trade liberalization effects on the development of small ... · trade liberalization effects on the...
TRANSCRIPT

Asia-Pacific Development Journal Vol. 15, No. 2, December 2008
35
TRADE LIBERALIZATION EFFECTS ON THEDEVELOPMENT OF SMALL AND MEDIUM-SIZEDENTERPRISES IN INDONESIA: A CASE STUDY
Tulus Tambunan*
The impact of international trade policy reform on the Indonesianeconomy, particularly in the areas of economic growth and developmentof the domestic manufacturing industry, has been studied extensively.However, the implications of such reform on the growth of small andmedium-sized enterprises (SMEs) in Indonesia remain under-researched.This paper thus contributes to filling the gap by examining the impactof international trade policy reform, particularly following the 1997 crisis,on the growth of SMEs in Indonesia. Two main questions are posited:(a) how does international trade policy reform affect local SMEs?; and(b) has the growth of SME exports accelerated since the reform? Thestudy does not find evidence that the reform has affected SMEsnegatively. On the contrary, with the exception of a slight decline in1998 due to the economic crisis, the number of SMEs has been growing.The paper suggests that such enterprises have not only managed tosurvive, but they have also been able to increase their output. Theirexports also increased annually.
I. INTRODUCTION
The international trade regime in Indonesia has undergone fundamentalchanges since the 1980s, with a reduction of many tariffs on imports accompaniedby a gradual shift from an inward-looking import substitution policy to an outward-looking export promotion strategy. Indonesia has also removed all non-tariff barriers
* Senior researcher, Centre for Industry, SME and Business Competition Studies, University ofTrisakti, Indonesia. This paper is based on research carried out as part of the Regional Study onTrade and Investment Linkages and Policy Coordination 2007 of the Asia-Pacific Research and TrainingNetwork on Trade. The technical and financial support provided by the Economic and SocialCommission for Asia and the Pacific and the International Development Research Centre in preparingthis research are gratefully acknowledged.

Asia-Pacific Development Journal Vol. 15, No. 2, December 2008
36
and export restrictions. The process of trade policy reform accelerated shortlyafter the economic crisis of 1997. The Indonesian Government reduced tariffs onall imported food items to a maximum of 5 per cent, deregulated its trade regimein the major agricultural commodities (except rice, for social reasons), terminatedproduction and trade monopolies in certain intermediate industries (cement, plywoodand rattan) and reduced export taxes on wood and many other commodities.
The impact of international trade policy reforms on the Indonesian economy,particularly in the areas of economic growth and development of the domesticmanufacturing industry, has been studied extensively. However, the implicationsof such reform on the growth of small and medium-sized enterprises (SMEs) inIndonesia remain an under-researched area. This paper thus contributes to fillingthe gap by examining the impact of international trade policy reforms, particularlyfollowing the 1997 crisis, on the growth of SMEs in Indonesia. In particular, answersto the following two questions are sought: (a) how does international trade policyreform affect local SMEs?; and (b) has growth of SME exports accelerated sincethe reform?
Following a brief review of the literature available on the effects ofinternational trade policy reforms on SMEs, overviews of international tradereform in Indonesia and of the development of Indonesian SMEs are presented inchapters III and IV, respectively. Effects of the reform on Indonesian SMEs areexamined in section V. Concluding remarks and policy recommendations are givenin section VII.
II. LITERATURE REVIEW
The Asian region provides evidence of the benefits of external tradeliberalization policies (in terms of exports and imports). With its continued growthin external trade, the region continues to generate the highest rates of economicgrowth in the world, and experienced an average reduction in poverty of about12.5 per cent between the early 1990s and early 2000. Through external trade, theregion has been further integrated into and benefited from the global economy(Bonapace 2005).
In most Asian economies, SMEs are considered the engine of economicgrowth by virtue of their numbers and their significant economic and socialcontributions. The role of such enterprises in industrial development is morepronounced in Asia than it is in the West. SMEs in developing Asia account forabout 80 per cent of all non-agricultural enterprises, and generate about the same
Asia-Pacific Development Journal Vol. 15, No. 2, December 2008
37
percentage of total employment. In addition, they contribute between 40 and70 per cent of total value added (Tambunan 2008).
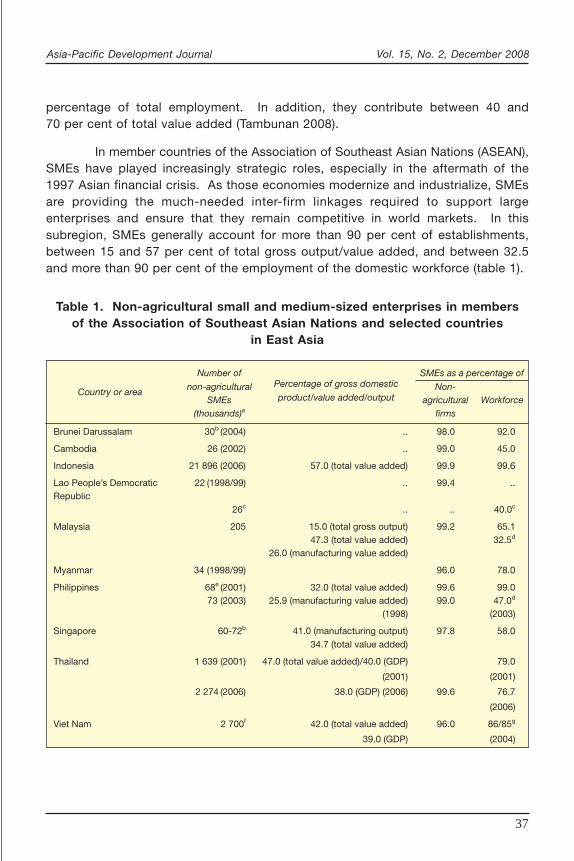
In member countries of the Association of Southeast Asian Nations (ASEAN),SMEs have played increasingly strategic roles, especially in the aftermath of the1997 Asian financial crisis. As those economies modernize and industrialize, SMEsare providing the much-needed inter-firm linkages required to support largeenterprises and ensure that they remain competitive in world markets. In thissubregion, SMEs generally account for more than 90 per cent of establishments,between 15 and 57 per cent of total gross output/value added, and between 32.5and more than 90 per cent of the employment of the domestic workforce (table 1).
Table 1. Non-agricultural small and medium-sized enterprises in membersof the Association of Southeast Asian Nations and selected countries
in East Asia
Number ofPercentage of gross domestic
SMEs as a percentage of
Country or area non-agriculturalproduct/value added/output
Non-SMEs agricultural Workforce
(thousands)a firms
Brunei Darussalam 30b (2004) .. 98.0 92.0
Cambodia 26 (2002) .. 99.0 45.0
Indonesia 21 896 (2006) 57.0 (total value added) 99.9 99.6
Lao People’s Democratic 22 (1998/99) .. 99.4 ..Republic
26c .. .. 40.0c
Malaysia 205 15.0 (total gross output) 99.2 65.147.3 (total value added) 32.5d
26.0 (manufacturing value added)
Myanmar 34 (1998/99) 96.0 78.0
Philippines 68e (2001) 32.0 (total value added) 99.6 99.073 (2003) 25.9 (manufacturing value added) 99.0 47.0d
(1998) (2003)
Singapore 60-72b 41.0 (manufacturing output) 97.8 58.034.7 (total value added)
Thailand 1 639 (2001) 47.0 (total value added)/40.0 (GDP) 79.0
(2001) (2001)
2 274 (2006) 38.0 (GDP) (2006) 99.6 76.7
(2006)
Viet Nam 2 700f 42.0 (total value added) 96.0 86/85g
39.0 (GDP) (2004)

Asia-Pacific Development Journal Vol. 15, No. 2, December 2008
38
East Asiah
China 8 000 60.0 (industrial output) 99.0 78.8
Hong Kong, China 292 99.3 60.7
Japan 6 140 52.0 (manufacturing output), 99.7 77.655.3 (total value added)
Republic of Korea 2 700 47.5 (total gross output), 99.8 86.750.0 (total value added)
Taiwan Province of China 1 050 98.1 78.4
Sources: Tambunan (2006a; 2008, Table III.1).
Note: Figures are for 2002, unless otherwise indicated.
Abbreviations: GDP, gross domestic product; SME, small and medium-sized enterprisea Including microenterprises, unless otherwise specified.b Estimated active.c Excluding microenterprises.d Manufacturing only.e Excluding 744,000 microenterprises.f Excluding 10 million microenterprises.g Total permanent workers/total corporate workforce.h Best guess for 2000.
Table 1. (continued)
Number ofPercentage of gross domestic
SMEs as a percentage of
Country or area non-agriculturalproduct/value added/output
Non-SMEs agricultural Workforce
(thousands)a firms
It is generally believed that trade liberalization should be beneficial for thedomestic economy as well as for the world as a whole. At an aggregate level, thechannels through which trade reform could bring benefits are, broadly, the following:(a) improved resource allocation; (b) access to better technologies, inputs andintermediate goods; (c) economies of scale and scope; (d) greater domesticcompetition; and (e) availability of favourable growth externalities, such as transferof know-how. Until recently, more attention has been given to the macroeconomiceffects of international trade reforms.1 There is now a small but growing empiricalliterature on the effects of international trade liberalization at a disaggregate level.Theoretically, reform towards international trade liberalization could affect (positivelyor negatively) local individual firms in four major ways:
1 Some of the best known analyses are: Krueger (1978), Dollar (1992), and Kruger, Cantner andHanusch (2000).
microenterprises.
microenterprises.
microenterprises.
Asia-Pacific Development Journal Vol. 15, No. 2, December 2008
39
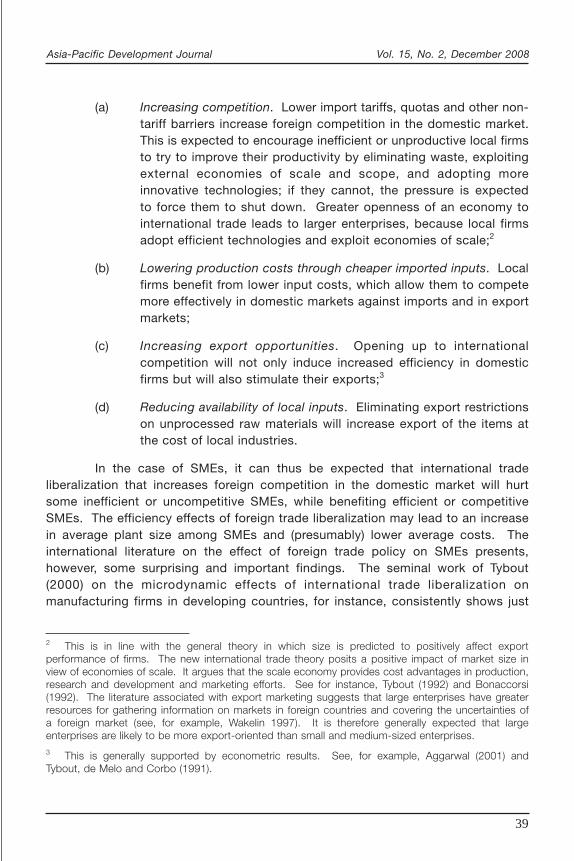
(a) Increasing competition. Lower import tariffs, quotas and other non-tariff barriers increase foreign competition in the domestic market.This is expected to encourage inefficient or unproductive local firmsto try to improve their productivity by eliminating waste, exploitingexternal economies of scale and scope, and adopting moreinnovative technologies; if they cannot, the pressure is expectedto force them to shut down. Greater openness of an economy tointernational trade leads to larger enterprises, because local firmsadopt efficient technologies and exploit economies of scale;2
(b) Lowering production costs through cheaper imported inputs. Localfirms benefit from lower input costs, which allow them to competemore effectively in domestic markets against imports and in exportmarkets;
(c) Increasing export opportunities. Opening up to internationalcompetition will not only induce increased efficiency in domesticfirms but will also stimulate their exports;3
(d) Reducing availability of local inputs. Eliminating export restrictionson unprocessed raw materials will increase export of the items atthe cost of local industries.
In the case of SMEs, it can thus be expected that international tradeliberalization that increases foreign competition in the domestic market will hurtsome inefficient or uncompetitive SMEs, while benefiting efficient or competitiveSMEs. The efficiency effects of foreign trade liberalization may lead to an increasein average plant size among SMEs and (presumably) lower average costs. Theinternational literature on the effect of foreign trade policy on SMEs presents,however, some surprising and important findings. The seminal work of Tybout(2000) on the microdynamic effects of international trade liberalization onmanufacturing firms in developing countries, for instance, consistently shows just
2 This is in line with the general theory in which size is predicted to positively affect exportperformance of firms. The new international trade theory posits a positive impact of market size inview of economies of scale. It argues that the scale economy provides cost advantages in production,research and development and marketing efforts. See for instance, Tybout (1992) and Bonaccorsi(1992). The literature associated with export marketing suggests that large enterprises have greaterresources for gathering information on markets in foreign countries and covering the uncertainties ofa foreign market (see, for example, Wakelin 1997). It is therefore generally expected that largeenterprises are likely to be more export-oriented than small and medium-sized enterprises.3 This is generally supported by econometric results. See, for example, Aggarwal (2001) andTybout, de Melo and Corbo (1991).
Asia-Pacific Development Journal Vol. 15, No. 2, December 2008
40
the opposite: that increases in import penetration as well as reductions in protectionare associated with reductions, not increases, in plant size. Thus, an importantfinding of that study is that liberalization, rather than improve efficiency immediately,may work against the scale efficiency of SMEs in the short run (or if there aregains in efficiency, they are quite small).
Tybout’s findings are supported by Tewari’s (2001) findings regarding theexperience of Tamil Nadu, India, over the past 15 years. The government removedrestrictions on many industries, allowing anyone to enter, and simultaneouslyliberalized trade. Shortly thereafter, there was a spate of relatively small firmsentering those industries, notably textiles. Firms with 400 to 500 spindles set upshop, in contrast to the plants with 10,000 to 20,000 spindles that larger firmsoperated. By the mid-1990s, the average plant size in the spinning industry hadfallen significantly.
Valodia and Velia (2004) investigated the relationship between foreign tradeliberalization at the macrolevel and its micro- or firm-level adjustment effects in theSouth African manufacturing industry. Their findings suggest that there is a strongrelationship between firm size and international trade. Most firms servicing onlydomestic markets are SMEs, whereas the majority of exporters are large enterprises;almost half of exporters are firms with more than 200 workers. It seems that largerfirms have been more successful at integrating their manufacturing activities intoglobal chains of production.
Tewari and Goebel (2002) studied SME competitiveness, also in Tamil Nadu.They found two interesting facts. First, SMEs are doing better in some industriesthan in others; just as some industries are doing better than others. Second,SMEs tied to low-end market segments in large urban or metro areas appear to bethe most vulnerable to cheap import competition. SMEs serving similar niches inthe rural areas or in small towns do not face the same pressures. Their access tointricate, socially embedded distribution networks that link them to rural marketsappears to be a source of strength that non-local competitors find too costly toreplicate.
Others, such as Kaplinsky, Morris and Readman (2002), Roberts andTybout (1996) and Roberts (2000), suggest that the path to growth for SMEs ina trade-liberalized world lies in their ability to compete with imported goods andservices. This, in turn, depends greatly on their ability to upgrade their productioncapacities, their access to human resources and new technology, and their abilityto improve the quality of their products.
Asia-Pacific Development Journal Vol. 15, No. 2, December 2008
41
III. SME DEVELOPMENT IN INDONESIA: AN OVERVIEW
In Indonesia, SMEs have historically been the main players in domesticeconomic activities, especially as providers of employment opportunities, and hencegenerators of primary or secondary sources of income for many households. Forlow-income and poor farm households in rural areas, SMEs, especially smallenterprises (including microenterprises), in non-farm activities are a particularlyimportant source of employment. As a group, these enterprises have also been animportant engine for the development of local economies and communities.However, compared with more developed economies, Indonesian SMEs are not yetcontributing significant value added to the national economy. Instead, they havebeen more important as the locus of employment.4
Though no data are available to show how many SMEs operate in theinformal sector, it is generally believed that numbers are high, particularly withrespect to microenterprises. The informal sector refers to the part of the economythat operates outside the ambit of organized economic activities. The sector ischaracterized by: (a) ease of entry; (b) reliance on indigenous resources; (c) familyownership of enterprises; (d) small scale of operations; (e) lack of formal systemsof organization; (f) low and uncertain incomes; (g) labour-intensive and adaptedtechnology; (h) skills acquired outside the formal school system; (i) no social welfareor security; and (j) unregulated and competitive markets. In Indonesia, the informalsector played a crucial role during the economic crisis in 1997, as it absorbedmany people who had lost their jobs in the formal sector.
Typically, SMEs in Indonesia account for more than 90 per cent of allfirms, and thus they are the largest source of employment, providing a livelihood
4 In Indonesia, there are several definitions of small and medium-sized enterprises, depending onwhich agency provides the definition. As the present paper uses data from the State Ministry ofCooperative and Small and Medium Enterprises (Menegkop & UKM), the Ministry of Industry, andStatistics Indonesia (the central statistical agency), only the definitions of these three governmentagencies are used. Menegkop & UKM promulgated the Law on Small Enterprises No. 20 of 2008,which defines a microenterprise as a business unit with total initial assets of up to 50 million rupiah(Rp), not including land and buildings, or with an annual value of sales of a maximum of Rp 300million. A small enterprise is defined as a business unit with total initial assets of up to Rp 500million, or with an annual value of sales of a maximum of Rp 2.5 billion, and a medium-sized enterpriseas a business unit with total initial assets of up to Rp 10 billion or with an annual value of sales of upto Rp 50 billion. Statistics Indonesia, which regularly conducts surveys of small and medium-sizedenterprises, uses the number of workers as the basis for determining the size of an enterprise. In itsdefinition, micro-, small and medium-sized enterprises are business units with, respectively, 1-4,5-19, and 20-99 workers, and large enterprises are units with 100 or more workers. The Departmentof Industry categorizes an enterprise by its size in its sector and according to number of workers,following the Statistics Indonesia definition.
Asia-Pacific Development Journal Vol. 15, No. 2, December 2008
42
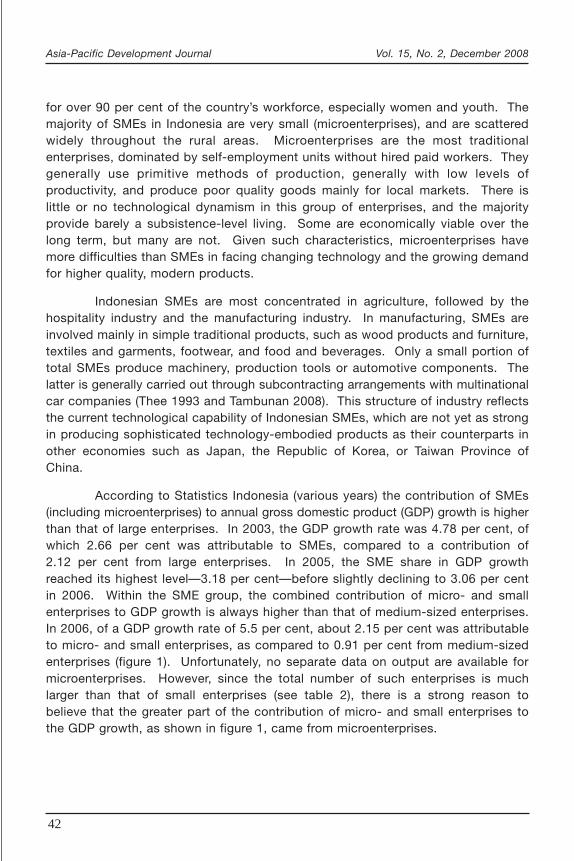
for over 90 per cent of the country’s workforce, especially women and youth. Themajority of SMEs in Indonesia are very small (microenterprises), and are scatteredwidely throughout the rural areas. Microenterprises are the most traditionalenterprises, dominated by self-employment units without hired paid workers. Theygenerally use primitive methods of production, generally with low levels ofproductivity, and produce poor quality goods mainly for local markets. There islittle or no technological dynamism in this group of enterprises, and the majorityprovide barely a subsistence-level living. Some are economically viable over thelong term, but many are not. Given such characteristics, microenterprises havemore difficulties than SMEs in facing changing technology and the growing demandfor higher quality, modern products.
Indonesian SMEs are most concentrated in agriculture, followed by thehospitality industry and the manufacturing industry. In manufacturing, SMEs areinvolved mainly in simple traditional products, such as wood products and furniture,textiles and garments, footwear, and food and beverages. Only a small portion oftotal SMEs produce machinery, production tools or automotive components. Thelatter is generally carried out through subcontracting arrangements with multinationalcar companies (Thee 1993 and Tambunan 2008). This structure of industry reflectsthe current technological capability of Indonesian SMEs, which are not yet as strongin producing sophisticated technology-embodied products as their counterparts inother economies such as Japan, the Republic of Korea, or Taiwan Province ofChina.
According to Statistics Indonesia (various years) the contribution of SMEs(including microenterprises) to annual gross domestic product (GDP) growth is higherthan that of large enterprises. In 2003, the GDP growth rate was 4.78 per cent, ofwhich 2.66 per cent was attributable to SMEs, compared to a contribution of2.12 per cent from large enterprises. In 2005, the SME share in GDP growthreached its highest level—3.18 per cent—before slightly declining to 3.06 per centin 2006. Within the SME group, the combined contribution of micro- and smallenterprises to GDP growth is always higher than that of medium-sized enterprises.In 2006, of a GDP growth rate of 5.5 per cent, about 2.15 per cent was attributableto micro- and small enterprises, as compared to 0.91 per cent from medium-sizedenterprises (figure 1). Unfortunately, no separate data on output are available formicroenterprises. However, since the total number of such enterprises is muchlarger than that of small enterprises (see table 2), there is a strong reason tobelieve that the greater part of the contribution of micro- and small enterprises tothe GDP growth, as shown in figure 1, came from microenterprises.

Asia-Pacific Development Journal Vol. 15, No. 2, December 2008
43
Figure 1. GDP growth contribution by size of firm, 2003-2006(Percentage)
Table 2. Total units of enterprises by size category, Indonesia, 1997-2006(Thousands of units)
Size1997 1998 1999 2000 2001 2003 2004 2005 2006
category
Micro- 36 528.3 33 085.5 35 158.2 36 131.7 35 894.8 40 336.8 41 109.7 42 306.2 44 428.8
enterprises
Small 3 176.4 3 676.2 2 646.3 3 573.5 3 988.3 3 036.1 3 574.8 4 700.7 4 394.1
enterprises
Medium-sized 60.5 51.9 51.8 78.8 81.0 87.4 93.0 95.9 106.7
enterprises
Large 2.1 1.8 1.8 5.7 5.9 6.5 6.7 6.8 7.2
enterprises
Total 39 767.3 36 815.4 37 858.1 39 789.7 39 970.0 43 466.8 44 784.1 47 109.6 48 936.8
Source: State Ministry of Cooperative and Small and Medium-sized Enterprises (Menegkop & UKM)database (available at www.depkop.go.id).
Source: Statistics Indonesia.
1.88 1.97 2.24 2.15
0.78 0.830.94 0.91
2.12 2.222.50 2.42
0
1
2
3
4
5
6
2003 2004 2005 2006
Small enterprises Medium-sized enterprises Large enterprises
Asia-Pacific Development Journal Vol. 15, No. 2, December 2008
44
IV. INTERNATIONAL TRADE POLICY REFORM IN INDONESIA
When former Indonesian President Soeharto came to power in 1966,marking the beginning of the “New Order” Government (1966-1998), he initiatedswift economic reform which, in its first five years, produced results beyond themost optimistic expectations. The main aim of the reform was two-pronged, namely,to reduce inflation (a short-term objective) and to generate economic growth andimprove living standards (a medium- to a long-term objective). The Governmentwas fully aware that macroeconomic stabilization was a precondition for achievingthe first objective, and that international trade reform and liberalization of the capitalaccount, including a more favourable investment law, were the most effectivestrategies for achieving the second.
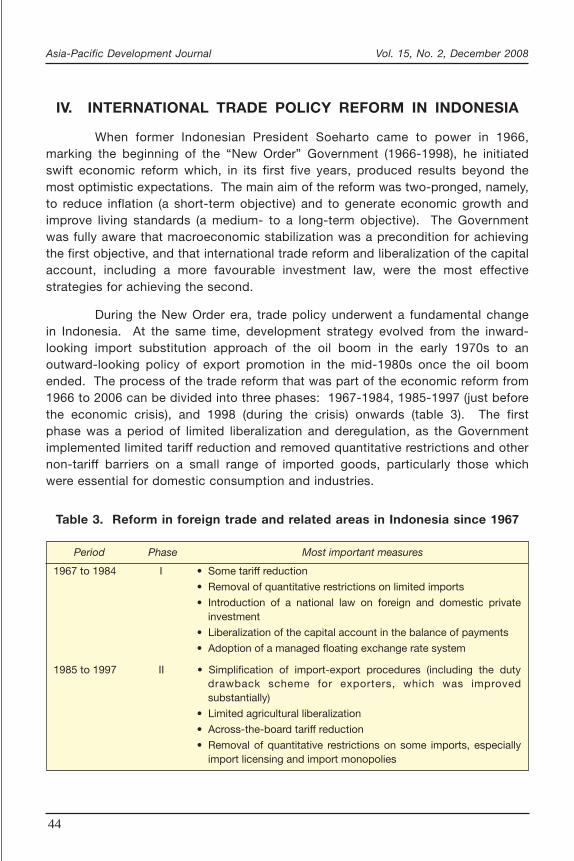
During the New Order era, trade policy underwent a fundamental changein Indonesia. At the same time, development strategy evolved from the inward-looking import substitution approach of the oil boom in the early 1970s to anoutward-looking policy of export promotion in the mid-1980s once the oil boomended. The process of the trade reform that was part of the economic reform from1966 to 2006 can be divided into three phases: 1967-1984, 1985-1997 (just beforethe economic crisis), and 1998 (during the crisis) onwards (table 3). The firstphase was a period of limited liberalization and deregulation, as the Governmentimplemented limited tariff reduction and removed quantitative restrictions and othernon-tariff barriers on a small range of imported goods, particularly those whichwere essential for domestic consumption and industries.
Table 3. Reform in foreign trade and related areas in Indonesia since 1967
Period Phase Most important measures
1967 to 1984 I • Some tariff reduction
• Removal of quantitative restrictions on limited imports
• Introduction of a national law on foreign and domestic privateinvestment
• Liberalization of the capital account in the balance of payments
• Adoption of a managed floating exchange rate system
1985 to 1997 II • Simplification of import-export procedures (including the dutydrawback scheme for exporters, which was improvedsubstantially)
• Limited agricultural liberalization
• Across-the-board tariff reduction
• Removal of quantitative restrictions on some imports, especiallyimport licensing and import monopolies

Asia-Pacific Development Journal Vol. 15, No. 2, December 2008
45
• Simplification of approval procedures for foreign investment andabolition of limitations on foreign direct investment, especiallyexport-oriented investments (including more liberal treatment withregard to foreign ownership)
• A revamping and replacement of the corrupt customs servicewith a private Swiss surveying company (Société Générale deSurveillance)
• Exemption from duties and value added tax for export-orientedinvestments
• Banking system deregulation
1998 onwards III • Liberalization of foreign trade and investment
• Elimination of all cartels in all sectors
• Agricultural liberalization, including actions such as: (a) removingimport restrictions on various commodities; (b) removing exportbans on wheat, soybeans, sugar and oil palm products;(c) replacing the monopoly role the State logistics agency (Bulog)played in rice imports with a 30 per cent tariff; (d) removing localcontent regulation for agricultural products; (e) privatizingplantations, estates and input suppliers; (f) liquidatingcooperatives and removing land-use regulations that restrictedcrop choices of producers; (g) suspending the value added tax onrice and other essential commodities; (h) eliminating wheat, sugarand fertilizer subsidies; (i) phasing out soybean subsidies;(j) eliminating import subsidies and relevant import duties forsoybean meal and fishmeal; and (k) allowing private traders toimport rice, for the first time in 30 years
• Removal of various import licensing schemes, such as the importlicences for iron and steel products, engine and engine parts,heavy transport equipment, and electronic products
• Removal of local content requirements, reduction of tariffs onimported cars and components, and simplification of licensingprocedures
• Elimination of all export restrictions and taxes
• Introduction of anticorruption and competition laws
• Approval of Importer and Approved Sole Agent licences, whichwere applied to various industries, from food-related products tolubricants
• Removal of local content regulations under the World TradeOrganization Agreement on Trade Related Investment Measures,as well as the local content requirements for motor vehicles
Source: Tambunan (2007b).
Table 3. (continued)
Period Phase Most important measures

Asia-Pacific Development Journal Vol. 15, No. 2, December 2008
46
The second phase was a period of extensive liberalization and deregulation,with a broad range of measures. Between 1985 and 1992, the simple (unweighted)average tariff was cut to just under 20 per cent, down from 27 per cent. Non-tariffbarriers as a percentage of tariff lines had declined from 32 down to 17 per centby 1990 and to 5 per cent by 1992; as a percentage of imports they fell from43 per cent in 1986 down to 13 per cent by 1990 (Iqbal and Rashid 2001). Theprivate sector began to play a larger role during this period, as reflected by theincrease in private domestic as well as foreign investments in Indonesia. Therewas also an emphasis on exports of non-oil and gas products, especially labour-intensive manufactured products, such as textiles and garments, footwear andwood products. Restrictions on foreign direct investment and ownership regulations,particularly on export-oriented investments, were gradually relaxed (Pangestu 2001).
The third phase is the broader post-crisis reform, which began with theInternational Monetary Fund-sponsored deregulation under a letter of intent andcontinued further with Indonesia’s own initiatives. One of the most heavily regulatedand protected sectors of the Indonesian economy, the automobile industry, wassignificantly affected by these developments. The tariff on completely built-upsedans was reduced to 200 per cent in 1995 and to 90 per cent in 2003.
Figure 2 shows the result of the foreign trade reform. The ratio of totaltrade (export plus import) to GDP increased steadily from the early 1990s up to
Figure 2. Growth in the external trade of Indonesia, 1993-2006(Total trade as a percentage of gross domestic product)
Source: Asian Development Bank, Key Indicators database, (1993-2006).
0
10
20
30
40
50
60
70
80
90
1993 1994 1995 1996 1997 1998 1999 2000 2001 2002 2003 2004 2005 2006
Asia-Pacific Development Journal Vol. 15, No. 2, December 2008
47
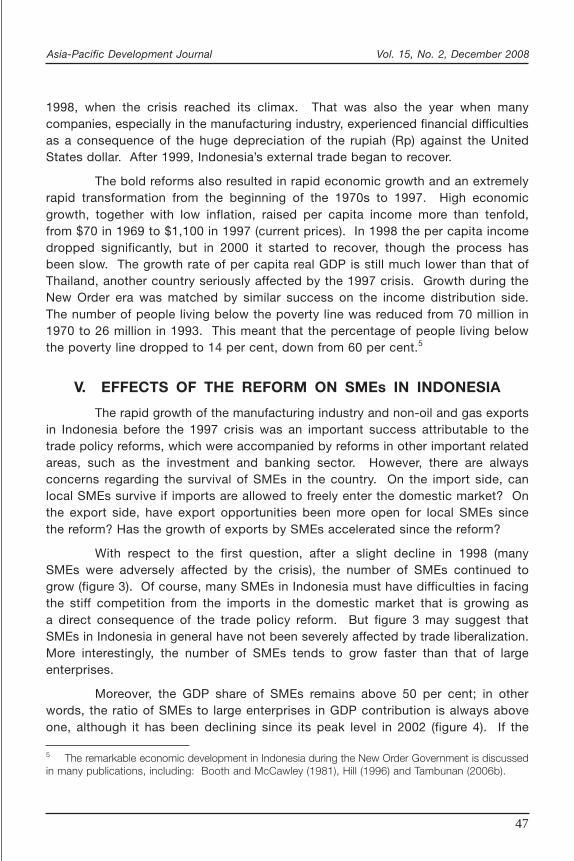
1998, when the crisis reached its climax. That was also the year when manycompanies, especially in the manufacturing industry, experienced financial difficultiesas a consequence of the huge depreciation of the rupiah (Rp) against the UnitedStates dollar. After 1999, Indonesia’s external trade began to recover.
The bold reforms also resulted in rapid economic growth and an extremelyrapid transformation from the beginning of the 1970s to 1997. High economicgrowth, together with low inflation, raised per capita income more than tenfold,from $70 in 1969 to $1,100 in 1997 (current prices). In 1998 the per capita incomedropped significantly, but in 2000 it started to recover, though the process hasbeen slow. The growth rate of per capita real GDP is still much lower than that ofThailand, another country seriously affected by the 1997 crisis. Growth during theNew Order era was matched by similar success on the income distribution side.The number of people living below the poverty line was reduced from 70 million in1970 to 26 million in 1993. This meant that the percentage of people living belowthe poverty line dropped to 14 per cent, down from 60 per cent.5
V. EFFECTS OF THE REFORM ON SMEs IN INDONESIA
The rapid growth of the manufacturing industry and non-oil and gas exportsin Indonesia before the 1997 crisis was an important success attributable to thetrade policy reforms, which were accompanied by reforms in other important relatedareas, such as the investment and banking sector. However, there are alwaysconcerns regarding the survival of SMEs in the country. On the import side, canlocal SMEs survive if imports are allowed to freely enter the domestic market? Onthe export side, have export opportunities been more open for local SMEs sincethe reform? Has the growth of exports by SMEs accelerated since the reform?
With respect to the first question, after a slight decline in 1998 (manySMEs were adversely affected by the crisis), the number of SMEs continued togrow (figure 3). Of course, many SMEs in Indonesia must have difficulties in facingthe stiff competition from the imports in the domestic market that is growing asa direct consequence of the trade policy reform. But figure 3 may suggest thatSMEs in Indonesia in general have not been severely affected by trade liberalization.More interestingly, the number of SMEs tends to grow faster than that of largeenterprises.
Moreover, the GDP share of SMEs remains above 50 per cent; in otherwords, the ratio of SMEs to large enterprises in GDP contribution is always aboveone, although it has been declining since its peak level in 2002 (figure 4). If the
5 The remarkable economic development in Indonesia during the New Order Government is discussedin many publications, including: Booth and McCawley (1981), Hill (1996) and Tambunan (2006b).

Asia-Pacific Development Journal Vol. 15, No. 2, December 2008
48
Figure 3. Growth in the number of small and medium-sized enterprises(excluding microenterprises) and large enterprises, 1997-2006
Source: State Ministry of Cooperative and Small and Medium-sized Enterprises (Menegkop &UKM) database (www.depkop.go.id).
10 000
20 000
30 000
40 000
50 000
60 000
1997
1998
1999
2000
2001
2002
2003
2004
2005
2006
Small and medium-sized enterprises
Large enterprises
Figure 4. Ratio of small and medium-sized enterprises to large enterprisesin terms of gross domestic product contribution, 2000-2006
Source: State Ministry of Cooperative and Small and Medium-sized Enterprises (Menegkop & UKM)database (www.depkop.go.id).
Note: The data on small and medium-sized enterprises include microenterprises (no separate dataare available for microenterprises).
1.00
1.05
1.10
1.15
1.20
1.25
1.30
1.35
2000 2001 2002 2003 2004 2005 2006

Asia-Pacific Development Journal Vol. 15, No. 2, December 2008
49
reforms before and after the crisis favoured large enterprises, the share of SMEcontribution to GDP would have fallen to less than 50 per cent. SMEs havemanaged not only to survive, but also to increase their output. There is thus noevidence to support the suspected negative correlation between the openness ofthe Indonesian economy that resulted from the trade reforms and the existence oflocal SMEs.
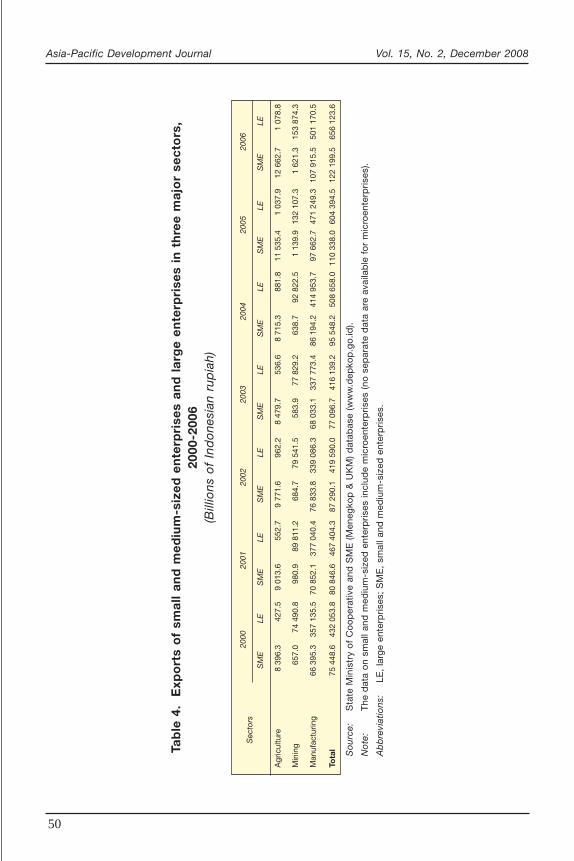
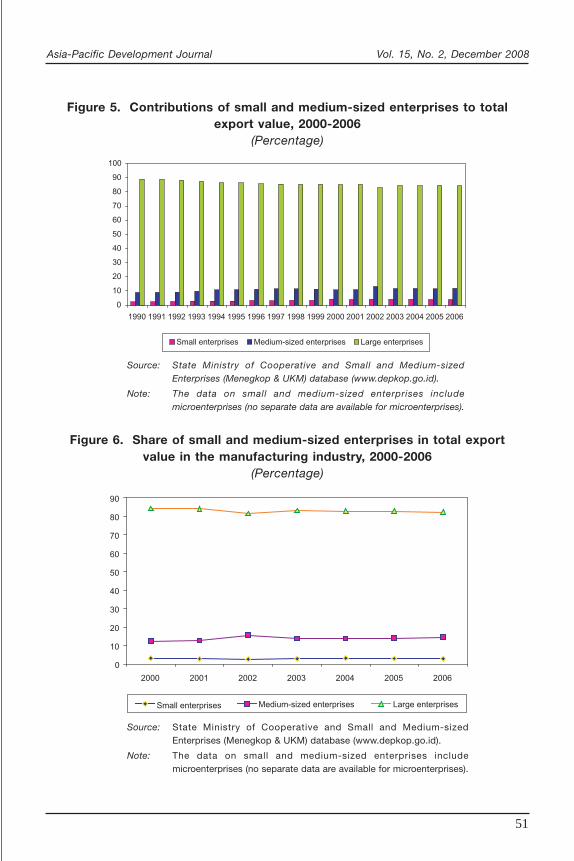
With respect to the second and third questions, not only are SMEs able toexport, but their exports increase on average per year. In 2000, their total exportsamounted to Rp 75,449 billion; by 2006, exports had increased by 50 per cent toRp 122,200 billion (table 4). However, the share of SMEs in the country’s totalexports (excluding oil and gas) is still very small as compared to that of largeenterprises. In 1990, their share was 11.1 per cent; by 2006 it was 15.7 per cent.Medium-sized enterprises are much stronger in exports than small enterprises are.In 1990, medium-sized enterprises accounted for 8.9 per cent of total exports,compared with 2.2 per cent for small enterprise. In 2006 the ratio was 11.81 to3.89 per cent (figure 5).
The majority of SME exports came from the manufacturing industry.However, the share of SMEs in total exports of the manufacturing industry continuesto be smaller than that of large enterprises (figure 6). Many, such as Hill (1997),Tambunan (2006a and 2007a) and Thee (1993) argue that, although on averagetheir annual export contribution to Indonesia’s total manufacturing export is relativelysmall, SMEs seem to have shared in the manufactured export boom in the 1980sand 1990s. Thee (1993) concludes that, from the point of view of technology andadaptability, export growth of SMEs in the manufacturing industry has been achievedlargely by finding niche markets and adapting costs and quality to market demand.
Perhaps the only microlevel evidence of the effects of trade reform inIndonesia on SME exports is from a field study conducted by Berry and Levy(1994). They surveyed 91 SME exporters in three subsectors of manufacturing,and conducted intensive interviews with 40 public and non-profit agencies activein SME issues between January and June 1992. The three subsectors were:garments in Jakarta and Bandung (both in West Java), rattan furniture in Jakartaand Surabaya (East Java) and carved wooden furniture in Jepara (Central Java).From a total of 33 interviewed exporters of rattan products, they found that all butone of the firms exported 90 per cent or more of their output; 26 of 33 firms beganexporting the same year they entered into production. Most began to export orincreased their export share in their total production since the Government ofIndonesia imposed bans on the export of unprocessed and semi-processed rattan
Asia-Pacific Development Journal Vol. 15, No. 2, December 2008
50
Tab
le 4
. E
xpo
rts
of
smal
l an
d m
ediu
m-s
ized
en
terp
rise
s an
d l
arg
e en
terp
rise
s in
th
ree
maj
or
sect
ors
,20
00-2
006
(Bi l l
ions
of
Ind
one
sian
rup
iah)
Sec
tors
2000
2001
2002
2003
2004
2005
2006
SM
ELE
SM
ELE
SM
ELE
SM
ELE
SM
ELE
SM
ELE
SM
ELE
Agr
icul
ture
8 39
6.3
427.
59
013.
655
2.7
9 77
1.6
962.
28
479.
753
6.6
8 71
5.3
881.
811
535
.41
037.
912
662
.71
078.
8
Min
ing
657.
074
490
.898
0.9
89 8
11.2
684.
779
541
.558
3.9
77 8
29.2
638.
792
822
.51
139.
913
2 10
7.3
1 62
1.3
153
874.
3
Man
ufac
turin
g66
395
.335
7 13
5.5
70 8
52.1
377
040.
476
833
.833
9 08
6.3
68 0
33.1
337
773.
486
194
.241
4 95
3.7
97 6
62.7
471
249.
310
7 91
5.5
501
170.
5
Tota
l75
448
.643
2 05
3.8
80 8
46.6
467
404.
387
290
.141
9 59
0.0
77 0
96.7
416
139.
295
548
.250
8 65
8.0
110
338.
060
4 39
4.5
122
199.
565
6 12
3.6
So
urce
:S
tate
Min
istr
y o
f C
oo
per
ativ
e an
d S
ME
(M
eneg
kop
& U
KM
) d
atab
ase
(ww
w.d
epko
p.g
o.id
).
No
te:
The
dat
a o
n sm
all a
nd m
ediu
m-s
ized
ent
erp
rises
incl
ude
mic
roen
terp
rises
(no
sep
arat
e d
ata
are
avai
lab
le f
or
mic
roen
terp
rises
).
Ab
bre
viat
ions
:LE
, la
rge
ente
rpris
es;
SM
E,
smal
l and
med
ium
-siz
ed e
nter
pris
es.
Asia-Pacific Development Journal Vol. 15, No. 2, December 2008
51
Figure 5. Contributions of small and medium-sized enterprises to totalexport value, 2000-2006
(Percentage)
Source: State Ministry of Cooperative and Small and Medium-sizedEnterprises (Menegkop & UKM) database (www.depkop.go.id).
Note: The data on small and medium-sized enterprises includemicroenterprises (no separate data are available for microenterprises).
Figure 6. Share of small and medium-sized enterprises in total exportvalue in the manufacturing industry, 2000-2006
(Percentage)
Source: State Ministry of Cooperative and Small and Medium-sizedEnterprises (Menegkop & UKM) database (www.depkop.go.id).
Note: The data on small and medium-sized enterprises includemicroenterprises (no separate data are available for microenterprises).
0
10
20
30
40
50
60
70
80
90
100
1990 1991 1992 1993 1994 1995 1996 1997 1998 1999 2000 2001 2002 2003 2004 2005 2006
Small enterprises Medium-sized enterprises Large enterprises
0
10
20
30
40
50
60
70
80
90
2000 2001 2002 2003 2004 2005 2006
Small enterprises Medium-sized enterprises Large enterprises

Asia-Pacific Development Journal Vol. 15, No. 2, December 2008
52
in 1986 and 1988-1989. This suggests that the ban has been a key factor leadingto a major expansion in exports of rattan furniture by SMEs in Indonesia.6
The view expressed by Berry and Levy (1994) is also supported by theauthor’s own observations that free exports of raw materials have become seriousconstraints for many SMEs that produce or export goods made from such materials.For instance, several times during the 1980s and also in the 1990s, many SMEs inmetalworking industry clusters, for example in Tegal and Ceper in Central Java andPasuruan in East Java, experienced difficulties in continuing or expanding theirproduction due to the lack of local scraps—their main raw material. This materialhas been exported mainly to China, leading to a scarcity in the local market.7 Inanother case, PT Panasonic Manufacturing Indonesia, the leading electroniccompany in Indonesia, has subcontracting linkages with many SMEs to manufacturea variety of electronic products. Recently, subcontractors that make water pumpsfor the company have been facing difficulties due to a scarcity of one of their mainraw materials—brass, which is one of the raw materials that are free for export.8
Shortly after the economic crisis in 1997, Dierman and others (1998) triedto assess the impact of the more aggressive trade and investment policy reformsrelated to the International Monetary Fund-sponsored deregulation on SMEs in themanufacturing industry in Indonesia. They concluded that the likely impact wouldvary by subsector or group of industry. SMEs in the industries that were mostprotected before the crisis were expected to be more adversely affected thanthose in the less protected ones. For instance, currently many SMEs in the textileand garment industry, one of the most protected industries before the crisis, arestruggling to compete with very cheap textile products from China, which havebeen extensively penetrating the Indonesian market over the past few years.
Overall, based on the official data presented in the present paper andseveral studies, including that of Van Dierman and others (1998), there is noindication that the number of SMEs, including microenterprises, in Indonesia hasbeen negatively affected by the international trade reform (figure 7). Moreover,relying on protection that restricts certain activities to domestic SMEs may actually
6 Indonesia has long been a major supplier of raw rattan to the major rattan furniture exportingareas of Taiwan Province of China and the Philippines. In an effort to jump-start the rattan productsindustry in the country, the Government of Indonesia imposed this restriction policy (Berry and Levy1994).7 Interviews by the author with some producers and local government officials in the Tegal cluster,February 2007.8 Interview by the author with Daniel Suhardiman, Group Manager from PT Panasonic ManufacturingIndonesia.

Asia-Pacific Development Journal Vol. 15, No. 2, December 2008
53
contribute to abuse of local market power and, by insulating firms from competition,make them less able to penetrate foreign markets or develop improvements intechnology, productivity and efficiency (Thee 2000). However, there is also noevidence that the efficiency effects of trade liberalization resulted in an increase inaverage plant size among SMEs. This Indonesian case seems to be consistentwith the findings by Tybout (2000) that trade liberalization may work against the(scale) efficiency of SMEs in the short run.
Figure 7. Scatter diagram of the number of small and medium-sizedenterprises (including microenterprises) and trade in Indonesia
Sources: State Ministry of Cooperative and Small and Medium-sized Enterprises (Menegkop &UKM) Perkembangan Indikator Makro UKM database, Table 1 (www.depkop.go.id), andStatistics Indonesia data for Indonesian external trade and gross domestic profit.
0
10
20
30
40
50
60
70
80
90
52 53 54 55 56 57 58
Small and medium-sized enterprises (in thousands)
Ext
ern
al t
rad
e (p
erce
nta
ge
of
gro
ss d
om
esti
c p
rod
uct
)
As microenterprises represent the informal sector in Indonesia, it can alsobe concluded that the informal sector has managed to survive the processes oftrade liberalization. There are two main reasons for this. First, although importedgoods, especially from China, have been penetrating the domestic market at anaccelerating rate in the period, such goods are still concentrated in urban areas orcities, while microenterprises are still the dominant source of basic consumptiongoods in rural areas. Second, in general, imported goods are still more expensivethan those produced by the microenterprises on which most poor or low-incomehouseholds are dependent.

Asia-Pacific Development Journal Vol. 15, No. 2, December 2008
54
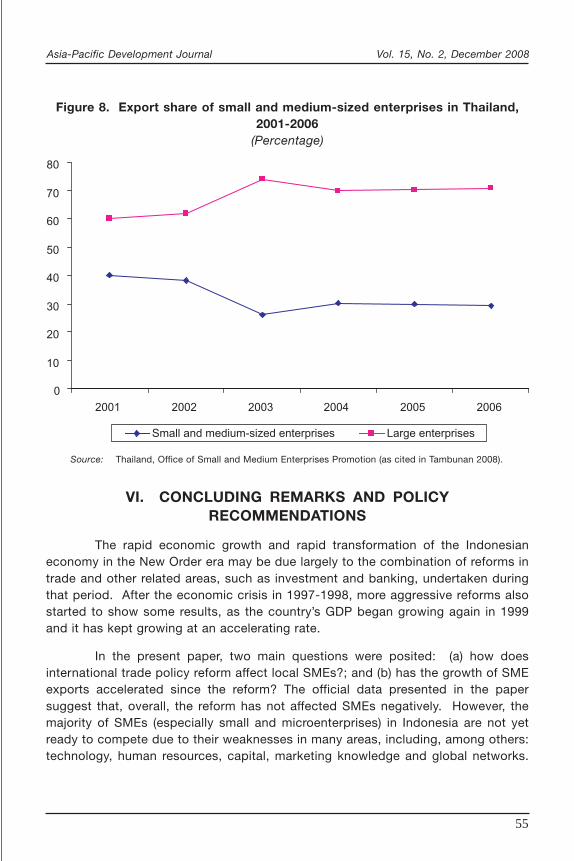
As a comparison, in India as well as in China and other ASEAN countrieswith more or less similar stages of development, SMEs have also been playing animportant role in exports, directly or indirectly (through subcontracting arrangementswith large enterprises, including multinational companies), although the rate variesby country. As can be seen in table 5, among the surveyed countries, SMEs inChina play the largest role, with export contributions running between 40 and60 per cent. SMEs in Thailand, which is more comparable to Indonesia in terms oflevel of economic development, are more developed in export activities than theircounterparts in Indonesia (figure 8).
Table 5. Share of small and medium-sized exports in total exports inselected Asian developing countries, 1990s
Country 2003 Share (percentage) 2005-2006 Share (percentage)
China 40 to 60a ..
Indonesia 11a 17.72 (2006)b
India 38 to 40c ..
Malaysia 15a ..
Pakistan .. 25 (2005)d
Singapore 16a ..
Thailand 10a 29.10% (2006)e
Viet Nam 20a ..
Sources: a United Nations Conference on Trade and Development (2003), for manufactured export only.b State Ministry of Cooperative and SME (Menegkop & UKM) database (www.depkop.go.id).c United Nations Conference on Trade and Development (2003), ICICI Bank and International
Finance Corporation (2002), and Das (2007), for manufactured export only.d Tambunan (2008).e Thailand (2007).
All this evidence may suggest that trade openness does not negativelyaffect local SMEs. But neither does it automatically lead local SMEs to becomeexporters or increase their external market shares. It depends, among many otherthings, on the role of government in supporting capacity-building for local SMEsso that they can become highly competitive exporters. In other words, tradeliberalization creates export market opportunities only for efficient and highlycompetitive local SMEs.
Asia-Pacific Development Journal Vol. 15, No. 2, December 2008
55
VI. CONCLUDING REMARKS AND POLICYRECOMMENDATIONS
The rapid economic growth and rapid transformation of the Indonesianeconomy in the New Order era may be due largely to the combination of reforms intrade and other related areas, such as investment and banking, undertaken duringthat period. After the economic crisis in 1997-1998, more aggressive reforms alsostarted to show some results, as the country’s GDP began growing again in 1999and it has kept growing at an accelerating rate.
In the present paper, two main questions were posited: (a) how doesinternational trade policy reform affect local SMEs?; and (b) has the growth of SMEexports accelerated since the reform? The official data presented in the papersuggest that, overall, the reform has not affected SMEs negatively. However, themajority of SMEs (especially small and microenterprises) in Indonesia are not yetready to compete due to their weaknesses in many areas, including, among others:technology, human resources, capital, marketing knowledge and global networks.
Figure 8. Export share of small and medium-sized enterprises in Thailand,2001-2006
(Percentage)
Source: Thailand, Office of Small and Medium Enterprises Promotion (as cited in Tambunan 2008).
0
10
20
30
40
50
60
70
80
2001 2002 2003 2004 2005 2006
Small and medium-sized enterprises Large enterprises

Asia-Pacific Development Journal Vol. 15, No. 2, December 2008
56
Therefore, the Government should take concrete actions in order to help SMEsmaximize benefits and minimize losses related to the trade reform over the longrun. This policy implication is also valid for many other Asian developing countries,where conditions for SMEs are similar to those in Indonesia.
The required policy actions are particularly related to the following aspects.First, trade liberalization should be accompanied by development schemes designedto support long-term capacity-building for SMEs; such schemes should focus onsix major areas: (a) credit and market information; (b) human resource development;(c) technology and innovation; (d) global networks in both input and output markets;(e) subcontracting opportunities and capabilities; and (f) infrastructure that increasesaccess for local SMEs to broader markets. Second, trade reform policies shouldbe carefully designed to prevent the liberalization of exports of unprocessedcommodities which are the key raw materials for SMEs, as such liberalization couldlead to shortages of these items in the local market and reduce the productioncapacity of SMEs. Third, new plans with respect to trade regulations should bedisseminated to all SMEs through all available channels (such as electronic media,newspapers, press releases and public gatherings) in advance of theirimplementation. At the same time, the Government should provide SMEs witheffective alternative solutions in order to minimize the negative effects or maximizethe positive effects of such new policies or regulations. Fourth, SMEs representedby, among other entities, SME associations or non-governmental organizations,should be more actively involved in the preparation and formulation of economicpolicies (such as in trade and investment) that will affect them directly or indirectly.
Asia-Pacific Development Journal Vol. 15, No. 2, December 2008
57
REFERENCES
Aldaba, R.M. (2007). “SMEs in the Philippine Manufacturing Industry and Globalization”, paperpresented at the third workshop on the ERIA Related Joint Research of SME Project,IDE-JETRO, Bangkok, 13-14 November.
Aggarwal, A. (2001). “Liberalisation, multinational enterprises and export performance: evidencefrom Indian manufacturing”, Working Paper No. 69 (New Delhi, Indian Council forResearch on International Economic Relations).
Berry, A. and B. Levy (1994). “Indonesia’s small and medium-size exporters and their supportsystems”, Policy Research Working Paper No. 1402 (Washington, D.C., World Bank).
Bonaccorsi, A. (1992). “On the relationship between firm size and export intensity”, Journal ofInternational Business Studies, vol. 23, No. 4, pp. 605-635.
Bonapace, T. (2005). “Regional trade and investment architecture in Asia-Pacific emerging trendsand imperatives”, RIS Discussion Paper No. 92/2005 (New Delhi, Research andInformation System for the Non-aligned and Other Developing Countries (RIS)).
Booth, A. and P. McCawley, eds. (1981). The Indonesian Economy During the Soeharto Era(Kuala Lumpur, Oxford University Press).
Das, K. (2007). “SMEs in India: issues and possibilities in times of globalisation”, paper presentedat the third workshop on the ERIA Related Joint Research of SME Project, IDE-JETRO,Bangkok, 13-14 November.
Dollar, D. (1992). “Outward-oriented developing economics really do grow more rapidly: evidencefrom 95 LDCs, 1976-1985”, Economic Development and Cultural Change, vol. 40,No. 3, pp. 523-544.
Hill, H. (1996). The Indonesian Economy since 1966: Southeast Asia’s Emerging Giant (Singapore,Cambridge University Press).
Hill, H. (1997). Indonesia’s Industrial Transformation (Singapore, Institute of Southeast AsianStudies).
ICICI Bank and International Finance Corporation (2002). “Overview of SME in India”, presentationat the Symposium on SME Finance, February, New Delhi, accessed on 23 May 2008from www.ficci.com/media-room/speeches-presentations/2002/Feb/feb-sme-ifci.ppt.
Iqbal, F. and F. Rashid (2001). “Deregulation and Development in Indonesia: An IntroductoryOverview,” in F. Iqbal and W. James, eds., Indonesia’s Trade and Investment PolicyExperience: Distortions, Deregulation and Future Reforms (Westport, Praeger),pp. 50-69.
Kaplinsky, R., M. Morris and J. Readman (2002). “The globalisation of product markets andimmiserising growth: lessons from the South African furniture industry”, WorldDevelopment, vol. 30, No. 7, pp. 1159-1177.
Krueger, A. (1978). Foreign Trade Regimes and Economic Development: Liberalization Attemptsand Consequences (Cambridge, Ballinger Publishing Co. for the National Bureau ofEconomic Research).
Kruger, J.J., U. Cantner and H. Hanusch (2000). “Total factor productivity, the East Asian miracle,and the world production frontier”, Weltwirtschaftliches Archiv, vol. 136, No. 1,pp. 111-136.
Asia-Pacific Development Journal Vol. 15, No. 2, December 2008
58
Mephokee, C. (2004), “Thai SME development policies: country report” (Bangkok, Faculty ofEconomics, Thammasat University).
Pangestu, M. (2001), “Foreign Investment Policy: Evolution and Characteristics,” in F. Iqbal andW. James, eds., Deregulation and Development in Indonesia (Westport, Praeger),pp. 93-113.
Roberts, M.J. and J. Tybout (eds.) (1996). Industrial Evolution in Developing Countries: MicroPatterns of Turnover, Productivity and Market Structure (Oxford, Oxford University Press).
Roberts, S. (2000). “Understanding the effects of trade policy reform: the case of South Africa”,South African Journal of Economics, vol. 68, No. 4, pp. 270-281.
Statistics Indonesia (Badan Pusat Statistk) (various years). Perkembangan Indikator Makro UKMdata base.
Tambunan, T.T.H. (2006a). Development of Small and Medium Enterprises in Indonesia from theAsia-Pacific Perspective (Jakarta, LPFE-University of Trisakti).
Tambunan, T.T.H. (2006b). Perekonomian Indonesia sejak Orde Lama hingga pasca krisis (TheIndonesian economy since the old order up to the post-crisis period) (Jakarta, PT PustakaQuantum).
Tambunan, T.T.H. (2007a). Entrepreneurship Development in Developing Countries (New Delhi,Academic Excellence).
Tambunan, T.T.H. (2007b). “Trade and investment liberalization effects on small and medium-sized enterprise development: a literature review and case study of Indonesia”, inESCAP, Towards Coherent Policy Frameworks: Understanding Trade and InvestmentLinkages, Studies in Trade and Investment No. 62 (United Nations publication, SalesNo. E.08.II.F.5).
Tambunan, T.T.H. (2008). Development of SMEs in ASEAN (New Delhi, Readworthy PublicationsLtd.).
Tewari, M. (2001). “The challenge of reform: how Tamil Nadu’s textile and apparel industry isfacing the pressures of liberalization” (Cambridge, The Center for InternationalDevelopment, Harvard University).
Tewari, M. and J. Goebel (2002). “Small firm competitiveness in a trade liberalized world: lessonsfor Tamil Nadu” (New Delhi, Global Development Network).
Thailand (2007). “White Paper on SMEs 2006” (Bangkok, Office of Small and Medium EnterprisesPromotion, Ministry of Industry).
Thee K.W. (2000), “The Impact of the Economic Crisis on Indonesia’s Manufacturing Sector”, TheDeveloping Economies, vol. 38, No. 4, pp. 420-453.
Thee, K.W. (1993). “Industrial structure and small and medium enterprise development inIndonesia”, paper prepared for the World Bank Economic Development Institute(Washington, D.C., World Bank).
Tybout, J.R. (1992). “Linking Trade and Productivity: New Research Directions”, World BankEconomic Review, vol. 6, No. 2, pp. 189-211.
Tybout, J.R. (2000). “Manufacturing firms in developing countries: How well do they do, andwhy?” Journal of Economic Literature, vol. 38, No. 1, pp. 11-44.

Asia-Pacific Development Journal Vol. 15, No. 2, December 2008
59
Tybout, J.R., J. de Melo and V. Corbo (1991). “The effects of trade reforms on scale and technicalefficiency: new evidence from Chile”, Journal of International Economics, vol. 31,Nos. 3-4, pp. 231-250.
United Nations Conference on Trade and Development (2003), “Improving the Competitiveness ofSMEs through Enhancing Productive Capacity”, TD/B/Com.3/51/Add.1, January (Geneva,United Nations).
Valodia, I. and M. Velia (2004). “Macro-micro linkages in trade: how are firms adjusting to tradeliberalization, and does trade liberalization lead to improved productivity in South Africanmanufacturing firms?”, paper presented at the conference on African Development andPoverty Reduction: The Macro-Micro Linkage, held by the Development Policy ResearchUnit and the Trade and Industrial Policy Secretariat, 13-15 October.
Van Dierman, P., T.K. Wie, M. Tambunan, and T. Tambunan (1998). “The IMF reform agreements:evaluating the likely impact on SMEs” (Jakarta, The Asia Foundation).
Wakelin, K. (1997). Trade and Innovation: Theory and Evidence (Cheltenham, Edward EdgarPublishing Ltd.).
60 blank