trade in intermediate goods and regional production ... de economa/t_recalde_ma… · trade in...
TRANSCRIPT

Trade in intermediate goods and regional production networks. An
application for Latin America
Luis Marcelo Florensaa
Laura Márquez-Ramosb
Inmaculada Martínez-Zarzosoc
María Luisa Recalded
Abstract
This paper focuses on the effects of two regional integration agreements in Latin America (LA), namely
the Latin American Integration Association and the Southern Common Market. The main objective is to
analyse the effect of regionalism on production networks in the region. Previous research has focused on
other integration agreements, such as the European Union or the North American Free Trade Area.
However, as far as the authors are aware, this is the first paper that addresses the relationship between
product integration networks and the ongoing regional integration process of Latin American countries.
The paper tests two main hypotheses, on the one hand, whether LA countries have become more
integrated into regional production networks and on the other hand, whether the effect of LA agreements
may have production relocation consequences. Contrary to the higher level of production integration
apparent in LA countries due to growth in trade in intermediate goods, the results of this paper point
towards a downward trend in LA production networks.
Keywords: Production networks; intermediate goods; trade; integration; Latin
America; panel data; gravity model
JEL: F14
a Instituto de Economía y Finanzas, Universidad Nacional de Córdoba, Argentina.
b Department of Economics and Institute of International Economics, Universidad Jaume I, Spain.
c Department of Economics and Institute of International Economics, Universidad Jaume I, Spain and
Department of Economics, University of Goettingen, Germany. d Instituto de Economía y Finanzas, Universidad Nacional de Córdoba, Argentina. Corresponding author.
Email: [email protected]

Trade in intermediate goods and regional production networks. An
application for Latin America
1. Introduction
This paper concentrates on the effects of two regional integration agreements (RIAs) in
Latin America (LA), namely the Latin American Integration Association (LAIA) and
the Southern Common Market (Mercosur). LAIA includes 12 LA countries, whereas
Mercosur only includes 4 bordering countries, which represent 65% of LA surface area,
almost 9% of the world surface area and about 50% of the population of LA.
Additionally, more than 90% of GDP is generated in the two largest countries
(Blanchard and Pérez-Enrri, 2000) and trade policies in Mercosur partially reflect
interests in Argentina and Brazil (de Paiva Abreu, 2004).
The main aim of this paper is to analyse intra-LAIA and intra-Mercosur trade in
intermediate goods and link them to trade in final goods.1 In order to do so, two main
hypotheses were tested, on the one hand whether LA countries have become more
integrated into regional production networks, on the other hand whether the effect of LA
agreements may have production relocation consequences, as manufacturing companies
may prefer to locate an activity or process of their production in countries with a more
favourable trade policy or nearer to potential markets.
Previous results indicate that European Union integration has been a fundamental
driving force behind the increase observed in intermediate goods trade, fostering
integrating countries’ participation in European production networks (Blázquez, Diaz-
Mora and Gandoy, 2009 and 2010; Martínez-Zarzoso, Voicu, and Vidovic, 2010). In the
same vein, this paper tests whether increasing imports of intermediate goods in the
1 Imports of intermediate goods for each LAIA country represent around 60% of total goods from LAIA
and Mercosur (see Table A.1, Appendix).

region have led to higher exports of final and intermediate goods to LA trading partners.
As far as the authors are aware, this is the first paper that addresses the relationship
between product integration networks and the ongoing regional integration process in
LA trading partners at country level.
The rest of the paper is organised as follows. Section 2 presents stylised facts about
regional integration in LA. The main hypotheses are described in Section 3. Section 4
describes the data and the empirical strategy and Section 5 presents the main results.
Finally, Section 6 concludes.
2. Regional Integration in Latin America
2.1. LAIA and Mercosur integration processes
The first of the two agreements considered in this paper, LAIA (Montevideo Treaty,
1980), aims to establish a preferential economic system within the LA region. LAIA
employs three mechanisms to do so: 1) Preferential regional tariffs applied to products
which come from member countries, 2) Regional trade agreements, common to all
member countries and 3) Trade agreements, in which only two or more countries in the
region participate. Member countries are Argentina, Bolivia, Brazil, Chile, Colombia,
Ecuador, Mexico, Paraguay, Peru, Uruguay and Venezuela.2
As regards the second agreement, the Asuncion Treaty was signed in 1991 and
established Mercosur, a free trade area including Argentina, Brazil, Paraguay and
Uruguay. The main objective was to achieve a common market by 1995 based on the
free movement of goods, services and production factors. This Treaty entailed an initial
40% reduction in tariffs among member countries, with progressive reductions until
they were totally eliminated in 1995. That same year, a common external tariff (CET)
came into force in the region. The main foundations of Mercosur included coordination
2 Cuba has been a member since 1999, but is not considered in the empirical analysis.

in macroeconomic, external trade, agriculture, industry, fiscal, monetary and exchange
rate policies, among others.
Unlike other RIAs that involve developed countries, such as the European Union, LAIA
and Mercosur seem to have accepted the arguments put forward by Prebisch (1959) and
Cooper and Massell (1965). Prebisch (1959) distinguished between the effect of trade
protection in developed and developing countries. According to this author, protection
of primary production in developed countries tends to depress developing countries and
decreases growth in world trade, whereas in developing countries trade protection can
correct the effects of existing disparities without hampering growth in world trade. This
author recommends enlarging domestic markets in developing countries by establishing
a common market to foster and diversify trade within the area. In fact, LA regional
integration could have helped Brazil to achieve its industrialisation objectives, as Brazil
exports more sophisticated goods, in which it does not have a comparative advantage, to
Mercosur members (Moncarz, Olarreaga, Vaillant, 2010).
Cooper and Massell (1965), by assuming that economic planners in a developing
country may be willing to accept a reduction in national income to achieve an increase
in industrial production, state that industrialisation objectives might be achieved at a
lower cost by establishing RIAs and point out that when “two countries are
complementary, different industries are likely to be protected in each country, and a
customs union will tend on balance to be trade-diverting, with the loss in efficiency (and
hence in welfare) that Vinerian theory associates with this result”.3 These authors
support not only explicit compensation agreements between the integrated members, but
also a detailed agreement on intra-union division of industry. One example of intra-
Mercosur division of industry could be observed in the leather footwear industry, as
3 Cooper and Massell (1965), page 475.

Argentina specialised in the supply of tanned leather and Brazil specialised in the
production of leather shoes, consolidating a South American production network as a
result of the dramatic growth in consumer demand in the United States during the 1980s
(Korzeniewicz, 1992).
2.2. Intermediate goods trade in LA
As trade in intermediate goods and its role in global production networks are the main
interest of this research, it was considered appropriate to present a more detailed
description of intermediate trade data. After the CET was established in Mercosur,
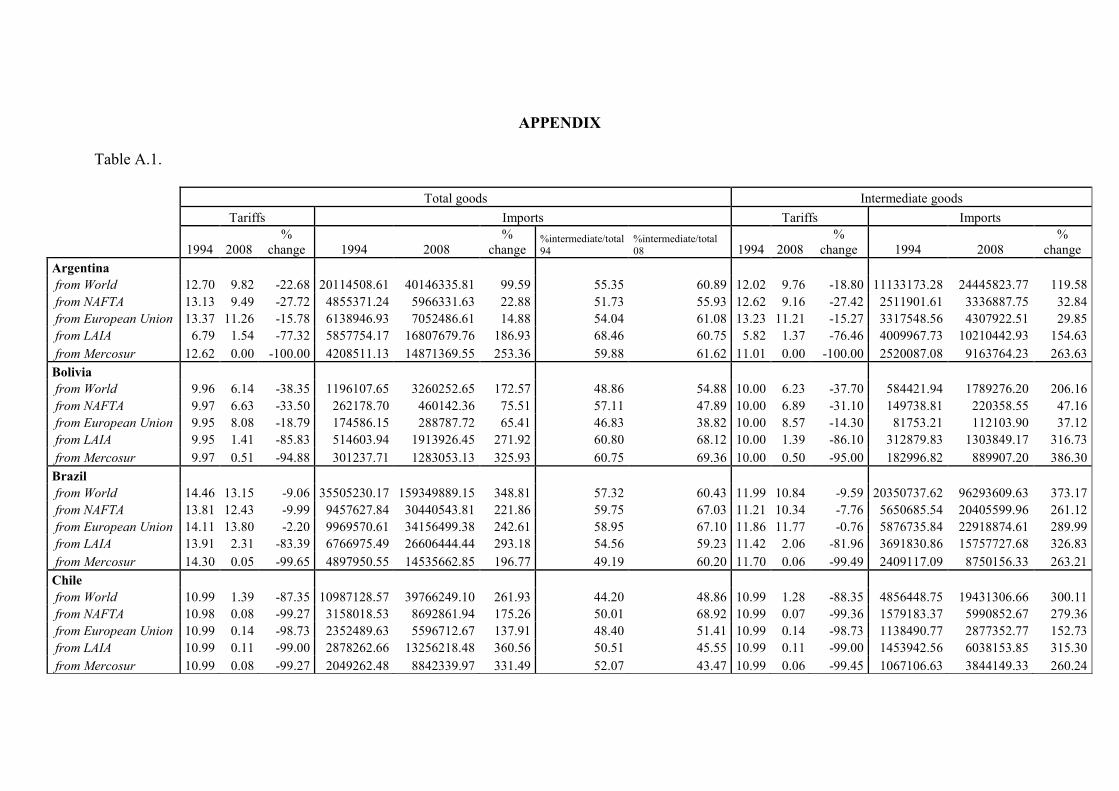
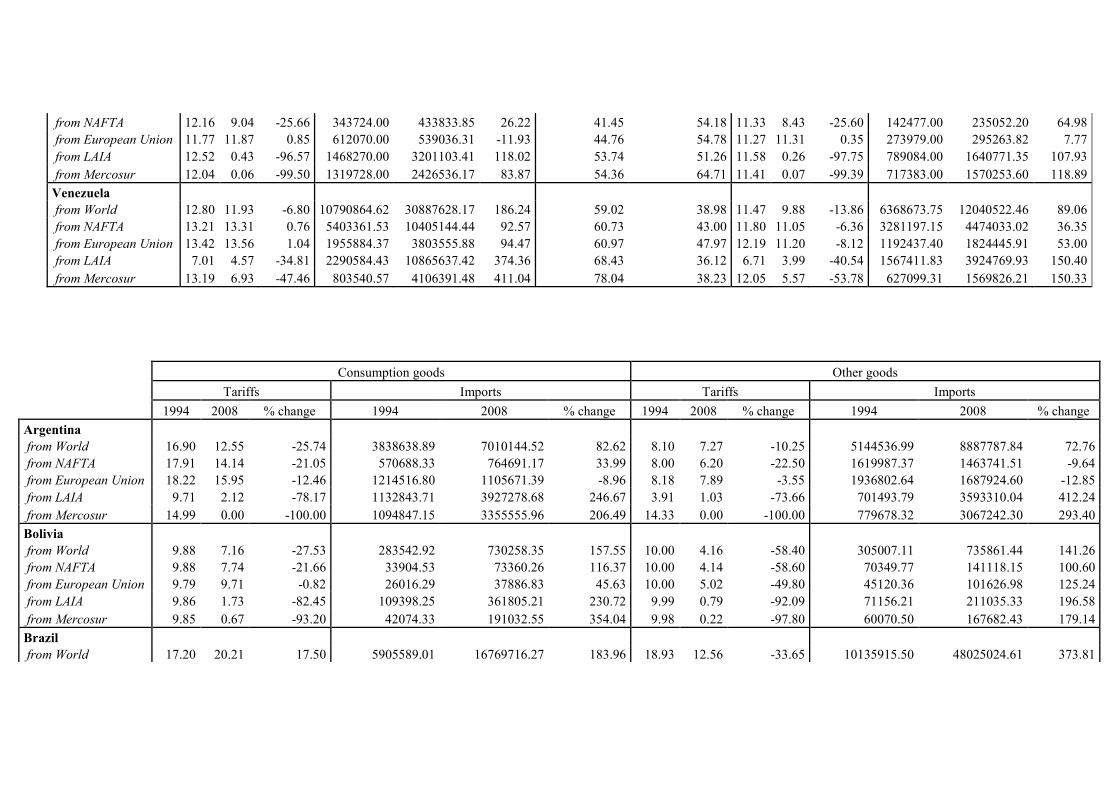
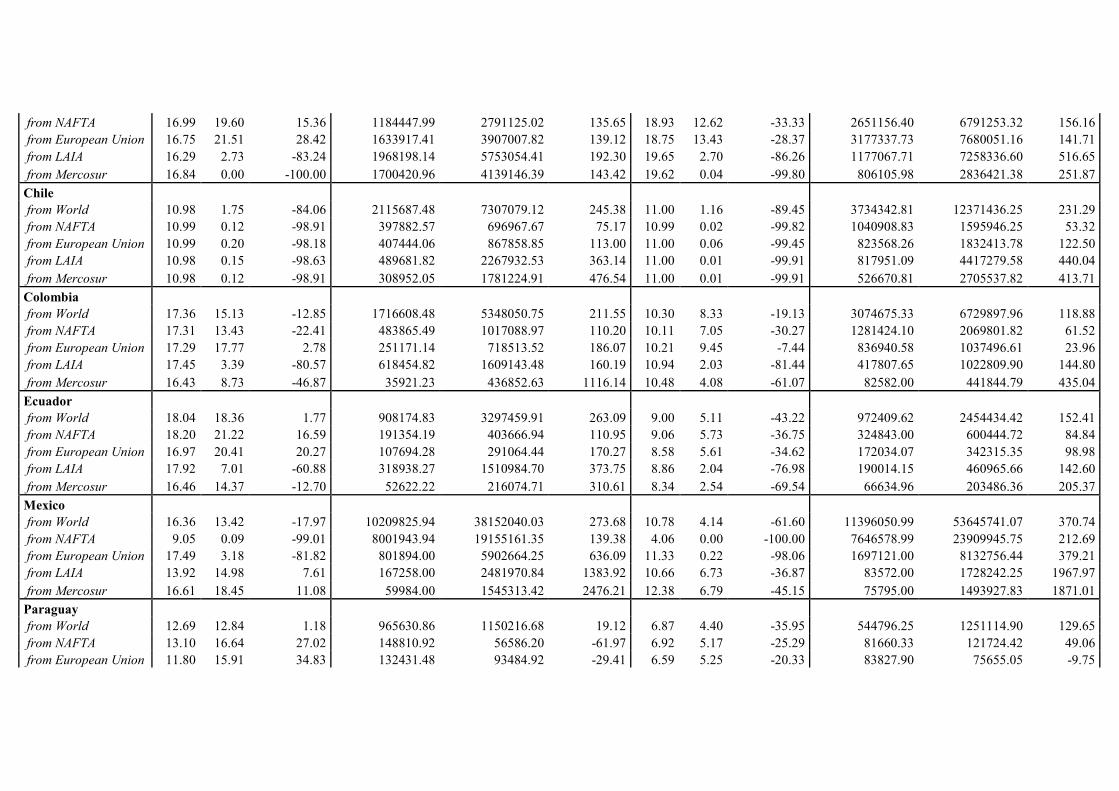
import duties on intermediate goods were reduced drastically. Table A.1 (Appendix)
shows that giving easier access to foreign equipment and intermediate products than to
consumer goods, a trade policy strategy which increases the effective degree of
protection, was widespread among the 11 LAIA members. Nevertheless, some
differences could be observed from one country to another. Brazil protects consumer
goods and other final goods4 to a greater extent than intermediate goods, whereas the
group of other goods, which includes primary fuels and capital goods, is a more
liberalised sector in Argentina, Bolivia, Colombia, Ecuador, Paraguay, Peru, Uruguay
and Venezuela, followed by the sector of intermediate goods. In contrast, Chile has
undergone the most far-reaching liberalisation process over the period 1994-2008.
Mexico has experienced greater liberalisation with other RIAs that involve developed
countries after becoming a member of the North American Free Trade Area (NAFTA)
and signing a free trade agreement with the EU in 2000. Meanwhile, the rest of
countries (excluding Chile) have liberalised trade with LAIA and Mercosur to a greater
extent.
4 According to the BEC classification, see Table A.2 in Appendix.

The relative importance of imports of intermediate goods (in regard to total goods) has
increased in all the countries considered (excluding Bolivia, Ecuador and Venezuela)
when intermediate goods originate in the NAFTA and the EU, whereas they only
increased in Bolivia, Brazil, Ecuador and Paraguay when intermediate goods originate
in the two South-South RIAs considered (LAIA and Mercosur). Additionally, the global
relative importance of intermediate imports, that is, world imports of intermediate goods
over total world imports, increased in all members of Mercosur over the period 1994-
2008. The increase in the importance of intermediate goods trade appears to point
towards greater production integration among the members of the RIAs. Nonetheless,
when considering the change in imports of intermediate goods that originated in
different RIAs, different patterns in LA countries are observed. While a number of
countries in the region seem to be more integrated in LA regional production networks,
such as Brazil (increase in relative imports from LA regional agreements), others seem
to be more integrated in production networks within other integration agreements, such
as the NAFTA and the EU (as is the case of Chile and Mexico) or global production
networks with other countries in the world (as could be the case of the increase in
imports of intermediate goods from China). Figures 1 and 2 summarise the change in
the relative importance of imports of intermediate goods in the four most representative
countries in the region in terms of trade (Argentina, Brazil, Chile and Mexico).
Figure 1. Relative imports of intermediate goods in 1994

Figure 2. Relative imports of intermediate goods in 2008
Furthermore, the specific characteristics of certain intermediate goods might be behind
the different patterns observed in LA imports, such as the relative intensity of
production factors or the abundance of natural resources. In order to illustrate the
change in the composition of intermediate goods in Mercosur, the most advanced and
recent LA integration agreement, the two largest partners (Argentina and Brazil) are
considered. Imports and exports of intermediate goods to and from Mercosur are

calculated over a period of 15 years.5 Figures A.1-A.8 (Appendix) show the results
obtained. Figures A.1 and A.2 show that Argentina has maintained a more similar
import structure over time than Brazil, but that both countries have experienced a larger
increase in relative imports of intermediate goods from Mercosur in sectors 111
(Primary food and beverages, mainly for industry) and 32 (Processed fuels and
lubricants). In contrast, both Argentina and Brazil now import less intermediate goods
from sector 53 (Parts and accessories of transport equipment) than in the past. This is
the opposite to what has occurred in the European Union automotive sector, where the
adhesion of Eastern and Central European countries has led to greater integration of
production networks (Blázquez, Diaz-Mora and Gandoy, 2010), as the automotive
sector in Mercosur still has a number of artificial trade barriers.6 Additionally, Brazil
also imports less intermediate goods from Mercosur in the case of sectors 121
(Processed food and beverages, mainly for industry), 21 (Primary industrial supplies)
and 22 (Processed industrial supplies).
With regard to exports, Argentina has recorded an increase in exports of intermediate
goods belonging to sectors 111 and 32 to Mercosur, whereas Brazil now exports more
intermediate goods from sectors 22 and 32 to Mercosur. The decrease in exports from
sector 53 in both countries falls in line with the previous argument and indicates the
existence of protectionist industrial policy in the automotive sector in Mercosur.7
Finally, Argentina also registers a decrease in exports where goods from sector 21
(Primary industrial supplies) are concerned. This sector includes raw hides, skins,
5 The first and last years of the period considered to analyse the change by sector were selected in
accordance with data availability. 6 See for example the recent case “Brasil informará hoy si acepta las condiciones argentinas para
negociar” (“Brazil will announce today whether it accepts Argentina’s conditions for negotiations” in
English), Page 12, 16th May 2011. http://www.pagina12.com.ar/diario/economia/2-168230-2011-05-
16.html 7 The Mercosur agreement included special conditions for the automotive sector, as it was not included in
the common market. The automotive sector became both a central and controversial issue within
Mercosur’s regional trade integration process (Ciravegna, 2003).

leather and furs and was a key variable in the division of labour between Argentina and
Brazil in the 1980s, as Argentina exported leather to Brazil, which expanded its leather
footwear industry through an increase in exports mainly due to the growth in consumer
demand for footwear in the United States (Korzeniewicz, 1992). The argument that
Brazil should record greater profits than Argentina, due to being closer to the
consumption end of the leather production network (Gerefi and Korzeniewicz, 1990)
might be in line with the decision by Argentinean authorities to restrict exports of
primary goods, such as raw and semi-tanned bovine hides, with a lower value added.8
This descriptive analysis performed for intermediate goods in LA countries indicates the
need to empirically test whether LA regionalism has led to increasing regional
production networks in LA countries.
3. Hypotheses
This paper aims to test two main hypotheses. In the first case, the issue is whether LA
countries have become more integrated into regional production networks within the LA
regionalism process (H1). In this sense, the higher the imports of intermediate goods,
the greater the flow of exports of final goods to LA partner countries. As opposed to
RIAs that involve developed countries, we expect production networks to have only a
small effect on integration as no significant changes have occurred in the pattern of
trade over the last 20 years at a very aggregate level (including all sectors, years and
countries). However, marked differences are expected when different countries, periods
of time and sectors are considered.
Secondly, the effect of LA integration may have fostered the relocation of production,
as manufacturers may prefer to locate an activity or process of their production in
countries with more favourable trade policy, greater macroeconomic stability or which
8 The scarcity of raw materials in the international leather market and the increase in production of
synthetic footwear manufactures in Brazil are also behind these figures.

are nearer to potential markets (H2). This relationship may be ambiguous. On the one
hand, a “substitution” effect might occur, whereby the higher the imports of
intermediate goods from the rest of the world, the lower the export flow of intermediate
goods to partner countries (inverse relationship). On the other hand, a “complementary”
effect might also occur, whereby the higher the imports of intermediate goods from the
rest of the world, the higher the export flow of intermediate goods to partner countries
(direct relationship), hence revealing a stronger and more complex integration
relationship through the various stages of production.
The two effects stated in H1 and H2 are summarised in Figure 3. If H1 is true, an
increase in imports of intermediate goods from the rest of the world (RoW) in a
particular LA country would lead to an upturn in exports of final goods to the region. If
H2 implies a direct relationship, an increase in imports of intermediate goods in LA
countries would lead to higher exports of intermediate goods bound for LA trading
partners, thus indicating that intermediate goods are processed in different countries in
the region, which then export them to another country in the region, which assembles
and sells the final good.
Figure 3. H1 and H2 production integration networks.9
9 Note that RoW denotes countries other than the exporting or importing country.

Related to these two main hypotheses, Recalde, Florensa and Iturralde (2010) have
shown that exports from LAIA countries to the rest of the world have decreased as a
consequence of growth in Brazil’s exports and this displacement effect is higher in the
case of manufactures than other goods. Therefore, the third hypothesis to be tested is
that the effect of regional integration on production networks differs by sector (H3). In
order to test H3, and provided that the items in the BEC trade classification aggregate a
high number of sectors, a correspondence table is built (Table A.3, Appendix) between
final and intermediate industries and separate regressions are run for the four different
sectors of final goods (food and beverages, capital goods, transport equipment,
consumer goods) and for the four sectors of intermediate goods (food and beverages,
capital goods, transport equipment, industrial products) considered in the empirical
analysis. Evidence of H1 is found for the consumer goods industry, an inverse
relationship in H2 for the sector of food and beverages and a direct relationship in H2
for capital goods.
RoW LA country RoW LA country
Intermediate
Good Exports
Intermediate
Good Exports
Final Good
Exports
Intermediate
Good Exports
Final Good
Exports
H1
H2

Previous research has found a significant positive impact on the increase in exports
within the Mercosur integration process in Argentina (trade creation), whereas no
significant effect was found for Brazil (Recalde and Florensa, 2009). Moreover, the
trade liberalisation process seems to have been stronger in Mercosur than in LAIA (see
Table A.1). Consequently, the fourth hypothesis to be tested is that the effect of regional
integration on production networks in LAIA and Mercosur might differ (H4). This
paper provides empirical evidence for H4 as the effect on regional production networks
is stronger in Mercosur than in LAIA.
Finally, Korzeniewicz (1992) and Ciravegna (2003) provided evidence of the existence
of a strongly integrated regional value chain in the 1990s in two strategic industries in
Mercosur, namely the leather footwear and automotive value chains. However, the
significant events that took place at the end of the 1990s and the beginning of the
present century affected stability and international investor confidence, thereby
interrupting regional production networks.10
Hence, the last hypothesis to be tested is
that the existence of the strongest LA regional production networks may have been
limited during the period immediately after the creation of the Southern Common
Market, whereas regional integration per se might not guarantee significant production
networks because of the continued absence of a serious commitment to regional trade
integration in LA (H5). The results of this research support H5, as imports of
intermediate goods have a more positive impact on exports of both final and
intermediate goods within Mercosur over the period 1991-1999 than over the period
2000-2008.
4. Empirical Analysis
10 The Brazilian devaluation in 1998 and the Argentinean crisis at the beginning of the present century.

This paper uses data for trade in goods between eleven LAIA members (Argentina,
Bolivia, Brazil, Chile, Colombia, Ecuador, Mexico, Paraguay, Peru, Uruguay and
Venezuela) over the period 1991-2008. The products are classified according to the
Broad Economic Categories (BEC) codes as in Baldwin and Taglioni (2011).11
Trade
data and tariffs are obtained from the World Integrated Trade Solution (WITS).
Nominal exchange rates and GDP deflators are taken from the World Development
Indicators database and contiguity and distance from CEPII.
A gravity equation is specified and estimated for trade data at sector level. Previous
literature which uses the gravity equation for both developed and developing countries
(Márquez-Ramos, Martínez-Zarzoso and Suárez-Burget, 2010) finds that this model
performs better for developed than for developing exporters, for which reason other
factors such as exchange rates could be important determinants of exports. As a result,
exchange rates are included in the estimated gravity regressions. Additionally, Baldwin
and Taglioni (2011) point out that trade is measured on a gross sales basis while GDP is
measured on a net sales basis, i.e. value added, presenting empirical evidence that the
gravity equation model performs poorly when applied to bilateral flows where there is
significant trade in intermediate goods. To address this issue, this paper includes an
additional control variable. This variable is imports of intermediate goods from the
RoW to a particular country. Exporter-time, importer-time and sector-specific fixed
effects are included in the model (not reported in Tables 1-4), as the effects of exporter-
time and importer-time model “multilateral resistance” terms and sector-specific effects
model unobservable characteristics at sector level. Finally, as in Anderson and van
Wincoop (2003), the product of the GDPs of the exporter and the importer divides
exports by the LHS variable. Two different models are regressed as follows:
11 The sectors considered in the analysis are 1, 4, 5 and 6 (final goods) and 1, 2, 4 and 5 (intermediate
goods).

ijktkjtitiktjijikt
ijtijtijij
ji
ijkt
sMlandlandfinaltariff
MercERcontigDistYY
finalX
εφγαααα
ααααα
++++⋅+⋅+⋅+⋅+
+⋅+⋅+⋅+⋅+=
⋅
int_ln_ln
lnln_
ln
8765
43210(1)
ijktkjtitiktjijikt
ijtijtijij
ji
ijkt
zMlandlandtariff
MercERcontigDistYY
X
δϕηββββ
βββββ
++++⋅+⋅+⋅+⋅+
+⋅+⋅+⋅+⋅+=
⋅
int_lnint_ln
lnlnint_
ln
8765
43210 (2)
where ln denotes natural logarithms. Equation (1) tests hypothesis 1 (H1) and Equation
(2) tests hypothesis 2 (H2).
X_finalijkt (X_intijkt) denotes the value of exports of final (intermediate) goods k from
country i to j in the year t; Yi (Yj) denotes GDP in the exporter (importer)’s country,
respectively; Distij is the geographical great circle distance in kilometres between the
capitals of country i and j. Contigij is a dummy for countries sharing a common
geographical border and landj (landj) takes a value equal to one if the exporter
(importer) is landlocked. ERijt denotes the real exchange cross-rate12
between the
exporting and importing country.13
Tariff_finaljikt (Tariff_intjikt) is the weighted average
tariff effectively applied to each LA exporter that exports a final (intermediate) good k
to each of the 10 importers.14
M_intikt denotes the value of imports of intermediate
goods from the RoW in the year t required to produce a final or an intermediate good k
in country i. Finally, ijktε and ijktδ are the error terms.
5. Main Results
In order to analyse the set of hypotheses established in section 3, Equations (1) and (2)
are estimated using the data from the LAIA countries between 1991 and 2008. As the
12 The real exchange cross-rate is constructed as EAxPB/EBxPA, where E denotes the nominal exchange
rate in a particular country (A or B) and P denotes the GDP deflator in country A or B. 13 An increase in this variable indicates devaluation in the exporter country. As Ecuador was dollarised in
the year 2000, the exchange rates series in Ecuador was transformed by multiplying the nominal
exchange rate in 1999 by the GDP deflator in every year t from the year 2000 onwards. 14 It is important to note that export taxes are also of great relevance in the case of Argentina as, for
example, is the case of soybean. Due to data restrictions, export taxes were not considered in the
empirical analysis.

dataset is a panel, special estimation techniques are required. The presence of
unobserved heterogeneity could be modelled as being random or fixed. A Hausman test
indicates that fixed effects are preferred, for which reason fixed effects estimates were
employed.15
Table 1 and Table 2 show the estimation results of regressing Equations (1)
and (2), respectively, and they are related to H1, H2 and H3. First, Column (1)16
in
Table 1 shows that the exchange rate variable is not significant, whereas the coefficient
of tariffs is negative and significant. Second, Column (1) in Table 2 shows the expected
negative sign for the tariffs variable, while the exchange rate displays a negative sign
and is significant in the case of exports of intermediate goods over the product of
incomes in exporting and importing countries (the LHS variable). A devaluation in a
LAIA country decreases relative exports of intermediates to other LA countries. This
result is unexpected and requires further research. It could be due to country and/or time
heterogeneity in the sample. As expected, trade integration (tariffs) is seen to have an
effect on LA exports of both intermediate and final goods, whereas the effect of
increasing imports of intermediate goods from RoW is found to be non-significant when
regressing Equations (1) and (2) for all sectors, LAIA countries and years.
Columns (2), (3), (4) and (5) in Tables 1 and 2 show the estimation results of testing
H3, as the variable of interest, M_intikt , interacts with sectors 1, 4, 5 and 6, respectively.
Table 1 shows empirical evidence of the existence of H1 among LAIA members only in
the sector of consumption goods. Therefore, the higher the level of imports of industrial
products from the RoW, the higher the level of exports of consumer goods among LAIA
15 As the estimate is based on fixed effects, the Tables in this Section do not show the coefficients of
distance, contiguity, Mercosur and landlocked dummies. Nonetheless, when Equations (1) and (2) are
estimated using random effects, distance is found to be significant and displays a negative sign, whereas
contiguity and Mercosur dummies are positive and significant, as expected. Landlocked is only negative
and significant in the case of the importing country. These results are available upon request. 16 Column (1) in Tables 1 and 3 corresponds to the results obtained for the baseline model when
regressing Equation (1), whereas Column (1) in Tables 2 and 4 corresponds to the results obtained for the
baseline model when regressing Equation (2). Baseline results are included in the different tables for
comparative purposes.

members will be. In relation to H2, Table 2 shows that a “substitution” effect exists in
the sector of food and beverages, i.e. higher imports of intermediate goods leads to
lower exports of intermediate goods to the region, whereas a “complementary” effect
exists in the case of capital goods.
Table 1. The effect of imports of intermediate goods on exports of final goods (H1) in
different sectors (H3)
H1 (1) H3 (2) H3 (3) H3 (4) H3 (5)
Exchange rate 0.209 0.209 0.205 0.21 0.213
0.825 0.826 0.812 0.83 0.844
Tariffs -0.104*** -0.104*** -0.106*** -0.103*** -0.105***
-5.232 -5.222 -5.328 -5.197 -5.315
Imports of intermediate goods from RoW 0.067 0.092 0.095 0.077 0.04
0.645 0.842 0.891 0.704 0.378
Imports of intermediate goods from RoW
*BEC1 -0.077
-0.775
Imports of intermediate goods from
RoW*BEC4 -0.111
-1.173
Imports of intermediate goods from
RoW*BEC5 -0.03
-0.298
Imports of intermediate goods from
RoW*BEC6 0.247**
2.392
Constant Term -42.802*** -42.620*** -42.472*** -42.111*** -43.027***
-27.893 -29.867 -29.971 -28.155 -27.099
Number of observations 4002 4002 4002 4002 4002
R2_within 0.28 0.28 0.28 0.28 0.28
R2_between 0.01 0.00 0.00 0.04 0.04
R2_overall 0.01 0.00 0.01 0.06 0.03
AIC 10095.68 10096.85 10095.78 10097.56 10089.79
BIC 11776.32 11783.79 11782.72 11784.49 11776.73
RMSE 0.94 0.94 0.94 0.94 0.94
Notes: ***, **, * indicate significance at 1%, 5% and 10%, respectively. T-statistics are provided below
every coefficient.
Table 2. The effect of imports of intermediate goods on exports of intermediate goods
(H2) in different sectors (H3)
H2 (1) H3 (2) H3 (3) H3 (4) H3 (5)
Exchange rate -0.497* -0.487* -0.481* -0.497* -0.495*
-1.941 -1.908 -1.885 -1.942 -1.936
Tariffs -0.084*** -0.082*** -0.081*** -0.085*** -0.085***
-4.353 -4.257 -4.198 -4.36 -4.365
Imports of intermediate goods from RoW -0.052 0.038 -0.121 -0.062 -0.045
-0.501 0.353 -1.154 -0.569 -0.438

Imports of intermediate goods from RoW
*BEC1 -0.336***
-3.196
Imports of intermediate goods from
RoW*BEC4 0.294***
3.191
Imports of intermediate goods from
RoW*BEC5 0.026
0.291
Imports of intermediate goods from
RoW*BEC2 -0.07
-0.723
Constant Term -41.244*** -41.307*** -41.306*** -41.281*** -41.000***
-28.732 -29.896 -28.949 -27.851 -27.676
Number of observations 4034 4034 4034 4034 4034
R2_within 0.18 0.18 0.18 0.18 0.18
R2_between 0.01 0.04 0.02 0.00 0.00
R2_overall 0.03 0.03 0.01 0.01 0.00
AIC 10471.48 10460.29 10460.33 10473.37 1047281.00
BIC 12154.25 12149.36 12149.40 12162.45 12161.88
RMSE 0.94 0.94 0.94 0.94 0.94
Notes: ***, **, * indicate significance at 1%, 5% and 10%, respectively. T-statistics are provided below
every coefficient.
Tables 3 and 4 show the estimation results related to H1, H2, H4 and H5. Column (2) in
Tables 3 and 4 test H4 as an additional variable is included, namely the interaction
between the variable of interest and Mercosur membership (Imports of intermediate
goods from RoW*Mercosur). This variable is positive and significant when testing H1
(Table 3), but is non-significant for H2 (Table 4). This result is in line with H4, which
predicted a different effect on regional production networks among Mercosur and LAIA
members, a greater impact being expected in the case of Mercosur. With regard to H5,
regressions are carried out for two different periods, 1991-1999 and 2000-2008.
Columns (3) and (4) in Tables 3 and 4 show the estimation results of regressing
Equations (1) and (2) for the period 1991-1999 and 2000-2008, respectively. As
expected, a positive relationship is found between the imports of intermediate goods
from the RoW and exports of final goods among Mercosur members over 1991-1999
(Table 3). Furthermore, Table 4 shows a positive relationship between the imports of
intermediate goods from the RoW and exports of intermediate goods within Mercosur

over the same period. Tables 3 and 4 provide evidence in line with H5 expectations, as
imports of intermediate goods from the RoW are found to have a non-significant effect
on exports of both final and intermediate goods from 2000 onwards. Finally, the real
exchange cross-rate only recorded a positive and significant sign over the period 1991-
1999, suggesting that devaluation in the exporting country led to an increase in exports
of final goods to LA. The instability of Latin American countries during this period,
associated to the “Tequila” crisis and including the devaluation in Brazil, the
convertibility program in Argentina, the economic crisis in Ecuador, hyperinflation and
the widespread economic deregulation and privatisation process in the region, among
other things, might be reflected in the results obtained for the variable real exchange
rates.17
Table 3. The effect of imports of intermediate goods on exports of final goods (H1) in
LAIA, Mercosur (H4) and over different periods of time (H5)
H1 (1) H4 (2) H5 (3) 1991-1999 H5 (4) 2000-2008
Exchange rate 0.209 0.206 4034.417* -0.683
0.825 0.816 1.742 -0.601
Tariffs -0.104*** -0.102*** -0.168*** -0.087***
-5.232 -5.114 -2.83 -3.813
Imports of intermediate goods from
RoW 0.067 0.025 0.135 -0.09
0.645 0.232 0.74 -0.546
Imports of intermediate goods from
RoW* Mercosur 0.383** 0.753** 0.038
2.029 2.377 0.139
Constant Term -42.802*** -41.780*** 1531.776* -40.915***
-27.893 -28.73 1.693 -17.596
Number of observations 4002 4002 1907 2095
R2_within 0.28 0.28 0.19 0.27
R2_between 0.01 0.03 0.00 0.00
R2_overall 0.01 0.04 0.00 0.01
AIC 10095.68 10092.00 4130.22 4314.98
BIC 11776.32 11778.94 4752.19 5099.95
RMSE 0.94 0.94 0.91 0.83
Notes: ***, **, * indicate significance at 1%, 5% and 10%, respectively. T-statistics are provided below
every coefficient.
17 It is worth noting that the evolution of trade among LA countries is strongly associated to international
trade trends and trading terms. Hence, this result must be treated with caution due to the different role of
prices in explaining trade trends or cycles (Díaz-Cafferata et al, 2002; Díaz-Cafferata and Fornero, 2003).

Table 4. The effect of imports of intermediate goods on exports of intermediate goods
(H2) in LAIA, Mercosur (H4) and over different periods of time (H5)
H2 (1) H4 (2) H5 (3) 1991-1999 H5 (4) 2000-2008
Exchange rate -0.497* -0.497* -553.455 -0.097
-1.941 -1.943 -0.257 -0.094
Tariffs -0.084*** -0.084*** -0.115** -0.061***
-4.353 -4.341 -2.174 -2.822
Imports of intermediate goods from
RoW -0.052 -0.054 -0.104 0.237
-0.501 -0.513 -0.618 1.516
Imports of intermediate goods from
RoW* Mercosur 0.02 0.684** -0.044
0.111 2.402 -0.178
Constant Term -41.244*** -40.506*** -75.381 -45.545***
-28.732 -28.676 -0.566 -20.45
Number of observations 4034 4034 1895 2139
R2_within 0.18 0.18 0.15 0.22
R2_between 0.01 0.01 0.01 0.00
R2_overall 0.03 0.02 0.01 0.00
AIC 10471.48 10473.47 4044.57 4509.30
BIC 12154.25 12162.54 4665.84 5297.17
RMSE 0.94 0.94 0.84 0.81
Notes: ***, **, * indicate significance at 1%, 5% and 10%, respectively. T-statistics are provided below
every coefficient.
6. Conclusions
This paper analyses intra-LAIA and intra-Mercosur trade in intermediate goods by
linking them to trade in final goods and tests two main hypotheses: first, whether LA
countries have become more integrated into regional production networks (H1), in
which case, an increase in imports of intermediate goods from the RoW leads to higher
exports of final goods to LA partners. Second, this analysis tests whether the effect of
LA agreements may have consequences in terms of the relocation of production (H2);
then, higher imports of intermediate goods from the RoW might lead to higher or lower
exports of intermediate goods to LA countries (direct or inverse effect, respectively).
Additionally, the two main hypotheses are tested for the different sectors (H3),
agreements (H4) and periods of time (H5).

Our results find evidence of H1 in consumer goods, suggesting that the higher level of
imports of industrial products from the RoW, the higher level of exports of consumer
goods to LA countries. Evidence is also found of H2, results being in line with the
existence of a “substitution” effect in the sector of food and beverages and a
“complementary” effect in capital goods.
The effect on regional production networks is found to be greater in Mercosur, and this
effect is non-significant in LAIA. Finally, there is evidence of H1 and H2
(“complementarities”) among Mercosur members, but only over the period 1991-1999.
As opposed to the apparently greater production integration among the members of the
RIAs in LA due to the increase in the importance of intermediate goods trade and to the
results obtained by other integration agreements in which both developed and
developing countries are involved, such as the European Union with Maghreb countries
or Central and Eastern European Countries, these results point towards a downward
trend in LA production networks.
References
- Anderson, J. E. and van Wincoop, E. (2003). “Gravity with gravitas: A solution to the
border puzzle”, American Economic Review 93(1), 170-192.
- Baldwin, R. and Taglioni, D. (2011). “Gravity chains: estimating bilateral trade flows
when parts and components trade is important”. NBER Working Paper Series.
Working Paper 16672. http://www.nber.org/papers/w16672
- Blanchard, O. and Pérez-Enrri, D. (2000). Macroeconomía. Teoría y Política
Económica con aplicaciones a América Latina. Prentice Hall, Argentina.
- Blázquez, L., Diaz-Mora, C. and Gandoy, R. (2009). “Cross-National Production
Networks in Europe: Evidence from Spain”, Paper presented at the 11th Meeting of
the European Trade Study Group.

- Blázquez, L., Diaz-Mora, C. and Gandoy, R. (2010). “European Automotive
Networks: A parts and components trade perspective”, Paper presented at the 7th
Jornadas sobre Integración Económica, Spain.
- Ciravegna, L. (2003). “Global and regional integration of production in the Mercosur
automotive value chains: the case of Fiat”. Paper presented at the EADI workshop,
“Clusters and Value Chains in the North and in the Third World”, 30-31st of
November 2003, Università del Piemonte Orientale, Novara.
- Cooper, C. and B. Massell (1965). “Toward a General Theory of Customs Union for
Developing Countries”, Journal of Political Economy, 73, 461-476.
- De Paiva Abreu, M. (2004). “Trade Liberalization and the Political Economy of
Protection in Brazil since 1987”, INTAL-ITD, Working Paper –SITI-08a.
- Díaz-Cafferata, A. M., Gáname, M. C. and Moncarz, P. E. (2002). “Sensitivity of
Argentine Exports to World Exports”. XXXVII Reunión Anual de la Asociación
Argentina de Economía Política. Universidad de Tucumán, 13-15 November.
- Díaz-Cafferata, A. M. and Fornero, J. (2003). “Tendencias y Quiebres del Grado de
Apertura Exportador de Argentina. Una Perspectiva Internacional, 1884-2002”.
XXXVIII Reunión Anual de la Asociación Argentina de Economía Política.
Universidad Nacional de Cuyo, 12-14 November.
- Gerefi, G. and Korzeniewicz, M. (1990). “Commodity Chains and Footwear Exports
in the Semiphery.” William G. Martin (ed), Semipheral States in the World Economy,
New York: Greenwood, 45-68.
- Korzeniewicz, M. (1992). “Global Commodity Networks and the Leather Footwear
Industry: Emerging Forms of Economic Organization”, Sociological Perspectives 35
(2), 313-327.

- Márquez-Ramos, L. and Martínez-Zarzoso, I. (2011). “Production integration and
disintegration of North African countries into the European Union”, Universitat
Jaume I, mimeo.
- Márquez-Ramos, L., Martínez-Zarzoso, I. and Suárez-Burget, C. (2010). “Trade
policy versus institutional trade barriers: An application using “good old” OLS”.
Fundación de las Cajas de Ahorros. Working paper 514/2010.
- Martínez-Zarzoso, I., Voicu, A. and Vidovic, M. (2010). “CEECs Integration into
Regional and Global Production Networks”. Available at:
http://works.bepress.com/inma_martinez_zarzoso/20
- Moncarz, P., Olarreaga, M. and Vaillant, M. (2011). “Regionalism as Industrial
Policy. Evidence from MERCOSUR.” Mimeo.
- Prebisch, R. (1959). “Commercial policy in the underdeveloped countries”, American
Economic Review, 49, 251-273.
- Recalde, M.L. and Florensa, L. M. (2009). “Impacto del Mercosur en el comercio
Internacional de Argentina y Brasil: ecuación gravitatoria y Filtro de Kalman”.
Montevideo, 5-6 October 2009. XXIV Jornadas Anuales de Economía 2009 del
Banco Central de Uruguay.
- Recalde, M. L., Florensa, M. and Iturralde, I. (2010). “Latin American Exports: Has
Brazil displaced them?”. XXIV International Conference on Applied Economics,
ASEPELT. Universidad de Alicante, Spain, 16- 19 June 2010 and XLIV Reunión
Anual de la Asociación Argentina de Economía Política. Universidad Nacional de
Cuyo, 18-20 November 2009.
- Viner, J. (1950). The Customs Union Issue. New York: Carnegie Endowment for
International Peace.
APPENDIX
Table A.1.
Total goods Intermediate goods
Tariffs Imports Tariffs Imports
1994 2008
%
change 1994 2008
%
change %intermediate/total
94
%intermediate/total
08 1994 2008
%
change 1994 2008
%
change
Argentina
from World 12.70 9.82 -22.68 20114508.61 40146335.81 99.59 55.35 60.89 12.02 9.76 -18.80 11133173.28 24445823.77 119.58
from NAFTA 13.13 9.49 -27.72 4855371.24 5966331.63 22.88 51.73 55.93 12.62 9.16 -27.42 2511901.61 3336887.75 32.84
from European Union 13.37 11.26 -15.78 6138946.93 7052486.61 14.88 54.04 61.08 13.23 11.21 -15.27 3317548.56 4307922.51 29.85
from LAIA 6.79 1.54 -77.32 5857754.17 16807679.76 186.93 68.46 60.75 5.82 1.37 -76.46 4009967.73 10210442.93 154.63
from Mercosur 12.62 0.00 -100.00 4208511.13 14871369.55 253.36 59.88 61.62 11.01 0.00 -100.00 2520087.08 9163764.23 263.63
Bolivia
from World 9.96 6.14 -38.35 1196107.65 3260252.65 172.57 48.86 54.88 10.00 6.23 -37.70 584421.94 1789276.20 206.16
from NAFTA 9.97 6.63 -33.50 262178.70 460142.36 75.51 57.11 47.89 10.00 6.89 -31.10 149738.81 220358.55 47.16
from European Union 9.95 8.08 -18.79 174586.15 288787.72 65.41 46.83 38.82 10.00 8.57 -14.30 81753.21 112103.90 37.12
from LAIA 9.95 1.41 -85.83 514603.94 1913926.45 271.92 60.80 68.12 10.00 1.39 -86.10 312879.83 1303849.17 316.73
from Mercosur 9.97 0.51 -94.88 301237.71 1283053.13 325.93 60.75 69.36 10.00 0.50 -95.00 182996.82 889907.20 386.30
Brazil
from World 14.46 13.15 -9.06 35505230.17 159349889.15 348.81 57.32 60.43 11.99 10.84 -9.59 20350737.62 96293609.63 373.17
from NAFTA 13.81 12.43 -9.99 9457627.84 30440543.81 221.86 59.75 67.03 11.21 10.34 -7.76 5650685.54 20405599.96 261.12
from European Union 14.11 13.80 -2.20 9969570.61 34156499.38 242.61 58.95 67.10 11.86 11.77 -0.76 5876735.84 22918874.61 289.99
from LAIA 13.91 2.31 -83.39 6766975.49 26606444.44 293.18 54.56 59.23 11.42 2.06 -81.96 3691830.86 15757727.68 326.83
from Mercosur 14.30 0.05 -99.65 4897950.55 14535662.85 196.77 49.19 60.20 11.70 0.06 -99.49 2409117.09 8750156.33 263.21
Chile
from World 10.99 1.39 -87.35 10987128.57 39766249.10 261.93 44.20 48.86 10.99 1.28 -88.35 4856448.75 19431306.66 300.11
from NAFTA 10.98 0.08 -99.27 3158018.53 8692861.94 175.26 50.01 68.92 10.99 0.07 -99.36 1579183.37 5990852.67 279.36
from European Union 10.99 0.14 -98.73 2352489.63 5596712.67 137.91 48.40 51.41 10.99 0.14 -98.73 1138490.77 2877352.77 152.73
from LAIA 10.99 0.11 -99.00 2878262.66 13256218.48 360.56 50.51 45.55 10.99 0.11 -99.00 1453942.56 6038153.85 315.30
from Mercosur 10.99 0.08 -99.27 2049262.48 8842339.97 331.49 52.07 43.47 10.99 0.06 -99.45 1067106.63 3844149.33 260.24

Colombia
from World 12.48 10.74 -13.94 11277084.97 29444210.75 161.10 53.90 56.84 11.18 9.55 -14.58 6078378.01 16735857.50 175.33
from NAFTA 12.30 8.91 -27.56 4543593.06 11067433.54 143.58 53.43 63.54 11.02 7.84 -28.86 2427539.02 7031876.09 189.67
from European Union 11.87 12.09 1.85 2429606.99 3697611.25 52.19 44.59 54.31 10.84 11.05 1.94 1083278.56 2008168.14 85.38
from LAIA 12.83 2.41 -81.22 2658670.17 8547920.54 221.51 65.82 58.62 11.63 2.06 -82.29 1749807.51 5011206.89 186.39
from Mercosur 11.61 5.63 -51.51 629678.29 2894532.52 359.68 80.74 59.52 10.85 4.76 -56.13 508407.63 1722815.38 238.86
Ecuador
from World 11.91 9.72 -18.39 3621131.23 15929164.22 339.89 47.76 61.50 10.29 6.90 -32.94 1729624.80 9796154.87 466.37
from NAFTA 11.87 10.91 -8.09 1154419.97 3212920.74 178.31 53.22 66.30 10.11 7.96 -21.27 614400.26 2130066.04 246.69
from European Union 10.43 9.94 -4.70 634585.66 1324909.12 108.78 58.72 52.17 9.51 7.67 -19.35 372606.51 691266.78 85.52
from LAIA 12.06 3.85 -68.08 1009656.26 4857263.45 381.08 52.72 58.16 10.58 2.70 -74.48 532249.80 2824907.47 430.75
from Mercosur 10.58 6.99 -33.93 281867.53 1260252.20 347.11 56.76 64.71 10.02 4.70 -53.09 159986.10 815536.26 409.75
Mexico
from World 12.36 6.66 -46.12 67495877.01 269987263.73 300.01 68.13 67.27 10.90 4.28 -60.73 45984705.09 181624062.54 294.97
from NAFTA 6.23 0.05 -99.20 51832465.00 150663323.64 190.67 70.09 72.23 5.65 0.05 -99.12 36328412.08 108830271.66 199.57
from European Union 13.00 1.05 -91.92 6368431.00 36792872.19 477.74 60.17 64.26 11.87 0.48 -95.96 3831998.00 23641441.38 516.95
from LAIA 11.38 9.27 -18.54 1369050.00 10869869.05 693.97 81.30 63.45 10.41 6.93 -33.43 1113005.00 6896751.08 519.65
from Mercosur 12.89 9.99 -22.50 735345.00 6252592.94 750.29 80.83 55.27 11.88 7.01 -40.99 594365.00 3455515.79 481.38
Paraguay
from World 8.75 8.42 -3.77 2423905.55 5033053.19 107.64 35.76 52.17 6.53 7.26 11.18 866794.94 2625723.86 202.92
from NAFTA 9.16 10.78 17.69 323287.36 271986.38 -15.87 28.76 36.04 7.13 9.57 34.22 92962.05 98017.61 5.44
from European Union 7.83 10.28 31.29 298524.03 276463.48 -7.39 31.55 40.48 5.91 9.62 62.77 94196.51 111913.36 18.81
from LAIA 8.40 2.28 -72.86 1093246.40 2770117.80 153.38 51.71 67.55 5.99 1.48 -75.29 565349.26 1871197.92 230.98
from Mercosur 7.87 0.14 -98.22 979239.50 2478130.80 153.07 54.21 66.50 5.79 0.08 -98.62 530852.08 1647911.90 210.43
Peru
from World 16.24 3.90 -75.99 7583564.34 21524237.15 183.83 50.31 56.71 15.65 3.27 -79.11 3815064.45 12207153.58 219.97
from NAFTA 16.31 5.00 -69.34 2305461.51 6810117.20 195.39 55.67 69.09 15.83 4.53 -71.38 1283406.70 4704941.01 266.60
from European Union 15.68 4.06 -74.11 1389840.12 2585209.80 86.01 51.77 58.44 15.31 3.60 -76.49 719496.26 1510717.76 109.97
from LAIA 16.25 2.37 -85.42 2529854.26 8602821.22 240.05 58.96 48.11 15.58 1.95 -87.48 1491678.35 4139200.41 177.49
from Mercosur 15.79 3.50 -77.83 813534.67 3660908.63 350.00 64.36 58.79 15.35 2.53 -83.52 523604.21 2152265.39 311.05
Uruguay
from World 12.65 9.54 -24.58 2864291.00 5169735.14 80.49 45.83 52.48 11.58 8.59 -25.82 1312698.00 2713014.21 106.67
from NAFTA 12.16 9.04 -25.66 343724.00 433833.85 26.22 41.45 54.18 11.33 8.43 -25.60 142477.00 235052.20 64.98
from European Union 11.77 11.87 0.85 612070.00 539036.31 -11.93 44.76 54.78 11.27 11.31 0.35 273979.00 295263.82 7.77
from LAIA 12.52 0.43 -96.57 1468270.00 3201103.41 118.02 53.74 51.26 11.58 0.26 -97.75 789084.00 1640771.35 107.93
from Mercosur 12.04 0.06 -99.50 1319728.00 2426536.17 83.87 54.36 64.71 11.41 0.07 -99.39 717383.00 1570253.60 118.89
Venezuela
from World 12.80 11.93 -6.80 10790864.62 30887628.17 186.24 59.02 38.98 11.47 9.88 -13.86 6368673.75 12040522.46 89.06
from NAFTA 13.21 13.31 0.76 5403361.53 10405144.44 92.57 60.73 43.00 11.80 11.05 -6.36 3281197.15 4474033.02 36.35
from European Union 13.42 13.56 1.04 1955884.37 3803555.88 94.47 60.97 47.97 12.19 11.20 -8.12 1192437.40 1824445.91 53.00
from LAIA 7.01 4.57 -34.81 2290584.43 10865637.42 374.36 68.43 36.12 6.71 3.99 -40.54 1567411.83 3924769.93 150.40
from Mercosur 13.19 6.93 -47.46 803540.57 4106391.48 411.04 78.04 38.23 12.05 5.57 -53.78 627099.31 1569826.21 150.33
Consumption goods Other goods
Tariffs Imports Tariffs Imports
1994 2008 % change 1994 2008 % change 1994 2008 % change 1994 2008 % change
Argentina
from World 16.90 12.55 -25.74 3838638.89 7010144.52 82.62 8.10 7.27 -10.25 5144536.99 8887787.84 72.76
from NAFTA 17.91 14.14 -21.05 570688.33 764691.17 33.99 8.00 6.20 -22.50 1619987.37 1463741.51 -9.64
from European Union 18.22 15.95 -12.46 1214516.80 1105671.39 -8.96 8.18 7.89 -3.55 1936802.64 1687924.60 -12.85
from LAIA 9.71 2.12 -78.17 1132843.71 3927278.68 246.67 3.91 1.03 -73.66 701493.79 3593310.04 412.24
from Mercosur 14.99 0.00 -100.00 1094847.15 3355555.96 206.49 14.33 0.00 -100.00 779678.32 3067242.30 293.40
Bolivia
from World 9.88 7.16 -27.53 283542.92 730258.35 157.55 10.00 4.16 -58.40 305007.11 735861.44 141.26
from NAFTA 9.88 7.74 -21.66 33904.53 73360.26 116.37 10.00 4.14 -58.60 70349.77 141118.15 100.60
from European Union 9.79 9.71 -0.82 26016.29 37886.83 45.63 10.00 5.02 -49.80 45120.36 101626.98 125.24
from LAIA 9.86 1.73 -82.45 109398.25 361805.21 230.72 9.99 0.79 -92.09 71156.21 211035.33 196.58
from Mercosur 9.85 0.67 -93.20 42074.33 191032.55 354.04 9.98 0.22 -97.80 60070.50 167682.43 179.14
Brazil
from World 17.20 20.21 17.50 5905589.01 16769716.27 183.96 18.93 12.56 -33.65 10135915.50 48025024.61 373.81
from NAFTA 16.99 19.60 15.36 1184447.99 2791125.02 135.65 18.93 12.62 -33.33 2651156.40 6791253.32 156.16
from European Union 16.75 21.51 28.42 1633917.41 3907007.82 139.12 18.75 13.43 -28.37 3177337.73 7680051.16 141.71
from LAIA 16.29 2.73 -83.24 1968198.14 5753054.41 192.30 19.65 2.70 -86.26 1177067.71 7258336.60 516.65
from Mercosur 16.84 0.00 -100.00 1700420.96 4139146.39 143.42 19.62 0.04 -99.80 806105.98 2836421.38 251.87
Chile
from World 10.98 1.75 -84.06 2115687.48 7307079.12 245.38 11.00 1.16 -89.45 3734342.81 12371436.25 231.29
from NAFTA 10.99 0.12 -98.91 397882.57 696967.67 75.17 10.99 0.02 -99.82 1040908.83 1595946.25 53.32
from European Union 10.99 0.20 -98.18 407444.06 867858.85 113.00 11.00 0.06 -99.45 823568.26 1832413.78 122.50
from LAIA 10.98 0.15 -98.63 489681.82 2267932.53 363.14 11.00 0.01 -99.91 817951.09 4417279.58 440.04
from Mercosur 10.98 0.12 -98.91 308952.05 1781224.91 476.54 11.00 0.01 -99.91 526670.81 2705537.82 413.71
Colombia
from World 17.36 15.13 -12.85 1716608.48 5348050.75 211.55 10.30 8.33 -19.13 3074675.33 6729897.96 118.88
from NAFTA 17.31 13.43 -22.41 483865.49 1017088.97 110.20 10.11 7.05 -30.27 1281424.10 2069801.82 61.52
from European Union 17.29 17.77 2.78 251171.14 718513.52 186.07 10.21 9.45 -7.44 836940.58 1037496.61 23.96
from LAIA 17.45 3.39 -80.57 618454.82 1609143.48 160.19 10.94 2.03 -81.44 417807.65 1022809.90 144.80
from Mercosur 16.43 8.73 -46.87 35921.23 436852.63 1116.14 10.48 4.08 -61.07 82582.00 441844.79 435.04
Ecuador
from World 18.04 18.36 1.77 908174.83 3297459.91 263.09 9.00 5.11 -43.22 972409.62 2454434.42 152.41
from NAFTA 18.20 21.22 16.59 191354.19 403666.94 110.95 9.06 5.73 -36.75 324843.00 600444.72 84.84
from European Union 16.97 20.41 20.27 107694.28 291064.44 170.27 8.58 5.61 -34.62 172034.07 342315.35 98.98
from LAIA 17.92 7.01 -60.88 318938.27 1510984.70 373.75 8.86 2.04 -76.98 190014.15 460965.66 142.60
from Mercosur 16.46 14.37 -12.70 52622.22 216074.71 310.61 8.34 2.54 -69.54 66634.96 203486.36 205.37
Mexico
from World 16.36 13.42 -17.97 10209825.94 38152040.03 273.68 10.78 4.14 -61.60 11396050.99 53645741.07 370.74
from NAFTA 9.05 0.09 -99.01 8001943.94 19155161.35 139.38 4.06 0.00 -100.00 7646578.99 23909945.75 212.69
from European Union 17.49 3.18 -81.82 801894.00 5902664.25 636.09 11.33 0.22 -98.06 1697121.00 8132756.44 379.21
from LAIA 13.92 14.98 7.61 167258.00 2481970.84 1383.92 10.66 6.73 -36.87 83572.00 1728242.25 1967.97
from Mercosur 16.61 18.45 11.08 59984.00 1545313.42 2476.21 12.38 6.79 -45.15 75795.00 1493927.83 1871.01
Paraguay
from World 12.69 12.84 1.18 965630.86 1150216.68 19.12 6.87 4.40 -35.95 544796.25 1251114.90 129.65
from NAFTA 13.10 16.64 27.02 148810.92 56586.20 -61.97 6.92 5.17 -25.29 81660.33 121724.42 49.06
from European Union 11.80 15.91 34.83 132431.48 93484.92 -29.41 6.59 5.25 -20.33 83827.90 75655.05 -9.75

from LAIA 12.89 4.08 -68.35 311462.42 558794.26 79.41 6.64 1.37 -79.37 167512.73 292841.51 74.82
from Mercosur 12.81 0.18 -98.59 242231.79 508597.15 109.96 6.50 0.33 -94.92 155180.75 272769.46 75.78
Peru
from World 18.30 8.66 -52.68 1615369.70 3118913.24 93.08 15.13 0.34 -97.75 2014464.36 5714754.73 183.69
from NAFTA 18.39 10.91 -40.67 378072.25 525676.85 39.04 15.12 0.48 -96.83 618375.58 1227572.12 98.52
from European Union 17.47 10.52 -39.78 202360.53 289398.51 43.01 15.11 0.35 -97.68 449152.18 774856.42 72.52
from LAIA 18.42 4.75 -74.21 450771.55 1301380.26 188.70 15.13 0.17 -98.88 534206.49 2651779.27 396.40
from Mercosur 17.85 8.28 -53.61 95109.08 394171.90 314.44 15.11 0.22 -98.54 141232.23 863544.39 511.44
Uruguay
from World 17.61 13.74 -21.98 854122.00 1001560.96 17.26 6.88 5.72 -16.86 778234.00 1395381.60 79.30
from NAFTA 17.35 13.72 -20.92 79039.00 57696.85 -27.00 6.16 4.70 -23.70 122525.00 139522.42 13.87
from European Union 17.37 17.48 0.63 183560.00 105073.45 -42.76 6.06 6.90 13.86 215057.00 152926.51 -28.89
from LAIA 17.12 0.91 -94.68 423575.00 622962.63 47.07 6.31 0.12 -98.10 278325.00 916021.03 229.12
from Mercosur 17.18 0.05 -99.71 373069.00 570723.43 52.98 5.61 0.04 -99.29 249358.00 263332.53 5.60
Venezuela
from World 16.55 17.52 5.86 2365498.59 9555044.31 303.93 11.65 9.08 -22.06 2370679.36 9711186.32 309.64
from NAFTA 17.74 20.60 16.12 850899.54 1964109.67 130.83 11.60 10.18 -12.24 1344601.85 3728636.55 177.30
from European Union 18.32 21.40 16.81 344767.95 865764.74 151.12 12.26 10.45 -14.76 417910.61 1063973.96 154.59
from LAIA 7.58 6.08 -19.79 572481.22 4558326.85 696.24 7.20 3.46 -51.94 182593.51 2494526.18 1266.16
from Mercosur 17.91 11.29 -36.96 102604.15 1163258.68 1033.73 12.43 4.02 -67.66 98034.56 1413413.92 1341.75
Notes: The table includes effectively applied tariffs (simple averages) and imports of total, intermediate, consumer and other goods (value in 1,000s of US dollars) from the
world, NAFTA, EU, LAIA and Mercosur to reporting countries (LAIA members) in 1994 and 2008. % change is greater than 0 if there is an increase and lower than 0 if
there is a decrease. Due to data availability, the last year considered for trade data in Argentina, Bolivia, Chile, Colombia, Paraguay, Uruguay and Venezuela was 2007. The
starting year considered for Mexico, Peru, Uruguay and Venezuela is 1995, whereas it was 1993 in the case of tariffs and imports from Mercosur to Argentina. UNCTAD and
the World Bank have computed ad valorem equivalents (AVEs) of non ad valorem tariffs, which are included when average tariff rates are computed.
Source: WITS (2011) for tariff rates and trade data, following Baldwin and Taglioni (2011) for product groups.
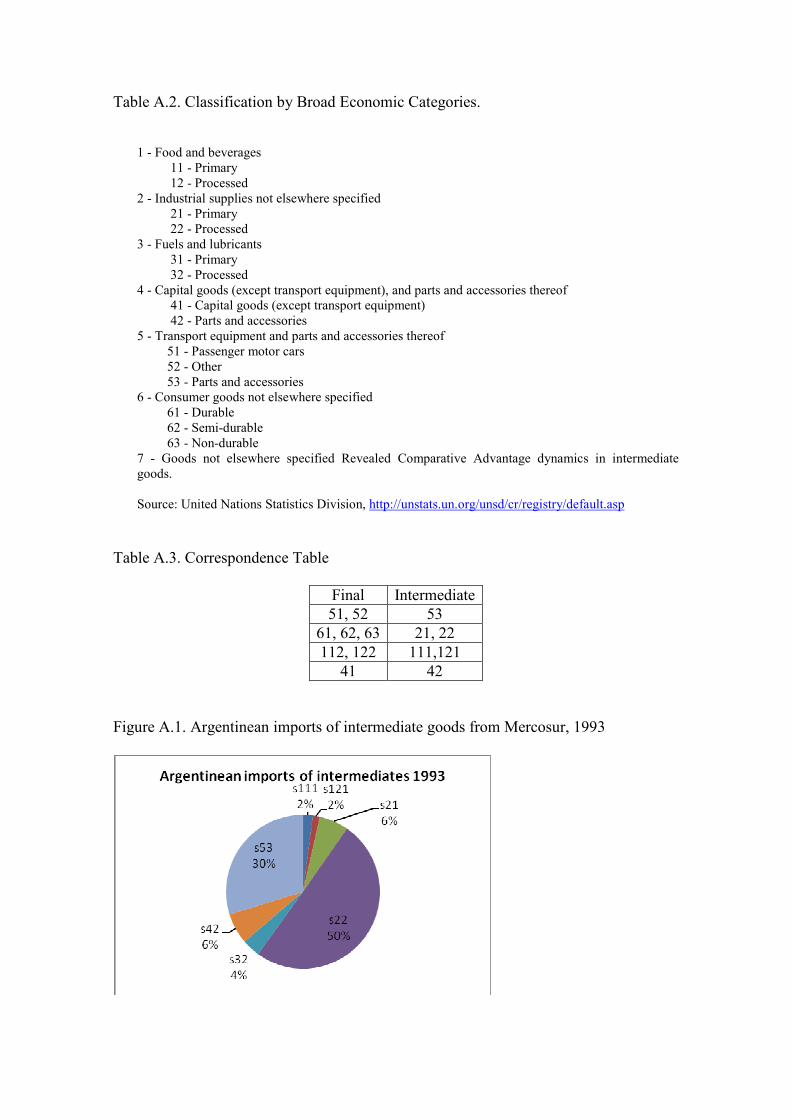
Table A.2. Classification by Broad Economic Categories.
1 - Food and beverages
11 - Primary
12 - Processed
2 - Industrial supplies not elsewhere specified
21 - Primary
22 - Processed
3 - Fuels and lubricants
31 - Primary
32 - Processed
4 - Capital goods (except transport equipment), and parts and accessories thereof
41 - Capital goods (except transport equipment)
42 - Parts and accessories
5 - Transport equipment and parts and accessories thereof
51 - Passenger motor cars
52 - Other
53 - Parts and accessories
6 - Consumer goods not elsewhere specified
61 - Durable
62 - Semi-durable
63 - Non-durable
7 - Goods not elsewhere specified Revealed Comparative Advantage dynamics in intermediate
goods.
Source: United Nations Statistics Division, http://unstats.un.org/unsd/cr/registry/default.asp
Table A.3. Correspondence Table
Final Intermediate
51, 52 53
61, 62, 63 21, 22
112, 122 111,121
41 42
Figure A.1. Argentinean imports of intermediate goods from Mercosur, 1993

Figure A.2. Argentinean imports of intermediate goods from Mercosur, 2007
Figure A.3. Brazilian imports of intermediate goods from Mercosur, 1994
Figure A.4. Brazilian imports of intermediate goods from Mercosur, 2008
Figure A.5. Argentinean exports of intermediate goods to Mercosur, 1993

Figure A.6. Argentinean exports of intermediate goods to Mercosur, 2007
Figure A.7. Brazilian exports of intermediate goods to Mercosur, 1993
Figure A.8. Brazilian exports of intermediate goods to Mercosur, 2007
