tracking tectonic plates: testing plate tectonics with two independent methods laurel goodell dept...
TRANSCRIPT

Tracking Tectonic Plates:Testing Plate Tectonics with Two Independent Methods
Laurel Goodell Dept of Geosciences
Princeton University

The theory of plate tectonics is supported by many lines of evidence…
• Patterns of earthquake epicenters, depths, magnitudes, focal mechanisms.• Topography of the ocean floor• Age progression along certain volcanic island chains and symmetric aging of
ocean rock with distance on either side of mid-ocean ridges..• Lack of ocean sediment at mid-ocean ridges and progressively increasing
sediment thickness on either side of ridges• Symmetric pattern of magnetism on either side of mid-ocean ridges.• Locations and types of volcanism. • Relative youth of ocean lithosphere compared to continental lithosphere.• Composition of the oceanic lithosphere vs. composition of the continental
lithosphere.• Jigsaw puzzle-like fit of some continental shapes, fossils, rock types and rock
ages across oceans• Fossils of warm-climate organisms in areas now cold; fossils of cold-climate
organisms in areas now warm.
…and we might be hard-pressed to think of alternate explanations that could explain the same lines of evidence,

But isn’t it all circumstantial ?
or can we…. ??We can’t see the plates moving…

Tracking Tectonic Plates:Testing Plate Tectonics with Two Independent Methods
Method 1:
Long-term average motions based on geologic data

Example of geologic data used to infer long-term rates and directions of plate motion

Data like these are used to develop various “Plate Motion Calculators,” e.g.
• http://ofgs.ori.u-tokyo.ac.jp/~okino/platecalc_new.html
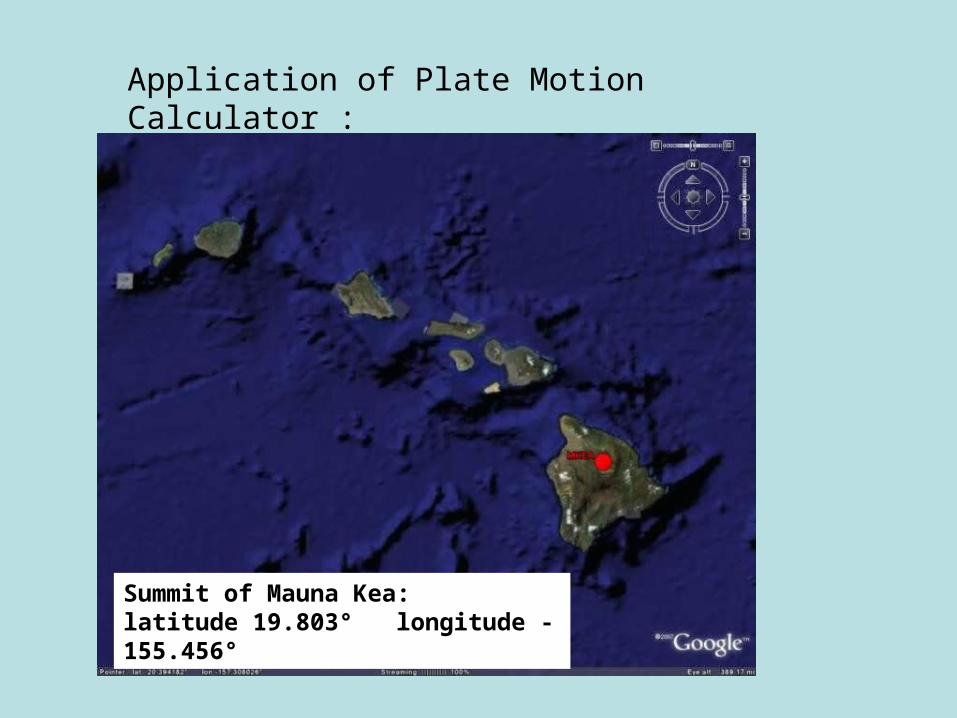
Summit of Mauna Kea: latitude 19.803° longitude -155.456°
Application of Plate Motion Calculator :

Plate Motion Calculator (http://ofgs.ori.u-tokyo.ac.jp/~okino/platecalc_new.html)
Execute calculation
This "Plate Motion Calculator" calculates the relative and absolute plate motion direction and speed at any point on the earth. The prototype of web-based plate motion calculator was developed by K. Tamaki. This calculator is a revised version by K. Okino using perl-CGI script. Method of Calculation: Select plate motion model, plate (or plates) and input latitude and longitude of the point, then press the "Execute calculation" button.
Plate Model:
Moving Plate:
Fixed Plate:
Latitude[deg]:
Longitude[deg]:
(see references below)
(not used in NNR models)
(North: positive, South : negative)
East: positive, West: negative)
Pacific
19.803
HS3-NUVEL-1A
-155.456
n/a

Calculation results
plate velocity : 10.3 [cm/yr] direction: 299.8 [deg. from North]
Plate Model: HS3-NUVEL-1A Moving Plate: pa rotation rate: 1.0613 [deg/my] Latitude of Euler pole: -61.467 [deg.] Longitude of Euler pole: 90.326 [deg.] Angular velocity: 1.0613 [deg./m.y.] Latitude inputted: 19.803 [deg.] Longitude inputted: -155.456 [deg.]
Results from Plate Motion Calculator:

103 mm/yr
Summit of Mauna Kea: latitude 19.803° longitude -155.456°
Method 1: Long-term average plate motion vector

Tracking Tectonic Plates:Testing Plate Tectonics with Two Independent Methods
Method 1:
Long-term average motions based on geologic data
Method 2:
Near real-time motions from GPS data

Global Positioning System

Consumer GPS UnitsAccuracy of• +/- 10 m (30 ft) error
(horizontal)• +/- 15 m (45 ft) error
(vertical)
Location to The level of about 10m
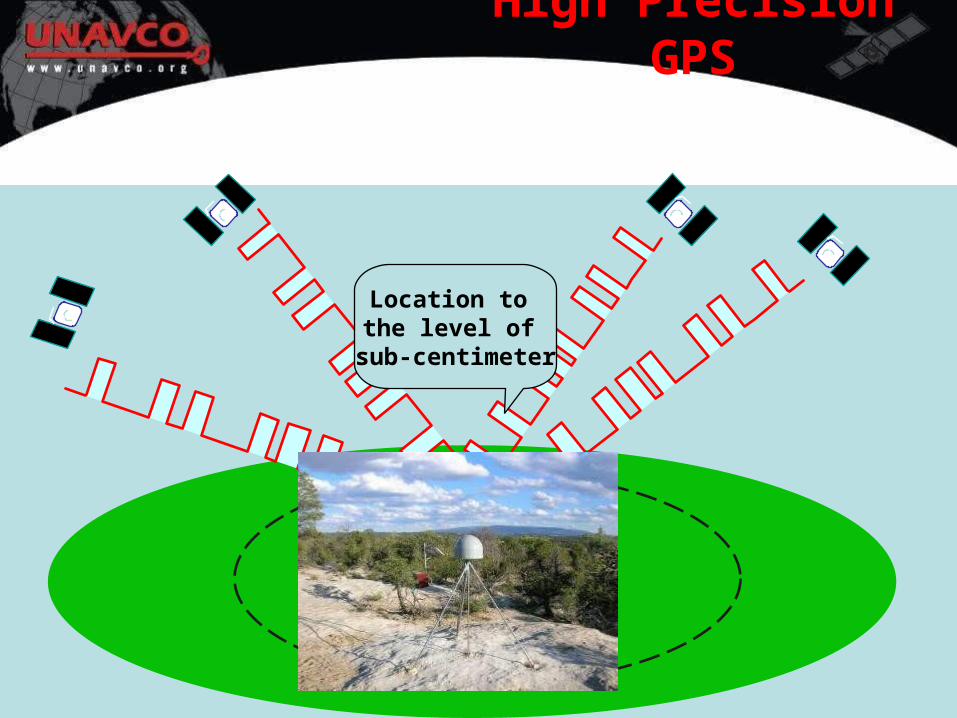
High Precision GPS
Location to the level of
sub-centimeter

ACU1 ADKS ADRI AGMT AIS1 AJAC ALBH ALGO ALIC ALPP ALRT AMC2
AML5 AMMN ANA1 ANKR ANP1 ANTC ANTO AOA1 AOML AREQ ARL5 ARM1
ARM2 ARP3 ARTU ASC1 ASHV ASPA ATL1 AUCK AUS5 AVRY AZCN AZRY
AZU1 BAHR BAIE BAKE BAKO BAN2 BAR1 BARB BARH BARN BAY1 BAY2
BAYR BBDM BBRY BCWR BEA5 BEMT BEPK BGIS BIL1 BILI BILL BIS1
Access to GPS data: http://sideshow.jpl.nasa.gov/mbh/series.html
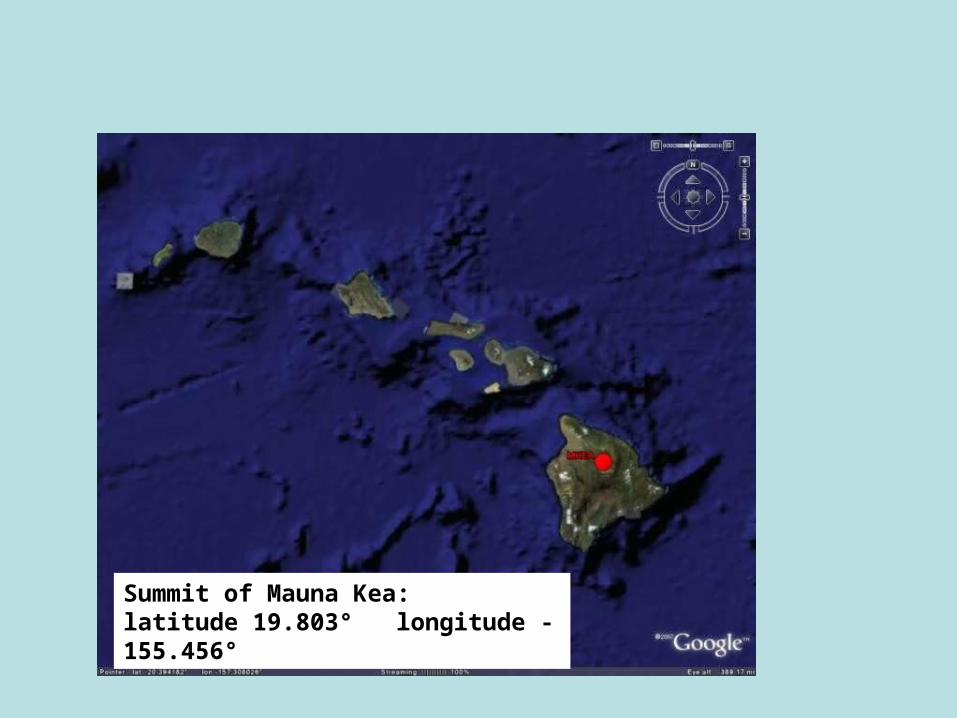
Summit of Mauna Kea: latitude 19.803° longitude -155.456°

Increase in latitude (positive slope) means the N-S component is to the north. Decrease in latitude (negative slope) would mean the N-S component is to the sorth.
Motion data is given in three components:
Increase in longitude (positive slope) means the E-W component is to the east. Decrease in latitude (negative slope) would mean the E-W component is to the west.
Increase in height (positive slope) means the up-down component is up. Decrease in height (negative slope) would mean the up-down component is to the down.
north
Down (relatively slow)
west

35.16 mm / yr
63.74 mm / yrW
N
72.79 mm / yr 61°
72.79 mm/yr at an azimuth of 299°

Summit of Mauna Kea: latitude 19.803° longitude -155.456°
GPS
Method 2: near real-time plate motion vector
So, now we have plate motions for two different methods – but reference frames of the two methods are not the same. So…
Investigate relative motions across plate boundaries, inferred by the two methods.
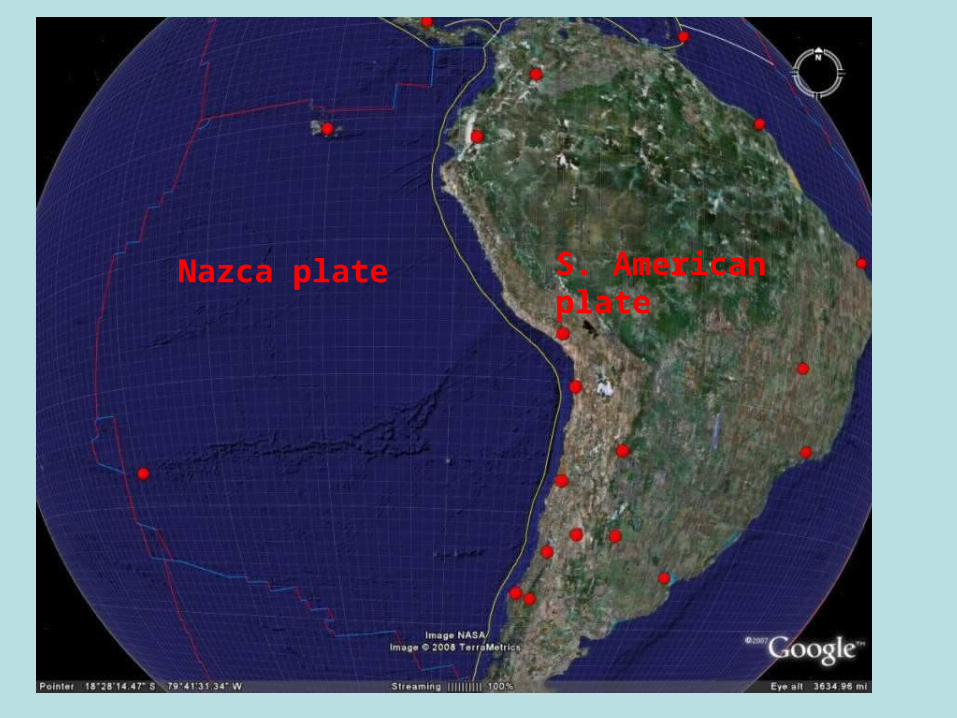
Nazca plate S. American plate

ModelLong Term
GPS
CHANGE(GPS-model)GPS Components GPS Resultant
latitude longitude rate azimuth lat vel long vel velocity azimuth Δ vel Δ az
EISLNazc
a Easter Isl -27.15 -109.38 33 106 -6.04 67.97 68.2 95 35.2 -11
ISPANazc
a Easter Isl -27.12 -109.34 33 106 -5.19 67.54 67.7 94 34.7 -12
GALA
Nazca
Galapagos Isl -0.74 -90.30 21 89 11.87 51.8 53.1 77 32.1 -12
GLPSNazc
aGalapagos
Isl -0.74 -90.30 21 89 9.46 49.97 50.9 79 29.9 -10
ANTC S Am Andes -37.34 -71.53 46 260 10.17 15.36 18.4 56 -27.6 -204
AREQ S Am Andes -16.47 -71.49 48 261 2.58 -6.47 7.0 292 -41.0 31
BOGT S Am Andes 4.64 -74.08 45 261 14.81 0.7 14.8 3 -30.2 -258
CFAG S Am Andes -31.60 -68.23 47 260 11.39 5.84 12.8 27 -34.2 -233
CONZ S Am Andes -36.84 -73.03 46 261 20.26 33.17 38.9 59 -7.1 -202
COPO S Am Andes -27.38 -70.34 48 261 17.86 14.8 23.2 40 -24.8 -221
IQQE S Am Andes -20.27 -70.13 48 261 15.93 26.88 31.2 59 -16.8 -202
RIOP S Am Andes -1.65 -78.65 46 263 -0.65 -3.88 3.9 260 -42.1 -3
SANT S Am Andes -33.15 -70.67 47 260 16.85 20.57 26.6 51 -20.4 -209
UNSA S Am Andes -24.73 -65.41 48 259 11.25 4.86 12.3 23 -35.7 -236
BRAZ S Am S Am -15.95 -47.88 48 255 12.86 -3.7 13.4 344 -34.6 89
CHPI S Am S Am -22.69 -44.99 48 254 12.08 -3.83 12.7 342 -35.3 88
CORD S Am S Am -31.53 -64.47 47 259 12 0.48 12.0 2 -35.0 -257
FORT S Am S Am -3.88 -38.43 48 253 12.94 -4.59 13.7 340 -34.3 87
KOU1 S Am S Am 5.25 -52.81 46 255 11.84 -4.52 12.7 339 -33.3 84
KOUR S Am S Am 5.25 -52.81 46 255 13.21 -4.27 13.9 342 -32.1 87
LPGS S Am S Am -34.91 -57.93 46 256 11.93 -1.31 12.0 354 -34.0 98

Model:Converging at a rate of 68 to 80 mm/yr
33
21
47
47
47
47

GPS:Converging at a rates of ~30-50 mm/yr
Picks up intra-plate deformation (S. American vectors quite varied, although still indicate convergence)
51
68 12
27
4
29
Many other projects possible, e.g.
• Mid-Atlantic ridge
• Crossing Pacific, Phillippine and Eurasion plates
• Pacific/North American plate boundary


Lines of Evidence
• Patterns of earthquake epicenters, depths, magnitudes, focal mechanisms.
• Topography of the ocean floor• Age progression along certain volcanic island chains and symmetric
aging of ocean rock with distance on either side of mid-ocean ridges..• Lack of ocean sediment at mid-ocean ridges and progressively
increasing sediment thickness on either side of ridges• Symmetric pattern of magnetism on either side of mid-ocean ridges.• Locations and types of volcanism. • Relative youth of ocean lithosphere compared to continental
lithosphere.• Composition of the oceanic lithosphere vs. composition of the
continental lithosphere.• Jigsaw puzzle-like fit of some continental shapes, fossils, rock types
and rock ages across oceans• Fossils of warm-climate organisms in areas now cold; fossils of cold-
climate organisms in areas now warm.• GPS (and VLBI) data.

Testing a theory
• Case for plate tectonics is strengthened as both methods generally agree.
• But over the time-span of GPS measurements, plates move at rates different than long-term model averages and thus rates must not be constant.
• GPS rates for stations on the same plate are often similar, but not identical and sometimes quite different - indicating that internal deformation of plates does occur.
• Some plate boundaries are “wider” than others.

Quantitative Skills
• Unit conversion• Vector algebra• Trigonometry• Reading and interpreting graphs• Geographic skills and spatial analysis, visualization• Comparison and evaluation of numerical data• Reference frames

Evolution of an Exerciseacknowledgements:
• W. Jason Morgan, Princeton Univ. Professor Emeritus
Developed a version of this using VLBI data a decade ago.
• Barb Tewksbury described a ““study your own tectonic plate” project at a workshop some years ago.
• Using GPS Data to Study Crustal Deformation, Earthquakes, and Volcanism: A Workshop for College Faculty
- at 2006 GSA Annual Meeting
- similar workshop offered this year at 2008 meeting in Houston
• UNAVCO, Google Earth, EXCEL, etc.