track structure model for radial distributions of electron
TRANSCRIPT

NASA/TP-1998-208707
Track Structure Model for Radial
Distributions of Electron Spectra and
Event Spectra From High-Energy Ions
F. A. Cucinotta
Langley Research Center, Hampton, Virginia
R. Katz
University of Nebraska, Lincoln, Nebraska
J. W. Wilson
Langley Research Center, Hampton, Virginia
National Aeronautics and
Space Administration
Langley Research CenterHampton, Virginia 23681-2199
September 1998

Available from the following:
NASA Center for AeroSpace Information (CASI)7121 Standard Drive
Hanover, MD 21076-1320
(301) 621-0390
National Technical Information Service (NTIS)
5285 Port Royal Road
Springfield, VA 22161-2171(703) 487-4650

Abstract
An analytic method is described for evaluating the average radial electron
spectrum and the radial and total frequency-event spectrum for high-energy ions.
For high-energy ions, indirect events make important contributions to frequency-
event spectra. The method used for evaluating indirect events is to fold the radial
electron spectrum with measured frequency-event spectrum for photons or elec-trons. The contribution from direct events is treated using a spatially restricted
linear energy transfer (LET). We find that high-energy heavy ions have a signifi-
cantly reduced frequency-averaged lineal energy (YF) compared to LET, while
relativistic protons have a significantly increased YF and dose-averaged lineal
energy (YD) for typical site sizes used in tissue equivalent proportional counters.
Such differences represent important factors in evaluating event spectra with lab-
oratory beams, in spaceflight, or in atmospheric radiation studies and in valida-
tion of radiation transport codes. The inadequacy of LET as descriptor because ofdeviations in values of physical quantities, such as track width, secondary elec-
tron spectrum, and yo for ions of identical LET is also discussed.
Introduction
This paper presents an analytic model for describ-
ing the radial distribution of electrons and frequency-
event spectra measured by proportional counters used
in the dosimetry of radiation fields in space and the
upper atmosphere (refs. 1 and 2). At high energies thetrack width of an ion will extend to 100's of microns
or more because of delta-ray diffusion. Monte-Carlo
models have difficulty with these calculations because
of large computational times and poor statistics in con-
sidering events at distances greater than 1 ktm from the
track of an ion (ref. 3). Furthermore, in most applica-
tions with high-energy nuclei including space or atmo-
spheric radiation studies, nuclear fragmentation and
energy loss processes will lead to a broad spectrum of
ion types and velocities. These considerations point to
the usefulness of analytic approaches to treat trackstructure for high-energy particles. An analytic model
is developed to evaluate frequency-event spectra thatinclude the indirect events important for high-energy
ions. Furthermore, the radial dependence of the spec-
trum is described. The model is being used to compare
the results of radiation transport codes directly to
recent spaceflight measurements as described else-
where. These comparisons will provide important val-
idation of radiation transport codes and environmentalmodels.
Track structure models describe the relationship
between the spatial distribution of energy deposition
in the form of positions of ionization and excitation,
the geometric structure of target molecules, and the
response of a physical or biological system. The firsttrack model formulated was the average-track model,
or amorphous-track model, which considered the
radial dose about the path of the ion as the descriptive
parameter for ion effects. This model has been usedfor over 30 years in describing the response of physi-
cal and biological systems (refs. 4-6). The average-
track model has the advantage of simplicity; however,
the model considers only simplified target geometry
and ignores fluctuations in energy deposition. Monte-Carlo track simulations consider local fluctuations in
energy deposition and provide methods for dealing
with complicated target geometry including applica-tions to treat details of DNA molecular structure and
DNA folding (refs. 7 and 8). However, the average-track model remains the most successful parametric
approach for describing the response of biological sys-
tems and physical detectors to ions.
The importance of track width has been discussed
for many years in relationship to radiation quality and
the resulting inadequate capability of linear energy
transfer (LET) or the ratio of the square of the effec-tive charge to ion velocity (Z'2/132) as indicators of
biological effectiveness (ref. 9). The parameter Z'2/[32
was noted by Katz to be useful only when comparing
ions of similar velocity (ref. 9). Experimental observa-
tion of the importance of track width has been demon-
strated for endpoints such as inactivation of yeast, bac-terial and V79 mammalian cells, and mutation of the
HPRT gene in V79 cells (refs. 10-12). Recently,

calculationswith the average-trackmodel (ref. 6)showedthat,for cellularmutation,thespatialdistribu-tionof sitesfor cellularinactivationandgenemutationnecessitatestheuseof atrackstructuredescriptionforradiationqualitythatindicatestheinadequacyof theparametersLET or Z*2/_ 2. Our calculation of the
radial distribution further illustrates inadequacies in
these parameters when biological effectiveness is
dependent on electron energy.
Algorithms for converting particle energy spectrato lineal energy spectra are needed to correlate radia-
tion transport code predictions to lineal energy spectrameasured by proportional counters. Microdosimetric
approaches to energy deposition have relied mostly on
Monte-Carlo simulations (refs. 13 and 14), which are
computationally inadequate for describing diverseradiation fields such as that seen in space or in the
upper atmosphere. Several factors are known to be
important in evaluating lineal energy spectra. For
high-energy ions, a significant fraction of events occur
from secondary electrons produced by ions that do notdirectly enter the volume of the detector. Other factors
include the treatment of secondary electrons trans-
ported outside the volume by ions that do pass throughthe volume, nuclear reaction effects, and the effects of
straggling of the ions in the volume. For each of these
factors the role of wall composition and thickness
must be studied. Also, for low-energy ions there is a
significant change in the rate of energy loss inside the
volume, including the effects of stopping ions(ref. 15).
This report presents an approach for treating the
indirect events from delta rays and introduces a spa-
tially restricted energy deposition model for directevents. The other factors noted will be discussedelsewhere.
Model for Radial Electron Spectrum
The approach of the average-track model has beento consider the primary electron spectrum from ion
interactions with target atoms and fold this spectrumwith average transmission properties of electrons to
obtain the spatial distribution of electron dose as a
function of radial distance from the path of the ion. As
introduced by Kobetich and Katz (ref. 4) the radial
dose is given by
-1 _ [E(t, ta)rl(t, ¢0)]
fdni d[21X rl(t, ta)_-_ (1)
In equation (1) E is the residual energy of an electron
ta after travelling distance t, and rl(t, ta ) is the transmis-
sion probability that an electron with starting energy co
penetrates a depth t. We have included an angular dis-
tribution for the primary electrons with energy ta andsolid angle f_. The subscript 8 indicates that it is the
dose contribution from ionization by secondary elec-
trons at a radial distance t from the path of the ion. Theinput functions for the evaluation of equation (1) are
described by Cucinotta et al. (ref. 16). Note that the
cross sections for electron production from protons are
scaled to heavy ions using effective charge.
The LET can be described by integrating theradial dose distribution over all radial distances and
including other contributions such as excitations,
nuclear stopping, and high-energy corrections (ref. 17)
MLET = 2re t dt[Ds(t ) + Dexc(t)]
+ Nuclear stopping
+ High-energy corrections (2)
where tM is the maximum distance of electron penetra-
tion. Brandt and Ritchie (ref. 18) have considered a
formulation of the excitation term, Dexc(t), as
Dexc(t) = Cex c exp(-t/2d)/t 2 (3)
with d = 13/2 tar with ta r = 13 eV for water. The radially
restricted LET can be introduced by limiting the upper
limit in equation (2) as defined by
L r = 2r: _ t dt[Ds(t) + Dexc(t)] (4)
Equation (4) ignores the nuclear stopping and
high-energy corrections to the LET. In many applica-
tions the number of electrons, as well as their energy
spectrum, is required for describing the response of a
system. The average or residual energy spectrum ofelectrons penetrating to a radial distance t is derived
from equation (1) as
2

O#(t, E) = 1 _ S(to)27t---t_ df_ S( E)
x{rl(t'E)+ [S_E)] _q(t'E) _(dni d_)_tJ_,dto
(5)
where the primary electron energy to is now a function
of the residual energy. Equation (5) shows that the
attenuation of the electron spectrum is through twofactors: first an overall factor of lit for all secondary
electrons, and second an additional attenuation for
low-energy electrons dependent on their starting
energy and depth of penetration.
Figures 1 and 2 show calculations of the radial
dose for ions of linear energy transfer (LET) of 30 and
150 keV/gm. These results show the large differences
in radial energy deposited due to differences in track
width, which is dependent on ion velocity. Such dif-
ferences are expected to be important for specific
target molecule sizes and the spatial distribution of
these molecules. Also shown in figure 1 are results
based on an assumption that the electrons are ejected
normal to the ion path leading to an underestimate of
the dose at small distances. Figures 3 and 4 show the
secondary electron spectrum for these same ions. We
have plotted the spectrum from equation (5) versus
energy for several impact parameters and also we plot
2rotE t_(E, t) versus energy on a linear-log scale toshow the fractional contribution from each decade of
electron energy. Lower charge ions are seen to haveboth a confined track width and electrons of lower
energy (i.e., electrons of higher LET). Experiments
with soft X rays indicate increased biological effec-
tiveness for electrons with energies less than several
keV (ref. 19).
the maximal radial distances where the highest energy
ejected electrons are stopped (electron track ends).
Figures 3 and 4 show that for ions with atomic num-
bers less than iron (Z < 26), overlapping electrontracks in small volumes such as the nucleosome would
occur only at very close distances to the path of the ion
(<10 nm).
Direct Events
For fast charged ions undergoing small velocity
changes in the site, the energy deposited for path
length x is given in terms of the linear energy transfer
as
e = Lx (6)
For high-energy ions a significant fraction of theLET escapes the volume of a site by electron transportand therefore does not contribute to the events inside
the site. The energy deposited, as restricted by the spa-tial distribution of secondary electrons, is given by
p PE = dx Lr(X ) (7)
For a given path length the radial distance fromthe ion to the center of the volume is
2 d 2 2--X
tx - 4 (8)
where d is the diameter of the site. For a spherical site
the relation given by equation (8) limits the radialextension of the track for direct events such that the
maximum radial extension of the track at a polar angle
tp is given by
tM(X" , tp) = r x, + tx - 2r x, tx cos tp (9)
For ions of a given value of LET, low charge and
energy ions (LZE) may have increased effectiveness
because the predominance of low-energy electrons in
comparison to high charge and energy ions (HZE).
However, for large target volumes, including a
response dependent on alterations in spatially distrib-
uted target molecules, the present energy deposition
model would predict that the effects of track widthwould increase the effectiveness of HZE ions in com-
parison to LZE ions. The secondary electron spectrumvaries more slowly as a function of radial distance for
the LZE ions and contains a larger fraction of low-
energy electrons both at small radial distances and at
where
r x, = x" for x' < d12 (10a)
r x, = d - x" for x' > d/2 (10b)
The energy deposited for a given path length as
restricted by electron diffusion is then given by
e ;dx'_dtpf M(x''(p)= t dt D(t) (11)
For a distribution of path lengths j(x), the distribu-
tion of event sizes is given by
3

f(e) de = Nf(x) dx
Such that
where from equation (11)
de f dtp ;M (x'_)-d-x = t dt D(t)
(12)
(13)
(14)
been made with TEPC's (refs. 20-22). For smaller sitesizes, Monte-Carlo calculations have been made for
electrons with energies from 0.1 to 100 keV (refs. 6
and 7). Our approach is to consider the average elec-tron spectrum of electrons at radial distance t from the
path of the ion and fold this distribution with represen-tations of measurements for photons or electrons. In
this way, local fluctuations in energy deposition fromdelta rays are taken into account.
The lineal energy is given by y = e / :ca where :cA is theaverage path length in the volume and the distribution
in lineal energy is given by
f(y) = NXAf[Y(X)] (15)
Low velocity ions with insufficient range to transverse
the site at a given path length will deposit all theirenergy in the site and the direct events should be
appropriately corrected (ref. 15). The distributions for
direct events should also be corrected for ion strag-gling and nuclear reaction effects should be described.
Indirect Events
Particles that do not pass directly through the vol-
ume deposit energy through secondary electrons; these
events are denoted as indirect events. Figure 5 showsthe fraction of the LET from iron ions as a function of
their energy that are from indirect events in a homoge-
neous medium for several site sizes. At high energies,a significant fraction of the LET from indirect events
occurs for site sizes in the 0.5-4 _tm range, which isused frequently for radiation field definition. For small
site sizes expected to be important in producing DNA
damage and mutations, the LET is dominated by theso-called indirect events.
The average distribution of secondary electrons asa function of radial distance can be used to evaluate
the contribution from indirect events using a folding
approach. We treat this spectrum as an isotropicsource incident on the sensitive volume. The theoreti-
cal evaluation of microdosimetric spectra from elec-
trons is difficult to treat analytically because of the
small mean free path of electrons for both elastic and
inelastic collisions and the importance of energy and
range straggling for electrons. Extensive measure-
ments of event spectra using photons and in some
cases electrons over a large range of energies have
The event spectrum from indirect events is found
by assuming the radial distribution of electrons is inci-
dent on a spherical site at distance t from the track cen-
ter and folding this spectrum with the event spectrumfor electrons of a given energy
fout(Y, t) = f dE t_(t, E)fe_ (E,y) (16)
where the distributions fe- (E, y) are the events by elec-trons of energy E in a particular volume as inferred
from experiments (refs. 20-22).
The y spectra from measurements with photonsare parameterized as
f(E,y)= NIc exp(_)+ (1-c) exp (__y)2] (17)
with N as a normalization constant and the parameters
chosen as b = 6.5 keV/I.tm, and
(_ Ephoton_ 1/2a = al+a2ex p 6"0 ) (18)
c = 1-c0II-exp(-E_-_n/l(19)
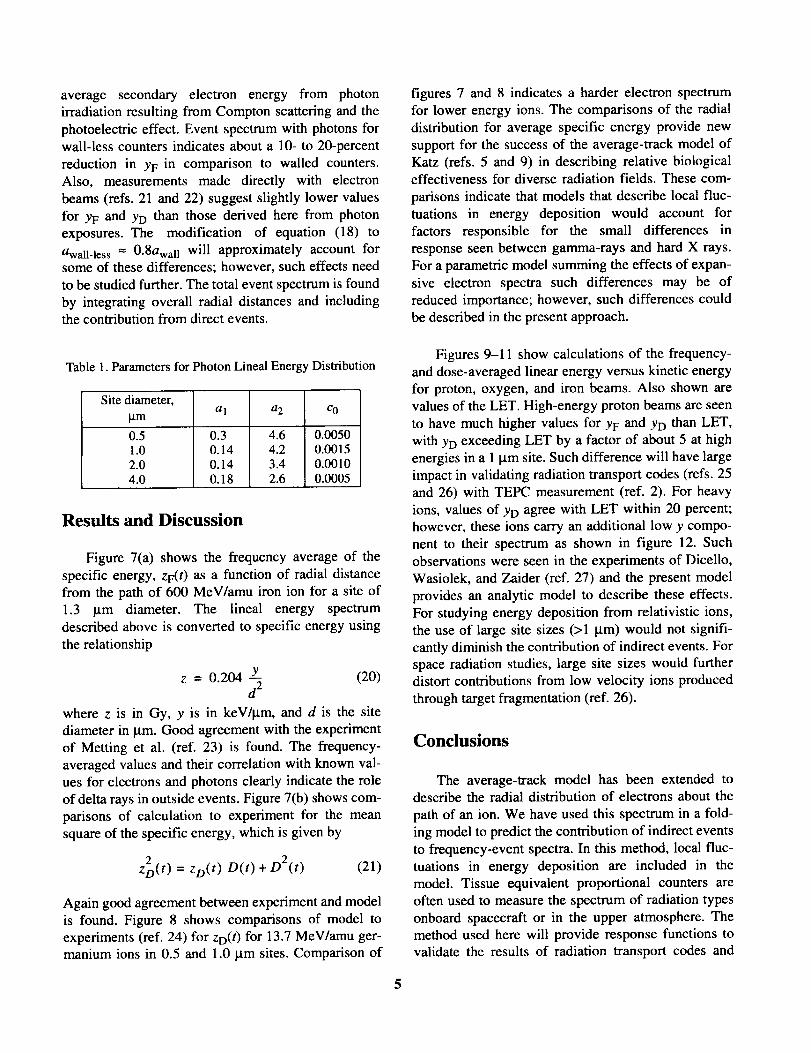
Values for the parameters al, a2, and co are given intable 1 for several spherical sites with diameters from
0.5-4.0 _tm. Equation (17) provides a good approxi-
mation to measured values for YF and YD as a function
of photon energy as shown in figure 6. For an expo-nential spectrum, the relationship yD/YF = 2 is found
and is observed in most experiments below 100 keV.
The photon spectrum of equation (17) is fit to
experiments for photon irradiation in walled counters.
Some differences in the response of walled and wall-
less counters for photons and electrons should beexpected and are not described here. To relate the
photon energy to its secondary electrons we use the
averagesecondaryelectron energyfrom photonirradiationresultingfromComptonscatteringandthephotoelectriceffect.Eventspectrumwithphotonsforwall-lesscountersindicatesabouta 10-to 20-percentreductionin YF in comparison to walled counters.
Also, measurements made directly with electron
beams (refs. 21 and 22) suggest slightly lower values
for YF and YD than those derived here from photonexposures. The modification of equation (18) to
awall_iess = 0.8awall will approximately account forsome of these differences; however, such effects need
to be studied further. The total event spectrum is found
by integrating overall radial distances and includingthe contribution from direct events.
Table 1. Parameters for Photon Lineal Energy Distribution
Site diameter,
p.m
0.5
1.0
2.0
4.0
al
0.30.140.140.18
a2 Co
4.6 0.00504.2 0.00153.4 0.00102.6 0.0005
Results and Discussion
Figure 7(a) shows the frequency average of the
specific energy, zF(t) as a function of radial distancefrom the path of 600 MeV/amu iron ion for a site of
1.3 _tm diameter. The lineal energy spectrum
described above is converted to specific energy using
the relationship
z = 0.204 y (20)d 2
where z is in Gy, y is in keV/lxm, and d is the site
diameter in _tm. Good agreement with the experiment
of Metting et al. (ref. 23) is found. The frequency-
averaged values and their correlation with known val-ues for electrons and photons clearly indicate the role
of delta rays in outside events. Figure 7(b) shows com-
parisons of calculation to experiment for the mean
square of the specific energy, which is given by
z2 (t) = zD(t ) D(t) + D2(t) (21)
Again good agreement between experiment and model
is found. Figure 8 shows comparisons of model to
experiments (ref. 24) for zD(t) for 13.7 MeV/amu ger-manium ions in 0.5 and 1.0 _tm sites. Comparison of
figures 7 and 8 indicates a harder electron spectrum
for lower energy ions. The comparisons of the radial
distribution for average specific energy provide new
support for the success of the average-track model ofKatz (refs. 5 and 9) in describing relative biologicaleffectiveness for diverse radiation fields. These com-
parisons indicate that models that describe local fluc-tuations in energy deposition would account for
factors responsible for the small differences in
response seen between gamma-rays and hard X rays.
For a parametric model summing the effects of expan-sive electron spectra such differences may be of
reduced importance; however, such differences could
be described in the present approach.
Figures 9-11 show calculations of the frequency-
and dose-averaged linear energy versus kinetic energy
for proton, oxygen, and iron beams. Also shown are
values of the LET. High-energy proton beams are seen
to have much higher values for YF and YD than LET,
with YD exceeding LET by a factor of about 5 at highenergies in a I [.tm site. Such difference will have large
impact in validating radiation transport codes (refs. 25
and 26) with TEPC measurement (ref. 2). For heavy
ions, values of YD agree with LET within 20 percent;
however, these ions carry an additional low y compo-
nent to their spectrum as shown in figure 12. Suchobservations were seen in the experiments of Dicello,
Wasiolek, and Zaider (ref. 27) and the present model
provides an analytic model to describe these effects.
For studying energy deposition from relativistic ions,
the use of large site sizes (> 1 I.tm) would not signifi-cantly diminish the contribution of indirect events. For
space radiation studies, large site sizes would further
distort contributions from low velocity ions produced
through target fragmentation (ref. 26).
Conclusions
The average-track model has been extended todescribe the radial distribution of electrons about the
path of an ion. We have used this spectrum in a fold-
ing model to predict the contribution of indirect eventsto frequency-event spectra. In this method, local fluc-
tuations in energy deposition are included in the
model. Tissue equivalent proportional counters are
often used to measure the spectrum of radiation types
onboard spacecraft or in the upper atmosphere. The
method used here will provide response functions tovalidate the results of radiation transport codes and
5
environmental models with such measurements. Large
differences between linear energy and lineal energy
spectra for relativistic ions are expected, based on the
model described, because of indirect events. Most
importantly, high-energy light ions have significantly
increased values for frequency- and dose-averaged lin-
eal energies compared to LET. Finally, we have dis-
cussed differences in track width, secondary electron
spectrum, and frequency event spectrum for ions of
identical LET. Clearly these differences, along with
other noted track structure effects, preclude the use of
LET or Z*2/[_ 2 as descriptors of radiation quality.
NASA Langley Research Center
Hampton, VA 23681-2199
April 6, 1998
Reference
1. Cucinotta, E A.; Wilson, J. W.; Katz, R.; Atwell, W.;
Badhwar, G. D.; and Shavers, M. R.: Track Structure
and Radiation Transport Model for Space Radiobiology
Studies. Adv. Space Res., vol. 18, no. 12, 1996,
pp. 183-194.
2. Badhwar, G. D.; Cucinotta, F. A.; Braby, L. A.; and
Konradi, A.: Measurements on the Shuttle of the LET
Spectra of Galactic Cosmic Radiation and ComparisonWith the Radiation Transport Model. Radiat. Res.,
vol. 139, no. 3, 1994, pp. 344-351.
3. Hamm, R. N.; Turner, J. E.; Wright, H. A.; and
Ritchie, R. H.: Heavy-Ion Track Structure in Silicon.
IEEE Trans. Nucl. Sci., vol. NS-26, no. 6, Dec. 1979,
pp. 4892-4895.
4. Kobetich, E. J.; and Katz, Robert: Energy Deposition by
Electron Beams and 8 Rays. Phys. Rev., vol. 170, no. 2,
June 1968, pp. 391-396.
5. Katz, R.; Ackerson, B.; Homayoonfar, M.; and Sharma,
S. C.: Inactivation of Cells by Heavy Ion Bombardment.
Radiat. Res., vol. 47, 1971, pp. 402-425.
6. Cucinotta, E A.; Wilson, J. W.; Shavers, M. R.; and
Katz, R.: Effects of Track Structure and Cell Inactiva-
tion on the Calculation of Heavy Ion Mutation Rates inMammalian Cells, Internat. J. Radiat. Biol., vol. 69,
no. 5, May 1996, pp. 593-600.
7. Goodhead, D. T.: Initial Events in the Cellular Effects of
Ionizing Radiations: Clustered Damage in DNA. Inter-
nat. J. Radiat. Biol., vol. 65, no. 1, Jan. 1994, pp. 7-18.
8. Nikjoo, H.; O'Neill, P. O.; Goodhead, D. T.; andTerissol, M.: Computational Modelling of Low Energy
Electron Induced DNA Damage by Early Physical andChemical Events. Int. J. Radiat., vol. 71, 1997,
pp. 467-483.
9. Katz, R.: RBE, LET, and Z/13<x.Health Phys., vol. 18,
no. 2, 1970, p, 170.
10. Schafer, M.; Schmitz, C.; and Bticker, H.: DNA Double
Strand Breaks Induced in Escherichia Coli Cells by
Radiations of Different Quality. Radiat. Prot. Dosim.,
vol. 52, nos. 1-4, 1994, pp. 233-236.
11. Kiefer, J.; Stoll, U.; and Schneider E.: Mutation Induc-
tion by Heavy Ions. Adv. Space Res., vol. 14, no. 10,
Oct. 1994, pp. 257-266.
12. Belli, M.; Moschini, G.; Tabocchini, M. A.; Simone, G.;
Sapora, O.; Tiverson, P.; Ianzini, E; Haque, A. M. I.;Cherubini, R.; and Cera, F.: Inactivation and Mutation
Induction in V79 Cells by Low Energy Protons: Re-
Evaluation of the Results at the LNL Facility. lnternat.
J. Radiat. Biol., vol. 63, no. 3, Mar. 1993, pp. 331-338.
13. Brenner, D. J.; Zalder, M.; Dicello, J. F.; and Bichsel,
H.: Theoretical Approaches to Energy Deposition in
Small Sites. Seventh Symposium on Microdosimetry,
J. Booz, H. E. Ebert, and H. D. Hartfiel, eds., LALS,
1981, pp. 677-688.
14. Wilson, W. E.; Metting, N. F.; and Paretzke, H. G.:
Microdosimetric Aspects of 0.3- to 10-MeV Proton
Tracks. Radiat. Res., vol. 115, 1988, pp. 389-402.
15. Wilson, J. W.; Cucinotta, F. A.; and Hajnal, E: Analytic
Relationships of Nuclear Field Microdosimetric Quanti-
fies for Target Fragmentation in Tissue Systems. Health
Phys., vol. 60, no. 4, 1991, pp. 559-565.
16. Cucinotta, Francis A.; Katz, Robert; Wilson, John W.;
and Dubey, Rajendra R.: Heavy Ion Track-Structure
Calculations for Radial Dose in Arbitrary Materials.NASA TP-3497, 1995.
17. Cheung, Wang K.; and Norbury, John W.: StoppingPowers and Cross Sections Due to Two-Photon Pro-
cesses in Relativistic Nucleus-Nucleus Collisions.
NASA CR-4574, 1994.
18. Brandt, Werner; and Ritchie, R. H.: Primary Processes
in the Physical Stage. Physical Mechanisms in Radia-
tion Biology, U.S. Atomic Energy Comm., 1974,
pp. 20--46.
19. Goodhead, D. T.; and Nikjoo, H.: Current Status of
Ultrasoft X-Rays and Track Structure Analysis as Tools
for Testing and Developing Biophysical Models ofRadiation Action. Radiat. Prot. Dosim., vol. 31,
nos. 1-4, May 1989, pp. 343-350.
6

20.Booz,J.;Ebert,H. G.; andSmith,B. G. R., eds.:MicrodosimetricSpectraand Parametersof LowLET-Radiations.Fifth Symposium on Microdosimetry,
EUR-5452, Vol. 1, Comm. European Comm., 1976,
pp. 311-345.
21. Haque, A. K. M.; and Saqan, S. A.: Microdosimetric
Study With Cylindrical Walled and Wall-less Propor-
tional Counters. Sixth Symposium on Microdosimetry,
J. Booz and H. G. Ebert, eds., Comm. European Comm.,
May 1978.
22. Braby, L. A.; and Roesch, W. C.: Direct Measurement of
f(z) for Fast Electrons. Sixth Symposium on Microdo-
simetry, J. Booz and H. G. Ebert, eds., Comm. European
Comm., May 1978.
23. Metting, N. F.; Rossi, H. H.; Braby, L. A.; Kliauga, P. J.;Howard, J.; Zaider, M.; Schimmerling, W.; Wong, M.;
and Rapkin, M.: Microdosimetry Near the Trajectory of
High-Energy Heavy Ions. Radiat. Res., vol. 116, 1988,
pp. 183-195.
24. Metting, Noeile Frances: Studies of Radiation-Induced
Mutagenesis and Cell Cycle Perturbation. Ph.D. Thesis,Harvard Univ., 1994.
25. Wilson, John W.; Townsend, Lawrence W.;
Schimmerling, Walter; Khandelwal, Govind S.; Khan,
Ferdous; Nealy, John E.; Cucinotta, Francis A.;
Simonsen, Lisa C.; Shinn, Judy L.; and Norbury,
John W.: Transport Methods and Interactions for SpaceRadiations. NASA RP-1257, 1991.
26. Cucinotta, E A.; Wilson, J. W.; Shinn, J. L.; Badavi,
E E; and Badhwar, G. D.: Effects of Target Fragmenta-
tion on Evaluation of LET Spectra From Space Radia-
tions: Implications for Space Radiation ProtectionStudies. Radiat. Meas., vol. 26, no. 6, Nov. 1996,
pp. 923-934.
27. Dicello, J. F.; Wasiolek, M.; and Zaider, M.: Measured
Microdosimetric Spectra of Energetic Ion Beams of Fe,
Ar, Ne, and C: Limitations of LET Distributions and
Quality Factors in Space Research and RadiationEffects. IEEE Trans. Nucl. Sci., vol. 38, no. 6,
Dec. 1991, pp. 1203-1209.
7

L_
O
r_
O
10 6
10 4
10 2
10 0
-- Total....... Delta rays---- Excitations
-- --- Normal ejection
[] Experiment
O
l05
10 0
10-5
-- Total
....... Delta rays---- Excitations
Normal ejection[] Experiment
10-2 10-10
10 -1 100 101 102 103 100 102 104 106 108
Distance, t, nm Distance, t, nm
(a) For 1 MeV protons. (b) For 377 MeV/amu neon.
Figure 1. Comparison of calculations to experiments for radial dose for ions of LET = 30 KeV/_tm.
10 2
10 8 --
-- Total
....... Delta rays---- Excitations
- Normal ejection
106 __" ,, [] Experiment
104 -- __
-100
L_
O
r_
10-2
10-2 ........ ,I ....... d ........ I ........ i 10-610 -1 10 0 101 10 2 10 3 10 0
Distance, t, run
(a) For 0.75 MeV/amu alpha particles.
10--4
106 F
Total
104
102
100
liiln J llllm J ili,m J ,lllu,il JlJm¢i ll_t,.il
101 102 103 104 105 106
Distance, t, nm
(b) For 1000 MeV/amu iron particles.
Figure 2. Calculations of radial dose distributions from ions of LET of 150 KeV/_tm.
8

102
101"7
"7E
100
u_
_ l0 -1
Distance,
t, nm10
........ 50---- 100
\
10 .2 n i ,,,,,,i J t tiilJil , , ,,,,,,I10-2 10 -1 100 101
Electron energy, E, keV
(a) Electron spectra for 1 MeV protons.
"7
::I.
¢'4
8Distance,
t, nm10
6 ........ 50100
4
2
0 , , ,,,,d
10-2 10 -1 10 0 101
Electron energy, E, keY
(b) Electron lethargy spectra for 1 MeV protons.
=1.,.-.,
t"q
104 _ Distance,
t, nm
,03 ,0i ........ . ........ 50......... " ----- 100
------ loo0102.... 10000
lO 1
10-1
10_2 -_ ....... I ........ I I_ ...... I
10-2 10-1 100 101 102 103
Electron energy, E, keV
(c) Electron spectra for 377 MeV/amu neon.
2000 Distance,
t, nm10
1500 ........ 50
loo0_ 10000
5oo
00-2 10-1 100 101 103
Electron energy, E, keV
(d) Electron lethayrgy spectra for 377 MeV neon.
Figure 3. Calculations of electron energy (E) spectrum tp(E, t) or 2_t 9(E, t) at various distances t from ions of LET of
30 keV/lam.

10 6
10 5
%1o4
"7
m" 103
¢',1
102
Distance,
t, nm
.... 50100
\
101 i i I Illlll I I I IllIII I I I lllJ_l
10-2 10-1 100 101
Electron energy, E, keV
(a) Electron spectra for 0.75 MeV/amu alpha particle.
50
"7
--1
-O-
¢q
x 103
Distance,t, nm
10........ 50
40
30
20
10
0 I I I IIIIll-2 10-1 100 101
Electron energy, E, keV
(b) Electron lethargy spectra for 0.75 MeV alpha particle.
105
%"7
Distance,
t, nm
10........ 50---_ I_
..... .... - --" - _ ------ I__-_- _ .... I0_
// "_---- 20000
-0- "
t_ /"f
I°-I .I- \
11-1-3 _ i_.ml i ii.ml i ii..,I t ii-ml _ ill..IA_
10-2 10-1 100 101 102 103
Electron energy, E, keV
10 3
101
I
E
d
u_
¢q
x 1034
Distance,
t, lira
10
3 ........ 50----- 100/ \
_-'" J.f .
10-2 10-1 100 101 102
Electron energy, E, keV
(c) Electron spectra for 1000 MeV/amu iron ions. (d) Electron lethargy spectra for 1000 MeV/amu iron ions.
Figure 4. Calculations of electron energy (E) spectrum tp(E, t) or 2_t tp(E, t) at various distances t from ions of LET of
150 keV/btm.
10

11

101
10 0
Lr.
"'421. Dr¥'-. rE]
0"-.[3 ri []
""_".. [] []• --... .......
• _ "'"
yF_ fi • "_-- (diameter = 0.5 Bm)
....... YD - fit
• YF - experiment (diameter = 0.5 Ixrn)
[] YD - experiment
10 -1 i J _ i lllJl _ _ , _ ,,,_1 I t I J Itlll
10 0 10 1 10 2 10 3
Photon energy, kV
i i lit I
1o4
(a) Diameter = 0.5 I.tm.
101
>
no0
[] '_ ...... B [][][] "-.
O "O [] []
_O• _ "", o ° []• ",.. []
o _.. o'-.. .... £2• • "----'" -,,
-- YF - fit (diameter = 1.0 ) •
....... YD-fit ...... _O
• yF- ex_nm, ent (diameter = LO lxm)El YD - experiment
10 -1 n n n a Jl,_l _ , ] , _,,,I t n n ] IJJnl l i J I ''Ill
10 0 101 10 2 10 3 10 4
Photon energy, kV
(b) Diameter = 1 rtm.
Figure 6. Comparison of parametric model to experiments for frequency-averaged lineal energy (YF) and dose-averaged lineal
energy (YD) versus photon energy.
12

I01 _
_h l°°
10-1
10 o
101
_h 1°°
10-1
10 0
---...°
"-''-°-... °
[] b"--. 121"[_-. []
_. n 13 0• "r-a....
_0"__ ; "'""-, IID
-- YF -fit (diameter = 1.9 I.tm) "_ • •"--'"" YD-fit .......
• YF- ex_n'ment (diameter = 1.9 Jam) _ •Q YD - experiment
I I I l l JlJ] I I _ _ ++l;l I I ( I IifJl
101 10 2 10 3
Photon energy, kV
(c) Diameter = 2 I.tm.
--___a° O"b... []
• _ 0""'"-. []
........ YD - fit •-"_1"" _D-et_periment (diameter = 4.0 jam)
[] YD- experiment
I I I I I illi I I I l I lla] I I I I I lli[
101 102 10 3
Photon energy, kV
(d) Diameter = 4 _tm.
Figure 6. Concluded.
] I I I I I I I_
10 4
| I | I 11111
10 4
13

100 -
tL
10--1
10-2
10-3
10-4
0
'.. _ ZF(t) (model)
_-- ZF(t ) (experiment)
_ _1)
i J _ t I J J J _ N _ I I I I I I I I 1 i I J I20 40 60 80 100
Distance, t, _tm
(a) Average specific energy, z_t).
10-1
10-2
10 -3¢q
N
"0
_'_ 10-4
10-5
10-6
0 20 40 60 80 100
Distance, t, grn
(b) Square of mean specific energy.
Figure 7. Comparison of calculation to experiments (ref. 23) for average energy in 1.3 _tm site as function of radial distance t
for 600 MeV/amu iron ions.
14

..a
10 2 .--
101
lOo
10-1
0
,\f D(t)(model)
m
m • • • We
ZD(t ) (0.5 lam site)
_zD(t ) (1.0 }am site)
i i i i I I I I t I I ),t I I t i i t I I I f I [ I I I I I t t i t I I I t t [
2 4 6 8 10 12 14 16
Distance, t, I.tm
Figure 8. Comparison of calculation to experiment (ref. 24) for average specific energy in 0.5 and 1.0 _tm sites as function of
radial distance for 13.7 MeV/amu germanium ions.
15

8
10 2
lO l
10 o
10-1
10 0
-- - _ YD (direct + indirect)
_.. --"_ YD(direct)
\..
I I I ! llllI I I I I lllll I , t ' '''II 1 l , , ,,,,I
101 10 2 10 3 10 4
E, MeV
(a)Diameter= 1 _tm.
Figure 9. Calculations of dose-averaged lineal energy (YD) versus kinetic energy for protons in spherical sites.
16

10 2
101
10 0
10-1
- LET
._ -- - -- YD (direct + indirect)
- _ .... YD (direct)
l I I I lllli I I I I i IIII I I i I I llll I I
I0 0 101 10 2 10 3
E, MeV
(b) Diameter = 4 _tm.
Figure 9. Concluded.
I I I I II]
1o4
17

10 4 _
10 3
• m
• B___
LET
YD (direct + indirect)
YD (direct)
E
[-.; 10 2
101
10 0 i _ , ,_,,,I I i I llllll J _ _ JJt,_l _ i i llJlll
l0 0 l01 10 2 t0 3 10 4
E, MeV/amu
Figure 10. Calculations of dose-averaged lineal energy (YD) versus kinetic energy for oxygen ions in 1 _tm sites.
18

10 4
•- LET
• -- - -- YD (direct + indirect)
• .... YD (direct)
E
;>
,.d
10 3
10 2
l01 i I J i iJlJ[ ] [ i i lilii I I I I IItil i i i i J,JJl
10 0 101 10 2 10 3 10 4
E, MeV/amu
Figure 11. Calculations of dose-averaged lineal energy (YD)versus kinetic energy for iron ions in 1 lam sites.
19

1°1F10 0 .
10-1
10-2 , _ ........ I
10 -2 10-1 10 0 101 10 2
Lineal energy, y, keV/_tm
(a) Helium.
101
i n unhand
10 3
10 0
10-1
10-210 -2
I I Illll]
10 -1 10 0 101 10 2 10 3
Lineal energy, y, keV#tm
(b) Iron.
Figure 12. Comparison of event distributions, yf(y), in 1 p.m site for helium and iron ions of 200 MeV/amu.
2O


Form ApprovedREPORT DOCUMENTATION PAGE oMeNo o_o4-o,ee
Public reporting burden for this collection of information Is estimated to average 1 hour per response, including the time for reviewing instructions, seemhing existing data sources,gathering end maintaining the data needed, and completing and reviewing the collection of information. Send comments regarding this burden estimate or any other aspect of thiscollection of information, Including suggestions for reducing this burden, to Washington Headquarters Services, Directorate for Information Opera,one and Reports, 1215 JeffersonDavis Highway, Suite 1204, Arlington, VA 222024302, and to the Office of Management and Budget, Paperwork Reduction Project (0704-0188), Washington, DC 20503.
1. AGENCY USE ONLY (Leave blank)I =. REPORT DATE 3. REPORT TYPE AND DATES COVERED
I September 1998 Technical Publication
4. TITLE AND SUulilLE 5. FUNDING NUMBERS
Track Structure Model for Radial Distributions of Electron Spectra andEvent Spectra From High-Energy Ions WU 199-45-16-11
S. AUTHOR(S)
F. A. Cucinotta, R. Katz, and J. W. Wilson
7. PERFORMING ORGANIZATION NAME(S) AND ADORESS(ES) a. PERFORMING ORGANIZATION
REPORT NUMBER
NASA Langley Research CenterHampton, VA 23681-2199 L- 17655
9. SPONSORING/MONITORING AGENCY NAME(S) AND ADDRESSiES) !10. SPONSORING/MONITORING
AGENCY REPORT NUMBER
National Aeronautics and Space Administration NASA/TP-1998-208707Washington, DC 20546-0001
11. SUPPLEMENTARY Nut =-S
Cucinotta and Wilson: NASA Langley Research Center, Hampton, VA; Katz: University of Nebraska, Lincoln, NE.
1211. DISTRIBUTION/AVAILABILITY STATEMENT 12b. DISTRIBUTION CODE
Unclassified-UnlimitedSubject Category 93 Distribution: StandardAvailability: NASA CASI (301) 621-0390
13. ABSTRACT (Maximum 200 words)
An analytic method is described for evaluating the average radial electron spectrum and the radial and totalfrequency-event spectrum for high-energy ions. For high-energy ions, indirect events make important contributionsto frequency-event spectra. The method used for evaluating indirect events is to fold the radial electron spectrumwith measured frequency-event spectrum for photons or electrons. The contribution from direct events is treatedusing a spatially restricted linear energy transfer (LET). We find that high-energy heavy ions have a significantlyreduced frequency-averaged lineal energy (YF) compared to LET, while relativistic protons have a significantly
increased YF and dose-averaged lineal energy (YD) for typical site sizes used in tissue equivalent proportional
counters. Such differences represent important factors in evaluating event spectra with laboratory beams, in space-flight, or in atmospheric radiation studies and in validation of radiation transport codes. The inadequacy of LET asdescriptor because of deviations in values of physical quantities, such as track width, secondary electron spectrum,and YD for ions of identical LET is also discussed.
14. SUBJECT TERMS
Space radiation; Microdosimentry; High-energy ions; Radiation transport codes
17. SECURITY CLASSIFICATIONOF REPORT
Unclassified
NSN 7540-01-280-5500
18. SECURITY CLASSIFICATION
OF THIS PAGE
Unclassified
19. SECURITY CLASSIFICATION
OF ABSTRACT
Unclassified
15. NUMBER OF PAGES
2516. PRICE CODE
A03
20. LIMITATION
OF ABSTRACT
Standard Form 298 (Rev. 2-89)Prescribed by ANSi Std. Z39-18298-102