trace metals and organic carbon in sediments of the northeastern chukchi sea
TRANSCRIPT

Deep-Sea Research II 102 (2014) 18–31
Contents lists available at ScienceDirect
Deep-Sea Research II
0967-06http://d
n CorrE-m
journal homepage: www.elsevier.com/locate/dsr2
Trace metals and organic carbon in sediments of the northeasternChukchi Sea
John H. Trefry a,n, Robert P. Trocine a, Lee W. Cooper b, Kenneth H. Dunton c
a Department of Marine & Environmental Systems, Florida Institute of Technology, 150 West University Boulevard, Melbourne, FL 32901, USAb Chesapeake Biological Laboratory, University of Maryland Center for Environmental Science, Solomons, MD 20688, USAc Marine Science Institute, The University of Texas at Austin, Port Aransas, TX 78373, USA
a r t i c l e i n f o
Available online 20 July 2013
Keywords:Chukchi SeaSedimentsMetalsOrganic carbon137Cesium and 210Pb dating
45/$ - see front matter & 2013 Elsevier Ltd. Ax.doi.org/10.1016/j.dsr2.2013.07.018
esponding author. Tel.: +1 321 674 7305.ail address: [email protected] (J.H. Trefry).
a b s t r a c t
Concentrations of Al, Fe and selected trace metals (As, Ba, Be, Cd, Cr, Cu, Hg, Mn, Ni, Pb, Sb, Se, Sn, V, Zn)in surface sediments from the northeastern Chukchi Sea (NECS) varied considerably as a function ofsediment texture (i.e., grain size); however, essentially all metals, when normalized to Al, were presentat natural, background values. Total organic carbon content ranged from 0.06–1.56% with a marineorigin for at least two-thirds of the organic matter at each station based on δ13C values and C/N ratios.Recent sedimentation rates from 137Cs and 210Pb dating were 0.03–0.14 cm yr�1. Corresponding verticaldistributions for most metals in age-dated sediment cores showed 4100-yr records of uniform metal/Alratios, including Pb and Hg. Concentrations of As, Mn and Cd were modified in surface sediments at afew stations by early chemical diagenesis. Surveys around two exploratory oil and gas drilling sites thatwere occupied in 1989 showed that Ba concentrations were as high as 10,000 mg g�1 within 200 m ofone drilling site relative to background values of �700 mg g�1. Barium enrichment was from barite, adrilling mud additive that was discharged to the seafloor. Above background concentrations of Cu, Hg, Pband Zn also were found in sediments from 3–4 stations within 200 m of the two drilling sites. At present,sediments in the NECS are essentially pristine with respect to trace metals of anthropogenic origin,excluding small areas around drilling sites. These data should be of value for detecting and trackingfuture chemical changes in the sediments of the NECS, particularly in light of planned oil and gasexploration and production as well as environmental changes that may be associated with climatechange.
& 2013 Elsevier Ltd. All rights reserved.
1. Introduction
Sea ice retreat, increased coastal erosion, enhanced primaryproductivity and planned oil and gas exploration foreshadowimpending changes to the biologically-rich benthic environmentof the northeastern Chukchi Sea (NECS) (Post et al., 2009; Rowlandet al., 2010). These impacts carry with them the possibility forincreased inputs of sediment, particulate organic carbon andpotentially toxic metals, as well as a shift to a more reducingsedimentary environment. Limited information on the distributionof trace metals in sediments is available for the NECS, making itimportant to determine background concentrations as a referencepoint for tracking any future changes from human activities andclimate change.
Sediment texture varies greatly throughout the NECS with a rangeof o10% to 490% silt+clay (mud) in surface sediments (Naidu, 1988;
ll rights reserved.
Naidu et al., 1997). Gravelly-sand is found along the nearshorepathway of the Alaska Coastal Current and around Hanna and Heraldshoals (McManus et al., 1969). Sand and gravel have remained on theshoals after winnowing of the fine fraction by currents followingresuspension due to ice gouging of the seafloor (Tomil and Grantz,1976). Silt and clay are more abundant in the central Chukchi Basin(McManus et al., 1969; Naidu, 1988). Provenance for much of thefine-grained sediment is the Yukon River with transport from theBering Sea to the eastern Chukchi Sea via the Alaska Coastal Current(McManus et al., 1969). The sediments of the Chukchi Sea supportdiverse assemblages of abundant infaunal and epifaunal commu-nities that are partly linked with sediment texture (Feder et al., 1994;Grebmeier et al., 2006).
Concentrations of total organic carbon (TOC) also vary greatlyin sediments from the NECS with a range of 0.1% to 42% and aspatial pattern driven by sediment texture and the flux ofphytodetritus (Naidu et al., 2000, 2004). The mass ratio of C/Nfor organic matter (OM) decreases from 410 to o5 withincreased distance offshore, a trend that correlates significantlywith the stable carbon isotope composition (δ13C) of sediment OM
J.H. Trefry et al. / Deep-Sea Research II 102 (2014) 18–31 19
(Cooper et al., 2009). Values for δ13C increase from �27‰ for terri-genous OM nearshore to �21‰ for marine OM offshore (Cooperet al., 2009; Naidu et al., 1993, 2000, 2004). Carbon budgetspresume high productivity in offshore areas (840 g C m�2 yr�1 inthe southern Chukchi Sea) and lower productivity in nearshorelocations (70 g m�2 yr�1; see Naidu et al., 2004). Furthermore,o10% of the labile offshore OM is estimated to be buried in thesediments due to losses by advection, remineralization or con-sumption by benthic biota whereas �60% of the OM deposited innearshore sediments is buried in place (Naidu et al., 2004).Increases in primary productivity and terrigenous inputs of OMfrom fluvial runoff and coastal erosion may result from projectedclimate change and have a significant impact on the future carbonbudget, redox environment and behavior of redox-active metals inthe sediments of the NECS.
Few previous studies of trace metals in sediments from the NECShave been carried out. Naidu et al. (1997) reported backgroundconcentrations of Co, Cr, Cu, Mn, Ni, V and Zn in surface sedimentsfrom 31 stations in the eastern Chukchi Sea. Likewise, Cai et al.(2011) found background concentrations of Cd, Cr, Cu, Pb, V and Znin surface sediments from eight locations in the Chukchi Sea. Chenet al. (2003) analyzed 26 surface samples from the Chukchi Sea forrare earth elements (REE) and found higher concentrations in fine-grained sediments with shale-normalized REE patterns that wereconsistent with terrigenous components subjected to only weakchemical weathering. Deposition of anthropogenic metals in sedi-ments of the Chukchi Sea seems limited; Cantillo et al. (1999)reported enhanced Cr concentrations as high as 213 μg g�1 incoastal sediments �140 km north of Kotzebue where Zn and Pbore from the Red Dog Mine are transferred from barges to ships.Exploratory drilling for oil was conducted at five locations in theNECS between 1989 and 1992 (Fig. 1); we report here results fortrace metals at two of these sites.
Mass accumulation rates (MAR) for the top 20 cm of sedimentin the NECS average 133 mg cm�2 yr�1 and range from 31–324 mg cm�2 yr�1 (Baskaran and Naidu, 1995). Assuming sedimentwater content of �50% by weight, these recent accumulation rates
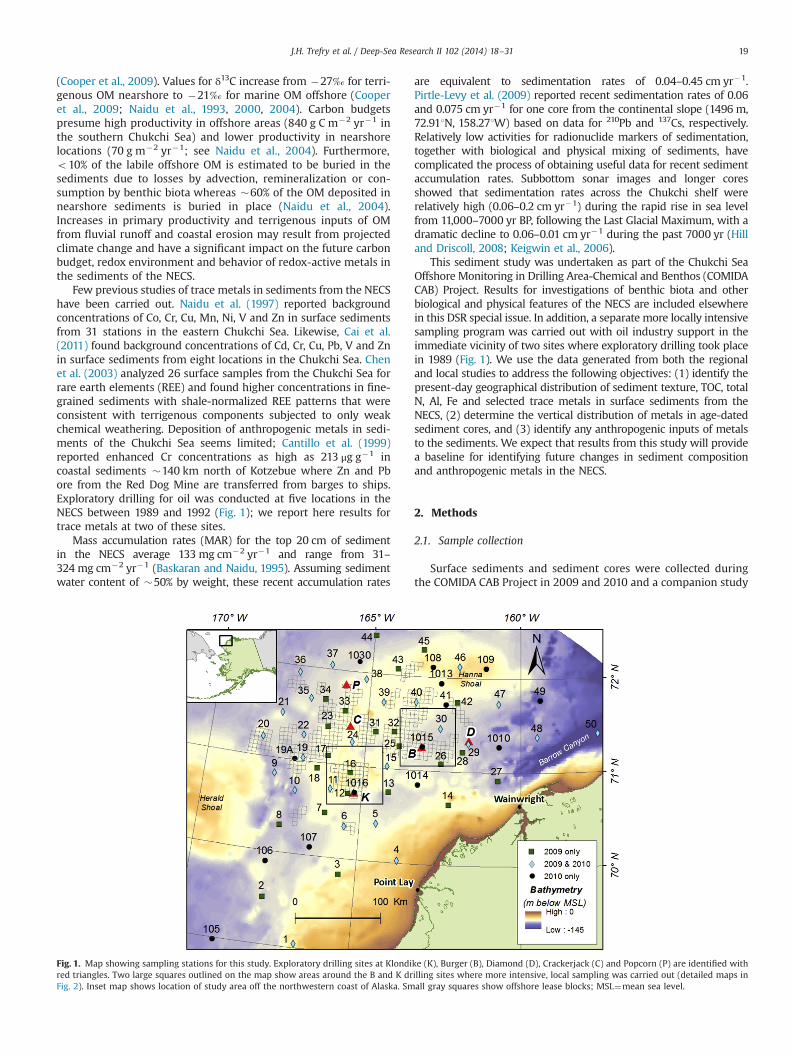
Fig. 1. Map showing sampling stations for this study. Exploratory drilling sites at Klondired triangles. Two large squares outlined on the map show areas around the B and K drFig. 2). Inset map shows location of study area off the northwestern coast of Alaska. Sm
are equivalent to sedimentation rates of 0.04–0.45 cm yr�1.Pirtle-Levy et al. (2009) reported recent sedimentation rates of 0.06and 0.075 cm yr�1 for one core from the continental slope (1496 m,72.911N, 158.271W) based on data for 210Pb and 137Cs, respectively.Relatively low activities for radionuclide markers of sedimentation,together with biological and physical mixing of sediments, havecomplicated the process of obtaining useful data for recent sedimentaccumulation rates. Subbottom sonar images and longer coresshowed that sedimentation rates across the Chukchi shelf wererelatively high (0.06–0.2 cm yr�1) during the rapid rise in sea levelfrom 11,000–7000 yr BP, following the Last Glacial Maximum, with adramatic decline to 0.06–0.01 cm yr�1 during the past 7000 yr (Hilland Driscoll, 2008; Keigwin et al., 2006).
This sediment study was undertaken as part of the Chukchi SeaOffshore Monitoring in Drilling Area-Chemical and Benthos (COMIDACAB) Project. Results for investigations of benthic biota and otherbiological and physical features of the NECS are included elsewherein this DSR special issue. In addition, a separate more locally intensivesampling program was carried out with oil industry support in theimmediate vicinity of two sites where exploratory drilling took placein 1989 (Fig. 1). We use the data generated from both the regionaland local studies to address the following objectives: (1) identify thepresent-day geographical distribution of sediment texture, TOC, totalN, Al, Fe and selected trace metals in surface sediments from theNECS, (2) determine the vertical distribution of metals in age-datedsediment cores, and (3) identify any anthropogenic inputs of metalsto the sediments. We expect that results from this study will providea baseline for identifying future changes in sediment compositionand anthropogenic metals in the NECS.
2. Methods
2.1. Sample collection
Surface sediments and sediment cores were collected duringthe COMIDA CAB Project in 2009 and 2010 and a companion study
ke (K), Burger (B), Diamond (D), Crackerjack (C) and Popcorn (P) are identified withilling sites where more intensive, local sampling was carried out (detailed maps inall gray squares show offshore lease blocks; MSL¼mean sea level.

Table 1Summary of sediment samples collected for this study. Sampling areas are designated as follows: (1) northeastern Chukchi Sea, regional, (2) within 3100-km2 reference areasaround the Burger (B) and Klondike (K) drilling sites, and (3) within 600 m of the B and K drilling sites. Locations shown in Figs. 1 and 2.
Year Project # Surface sediment # Sediment cores (# samples) Coring stations Sampling area
2009 COMIDA 48 5 (74) 6, 13, 20, 29, 37 (HAPS)a Regional, NE Chukchi Sea2010 COMIDA 35b 4 (41) 40, 49, 1015c, 1016c (HAPS) Regional, NE Chukchi Sea2010 Shell, CPAI, Statoil – 1 (56) 19A (GC)d Regional, NE Chukchi Sea
2008 CPAI, Shell, Statoil 52 – – B and K references areas
2008 CPAI, Shell, Statoil 10 3 (16) BD5, KD2, KD5 (vV)e o600 m from B, K drilling sites2009 Shell, CPAI, Statoil 28 2 (17) B0, B1 (HAPS) o300 m from B drilling site
2010 Shell, CPAI, Statoil – 1 (26) K3 (GC) o300 m from K drilling site
a HAPS corer (Kanneworff and Nicolaisen, 1973).b Includes repeat sampling of 25 stations occupied during the 2009 COMIDA cruise.c Cores 1015 and 1016 were collected at fixed stations in the B and K drilling sites, respectively. Data for these samples are not included in the regional COMIDA
data set.d Gravity core.e van Veen sediment sampler.
J.H. Trefry et al. / Deep-Sea Research II 102 (2014) 18–3120
undertaken on behalf of Shell Exploration and Production Com-pany (SEPCo) Alaska, ConocoPhillips Alaska, Incorporated (CPAI)and Statoil in 2008, 2009 and 2010 (Fig. 1, Table 1). Data from theCOMIDA CAB Project were used to define the regional distributionof metals in the sediments of the NECS whereas data from moreintensive sampling of the Burger (B) and Klondike (K) drilling sites(Figs. 1 and 2) were used to identify any anthropogenic inputs ofmetals that may have occurred during exploratory drilling for oiland gas in 1989.
Regional sampling for the COMIDA CAB project was carried outduring July and August 2009 and 2010 using the vessels R/V AlphaHelix and R/V Moana Wave, respectively. Sample stations wereselected in 2009 by randomly choosing 48 locations using thehexagonal grid approach of White et al. (1992) that insured aneven distribution of stations throughout the study area (Fig. 1,Table 1). Twenty-five of the stations sampled in 2009 wereresampled in 2010; an additional 10 locations were selected in2010 as fixed stations. Overall, 58 stations were sampled duringthe COMIDA CAB Project.
Sampling at the B and K drilling sites was carried out in 2008,2009 and 2010 using the vessels R/V Bluefin, R/V Alpha Helix andR/V Moana Wave, respectively. Sampling near each drilling site in2008 followed a stratified-random strategy that incorporated thefollowing: (1) 13 fixed reference stations selected using 14-kmgrids within a 56�56 km sampling area with stations on gridcorners and at every other grid intersection, (2) 13 randomreference stations with locations in 5.6-km square grids spacedthroughout each study block and (3) 5 site-specific locations atdistances of 400–600 m from each drilling site along four radialswith one axis of the radial oriented along the direction of theprevailing currents (Table 1 and Fig. 2). Sampling during 2009 wascarried out at 14 random stations within 300 m of each drillingsite; station locations were chosen using the hexagonal gridapproach of White et al. (1992), (Table 1 and Fig. 2).
Surface sediments were collected at all locations using a pre-cleaned, double van Veen grab that obtained two side-by-sidesamples, each with a surface area of 0.1 m2 and a depth of �15 cm.Samples (top 1 cm) were carefully collected from the center of oneof the two grabs and placed in separate containers for metals, TOCand grain size analysis. The companion grab was used for samplingbenthic biota and the results are reported elsewhere in this issue.
Sediment cores were collected at 11 locations using a HAPScorer (Kanneworff and Nicolaisen, 1973) with a 30-cm acrylic linerand at two locations using a Benthos gravity corer with a 1-m longbarrel, 7.5-cm diameter plastic liner and no core catcher (Table 1).Three short sediment cores (�12-cm long) were collected near the
drilling sites using a van Veen grab. All cores were stratigraphicallysectioned into 0.5- to 2-cm thick layers aboard ship under cleanconditions and the sediment was placed in plastic containers.All sediments samples, except those for grain size analysis, werefrozen shipboard.
2.2. Laboratory methods
Sediment samples analyzed for metals were thawed, homo-genized and a wet portion was set aside to determine concentra-tions of total Hg. The remaining sample was freeze-dried to obtainwater content, homogenized and then dissolved using Fisher TraceMetal Grade HF, HNO3 and HClO4. The resulting solution wasanalyzed for Al, Cr, Cu, Fe, Mn, V and Zn using a Perkin-ElmerModel 4000 atomic absorption spectrometer (AAS) and for As, Ba,Be, Cd, Ni, Pb, Sb, Se and Sn using a Varian Model 820-MSinductively coupled plasma mass spectrometer following methodsdescribed in Trefry et al. (2003). Standard reference material(SRM) #2709 (soil with certified values for Ba and other metals)from the U.S. National Institute of Standards and Technology(NIST) was processed with each batch of samples; all of our resultswere within the 95% confidence intervals for certified values.Analytical precision ranged from 1% (Al, Cu, Fe, and Pb) to 3%(Sn). Method detection limits (MDL) were 25 (Cu) to 45000 (Ba,Pb) times lower than the lowest value obtained for field samples.
For determination of total Hg, the sediment splits weredigested in Fisher Trace Metal Grade HNO3 and H2SO4 and thesolutions were analyzed by cold vapor AAS. The sediment CertifiedReference Material (CRM) MESS-3 from the National ResearchCouncil of Canada was used to determine accuracy for Hg analysesand all values were within the 95% confidence intervals forcertified values. Analytical precision for Hg was 4% and the MDLwas 0.001 mg g�1.
Concentrations of sediment TOC were determined by firsttreating dried sediment (60 1C) with 10% HCl to remove inorganiccarbon, followed by combustion at 900 1C and infrared quanti-fication of CO2. Concentrations of total N (TN) were determinedusing an element analyzer (Cooper et al., 2009). Grain size analysiswas carried out using a combination of wet sieving and pipettetechniques. Samples for stable carbon isotope analysis weretreated with 1 N HCl to remove carbonates, rinsed with distilledwater and then dried at 60 1C. All samples were analyzed for δ13Cof the OC using a Finnigan Delta Plus stable isotope mass spectro-meter. Results are expressed in standard δ notation relative tocarbonate PeeDee Belemnite. Precision was70.2‰ based onanalysis of replicate samples.

Fig. 2. Locations of sampling stations in the areas of the (A) Burger and(B) Klondike exploratory drilling sites. Larger maps show stations within 600 mof each drilling site with centers at B0 and K0 (encircled). Smaller maps showlocations of drilling sites as small red squares along with reference stationssampled in the surrounding 3100 km2. Triangles and diamonds show fixed stationsand circles show random stations. Locations of expanded areas (smaller maps) areshown on Fig. 1.
J.H. Trefry et al. / Deep-Sea Research II 102 (2014) 18–31 21
Sediment geochronology was determined using 137Cs andexcess 210Pb (210Pbxs) following methods described by Kang et al.(2000). The activities of 137Cs, 210Pb and 226Ra (via 214Pb and 214Bi)were counted for 10-g samples of each core section in plastic vialsfor 2–3 days using a well-type, intrinsic germanium detector(WiGe, Princeton Gamma Tech) to yield peak areas sufficient toprovide o10% counting error for total 210Pb. Detector efficiencywas determined using the following standards: NBS 4350B riversediment and NBS 4354 freshwater lake sediment from NIST aswell as standards RGU-1 and RGTh-1 from the InternationalAtomic Energy Agency. The specific activity (dpm g�1) of theradionuclides in each sample was calculated from the detectorefficiency, gamma intensity, geometry factor and sample weight(Kang et al., 2000). All values were decay-corrected to the date ofcoring. Errors reported are based on 1-sigma counting statistics.
Linear sedimentation rates (LSR in cm yr�1) based on 137Csactivities were determined by dividing the depth of the 137Csmaximum by 46 yr, the elapsed time between peak deposition of137Cs from bomb fallout (�1963–1964) and sample collection(2009–2010). Sediment MAR (in mg cm�2 yr�1) were calculatedby (1) assuming a constant accumulation rate for excess 210Pb(210Pbxs¼Σ210Pb�210Pbsupported), with APb
210supported¼ARa
226, (2) plot-ting data for ln 210Pbxs versus the cumulative dry mass ofsediment, and (3) dividing the slope of that line (�λ210/MAR) bythe decay constant for 210Pb (λ210¼0.0305 yr�1) (Oldfield andAppleby, 1984). Sedimentation rates based on 210Pbxs were calcu-lated by dividing λ210 by the slope from a plot of ln 210Pbxs versussediment depth (Kang et al., 2000; Robbins and Edgington, 1975).
2.3. Statistical analysis
Statistical analyses were performed using Systat 12 (SystatSoftware, Inc., Chicago) and JMP 10 (SAS Institute, Inc., Cary, NC).The apriori alpha value used to define statistical significance wasset at 0.05 (α¼0.05) for all statistical tests and regressions. Linearleast squares regressions were computed to determine the rela-tionship between individual pairs of parameters (e.g., sediment Crversus Al). Comparisons of two independent groups of data (e.g.,sediment Ba at reference versus drilling sites) were carried outusing two-tailed, t-tests. Levene's test was used to determine theequality of variance between two independent data sets andpooled variance was used for all t-tests in this study based onLevene p-values40.05. Independent groups of data withp-values40.05 from the t-test were reported as being not statis-tically different.
3. Results and discussion
3.1. Regional distribution of texture, organic carbon and metals insurface sediments
The present-day composition of surface sediments in the NECSis described here using sediment texture and values for TOC, TN,δ13C, Al, Fe and selected trace metals. Sediment texture at the58 regional (COMIDA) stations was quite variable with ranges ofo1–58% gravel, 2–90% sand and 9–98% silt+clay (Table 2, Fig. 3A).As reported by previous investigators (e.g., McManus et al., 1969;Naidu, 1988), sandy sediments were found in and around HannaShoal and at nearshore stations along the pathway of the AlaskaCoastal Current (lower edge of contoured area, Fig. 3A). Higher siltand clay fractions were found farther offshore (Fig. 3A).
Concentrations of TOC also were variable with a range of 0.06%at Hanna Shoal station 46 to 1.56% at offshore station 44 (Table 2and Fig. 3B). Low TOC (o0.4%) was found only at two nearshorestations (4 and 14) and at Hanna Shoal stations 46 and 109 (Fig. 3B).

Table 2Summary data for sediment texture, total organic carbon (TOC), total nitrogen (TN), C/N ratio, and stable isotopes of OC (δ13C) for surface sediments from this and otherstudies.
Samples Gravel (%) Sand (%) Silt+Clay (%) TOC (%) TN (%) C/N (mass) δ13C (‰)
NE Chukchi Sea (This study, n¼58)Mean7SD 5710 31723 64726 0.8970.39 0.1270.05 7.370.8 �23.2470.70Median 0.2 26 71 0.90 0.12 7.2 �23.15Maximum 58 90 98 1.56 0.25 10.8 �22.29Minimum o1 2 9 0.06 0.015 4.0 �26.20
Chukchi Sea (Other studies)a,b
Mean7SD 14a720 34a727 52a734 0.72a70.38 — 6.0b1.0 �21.2b71.1Median 2 32 54 0.69 – 6.2 �21.7Maximum 65 90 100 1.57 – 7.7 �19.4Minimum o1 o1 4 0.12 – 3.5 �23.6
a Naidu et al., 1997, n¼31, NE Chukchi Sea.b Cooper et al., 2009, n¼30, Southern Chukchi Sea.
J.H. Trefry et al. / Deep-Sea Research II 102 (2014) 18–3122
Higher TOC values (41.2%) were found offshore and at the head ofBarrow Canyon (Fig. 3B). TOC showed a strong positive correlationwith silt+clay (Fig. 4A), most likely due to the increased surfacearea for adsorption of OM on finer-grained particles and co-deposition of mud and particulate OM with similar hydraulicbehavior. The average values for TOC in the present study was�24% higher than reported by Naidu et al. (1997) for the NECS;however, this difference can be accounted for by fewer nearshore(sandy) sediments in our study. Maximum and minimum valuesfor TOC from the two studies were similar (Table 2). Concentrationsof sediment TN averaged 0.1270.05% (mean7SD) and ranged from0.015% on Hanna Shoal to 0.25% at the head of Barrow Canyon(Table 2, Fig. 4B).
Sediment C/N (TOC/TN) mass ratios were relatively uniform at7.370.8 (Table, 2; atomic ratio¼8.570.9). Furthermore, with theexceptions of stations 1, 106 and 46 with C/N ratios of 10.8, 9.3 and4.0, respectively (Fig. 4B), the range of C/N values was 6.2–8.2 andthe mean was 7.370.4. Naidu et al. (2004) showed that C/N ratiosdecreased from 9.5–10 to o7 from east to west across the ChukchiSea in response to an increase in marine versus terrestrial organicmatter.
The δ13C of OC in offshore sediments has been used to estimatethe relative amounts of terrigenous and marine OC in sedimentOM (e.g., Hedges and Parker, 1976; Prahl et al., 1994). Suchestimates are based on the known δ13C values for terrigenousand marine OM for the area and calculated using an isotopemixing equation (e.g., Schultz and Calder, 1976). Naidu et al. (1993)defined terrigenous and marine end-member values for δ13C at�27‰ and �21‰, respectively, with samples from the northernBering and southern Chukchi seas. The δ13C value for the terrige-nous end-member seems to be well constrained by available datafor the Arctic (e.g., Stein and Macdonald, 2004). Choosing a δ13Cvalue for the marine end-member is not as straightforwardbecause considerable variability in values for the Arctic have beenreported and the ratio is affected by biological productivity,phytoplankton cell size, presence of sea ice algae and other factors(Stein and Macdonald, 2004).
Our δ13C values for surface sediments from the NECS rangedfrom �22.3 to �26.2‰ (Table 2). The δ13C values for fivenearshore stations (1, 4, 14, 27 and 50) were less than �24‰and statistically different (t-test, 2 tailed, α¼0.05, p¼0.01) fromvalues for the other 53 stations that averaged �23.070.3‰.Using end-member values for the Chukchi Sea from Naidu et al.(1993, 2000), sediments from the five nearshore stations areestimated to contain 450% terrigenous OM with an average of64710% terrigenous OM based on the following calculation: %Terrigenous OM¼{[(δ13Cmeasured+21)/(�6)]�100%}. In contrast,
using the same end-member values, all the other stations con-tained an average of 3475% terrigenous OM and thus were rich inmarine OM (Fig. 3B).
Our results for sources of OM are consistent with previousobservations of relatively more refractory OM nearshore versusmore labile OM offshore and near Barrow Canyon (Cooper et al.,2009; Naidu et al., 2000, 2004). Furthermore, Cooper et al. (2009)showed that δ13C values and C/N ratios in surface sediments havedecreased during the past 20 yr in parts of the southern ChukchiSea in response to apparent increases in primary productivity anddeposition of more labile OM. These observations are of interestbecause, if sustained, they may shift the contemporary biogeo-chemical environment of the NECS in the future to create a morereducing sedimentary environment that may lead to an increase indiagenetic mobilization of some metals.
A 5-fold range in the Al concentrations of surface sedimentswas observed with the lowest values in near shore gravelly sandand in sand on Hanna Shoal; the highest values were foundoffshore in silt- and clay-rich sediments (Table 3, Fig. 3C). Con-centrations of Al were positively correlated with silt+clay becauseAl values are very low in coarse-grained quartz sand and carbo-nate shell material, but are much higher in fine-grained alumino-silicates (Fig. 4C). Therefore, the geographic distribution of Alparalleled the distribution of silt+clay and OC (Fig. 3).
Concentrations of Be, Cd, Cr, Cu, Hg, Ni, Pb, Sb, Se, Sn, V andZn also varied considerably in sediments throughout the NECS(Table 3); but, they were strongly (r¼0.7–0.9) or very strongly(r40.9) correlated with concentrations of Al (Fig. 5A–I) andthus followed the same geographic trends observed for Al(Fig. 3C). Corresponding trends for the absolute concentrationsof Al and correlated trace metals can be reasonably explainedby variations in grain size, TOC and/or mineralogy becausethese three variables generally control metal concentrations insediments. In our analysis, we used precedents where concentra-tions of metals are normalized to Al to provide a useful index foridentifying background metal concentrations (Bruland et al.,1974; Trefry and Presley, 1976; Schropp et al., 1990; Trefry et al.,2003). As with these prior studies, we assumed that naturalconcentrations of metals, without detectable anthropogenicinputs, will plot within the prediction intervals calculated fromlinear regression analysis as shown on metal versus Al scatterplots (Fig. 5). Significant, positive deviations from these lineartrends can be used to identify metal contamination or diageneticmobilization of metals as described below and in Trefry et al.(2003).
Although correlation coefficients for Cd, Hg and Pb versusAl (r¼0.74–0.80) were lower than found for the other metals
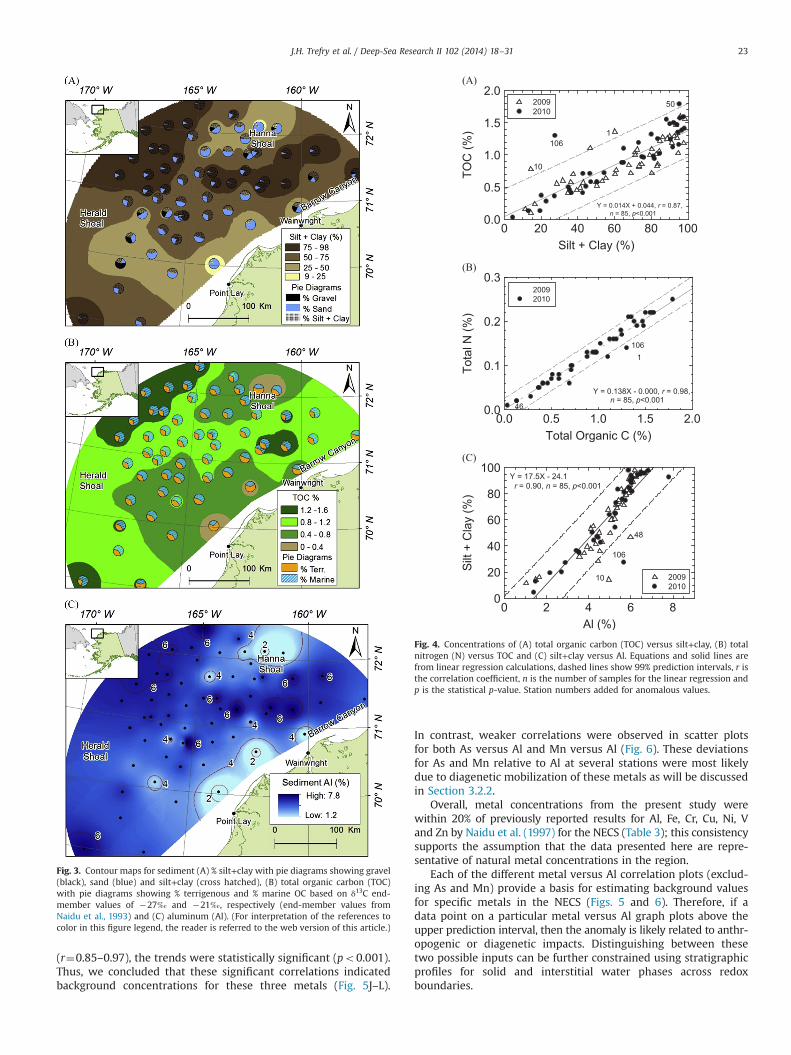
Fig. 3. Contour maps for sediment (A) % silt+clay with pie diagrams showing gravel(black), sand (blue) and silt+clay (cross hatched), (B) total organic carbon (TOC)with pie diagrams showing % terrigenous and % marine OC based on δ13C end-member values of �27‰ and �21‰, respectively (end-member values fromNaidu et al., 1993) and (C) aluminum (Al). (For interpretation of the references tocolor in this figure legend, the reader is referred to the web version of this article.)
Fig. 4. Concentrations of (A) total organic carbon (TOC) versus silt+clay, (B) totalnitrogen (N) versus TOC and (C) silt+clay versus Al. Equations and solid lines arefrom linear regression calculations, dashed lines show 99% prediction intervals, r isthe correlation coefficient, n is the number of samples for the linear regression andp is the statistical p-value. Station numbers added for anomalous values.
J.H. Trefry et al. / Deep-Sea Research II 102 (2014) 18–31 23
(r¼0.85–0.97), the trends were statistically significant (po0.001).Thus, we concluded that these significant correlations indicatedbackground concentrations for these three metals (Fig. 5J–L).
In contrast, weaker correlations were observed in scatter plotsfor both As versus Al and Mn versus Al (Fig. 6). These deviationsfor As and Mn relative to Al at several stations were most likelydue to diagenetic mobilization of these metals as will be discussedin Section 3.2.2.
Overall, metal concentrations from the present study werewithin 20% of previously reported results for Al, Fe, Cr, Cu, Ni, Vand Zn by Naidu et al. (1997) for the NECS (Table 3); this consistencysupports the assumption that the data presented here are repre-sentative of natural metal concentrations in the region.
Each of the different metal versus Al correlation plots (exclud-ing As and Mn) provide a basis for estimating background valuesfor specific metals in the NECS (Figs. 5 and 6). Therefore, if adata point on a particular metal versus Al graph plots above theupper prediction interval, then the anomaly is likely related to anthr-opogenic or diagenetic impacts. Distinguishing between thesetwo possible inputs can be further constrained using stratigraphicprofiles for solid and interstitial water phases across redoxboundaries.
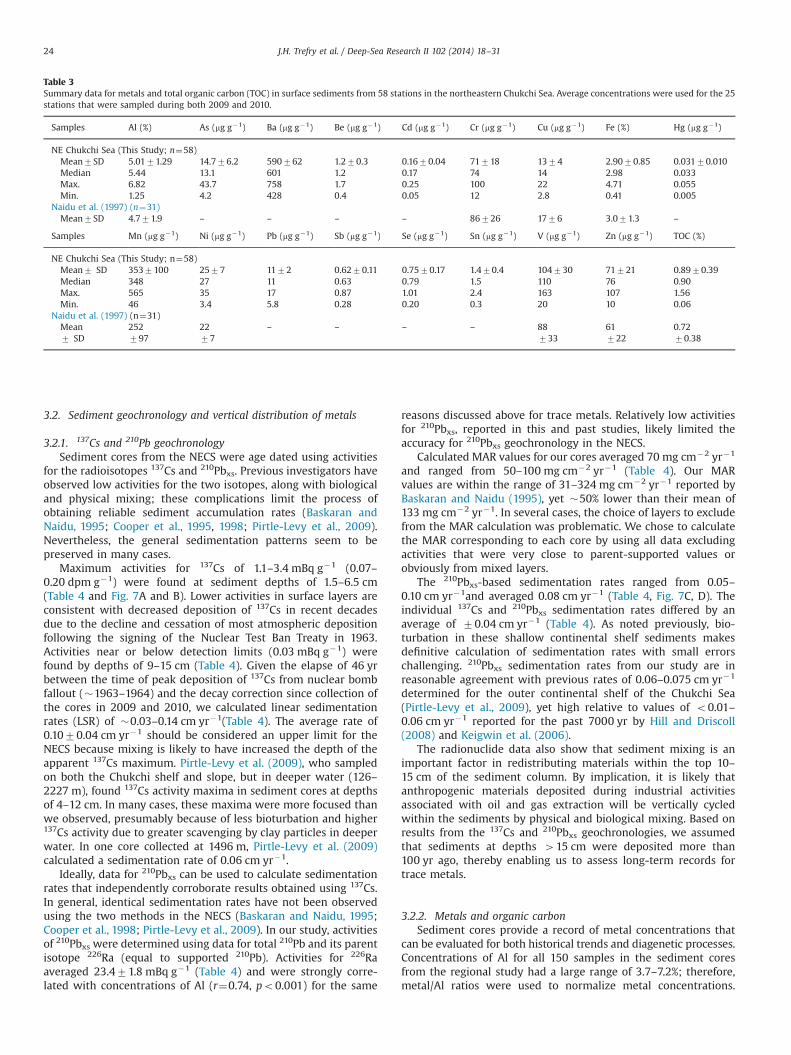
Table 3Summary data for metals and total organic carbon (TOC) in surface sediments from 58 stations in the northeastern Chukchi Sea. Average concentrations were used for the 25stations that were sampled during both 2009 and 2010.
Samples Al (%) As (mg g�1) Ba (mg g�1) Be (mg g�1) Cd (mg g�1) Cr (mg g�1) Cu (mg g�1) Fe (%) Hg (mg g�1)
NE Chukchi Sea (This Study; n¼58)Mean7SD 5.0171.29 14.776.2 590762 1.270.3 0.1670.04 71718 1374 2.9070.85 0.03170.010Median 5.44 13.1 601 1.2 0.17 74 14 2.98 0.033Max. 6.82 43.7 758 1.7 0.25 100 22 4.71 0.055Min. 1.25 4.2 428 0.4 0.05 12 2.8 0.41 0.005
Naidu et al. (1997) (n¼31)Mean7SD 4.771.9 – – – – 86726 1776 3.071.3 –
Samples Mn (mg g�1) Ni (mg g�1) Pb (mg g�1) Sb (mg g�1) Se (mg g�1) Sn (mg g�1) V (mg g�1) Zn (mg g�1) TOC (%)
NE Chukchi Sea (This Study; n¼58)Mean7 SD 3537100 2577 1172 0.6270.11 0.7570.17 1.470.4 104730 71721 0.8970.39Median 348 27 11 0.63 0.79 1.5 110 76 0.90Max. 565 35 17 0.87 1.01 2.4 163 107 1.56Min. 46 3.4 5.8 0.28 0.20 0.3 20 10 0.06
Naidu et al. (1997) (n¼31)Mean 252 22 – – – – 88 61 0.727 SD 797 77 733 722 70.38
J.H. Trefry et al. / Deep-Sea Research II 102 (2014) 18–3124
3.2. Sediment geochronology and vertical distribution of metals
3.2.1. 137Cs and 210Pb geochronologySediment cores from the NECS were age dated using activities
for the radioisotopes 137Cs and 210Pbxs. Previous investigators haveobserved low activities for the two isotopes, along with biologicaland physical mixing; these complications limit the process ofobtaining reliable sediment accumulation rates (Baskaran andNaidu, 1995; Cooper et al., 1995, 1998; Pirtle-Levy et al., 2009).Nevertheless, the general sedimentation patterns seem to bepreserved in many cases.
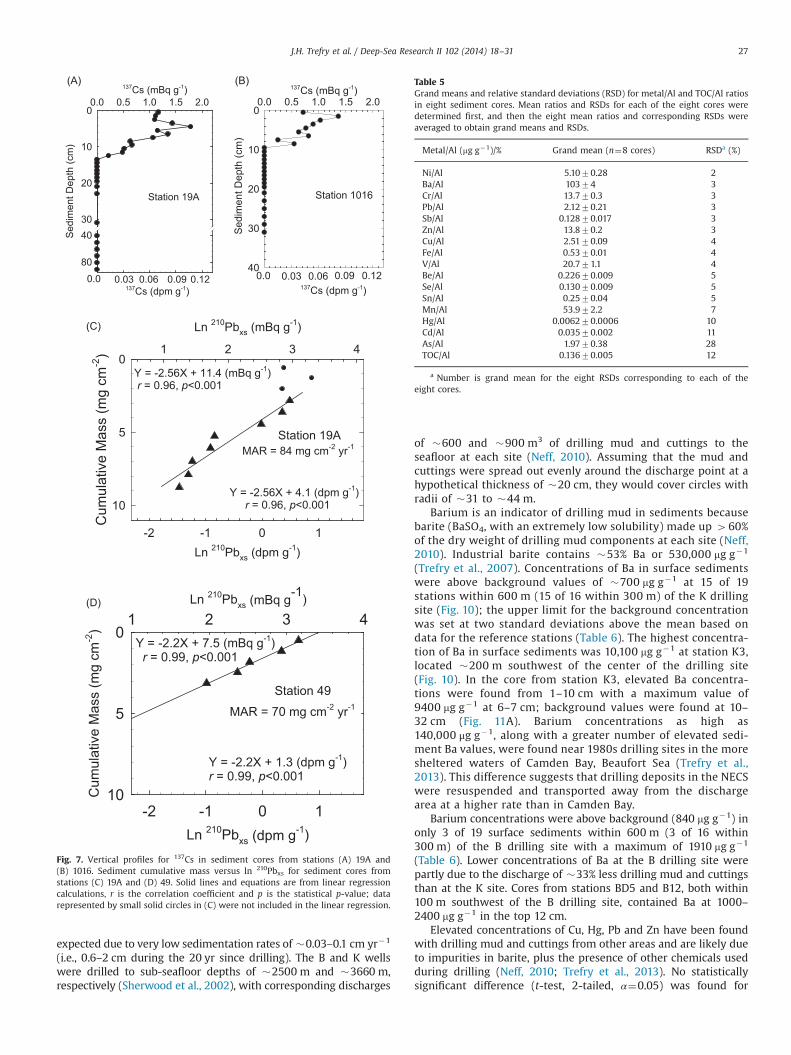
Maximum activities for 137Cs of 1.1–3.4 mBq g�1 (0.07–0.20 dpm g�1) were found at sediment depths of 1.5–6.5 cm(Table 4 and Fig. 7A and B). Lower activities in surface layers areconsistent with decreased deposition of 137Cs in recent decadesdue to the decline and cessation of most atmospheric depositionfollowing the signing of the Nuclear Test Ban Treaty in 1963.Activities near or below detection limits (0.03 mBq g�1) werefound by depths of 9–15 cm (Table 4). Given the elapse of 46 yrbetween the time of peak deposition of 137Cs from nuclear bombfallout (�1963–1964) and the decay correction since collection ofthe cores in 2009 and 2010, we calculated linear sedimentationrates (LSR) of �0.03–0.14 cm yr�1(Table 4). The average rate of0.1070.04 cm yr�1 should be considered an upper limit for theNECS because mixing is likely to have increased the depth of theapparent 137Cs maximum. Pirtle-Levy et al. (2009), who sampledon both the Chukchi shelf and slope, but in deeper water (126–2227 m), found 137Cs activity maxima in sediment cores at depthsof 4–12 cm. In many cases, these maxima were more focused thanwe observed, presumably because of less bioturbation and higher137Cs activity due to greater scavenging by clay particles in deeperwater. In one core collected at 1496 m, Pirtle-Levy et al. (2009)calculated a sedimentation rate of 0.06 cm yr�1.
Ideally, data for 210Pbxs can be used to calculate sedimentationrates that independently corroborate results obtained using 137Cs.In general, identical sedimentation rates have not been observedusing the two methods in the NECS (Baskaran and Naidu, 1995;Cooper et al., 1998; Pirtle-Levy et al., 2009). In our study, activitiesof 210Pbxs were determined using data for total 210Pb and its parentisotope 226Ra (equal to supported 210Pb). Activities for 226Raaveraged 23.471.8 mBq g�1 (Table 4) and were strongly corre-lated with concentrations of Al (r¼0.74, po0.001) for the same
reasons discussed above for trace metals. Relatively low activitiesfor 210Pbxs, reported in this and past studies, likely limited theaccuracy for 210Pbxs geochronology in the NECS.
Calculated MAR values for our cores averaged 70 mg cm�2 yr�1
and ranged from 50–100 mg cm�2 yr�1 (Table 4). Our MARvalues are within the range of 31–324 mg cm�2 yr�1 reported byBaskaran and Naidu (1995), yet �50% lower than their mean of133 mg cm�2 yr�1. In several cases, the choice of layers to excludefrom the MAR calculation was problematic. We chose to calculatethe MAR corresponding to each core by using all data excludingactivities that were very close to parent-supported values orobviously from mixed layers.
The 210Pbxs-based sedimentation rates ranged from 0.05–0.10 cm yr�1and averaged 0.08 cm yr�1 (Table 4, Fig. 7C, D). Theindividual 137Cs and 210Pbxs sedimentation rates differed by anaverage of 70.04 cm yr�1 (Table 4). As noted previously, bio-turbation in these shallow continental shelf sediments makesdefinitive calculation of sedimentation rates with small errorschallenging. 210Pbxs sedimentation rates from our study are inreasonable agreement with previous rates of 0.06–0.075 cm yr�1
determined for the outer continental shelf of the Chukchi Sea(Pirtle-Levy et al., 2009), yet high relative to values of o0.01–0.06 cm yr�1 reported for the past 7000 yr by Hill and Driscoll(2008) and Keigwin et al. (2006).
The radionuclide data also show that sediment mixing is animportant factor in redistributing materials within the top 10–15 cm of the sediment column. By implication, it is likely thatanthropogenic materials deposited during industrial activitiesassociated with oil and gas extraction will be vertically cycledwithin the sediments by physical and biological mixing. Based onresults from the 137Cs and 210Pbxs geochronologies, we assumedthat sediments at depths 415 cm were deposited more than100 yr ago, thereby enabling us to assess long-term records fortrace metals.
3.2.2. Metals and organic carbonSediment cores provide a record of metal concentrations that
can be evaluated for both historical trends and diagenetic processes.Concentrations of Al for all 150 samples in the sediment coresfrom the regional study had a large range of 3.7–7.2%; therefore,metal/Al ratios were used to normalize metal concentrations.

Fig. 5. Concentrations of Al versus (A) Be, (B) Cr, (C) Cu, (D) Ni, (E) Sb, (F) Se, (G) Sn, (H) V, (I) Zn, (J) Cd, (K) Hg and (L) Pb for surface sediments and sediment cores collectedduring 2009 and 2010. Equations and solid lines are from linear regression calculations, dashed lines show 99% prediction intervals, r is the correlation coefficient, n is thenumber of samples and p is the statistical p-value.
J.H. Trefry et al. / Deep-Sea Research II 102 (2014) 18–31 25
Results from all cores collected showed that the relative standarddeviations [RSD¼(standard deviation/mean)�100%] for the grandmeans of metal/Al ratios for 12 metals (Ba, Be, Cr, Cu, Fe, Ni, Pb, Sb,Se, Sn, V and Zn) were small (2–5%; Table 5). We use the RSDhere as an index to determine a 4100-yr baseline for metal/Alratios. For example, high resolution profiles for a 92-cm core(56 samples) from station 19A (location, Fig. 1) show both uniformconcentrations and metal/Al ratios with RSDs of 2–4% for Fe,Ba, Cr and Pb (Fig. 8A–D). Similar uniformity was observed forBe, Cu, Ni, Sb, Se, Sn, V and Zn. Based on 137Cs and 210Pbxsgeochronology, core 19A likely records several centuries of uni-form metal/Al ratios with no detectable anthropogenic inputs ordiagenetic modifications. Although mixing can mute anomaliesfrom anthropogenic or diagenetic inputs, such alterations, if any,must be small to support the low RSDs found. Uniform metal/Alratios also were obtained for the same 12 metals in the other cores(Table 5).
A higher RSD of 10% for Hg/Al ratios was observed (Table 5)due to low Hg concentrations and lower analytical precisionfor Hg. Despite variations of 7–15% in Hg/Al ratios in cores fromthe NECS, no statistically significant vertical trends and no valuesabove background were observed (Fig. 5K). For example, nostatistically significant difference (t-test, p¼0.35) was foundin the Hg/Al ratio for the top of core 19A (0–17 cm, Hg/Al¼0.0055670.00035) versus the bottom of the core (48–92 cm; Hg/Al¼0.0054470.00044; Fig. 8E). The mid-segment ofcore 19A (17–48 cm) had a significantly lower Hg/Al ratio(0.0047370.00036) than either the top or bottom segments ofthe core (po0.001; Fig. 8E). Thus, we concluded that there was nodetectable anthropogenic Hg in recent sediments from theNECS because the anthropogenic flux was too small to alternatural sediment Hg concentrations or fine-grained Hg-bearingparticles were advected northward into deeper waters (Fox et al.,2014).

J.H. Trefry et al. / Deep-Sea Research II 102 (2014) 18–3126
Arsenic enrichment in surface sediments was identified at thefollowing eight stations where the As/Al ratio was 43.5, which ismore than two standard deviations above background (2.570.5):(concentrations of As in parentheses): 8 (27 mg g�1), 27 (26 mg g�1)28 (31 mg g�1), 29 (51 mg g�1), 30 (24 mg g�1), 48 (25 mg g�1), 106(25 mg g�1) and 1010 (44 mg g�1) (Fig. 6A). In the most extremecase at station 29, the As/Al ratio in the top 0.5 cm of sediment was7.6 and the absolute As concentration was 51 mg g�1 (Fig. 9A)relative to the average As concentration of 1576 mg g�1 for allsurface sediments and 1873 μg g�1 for suspended sedimentsin the bottom 20 m of the water column. Furthermore, verticalprofiles for both As and Fe and their ratios to Al show enrichmentin the top 5–6 cm of sediment at station 29 (Fig. 9A and B). Wesuggest that As enrichment at the sediment–water interface waslikely a result of sediment diagenesis that was initiated when Fe(III) oxides and sorbed As dissolved in subsurface sediments underreducing conditions as described in other studies (Farmer and
Fig. 6. Concentrations of Al versus (A) As and (B) Mn for surface sediments andsediment cores collected during 2009 and 2010. Equations and solid lines are fromlinear regression calculations, r is the correlation coefficient, n is the number ofsamples and p is the statistical p-value. Station numbers added for anomalousvalues.
Table 4Data for activities of 137Cs and 210Pb, mass accumulation rates (MAR), linear sedimenChukchi Sea.
Station 137Cs max.(mBq g�1)
Depth 137Csmax. (cm)
137Cs penetrationdepth (cm)
137Cs LSR(cm yr�1)a
M(m
6 1.6 3–4 15 0.08 213 3.4 6–7 10 0.14 319A 1.8 4–5 13 0.10 240 1.1 6–7 10b 0.14 349 2.4 1–6 (3.5)c 10 0.08 21015 2.4 5–6 10b 0.12 21016 1.5 1–2 9 0.03 2
a LSR¼(Depth 137Cs maximum)/(2010–1964 yr), no correction for mixing.b Incomplete profile, activity of 137Cs40.2 mBq g�1 at base of core.c Maximum 137Cs activity was mixed across several sediment layers, mid-point in p
Lovell, 1986; Linge and Oldham, 2002). In this diagenetic mechan-ism, reduced forms of iron (Fe2+) and arsenic (As3+) subsequentlydiffused upward toward oxic surface sediments where they wereoxidized and then coprecipitated with or adsorbed on Fe(III)oxides to create higher As and Fe concentrations in surfacesediments (Chaillou et al., 2003; Farmer and Lovell, 1986; Lingeand Oldham, 2002). Further stratigraphic studies involving ana-lyses of Fe and As in interstitial water and redox potentials couldhelp verify our explanation. Six of the eight stations with As-richsurface sediments clustered in the northeastern segment of thestudy area and the other two stations were located east of HeraldShoal. Future increases in the TOC flux to the sediments mayincrease the magnitude and frequency of As remobilization in theNECS and provide a potential indicator of changing sedimentconditions.
Surface sediments from stations 3, 8, 17, 22 and 34 (Fig. 6B), alongwith sediment in the top 1 cm of the cores from stations 6, 13, 20, 29,37 and 40, contained 30–50% higher Mn concentrations and Mn/Alratios than in baseline sediments or deeper layers in the cores (e.g.,Mn profiles for core 29, Fig. 9C). As discussed for Fe and As, weattribute the Mn enrichment in surface sediments to diageneticmobilization of metals from subsurface suboxic and anoxic layers andoxidative precipitation in surface sediments, a process thoroughlyinvestigated elsewhere (e.g., Lynn and Bonatti, 1965; Trefry andPresley, 1982; Gobeil et al., 1997). The limited occurrence andmagnitude of Mn enrichment in surface layers, as observed in theNECS, has previously been explained by diffusion of Mn2+ fromsediments into overlying bottom water (Trefry and Presley, 1982).
The relatively high variability in Cd/Al ratios (RSD¼11%) can bepartly explained by lower concentrations and analytical precision.In addition, a 20–25% depletion of Cd in surface sediments wasobserved in cores from stations 29 (Fig. 9D) and 19A. Thisdepletion may result from loss of the metal during decompositionof Cd-rich OM in surface sediments as suggested elsewhere (e.g.,Gobeil et al., 1997). All other metals in core 29 showed uniformvertical profiles as shown for Se (Fig. 9E).
Concentrations of TOC in our cores averaged 0.7670.20%(n¼128) and ranged from 0.38–1.21%. Vertical trends for TOCshowed either relatively uniform concentrations with depth (e.g.,station 29, Fig. 9F) or decreasing values with increasing depth (e.g.,station 19A, Fig. 8F). For example, the average concentration ofTOC in the top 18 cm at station 19A (0.9170.08%) was 50% higherthan in the 18–92 cm section of the core (0.6070.08%, Fig. 8F)whereas the RSD for TOC in the core from station 29 was �7%(Fig. 9F).
3.3. Metal enrichment near 1989 exploratory oil and gas drilling sites
Persistence of drilling mud and cuttings near the sedimentsurface at the Burger (B) and Klondike (K) drilling sites was
tation rates (LSR) and supporting data for sediment cores from the northeastern
ax. activity 210PbxsBq g�1)
Activity of 226Ra(mBq g�1)
210Pb MAR(mg cm�2 yr�1)
210Pb LSR(cm yr�1)
4 24.871.2 100 0.103 23.170.8 60 0.067 23.771.0 80 0.100 21.073.2 60 0.064 25.570.8 70 0.100 23.571.0 – –
3 21.871.0 50 0.05
arentheses.
Station 19A
137Cs (mBq g-1)0.0 0.5 1.0 1.5 2.0
Sed
imen
t Dep
th (c
m)
0
10
20
3040
80
137Cs (dpm g-1)0.06 0.120.0 0.03 0.09
Station 1016
137Cs (mBq g-1)0.0 0.5 1.0 1.5 2.0
Sed
imen
t Dep
th (c
m)
0
10
20
30
40
137Cs (dpm g-1)0.06 0.120.0 0.03 0.09
Cum
ulat
ive
Mas
s (m
g cm
-2) 0
5
10
Ln 210Pbxs (dpm g-1)-2 -1 0 1
Ln 210Pbxs (mBq g-1)
1 2 3 4
Y = -2.56X + 11.4 (mBq g-1)r = 0.96, p<0.001
Y = -2.56X + 4.1 (dpm g-1)r = 0.96, p<0.001
MAR = 84 mg cm-2 yr-1Station 19A
Cum
ulat
ive
Mas
s (m
g cm
-2) 0
5
10
Ln 210Pbxs (dpm g-1)-2 -1 0 1
Ln 210Pbxs (mBq g-1)1 2 3 4
Y = -2.2X + 7.5 (mBq g-1) r = 0.99, p<0.001
Y = -2.2X + 1.3 (dpm g-1)r = 0.99, p<0.001
Station 49
MAR = 70 mg cm-2 yr-1
Fig. 7. Vertical profiles for 137Cs in sediment cores from stations (A) 19A and(B) 1016. Sediment cumulative mass versus ln 210Pbxs for sediment cores fromstations (C) 19A and (D) 49. Solid lines and equations are from linear regressioncalculations, r is the correlation coefficient and p is the statistical p-value; datarepresented by small solid circles in (C) were not included in the linear regression.
Table 5Grand means and relative standard deviations (RSD) for metal/Al and TOC/Al ratiosin eight sediment cores. Mean ratios and RSDs for each of the eight cores weredetermined first, and then the eight mean ratios and corresponding RSDs wereaveraged to obtain grand means and RSDs.
Metal/Al (mg g�1)/% Grand mean (n¼8 cores) RSDa (%)
Ni/Al 5.1070.28 2Ba/Al 10374 3Cr/Al 13.770.3 3Pb/Al 2.1270.21 3Sb/Al 0.12870.017 3Zn/Al 13.870.2 3Cu/Al 2.5170.09 4Fe/Al 0.5370.01 4V/Al 20.771.1 4Be/Al 0.22670.009 5Se/Al 0.13070.009 5Sn/Al 0.2570.04 5Mn/Al 53.972.2 7Hg/Al 0.006270.0006 10Cd/Al 0.03570.002 11As/Al 1.9770.38 28TOC/Al 0.13670.005 12
a Number is grand mean for the eight RSDs corresponding to each of theeight cores.
J.H. Trefry et al. / Deep-Sea Research II 102 (2014) 18–31 27
expected due to very low sedimentation rates of �0.03–0.1 cm yr�1
(i.e., 0.6–2 cm during the 20 yr since drilling). The B and K wellswere drilled to sub-seafloor depths of �2500 m and �3660 m,respectively (Sherwood et al., 2002), with corresponding discharges
of �600 and �900 m3 of drilling mud and cuttings to theseafloor at each site (Neff, 2010). Assuming that the mud andcuttings were spread out evenly around the discharge point at ahypothetical thickness of �20 cm, they would cover circles withradii of �31 to �44 m.
Barium is an indicator of drilling mud in sediments becausebarite (BaSO4, with an extremely low solubility) made up 460%of the dry weight of drilling mud components at each site (Neff,2010). Industrial barite contains �53% Ba or 530,000 mg g�1
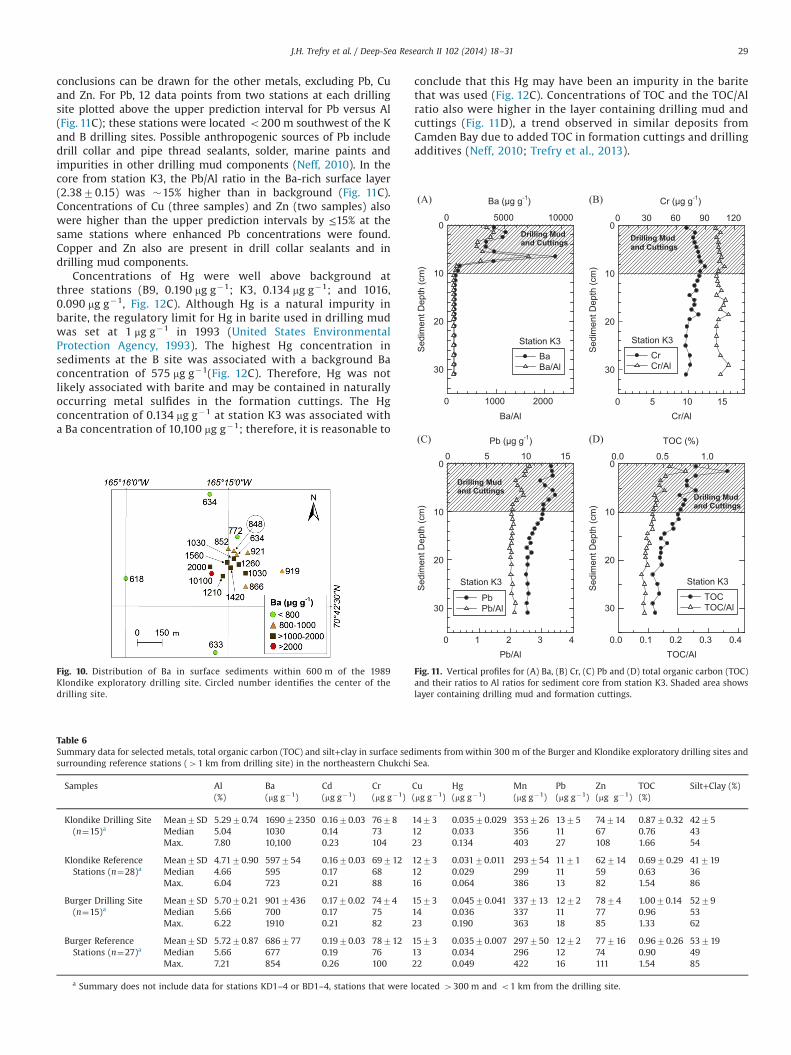
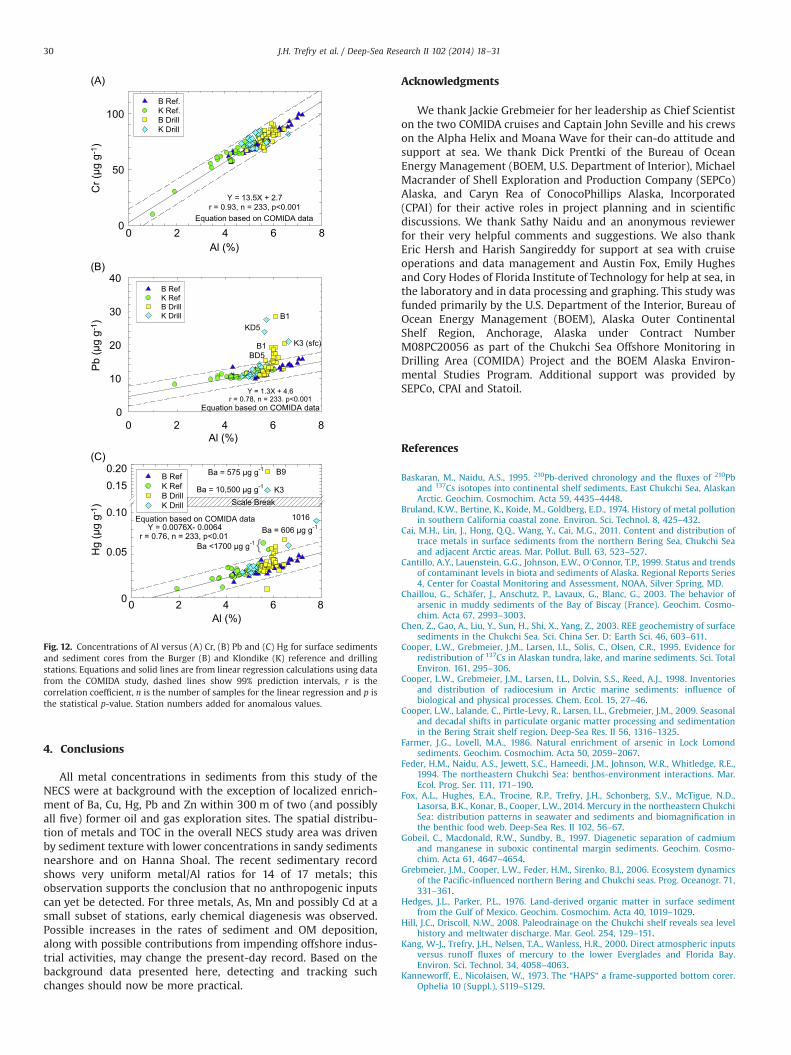
(Trefry et al., 2007). Concentrations of Ba in surface sedimentswere above background values of �700 mg g�1 at 15 of 19stations within 600 m (15 of 16 within 300 m) of the K drillingsite (Fig. 10); the upper limit for the background concentrationwas set at two standard deviations above the mean based ondata for the reference stations (Table 6). The highest concentra-tion of Ba in surface sediments was 10,100 mg g�1 at station K3,located �200 m southwest of the center of the drilling site(Fig. 10). In the core from station K3, elevated Ba concentra-tions were found from 1–10 cm with a maximum value of9400 mg g�1 at 6–7 cm; background values were found at 10–32 cm (Fig. 11A). Barium concentrations as high as140,000 μg g�1, along with a greater number of elevated sedi-ment Ba values, were found near 1980s drilling sites in the moresheltered waters of Camden Bay, Beaufort Sea (Trefry et al.,2013). This difference suggests that drilling deposits in the NECSwere resuspended and transported away from the dischargearea at a higher rate than in Camden Bay.
Barium concentrations were above background (840 mg g�1) inonly 3 of 19 surface sediments within 600 m (3 of 16 within300 m) of the B drilling site with a maximum of 1910 mg g�1
(Table 6). Lower concentrations of Ba at the B drilling site werepartly due to the discharge of �33% less drilling mud and cuttingsthan at the K site. Cores from stations BD5 and B12, both within100 m southwest of the B drilling site, contained Ba at 1000–2400 mg g�1 in the top 12 cm.
Elevated concentrations of Cu, Hg, Pb and Zn have been foundwith drilling mud and cuttings from other areas and are likely dueto impurities in barite, plus the presence of other chemicals usedduring drilling (Neff, 2010; Trefry et al., 2013). No statisticallysignificant difference (t-test, 2-tailed, α¼0.05) was found for

Fig. 8. Vertical profiles for metals and metal/Al ratios for (A) Fe, (B) Ba, (C) Cr,(D) Pb, (E) Hg and (F) TOC for sediment core from station 19A. Vertical lines showthe average value for the metal/Al ratio with corresponding mean and standarddeviation. Shaded rectangle shows likely range of depths that correspond to asediment age of �1950 with minimum at 6 cm [(2010 yr –1950 yr) x 0.1 cm yr�1)]and maximum at the 137Cs penetration depth of 13 cm.
Fig. 9. Vertical profiles for (A) As, (B) Fe, (C) Mn, (D) Cd, (E) Se and (F) total organiccarbon (TOC) in sediment core from station 29. Vertical lines show average valuefor the metal/Al ratio with corresponding mean and standard deviation.
J.H. Trefry et al. / Deep-Sea Research II 102 (2014) 18–3128
concentrations of Al in sediments from reference stations relativeto samples collected within 300 m of the B drilling site. Likewise,no statistically significant differences were observed for concen-trations of Cd, Cr, Cu, Fe, Hg, Mn, Pb, Zn or TOC in sediments fromthe reference stations versus samples collected within 300 m ofthe B drilling site. For the K drilling site, a statistically significantdifference was found for concentrations of Al in sediments fromreference versus drilling stations; so, t-tests were carried out usingmetal/Al ratios. However, no statistically significant differenceswere found in metal/Al ratios for Cd, Cr, Cu, Hg, Mn, Pb, Zn or TOC
in sediments from the reference stations versus samples collectedwithin 300 m of the K drilling site.
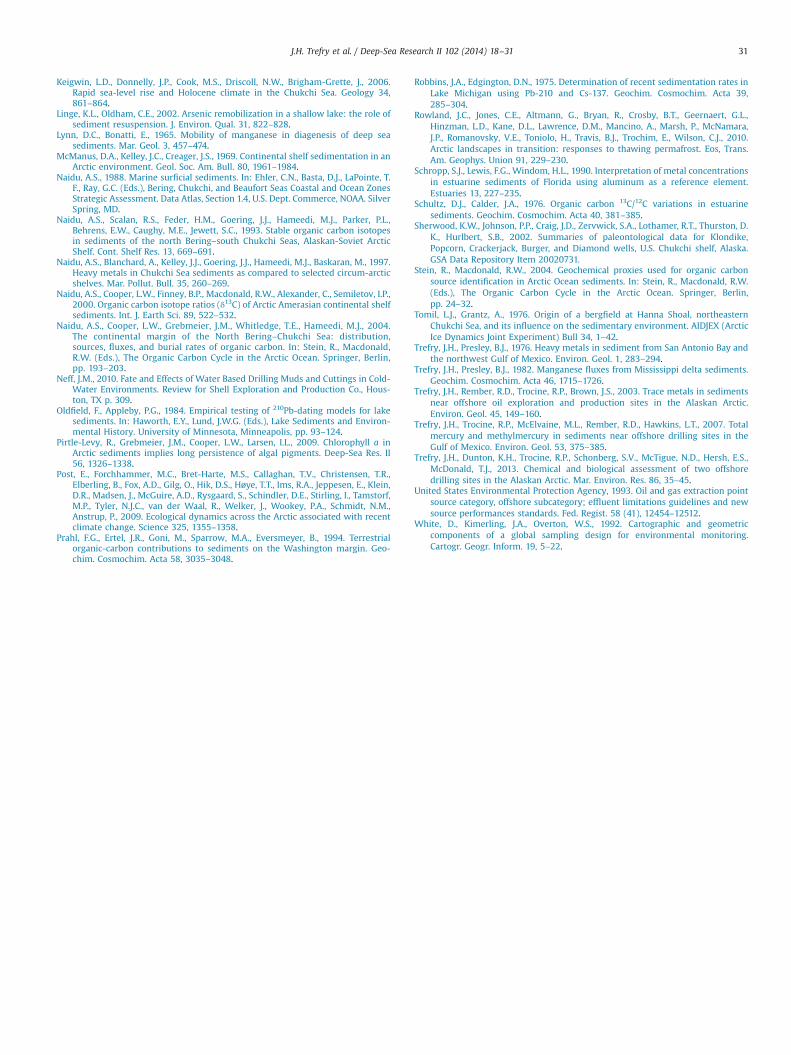
Even though no statistically significant differences were foundfor metal concentrations in sediments from all reference versus alldrilling stations, excluding Ba, concentrations of several metals, inaddition to Ba, were above background at one or more stations ateach drilling site based on results from metal versus Al correla-tions. All concentrations of Cr from the B and K sites plotted withinthe 99% prediction interval established for the NECS and thereforewere not considered to be above background (Fig. 12A). Likewise,Cr concentrations and Cr/Al ratios were uniform throughout thecore from station K3 (Fig. 11B) and at other stations. Similar
J.H. Trefry et al. / Deep-Sea Research II 102 (2014) 18–31 29
conclusions can be drawn for the other metals, excluding Pb, Cuand Zn. For Pb, 12 data points from two stations at each drillingsite plotted above the upper prediction interval for Pb versus Al(Fig. 11C); these stations were located o200 m southwest of the Kand B drilling sites. Possible anthropogenic sources of Pb includedrill collar and pipe thread sealants, solder, marine paints andimpurities in other drilling mud components (Neff, 2010). In thecore from station K3, the Pb/Al ratio in the Ba-rich surface layer(2.3870.15) was �15% higher than in background (Fig. 11C).Concentrations of Cu (three samples) and Zn (two samples) alsowere higher than the upper prediction intervals by ≤15% at thesame stations where enhanced Pb concentrations were found.Copper and Zn also are present in drill collar sealants and indrilling mud components.
Concentrations of Hg were well above background atthree stations (B9, 0.190 mg g�1; K3, 0.134 mg g�1; and 1016,0.090 mg g�1, Fig. 12C). Although Hg is a natural impurity inbarite, the regulatory limit for Hg in barite used in drilling mudwas set at 1 μg g�1 in 1993 (United States EnvironmentalProtection Agency, 1993). The highest Hg concentration insediments at the B site was associated with a background Baconcentration of 575 mg g�1(Fig. 12C). Therefore, Hg was notlikely associated with barite and may be contained in naturallyoccurring metal sulfides in the formation cuttings. The Hgconcentration of 0.134 mg g�1 at station K3 was associated witha Ba concentration of 10,100 mg g�1; therefore, it is reasonable to
Fig. 10. Distribution of Ba in surface sediments within 600 m of the 1989Klondike exploratory drilling site. Circled number identifies the center of thedrilling site.
Table 6Summary data for selected metals, total organic carbon (TOC) and silt+clay in surface sedsurrounding reference stations (41 km from drilling site) in the northeastern Chukchi
Samples Al(%)
Ba(mg g�1)
Cd(mg g�1)
Cr(mg g�1)
Klondike Drilling Site(n¼15)a
Mean7SD 5.2970.74 169072350 0.1670.03 7678Median 5.04 1030 0.14 73Max. 7.80 10,100 0.23 104
Klondike ReferenceStations (n¼28)a
Mean7SD 4.7170.90 597754 0.1670.03 69712Median 4.66 595 0.17 68Max. 6.04 723 0.21 88
Burger Drilling Site(n¼15)a
Mean7SD 5.7070.21 9017436 0.1770.02 7474Median 5.66 700 0.17 75Max. 6.22 1910 0.21 82
Burger ReferenceStations (n¼27)a
Mean7SD 5.7270.87 686777 0.1970.03 78712Median 5.66 677 0.19 76Max. 7.21 854 0.26 100
a Summary does not include data for stations KD1–4 or BD1–4, stations that were l
conclude that this Hg may have been an impurity in the baritethat was used (Fig. 12C). Concentrations of TOC and the TOC/Alratio also were higher in the layer containing drilling mud andcuttings (Fig. 11D), a trend observed in similar deposits fromCamden Bay due to added TOC in formation cuttings and drillingadditives (Neff, 2010; Trefry et al., 2013).
iments fromwithin 300 m of the Burger and Klondike exploratory drilling sites andSea.
Cu(mg g�1)
Hg(mg g�1)
Mn(mg g�1)
Pb(mg g�1)
Zn(mg g�1)
TOC(%)
Silt+Clay (%)
1473 0.03570.029 353726 1375 74714 0.8770.32 427512 0.033 356 11 67 0.76 4323 0.134 403 27 108 1.66 54
1273 0.03170.011 293754 1171 62714 0.6970.29 4171912 0.029 299 11 59 0.63 3616 0.064 386 13 82 1.54 86
1573 0.04570.041 337713 1272 7874 1.0070.14 527914 0.036 337 11 77 0.96 5323 0.190 363 18 85 1.33 62
1573 0.03570.007 297750 1272 77716 0.9670.26 5371913 0.034 296 12 74 0.90 4922 0.049 422 16 111 1.54 85
ocated 4300 m and o1 km from the drilling site.
Fig. 11. Vertical profiles for (A) Ba, (B) Cr, (C) Pb and (D) total organic carbon (TOC)and their ratios to Al ratios for sediment core from station K3. Shaded area showslayer containing drilling mud and formation cuttings.
Al (%)0 2 4 6 8
0
50
100B Ref.K Ref.B DrillK Drill
Y = 13.5X + 2.7r = 0.93, n = 233, p<0.001
Equation based on COMIDA data
Al (%)0 2 4 6 8
0
10
20
30
40B RefK RefB DrillK Drill
Y = 1.3X + 4.6r = 0.78, n = 233. p<0.001
KD5
BD5
B1
K3 (sfc)B1
Equation based on COMIDA data
Al (%)0 2 4 6 8
Hg
(µg
g-1 )
Pb
(µg
g-1 )
Cr (
µg g
-1)
B RefK Ref B DrillK Drill
Y = 0.0076X- 0.0064r = 0.76, n = 233, p<0.01
Scale Break
Equation based on COMIDA data
K3
B9
1016
0.05
0.10
0.150.20
0
Ba = 575 µg g-1
Ba = 10,500 µg g-1
Ba = 606 µg g-1
Ba <1700 µg g-1 {
Fig. 12. Concentrations of Al versus (A) Cr, (B) Pb and (C) Hg for surface sedimentsand sediment cores from the Burger (B) and Klondike (K) reference and drillingstations. Equations and solid lines are from linear regression calculations using datafrom the COMIDA study, dashed lines show 99% prediction intervals, r is thecorrelation coefficient, n is the number of samples for the linear regression and p isthe statistical p-value. Station numbers added for anomalous values.
J.H. Trefry et al. / Deep-Sea Research II 102 (2014) 18–3130
4. Conclusions
All metal concentrations in sediments from this study of theNECS were at background with the exception of localized enrich-ment of Ba, Cu, Hg, Pb and Zn within 300 m of two (and possiblyall five) former oil and gas exploration sites. The spatial distribu-tion of metals and TOC in the overall NECS study area was drivenby sediment texture with lower concentrations in sandy sedimentsnearshore and on Hanna Shoal. The recent sedimentary recordshows very uniform metal/Al ratios for 14 of 17 metals; thisobservation supports the conclusion that no anthropogenic inputscan yet be detected. For three metals, As, Mn and possibly Cd at asmall subset of stations, early chemical diagenesis was observed.Possible increases in the rates of sediment and OM deposition,along with possible contributions from impending offshore indus-trial activities, may change the present-day record. Based on thebackground data presented here, detecting and tracking suchchanges should now be more practical.
Acknowledgments
We thank Jackie Grebmeier for her leadership as Chief Scientiston the two COMIDA cruises and Captain John Seville and his crewson the Alpha Helix and Moana Wave for their can-do attitude andsupport at sea. We thank Dick Prentki of the Bureau of OceanEnergy Management (BOEM, U.S. Department of Interior), MichaelMacrander of Shell Exploration and Production Company (SEPCo)Alaska, and Caryn Rea of ConocoPhillips Alaska, Incorporated(CPAI) for their active roles in project planning and in scientificdiscussions. We thank Sathy Naidu and an anonymous reviewerfor their very helpful comments and suggestions. We also thankEric Hersh and Harish Sangireddy for support at sea with cruiseoperations and data management and Austin Fox, Emily Hughesand Cory Hodes of Florida Institute of Technology for help at sea, inthe laboratory and in data processing and graphing. This study wasfunded primarily by the U.S. Department of the Interior, Bureau ofOcean Energy Management (BOEM), Alaska Outer ContinentalShelf Region, Anchorage, Alaska under Contract NumberM08PC20056 as part of the Chukchi Sea Offshore Monitoring inDrilling Area (COMIDA) Project and the BOEM Alaska Environ-mental Studies Program. Additional support was provided bySEPCo, CPAI and Statoil.
References
Baskaran, M., Naidu, A.S., 1995. 210Pb-derived chronology and the fluxes of 210Pband 137Cs isotopes into continental shelf sediments, East Chukchi Sea, AlaskanArctic. Geochim. Cosmochim. Acta 59, 4435–4448.
Bruland, K.W., Bertine, K., Koide, M., Goldberg, E.D., 1974. History of metal pollutionin southern California coastal zone. Environ. Sci. Technol. 8, 425–432.
Cai, M.H., Lin, J., Hong, Q.Q., Wang, Y., Cai, M.G., 2011. Content and distribution oftrace metals in surface sediments from the northern Bering Sea, Chukchi Seaand adjacent Arctic areas. Mar. Pollut. Bull. 63, 523–527.
Cantillo, A.Y., Lauenstein, G.G., Johnson, E.W., O′Connor, T.P., 1999. Status and trendsof contaminant levels in biota and sediments of Alaska. Regional Reports Series4, Center for Coastal Monitoring and Assessment, NOAA, Silver Spring, MD.
Chaillou, G., Schäfer, J., Anschutz, P., Lavaux, G., Blanc, G., 2003. The behavior ofarsenic in muddy sediments of the Bay of Biscay (France). Geochim. Cosmo-chim. Acta 67, 2993–3003.
Chen, Z., Gao, A., Liu, Y., Sun, H., Shi, X., Yang, Z., 2003. REE geochemistry of surfacesediments in the Chukchi Sea. Sci. China Ser. D: Earth Sci. 46, 603–611.
Cooper, L.W., Grebmeier, J.M., Larsen, I.L., Solis, C., Olsen, C.R., 1995. Evidence forredistribution of 137Cs in Alaskan tundra, lake, and marine sediments. Sci. TotalEnviron. 161, 295–306.
Cooper, L.W., Grebmeier, J.M., Larsen, I.L., Dolvin, S.S., Reed, A.J., 1998. Inventoriesand distribution of radiocesium in Arctic marine sediments: influence ofbiological and physical processes. Chem. Ecol. 15, 27–46.
Cooper, L.W., Lalande, C., Pirtle-Levy, R., Larsen, I.L., Grebmeier, J.M., 2009. Seasonaland decadal shifts in particulate organic matter processing and sedimentationin the Bering Strait shelf region. Deep-Sea Res. II 56, 1316–1325.
Farmer, J.G., Lovell, M.A., 1986. Natural enrichment of arsenic in Lock Lomondsediments. Geochim. Cosmochim. Acta 50, 2059–2067.
Feder, H.M., Naidu, A.S., Jewett, S.C., Hameedi, J.M., Johnson, W.R., Whitledge, R.E.,1994. The northeastern Chukchi Sea: benthos-environment interactions. Mar.Ecol. Prog. Ser. 111, 171–190.
Fox, A.L., Hughes, E.A., Trocine, R.P., Trefry, J.H., Schonberg, S.V., McTigue, N.D.,Lasorsa, B.K., Konar, B., Cooper, L.W., 2014. Mercury in the northeastern ChukchiSea: distribution patterns in seawater and sediments and biomagnification inthe benthic food web. Deep-Sea Res. II 102, 56–67.
Gobeil, C., Macdonald, R.W., Sundby, B., 1997. Diagenetic separation of cadmiumand manganese in suboxic continental margin sediments. Geochim. Cosmo-chim. Acta 61, 4647–4654.
Grebmeier, J.M., Cooper, L.W., Feder, H.M., Sirenko, B.I., 2006. Ecosystem dynamicsof the Pacific-influenced northern Bering and Chukchi seas. Prog. Oceanogr. 71,331–361.
Hedges, J.L., Parker, P.L., 1976. Land-derived organic matter in surface sedimentfrom the Gulf of Mexico. Geochim. Cosmochim. Acta 40, 1019–1029.
Hill, J.C., Driscoll, N.W., 2008. Paleodrainage on the Chukchi shelf reveals sea levelhistory and meltwater discharge. Mar. Geol. 254, 129–151.
Kang, W-J., Trefry, J.H., Nelsen, T.A., Wanless, H.R., 2000. Direct atmospheric inputsversus runoff fluxes of mercury to the lower Everglades and Florida Bay.Environ. Sci. Technol. 34, 4058–4063.
Kanneworff, E., Nicolaisen, W., 1973. The “HAPS“ a frame-supported bottom corer.Ophelia 10 (Suppl.), S119–S129.
J.H. Trefry et al. / Deep-Sea Research II 102 (2014) 18–31 31
Keigwin, L.D., Donnelly, J.P., Cook, M.S., Driscoll, N.W., Brigham-Grette, J., 2006.Rapid sea-level rise and Holocene climate in the Chukchi Sea. Geology 34,861–864.
Linge, K.L., Oldham, C.E., 2002. Arsenic remobilization in a shallow lake: the role ofsediment resuspension. J. Environ. Qual. 31, 822–828.
Lynn, D.C., Bonatti, E., 1965. Mobility of manganese in diagenesis of deep seasediments. Mar. Geol. 3, 457–474.
McManus, D.A., Kelley, J.C., Creager, J.S., 1969. Continental shelf sedimentation in anArctic environment. Geol. Soc. Am. Bull. 80, 1961–1984.
Naidu, A.S., 1988. Marine surficial sediments. In: Ehler, C.N., Basta, D.J., LaPointe, T.F., Ray, G.C. (Eds.), Bering, Chukchi, and Beaufort Seas Coastal and Ocean ZonesStrategic Assessment. Data Atlas, Section 1.4, U.S. Dept. Commerce, NOAA. SilverSpring, MD.
Naidu, A.S., Scalan, R.S., Feder, H.M., Goering, J.J., Hameedi, M.J., Parker, P.L.,Behrens, E.W., Caughy, M.E., Jewett, S.C., 1993. Stable organic carbon isotopesin sediments of the north Bering–south Chukchi Seas, Alaskan-Soviet ArcticShelf. Cont. Shelf Res. 13, 669–691.
Naidu, A.S., Blanchard, A., Kelley, J.J., Goering, J.J., Hameedi, M.J., Baskaran, M., 1997.Heavy metals in Chukchi Sea sediments as compared to selected circum-arcticshelves. Mar. Pollut. Bull. 35, 260–269.
Naidu, A.S., Cooper, L.W., Finney, B.P., Macdonald, R.W., Alexander, C., Semiletov, I.P.,2000. Organic carbon isotope ratios (δ13C) of Arctic Amerasian continental shelfsediments. Int. J. Earth Sci. 89, 522–532.
Naidu, A.S., Cooper, L.W., Grebmeier, J.M., Whitledge, T.E., Hameedi, M.J., 2004.The continental margin of the North Bering–Chukchi Sea: distribution,sources, fluxes, and burial rates of organic carbon. In: Stein, R., Macdonald,R.W. (Eds.), The Organic Carbon Cycle in the Arctic Ocean. Springer, Berlin,pp. 193–203.
Neff, J.M., 2010. Fate and Effects of Water Based Drilling Muds and Cuttings in Cold-Water Environments. Review for Shell Exploration and Production Co., Hous-ton, TX p. 309.
Oldfield, F., Appleby, P.G., 1984. Empirical testing of 210Pb-dating models for lakesediments. In: Haworth, E.Y., Lund, J.W.G. (Eds.), Lake Sediments and Environ-mental History. University of Minnesota, Minneapolis, pp. 93–124.
Pirtle-Levy, R., Grebmeier, J.M., Cooper, L.W., Larsen, I.L., 2009. Chlorophyll a inArctic sediments implies long persistence of algal pigments. Deep-Sea Res. II56, 1326–1338.
Post, E., Forchhammer, M.C., Bret-Harte, M.S., Callaghan, T.V., Christensen, T.R.,Elberling, B., Fox, A.D., Gilg, O., Hik, D.S., Høye, T.T., Ims, R.A., Jeppesen, E., Klein,D.R., Madsen, J., McGuire, A.D., Rysgaard, S., Schindler, D.E., Stirling, I., Tamstorf,M.P., Tyler, N.J.C., van der Waal, R., Welker, J., Wookey, P.A., Schmidt, N.M.,Anstrup, P., 2009. Ecological dynamics across the Arctic associated with recentclimate change. Science 325, 1355–1358.
Prahl, F.G., Ertel, J.R., Goni, M., Sparrow, M.A., Eversmeyer, B., 1994. Terrestrialorganic-carbon contributions to sediments on the Washington margin. Geo-chim. Cosmochim. Acta 58, 3035–3048.
Robbins, J.A., Edgington, D.N., 1975. Determination of recent sedimentation rates inLake Michigan using Pb-210 and Cs-137. Geochim. Cosmochim. Acta 39,285–304.
Rowland, J.C., Jones, C.E., Altmann, G., Bryan, R., Crosby, B.T., Geernaert, G.L.,Hinzman, L.D., Kane, D.L., Lawrence, D.M., Mancino, A., Marsh, P., McNamara,J.P., Romanovsky, V.E., Toniolo, H., Travis, B.J., Trochim, E., Wilson, C.J., 2010.Arctic landscapes in transition: responses to thawing permafrost. Eos, Trans.Am. Geophys. Union 91, 229–230.
Schropp, S.J., Lewis, F.G., Windom, H.L., 1990. Interpretation of metal concentrationsin estuarine sediments of Florida using aluminum as a reference element.Estuaries 13, 227–235.
Schultz, D.J., Calder, J.A., 1976. Organic carbon 13C/12C variations in estuarinesediments. Geochim. Cosmochim. Acta 40, 381–385.
Sherwood, K.W., Johnson, P.P., Craig, J.D., Zervwick, S.A., Lothamer, R.T., Thurston, D.K., Hurlbert, S.B., 2002. Summaries of paleontological data for Klondike,Popcorn, Crackerjack, Burger, and Diamond wells, U.S. Chukchi shelf, Alaska.GSA Data Repository Item 20020731.
Stein, R., Macdonald, R.W., 2004. Geochemical proxies used for organic carbonsource identification in Arctic Ocean sediments. In: Stein, R., Macdonald, R.W.(Eds.), The Organic Carbon Cycle in the Arctic Ocean. Springer, Berlin,pp. 24–32.
Tomil, L.J., Grantz, A., 1976. Origin of a bergfield at Hanna Shoal, northeasternChukchi Sea, and its influence on the sedimentary environment. AIDJEX (ArcticIce Dynamics Joint Experiment) Bull 34, 1–42.
Trefry, J.H., Presley, B.J., 1976. Heavy metals in sediment from San Antonio Bay andthe northwest Gulf of Mexico. Environ. Geol. 1, 283–294.
Trefry, J.H., Presley, B.J., 1982. Manganese fluxes from Mississippi delta sediments.Geochim. Cosmochim. Acta 46, 1715–1726.
Trefry, J.H., Rember, R.D., Trocine, R.P., Brown, J.S., 2003. Trace metals in sedimentsnear offshore oil exploration and production sites in the Alaskan Arctic.Environ. Geol. 45, 149–160.
Trefry, J.H., Trocine, R.P., McElvaine, M.L., Rember, R.D., Hawkins, L.T., 2007. Totalmercury and methylmercury in sediments near offshore drilling sites in theGulf of Mexico. Environ. Geol. 53, 375–385.
Trefry, J.H., Dunton, K.H., Trocine, R.P., Schonberg, S.V., McTigue, N.D., Hersh, E.S.,McDonald, T.J., 2013. Chemical and biological assessment of two offshoredrilling sites in the Alaskan Arctic. Mar. Environ. Res. 86, 35–45.
United States Environmental Protection Agency, 1993. Oil and gas extraction pointsource category, offshore subcategory; effluent limitations guidelines and newsource performances standards. Fed. Regist. 58 (41), 12454–12512.
White, D., Kimerling, J.A., Overton, W.S., 1992. Cartographic and geometriccomponents of a global sampling design for environmental monitoring.Cartogr. Geogr. Inform. 19, 5–22.