shell 2012 beaufort and chukchi seas exploratory drilling
TRANSCRIPT

1
Shell’s Alaska Venture
Program Update – Open Water
Meeting
March 7, 2012

2
Agenda
Presentation Materials
� Proposed operations for 2012
� Proposed monitoring program overview
� Details of select aspects of monitoring program
� MMO programs
� Acoustics
� Sound Source Characterization – vessel strategy
� Real time Sound Source Characterization
� Optimal placement of arrays
� Aerial
� Beaufort
� Chukchi
� Power analyses Beaufort / Chukchi
� Peer review questions
Q&A
Discussion of Comprehensive Report

3
Chukchi and Beaufort Seas
Burger to Barrow 140 miles
Burger to Wainwright 78 miles
Burger to Point Lay 92 miles
Burger to Point Hope 206 miles Kaktovik to Topedo 55 miles
Nuiqsut to Sivulliq 118 miles
Barrow to Sivulliq 256 miles
Burger
TorpedoSivulliq
4
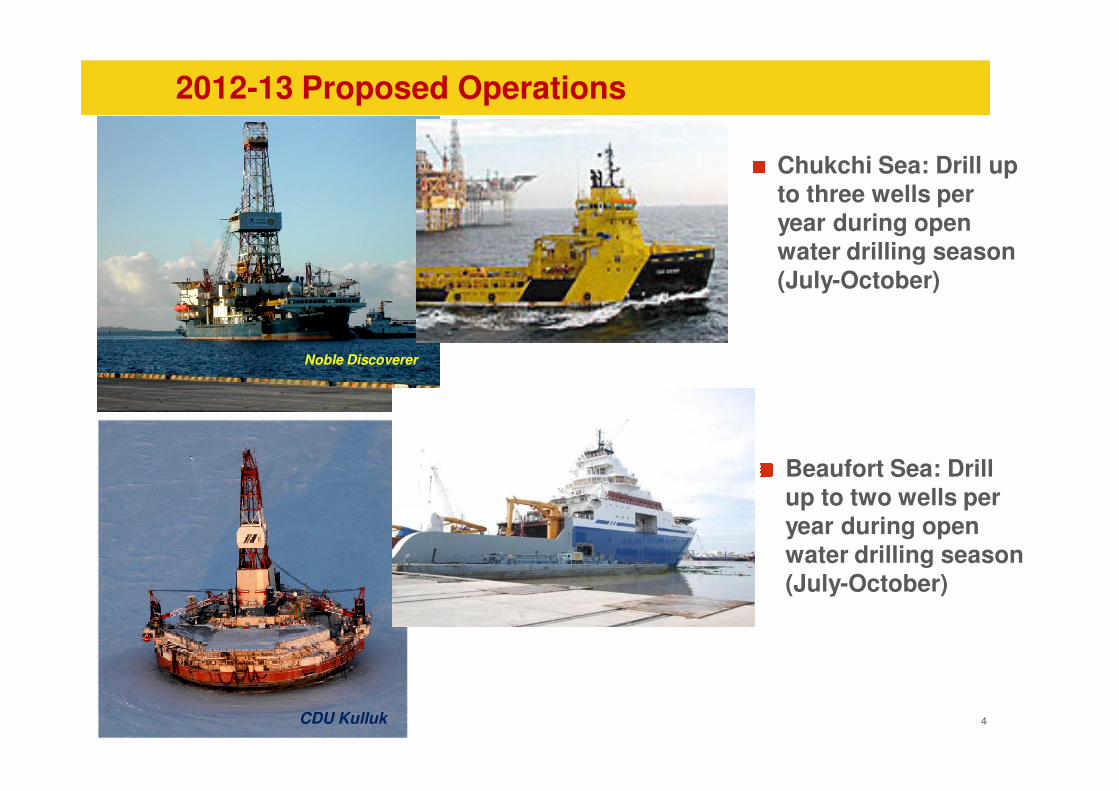
2012-13 Proposed Operations
Chukchi Sea: Drill up
to three wells per year during open
water drilling season (July-October)
Noble Discoverer
CDU Kulluk
Beaufort Sea: Drill
up to two wells per
year during open
water drilling season
(July-October)

5
2012-13 Science Program
Joint Industry
Program
Offshore ecological
studies
Mammal Monitoring
Program
Ice & Metocean
Buoys
On-shore and Near
shore ecological
studies (continued
from 2010 and 2011)
Drilling Monitoring

6
Fleet Overview
AffinityFuel Supply
&
CSR Tanker
Arctic Challenger &
TugContainmt System
2 x Cargo Barge & TugSupply & Waste Storage
Harvey HaulerSupply Vessel / Waste
Klamath & Tug
Spill Recovery
NanuqSpill Recovery &
Accommodation v/l
Harvey SpritSupply Vessel
Harvey Explorer
Supply Vessel
Endeavor / Pt Oliktok
Spill RecoveryBarge & Tug
FennicaPrimary Ice Management Vessel
AiviqAHTS & Secondary Ice Managmt
Arctic SealLanding Craft
Kulluk
BARROW
DEADHORSE
POINT HOPE
NOME
WAINWRIGHT
Tor VikingAHTS & Secondary Ice Managmt
NordicaPrimary Ice Management Vessel
Discoverer
Landing Craft
25 mi. Exclusion Zone
7
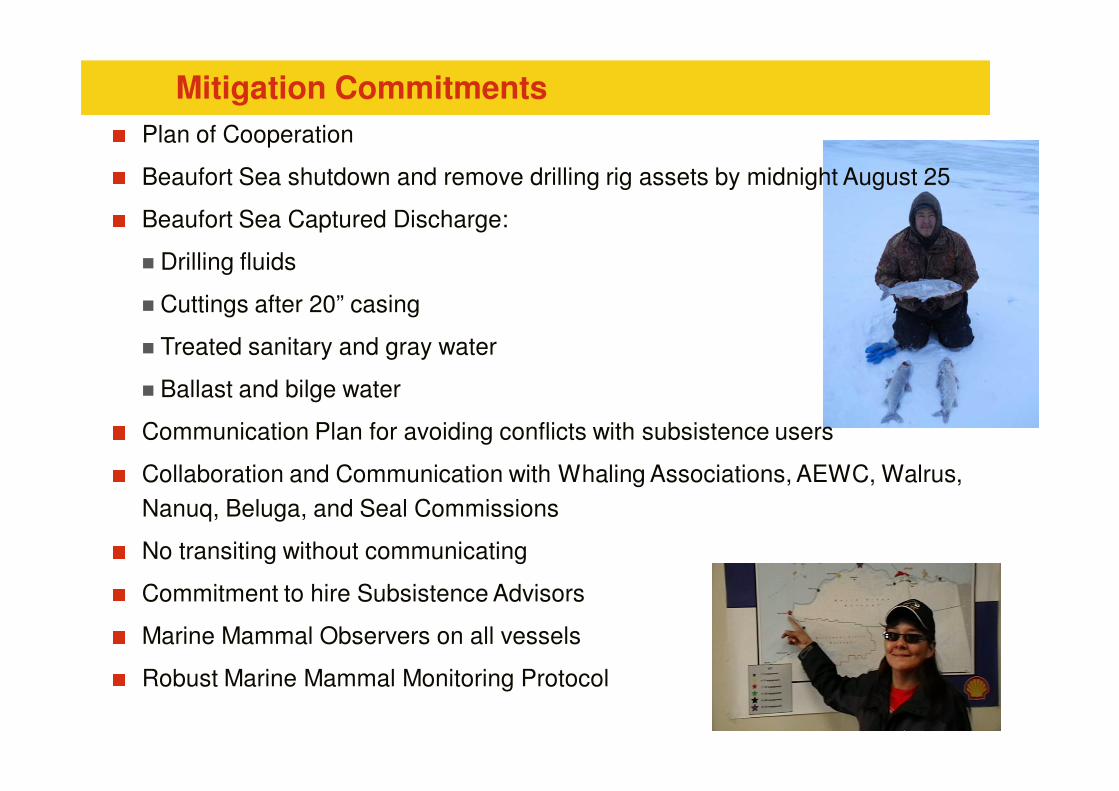
Mitigation Commitments
Plan of Cooperation
Beaufort Sea shutdown and remove drilling rig assets by midnight August 25
Beaufort Sea Captured Discharge:
� Drilling fluids
� Cuttings after 20” casing
� Treated sanitary and gray water
� Ballast and bilge water
Communication Plan for avoiding conflicts with subsistence users
Collaboration and Communication with Whaling Associations, AEWC, Walrus,
Nanuq, Beluga, and Seal Commissions
No transiting without communicating
Commitment to hire Subsistence Advisors
Marine Mammal Observers on all vessels
Robust Marine Mammal Monitoring Protocol
8
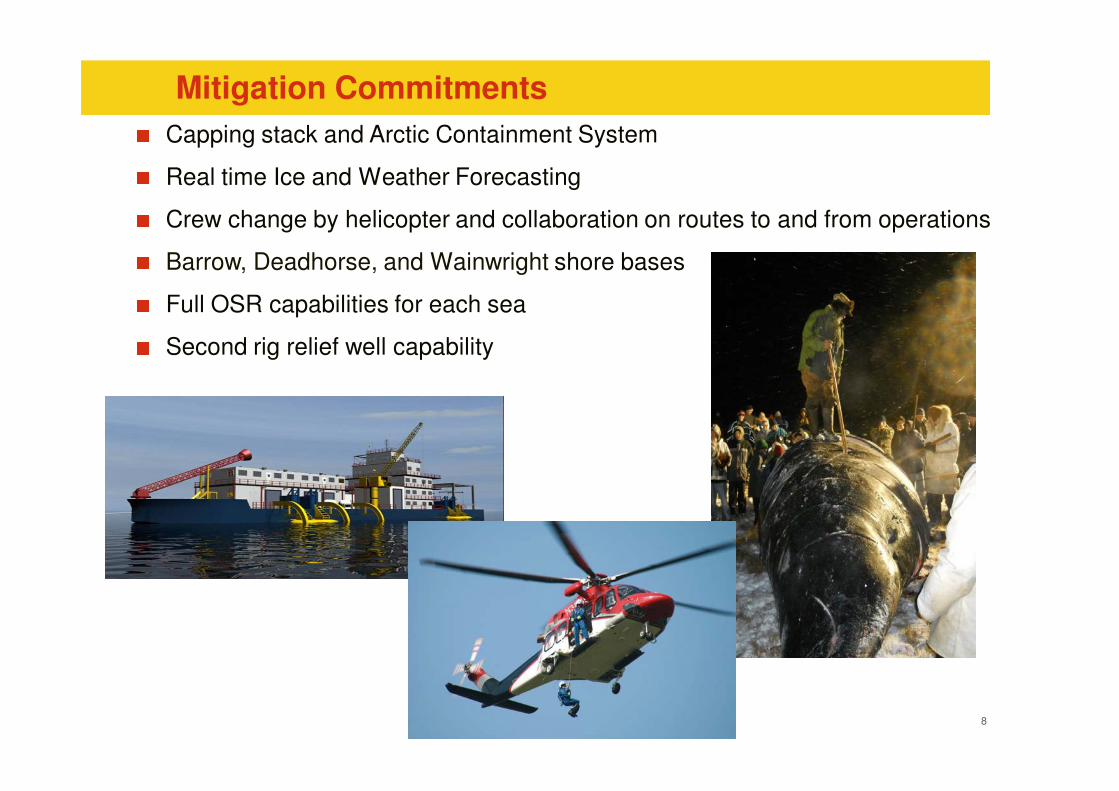
Mitigation Commitments
Capping stack and Arctic Containment System
Real time Ice and Weather Forecasting
Crew change by helicopter and collaboration on routes to and from operations
Barrow, Deadhorse, and Wainwright shore bases
Full OSR capabilities for each sea
Second rig relief well capability

9
Shell’s 2012 Drilling Program
Community Mitigation Measures
Barrow Com Center, SA (Subsistence Advisor), CLO (Community Liaison Officer), transit offshore
Kaktovik Com Center, SA, CLO, cease program 8/25 until after bowhead whale hunt, crew change by helicopter sensitive to subsistence hunting
Nuiqsut Com Center, SA, CLO, cease program 8/25 until after bowhead whale hunt, zero discharge at Camden Bay well-sites
Wainwright Com Center, SA, CLO
Community Mitigation Measures
Point Hope Com Center, SA, CLO
Point Lay Com Center, SA, CLO, sensitivity to beluga hunt
Kivalina & Kotzebue
Com Center, CLO, SA, sensitivity to beluga hunt
St. Lawrence Island Com Center, SA
Wales Com Center, SA
Diomede SA
Torpedo
Burger
Sivulliq

10
Plan of Cooperation Meetings
2011 Village meetings:• Kaktovik
• Nuiqsut
• Barrow
• Wainwright
• Point Lay
• Point Hope
2012 Village meeting plans:• Kaktovik
• Nuiqsut
• Barrow
• Wainwright
• Point Lay
• Point Hope
• Atqasuk
• Kivalina
• Kotzebue
• Kiana
• Shishmaref
• Gambell
• Savoonga
• Anaktuvuk Pass
• Kivalina
• Kotzebue
• Wales
• Gambell
• Savoonga

11
Questions
&
Discussion

12
Science and Monitoring
Program Overview
13
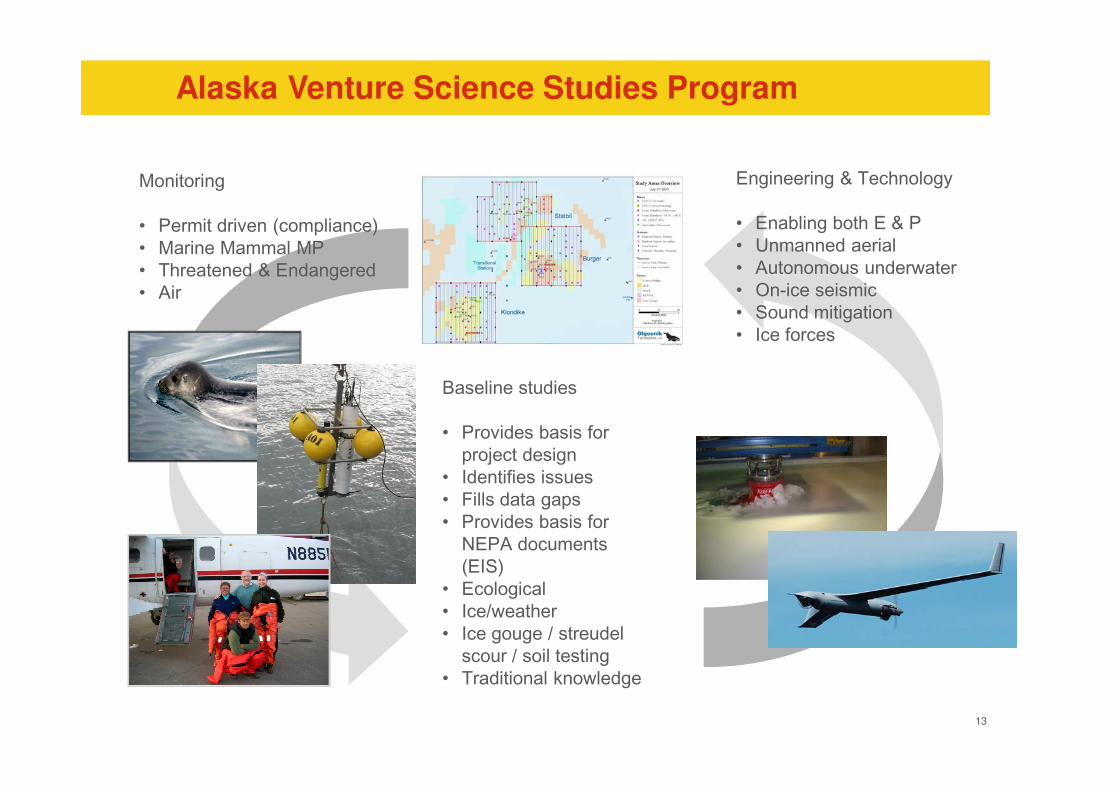
Alaska Venture Science Studies Program
Monitoring
• Permit driven (compliance)• Marine Mammal MP• Threatened & Endangered• Air
Baseline studies
• Provides basis for project design
• Identifies issues• Fills data gaps• Provides basis for
NEPA documents (EIS)
• Ecological• Ice/weather• Ice gouge / streudel
scour / soil testing• Traditional knowledge
Engineering & Technology
• Enabling both E & P• Unmanned aerial• Autonomous underwater• On-ice seismic• Sound mitigation• Ice forces

14
Alaska OCS Science Collaboration
Majority of Shell science is through collaboration
�ConocoPhillips key along with Statoil, GXT, Pioneer, & ENI
�Universities (UAF, UT, UMD) and Government including USGS, BOEM, NOAA
�Research entities including NFWF, Northern Forum, SINTEF
60 % of Shell Alaska science is leveraged
Shell - North Slope Borough Science Agreement to fund local community
directed priorities w/ $5 million/5 years
Shell/ConocoPhillips/Statoil – NOAA agreement on sharing scientific studies
data and ice and weather monitoring/forecasting
15
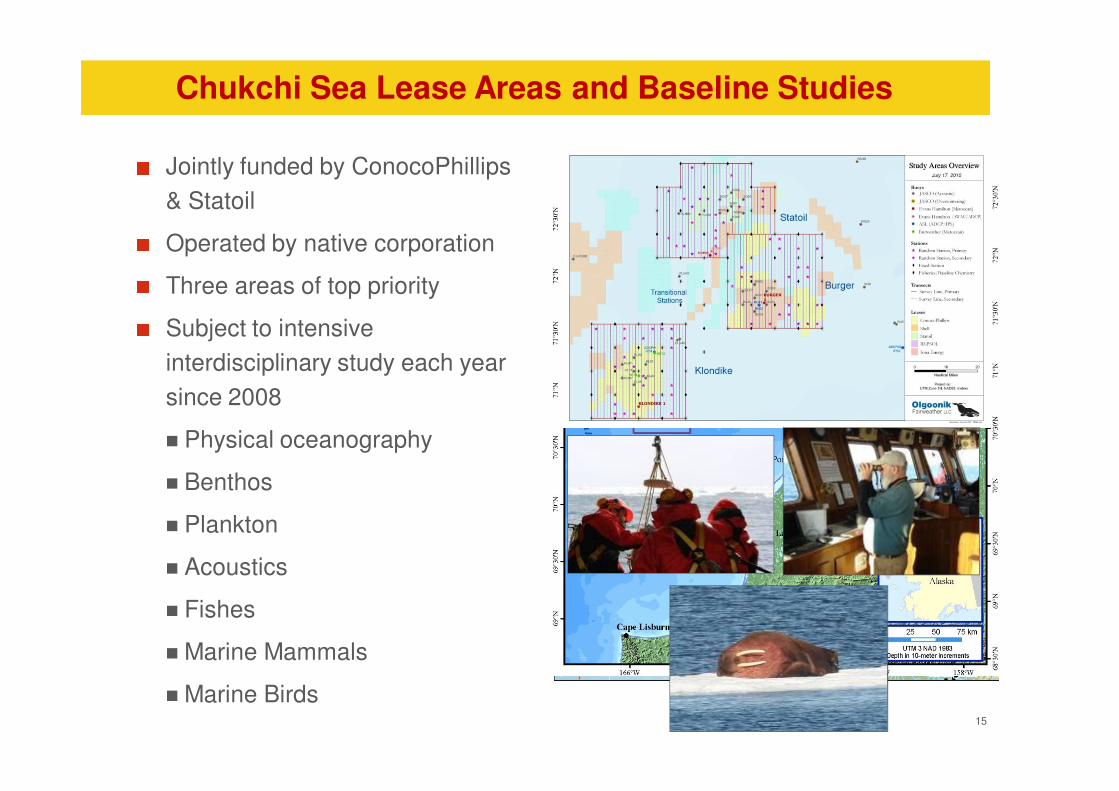
Chukchi Sea Lease Areas and Baseline Studies
Jointly funded by ConocoPhillips
& Statoil
Operated by native corporation
Three areas of top priority
Subject to intensive
interdisciplinary study each year
since 2008
� Physical oceanography
� Benthos
� Plankton
� Acoustics
� Fishes
� Marine Mammals
� Marine Birds
16
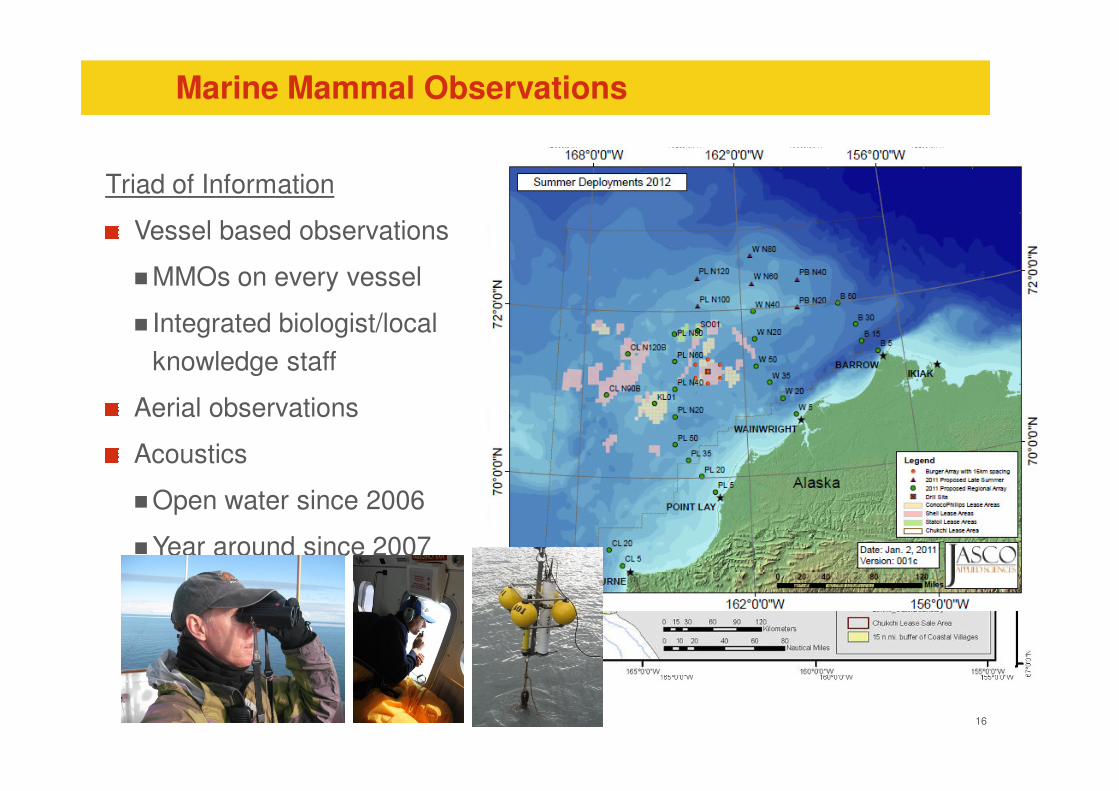
Marine Mammal Observations
Triad of Information
Vessel based observations
�MMOs on every vessel
� Integrated biologist/local
knowledge staff
Aerial observations
Acoustics
�Open water since 2006
�Year around since 2007

17
Acoustics – Regional arrays
Acoustic recorders
deployed in the Chukchi
& Beaufort
Localization capability in
Beaufort
Goals
�Understand effects of
industry sound on the
distribution and
behavior of marine
mammals.
�Understand patterns of
distribution and
movement

18
Acoustics – Sound Source Characterization
SSC conducted on all
vessels unless previously
assessed at location
Vessel SSCs at initiation of
activities
Rolling SSC for drilling
�Real time evaluation
�Weekly reporting

19
Acoustics – Site specific arrays
Monitor and evaluate drilling
related sound levels
Collect distribution and
movement information
through call data
Based upon learnings since
2006
�Masking
�Localization
�Calling behavior
Need input on final plan

20
Aerial Program
Offshore overflights in the Beaufort
�Manned flights w/ photography
�Stratified sampling strategy
Chukchi nearshore
�Sawtooth pattern
�Manned flights w/ photography
Chukchi Burger prospect
�Photographic survey
�Manned aircraft
�No MMOs
21
Drilling Monitoring
Before
�Sediment/water chemistry
�Biota community assessment
�Repetition of Joint studies evaluations localized at drill site(s)
During
�Plume monitoring – turbidity, chemistry
�Deposition
�Water chemistry
After
�Sediment/water chemistry
�Biota Community assessment
�Bioaccumulation

22
Questions
&
Discussion
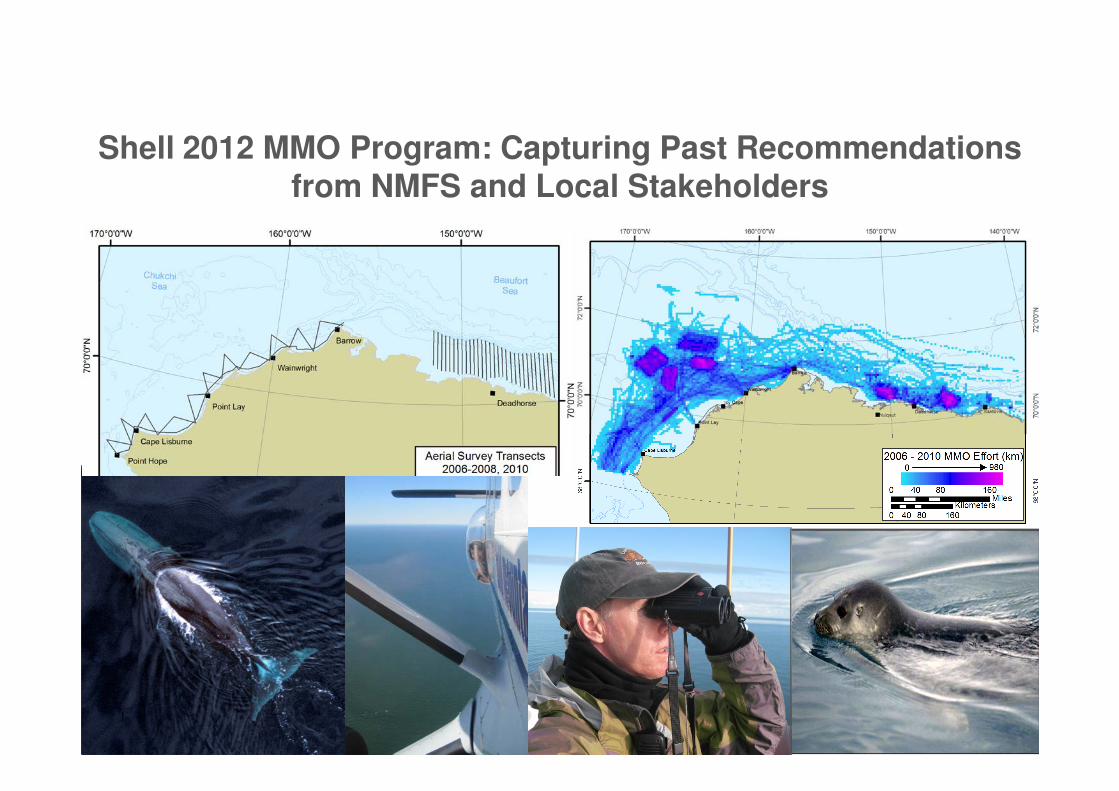
Shell 2012 MMO Program: Capturing Past Recommendationsfrom NMFS and Local Stakeholders

MMO Platforms:
Aerial (n = 2)
Vessel (n =18)
~58 MMOs in the field5 - 6 MMOs per aircraft
1 - 5 MMOs per vessel

“Qualified MMOs are key elements of successful monitoring
and mitigation efforts…” NMFS Expert Panel, 2010
• MMOs on ALL Project Vessels plus 2 Aircraft
• Qualified Alaska Natives and Professional
Biologists trained together through extensive
use of visual aids over course of 3 days:
• Emphasis on ID, Regulatory Context,
Sighting/Mitigation Scenarios
• Performance-based assessments/exams
• Recruiting from N. Slope and NANA
region
• Maximize eyes on water in areas relevant to
mitigation
• Appropriate use of Big Eyes + low-powered
optics and naked-eye search patterns

Additional NMFS Expert Panel Recommendations within Shell’s 2012 MMO Program
• MMOs stationed in areas that maximize viewing (e.g., bridge)
• Importance of ‘unidentified’ ID stressed, focus on what was/was
not observed and record in detail in comments
• Improved real-time data recording into computer, including
ability to geo-reference sightings for operational context
• Daily correspondence with shore-based support, data reports
• Debriefs following shift/season
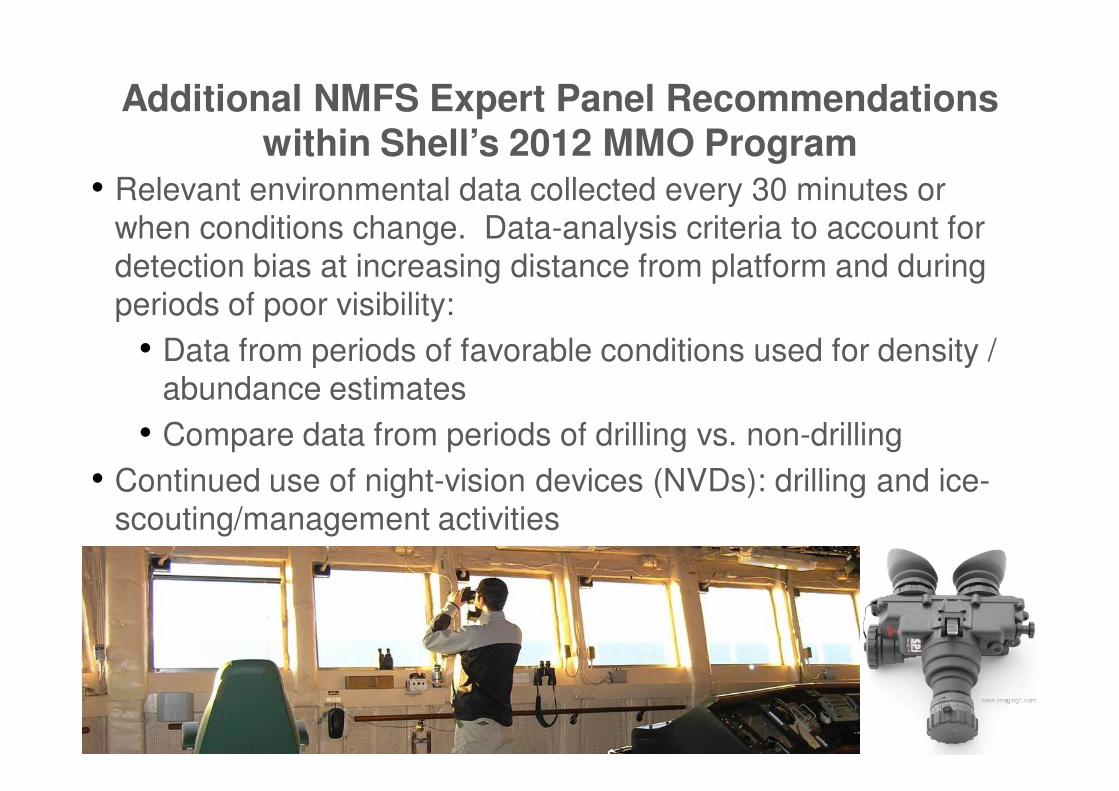
Additional NMFS Expert Panel Recommendations within Shell’s 2012 MMO Program
• Relevant environmental data collected every 30 minutes or
when conditions change. Data-analysis criteria to account for
detection bias at increasing distance from platform and during
periods of poor visibility:
• Data from periods of favorable conditions used for density /
abundance estimates
• Compare data from periods of drilling vs. non-drilling
• Continued use of night-vision devices (NVDs): drilling and ice-
scouting/management activities

Additional NMFS Expert Panel Recommendations within Shell’s 2012 MMO Program
• Use of aerial surveys to visually monitor animals at distances
greater than can be detected from vessels
• Aerial MMOs communicate sightings to MMOs on vessels

29
Questions
&
Discussion

Sound Source Characterization Plan
Objectives for Sound Characterization and SSV
Measurements
Quantify industrial underwater sound levels and sound
spectra as functions of distance from the drilling program
sources
Determine 1/3-octave band source levels of each industrial
noise source
The purpose of these measurements is to gauge potential
impacts on marine fauna (including takes under MMPA),
and to provide relevant information for predicting sound
levels during similar future operations

Vessel sound characterization
approach
SSC measurements will be made on all vessels that have not
previously had sound characterizations
Most SSC measurements will be performed outside the 25 mi
exclusion zone for air permits
Will make all measurements with a single deployment of recorders
as shown above
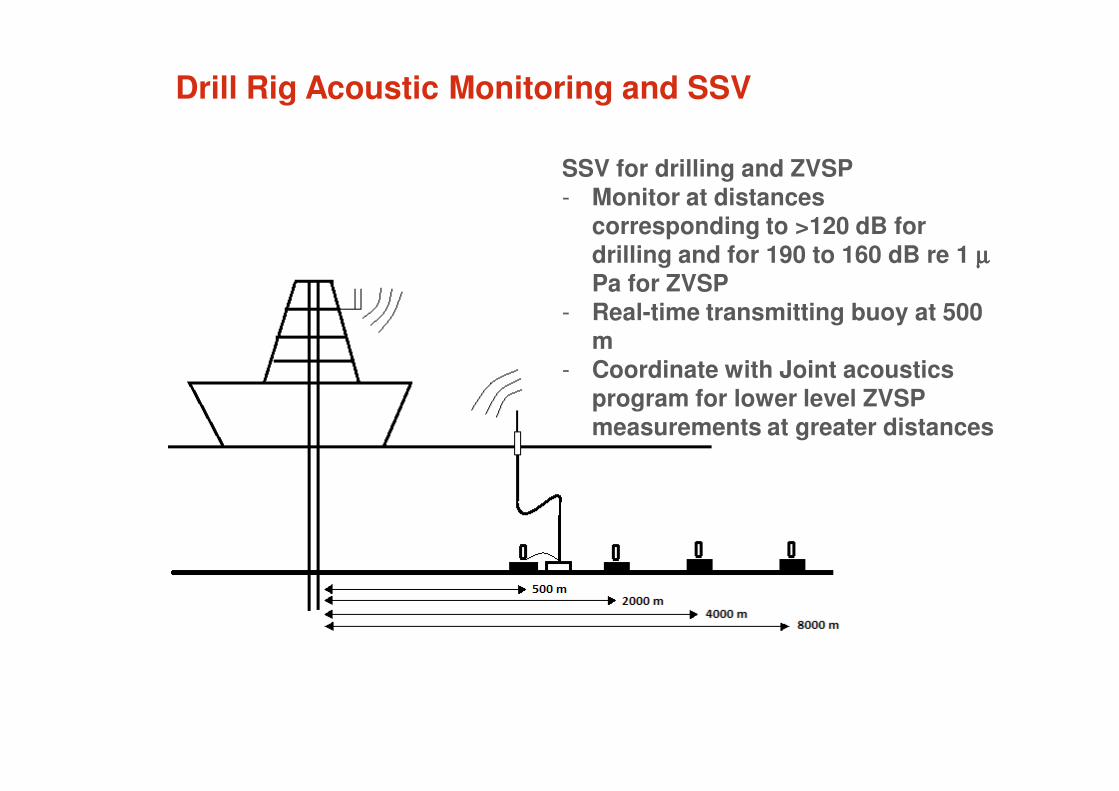
Drill Rig Acoustic Monitoring and SSV
SSV for drilling and ZVSP
- Monitor at distances
corresponding to >120 dB for drilling and for 190 to 160 dB re 1 µµµµ
Pa for ZVSP- Real-time transmitting buoy at 500
m
- Coordinate with Joint acoustics
program for lower level ZVSP
measurements at greater distances
Objectives for Chukchi Regional
Acoustics Monitoring by the Joint
Science Program
Measure ambient noise levels over a large area of the
northeastern Chukchi Sea
Measure long-range industrial sound levels from Shell drilling
operations, including vessel activities
Detect marine mammal calls to define spatial and temporal
distributions
Investigate possible changes to vocal behavior due to the
presence of industrial noise

35
Questions
&
Discussion

Beaufort Regional Acoustics Program

Deployment locations since 2007:
Beaufort Sea Acoustic Monitoring

Two DASARs added in 2010 and 2011 to gather background levels near the future drilling locations:
Site 1
15'
50 km
50mi
j
Site 2
I Prudhoe Bay
Site 3 ... ... ... ... ... ... ...
~~
Site 4
4H • ... • 41 .. ... ... ... ...
Site 5
Camden Bay

Suggested 2012 deployments near sites 3 and 4:40'
Site 3 Site 4
• G • F 30' • E • D • • • c • G
B • • • • H F A • E
70°N • • 20.00' -l_ I D • c •
... • B
- - A
-10' ~
~ • Sivulliq drill site e Torpedo drill site
• Original DASAR locations 1::::. Flipped OASAR locations
10 km
• Site 1 DASAR {A, B, C, G) moved to Site 4 10 mi /:;,. Small "triplet" array
147°W 40' 20' 146°W 40 ' 20'

Suggested 2012 deployments near sites 3 and 4:40'r-~r-------~--------~---------r--------~--------~------,
30'
10'
Site 3
.. G
.. E
.. c
.. A
.. F
.. D
.. B
-- -e Sivulliq drill site e Torpedo drill site _. Original DASAR locations
1::::. Flipped DASAR locations
.. e H
.. I
10 km
_. Site 1 DASAR {A, B, C, G) moved to Site 4 10 mi t::. Small "triplet" array
40'
Site 4
• .. F
.. D
.. B
1::::. G'
1::::. E'
1::::. C'
1::::. A'

Suggested 2012 deployments near sites 3 and 4:40'
Site 3 Site 4
• • G • • M F • L • 30' E • K D • • • J
c !::::.
• G' B • • • • H F
A !::::. E'
70°N • • 20.00' -l_ I D
!::::. C' •
... B !::::. - - A'
-10' ~
~ • Sivulliq drill site e Torpedo drill site
• Original DASAR locations !::::. Flipped OASAR locations
10 km
• Site 1 DASAR {A, B, C, G) moved to Site 4 10 mi /:;,. Small "triplet" array
147°W 40' 20' 146°W 40 ' 20'

Suggested 2012 deployments near sites 3 and 4:40'
Site 3 Site 4
• • G • • M F • L • 30' E • K D • • • J
c !::::.
• 1:::../:::,. G' B ~ • • • • H F
A !::::. E'
70°N • • 20.00' -l_ I D
!::::. C' •
... B !::::. - - A'
-10' ~
~ • Sivulliq drill site e Torpedo drill site
• Original DASAR locations !::::. Flipped OASAR locations
10 km
• Site 1 DASAR {A, B, C, G) moved to Site 4 10 mi 1:::.. Small "triplet" array
147°W 40' 20' 146°W 40 ' 20'

Suggested 2012 deployments near sites 3 and 4:40'
Site 3 Site 4
• • G • • M F • L • 30' E • t:.t:.
K D • • t:. • J
c !::::.
• G' B • • • • H F
A !::::. E'
70°N • • 20.00' -l_ I D
!::::. C' •
... B !::::. - - A'
-10' ~
~ • Sivulliq drill site e Torpedo drill site
• Original DASAR locations !::::. Flipped OASAR locations
10 km
• Site 1 DASAR {A, B, C, G) moved to Site 4 10 mi t:. Small "triplet" array
147°W 40' 20' 146°W 40 ' 20'
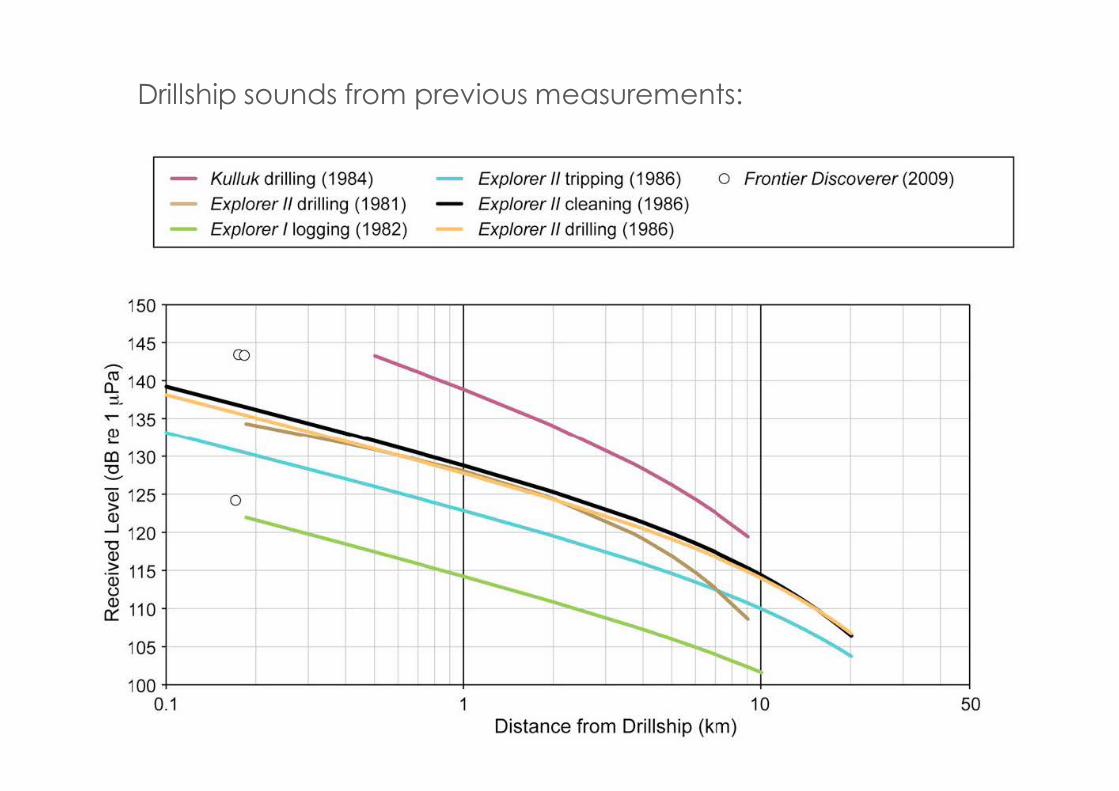
Drillship sounds from previous measurements:
Ku/luk drilling (1984) Explorer II drilling (1981) Explorer /logging (1982)
Explorer II tripping (1986) o Frontier Discoverer (2009) Explorer II cleaning (1986) Explorer II drilling (1986)
150 ~----------------------~------------------------~--------------~
145 ..-
~ 140
;: 135 i Q) ' .... co 130 "0 --Q) 125 > Q)
_J 120 "0 Q)
.~ 115 Q) (.)
~ 110
105
co
100+-----------~------~---+--------------~----~--+---------------~
0.1 1 10 50 Distance from Drillship (km)

Broadband (10-450 Hz) levels at DASARs 4H and 4I in 2010:
20 (i) -- 15 E ..._.. 10 '0 c: 5 ~
140
130
120
ro- 110 a.. :::.
..- 100
100
90
so ~~~~~~~~~~~~~~~~~~~~~~~~~~~~~~~~~~~~~~~~~~~~
12 14 16 18 20 22 24 26 28 30 1 3 5 7 9 11 13 15 17 19 21 23 25 27 29 3 Date in August, September, and October 2010

Broadband (10-450 Hz) levels at DASARs 4H and 4I in 2010:
20 (i) -- 15 E ..._..
10 '0 c: 5 ~
140
130
120
ro- 110 a.. :::.
..- 100
100
90
so ~~~~~~~~~~~~~~~~~~~~~~~~~~~~~~~~~~~~~~~~~~
12 14 16 18 20 22 24 26 28 30 1 3 5 7 9 11 13 15 17 19 21 23 25 27 29 3 Date in August, September, and October 2010
95th - 114 dB
50th - 102 dB
5th -89 dB

Adding in ambient sound levels as recorded at 4H and 4I in 2010:
Drilling
Anchor retrieval
Turret turn

Adding in distances from drillships to S3 & S4 DASARs:
Ku/luk drilling (1984) Explorer II drilling (1981)
Explorer /logging (1982)
Explorer II tripping (1986)
Explorer II cleaning (1986)
Explorer II drilling (1986)
o Frontier Discoverer (2009)
--- 4H & 41 ambient
• o o DASAR dist. to Sivulliq &Torpedo
• ~ 00 ···---·· 0 0 00 000 0 CD<D a::D 0 CD <m 150 ~----------------------~------------------------~--------------~
145 ..-
~ 140
~ 135 i ..... co 130 "'0 --0,) 125 > 0,)
_J 120 "'0 0,)
.~ 115 0,) (.)
~ 110
105
100 0.1
co
----------------- 9~h
1 10 50 Distance from Drillship (km)
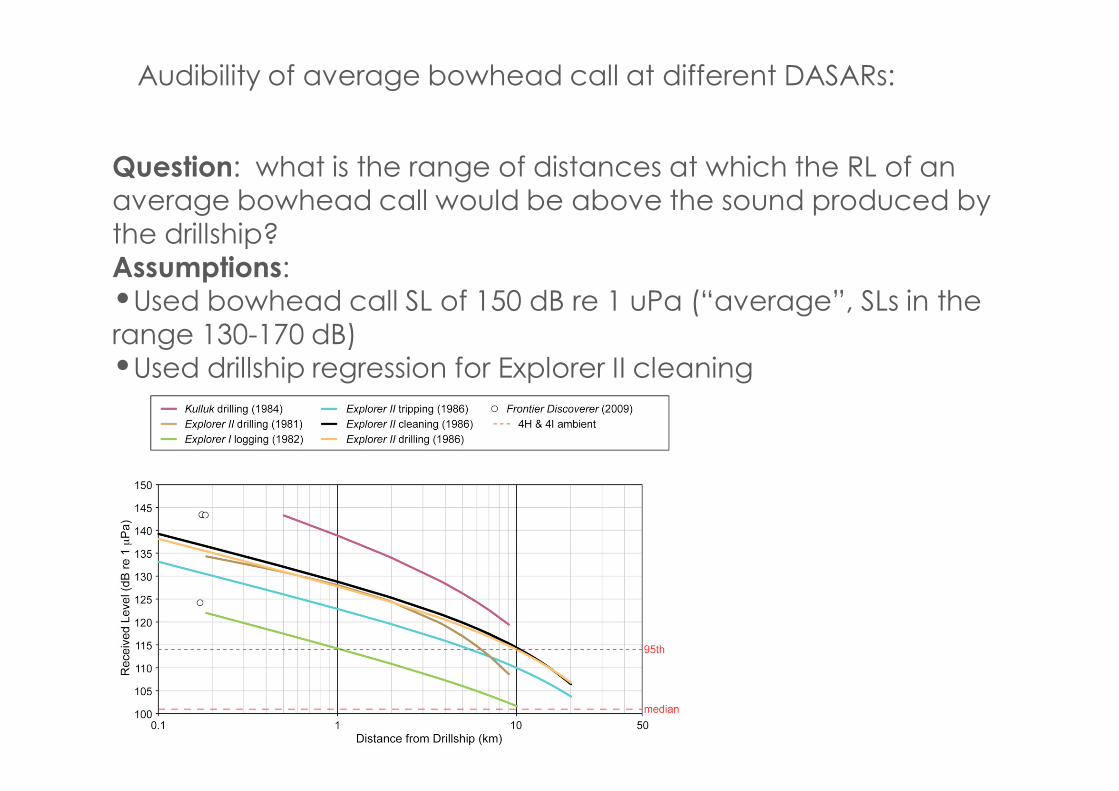
Audibility of average bowhead call at different DASARs:
Question: what is the range of distances at which the RL of an average bowhead call would be above the sound produced by the drillship?Assumptions:•Used bowhead call SL of 150 dB re 1 uPa (“average”, SLs in the range 130-170 dB)•Used drillship regression for Explorer II cleaning•Ambient sound levels are low (below drillship sounds)•Used spreading loss of 15log(distance) and 10log(distance)

Audibility of average bowhead call at different DASARs:40'~~--------~------~--------~--------~------~------,
30'
10'
...
DASAR4H 4.1 km from Sivulliq RL=121.2dB 80-710 m
•
---
e Sivulliq drill site e Torpedo drill site .A. Original DASAR locations
6. Flipped DASAR locations 10 km
.A. Site 1 DASAR (A, B, C, G) moved to Site 4 10 mi &;. Small "triplet" array
40'

Audibility of average bowhead call at different DASARs:40'~~--------~------~--------~--------~------~------,
30'
10'
...
Triplet DASAR 6 km from Sivulliq RL = 118.6 dB 120-1220 m
•
---
e Sivulliq drill site e Torpedo drill site .A. Original DASAR locations
6. Flipped DASAR locations 10 km
.A. Site 1 DASAR (A, B, C, G) moved to Site 4 10 mi !:;;. Small "triplet" array
40'

Audibility of average bowhead call at different DASARs:40'~~--------~------~--------~--------~------~------,
30'
10'
...
DASAR 4F 16 km from Sivulliq RL = 109.4 dB 490-6300 m
•
---
e Sivulliq drill site e Torpedo drill site .A. Original DASAR locations
6. Flipped DASAR locations 10 km
.A. Site 1 DASAR (A, B, C, G) moved to Site 4 10 mi 1::. Small "triplet" array
40'

Audibility of average bowhead call at different DASARs:40'~~--------~------~--------~--------~------~----~
30'
10'
...
DASAR4B 20 km from Sivulliq RL = 106.5 dB 760-9200 m
---
e Sivulliq drill site e Torpedo drill site .6. Original DASAR locations
6. Flipped DASAR locations 10 km
.6. Site 1 DASAR (A, B, C, G) moved to Site 4 10 mi 1:::. Small "triplet" array
40'
0

55
Questions
&
Discussion

Chukchi Regional Acoustics Program
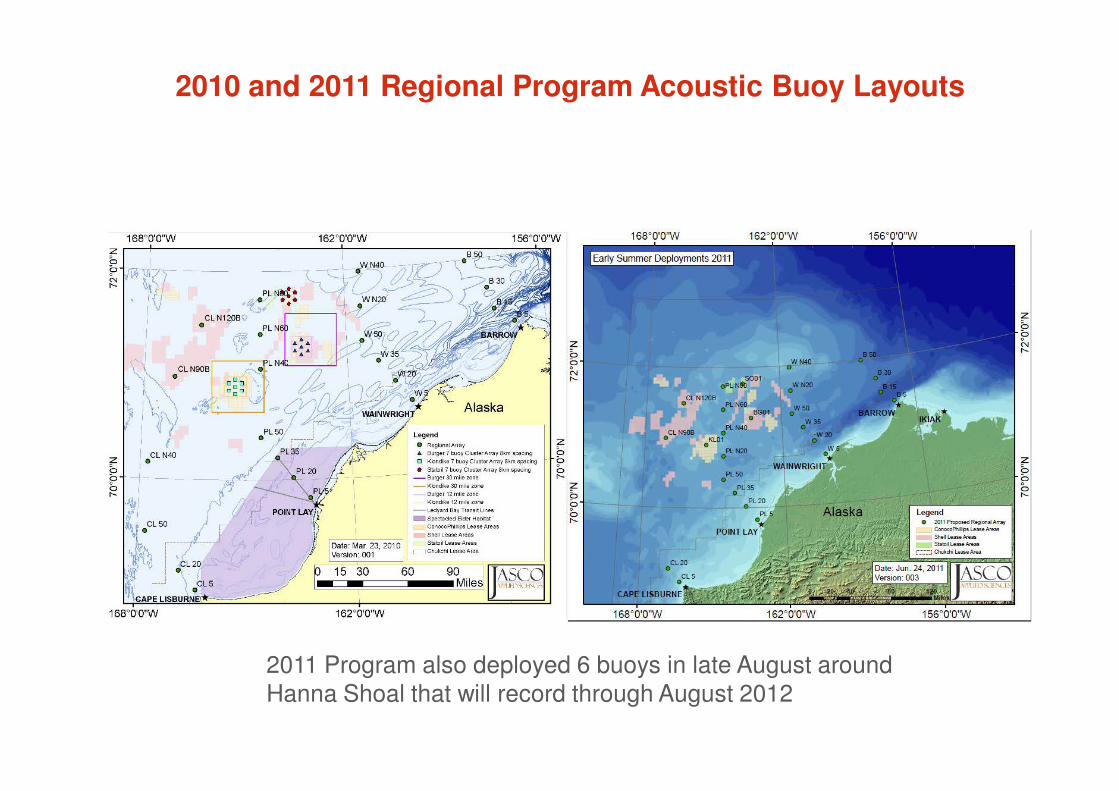
2010 and 2011 Regional Program Acoustic Buoy Layouts
2011 Program also deployed 6 buoys in late August around
Hanna Shoal that will record through August 2012
168c0'0"W
168°0'0"W
156c0'0"W
z 0 0 N I'-
. OL N120B
5001 ef'LN~
. PL I'WJ . 0011'
ePLN40
Kl01 • .Pl. N2IJ
PLSO •
156°0'0"W

z 0 0 0 N 1'-
z 0 0 0 0 1'-
168°0'0"W
168°0'0"W
CL 20 •
162°0'0"W
WN80 ... Pl N100 1 W N4D ... . 50 01
. PLN8b
Pl50 •
162°0'0"W
156°0'0"W
Legend • Burger..vray·..-l!h 16lm &paCing ..&. 2011 Proposed Late summer • 20 11 Proposeo R~onal ,..rray • oru ste
conocoPnlll" s Lease Areas sne:J Lease Areas Sta:oll t ease Are-as
c_:::.J CIWkCil l t easeArw
156°0'0"W
z 0 0 0 N 1'-
z 0 0 0 0 1'-
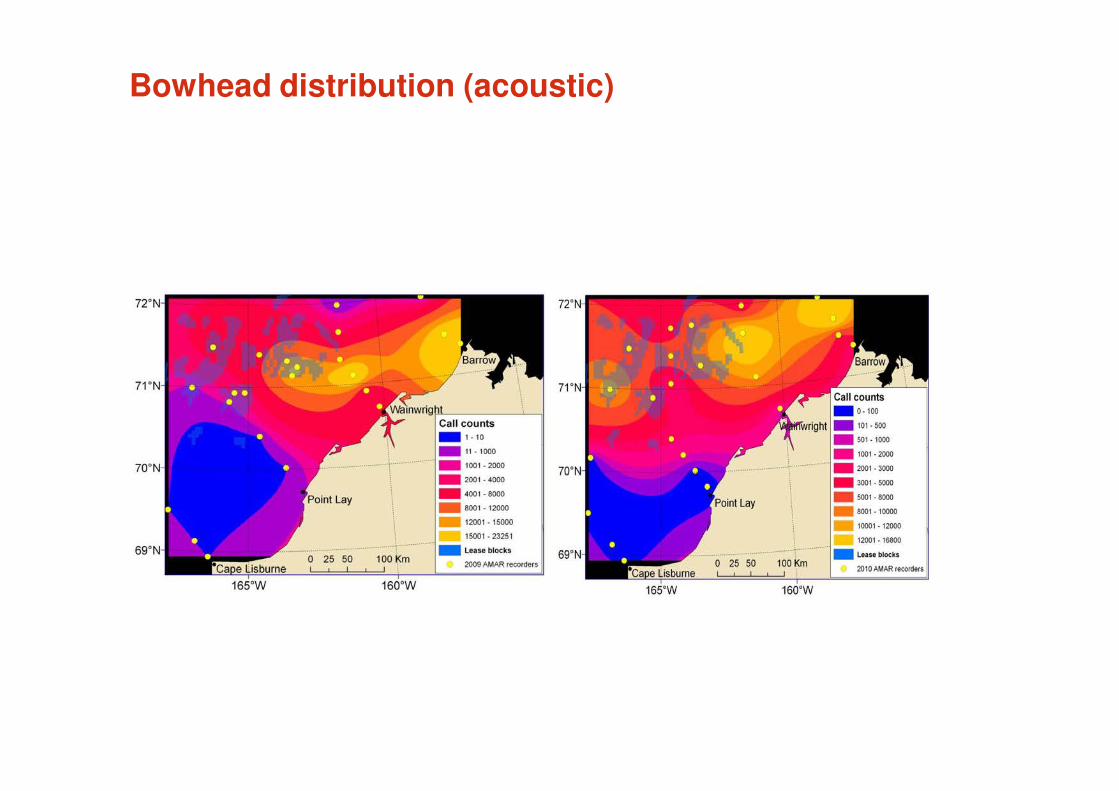
Bowhead distribution (acoustic)
72°
71 °
69°
165°W
Call counts - 1 - 10
- 11 - 1000
·,,,,, ............................ , .............. , . 1001-2000
- 2001-4000
- 4001-8000
- 8001- 12000
- 12001 - 15000
15001 - 23251
0 25 50
160°W
- 2001 -3000
- 3001-5000
- 5001-6000
- 8001 - 10000
- 10001 - 12000
12001 - 16600
165°W 160°W
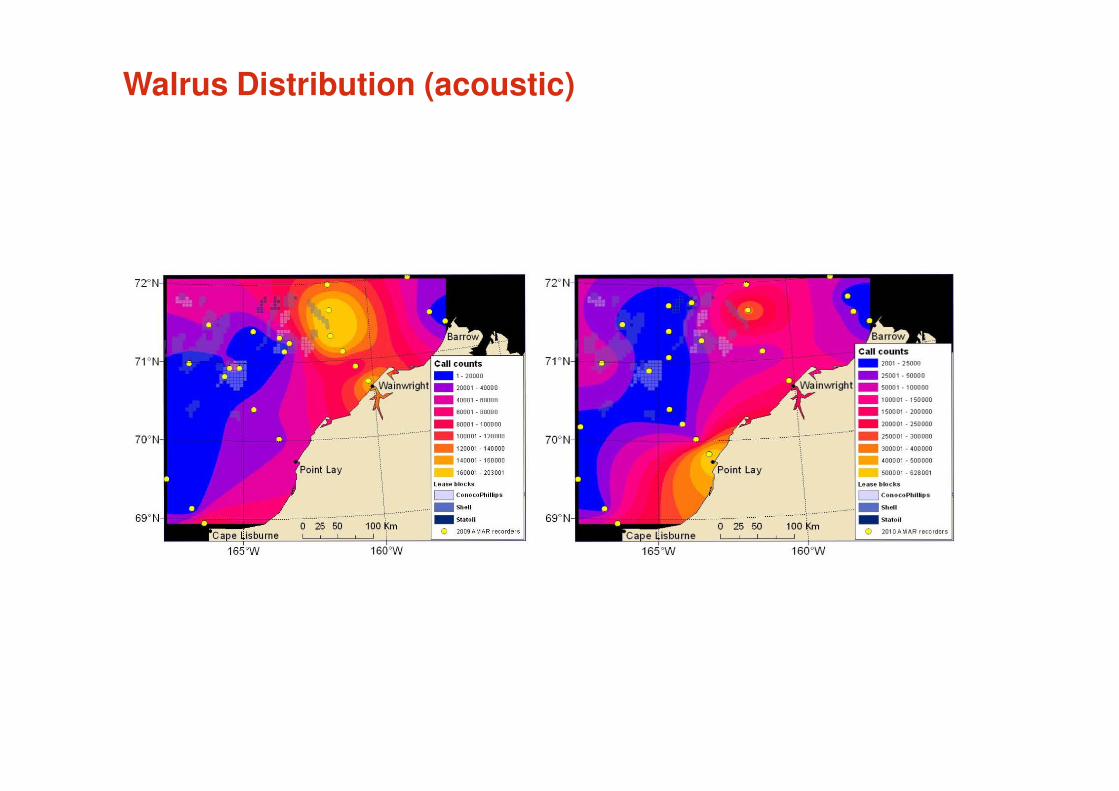
Walrus Distribution (acoustic)
16s·w 16o·w

61
Questions
&
Discussion

Beaufort Aerial Program

Beaufort Prospect Aerial Survey
Initiated in 2006 as part of an
integrated monitoring program
Manned flights in 06,07,08,10
Will fly in 2012 with MMOs aboard
to evaluate impacts of drilling
activities on migrating bowheads
and other species
Flight pattern will be modified per
findings of peer review
recommended power analysis
Aircraft will have both MMOs and
photographic equipment

Beaufort Prospect Aerial Survey
Long term goal to utilize
Unmanned Aerial Systems (2013?)
2 still frame cameras + HD video
Dual observation will allow direct
comparison of results & derivation
of correction factors
Photography will provide lasting
record
Photo analyses will be done when
not flying
Evaluating multi-spectral scanner

Sensors
2 Still Cameras- Cannon 5D Mk II digital SLR camera – one with 20
mm lens and other with 20 (Beaufort) or 100 mm
(Chukchi?) lens
- 5D is a 21.1 megapixel camera that stores imagery
in a 5616 × 3744 pixel array
One HD Video- Canon XF305
- 1920 × 1080 resolution
- NTSC video is 640 × 480

Survey Area
Still Camera
Single DSLR camera with 20 mm lens covers 720 m swath, 100 mm lens covers 144 m
swath
One pixel is 12 cm with 20 mm lens and 2.4 cm with 100 mm lens
Effective Strip Width for manned survey of bowheads has varied from 500 to 700 m and
for belugas was ~300 m
Can detect (20 mm) and identify and count (100 mm) animals that cannot be reliably
detected during visual surveys (seals)
Video Camera
Camera fixed to cover a 600 m swath
One pixel on water is 25 cm (same as Koski et al. 2009)
Provides constant coverage rather than soda-straw coverage making detection easier

67
Questions
&
Discussion

Chukchi Aerial Program

Chukchi Burger Prospect Aerial Survey
Since 2006 conducted nearshore
surveys
Surveys in 06,07,08, 10
Benefits have been initial
observation of walrus haulouts
Desire to collect data in the
offshore despite risks
2012 will add photographic
offshore surveys
Pilot & co-pilot but no MMOs

Chukchi Burger Prospect Aerial Survey
Offshore unmanned will be flown preferentially
Nearshore will be flown with MMOs and photography when Burger is not available or needed
Comparisons to Beaufort and nearshore will enable calibration
Based out of Barrow, MMOs will analyze data when not flying
Photographic results will be available
Eventually computer assisted detection is a goal.

71
Questions
&
Discussion
Aerial Survey Power Analysis

Background
One aspect of aerial monitoring is to investigate potential differences
in marine mammal densities around industrial activity.
At present, comparisons are made between sighting rates for
different received sound pressure level categories.
This analysis addresses a request by NMFS for a power analysis to
investigate the probability of the proposed survey design to detect
such effects

Original Proposed Beaufort Survey Design
... ' .
Aerial Survey Lines
g • Sivulliq-N
I Sivulliq_N - 10, 20, 30 km rings
Kulluk 120 dB zone {19.9 km) 0 5 10 20 30 40
Miles - Discoverer 120 dB zone (5 km) 0 5 10 20 30 40 Kilometers
147 143

Survey Sub-areas and Effect Sizes
Potential
Impact
Zone
Outer
Zone
0.02 bowheads / km2
Potential Impact Zone bowhead density assumed to be 25% (Big effect), 50% (Medium effect) or 75% (Small effect) of underlying density in Outer Zone.
Area = 20
or 30 km
radius

Estimating Power of Aerial Survey Design through
Simulation
Underlying bowhead density, detection function, g(0) etc. based on
existing data.
Expected effort in 2012 equal to average effort achieved during recent
survey seasons.
Effort in each zone proportional to zone’s area divided by total survey
area.
Also ran exploratory power analysis for Chukchi, accounting for
additional transit length to offshore survey area

0 10 20 30 40
010
20
30
40
Example Simulated Survey (Impact Zone)
Track-line
Vis. Range (2 km)
Not sighted
Sighting

Power: Original Proposed Survey Design (i.e. Uniform Transect-Line Spacing)
2) Chukchi
1) Beaufort
Radius of impact zone (km) Big effect (25%) Medium effect (50%) Small effect (75%)
20 1 0.49 0
30 1 1 0.38
Impact zone density as % of outer zone density
Radius of impact zone (km) Big effect (25%) Medium effect (50%) Small effect (75%)
20 0.993 0.113 0
30 1 0.999 0.142
Impact zone density as % of outer zone density

Concentrated Effort in Impact Zone
0 10 20 30 40
010
20
30
40
0 10 20 30 40
010
20
30
40

Power:
Concentrated Effort in Impact Zone
2) Chukchi
1) Beaufort
Impact zone effort multiplier Big effect (25%) Medium effect (50%) Small effect (75%)
Base case 1 0.49 0.00
1.2 x 1 0.88 0.01
1.4 x 1 0.99 0.01
1.6 x 1 0.99 0.06
Impact zone density as % of outer zone density
Impact zone effort multiplier Big effect (25%) Medium effect (50%) Small effect (75%)
Base case 1 0.11 0.00
1.2 x 1 0.33 0.00
1.4 x 1 0.69 0.00
1.6 x 1 0.87 0.00
Impact zone density as % of outer zone density
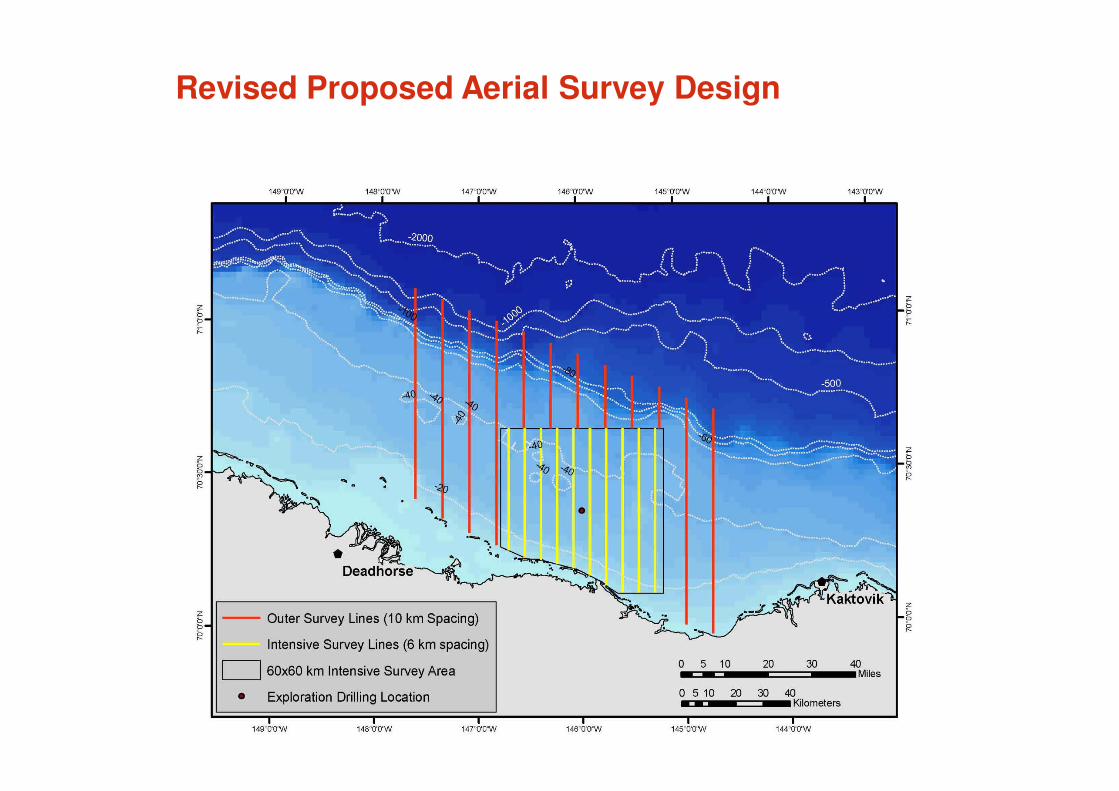
Revised Proposed Aerial Survey Design
Outer Survey Lines (1 0 km Spacing)
Intensive Survey Lines (6 km spacing)
D 60x60 km Intensive Survey Area
• Exploration Drilling Location
149•o·o·w 14a•o·o·w 14700'0'W 14e•o·ow
0 5 10 40 •=--=---c::=::::::l---Miles
20 30
0 5 10 20 30 40 • • Kilometers
14500'0'W 144°0'0'W
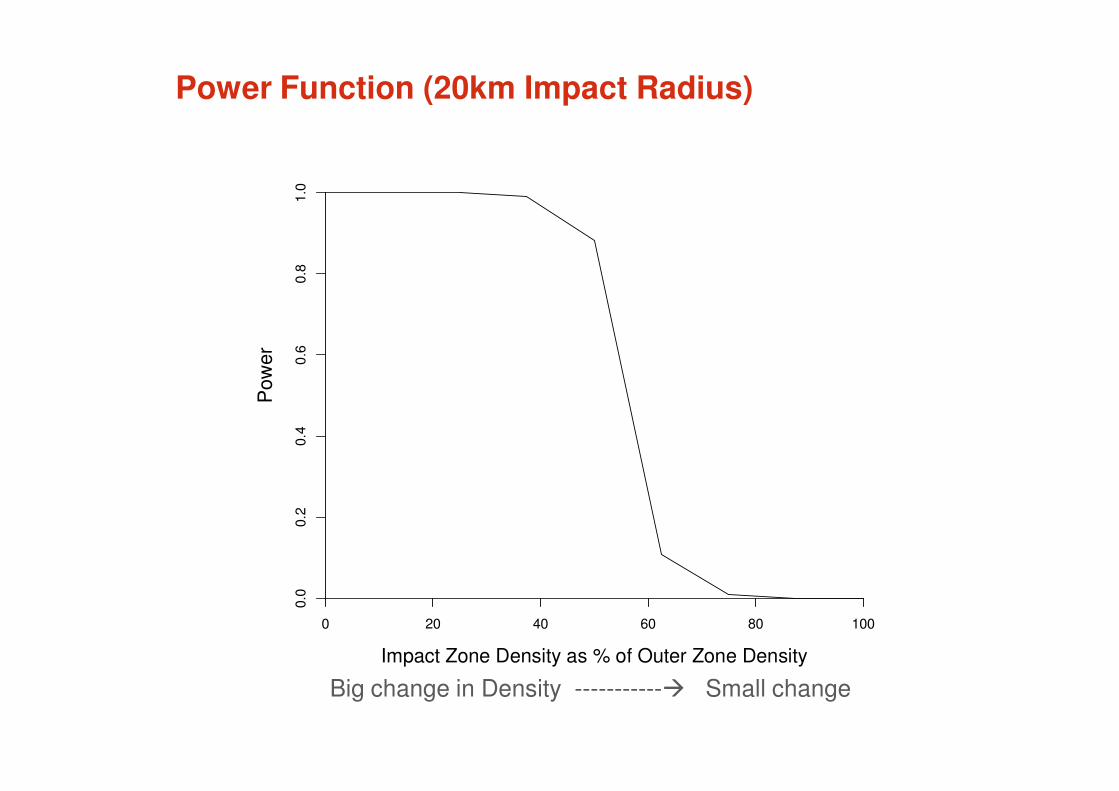
Impact Zone Density as % of Outer Zone Density
Pow
er
0 20 40 60 80 100
0.0
0.2
0.4
0.6
0.8
1.0
Power Function (20km Impact Radius)
Big change in Density -----------� Small change

Summary
•If impact radius is 30km, power to detect differences in densities is
generally high.
•If impact radius is 20km, power is high for larger changes in density but
drops off rapidly for smaller changes.
•In general, maximizing effort around industrial activity maximizes the
power to detect differences in underlying densities.
•
•There is a limit to the amount of effort achievable around industrial
activity however, as dictated by a minimum desirable spacing of transect
lines (else risk double counting).
•The revised aerial survey design has improved power to detect
differences in densities over the original design.