tr news - transportation research boardonlinepubs.trb.org/onlinepubs/trnews/trnews242.pdf · tr...
TRANSCRIPT

TR NEWSNUMBER 242 JANUARY–FEBRUARY 2006
COVER: Marking the 100th anniversaryof the New York City subway system,October 27, 2004 (in center window,left to right:) New York Lt. GovernorMary Donohue, Metropolitan TransitAuthority Chairman Peter S. Kalikow,and Mayor Michael Bloomberg ride an antique subway car through therestored City Hall station, the originalsystem’s first stop. (Photo by MikeSegar, Reuters)
3
16
28
3 New York City’s Subway Century:Rail Transit’s Role in Growth and DevelopmentThomas R. JablonskiOctober 2004 marked the centennial of New York City’s first subway line. This accountof the first 100 years shows how the subway enabled the city’s development andsustained its economic growth by improving the quality of life for a range of citizens, byspurring commercial development and the creation of the skyscraper skyline, and byincreasing real estate values and broadening the city’s tax base.
8 The Renaissance Man of New York’s Subways:William Barclay Parsons, Transportation Engineer Extraordinaire Tom MalcolmBest known for his work designing the New York City subway system more than 100years ago, William Barclay Parsons also was a renowned military engineer, a prolificauthor, a respected community leader, and a consultant for transportation systemsaround the world. He modeled his belief that the complexity of designing and buildingmodern infrastructure demanded engineers who were managers as well as technicians.
14 POINT OF VIEWDeveloping Around Transit: Challenges for Cities and Suburbs Robert T. DunphyMuch of the interest in new transit investments is occurring in places where transit is anovelty, yet many established transit markets are struggling to maintain services.Reinforcing a strong market with consistent public policies can produce successful transitdistricts, this author maintains. The project must be attuned to the real estatedevelopment market, and developers must appreciate the special opportunities of transit.
16 Laboratories for Addressing Critical Issues: State Departments of Transportation Test Out Solutions—Reports from the Transportation Research Board’s 2005 Field Visit ProgramState departments of transportation and other transportation organizations are activelyaddressing the challenges identified in TRB’s latest edition of Critical Issues inTransportation. The 2005 field visits by senior program officers in TRB’s TechnicalActivities Division yielded many examples of how transportation organizationsrepresenting a variety of disciplines and modes are testing out solutions.
Institutional Issues, 17Data and Information Technologies, 19Aviation, 20Freight Systems, 21Highways, 22Marine and Intermodal, 25Rail, 26Public Transportation, 26
The latest edition of Critical Issues in Transportation, assembled byTRB’s Executive Committee, is included in this magazine as a specialpull-out insert between pages 20 and 21.

TR NEWSTR NEWSfeatures articles on innovative and timelyresearch and development activities in allmodes of transportation. Brief news items ofinterest to the transportation community arealso included, along with profiles of transpor-tation professionals, meeting announcements,summaries of new publications, and news ofTransportation Research Board activities.
TR News is produced by theTransportation Research BoardPublications OfficeJavy Awan, Editor and Publications DirectorPatricia Spellman and Erika Hunter Lloyd,
Assistant EditorsJennifer J. Weeks and Jennifer Correro,
Photo ResearchersJuanita Green, Production ManagerMichelle Wandres, Graphic Designer
TR News Editorial BoardNeil F. Hawks, ChairmanWalter J. DiewaldFrederick D. HejlTimothy HessMark R. NormanStephan A. ParkerBarbara L. PostA. Robert Raab
Transportation Research BoardRobert E. Skinner, Jr., Executive DirectorSuzanne B. Schneider, Associate Executive
DirectorMark R. Norman, Director,
Technical ActivitiesStephen R. Godwin, Director,
Studies and Information ServicesAnthony N. Mavrogiannis, Director,
Administration and FinanceRobert J. Reilly, Director,
Cooperative Research ProgramsNeil F. Hawks, Director, Special Programs
TR News (ISSN 0738-6826) is issued bimonthly by theTransportation Research Board, National ResearchCouncil, 500 Fifth Street, NW, Washington, DC 20001.Internet address: www.TRB.org.
Editorial Correspondence: By mail to the PublicationsOffice, Transportation Research Board, 500 FifthStreet, NW, Washington, DC 20001, by telephone202-334-2972, by fax 202-334-3495, or by [email protected].
Subscriptions: North America: 1 year $55; single issue$9.50. Overseas: 1 year $75; single issue $13.50.Inquiries or communications concerning newsubscriptions, subscription problems, or single-copysales should be addressed to the Business Officeat the address below, or telephone 202-334-3216,fax 202-334-2519. Periodicals postage paid atWashington, D.C.
Postmaster: Send changes of address to TR News,Transportation Research Board, 500 Fifth Street, NW,Washington, DC 20001.
Notice: The opinions expressed in articles appearingin TR News are those of the authors and do notnecessarily reflect the views of the TransportationResearch Board. The Transportation Research Boardand TR News do not endorse products of manufac-turers. Trade and manufacturers’ names appear in anarticle only because they are considered essential toits object.
Printed in the United States of America.
Copyright © 2006 Transportation Research Board.All rights reserved.
C O M I N G N E X T I S S U E
28 SIGNALSThe Dramatic Failure of U.S. Traffic Safety Policy:Engineering Is Important, Public Policy Is CrucialLeonard EvansUntil the mid-1960s, the United States was the world leader in traffic safety, but by2002, the nation’s ranking had dropped from 1st to 16th place in terms of deathsper registered vehicle. If the focus of U.S. traffic safety policy would shift fromvehicle factors to such road-user behaviors as speeding, alcohol consumption,traffic law violation, and belt wearing, the number of fatalities could be reduced byhalf, this researcher and safety expert argues.
A L S O I N T H I S I S S U E :
32 Research Pays OffBikeways to Prosperity:Assessing the Economic Impact of Bicycle FacilitiesJudson J. Lawrie, Thomas P. Norman, Mary Meletiou, and Sarah W. O’Brien
34 ProfilesTransportation attorney Michael E. Tardif and transportation policyadviser John Mason
36 TRB Highlights
38 Bookshelf
40 Calendar
How can researchers find the fast lanes on the transportation information super-highway? Articles in the March–April TR News offer practical pointers and newdirections. Photographic highlights and summary reports from TRB’s 85th AnnualMeeting round out the issue.
U.S. Secretary of Transportation Norman Mineta cuts the ribbon to inaugurate the nationalcelebration of the 50th anniversary of the Interstate Highway System, January 23, at theAmerican Association of State Highway and Transportation Officials (AASHTO) exhibit atthe TRB 85th Annual Meeting. Participants include (front row, left to right:) William W.Millar, American Public Transportation Association; Gary Ridley, Oklahoma Department ofTransportation (DOT); Gloria Jean Jeff, Michigan DOT; Robert E. Skinner, Jr., TRB; SecretaryMineta; John C. Horsley, AASHTO; and T. Peter Ruane, American Road and TransportationBuilders Association.
CA
BLE R
ISDO
N

TR NEW
S 242 JANUARY–FEBRUARY 2006
3
The author is DeputyChief Planner,Department of CapitalProgram Management,New York City Transit.
The subway has shaped New York City.More than any other public works pro-gram or municipal project, the subway hasshaped the city’s development and sus-
tained its global competitiveness over the past 100years. The subway’s profound impact on the city’sgrowth and development—particularly in the outerboroughs—surpasses that of the city’s other widelyacclaimed infrastructure projects, such as the Brook-lyn Bridge and Robert Moses’ highway network.
The innovative, early 20th century transit systemstill serves the 21st century metropolis well—a trib-ute to visionary planning and advanced engineeringdesign. The October 2004 centennial of New York’sfirst subway line provides an occasion to look back athow dramatically the city was transformed in the yearsthat the subways were built.
Forging a VisionNew York City’s rapid transformation into the leadingmetropolis of the United States was linked inextricablyto improvements in the transportation infrastructurethat overcame a challenging geography. An urban arch-ipelago, New York capitalized in the early 19th centuryon an unusually good system of rivers and bays to growfrom a settlement of 60,000 clustered in southern Man-hattan to a booming port city of almost 3.5 million by1900, when it was second in the world only to London.
Establishing itself as the nation’s leading financialcenter and a magnet for business and employment,New York faced a troubling paradox. The most con-gested and populous city was attracting ever-increas-ing numbers of immigrants. Yet at the same time, thewaterways that had spurred the city’s initial successhad become the most serious impediment to sustained
NEW YORK CITY’SSUBWAY CENTURY
Rail Transit’s Role in Growth and DevelopmentT H O M A S R . J A B L O N S K I
(Photo above:) Subwaytrain prepares to leaveTimes Square 42nd Streetstation, October 27,2004—the 100thanniversary of thesystem’s opening.
PHO
TOB
YM
IKE
SEG
AR, R
EUTE
RS
TR N
EWS
242
JAN
UARY
–FEB
RUAR
Y 20
06
4
growth by severely limiting the areas where peoplecould live within a practical commute to jobs.
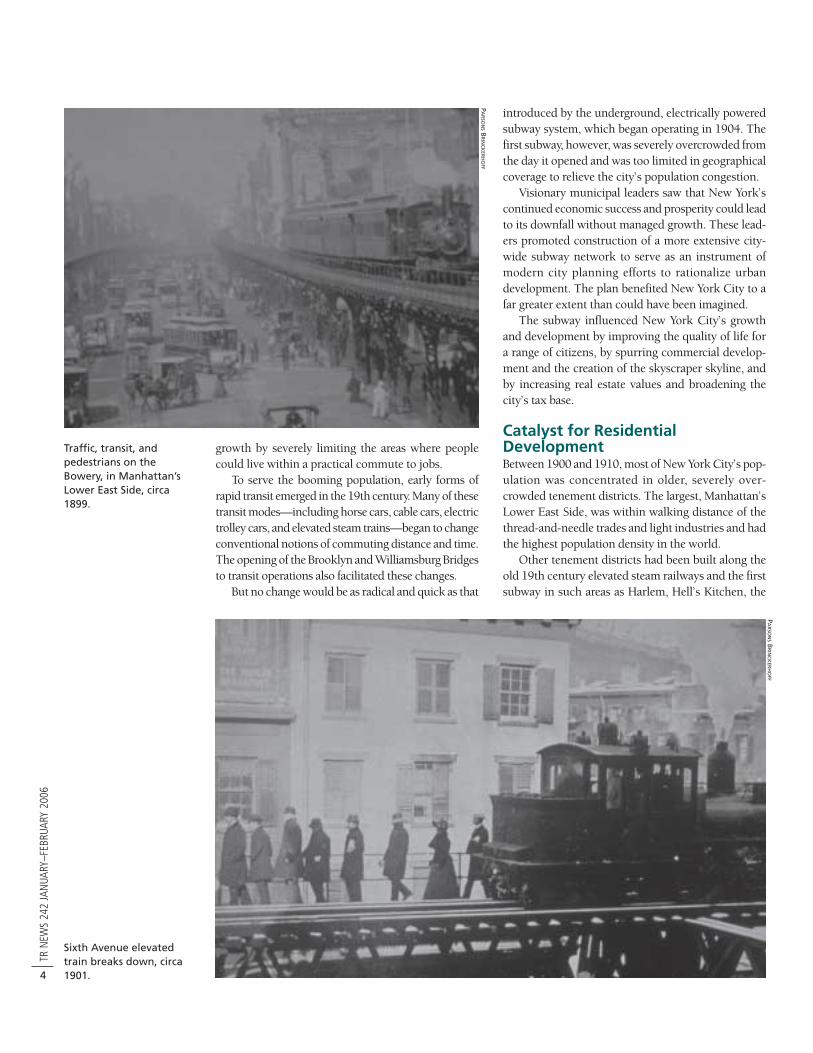
To serve the booming population, early forms ofrapid transit emerged in the 19th century. Many of thesetransit modes—including horse cars, cable cars, electrictrolley cars, and elevated steam trains—began to changeconventional notions of commuting distance and time.The opening of the Brooklyn and Williamsburg Bridgesto transit operations also facilitated these changes.
But no change would be as radical and quick as that
introduced by the underground, electrically poweredsubway system, which began operating in 1904. Thefirst subway, however, was severely overcrowded fromthe day it opened and was too limited in geographicalcoverage to relieve the city’s population congestion.
Visionary municipal leaders saw that New York’scontinued economic success and prosperity could leadto its downfall without managed growth. These lead-ers promoted construction of a more extensive city-wide subway network to serve as an instrument ofmodern city planning efforts to rationalize urbandevelopment. The plan benefited New York City to afar greater extent than could have been imagined.
The subway influenced New York City’s growthand development by improving the quality of life fora range of citizens, by spurring commercial develop-ment and the creation of the skyscraper skyline, andby increasing real estate values and broadening thecity’s tax base.
Catalyst for ResidentialDevelopmentBetween 1900 and 1910, most of New York City’s pop-ulation was concentrated in older, severely over-crowded tenement districts. The largest, Manhattan’sLower East Side, was within walking distance of thethread-and-needle trades and light industries and hadthe highest population density in the world.
Other tenement districts had been built along theold 19th century elevated steam railways and the firstsubway in such areas as Harlem, Hell’s Kitchen, the
Sixth Avenue elevatedtrain breaks down, circa1901.
Traffic, transit, andpedestrians on theBowery, in Manhattan’sLower East Side, circa1899.
PA
RSO
NS
BR
INC
KER
HO
FF
PA
RSO
NS
BR
INC
KER
HO
FF
TR NEW
S 242 JANUARY–FEBRUARY 2006
5
South Bronx, and Brooklyn’s Williamsburg and Bush-wick neighborhoods. New immigrants, many fromsouthern and eastern Europe, continued to crowd intoa limited supply of low-quality tenement buildings inthese districts.
The tenements lacked natural light and fresh airflow, and the cramped apartments did not have hotrunning water or private bathrooms. Contagious dis-eases and a variety of criminal activities proliferated.This bleak situation persisted despite the availability ofvast expanses of open or underdeveloped land in otherparts of Greater New York.
Manhattan’s average population density in 1910was 189 residents per acre (RPA), compared withBrooklyn (45 RPA), the Bronx (21 RPA), and Queens(5 RPA). These less crowded sections composednearly three-quarters of Greater New York’s land areabut housed less than 20 percent of its population,because the daily commuting time and cost to andfrom Manhattan’s employment districts were notpractical.
The threats from population congestion to thewider society spurred the massive expansion of NewYork’s subway system between 1913 and 1940. Duringthis era, the city built 180 route-miles of subwaylines—including 12 bridge and subaqeous tunnelcrossings—effectively overcoming the river barriersto integrate Manhattan geographically with Brooklyn,Queens, and the Bronx.
As a result, a greater amount of land was opened fordevelopment than at any other time in the city’s his-tory. Developers followed the new subway lines andextensions to construct decent, affordable, low-densityhousing for middle-class and working-class families.The bucolic, rural landscape of the city’s outlying areaswas quickly replaced by long rows of tree-shadedstreets with a mix of apartment houses, private single-and two-family homes, and open recreational spaces.
The expanded subway’s low-cost five-cent fare,devalued by significant inflation during World War I,was within the reach of even the poorest person inthe city. This was the primary catalyst for the devel-opment of new residential neighborhoods in theouter boroughs, allowing dispersal of the city’s grow-ing population.
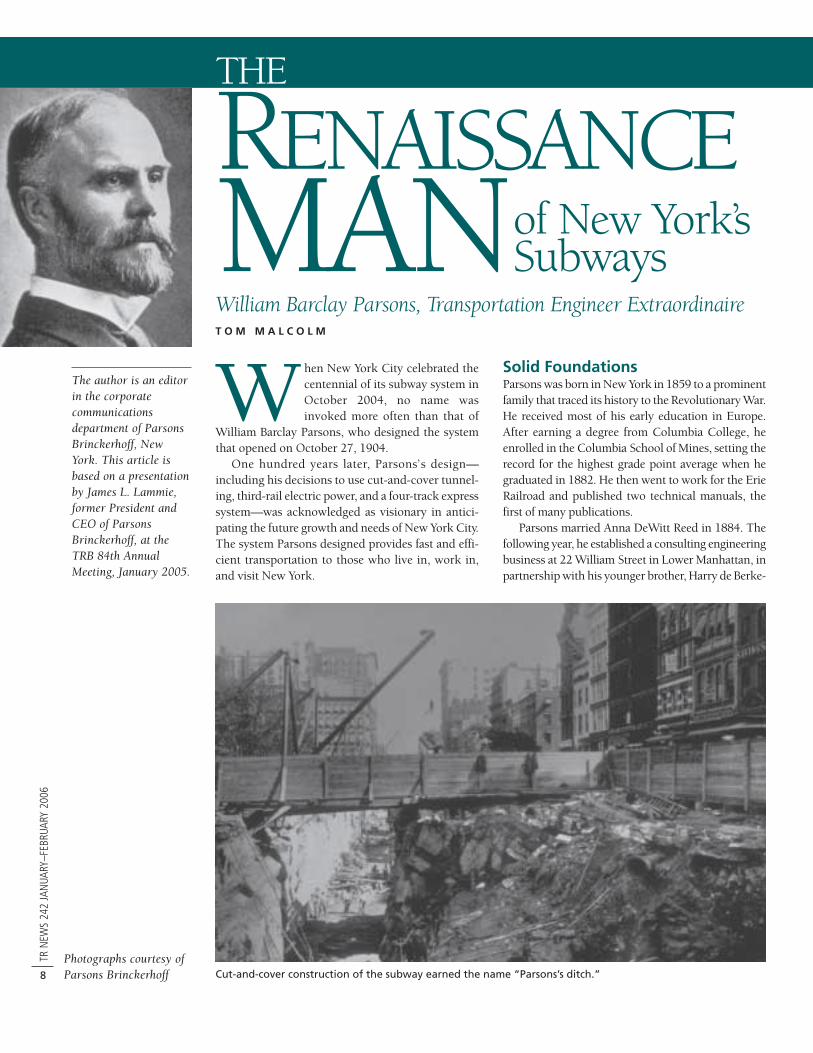
Most of the city’s net population growth from 1910to 1940 occurred within the new transit-orienteddevelopments, as the population density outside ofManhattan increased with the construction of newsubway lines (Figure 1). The city’s population rosesteadily until about 1930, when the InterboroughRapid Transit (IRT) and Brooklyn-Manhattan Transit(BMT) subway lines were largely completed. Growthcontinued at a slower rate until 1940, as the Indepen-dent (IND) subway lines were built.
The IRT and BMT lines reached into undevelopedareas; the IND reinforced many lines already in service.By 1940, nearly 90 percent of the city’s population of7.5 million lived within one-half mile of a subway oran elevated rapid transit line.
By reducing the early 20th century problems ofpopulation congestion, the subway improved the qual-ity of life for New Yorkers—an enduring legacy.
Building a Vertical City Four technological innovations of the late 19th cen-tury enabled the skyscraper—the “ultimate architec-ture of capitalism” and the symbol of New York’sfinancial preeminence—to dominate Manhattan’s sky-line. These were the passenger elevator; metal-skele-ton construction, which replaced load-bearingmasonry walls with cast iron and later with structuralsteel; electric power and light; and rapid transit.
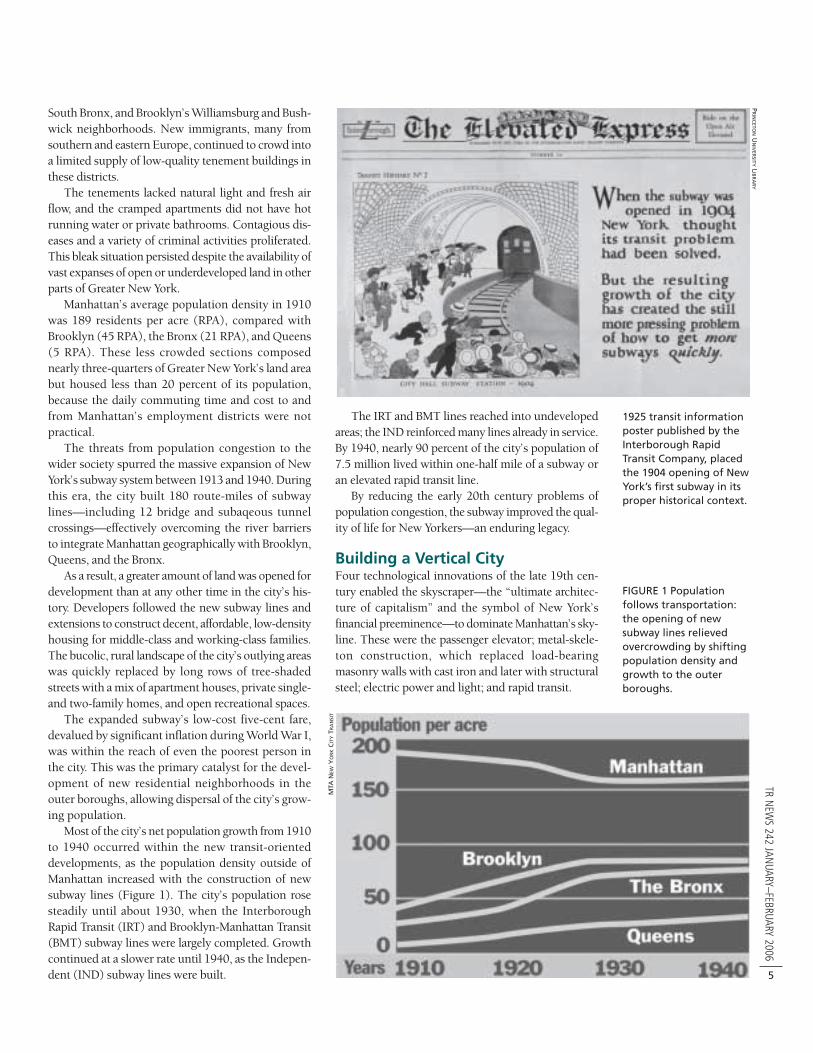
1925 transit informationposter published by theInterborough RapidTransit Company, placedthe 1904 opening of NewYork’s first subway in itsproper historical context.
FIGURE 1 Populationfollows transportation:the opening of newsubway lines relievedovercrowding by shiftingpopulation density andgrowth to the outerboroughs.
MTA
NEW
YO
RK
CIT
YTR
AN
SIT
PR
INC
ETON
UN
IVER
SITYL
IBR
AR
Y

TR N
EWS
242
JAN
UARY
–FEB
RUAR
Y 20
06
6
Pivotal in spreading out the city’s residential areasgeographically, the subway also played a role in NewYork’s development into a vertical city of skyscrapers.The subway made possible an extraordinary density ofdaytime worker populations in Manhattan’s centralbusiness districts—the subway’s capacity, speed, andaffordability enabled hundreds of thousands of peopleto commute to jobs in Manhattan; moreover, the sub-way provided Manhattan-based businesses with accessto labor, influencing continued growth.
When the subway opened in 1904, Lower Man-hattan already was the world’s largest office buildingdistrict, served by earlier forms of rapid transit, includ-ing the Manhattan elevated steam railways and theBrooklyn Bridge’s elevated cable railway. With the con-struction of additional subway lines in Lower Man-hattan, more and taller office buildings were built tomeet the demand for office space in prime locations.
With the completion of the IRT and BMT lines,subway station entrances were near every concentra-tion of employment. Without this accessibility, trafficcongestion would have stunted New York’s economicgrowth and development.
Midtown Manhattan’s transformation from a fash-ionable 19th century residential area into a leadingretail district began before the first subway opened. In1902, Macy’s Department Store relocated from 14thStreet and Sixth Avenue to Herald Square, one blockfrom the planned construction of the PennsylvaniaRailroad Station, and other department stores and spe-cialty shops soon followed. The subsequent construc-
tion of the IRT and BMT lines, together with the recon-struction and improvement of Grand Central Termi-nal, added impetus to the northward movement ofdevelopment.
Throughout the 1920s, although the financial dis-trict remained the focus of new office building devel-opment, the Midtown area evolved into Manhattan’ssecond central business district. By 1935, the 60 mil-lion square feet of office space in Midtown surpassedthe 55 million in Lower Manhattan.
Manhattan’s signature art deco skyscrapers, theChrysler and Empire State Buildings, were con-structed close to Midtown subway lines. Times Square,at the nexus of several subway lines, quickly devel-oped into the city’s premier hotel, theater, and enter-tainment district and became known as the“crossroads of the world.”
The subways brought huge crowds to the sky-scrapers and theaters. This type and density of devel-opment, in turn, made the need for subways acute.
Broadening the Tax BaseAs the subways brought the previously wooded andfarmland areas of Brooklyn, Queens, and the Bronxwithin a reasonable and inexpensive commute toManhattan’s central business districts, the demandfor—and value of—the land increased. The accessi-bility that the subways provided was a primary facili-tator, along with a strong regional economy, themarket demand for new development, and proactivepublic policy support.
The greatest rise in values occurred in the previ-ously undeveloped areas of the outer boroughs, as thepopulation followed the construction of new subwaylines. By 1935, the average value of land in Brooklyn,Queens, and the Bronx within one-half mile of a sub-way line was seven times that of land farther away.
In Manhattan, as land became more expensive, newoffice building developments grew denser and taller tosustain profitability. This necessitated more subways,increasing the land values of commercial developmentsites adjacent to the new subway stations.
The subway’s construction had a redistributiveeffect on land values in Manhattan. The building ofsubways after 1913 accelerated Midtown growth, untilit outpaced Lower Manhattan in size and importance.New Midtown office developments filled up at theexpense of Lower Manhattan’s older buildings. Con-sequently, as more subways were built through eachbusiness district, land values increased in Midtownbut remained stable in Lower Manhattan.
The construction of the IRT and BMT subway linesprovided the accessibility necessary for opening up allparts of the city to development. New York experi-enced a 160 percent increase in land values during
The extension of theFlushing Line alongQueens Boulevard,shown at Rawson Streetin 1917, completelychanged the rurallandscape of Queens,spurring intenseresidential, commercial,and industrialdevelopment.
MTA
NEW
YO
RK
CITY
TR
AN
SIT

TR NEW
S 242 JANUARY–FEBRUARY 2006
7
the 25-year span from 1905 to 1929. The increasedreal estate tax revenues financed many other munici-pal infrastructure improvements, including the con-struction of the IND subway lines during the 1930s.
Coming Full CircleWhen the subway system was largely completed in1940, the city’s growth had reached a maturationpoint, with a population of 7.5 million and 2.9 millionworkers—not much different from today’s 8.1 mil-lion residents and 3.6 million workers. The subwaycontinues to be New York’s lifeline, sustaining its eco-nomic and physical vitality. Without the subway, it isunlikely that New York would have remained a greatcity, the world’s leading city in finance, commerce,and culture for much of the past century.
At the beginning of the 1980s, New Yorkers expe-rienced life without a safe and reliable subway whenthe system nearly collapsed after many years ofneglect. The Metropolitan Transit Authority (MTA)then embarked on one of the biggest public worksrebuilding efforts in American history—a series of cap-ital programs worth more than $40 billion in currentdollars—to restore and reinvigorate the infrastructure.The programs began in 1982, and after nearly a quar-ter of a century of continuous investment, the resultsof the MTA capital programs are apparent. The dra-matically improved subway system has regained pas-sengers in record numbers, making it a primary factorin New York City’s resurgence.
In the 21st century, the subway remains crucial tothe city in keeping and attracting business, holdingand creating jobs, and strengthening the tax base.Continuing the current levels of capital investment iscritically important in the capital program for 2005to 2009 and beyond, to maintain progress andmomentum to bring the entire subway system into astate of good repair, helping to ensure safe, reliable,and efficient service. The capital program will makestrategic investments in new subway infrastructureto relieve congestion and to open up new areas of thecity for development—as was done 100 years ago.
ResourcesDerrick, Peter. Tunneling to the Future: The Story of the Great Sub-
way Expansion That Saved New York. New York UniversityPress, 2001.
Hood, Clifton. 722 Miles: The Building of the Subways and HowThey Transformed New York. Simon and Schuster, New York,1993.
Law, Edward M. Real Estate Values and Population GrowthAlong Rapid Transit Lines in the City of New York, Munici-pal Engineers Journal, 1935.
Plant, Irving M. Population Growth of New York City by Districts,1910–1948. Consolidated Edison Company of New York,December 1948.
Spengler, Edwin H. Land Values in New York in Relation to Tran-sit Facilities. Columbia University Studies in History, Eco-nomics and Public Law, No. 333. Columbia University Press,New York, 1930.
Willis, Carol. Form Follows Finance: Skyscrapers and Skylines inNew York and Chicago. Princeton Architectural Press, NewYork, 1995.
The subways encouragedManhattan’s densecommercial growth. Thecity’s iconic skyscraperswould have beenimpractical without thecapacity, speed, andaffordability of subwayservice for Manhattan’shundreds of thousands ofworkers.
TR N
EWS
242
JAN
UARY
–FEB
RUAR
Y 20
06
8
When New York City celebrated thecentennial of its subway system inOctober 2004, no name wasinvoked more often than that of
William Barclay Parsons, who designed the systemthat opened on October 27, 1904.
One hundred years later, Parsons’s design—including his decisions to use cut-and-cover tunnel-ing, third-rail electric power, and a four-track expresssystem—was acknowledged as visionary in antici-pating the future growth and needs of New York City.The system Parsons designed provides fast and effi-cient transportation to those who live in, work in,and visit New York.
Solid FoundationsParsons was born in New York in 1859 to a prominentfamily that traced its history to the Revolutionary War.He received most of his early education in Europe.After earning a degree from Columbia College, heenrolled in the Columbia School of Mines, setting therecord for the highest grade point average when hegraduated in 1882. He then went to work for the ErieRailroad and published two technical manuals, thefirst of many publications.
Parsons married Anna DeWitt Reed in 1884. Thefollowing year, he established a consulting engineeringbusiness at 22 William Street in Lower Manhattan, inpartnership with his younger brother, Harry de Berke-
The author is an editorin the corporatecommunicationsdepartment of ParsonsBrinckerhoff, NewYork. This article isbased on a presentationby James L. Lammie,former President andCEO of ParsonsBrinckerhoff, at theTRB 84th AnnualMeeting, January 2005.
RENAISSANCEMANTHE
of New York’sSubways
William Barclay Parsons, Transportation Engineer Extraordinaire
Cut-and-cover construction of the subway earned the name “Parsons’s ditch.”
T O M M A L C O L M
Photographs courtesy ofParsons Brinckerhoff

ley Parsons, a mechanical engineer. The brothers col-laborated on railroads, bridges, water supply systems,and hydroelectric plants. The firm continues today asParsons Brinckerhoff, with headquarters in New YorkCity and 9,000 employees in 150 offices worldwide.
Subway DreamsPlans for subterranean mass transit in New York Citydate to the mid-19th century. In 1870, inventor AlfredEly Beach built a block-long pneumatic tube subway,powered by a large fan, underneath Broadway.Although the scheme elicited amazement, it was not apractical, large-scale solution to the city’s need formass transit. New York continued to rely on a networkof elevated railroads, streetcars, and horse-drawn car-riages. Meanwhile, London opened the world’s firstsubway in 1863.
Parsons initially allied with the Arcade Railwaygroup, which offered a plan first proposed in 1866 tocreate an underground street below Broadway with afour-track rail flanked by sidewalks and stores. Parsonseventually broke away from the Arcade Railway and in1885 joined the rival New York District Railway.
The District Railway proposed a shallow excava-tion with an improved ventilation system designed byParsons. In 1887, New York Mayor Abram S. Hewittpublicly identified Parsons as the leading expert onsubways, and when the city formed a Rapid TransitCommission in 1891, Parsons was named deputychief engineer.
The commission sought bids for its plan butreceived none. In 1894, the commission reorganizedand chose the 35-year-old Parsons as chief engineer—an appointment that met open skepticism from some.
“When I look back now I am glad I was not older,”Parsons later remarked. “I doubt if I could now under-take or would undertake such a work under similarconditions….If I had fully realized what was ahead ofme, I do not think I would have attempted the work.As it was I was treated as a visionary. Some of my
friends spoke pityingly of my wasting my time onwhat they considered a dream.”
In 1898, before he began work in earnest on theNew York City subway, Parsons traveled to China tochart the course of a railroad from Hankow (Wu-Han)to Canton (Guangzhou) through Hunan Province.For a stretch of 500 miles, Parsons was “the first for-eigner ever seen,” according to his memoir, An Amer-ican Engineer in China.
Parsons also took time to study firsthand the greatunderground transit systems in operation or plannedin Europe. He traveled to London, Paris, and cities inseveral other countries. This survey convinced himthat electric power would be superior to coal-firedsteam, and that a system of shallow tunnels built bycut-and-cover construction would be preferable to thedeep tunnels of the London Underground. The com-mission adopted his report as the guiding documentfor the New York subway.
Parsons’s DesignParsons’s plan called for a rapid transit systembeginning at City Hall in downtown Manhattan andextending northward through Harlem to Washing-ton Heights and the Bronx. From City Hall, the lineproceeded north on the east side to what is nowGrand Central Terminal on 42nd Street, thenturned west to Times Square and north towardHarlem along the west side.
Below 96th Street, the system employed a four-track system—two tracks for local service and twotracks for express. At 96th Street, one leg continuednorth to Washington Heights and the Riverdale sec-
TR NEW
S 242 JANUARY–FEBRUARY 2006
9
Parsons swings the pickax to start construction on the subway at Bleecker andGreene Streets.
Charles T. Harvey, who designed and promoted theWest Side and Yonkers Patent Railway, runs a test onGreenwich Street, 1867. The system experiencedfrequent breakdowns and closed in 1870.

TR N
EWS
242
JAN
UARY
–FEB
RUAR
Y 20
06
10
tion of the Bronx; another leg veered east and termi-nated near the Bronx Zoo.
The initial system traversed 20.5 miles, including5 miles of viaduct and 3 miles of deep-bore tunnel.Most of the line was built with cut-and-cover con-struction—workers dug a shallow trench, removed orrerouted the utilities, covered the trench, and built arectangular box for the subway underneath.
Although it was the preferred constructionmethod, cut-and-cover disrupted normal life andcommerce. During construction, the subway wasderided as “Parsons’s ditch.” More than 3 millioncubic yards of earth and rock were excavated to makeway for the subway.
Three sections required deep tunneling—alongPark Avenue from 34th Street to 42nd Street; underthe northwest corner of Central Park; and from 157thStreet to Fort George in Washington Heights. The tun-nel under the Harlem River was built with an early ver-sion of the immersed tube method. The ManhattanValley viaduct included a renowned trussed archbridge still standing today at 125th Street.
Most stations were accessible by stairs, whichaccommodated larger crowds than would have beenpossible with elevators or escalators. Glass-block ceil-ings and grates provided natural light. Electric powerwas supplied from a remote generating station—ahuge powerhouse on the city’s west side—and con-veyed to the trains via a third rail (co-invented by Par-sons’s eventual partner, Henry Brinckerhoff).
The stairways and “blowholes” in the roof venti-lated the subway. Although the air quality was docu-
At Broadway and 125th Street, the first subway linecrossed a trussed arch bridge, still standing today.
Workers at 149th Street and Courtlandt Avenue in the Bronx, September 1902.
Construction of the tunnel under the Harlem River to connect Manhattan and the Bronxused an early version of the immersed tube method.

TR NEW
S 242 JANUARY–FEBRUARY 2006
11
mented as satisfactory, excessive heat and insufficientventilation were complaints—Parsons had used sixlayers of waterproofing to control water inflow. In1905, work began on adding ventilation chambers,sidewalk gratings, mechanical fans, automatic louvers,and an experimental cooling plant at the BrooklynBridge station to improve ventilation.
The Rapid Transit Construction Company, con-trolled by financier August Belmont, built the subwayunder a concession granted by the city. John B.McDonald was the contractor, and 10,000 to 12,000men were employed to build the 20.5-mile system ata cost estimated by newspapers of the day at $50 mil-lion to $65 million, including equipment.
As chief engineer of the city’s Rapid Transit Com-mission, Parsons had “sweeping powers of supervi-sion” during the construction, according to an accountproduced by Belmont’s Interborough Rapid Transit(IRT) Company. The IRT subway line was an earlyand outstanding example of a public–private partner-ship for producing public infrastructure through adesign–build–operate–maintain arrangement.
Opening DayThe initial leg of the system, from City Hall to 145thStreet, a distance of 9.1 miles, opened to the public justfour-and-a-half years after construction began in 1900.The opening ceremony, October 27, 1904, was a lav-ish public spectacle. Mayor George McClellan tookthe controls of the first train to leave City Hall andpiloted it—somewhat haphazardly, according toaccounts—to 103rd Street; an official motorman thendrove the train to 145th Street. The inaugural ride, at
an estimated 25 miles per hour, took about 26 min-utes, reaching 96th Street—the traditional boundaryof Harlem—in 17 minutes, more or less justifying theslogan, “From City Hall to Harlem in 15 minutes.”
An estimated 150,000 New Yorkers rode the sub-way on opening day. Newspaper reports varied.
“There was lots of noise of the hilarious, buoyantsort, a great deal of celebrating of the inoffensive kind,no end of joking and holiday spirit,” according to TheWorld. The New York Daily Tribune, however, reported“indescribable scenes of crowding and confusion,never before paralleled in this city.”
The public and the press greeted the new subwaywith almost universal acclaim. “The subway is abeauty,” said Mayor McClellan. “It is greater than anyof us dared dream.”
The Sun declared, “This is the finest, handsomest,most complete and best equipped underground rail-way in the world.”
The powerhouse for the subway system was located on Manhattan’s west side.
City Hall Station was the starting point for the initialleg of the subway system.

TR N
EWS
242
JAN
UARY
–FEB
RUAR
Y 20
06
12
The New York Times called the subway “the great-est achievement of the time in municipal engineering”and noted that Parsons “had [proved] that great pub-lic works may be carried to completion with an unsul-lied reputation and clean hands.”
The Globe wrote that the subway “will stand on the records as an enduring monument to [Parsons’s] genius.”
Parsons resigned from the Rapid Transit Commis-sion shortly after the opening, although he collabo-rated again with August Belmont on the Steinway(Queensboro) Tunnel. The tunnel opened in 1907 andbrought the subway to Queens under the East River.
Parsons also consulted on transit systems around theworld. He was advisory engineer to the Royal Commis-sion on London Traffic and was appointed a director ofthe London Tube in 1908. He chaired the Chicago Tran-sit Commission, contributed designs for subways inBoston and Philadelphia, and served as a transportationadviser to San Francisco, Toronto, and Detroit.
The Subway After ParsonsParsons foresaw that the subway system he designedwould grow to meet the demands of the city’s rapidlyexpanding population and the movement of peoplefrom downtown to the outer boroughs. The day afterthe opening, he said, “The railroad is not expected tobe all that New York City should have, but…is hopedto be but a beginning of a comprehensive system suchas future generations of New Yorkers and theinevitable growth of the city will require.”
As Parsons predicted, the subway expanded duringthe early 20th century as rival concerns, including theBrooklyn–Manhattan Transit Corporation (BMT) andthe city-owned Independent Subway System (IND),built lines that competed for passengers. In 1940, NewYork City took control of the three lines—the IRT,BMT, and IND—and consolidated them. New YorkCity Transit, an agency of the Metropolitan Transpor-tation Authority, now owns and operates the system,which includes 722 miles of rapid transit, with 26lines and 468 stations in four boroughs, and whichtransports 7.7 million passengers each weekday.
Canals and Other Projects After his resignation from the Rapid Transit Commis-sion, Parsons was appointed to the Isthmian CanalCommission and the Board of Consulting Engineers todevelop recommendations for the Panama Canal.President Theodore Roosevelt overruled the board’srecommendation for a sea-level canal and optedinstead for a canal with locks.
Parsons went on to design a sea-level route for theCape Cod Canal in Massachusetts, a formidable proj-ect he undertook in partnership with Belmont. At the1907 groundbreaking, Belmont likened previousattempts to build a canal to the experience with thesubways: “The subways in New York went through thesame [thing] for 20 years or more. Our engineer,William Barclay Parsons, is just as sanguine about thisas he was about them, and so am I.”
Nonetheless, Belmont and Parsons underesti-mated the difficulty of constructing the canal. When
Digging out the Steinway Tunnel below the East River, to connect Manhattan andQueens by subway.
Subway cars at 125thStreet, 1904.

TR NEW
S 242 JANUARY–FEBRUARY 2006
13
it opened in 1914, the canal proved difficult to navi-gate and did not fulfill the intended goals. In 1928,the U.S. Army Corps of Engineers assumed control ofthe canal and made it commercially successful, bydeepening, widening, and lengthening it, making itthen the widest artificial waterway in the world.
On Engineering In his writings, Parsons offered opinions on the roleand the obligations of the engineer in society. Herejected the view that engineers are narrow technicalspecialists, and argued that engineers and engineeringcan influence social and economic development: “Ofall human activities, engineering is the one that entersmost into our lives, that gives us our means of living,and permeates every fiber of the social fabric.”
He said that an engineer must have two abilities:“First, the technical skill; and second, the mind andthe knowledge to conceive that which is useful andwill be for the convenience of mankind in the longrun….It is not the design that governs [a project]but its adaptability to the economics and socialneeds of the time.” He argued that engineers must“have the imagination to conceive all solutions andthe courage to innovate.”
Parsons was also prescient in noting that the com-plexity of designing and building modern infrastruc-ture would demand that engineers be well-roundedmanagers in addition to technicians. “The engineer oftoday, and more especially of the future, will...be con-cerned not only with his calculations but also will haveto study men and their needs, questions of industrialdemand, the law of finance, and much in regard to leg-islation. His it will be to conceive, to plan, to design, toexecute, and then to manage.”
Renaissance ManBest known for his work on the New York City sub-way, Parsons also was a renowned military engineer, aprolific author, and a respected community leader inNew York City.
When the United States entered World War I in1917, Parsons was 58 years old, but he left his engi-neering practice to command the legendary EleventhEngineers Regiment—the “fighting engineers”—ofthe First Army. The Eleventh Engineers built roads,railroads, bridges, and docks and also engaged in com-bat. In Cambrai, France, in 1917, some fought withpicks and shovels before retrieving their weapons dur-ing a German attack.
For his service to the Allied cause, Parsonsreceived many honors, including the DistinguishedService Order of Britain, the Office of the Legion ofHonor of France, and the Order of the Crown ofBelgium. In 1919 he was promoted to Brigadier
General, although he preferred the title of Colonel,which is carved on his gravestone.
Parsons recounted the experience of the EleventhEngineers in his book, The American Engineers inFrance. Profoundly moved by the devastation of thewar, he dedicated the book to “the memory of all theAmerican engineers who fell in France...as a smalltribute of admiration and respect.”
A prominent citizen of early 20th century NewYork, Parsons served as a member of the board oftrustees of the New York Public Library from 1911 to1932 and as a trustee of his alma mater, ColumbiaUniversity, for 35 years, including terms as chairmanfrom 1917 to 1932. He also chaired the administrativebody of Columbia–Presbyterian Medical Center; hedrove in the structure’s final rivet on May 24, 1926. Hewas a vestryman and warden of New York’s TrinityChurch, a trustee of the Carnegie Institution, and a fel-low of the National Academy of Arts and Sciences.
Parsons’s interest in Mayan culture led to the dis-covery of significant archeological artifacts in theYucatan Peninsula. He admired the engineer andinventor Robert Fulton and authored the book, RobertFulton and the Submarine.
Parsons devoted the latter part of his life toresearching and writing the 651-page Engineers andEngineering in the Renaissance, an exhaustiveaccount of the major figures and their accomplish-ments. After doing research at the Vatican library, heproposed a cataloging system that was approved byPope Pius XI and implemented with assistance fromthe Carnegie Institution.
Parsons died in 1932 at the age of 73, with out-standing accomplishments in engineering, letters,military service, and philanthropy. His friend,Nicholas Murray Butler, president of Columbia Uni-versity, said that Parsons was “a true representative ofthe culture and refinement of old New York, and hisinterest in education, in religion, philanthropy, and inpublic service all came as naturally to him as did theordinary incidents of life.”
Parsons had explained his own accomplishmentswith characteristic modesty, pointing only to perse-verance and hard work.
“I have failed utterly to discover any substitute forhard work,” he wrote. “I have found nothing to takethe place of midnight oil. I am at a loss to know howto succeed except by plugging.”
ResourcesBobrick, Benson. Labyrinths of Iron: A History of the World’s Sub-
ways. Quill William Morrow, New York, 1981. Bobrick, Benson. Parsons Brinckerhoff: The First 100 Years. Van
Nostrand Reinhold Company, New York, 1985. Interborough Rapid Transit Company, the New York Subway: Its
Construction and Equipment. Arno Press, New York, 1904.
Parsons commanded the“fighting engineers” of theFirst Army’s Eleventh EngineersRegiment in World War I.
TR N
EWS
242
JAN
UARY
–FEB
RUAR
Y 20
06
14
The author is SeniorResident Fellow,Transportation andInfrastructure, UrbanLand Institute,Washington, D.C., and amember of the TRBTransportation and LandUse Committee.
Current interest in public transit invest-ments is enormous. The challenge is tocreate the supporting development thatwill make the investments work.
The Federal Transit Administration recentlyapproved funding for projects in Phoenix, Arizona,and Charlotte, North Carolina. The two join the ranksof light rail cities, which in recent years have addedHouston, Texas; Las Vegas, Nevada; and Minneapolis,Minnesota—regions in which transit had capturedonly 3 to 5 percent of commuters in 2000.
In spreading from traditional markets such as NewYork, Chicago, and San Francisco to nontraditionalmarkets in the South, Midwest, and West, transit facesa twofold challenge. The first challenge is for advocatesto convince the larger community that transit willwork—that it will serve middle-class people who areaccustomed to driving. The second and more difficultchallenge is making the case that compact, urbandevelopment around transit will work to generate theridership necessary to support the new project.
This kind of smart growth linked to transit is alsonecessary in established markets that have grown uparound transit. Ironically, residents in some traditionaltransit cities such as Boston and Cleveland do notbelieve that they have any transit-oriented develop-ment, which is perceived as more of a West Coast,
new urbanist phenomenon—that is, allied with smartgrowth and walkable communities that are large sub-urban planned developments.
Aspects of a ConundrumThe conundrum is that much of the interest in newtransit investments is occurring in places where tran-sit is a novelty, yet many established transit markets arestruggling to maintain services. A national survey, con-ducted under the Transportation Research Board’sTransit Cooperative Research Program, identifiedapproximately 100 transit-oriented developments inthe United States.1 This is a paltry number, which sug-gests either that not much is occurring or that the sizeof this market is severely underrepresented in the sur-vey results, considering the vast amount of attentiondevoted to the topic of transit-oriented development inthe planning and transit literature.
A new book by the Urban Land Institute, Develop-ing Around Transit: Strategies and Solutions That Work,avoids the term transit-oriented development buthighlights examples that meet the goals, whether ornot the developers or the cities acknowledge it (1).
Another aspect of the conundrum is that from a
Developing Around TransitR O B E R T T . D U N P H Y
P O I N T O F V I E W
Challengesfor Cities
andSuburbs
1 Transit Cooperative Research Program Project H-27,Transit-Oriented Development: State of the Practice andFuture Benefits.
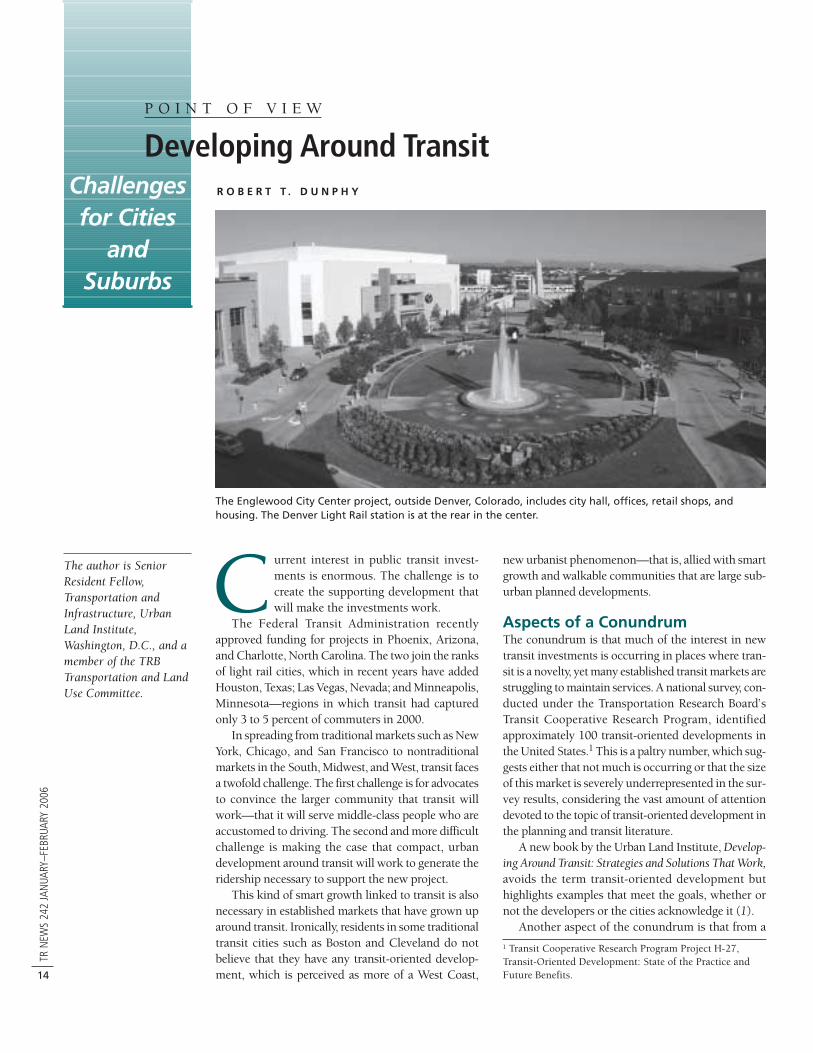
The Englewood City Center project, outside Denver, Colorado, includes city hall, offices, retail shops, andhousing. The Denver Light Rail station is at the rear in the center.

TR NEW
S 242 JANUARY–FEBRUARY 2006
15
transit perspective, urban projects yield the greatestleverage in expanding transit ridership and support-ing transit services. New housing and offices inneighborhoods with good transit service create addi-tional transit riders, often without the need foradding transit service. Neighborhoods accessible totransit also give options to new residents who wouldlike to avoid driving.
Reshaping DevelopmentBuilding in established urban areas is friendly to tran-sit, but unfriendly to development. Projects takelonger and are more expensive to build. The market isoften unproven—the risks are high, and profits areuncertain. In contrast, conventional suburban projectsare development-friendly, but transit-unfriendly. Mostgrowth is expected in the suburbs; therefore the chal-lenge is to reshape conventional development to cre-ate the kind of vibrant places that offer transit choices.
The market opportunities for urban infill develop-ment are excellent in many older areas, with youngprofessionals and empty nesters seeking a more urbanlifestyle, and with employers seeking neighborhoodsthat offer more employee amenities. In the report,Emerging Trends in Real Estate: 2005, the Urban LandInstitute and PricewaterhouseCoopers ranked theareas near transit highest for development and invest-ment, reflecting the appeal of infill development, aswell as the public’s frustration with traffic congestion.
Development, however, does not occur justbecause of transit. Block 37 in downtown Chicago, forexample, has been vacant since 1990, when the citycleared the land for mixed-use development. The loca-tion is excellent, but the vagaries of the marketplacehave foiled the city’s plans to create a mixed-use devel-opment in one phase—the office market lacked suffi-cient depth when retail business was strong, and vice
versa. When the city relaxed the requirement for sin-gle-phase development, a new developer with a retailorientation gave the project new momentum. Theexperience demonstrates that in urban infill develop-ment, a strong location cannot make up for soft mar-ket conditions or unrealistic expectations.
The first mixed-use transit project in Texas, Mock-ingbird Station is located adjacent to a Dallas AreaRapid Transit light rail station. The developer under-stood the appeal of in-town living near transit,although the city would not assist with pedestrianimprovements and would not relax parking standardsbecause of the light rail. In contrast, Dallas suburbssuch as Richardson and Plano have created moreurban development around their transit stations.
Markets and PoliciesReinforcing a strong market with consistent public poli-cies can turn individual projects into successful transitdistricts. One of the best examples in the United Statesis the Rosslyn–Ballston corridor in Arlington, Virginia.The vision that developed three decades ago with thesupport of public officials and civic leaders has turneda once-declining strip into a vibrant mix of office, high-density residential, retail, dining, and entertainment.The development is a massive fiscal success, givingArlington County the region’s lowest tax rate.
Successful development around transit is a chal-lenge for cities and suburbs. The transit project mustbe attuned to the needs of the real estate developmentmarket, and developers in turn must appreciate thespecial opportunities of transit.
Reference1. Dunphy, R., R. Cervero, F. Dock, M. McAvey, and D. Porter.
Developing Around Transit: Strategies and Solutions That
Work. Urban Land Institute, Washington, D.C., 2005.
POINT OF VIEW presentsopinions of contributingauthors on transporta-tion issues. The viewsexpressed are not neces-sarily those of TRB orTR News. Readers areencouraged to commentin a letter to the editor onthe issues and opinionspresented.Block 37 in downtown Chicago was hard to develop
despite the ready benefits of transit access in the Loop.
The Mockingbird Stationresidential developmentstands adjacent to DallasArea Rapid Transit’sMockingbird LaneStation.

TR N
EWS
242
JAN
UARY
–FEB
RUAR
Y 20
06
16
Reports from the Transportation Research Board’s
2005 FIELD VISIT PROGRAM
LABORATORIESFOR
ADDRESSINGCRITICAL ISSUES
State Departments of TransportationTest Out Solutions
State departments of transportation (DOTs) and other transportationorganizations are dealing directly with the challenges identified in
TRB’s recently released edition of Critical Issues in Transportation. Thesecritical issues include
Congestion: increasingly congested facilities across all modes; Emergencies: vulnerability to terrorist strikes and natural disasters; Energy and environment: extraordinary challenges; Equity: burdens on the disadvantaged; Finance: inadequate revenues; Human and intellectual capital: inadequate investment in innovation; Infrastructure: enormous, aging capital stock to maintain; Institutions: 20th century institutions mismatched to 21st century mis-
sions; and Safety: lost leadership in road safety.
More details on these critical issues are available in the special insert in thisissue of TR News and on the TRB website.1 The 2005 field visits yielded manyexamples of how transportation organizations view these critical issues,including perspectives from a variety of disciplines and modes. The field vis-its found that state DOTs and other organizations already are at work toaddress these issues.1 www.TRB.org/publications/general/CriticalIssues06.pdf
Specialists in the Transportation ResearchBoard’s Technical Activities Division identifycurrent issues, collect and generate infor-mation on the issues, and disseminate theinformation throughout the transportationcommunity. The TRB Annual Meeting, TRB-sponsored conferences and workshops,standing committee meetings and commu-nications, publications, and contact withthousands of organizations and individualsprovide TRB staff with information fromthe public and private sectors on all modesof transportation.
A major source of this information is theTRB annual field visit program. TRB staffmeet on-site with representatives of eachstate’s department of transportation andalso with representatives of universities,transit and other modal agencies, andindustry.
This report presents a summary of whatthe TRB staff learned from these visits andactivities over the past year.

TR NEW
S 242 JANUARY–FEBRUARY 2006
17
Institutional IssuesPolicy and OrganizationThe graying of America has affected the transportationsector. State DOTs are grappling with the problem ofworkforce succession.
By 2020, 25 percent of all Americans will be age 65or older. Providing transportation services for thosewho are no longer able to drive will require advanceplanning and significant funding. Moreover, the waveof retirements by baby boomers has created the needto recruit, educate, train, and retain qualified trans-portation professionals as successors.
In the past three years, an estimated 1,400 Pennsyl-vania DOT employees have retired—10 percent of thedepartment’s staff. Other state transportation agenciesacross the nation face similar challenges, with largenumbers of staff expected to retire in the next 10 years.
Training suitable replacements for senior staff hasbegun. Pennsylvania DOT’s Lead Program, for exam-ple, recruits, trains, and provides opportunities forfemale transportation professionals. South Carolina isdeveloping a Resident Engineering Academy to offertraining modules in seven subject areas: intelligenttransportation systems; construction management;administration; environment; materials; hydrologyand draining; and project management. Also offeredare online training tools for maintenance workers.
In addition to educating and training staff for suc-cession to senior-level management, DOTs are seekingways to capture the institutional memory and knowl-edge of veteran employees to pass along to the nextgeneration of leaders. In 2006, TRB is planning a forumfor state DOT CEOs to address this and other issues.
New York State DOT is completely reorganizingunder a process called “the transformation.” Theemphasis is on the DOT’s role as an operator instead
of as a builder of the transportation system. In addi-tion, the transformation takes into account the con-tinually shrinking workforce—the number of full-timeemployees has dropped from 13,000 to 9,000 in thepast 10 years.
Legal IssuesTransportation lawyers have ongoing concerns aboutagreements for the design and construction of projects.Transportation agencies are relying increasingly ondesign–build and on public–private developmentstrategies, whether to complete projects quickly or togain the funding to make a project feasible.
Design–build legislation is in effect or is pending in28 states. The laws are diverse, and many questions areunanswered, creating many issues to be addressed bythe resolution mechanism for contract disputes.
Another pressing issue is contracting with disad-vantaged business enterprises. In Western State Paving,Inc. v. Washington State Department of Transportation etal., the United States Court of Appeals for the NinthCircuit upheld the constitutionality of the disadvan-taged business provisions of the Transportation EquityAct for the 21st Century (TEA-21). The prevailingpolicy in several federal judicial circuits is that Con-gress must make a finding of discrimination to supportthe need for a disadvantaged business program as acomponent of the Congressional program, or a state orlocal government must collect data and make its ownfinding of need. The disadvantaged business programmust be tailored to the need of the jurisdiction inwhich it is established.
In Florida, 18 percent ofthe population is 65and older. By 2020, 25percent of the popu-lation will be 65 orolder, and of these,almost one-half will be75 or older. More than80 percent of tripsmade by those 65 andolder are made in cars.
State law mandatesthat the Idaho Trans-portation Departmentmaintain a staff of1,833. As staffers retire,the department musthave suitable replace-ments available.
In 2005, Missouri DOTstarted MoDOT Tracker,a comprehensivemanagement perfor-mance measurementprogram (www.modot.gov/about/general_info/Tracker.htm) “toassess how well wedeliver services andproducts to ourcustomers.”
Did You Know?
Pennsylvania DOT’s Lead Program has had success increating a leadership path for women on staff.Participation in the program facilitated thepromotions of Jill Reeder (left), a managementanalyst supervisor, and Erin Sodan (right), a humanresource analyst in labor relations, shown with thementoring program’s project manager, ElizabethThrenhauser (center).
Civil engineering students gain first-hand instructionat a highway reconstruction site in Iowa.
IOW
AS
TATE
UN
IVER
SITY

TR N
EWS
242
JAN
UARY
–FEB
RUAR
Y 20
06
18
In the Western State Pavingcase, the court ruled that that theState of Washington was justifiedin relying on the Congressionalfinding; however, the state had notcollected data to determine theextent of discriminatory treatmentof minorities within its jurisdic-tion and therefore could not havetailored a program to remedy theproblem. The decision highlightsthe differences between federalcircuit courts on whether statescan rely on Congressional evi-dence of discrimination or mustestablish their own.
The security of our nation’stransportation system also raises
legal issues. Despite heightened security measures,officials must conduct the routine business of con-structing, maintaining, and operating transportationsystems. Agencies are concerned about preserving theconfidentiality of security-sensitive plans and specifi-cations for public works and transportation projects.Many believe that the legal processes are not sufficientto protect the information.
PlanningTransportation planners are becoming more creativein communicating with stakeholders. Techniquesspan a variety of media and include website postings,face-to-face meetings, and printed reports. Plannersand other transportation professionals rely on these
techniques to present technical information to dif-ferent and diverse audiences, including the generalpublic, staff within the agency and at other agencies,and decision makers.
Communication with the public ranges fromexplanations of how tax dollars are being spent tobriefings on specific transportation issues, such asbicycle safety. Virginia DOT and Washington StateDOT have developed popular web pages and periodicstatus reports to inform the public. Virginia’s “Dash-board” provides a graphic performance report on thedepartment’s projects and programs.2 WashingtonState DOT’s Accountability web page details thedepartment’s progress on issues of interest to the pub-lic, including congestion and construction schedules.3
Frederick City, Maryland, offers “Frederick 101,” asix-week seminar for city residents. City departmentheads lead the seminar, which gives residents anopportunity to learn how the city is governed and tomeet the officials who keep the city operating.
Brown bag lunches and training courses for staffand consultants are other important communicationtools. New goals and procedures increase the needfor communication within agencies. For example,context-sensitive design programs and the newstormwater management requirements necessitatecommunication among DOT staff in all offices andwith contractors.
Resource agencies, other transportation agencies—such as metropolitan planning organizations (MPOs)and transit providers—and local agencies have becomepartners in providing transportation. The partnershipsare critical to achieving the state DOT mission, andcommunication is critical in forging strong partner-ships. The communication can be formal, as with asigned memorandum of understanding, or informal—for example, with regular lunch meetings.
Reports from the Transportation Research Board’s
2005 FIELD VISIT PROGRAM
Design-buildarrangements, whichproduce projects like thePeace River Bridge inFlorida, are subjects ofdiverse legislativeproposals around thestates.
Contracting team withWashington State DOT'sDisadvantaged Minorityand Women's BusinessEnterprise Program workon the new TacomaNarrows Bridge.
Residents who completed the Frederick 101 coursegather for a reception with Mayor Jennifer P.Dougherty (center).
2 http://dashboard.virginiadot.org/default.aspx3 www.wsdot.wa.gov/accountability/default.htm.
JAM
IEL.
FO
X, J
AC
OB
SC
IVIL
, IN
C.
ZO
EE
STRU
S, WSD
OT

TR NEW
S 242 JANUARY–FEBRUARY 2006
19
Energy and EnvironmentTransportation agencies are striving to become betterstewards of the environment. Approaches to air qual-ity, wildlife crossings, stormwater control, and otherenvironmental issues are changing with new researchand practical experience.
Noise is one of the most pervasive environmentalimpacts. To control transportation noise, the profes-sion has embraced a “three-pronged approach” thatinvolves (a) control of the source, (b) land use plan-ning and control, and (c) mitigation at the receivingpoint—or path control.
Quiet pavements—asphalt rubberized with recy-cled tires—are among the promising techniques forcontrolling highway noise at the source and are beingtested across the country. Arizona DOT, for example,has a Quiet Pavement Pilot Program under way inMaricopa County for resurfacing 115 miles of free-way. Early tests show a reduction in noise levels ofabout 4 decibels or more.
In addition to the benefits of noise reduction, theprogram will recycle 1,500 tires for every lane-mileconstructed. Research on the project will examine thelong-term noise reduction effectiveness, the mainte-nance requirements, and the durability of the rubber-ized pavement.
“Heat islands”—urban air and surface tempera-tures that are higher than surrounding rural areas—and their effects on urban residents and vegetation arean emerging environmental issue. Heat islands formwhen cities replace natural land cover with pavement,buildings, and other infrastructure; the temperaturescan reach up to 10°F (5.6°C) warmer than the sur-rounding natural land cover.
Cities experience higher rates of heat-related illnessand death than rural areas do. The heat island effectcan contribute to raising summertime temperatures tolevels that pose a threat to public health. Under certainconditions, excessive heat also can increase the rate ofground-level ozone formation—that is, smog—pre-senting an additional threat to health and ecosystemswithin and downwind of cities.
Communities can take several steps to decreasethe impacts of heat islands. Heat island reductionstrategies include
Installing cool or vegetated green roofs; Planting trees and vegetation; and Switching to cool paving materials.
The U.S. Environmental Protection Agency’s HeatIsland Reduction Initiative (HIRI) supports researchprograms to develop heat island reduction strategiesfor U.S. cities. HIRI-supported research aims toimprove understanding of the impacts that heat islandreduction strategies have on urban meteorology, airquality, energy demand, and human health.4
Data and Information TechnologiesStatewide data programs are realigning to reflectdepartment priorities and to demonstrate the value ofdata for the delivery of programs. Initiatives such astransportation system performance measurement andasset management accentuate the need for data shar-ing and integration.
The Safe, Accountable, Flexible, Efficient Trans-portation Equity Act: A Legacy for Users (SAFETEA-
With fire dangers fromdry, overgrown brushalong roads, CaliforniaDOT (Caltrans) isgetting its goats. In apilot program, Caltranssent a herd of 600goats to munch on thedry brush alongInterstate 880 andHighway 238 in SanLeandro. The goatswere able to managethe rocky terrainwithout generating thenoise and fumes ofmowers and weedtrimmers.
When Arizona DOTimproved roads in theOrgan Pipe CactusNational Monument,the construction planrequired salvaging andstoring the top 6 to 8inches of excavated soilduring construction.The soil and seedcollected in the parkwere used to revege-tate disturbed areas.
Did You Know?
New Hampshire DOT promoted bicycling and bicyclesafety in conjunction with the state fair.
LO
UIS
A. B
AR
KER
4 www.epa.gov/heatisland/index.html.
KIM
FISH
ER
KIM
FISH
ER
(Far left:) Pioneer roadbuilt within the footprintof the new US-60 nearPhoenix, Arizona, toprovide access togeotechnical andarchaeological sites andtesting. (Left:) Stormwatermanagement treatmentsinstalled before roadwayconstruction.

TR N
EWS
242
JAN
UARY
–FEB
RUAR
Y 20
06
20
LU) includes requirements for relating data from sev-eral programs and organizations, especially for safetyanalysis; this has heightened interest in integratingdata. The revised pavement design guide of the Amer-ican Association of State Highway and TransportationOfficials (AASHTO) also is prompting the reevaluationof traffic data programs to ensure the availability of rel-evant data.
Many DOTs are taking a more systematic approachto the capture, archiving, and analysis of intelligenttransportation systems data to improve understandingof traffic flows and to make extrapolations. Recentdisasters have confirmed the need for good inventoriesof physical assets and for strong analysis tools likegeographic information systems (GIS) for evaluatinga disaster’s impact and planning the response.
The state data community is concerned about thecontinuation of key national data sources—theNational Household Travel Survey (NHTS), the Com-modity Flow Survey (CFS), and the decennial census.
Funding for the NHTS and CFS is uncertain underSAFETEA-LU.
The transportation planning community is cau-tiously optimistic about the transition from the decen-nial census to the American Community Survey(ACS) for journey-to-work data. The ACS offers thepotential for annual population updates for large areasand for improvements in the tracking of trends.
But the federal commitment to adequate annualfunding for the ACS is also a concern. Although muchdata collection is oriented to traditional travel demandforecasting, new requests for data to evaluate policyalternatives are leading many agencies to reexaminetheir models and their supporting data programs.
Obtaining and using freight transportation data aresubstantial challenges for state DOTs, MPOs, and met-ropolitan areas. Uses of freight data are varied andcomplex. Two national data sets became available inthe past year—the Commodity Flow Survey (CFS)and the Vehicle Inventory and Use Survey.
The CFS provides multimodal freight activitypatterns every five years. Some agencies will pur-chase private-sector freight data from companies,although the geographic detail often is not suffi-cient for ready application to traffic and planningmodels. Some mode-specific data sources—such asmaritime and railroad freight data—provide ade-quate detail for intermodal planning, but data fortrucking, which is the largest mode of freight trans-portation, are least available.
State DOTs are increasing the use of GIS, often withagencywide units that manage departmentwide appli-cations. Most state DOTs are moving to an enterpriseorganizational structure, and staffs formerly orientedto mapping are evolving to provide technical support.
AviationState aviation officials are concerned about the state ofthe airline industry and its future, as well as the chal-lenges of funding the national aviation system, withstate and federal budgets shrinking and regulatoryrequirements increasing in complexity.
Airlines are facing financial crises, and the aviationsystem infrastructure is straining under levels of traf-fic that are reaching historic highs. The business andgeneral aviation communities also are reaching recordlevels of traffic. As the new “very light jets” begin toenter the market in 2006, this segment of the industryis primed for major changes.
The federal government is reviewing ways tofund the infrastructure needs of the national avia-tion system. Fuel taxes, user fees, and other chargesnow in place are not sufficient to cover futureneeds, and their equitability for users of the systemis a subject of debate.
Reports from the Transportation Research Board’s
2005 FIELD VISIT PROGRAM
(Top left:) Special vehiclefor thermal readings ofsurface and ambienttemperatures. (Bottomleft:) Thermal sensorsplaced into a conventionalportland cement concreteblend. (Right:) Handheldinfrared thermography ofcool pavement designsunder testing at theNational Center ofExcellence on SMARTMaterials, Arizona StateUniversity.
Interstate 17 in Phoenix,Arizona, is paved withasphalt rubber, whichreduces levels of tire–pavement noise, as well aspavement-generated heat.
NA
TION
AL
CEN
TERO
FE
XC
ELLENC
EO
NSM
AR
T MA
TERIA
LSJA
YG
OLD
ENA
ND
KA
MIL
KA
LOU
SH

TR NEW
S 242 JANUARY–FEBRUARY 2006
21
Many airports are under financial strain trying toaccommodate fluctuating levels and types of oper-ations under increasing regulatory controls. Envi-ronmental regulations present challenges to airportsand users, particularly the Environmental Protec-tion Agency’s Spill Prevention, Control, and Coun-termeasure requirements and the guidelines oneffluent limits. Some state aviation agencies con-tinue to support Airport Land Use Compatibilityprograms to reduce urban encroachment on alreadyconstrained airport systems.
Freight SystemsGeneral Freight IssuesFreight system capacity issues have made headlinesin recent years, so that the general public is moreaware of the impacts of growing freight volumes, andpublic agencies at all levels are pressured to play arole in relieving freight bottlenecks. Much of thegrowth stems from international trade, particularlyfrom China, which puts pressure on West Coast portsand then on the highway and rail system connectionsas the goods flow across the country.
As highway infrastructure providers, states mustpartner with private-sector carriers and shippers toprovide adequate system capacity. Critical needs atthe state level include management and staff capa-bilities to deal with freight issues; institutional capa-bilities to deal with the private sector and withother public agencies; and funding for improve-ments in freight flow.
AASHTO is identifying a key freight official ineach state DOT who understands what the freight jobis and who knows the parties that perform it. TheFederal Highway Administration (FHWA) is provid-ing freight training for state DOT staff, and AASHTOis focusing on freight education at the executive level.
The flows among ports, major intermodal, rail,and trucking hubs, and major market areas define
freight corridors. SAFETEA-LU reauthorization didnot provide the expected support for a corridorapproach to improving freight flows. In general,funding for freight improvements, particularly froma combination of public and private sources, remainsa major concern as international and domestic freightvolumes increase.
TruckingTrucks provide vital links in the freight transporta-tion system, including the critical “last mile” in manydeliveries and pickups. Increases in truck traffic arethe result of growth in domestic and internationalfreight. International freight flows translate into con-gestion on the highways that provide port access—for example, the highways that serve the ports of LosAngeles and Long Beach.
Marine terminals in Los Angeles and Long Beachhave collaborated to launch the PierPass program,which imposes a peak-hours fee. The program hasshifted almost one-third of port-related truck trafficto off-peak hours.
Concerned that fuel taxes will not raise adequatefunds for rebuilding and expanding highway capac-ity, many states are considering tolls or congestionpricing to improve the use of capacity. The impacts oftolling and congestion pricing on the trucking indus-try are subjects of debates and studies.
A Georgia study surveyed various groups of stake-holders to determine the value point at which truck-ers would use a toll road. The study concluded thattruck-only lanes could produce up to 20 percentmore relief than would high-occupancy toll or high-occupancy vehicle lanes.
These issues also illustrate the need for mutualeducation and dialogue between the trucking industryand public agencies. Planning activities in many stateshave focused on identifying major truck routes, mea-suring truck traffic, and forecasting truck flows. Theneed for truck flow data at the state and local levelsand for appropriate modeling tools is critical.
New very light jets, entering the market in 2006,will introduce major changes in business andgeneral aviation.
Freight volumes—and bottlenecks—are increasingnationwide.
EC
LIPSEA
VIA
TION)

TR N
EWS
242
JAN
UARY
–FEB
RUAR
Y 20
06
22
HighwaysDesignAn aging infrastructure and a heightened publicawareness of the importance of a reliable and safetransportation system are creating a demand for theredesign of roadways, the rehabilitation of pavementsand bridges, and a reliance on innovative materialsand techniques to get the job done more efficiently.
States are depending on contractors for the designand inspection of infrastructure projects. Contractorsoften must perform quality control, with quality assur-ance by inspection service providers. Several statesare researching automated inspection, data collection,and reports to compensate for a reduced in-houseinspection work force.
States that are developing implementation plansfor the recently piloted AASHTO pavement designguide are conducting related calibration and trainingefforts. Many states are looking for additional infor-mation from the National Cooperative HighwayResearch Program (NCHRP) to assist in training.
Use of the load and resistance factor design methodfor bridges and other structures has increased as the2007 implementation deadline approaches. The levelof adoption among the states varies from full to none.Many states are working on substructure calibrations.
States are using innovative materials such ashigh-performance concrete and structural fiber-reinforced plastics and are relying on innovativedesign and construction techniques such as precastpavement and bridge members to build structuresmore efficiently and more durably. The goal is toreduce work zone construction and maintenanceactivities in travel lanes.
Highway ConstructionInfrastructure renewal, congestion relief, and safetyimprovements are the goals for most state DOT con-struction projects. Contracting options and publicinformation campaigns are among the strategies tominimize the inconveniences of roadway construc-tion to motorists and the disruptions to adjacent prop-erty owners.
Construction in the midst of traffic requires plan-ning for the safety of the motorists and of the projectpersonnel. Utility work is the major source of delay onprojects. Many states are concerned about construc-tion quality because of a diminished and untrainedwork force.
States are improving their environmental steward-ship in construction. At least one state has imple-mented an environmental management system, andothers have added environmental positions in theirconstruction divisions.
More than one-half of the states have applied theproject development procedures from the AcceleratedConstruction Technology Transfer (ACTT) workshopconducted by FHWA and AASHTO. FHWA estimatesthat ACTT—conceived by the TRB Task Force onAccelerating Innovation in the Highway Industry—may be saving state DOTs millions of dollars and manyyears of construction time.
Highway MaterialsImproved performance, durability, and environmentalconsiderations are the watchwords for materials. Moststates are investigating self-consolidating concrete forstructural members. Recycled and waste materials andbyproducts are acceptable for use in most states as longas specifications are met and costs are competitive.
Several states have worked with industry onwarm-mix asphalt demonstration projects. Thetechnology offers the advantage of laying asphaltpavement at lower mix temperatures, reducing
Reports from the Transportation Research Board’s
2005 FIELD VISIT PROGRAM
MassachusettsDepartment of PublicWorks is scanning oldmylar design drawingsand converting them toan electronic graphicformat for archiving.
Nevada DOT hasconducted research onthe viability of tiltedsigns. The signs areinstalled at an angle toavoid snow sticking tothe surface.
Construction of thenew Woodrow WilsonBridge, spanning thePotomac Riverbetween Virginia andMaryland at thesouthernmost tip ofWashington, D.C., willuse more than 140million pounds ofsteel, more than thetotal weight of all thenew cars sold eachyear in Virginia andMaryland.
Did You Know?
The draw spans, or bascules, of the new Woodrow Wilson Bridge, nearWashington, D.C., feature eight opening leaves composed of more than 14 millionpounds of steel.
ACTT Workshop team develops a cost-efficientconstruction strategy.

TR NEW
S 242 JANUARY–FEBRUARY 2006
23
odors and emissions.Construction and materials issues throughout the
states include quiet pavements, moisture sensitivityand segregation of asphalt pavements, and the con-structability and durability of concrete mixes.
Geotechnical EngineeringOhio DOT has taken the lead in developing a geo-technical management system (GMS) in a pooled fundstudy with 10 other state DOTs, several U.S. federalagencies, and the United Kingdom Highway Agency.Every state DOT has archived vast amounts of geo-technical engineering information and gathers andadds new information each year, which makes thedevelopment of data management systems essential.Yet without standardization of the database, the sys-tems may become unwieldy.
The pooled fund study will develop frameworks,standards, and protocols to accelerate development ofthe GMS. Collaboration and information sharingshould minimize redundancy. The project is scheduledfor completion in mid-2007.
State DOT experience with the use of geophysicsfor transportation projects is varied, but general inter-est has increased. An NCHRP synthesis report on thetopic—slated for publication this year—will assembleuseful information for practitioners on geophysicalmethods, applicability, and limitations.
Many states are outsourcing some geotechnicalexploration. The percentage of the work that is out-sourced varies from state to state.
The effects on aquatic life from the vibrationsrelated to pile driving has emerged as an environmen-tal problem. California, Washington, and Oregon areconducting a study of ways to eliminate or minimizethe adverse effects.
Highway MaintenanceIn line with asset management, a preservationapproach is being developed to improve the level ofservice and to extend the service life of transportationinfrastructure. Successful transition from a reactionaryto a preservation approach depends on the commit-ment and support of the agency’s top managementand of the political oversight body; a repeatable mea-surement system that can appraise conditions andmonitor progress toward achievable goals; flexibility inthe selection of the preservation actions appropriate tothe project conditions; and champions workingthroughout the agency to keep the programs on track.
Many DOTs are developing and implementingintegrated management systems, employingadvanced technologies to develop infrastructureinventories, monitor roadway element conditions,and forecast workloads within the context of asset
management and environmental stewardship. Thenew performance-based maintenance managementsystems retain planning, budgeting, and resourcemanagement functions but have added roadway fea-ture inventory and condition assessment, customerinput, workload planning and forecasting, statisticalsampling of roadway conditions using maintenancequality assurance, customer-driven benchmarking,and performance measures.
Integrating these management systems requirescommon data definitions, several types of locationreference systems, and commitments from uppermanagement to support the costs. With decreases inemployees, agencies are entering into public–privatepartnerships under a variety of procurementapproaches, from short-duration contracts for labor,equipment, and materials to longer-term, lump-sumcontracts for a corridor or a network, with statedoutcome measures.
Safety for the traveling public, contractors, andagency workforces remains a priority. Many DOTs aredeploying new technologies to provide real-time infor-
South Carolina DOTmaintenance employeesattend a classroomtraining exercise toimprove skills; sometraining is offered online.
DA
KTR
ON
ICS
VA
NG
UA
RD
RO
BT
HO
MPSO
N, SO
UTH
CA
RO
LINA
DO
T
Timely, informativesignage systemscontribute to highwaysafety.
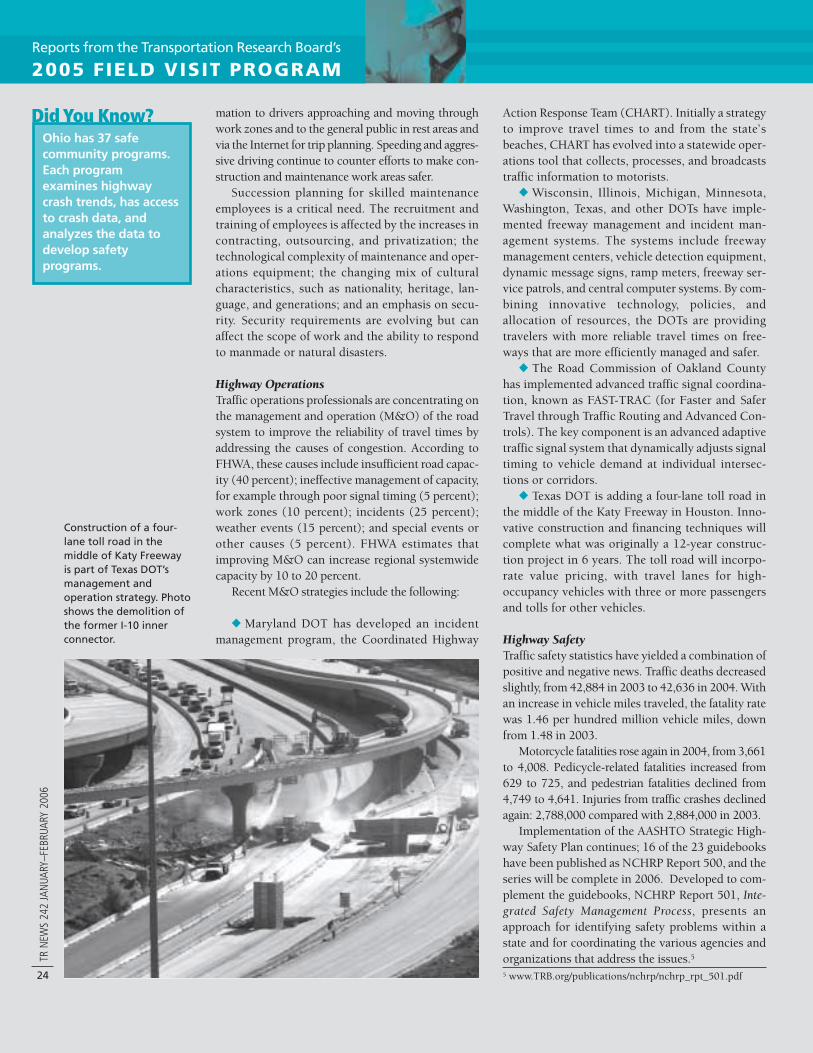
TR N
EWS
242
JAN
UARY
–FEB
RUAR
Y 20
06
24
mation to drivers approaching and moving throughwork zones and to the general public in rest areas andvia the Internet for trip planning. Speeding and aggres-sive driving continue to counter efforts to make con-struction and maintenance work areas safer.
Succession planning for skilled maintenanceemployees is a critical need. The recruitment andtraining of employees is affected by the increases incontracting, outsourcing, and privatization; thetechnological complexity of maintenance and oper-ations equipment; the changing mix of culturalcharacteristics, such as nationality, heritage, lan-guage, and generations; and an emphasis on secu-rity. Security requirements are evolving but canaffect the scope of work and the ability to respondto manmade or natural disasters.
Highway OperationsTraffic operations professionals are concentrating onthe management and operation (M&O) of the roadsystem to improve the reliability of travel times byaddressing the causes of congestion. According toFHWA, these causes include insufficient road capac-ity (40 percent); ineffective management of capacity,for example through poor signal timing (5 percent);work zones (10 percent); incidents (25 percent);weather events (15 percent); and special events orother causes (5 percent). FHWA estimates thatimproving M&O can increase regional systemwidecapacity by 10 to 20 percent.
Recent M&O strategies include the following:
Maryland DOT has developed an incidentmanagement program, the Coordinated Highway
Action Response Team (CHART). Initially a strategyto improve travel times to and from the state’sbeaches, CHART has evolved into a statewide oper-ations tool that collects, processes, and broadcaststraffic information to motorists.
Wisconsin, Illinois, Michigan, Minnesota,Washington, Texas, and other DOTs have imple-mented freeway management and incident man-agement systems. The systems include freewaymanagement centers, vehicle detection equipment,dynamic message signs, ramp meters, freeway ser-vice patrols, and central computer systems. By com-bining innovative technology, policies, andallocation of resources, the DOTs are providingtravelers with more reliable travel times on free-ways that are more efficiently managed and safer.
The Road Commission of Oakland Countyhas implemented advanced traffic signal coordina-tion, known as FAST-TRAC (for Faster and SaferTravel through Traffic Routing and Advanced Con-trols). The key component is an advanced adaptivetraffic signal system that dynamically adjusts signaltiming to vehicle demand at individual intersec-tions or corridors.
Texas DOT is adding a four-lane toll road inthe middle of the Katy Freeway in Houston. Inno-vative construction and financing techniques willcomplete what was originally a 12-year construc-tion project in 6 years. The toll road will incorpo-rate value pricing, with travel lanes for high-occupancy vehicles with three or more passengersand tolls for other vehicles.
Highway SafetyTraffic safety statistics have yielded a combination ofpositive and negative news. Traffic deaths decreasedslightly, from 42,884 in 2003 to 42,636 in 2004. Withan increase in vehicle miles traveled, the fatality ratewas 1.46 per hundred million vehicle miles, downfrom 1.48 in 2003.
Motorcycle fatalities rose again in 2004, from 3,661to 4,008. Pedicycle-related fatalities increased from629 to 725, and pedestrian fatalities declined from4,749 to 4,641. Injuries from traffic crashes declinedagain: 2,788,000 compared with 2,884,000 in 2003.
Implementation of the AASHTO Strategic High-way Safety Plan continues; 16 of the 23 guidebookshave been published as NCHRP Report 500, and theseries will be complete in 2006. Developed to com-plement the guidebooks, NCHRP Report 501, Inte-grated Safety Management Process, presents anapproach for identifying safety problems within astate and for coordinating the various agencies andorganizations that address the issues.5
Reports from the Transportation Research Board’s
2005 FIELD VISIT PROGRAM
Construction of a four-lane toll road in themiddle of Katy Freewayis part of Texas DOT’smanagement andoperation strategy. Photoshows the demolition ofthe former I-10 innerconnector.
Ohio has 37 safecommunity programs.Each programexamines highwaycrash trends, has accessto crash data, andanalyzes the data todevelop safetyprograms.
Did You Know?
5 www.TRB.org/publications/nchrp/nchrp_rpt_501.pdf

TR NEW
S 242 JANUARY–FEBRUARY 2006
25
SAFETEA-LU legislation has mandated that eachstate develop a strategic highway safety plan (SHSP).Many states started the process more than one yearago. In fall 2005, staff from 48 states met in a peerexchange on successes and on ways to overcome bar-riers. Successful programs were committed to coor-dination within and across the agencies andorganizations that have roles in highway safety; werecomprehensive, giving consideration to engineering,education, enforcement, and emergency medical ser-vices; and were data-driven and goal-directed.
Safety-conscious planning (SCP), a requirementunder TEA-21, continues to develop. By the end of2005, 25 states had organized and conducted SCPforums, which bring together representatives of high-way safety and transportation planning to learn abouteach other’s activities, to discuss data and resources,and to create an action plan that includes safety in thelong-range transportation planning process.
The interaction and coordination of SCP and theSHSP has been beneficial in several states. For exam-ple, as part of the SHSP process, Ohio State DOTand the Governor’s Representative for HighwaySafety are working to conduct SCP forums with eachof the MPOs within the state.
Marine and IntermodalIn the Gulf region, ports are reeling from the devas-tation caused by the 2005 hurricanes, especially inMississippi and Louisiana. Recovery and rebuildingat many of the ports require extensive efforts.
Just before the hurricane disaster, Louisiana hadlaunched an aggressive approach to the growth anddevelopment of maritime commerce by creating theGovernor’s Maritime Advisory Task Force and theLouisiana Waterways Infrastructure and DevelopmentFund. The goal was to expand trade by financingwaterside infrastructure and development projects.
New port terminal development is under way atseveral locations. The Alabama State Port Authorityis moving forward on plans to build a container ter-minal at Choctaw Point, which would boost the con-tainer capacity at the Port of Mobile 14-fold;financing comes from state funds and private invest-ments. The Virginia Port Authority is seeking statefunding to build a new container terminal atPortsmouth’s Craney Island.
Landside congestion and infrastructure are chal-lenges for many ports. In Southern California, a pub-lic–private partnership will be needed to finance a$20-billion rail-and-highway access infrastructurefor the Los Angeles–Long Beach port complex.
Short sea shipping has been promoted as a solu-tion to landside congestion in the United States, andsome operations are now successfully under way orare in development along the East and Gulf Coasts.Challenges to the wide use or availability of short seashipping, however, include conditions of the JonesAct, U.S. manning requirements, financing, and theharbor maintenance tax.
The inland waterways sector awaits approval andfunding for major infrastructure improvements, withdebate continuing over commodity forecasts andmarket demand. The 2005 hurricanes also affectedinland waterway operations, as many barges werelost or damaged. On the Great Lakes, environmentalissues are a primary concern, particularly preventingthe introduction of nonindigenous invasive species.
The ferry sector is devoting considerable attentionto new and proposed services, and to security, safety,and the environment. Liquefied natural gas terminals
Site for the construction of Choctaw Point Terminal,Mobile, Alabama.
Fishing boats are pressed along a pier in Port Arthur,Texas, in the aftermath of Hurricane Rita, September24, 2005.
North Carolina DOTowns and operates ashipyard.
A recent study reportedthat Georgia’sdeepwater ports andinland barge terminalssupport more than275,000 jobs andcontribute nearly$11 billion in income,$35 billion in revenue,and $1.4 billion in stateand local taxes to thestate’s economy.
The Port of Portland,Oregon, has a researchbranch to support air,rail, and maritimeactivities.
Did You Know?
DA
VID
L. RY
AN, R
EUTER
S
JUD
ITHA
DA
MS, A
LAB
AM
AS
TATE
PO
RT
AU
THO
RITY

TR N
EWS
242
JAN
UARY
–FEB
RUAR
Y 20
06
26
and transport have raised concerns in most areas ofthe country. In the Gulf region, a major focus is theimpact of offshore terminals on fish populations.
RailMany states regard intercity and commuter rail pas-senger services as important elements of the trans-portation network, relieving demand on the morecongested modes. Approximately one-quarter of thestates provide financial support for Amtrak passengerservices. The debate over federal funding for Amtrakis perennial.
Many states are investing their own funds or sup-plementing federal funds to improve rail passengerservices. For example, Connecticut plans to spendmore than $600 million on new self-propelled railcars for the New Haven line and $300 million fornew rail-maintenance facilities, as part of a majorinitiative to prevent roadway congestion in the south-western corner of the state.
Commuter rail is coming to Utah as part of a con-gestion relief solution that includes highwayimprovements in the rapidly growing Salt Lake Cityarea. With a combination of federal and local salestax funds, the Utah Transit Authority is buying a por-tion of right-of-way from the Union Pacific Railroadto accommodate the commuter rail services.
The demand for rail freight services is strainingrail capacity nationwide and has limited the ability offreight railroads to share facilities with passenger ser-
vices in many areas. Choke points have developedwhere freight railroads receive large volumes ofcargo—for example, at West Coast ports.
System velocity, capacity, and service reliabilityremain problematic despite many operationalimprovements. After more than two decades ofshrinking, the rail system infrastructure, equipmentsupplies, and work force—as well as operations—must build up again to meet growing demand.
Public TransportationFor public transportation, 2005 was the best ofyears financially in terms of federal investments.
Reports from the Transportation Research Board’s
2005 FIELD VISIT PROGRAM
Connecticut DOTcontinues to invest inexpansion andmodernization of theheavily used New Havenrail terminal.
Valley Metro light rail will link Phoenix, Tempe,Mesa, and Glendale, Arizona.
RO
BER
TM
OO
RE, C
ON
NEC
TICU
TD
OT
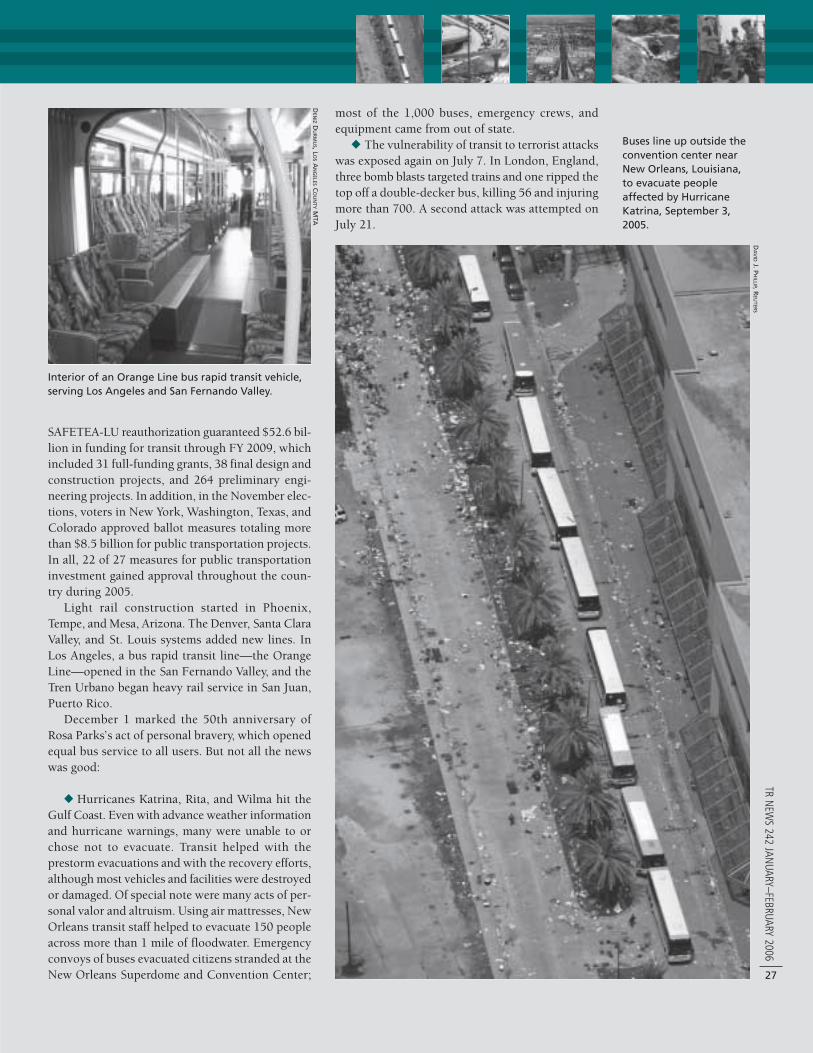
TR NEW
S 242 JANUARY–FEBRUARY 2006
27
SAFETEA-LU reauthorization guaranteed $52.6 bil-lion in funding for transit through FY 2009, whichincluded 31 full-funding grants, 38 final design andconstruction projects, and 264 preliminary engi-neering projects. In addition, in the November elec-tions, voters in New York, Washington, Texas, andColorado approved ballot measures totaling morethan $8.5 billion for public transportation projects.In all, 22 of 27 measures for public transportationinvestment gained approval throughout the coun-try during 2005.
Light rail construction started in Phoenix,Tempe, and Mesa, Arizona. The Denver, Santa ClaraValley, and St. Louis systems added new lines. InLos Angeles, a bus rapid transit line—the OrangeLine—opened in the San Fernando Valley, and theTren Urbano began heavy rail service in San Juan,Puerto Rico.
December 1 marked the 50th anniversary ofRosa Parks’s act of personal bravery, which openedequal bus service to all users. But not all the newswas good:
Hurricanes Katrina, Rita, and Wilma hit theGulf Coast. Even with advance weather informationand hurricane warnings, many were unable to orchose not to evacuate. Transit helped with theprestorm evacuations and with the recovery efforts,although most vehicles and facilities were destroyedor damaged. Of special note were many acts of per-sonal valor and altruism. Using air mattresses, NewOrleans transit staff helped to evacuate 150 peopleacross more than 1 mile of floodwater. Emergencyconvoys of buses evacuated citizens stranded at theNew Orleans Superdome and Convention Center;
most of the 1,000 buses, emergency crews, andequipment came from out of state.
The vulnerability of transit to terrorist attackswas exposed again on July 7. In London, England,three bomb blasts targeted trains and one ripped thetop off a double-decker bus, killing 56 and injuringmore than 700. A second attack was attempted onJuly 21.
Interior of an Orange Line bus rapid transit vehicle,serving Los Angeles and San Fernando Valley.
Buses line up outside theconvention center nearNew Orleans, Louisiana,to evacuate peopleaffected by HurricaneKatrina, September 3,2005.
DEN
IZD
UR
MU
S, LO
SA
NG
ELESC
OU
NTY
MTA
DA
VID
J. PH
ILLIP, REU
TERS

TR N
EWS
242
JAN
UARY
–FEB
RUAR
Y 20
06
28
The author, who was aresearch scientist atGeneral Motors from1967 to 2000, is aresearcher, writer, andlecturer on traffic safetyand president of ScienceServing Society,Bloomfield Hills,Michigan. He is a member of the NationalAcademy of Engineering.
The dramatic failure of U.S. traffic safetypolicy is one of our best-kept nationalsecrets. Policies aimed at reducing the tollof 42,000 Americans killed each year
rarely make the news. When they do, usually theinstitutions responsible for the policy failure areannouncing that impressive progress is being made.To gain a realistic view, however, we need to compareour own progress with that of other countries.
My 2004 book, Traffic Safety, presents such a com-parison (1). This article summarizes the main find-ings of that comparison and my interpretation of thefindings. The book presents in detail the numericalcalculations, the data sources, the references, andthe documentation. The material in the book led tocomments in a recent TR News editorial by BrianO’Neill (2). I am responding to those comments.
Until the mid-1960s, the United States had thesafest traffic in the world, whether measured bydeaths per registered vehicle or by deaths for the
same distance of travel. By 2002, in terms of deathsper registered vehicle, the United States haddropped from 1st to 16th place. Australia, Austria,Canada, Denmark, Finland, Germany, Great Britain,Iceland, Japan, Luxembourg, the Netherlands, NewZealand, Norway, Sweden, and Switzerland postedlower rates.
Comparing Fatalities, 1979–2002The decline in U.S. safety relative to other countriescan be explored by comparing changes in specificfatality rates with the changes in the same rates inother countries. Three traffic fatality rates are exam-ined:
1. Fatalities per year—the raw fatality rate;2. Fatalities per 1,000 registered vehicles—the
vehicle rate; and3. Fatalities per 100 million vehicle-miles of
travel—the distance rate.
S I G N A L S
The Dramatic Failure of U.S. Traffic Safety PolicyEngineering Is Important, Public Policy Is CrucialL E O N A R D E V A N S
U.S. traffic safety policy,the author notes, hasfocused on vehiclefactors and on survivingcrashes—for example, bymandating airbags,shown here deploying ina crash test—instead ofpreventing crashes.
DA
VID
WO
OD
S/CO
RB
IS
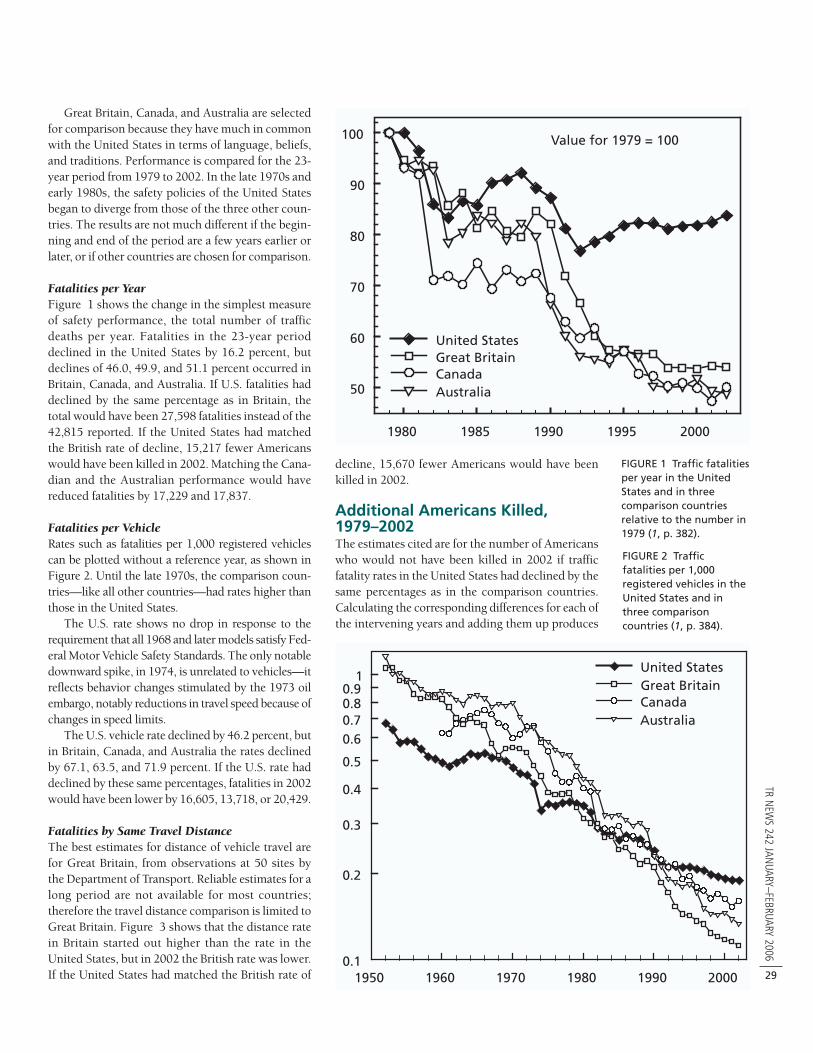
TR NEW
S 242 JANUARY–FEBRUARY 2006
29
Great Britain, Canada, and Australia are selectedfor comparison because they have much in commonwith the United States in terms of language, beliefs,and traditions. Performance is compared for the 23-year period from 1979 to 2002. In the late 1970s andearly 1980s, the safety policies of the United Statesbegan to diverge from those of the three other coun-tries. The results are not much different if the begin-ning and end of the period are a few years earlier orlater, or if other countries are chosen for comparison.
Fatalities per YearFigure 1 shows the change in the simplest measureof safety performance, the total number of trafficdeaths per year. Fatalities in the 23-year perioddeclined in the United States by 16.2 percent, butdeclines of 46.0, 49.9, and 51.1 percent occurred inBritain, Canada, and Australia. If U.S. fatalities haddeclined by the same percentage as in Britain, thetotal would have been 27,598 fatalities instead of the42,815 reported. If the United States had matchedthe British rate of decline, 15,217 fewer Americanswould have been killed in 2002. Matching the Cana-dian and the Australian performance would havereduced fatalities by 17,229 and 17,837.
Fatalities per VehicleRates such as fatalities per 1,000 registered vehiclescan be plotted without a reference year, as shown inFigure 2. Until the late 1970s, the comparison coun-tries—like all other countries—had rates higher thanthose in the United States.
The U.S. rate shows no drop in response to therequirement that all 1968 and later models satisfy Fed-eral Motor Vehicle Safety Standards. The only notabledownward spike, in 1974, is unrelated to vehicles—itreflects behavior changes stimulated by the 1973 oilembargo, notably reductions in travel speed because ofchanges in speed limits.
The U.S. vehicle rate declined by 46.2 percent, butin Britain, Canada, and Australia the rates declinedby 67.1, 63.5, and 71.9 percent. If the U.S. rate haddeclined by these same percentages, fatalities in 2002would have been lower by 16,605, 13,718, or 20,429.
Fatalities by Same Travel DistanceThe best estimates for distance of vehicle travel arefor Great Britain, from observations at 50 sites bythe Department of Transport. Reliable estimates for along period are not available for most countries;therefore the travel distance comparison is limited toGreat Britain. Figure 3 shows that the distance ratein Britain started out higher than the rate in theUnited States, but in 2002 the British rate was lower.If the United States had matched the British rate of
decline, 15,670 fewer Americans would have beenkilled in 2002.
Additional Americans Killed,1979–2002The estimates cited are for the number of Americanswho would not have been killed in 2002 if trafficfatality rates in the United States had declined by thesame percentages as in the comparison countries.Calculating the corresponding differences for each ofthe intervening years and adding them up produces
1980 1985 1990 1995 2000
50
60
70
80
90
100 Value for 1979 = 100
United StatesGreat Britain
AustraliaCanada
1950 1960 1970 1980 1990 2000
0.2
0.3
0.4
0.5
0.60.70.80.9
0.1
1United States
CanadaGreat Britain
Australia
FIGURE 1 Traffic fatalitiesper year in the UnitedStates and in threecomparison countriesrelative to the number in1979 (1, p. 382).
FIGURE 2 Trafficfatalities per 1,000registered vehicles in theUnited States and inthree comparisoncountries (1, p. 384).

TR N
EWS
242
JAN
UARY
–FEB
RUAR
Y 20
06
30
a cumulative estimate of American lives that wouldnot have been lost. The average of the totals for therates of the three comparison countries is 214,286.Therefore, if U.S. safety progress had kept pace withprogress in the comparison countries, approximately200,000 fewer Americans would have died on ourroads in the 23-year period.
Different Rates, Same PictureThe estimate of fatalities that would have been pre-vented if U.S. performance had matched that of thecomparison countries is relatively independent ofthe rate chosen. For example, the number of Ameri-can lives that would have been saved in 2002 if theUnited States had matched the British rate of declinein raw fatalities is 15,217; at the vehicle rate, 16,605;and at the distance rate, 15,670.
If the percent growth in vehicles and growth intravel were identical in both countries for the 23-year period, the estimates would be identical. Thedifference computed for the vehicle rate reflects ahigher percent of vehicle ownership growth inBritain, which had lower levels of vehicle ownershipat the start. The difference computed at the distancerate reflects a slightly larger increase in total distancetraveled in Britain compared with that in the UnitedStates.
The crucial point is that these are percentchanges. Large, fairly stable differences between thecountries should not much affect percent changes intime, because the influences on the 1979 and 2002fatalities would be similar. For example, Britain is
more urban than the United States and has a greaterpercent of pedestrian fatalities—but these factors donot differentially change all that much between 1979and 2002.
Defining ProgressIn his article, O’Neill correctly indicates progress inU.S. safety. If the data points for the other countriesare removed from Figures 1, 2, and 3, the declines inU.S. rates appear impressive.
O’Neill identifies great variation among U.S. statesand observes that some states had lower rates thanthose in the comparison countries. The reductions inthe rates in the United States, however, are muchless than in other countries. In all cases in Figures 2and 3, the U.S. rates are higher in 2002 than the ratesin the comparison countries, yet formerly the U.S.rates were lower.
Some U.S. states have lower rates than the aggre-gate national rates of the comparison countries. Sim-ilarly, regions, provinces, or states within thecomparison countries also have rates that are lowerthan the national average. Progress is indicated notby the values in 2002 but by a comparison of the per-cent changes since 1979 with the changes in thethree other countries.
Because the percent changes are similar over timefor raw fatalities, the vehicle rate, and the distancerate, comparing the changes in an individual U.S.state’s record of raw fatalities is the easiest approach.A drawback is that population growth was higher insome regions, such as the South, than in others,which contributes to increased fatalities; but theapproach avoids the uncertainties of crashes by out-of-state vehicles or of unreliable estimates of traveldistances.
Comparing 2002 and 1979 fatalities for all 50states and the District of Columbia shows that onlyone state enjoyed a decline of more than 50 percent.In Vermont, fatalities declined from 159 in 1979 to78 in 2002—a 50.9 percent drop. Although this statemay be a statistical outlier because of the small num-bers, the decline is less than the 51.1 percentachieved in Australia. The state with the secondhighest decline is Massachusetts, with 49.9 percent.All other states experienced smaller percent declinesthan any of the comparison countries.
States in the East and Midwest tended to have thelargest percent declines, and those in the South thelowest—in 14 Southern states, fatalities increased.The District of Columbia had an increase of 6.0 per-cent, although the vehicle rate is low for all yearsbecause the district is urban.
As O’Neill observes, the variations among thestates are due in part to differing policies on speed,
FIGURE 3 Trafficfatalities per 100 millionmiles of vehicle travel inthe United States and inGreat Britain (1, p. 386).
1920 1930 1940 1950 1960 1970 1980 1990 2000
1
10
United StatesGreat Britain
20
7
5
2
3

TR NEW
S 242 JANUARY–FEBRUARY 2006
31
alcohol, and occupant protection devices. This sup-ports my core thesis that public policy aimed at driv-er behavior really makes a difference. The vehicles inall states, however, are subject to identical safety stan-dards. Comparing changes over time for the statesshows that the failure of U.S. safety policy appliedthroughout the nation, even if not uniformly.
Search for an ExplanationAlthough straightforward analyses of publicly avail-able data show some 200,000 additional U.S. fatalitiesover a 23-year period, identifying what measureswould have made the difference is difficult. Safety beltuse, for example, can account for a substantial portionof the difference. If the United States had introducedbelt-wearing laws and achieved wearing rates on thesame schedule as Canada, 95,000 fewer Americanswould have died between 1979 and 2002. Why thendid the United States not adopt this proven, effectiveintervention earlier? Moreover, what accounts for theother 100,000-plus additional deaths?
Such large and robust effects likely reflect funda-mental differences in philosophy and approaches totraffic safety. U.S. policy has focused on vehicle fac-tors—even on factors that research has shown are ofminor importance. Public policies addressing suchroad-user behaviors as speeding, alcohol, traffic lawviolation, and belt wearing have been demonstratedto reduce casualties by large amounts but have notreceived appropriate attention. Traffic Safety explainshow the United States embarked on this course, towhich it still clings, resulting in the deaths of manyAmericans. The explanation involves analysis, docu-mentation, references, and photographs that cannotbe contained within the format of this article.1
In brief, the explanation draws on three interre-lated observations:
U.S. safety policy priorities have been orderedalmost perfectly opposite to where technical knowl-edge shows benefits are greatest.
This has occurred because lawyers who lackknowledge or interest in technical matters havedefined and guided U.S. policy.
This leadership is the result of the uniquelypowerful influence of law on all aspects of U.S. soci-ety—an influence that is without parallel in anyother country.
For example, evidence showed that airbags couldkill children and had low effectiveness; nonetheless,a mandate to equip all vehicles with airbags became
the top national safety goal in the 1970s. The com-mitment to the airbag mandate was used to opposebelt-wearing laws. An additional irony is that themedia refer to the architects of the disaster describedin this article as “safety advocates.”
Government ResponsibilityGovernments have major responsibilities for traffic.Governments traditionally have not been heldresponsible for the weather, yet when 1,000 peoplewere killed by Hurricane Katrina, responsibility wasattributed to various levels of government. Theannual deaths of 42,000 Americans, and the dailydeaths of 16 teenagers, in an entirely manmade sys-tem under government supervision do not generatecorresponding attributions of responsibility. Protect-ing public health is a major government responsibil-ity, and U.S. performance in the area of ground trafficsafety has been abysmal compared with that of othercountries.
In another transportation mode, however, U.S.safety performance is outstanding. In 2002 nobodywas killed in U.S. commercial aviation. This successoccurred because the focus was not on survivingcrashes, but on preventing them. As long as our focusin ground transportation safety is on squeezing anelusive additional minor increment of survivabilityfrom crashes, we can never make acceptableprogress. The relative lack of importance of vehiclefactors is clear in comparing Canada and the UnitedStates—both nations have similar vehicles, yetCanada has cut the number of traffic deaths by half.
The one cause for optimism is that whenever theUnited States recognizes it has a problem, it moveswith a speed and energy unequalled in other coun-tries. By adopting new thinking, the United Statescan cut the number of fatalities in half with policiesthat the public would welcome (1, p. 412).
References1. Evans, L. Traffic Safety. Science Serving Society, Bloomfield
Hills, Mich., 2004. Additional information at www.science-servingsociety.com.
2. O’Neill B. Improving U.S. Highway Safety: Have We Takenthe Right Road? TR News, No. 239, July–August 2005, pp.24–27.
SIGNALS is a guest editorial column, published onan occasional basis, that offers thought-provokingcommentary by organizational leaders, to stimu-late discussion on topics related to transportationresearch, practice, and policy. Reader response isencouraged in the form of letters to the editor.
1 As a supplement to this article, pages 389–411 of TrafficSafety are available at www.scienceservingsociety.com/TR.pdf, until July 2006.
ALA
NS
CH
EINP
HO
TOG
RA
PHY/C
OR
BIS

TR N
EWS
242
JAN
UARY
–FEB
RUAR
Y 20
06
32
Lawrie is SeniorResearch Associate,Meletiou is Bicycle andPedestrian ProgramManager, and O’Brien isa Research Associate,Public TransportationGroup, Institute forTransportation Researchand Education, NorthCarolina StateUniversity, Raleigh.Norman is Director ofthe Division of Bicycleand PedestrianTransportation, NorthCarolina Department ofTransportation, Raleigh.
Since 1987, the North Carolina Departmentof Transportation (DOT) and local govern-ments have invested $6.7 million in publicfunds to construct an extensive network of
bicycle facilities that consists of 55 miles of widepaved shoulders and multiuse pathways on thenorthern Outer Banks. North Carolina DOT com-missioned the Institute for Transportation Researchand Education (ITRE) at North Carolina State Uni-versity to determine if the benefits gained from thebicycle facilities would justify investment in addi-tional facilities throughout the state.
Problem ITRE conducted a case study of bicycle tourism in thearea. Measuring the benefits of this tourism was a chal-lenge, because tourists visit the northern Outer Banksfor a variety of reasons. Researchers needed a methodto distinguish the tourists who bicycle as an inciden-tal part of a vacation from those for whom bicycling isa major part of the attraction.
SolutionTwo methods were considered for understanding thebenefits—a benefit-cost analysis (BCA) and an eco-nomic impact analysis (EIA).
A BCA compares the value of the benefits with thecost of the investment and requires converting both thecosts and the benefits into dollar amounts. Some bene-
fits of bicycle facilities, however—such as reduced traf-fic congestion, increased safety, healthy activity, andimproved air quality—are not easily quantified.
An EIA examines the economic benefits fromtourists who visit for a specific tourist attraction orevent. The benefits largely result from tourist spendingon food, lodging, and entertainment—which are eas-ier to quantify. The researchers therefore chose theEIA approach.
Three key pieces of information were gatheredthrough surveys and through bicycle traffic counts:
The average amount of money that touristsspend during a visit to the northern Outer Banks,
The total annual number of tourists, and The proportion of tourists for whom bicycling
was an important reason for the visit.
Bicycle Use and Characteristics During a three-day period starting July 30, 2003,researchers developed a profile of area bicyclists bysurveying 173 who were riding on the facilities—143visitors and 30 residents. In addition, 392 touristscompleted self-administered surveys at three area vis-itor centers over three months, starting in July 2003,to determine the percentage of respondents whoengaged in bicycling on vacation.
Survey responses revealed spending patterns, tripinformation, attitudes and perceptions about bicyclingand the facilities, investment priorities, and generaldemographics. Pneumatic tube counters calibrated forbicycle detection tallied users at 11 locations on a vari-ety of bicycle facilities during a one-week period.
Economic Impact Analysis Information from the Outer Banks Chamber of Com-merce led researchers to estimate that 4 milliontourists visit the study area annually. The visitor cen-ter surveys showed that 17 percent of these tourists dosome bicycling on their trip. This translates to approx-imately 680,000 annual visitors who bicycle.
Bikeways to ProsperityAssessing the Economic Impact of Bicycle FacilitiesJ U D S O N J . L A W R I E , T H O M A S P. N O R M A N , M A R Y M E L E T I O U ,
A N D S A R A H W . O ’ B R I E N
R E S E A R C H P AY S O F F
Survey station set upalong a wide pavedshoulder section of abicycle facility.

TR NEW
S 242 JANUARY–FEBRUARY 2006
33
Three survey questions addressed the degree towhich these bicycling tourists were drawn to the areaby bicycling and the bicycle facilities:
“How important was the activity of bicycling inyour decision to come to this area?”
“How would you rate the overall quality ofbicycle facilities in the area?”
“How important will the quality of bicycling bein a decision for you to return?”
The answers to these questions yielded a conserv-ative estimate that approximately 40,800 tourists eachyear—roughly 1 percent of the 4 million total visitorsannually—were attracted to the Outer Banks to a sig-nificant degree by the bicycling activities. Estimatedannual expenditures, projected from the spending pat-terns and trip duration data collected in the surveys,were then evaluated using an economic impact model.Accounting for data specific to the Outer Banks area,federal and state taxes and contributions, and eco-nomic multiplier effects, the model estimated anannual economic impact of $60 million and 1,407jobs supported from the 40,800 visitors for whombicycling was an important reason for choosing tovacation in the area.
Other Survey Findings Of the survey respondents, 12 percent reported stay-ing an extra three to four days to bicycle in the area.The perceived high quality of bicycling in the regionhad a positive effect on respondents’ vacation experi-ence and planning—55 percent indicated that thebicycle facilities helped them feel safer while riding,and 53 percent reported that bicycling influenced theirdecision to return in the future.
According to the survey, 9 out of 10 respondentsstrongly agreed that state and federal tax dollarsshould be used to build bicycle facilities. Nearly two-thirds of respondents indicated that additional bicyclefacilities should be built.
ApplicationThis research demonstrates a straightforward way togauge the economic benefits of bicycle facilities. Sim-ilar research is needed in other regions to determinethe change in economic impact that may result fromdifferent types of tourist attractions, geography, or anetwork of bicycle facilities.
The study shows that continued investment inbicycle facilities could be expected to increase thefavorable economic impact—therefore additionalinvestment is recommended. Lessons learned fromthis research are under consideration in other localitiesthroughout the state.
BenefitsThe ITRE study foundthat visitors who bicyclein the northern OuterBanks have a significanteconomic impact on thearea. Moreover, thestudy provides evidencethat the expenditure ofpublic funds on bicyclefacilities in an area witha substantial amount oftourism can be a worth-while investment.
The annual eco-nomic impact of $60million and 1,407 jobssupported is a reason-able but conservativeestimate of the benefits.The estimate comparesfavorably with the $6.7million in public fundsinvested in the con-struction of the bicyclefacilities. That invest-ment annually yields aneconomic return approximately nine times the initialexpenditure.
The study suggests that public investment in anetwork of bicycle facilities in other coastal andresort areas could return similar benefits, whetherthe area attracts tourists primarily for bicycling or forother reasons. Because of the usefulness of the EIAfindings, North Carolina DOT plans to study morebicycle and pedestrian facilities for the economicimpact on local economies to allocate direct publicfunding most effectively.
For more information, contact Judson J. Lawrie, NorthCarolina State University, Institute for TransportationResearch and Education, Centennial Campus Box 8601,Raleigh, NC 27695-8601; telephone 919-513-3482; fax919-515-8898; e-mail jjlawrie@unity. ncsu.edu.
EDITOR’S NOTE: Appreciation is expressed to PeterShaw and Joseph Morris, Transportation ResearchBoard, for their efforts in developing this article.
Suggestions for “Research Pays Off” topics are wel-come. Contact G. P. Jayaprakash, TransportationResearch Board, Keck 488, 500 Fifth Street, NW,Washington, DC 20001 (telephone 202-334-2952,e-mail [email protected]).
Bicycle facilities of thenorthern Outer Banks.
Wide Paved Shoulders
Wide Paved Shoulder with Side Path Adjacent to Road
Side Path Adjacent to Road
Multi-use Path
Incidental Improvements

As senior attorney in the Torts Division of the Wash-ington State Attorney General’s Office, Michael E.Tardif’s responsibilities include handling major tortappeals and advising staff attorneys on major tort
cases. He works on tort cases involving the regulatory activi-ties of state government, such as securities regulation andindustrial safety, and serves as legal adviser to the state Depart-ment of Transportation and other agencies on matters relatedto tort liability.
Tardif became involved in TRB in 1984 and joined the TaskForce on Torts in 1987. He has served on several National Coop-erative Highway Research Program project panels—currently forBest Methods and Practices of Data Integration for TransportationDepartments and for Legal Problems Arising out of HighwayPrograms—and is an active member of the Tort Liability and
Risk Management Committee and the Context-Sensitive Designand Solutions Task Force.
“Involvement in TRB has proved valuable in two respects,”Tardif observes. “First, TRB’s initiatives for research on trans-portation legal issues and the work of the committees in the legalresources group have provided a lot of legal research that I haveused in my cases. Second, TRB is a source of objective, high-qual-ity research on transportation engineering issues and of access tolegitimate transportation experts—invaluable in representingtransportation agencies in litigation.”
For lawyers planning a career in transportation law, Tardif rec-ommends joining TRB committees and attending annual meet-ing and other conference sessions, such as the Annual Workshopon Transportation Law.
“Participating actively in committees and sessions by makingpresentations, serving on panels, and performing researchenhance professional skills and contribute to the advancement oftransportation law,” he points out.
“My particular advice for transportation lawyers handling lit-igation is to make clear and complete presentations to courts ofthe factual and technical transportation issues involved,” saysTardif. “It is important for decision makers to receive not only a
good briefing on the law, but a straightforward and concise pre-sentation on the historical and technical context of the trans-portation issue at hand.”
For example, the 2003 case Pierce County v. Guillen involveda federal statute prohibiting state and federal courts from allow-ing use of certain federally required safety data in personal injurylitigation against state and local transportation agencies. A statesupreme court had declared the federal statute unconstitutional.Tardif wrote a multistate amicus brief, asking the U.S. SupremeCourt to reverse the state court’s decision.
In developing the presentation to the U. S. Supreme Court,Tardif and his team decided not to emphasize principles of con-stitutional law but to trace the history of the federal highwaysafety statutes. The court unanimously reversed the state opinionand upheld the constitutionality of the federal law.
“The U.S. Supreme Court opinion was16 pages long, but the facts, history, con-text, and interpretation of the federalstatute took up 15 pages,” Tardif notes.“Only one page dealt with the legal issueunder the commerce clause of the U.S.Constitution.”
Tardif is a member of the WashingtonState Trial Lawyers Association, the Wash-ington Defense Trial Lawyers Association,and the Government Lawyers Associa-tion. He has written legal education mate-rials for these organizations and for state
and local bar associations. With Washington State Attorney Gen-eral Rob McKenna, he coauthored “Washington State’s 45-YearExperiment in Governmental Liability,” the lead article in a 2005volume of the Seattle University Law Review.
Tardif graduated from Seattle University and earned his lawdegree at the University of Washington and an MBA at the Uni-versity of Puget Sound. By then he had joined the state’s Office ofthe Attorney General, holding a succession of assignments culmi-nating in service as chief of the torts division of 50-plus attorneysfrom 1987 to 2001, when he took his current senior attorney post.
During his career, Tardif has represented government agenciesinvolved in a spectrum of activities including law enforcement,social welfare, corrections, and regulation. He has served on thestate Risk Management Advisory Committee and the Manage-ment Service Advisory Committee. Although much of his tortwork has been related to transportation, he also defends casesinvolving liability for civil rights, employment, regulatory, lawenforcement, and social welfare issues.
“Liability and damage theories from these other areas of tortlaw have increasingly become evident in cases involving trans-portation,” Tardif reports. “This variety of experience has beenhelpful in defending transportation claims.”
TR N
EWS
242
JAN
UARY
–FEB
RUAR
Y 20
06
34
P R O F I L E S. . . . . . . . . . . . . . . . . . .
“It is important for decision makers to
receive not only a good briefing on
the law, but a straightforward and
concise presentation on the historical
and technical context of the
transportation issue at hand.”
Michael E. TardifWashington State Attorney General’s Office

John Mason has distinguished himself in three careers:first as a U.S. Army officer, retiring as a colonel; then asa division and operations manager, vice president, andnow consultant at Science Applications International
Corporation (SAIC); and as an elected council member and six-term mayor of the City of Fairfax, Virginia.
In the Army, he served two tours in Vietnam, first as an adviserto a Vietnamese railway security battalion and then as command-er of a U.S. Army armored cavalry squadron of 1,200 soldiers. AtSAIC, he has been a leader in the development of the company’stransportation consulting business. As mayor, he has partici-pated in several transportation policy initiatives for the nationalcapital region and Virginia.
Mason concluded his Army career at the Pentagon as Assis-tant Director, Operations and Readiness Directorate, and joined
SAIC, an employee-owned research and engineering firm. Hewas the first director of the company’s Transportation and PolicyAnalysis Center, managing SAIC’s operations, research, andanalysis support for the Volpe National Transportation SystemsCenter. He also was the program manager for SAIC’s support tothe Federal Highway Administration (FHWA) Office of Opera-tions and continues to assist FHWA on regional transportationpolicy and decision-making issues.
Volunteer community service led to Mason’s election to theFairfax city council in 1986, followed by six successive terms asmayor from 1990 to 2002.
“It’s been fortunate that my civic life as mayor and my pro-fessional life as transportation consultant have been comple-mentary,” Mason comments. “The key to being effective in acivic role and successful in the consulting arena is building teamsof good people.”
Located “at the crossroads of Northern Virginia,” with “some350,000 vehicle-trips per day,” Fairfax owns and operates itshighway and street system, as well as its own bus system.
“In the mid-1990s, the City of Fairfax was among the leadersin Northern Virginia with technology initiatives such as trafficlight synchronization and coordination,” Mason notes. “We were
the first jurisdiction in Virginia to install cameras at intersec-tions that had patterns of red-light running.” Despite favorableresults, he reports, the cameras were removed in 2005 after thestate’s General Assembly decided not to renew the legislation.
Mason’s involvement in regional transportation issues wasinevitable. As a member of the National Capital Region Transpor-tation Planning Board, he chaired its Vision Steering Committee,which drafted the goals, objectives, and strategies for long-rangetransportation planning for metropolitan Washington, D.C. Masonalso served as vice-chair of the Transportation Coordinating Coun-cil of Northern Virginia, chaired the I-66 Major Investment StudyPolicy Advisory Committee, and was a member of the NorthernVirginia Transportation Commission.
He served as vice-chair for transportation on the RegionalEmergency Response Task Force convened by the Metropolitan
Washington Council of Govern-ments after the September 11,2001, terrorist attacks. He led thedesign of an innovative informa-tion-sharing approach for themany transportation agencies andjurisdictions in the region. He is apast chair of the board of direc-tors of the Association of Metro-politan Planning Organizations.
In 2004, Mason was appointedto the Governor’s Commission onRail Enhancement in Virginia for
the 21st Century, which drafted future rail policy for the state. Hehas authored an array of transportation-related papers and arti-cles, including reports on operations planning, intelligent trans-portation systems, national transportation strategic planning,and “How to Communicate with Elected Officials,” whichappeared in the February 2004 ITE Journal.
“I would urge that newcomers in the civic arena or in a trans-portation consulting role do the homework to understand notonly the technical aspects of the transportation issues, but alsothe decision-making process and what motivates leaders to getthings done,” he advises.
Involved in many community cultural activities, Mason ispresident of the board of directors for the Fairfax SymphonyOrchestra. He graduated from the University of Massachusettswith a degree in history and earned a master’s degree in politicalscience from New York University.
Mason has served TRB as a member of the National Cooper-ative Highway Research Program Oversight Panel for a FutureStrategic Highway Research Program and of the Regional Trans-portation Systems Management and Operations Committee. Hechaired the TRB Committee on Developing a Regional Conceptfor Managing Surface Transportation Operations.
TR NEW
S 242 JANUARY–FEBRUARY 2006
35
P R O F I L E S. . . . . . . . . . . . . . . . . . .
“I would urge that newcomers in the civic
arena or in a transportation consulting role
do the homework to understand not only the
technical aspects of the transportation issues,
but also the decision-making process and
what motivates leaders to get things done.”
John MasonScience Applications International Corporation

TR N
EWS
242
JAN
UARY
–FEB
RUAR
Y 20
06
36
TRANSIT IDEAS—The Transit Innovations Deserving Exploratory
Analysis (IDEA) program panel reviewed a project to develop a chem-
ical and biological decontamination system for subway stations, at a
meeting January 6 in Washington, D.C. Participants included (clock-
wise, from foreground) Katherine Turnbull, Texas Transportation Insti-
tute; Joe Henebury, U.S. Department of Transportation; Paul Messina,
New York City Transit; Lewis Clopton, Federal Transit Administration
(FTA); Frank Lonyai, Metropolitan Transportation Authority of Los
Angeles County; TRB Senior Program Officer Stephan Parker; Fred
Gilliam, Capital Metropolitan Transit Authority (Austin, Texas), panel
chair; TRB Senior Program Officer Harvey Berlin; Barry Barker, Transit
Authority of River City (Kentucky); and Joan LeLacheir of the Wash-
ington Metropolitan Area Transit Authority. The panel also selected
several proposals for project contracts.
The Transit IDEA Program supports innovative approaches to
advance transit practice. The program funds applied research and
development to improve the efficiency, safety, security, maintenance,
and ridership of transit systems. The program is funded by the Tran-
sit Cooperative Research Program sponsored by FTA. For more infor-
mation, see the IDEA website at www.TRB.org/idea.
TRB HIGHLIGHTS
STARTING UP—The oversight commit-
tee for TRB’s new Airport Cooperative
Research Program conducted its first
meeting, January 30–31, at the National
Academies Keck Center, Washington,
D.C. Participants included (left to right:)
Catherine Lang, Federal Aviation
Administration; TRB Executive Director
Robert E. Skinner, Jr.; Richard Marchi,
Airports Council International–North
America; TRB Cooperative Research Pro-
grams Director Robert Reilly; Paul
McGraw, Air Transport Association of
America, Inc.; and Gina Marie Lindsey,
McBee Strategic Consulting.
INTERNATIONAL EXCHANGE—Panel members for NCHRP
Project 20-36, Highway Research and Technology: Inter-
national Information Sharing, met in November 2005 in
Washington, D.C., to review project activities and the bud-
get. Since 1993, the project has supported participation by
state department of transportation (DOT) professionals
in international highway technology scans and on techni-
cal committees of PIARC, the World Road Association. The
project also assists in the implementation of scan findings.
The session included (clockwise, from foreground) Hana
Maier, Federal Highway Administration (FHWA); C.
Michael Walton, University of Texas–Austin; Larry R.
Goode, North Carolina DOT (retired); C. Franklin Gee, Vir-
ginia DOT (retired); Ken Kobetsky, American Association of State High-
way and Transportation Officials (AASHTO); William P. Carr, District DOT;
Amir N. Hanna, NCHRP; panel chair James F. Byrnes, Jr., Parsons Brinck-
erhoff Quade and Douglas; Francis B. Francois, Consultant; Bob Bryant,
AASHTO and Oregon DOT; Terry Halkyard, FHWA; and Richard C. Long,
Florida DOT.

TR NEW
S 242 JANUARY–FEBRUARY 2006
37
Alan M. Voorhees, NAE,internationally renownedpioneer in urban trans-portation planning and aninfluential writer on plan-ning standards and meth-ods, died in Richmond,Virginia, on December 18.Active in TRB, he servedas chairman of the Execu-tive Committee in 1973.
Voorhees developed a mathematical model to fore-cast traffic patterns; the model was used in the designand construction of the Interstate Highway Systemand around the world to plan highways, office andshopping complexes, and subway systems. He beganhis professional career in 1949 as city planning engi-neer for the City of Colorado Springs. He joined thestaff of the Automobile Safety Foundation in Wash-ington, D.C., in 1952 as a planning engineer.
In 1961, he founded the transportation consultingfirm of Alan M. Voorhees & Associates, which plannedmany of the metropolitan transit systems built in thefree world in the 1960s and 1970s. He contributed toseveral textbooks and manuals, including the guideBetter Transportation for Your City.
In the late 1970s, Voorhees was appointed dean ofthe College of Architecture, Art, and Urban Sciences atthe University of Illinois at Chicago. In 1980 hefounded Atlantic Southeast Airlines, which became a
subsidiary of Delta Air Lines. He collaborated inexpanding Autometric, Inc., a mapping and recon-naissance firm, and founded Summit Enterprises, areal estate holding company.
His awards and honors include the first HarlandBartholomew Award of the American Society of CivilEngineers, for his contributions to urban planning;and election in 2000 to the National Academy of Engi-neering, for his development and application of quan-titative relationships between urban land uses andtraffic flows. Rutgers University created the Alan M.Voorhees Transportation Center in his honor in 1998.He was a Fellow of the American Institute of CertifiedPlanners.
Voorhees was a veteran of World War II. Hereceived a Silver and a Bronze Star for his service in thePacific with Underwater Demolition Team 11, an eliteNavy unit that was a precursor to the Seals.
Voorhees completed a degree in civil engineering atRensselaer Polytechnic Institute and in city planningat the Massachusetts Institute of Technology. Heearned a certificate from the Yale University Bureau ofHighway Traffic.
In addition to his service on TRB’s Executive Com-mittee, he chaired the Technical Activities Councilfrom 1971 to 1972 and was a member of several TRBstanding committees. He chaired the Project Com-mittee on Highway Capacity Subcommittee on Defi-nitions (1960–1968) and the Project Committee onOrigin and Destination (1965–1970).
IN MEMORIAM
Alan M. Voorhees 1922–2005
David K. Witheford, a civil engineer and retired TRBsenior program officer, died November 18 in Arling-ton, Virginia. A native of Sheffield, England, he cameto the United States in 1941. He graduated fromSwarthmore College and received a certificate fromthe Yale University Bureau of Highway Traffic. Hisareas of special interest were urban transportationplanning and traffic and highway engineering.
Witheford served on 50 TRB committees, mostly asTRB staff or liaison representative, and chaired theSubcommittee on Criteria for the Design and Appli-cation of No Passing Zones. He joined the TRB staff asa projects engineer with the National CooperativeHighway Research Program in 1973; two years later,he was appointed assistant program director. In 1979he transferred to the Technical Activities Division as
senior program officer and engineer of traffic and oper-ations. He retired in January 1989 but continued towork as a consultant on highway-related topics forthe next 10 years.
Before coming to TRB, Witheford was technicaldirector for the Eno Transportation Foundation. Healso had worked for the Yale Bureau of Highway Traf-fic, for the Pittsburgh Area Transportation Study, andfor the Delaware State Highway Department. Duringthe Korean War, he served in the U.S. Army in Japanas engineering officer with the Japan ConstructionAgency.
Witheford was the author of many technical pub-lications. He participated on committees of the Amer-ican Society of Civil Engineers and the Institute ofTransportation Engineers.
David K. Witheford 1928–2005

TR N
EWS
242
JAN
UARY
–FEB
RUAR
Y 20
06
38
Intelligent Vehicle Technology and TrendsRichard Bishop. Artech House, Norwood, Massachusetts,2005; 366 pp.; $89; 1-58053-911-4.
This book presents a comprehensive overview ofthe workings of intelligent vehicle systems and of theissues involved in introducing the systems into roadvehicles. Real-world products are examined, along withpractical considerations such as market aspects anduser acceptance. The author discusses government andindustry strategies and offers a view of the future. Amember of the TRB Vehicle–Highway AutomationCommittee, Bishop intends to raise awareness of intel-ligent vehicle technology among audiences not directlyinvolved in developing the systems.
Round Table 127: Time and TransportAlan Deardorff, Yves Crozet, Lori Tavasszy, and NilsBruzelius. European Conference of Ministers of Trans-port. Organisation for Economic Co-Operation andDevelopment, Paris, France, 2005; 130 pp.; $50; 92-821-2330-8.
Participants in this roundtable revisited the exten-sive literature on the valuation of passenger time anddiscussed the underresearched topic of the value oftime in freight transport. Reports address the impor-tance of the cost and time of transport for interna-tional trade, time and passenger transport, and thelogistics perspective—the state of the art and researchchallenges—on the value of freight transport time.
Round Table 129: Transport Services: The Limits of (De)regulationGünter Knieps, Antonio Estache, Tomas Serebrisky,Dominique Bouf, Julien Leveque, and Marco Ponti. Euro-pean Conference of Ministers of Transport. Organisationfor Economic Co-Operation and Development, Paris,France, 2005; 164 pp.; $63; 92-821-2345-6.
Although deregulation and privatization in thetransport sector have led to increases in productivity,
reforms in the provision of infrastructure services havenot led to the mobilization of private resources, andconcession relations have been less successful thanenvisioned. Reports address current issues in reformand the results from delimiting regulatory needs,deregulating transport infrastructure and public–pri-vate partnerships, and competing for transport infra-structure services, as well as the theoretical and policyissues surrounding the regulation of transport servicesand infrastructure. Rapporteur Ponti is an individualaffiliate of TRB.
Advances in City Transport: Case StudiesS. Basbas, ed. Advances in Transport Series, Vol. 17. WITPress, Southampton, United Kingdom; Billerica, Massa-chusetts, 2005; 208 pp.; $120; 1-85312-799-X.
City transport systems are a challenge around theworld to the engineers and planners who must makedecisions that affect people’s daily lives and the qual-ity of the environment. An overview introduces sev-eral transportation systems, along with their plansand solutions: Adelaide, Australia; Bangalore, India;Bilbao, Spain; the Netherlands; Santiago, Chile; SãoPaulo, Brazil; Singapore; and Thessaloniki, Greece.The effect of traffic on air quality is a prominent topicin each case study.
Transport Phenomena in Fuel Cells B. Sundén and M. Faghri, eds. Developments in HeatTransfer Series, Vol. 19. WIT Press, Southampton, UnitedKingdom; Billerica, Massachusetts, 2005; 432 pp.; $195;1-85312-840-6.
Fuel cells are expected to play a significant role inthe next generation of energy systems and road vehi-cles. This book examines the potential transportationuses of solid oxide fuel cells, proton exchange mem-brane fuel cells, and direct methanol fuel cells. Alsopresented are detailed summaries of state-of-the-artknowledge and future needs.
The books in this section are not TRB publications. To order, contact the publisher listed.
TRB PUBLICATIONS
Aggregate Properties and the Performance ofSuperpave-Designed Hot-Mix AsphaltNCHRP Report 539This report offers a critical review of the post-1993technical literature on the impact of the aggregatecriteria specified by the Superpave® mix designmethod on the performance of hot-mix asphalt(HMA). The goal was to identify criteria withdemonstrated positive relationships with HMA per-
formance and to estimate the significance of therelationships. The report will be of interest to mate-rials engineers in state highway agencies, as well asto materials supplier and paving contractor per-sonnel responsible for the production of aggregatesand HMA.
2005; 90 pp.; TRB affiliates: $17.25; TRB nonaffili-ates: $23. Subscriber category: materials and construc-tion (IIIB).
BOOKSHELF

TR NEW
S 242 JANUARY–FEBRUARY 2006
39
Guidelines for Early-Opening-to-Traffic PortlandCement Concrete for Pavement RehabilitationNCHRP Report 540Guidelines are presented to facilitate the use of early-opening-to-traffic (EOT) concrete for pavement rehabil-itation by highway agencies, reducing pavement closuresand accruing economic and environmental benefits. Theguidelines address proportioning, testing, construction,and other aspects of EOT concrete to achieve long-termperformance, durability, and cost-effectiveness.
2005; 28 pp.; TRB affiliates: $15; TRB nonaffiliates:$20. Subscriber categories: pavement design, management,and performance (IIB); materials and construction (IIIB).
Integrated Roadside Vegetation ManagementNCHRP Synthesis 341Research and current practices in integrated roadsidevegetation management are documented in this syn-thesis, along with reports on the incorporation of thedecision-making processes into highway project plan-ning, design, construction, and maintenance. A surveyof 26 transportation agencies and a review of the litera-ture have yielded a compendium of successful prac-tices for potential implementation by other state DOTs.
2005; 80 pp.; TRB affiliates: $12.75; TRB nonaffili-ates: $17. Subscriber categories: energy and environment(IB); highway and facility design (IIA).
Chip Seal Best PracticesNCHRP Synthesis 342This synthesis presents an overview of successful chipseal practices in the United States, Canada, and over-seas. With a goal of assisting in the development andimplementation of pavement preservation programs,the volume describes the benefits of chip seal as partof a preventive maintenance program. Approximately40 best practices in chip seal design methods, contractadministration, equipment use, construction, and per-formance measures are identified.
2005; 111 pp.; TRB affiliates: $13.50; TRB nonaffili-ates: $18. Subscriber categories: materials and construc-tion (IIIB); maintenance (IIIC).
Management of Disadvantaged BusinessEnterprise Issues in Construction ContractingNCHRP Synthesis 343State transportation agencies have taken differentapproaches to the requirements in the DisadvantagedBusiness Enterprise (DBE) regulations revised in Feb-ruary 1999. This synthesis presents the approaches,generally covering all DBE programs, but with specificfocus on the highway transportation sector.
2005; 97 pp.; TRB affiliates: $13.50; TRB nonaffili-ates: $18. Subscriber categories: planning and adminis-tration (IA); materials and construction (IIIB).
Winter Highway OperationsNCHRP Synthesis 344Changes that occurred between 1994 and 2004 inpractices and strategies to control the impacts of win-ter weather on the safe and efficient movement of traf-fic are examined. The information is directed to anaudience of frontline and midlevel supervisory wintermaintenance decision makers and planners.
2005; 66 pp.; TRB affiliates: $12.75; TRB nonaffili-ates: $17. Subscriber category: maintenance (IIIC).
Track-Related Research: Friction ControlMethods Used by the Transit IndustryTCRP Report 71, Volume 4A variety of onboard and wayside friction control appli-cations for transit rail are described, including appro-priate uses and operational issues. Guidelines are givenfor selecting various types of friction control technolo-gies. The material should be of interest and assistance toengineers involved in the design, construction, mainte-nance, and operation of rail transit systems.
2005; 72 pp.; TRB affiliates: $16.50; TRB nonaffiliates:$22. Subscriber categories: public transit (VI); rail (VII).
Track-Related Research: Flange ClimbDerailment Criteria and Wheel–Rail ProfileManagement and Maintenance Guidelines forTransit OperationsTCRP Report 71, Volume 5Flange climb derailment criteria for transit vehicles,including lateral-to-vertical ratio limits and a corre-sponding flange-climb distance limit, are presented.Guidance is offered on wheel and rail maintenancepractices for transit agencies.
2005; 140 pp.; TRB affiliates: $18.75; TRB nonaffiliates:$25. Subscriber categories: public transit (VI); rail (VII).
Practices in No-Show and Late CancellationPolicies for ADA ParatransitTCRP Synthesis 60This synthesis documents current and innovativepractices of U.S. transit agencies in developing andimplementing passenger no-show and late cancella-tion policies for paratransit programs operated underthe requirements of the Americans with DisabilitiesAct of 1990 (ADA). The administration, communityresponse, and effectiveness of policies are described forsmall, medium, and large transit agencies. The reportexamines how the policies can improve system pro-ductivity, efficiency, and capacity, as well as service forriders with disabilities, who may experience difficul-ties with the advance reservation procedures of manyADA complementary paratransit operations.
2005; 49 pp.; TRB affiliates: $12; TRB nonaffiliates:$16. Subscriber category: public transit (VI).
TRB PUBLICATIONS (continued)
To order the TRBtitles described inBookshelf, visit theTRB online Book-store, www.TRB.org/bookstore/, or contact the Business Office at 202-334-3213.
BOOKSHELF

TR N
EWS
242
JAN
UARY
–FEB
RUAR
Y 20
06
40
TRB Meetings2006
Additional information on TRB meetings, including calls for abstracts, meeting registration, and hotel reservations, is available atwww.TRB.org/calendar. To reach the TRB staff contacts, telephone 202-334-2934, fax 202-334-2003, or e-mail [email protected]. Meetingslisted without a TRB staff contact have direct links from the TRB calendar web page.
*TRB is cosponsor of the meeting.
C A L E N D A R
March27–28 Safety Data Analysis Tools
Workshop (by invitation)Washington, D.C.Richard Pain
27–29 AASHTO Symposium onGeographic InformationSystems for Transportation *Columbus, OhioThomas Palmerlee
28–30 Transportation and EconomicDevelopment 2006*Little Rock, Arkansas
April5–6 Research to Enhance Rail
Network Performance: AWorkshop (by invitation)Washington, D.C.Elaine King
9–11 10th National Light RailTransit Conference: LightRail—A World of Applicationsand Opportunities*St. Louis, MissouriPeter Shaw
26–28 8th Annual National HarborSafety CommitteeConference*Washington, D.C.Joedy Cambridge
May3–4 Environmental Geospatial
Information forTransportation: AMultidisciplinary Examinationof Noteworthy Practices(by invitation)Thomas Palmerlee
17–19 6th National Aviation SystemPlanning SymposiumDaytona Beach, Florida
June4–7 North American Travel
Monitoring Exposition andConferenceMinneapolis, MinnesotaThomas Palmerlee
4–7 1st International Symposiumon Freeway Operations*(by invitation)Athens, GreeceRichard Cunard
July8 Challenges of Data for
Performance Measures(by invitation)La Jolla, CaliforniaThomas Palmerlee
9–11 TRB 2006 SummerConferenceLa Jolla, CaliforniaMark Norman
9–11 31st Annual Summer Ports,Waterways, Freight, andInternational TradeConferenceLa Jolla, California
16–19 3rd International Conferenceon Bridge Maintenance,Safety, and Management*Porto, Portugal
16–20 11th AASHTO–TRBMaintenance ManagementConference*Charleston, South Carolina
23–26 45th Annual Workshop onTransportation LawChicago, IllinoisJames McDaniel
25–29 5th International Symposiumon Highway Capacity*Yokohama, JapanRichard Cunard
30– 2nd International SymposiumAug. 3 on Transportation Technology
Transfer*St. Petersburg, FloridaKimberly Fisher
AugustTBD 7th National Access
Management ConferencePark City, UtahKimberly Fisher
2–4 3rd Bus Rapid TransitConferenceToronto, Ontario, CanadaPeter Shaw
6–9 1st International Conferenceon Fatigue and Fracturein the Infrastructure:Bridges and Structuresof the 21st Century*Philadelphia, PennsylvaniaStephen Maher
23–26 7th International Conferenceon Short and Medium SpanBridges*Montreal, Quebec, CanadaStephen Maher
TR News welcomes the submission of manuscripts for possiblepublication in the categories listed below. All manuscripts sub-mitted are subject to review by the Editorial Board and otherreviewers to determine suitability for TR News; authors will beadvised of acceptance of articles with or without revision. Allmanuscripts accepted for publication are subject to editing forconciseness and appropriate language and style. Authorsreceive a copy of the edited manuscript for review. Original art-work is returned only on request.
FEATURES are timely articles of interest to transportation pro-fessionals, including administrators, planners, researchers, andpractitioners in government, academia, and industry. Articlesare encouraged on innovations and state-of-the-art practicespertaining to transportation research and development in allmodes (highways and bridges, public transit, aviation, rail, andothers, such as pipelines, bicycles, pedestrians, etc.) and in allsubject areas (planning and administration, design, materialsand construction, facility maintenance, traffic control, safety,geology, law, environmental concerns, energy, etc.). Manuscriptsshould be no longer than 3,000 to 4,000 words (12 to 16double-spaced, typed pages). Authors also should provideappropriate and professionally drawn line drawings, charts, ortables, and glossy, black-and-white, high-quality photographswith corresponding captions. Prospective authors are encour-aged to submit a summary or outline of a proposed article forpreliminary review.
RESEARCH PAYS OFF highlights research projects, studies,demonstrations, and improved methods or processes thatprovide innovative, cost-effective solutions to important transportation-related problems in all modes, whether theypertain to improved transport of people and goods or provi-sion of better facilities and equipment that permits such trans-port. Articles should describe cases in which the applicationof project findings has resulted in benefits to transportationagencies or to the public, or in which substantial benefits areexpected. Articles (approximately 750 to 1,000 words) shoulddelineate the problem, research, and benefits, and be accom-panied by one or two illustrations that may improve a reader’sunderstanding of the article.
NEWS BRIEFS are short (100- to 750-word) items of inter-est and usually are not attributed to an author. They may beeither text or photographs or a combination of both. Linedrawings, charts, or tables may be used where appropriate.Articles may be related to construction, administration, plan-ning, design, operations, maintenance, research, legal matters,or applications of special interest. Articles involving brandnames or names of manufacturers may be determined to beinappropriate; however, no endorsement by TRB is impliedwhen such information appears. Foreign news articles shoulddescribe projects or methods that have universal instead oflocal application.
POINT OF VIEW is an occasional series of authored opin-ions on current transportation issues. Articles (1,000 to2,000 words) may be submitted with appropriate, high-qual-ity illustrations, and are subject to review and editing. Read-ers are also invited to submit comments on published pointsof view.
CALENDAR covers (a) TRB-sponsored conferences, work-shops, and symposia, and (b) functions sponsored by otheragencies of interest to readers. Notices of meetings shouldbe submitted at least 4 to 6 months before the event.
BOOKSHELF announces publications in the transportationfield. Abstracts (100 to 200 words) should include title, author,publisher, address at which publication may be obtained, num-ber of pages, price, and ISBN. Publishers are invited to submitcopies of new publications for announcement.
LETTERS provide readers with the opportunity to com-ment on the information and views expressed in publishedarticles, TRB activities, or transportation matters in general.All letters must be signed and contain constructivecomments. Letters may be edited for style and spaceconsiderations.
SUBMISSION REQUIREMENTS: Manuscripts submittedfor possible publication in TR News and any correspondenceon editorial matters should be sent to the Director, Publica-tions Office, Transportation Research Board, 500 Fifth Street,NW, Washington, DC 20001, telephone 202-334-2972, or e-mail [email protected].
All manuscripts should be supplied in 12-point type,double-spaced, in Microsoft Word 6.0 or WordPerfect 6.1 orhigher versions, on a diskette or as an e-mail attachment.
Submit original artwork if possible. Glossy, high-qual-ity black-and-white photographs, color photographs, andslides are acceptable. Digital continuous-tone images mustbe submitted as TIFF or JPEG files and must be at least 3 in.by 5 in. with a resolution of 300 dpi or greater. A captionshould be supplied for each graphic element.
Use the units of measurement from the researchdescribed and provide conversions in parentheses, as appro-priate. The International System of Units (SI), the updatedversion of the metric system, is preferred. In the text, the SIunits should be followed, when appropriate, by the U.S.customary equivalent units in parentheses. In figures andtables, the base unit conversions should be provided in afootnote.
NOTE: Authors are responsible for the authenticity of theirarticles and for obtaining written permissions from pub-lishers or persons who own the copyright to any previouslypublished or copyrighted material used in the articles.
I N F O R M A T I O N F O R C O N T R I B U T O R S T O
TR NEWS

Critical Issues in TransportationTRB Miscellaneous Publication, 16 pages, 8.5 x 11, free (2006)(Included in this magazine; to orderadditional copies, contact RussellHouston at [email protected].)
The Fuel Tax and Alternatives forTransportation FundingTRB Special Report 285, 6 x 9, paperback, on press—forthcomingApril 2006
Future Truck and Bus Safety ResearchOpportunitiesTRB Conference Proceedings 38, 8.5 x 11, paperback, on press—forthcoming April 2006
Integrating Sustainability into theTransportation Planning ProcessTRB Conference Proceedings 37, ISBN 0-309-09418-6, 59 pages, 8.5 x 11, paperback, $33.00 (2005)
Guide for Emergency TransportationOperationsNational Cooperative HighwayResearch Program (NCHRP) Report 525,Vol. 6, ISBN 0-309-08829-1, 56 pages,8.5 x 11, paperback, $21.00 (2005)
State Construction Quality AssuranceProgramsNCHRP Synthesis 346, ISBN 0-309-09749-5, 75 pages, 8.5 x 11, paperback,$17.00 (2005)
Strategies to Increase Coordination ofTransportation Services for theTransportation DisadvantagedTransit Cooperative Research ProgramReport 105, ISBN 0-309-08813-5, 77 pages, 8.5 x 11, paperback, $31.00 (2004)
The Marine Transportation System andthe Federal Role: MeasuringPerformance, Targeting ImprovementTRB Special Report 279, ISBN 0-309-09452-6, 180 pages, 6 x 9, paperback,$24.00 (2003)
The Workforce Challenge: Recruiting,Training, and Retaining QualifiedWorkers for Transportation and TransitAgenciesTRB Special Report 275, ISBN 0-309-08563-2, 186 pages, 6 x 9, paperback,$23.00 (2003)
To order these and other TRB publications, visit the TRB Bookstore, www.TRB.org/bookstore/; call 202-334-3213; or e-mail [email protected].
Congestion, emergencies, energy and environment, equity, finance,human and intellectual capital, infrastructure, institutions, and safetyare the critical issues in transportation that challenge the nation.Addressing these challenges will require new ideas, creativity, andinnovation. TRB has produced an array of information to help trans-portation professionals and decision makers address the criticalissues. Recent TRB publications of interest include the following:
AddressingTransportation’sCritical Issues