t/r module test...rx enable / tx enable pc with trm control sw rf measurement data trigger...
TRANSCRIPT

T/R Module Test
TRM Module
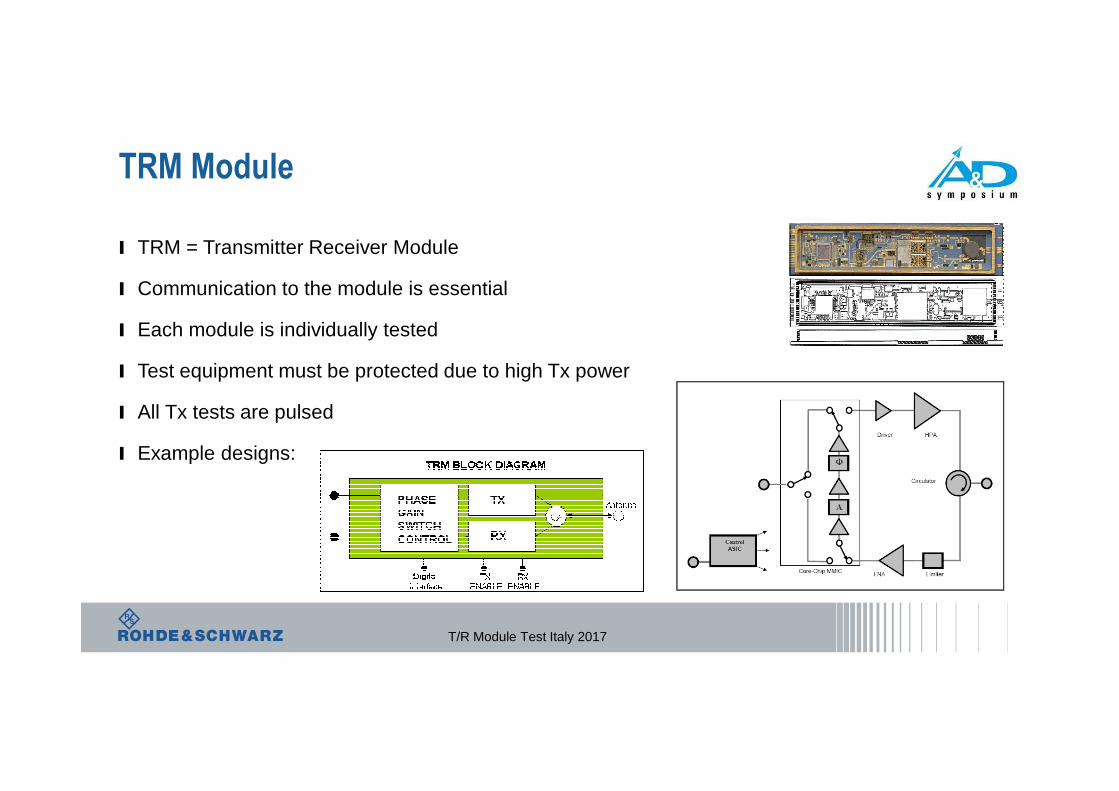
l TRM = Transmitter Receiver Module
l Communication to the module is essential
l Each module is individually tested
l Test equipment must be protected due to high Tx power
l All Tx tests are pulsed
l Example designs:
T/R Module Test Italy 2017

Typical Tests
T/R Module Test Italy 2017
Rxl S-parameter for all
attenuation and phasevalues
l Noise figurel Compression pointl Intermodulationl Out of band rejectionl Spuriousl …
Txl S-parameter for all
attenuation and phasevalues
l Output power vs. input powerl Saturated output powerl Pulse parametersl Power added efficiencyl Spurious and harmonicsl Intermodulation
Generall EEPROM programmingl Sensor temperaturl 1,024 to 65,536 states
per frequency
⇒ Typically 25.000 measurement values for full characterizationof one TRM module
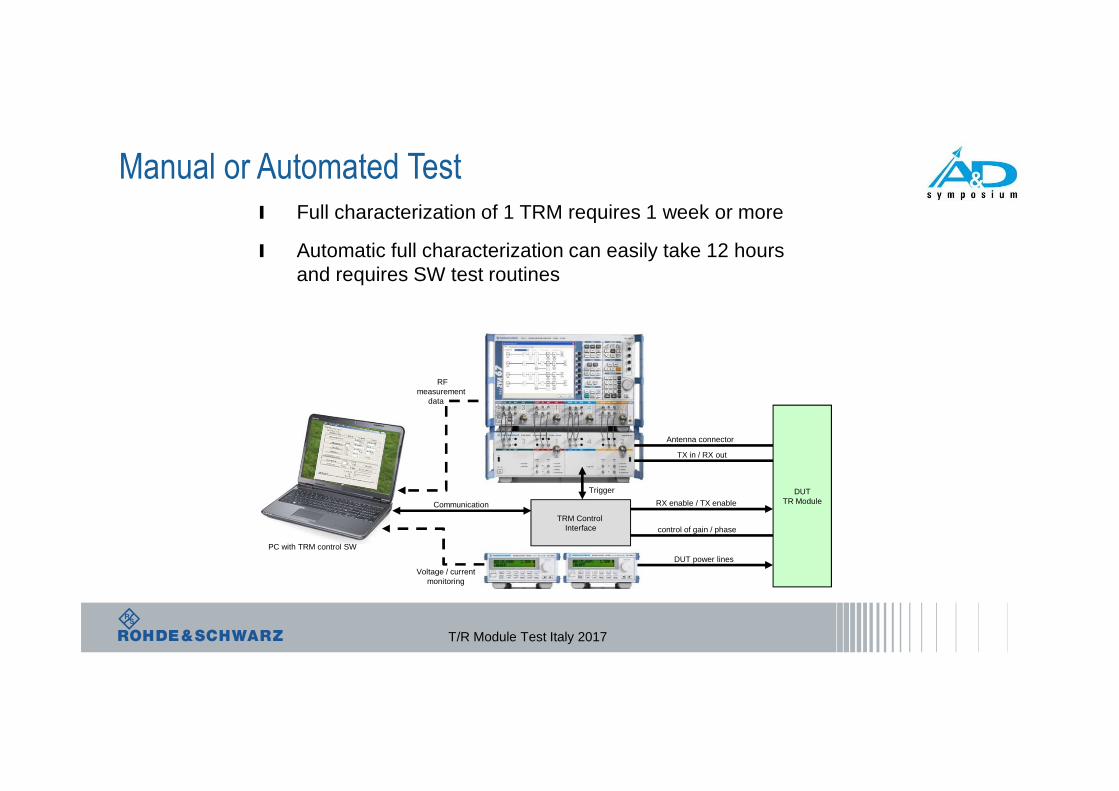
l Full characterization of 1 TRM requires 1 week or more
l Automatic full characterization can easily take 12 hoursand requires SW test routines
Manual or Automated Test
T/R Module Test Italy 2017
TRM Control Interface
DUTTR Module
control of gain / phase
DUT power lines
TX in / RX out
Antenna connector
RX enable / TX enable
PC with TRM control SW
RFmeasurement
data
Trigger
Communication
Voltage / currentmonitoring

T/R Module manual Test Solution for R&D
ZVA+ZVAX-TRMı Device from the shelfı Ideal for R&D applicationı TX and RX tests can be performed sequentiallyı Complete control via ZVA GUI
T/R Module Test Italy 2017

ZVAX-TRM
Meas 2
Out
Ref 2
Out
Src 2
In
Meas 1
Out
Ref 1
Out
Src 1
In
Src 4
Out
Ref 4
Out
Src 4
In
Ref 4
In
Src 3
Out
Ref 3
Out
Src 3
In
Ref 3
In
Port 2
Port 1
high
power
couplerpath
accesscombinerpulse
modulator amplifier
ZVAX-TRM
T/R Module Test Italy 2017

Special Features of R&S®ZVAX-TRM
ı 3 pulse modulators in 3 source paths� Bidirectional pulsed measurements
ı Two combiners � Intermodulation measurements in two directions, pulsed intermodulation measurements
ı Internal LNA for noise figure testı Internal power amplifier
� High output power under all conditionsı Switchable access to source and receiver paths
� Additional power amplifiers for high power applications� Additional LNA for noise figure measurement
ı R&S®ZVA with 4 sources� Fast intermodulation and mixer measurements
T/R Module Test Italy 2017

Intuitive User Interface
T/R Module Test Italy 2017

TRM Test Solution for Production
T/R Module Test Italy 2017
R&S ZVA24: 24GHz Network Analyzer
R&S OSP-TRM Multiplexing, Pulse Modulator, Switching, Combiner , LNA...
R&S TSVP PXI Platform: Communication to Device Under Test (DUT), trigger generation, system controller …
DUT power supplye.g. HMP4040
Customer Specific Test Sequencer TS6710 (Low Rack Height)

Automated Test e.g. TS6710
T/R Module Test Italy 2017

OSP-TRM – High Customization
ı Platform for high flexibilityı Combinersı Pulse modulatorsı Amplifiersı Filtersı Multiport switchesı Controlled via sequencer
T/R Module Test Italy 2017

ı ZVA + OSP-TRMı Customization according to the requirementsı TX and RX test without reconnection of the T/R moduleı Control Software with prepared test casesı Control via external PCı Digital control of the DUT
ı Test of several DUTs in parallel
T/R Module Test Solution for Production
T/R Module Test Italy 2017

Test Suite TRM-LIB
– Features
T/R Module Test Italy 2017

Test Suite TRM-LIB – DUT Control
ı Support of devices without and with control(e.g. different DUT states)
ı Digital control plugin programmed in C# for
� Communication with DUT
� Trigger generation
ı Example C# source code enclosed, Adaptation by customerto his DUT
� Programming of the DUT actions to be carried out at eachstep
� Adaptation by customer or R&S
T/R Module Test Italy 2017

Requirements for the RF Equipment
T/R Module Test Italy 2017

High Performance for Intermodulation
-120
-105
-90
-75
-60
-45
-30
-15
0 0
1
Ch1 Arb Center 1 GHz Pwr 10 dBm Span 5 MHz
Trc1 b2 dB Mag 15 dB / Ref 0 dBm
b2
Mkr 1 1.000500 GHz -4.664 dBm Mkr 2 999.50000 MHz -4.652 dBm Mkr 3 998.50000 MHz -98.019 dBm Mkr 4 1.001500 GHz -99.926 dBm
Mkr 1Mkr 2
Mkr 3 Mkr 4
T/R Module Test Italy 2017
>90 dBcIP3 40 dBm

Typical Measurement Tasks for TR-Module Test
ı Transmitter (TX)� Transmission / reflection
� Low power� Saturated power
� Pulse profile� Harmonics� Spurs
T/R Module Test Italy 2017
ı Receiver (RX)� Transmission / reflection
� Low power� Saturated power
� Spurs� Intermodulation� Noise figure
ı Number of states to be tested� All combinations of phase and attenuator settings referred to basic setting� Up to 1024 (5 bit) or 65536 (8 bit) combinations

High Output Power under all Conditions with Preamplifier
-10
-5
0
5
10
15
20
25
30
0
1
Pb 20 dBm Ch1 fb Start 500 MHz Stop 20 GHz
No_OPTION a1(P1s) dB Mag 5 dB / Ref 0 dBm PCai Smo
a1(P1s)
M1 1.000000 GHz 18.414 dBm M2 18.000000 GHz 11.006 dBm
M1
M2
-10
-5
0
5
10
15
20
25
30
0
2
Pb 20 dBm Ch2 fb Start 500 MHz Stop 20 GHz
Pumo a1(P1s) dB Mag 5 dB / Ref 0 dBm PCai Smo
a1(P1s)
M1 1.000000 GHz 10.849 dBm M2 18.000000 GHz 2.2145 dBm
M1
M2
-10
-5
0
5
10
15
20
25
30
0
3
Pb 10 dBm Ch3 fb Start 500 MHz Stop 20 GHz
Preamp_Pumo a1(P1s) dB Mag 5 dB / Ref 0 dBm PCai Smo
a1(P1s)
M1 1.000000 GHz 19.279 dBm M2 18.000000 GHz 16.150 dBm
M1M2
-10
-5
0
5
10
15
20
25
30
0
4
Pb 10 dBm Ch4 fb Start 500 MHz Stop 20 GHz
Pumo_Comb_PA a1(P1s) dB Mag 5 dB / Ref 0 dBm PCai Smo
a1(P1s)
M1 1.000000 GHz 16.124 dBm M2 18.000000 GHz 11.080 dBm
M1
M2
T/R Module Test Italy 2017
Up to 10 dBm @ 18 GHzwith pulse modulator and combiner
no option pulse mod only
pulse mod + preamp
pulse mod + preamp + combiner

Pulsed Measurement Capabilities
ı Average pulse measurements� Measurement versus power and frequency� Receiver sampling time > pulse period� Measures the average power of several pulses
ı Point in pulse measurement (more accurate)� Measurement versus power and frequency� Receiver sampling time < pulse width � Measures the peak power during one pulse
ı Pulse profile measurement� Measurement of the pulse versus time� Receiver sampling time << pulse width (ZVA-K7)� Measures the time dependent behavior during one pulse
timeMeasurement time / point
timetriggerdelay
Measurement time / point
timetrigger delay
data points
Measurement time / point
T/R Module Test Italy 2017

t
A
f1 f2 f3 f4 f5
f1 f2 f3 f4 f5
t
τ
Point in Pulse Measurement
ı Frequency or power swept measurementsı Pulse width > sampling timeı Accurate power measurements during “On” time of the pulseı Sampling time = (1..2) / IFBwı Sampling time @5 MHz IFBw abt. 420 ns
T/R Module Test Italy 2017
Pulse Profile with R&S®ZVA‘s Fast RAM-Mode
T/R Module Test Italy 2017

Pulse Profile with R&S®ZVA‘s Fast RAM-Mode
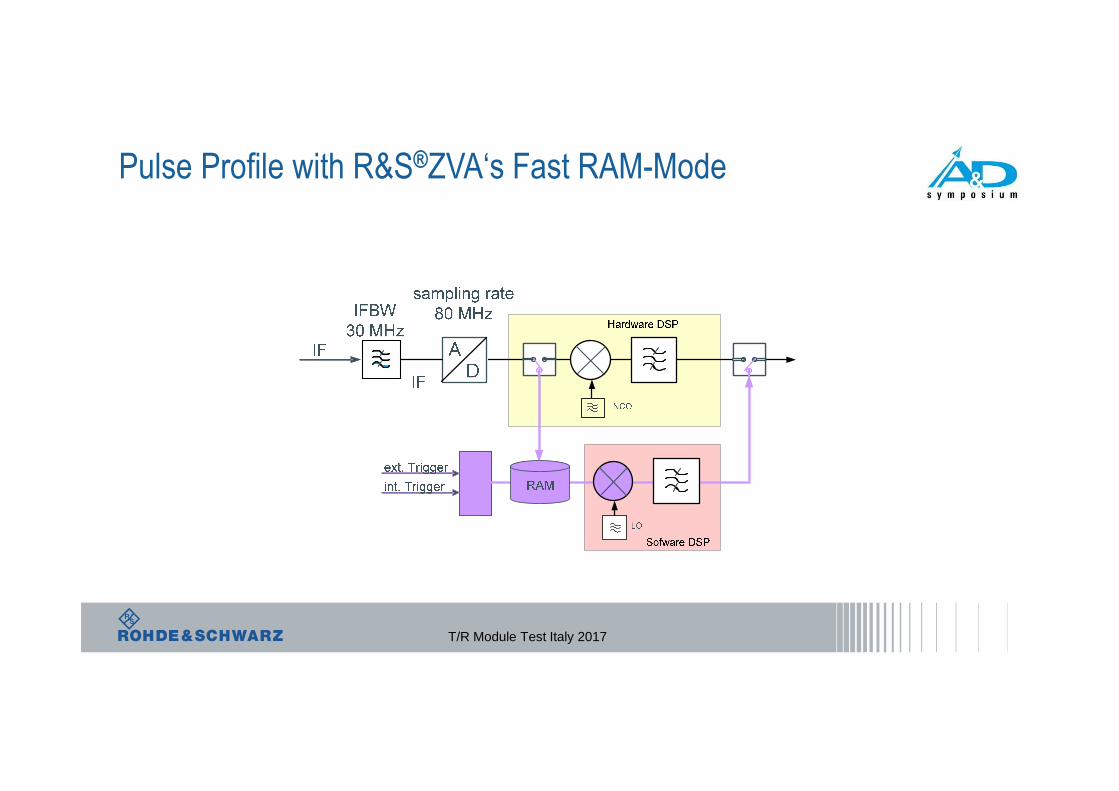
ı Measurement on one pulse with high sampling rate of 80 MHz and up to 30 MHz of bandwidth
ı Time resolution 12.5 ns
ı No loss of dynamic range by desensitization
ı No re-calibration required, when pulse parameters are changed
ı Measurements with single, double pulses and pulse trains possible
ı Correction for delay caused by DUT with high electrical length
T/R Module Test Italy 2017

Internal Pulse Generators
T/R Module Test Italy 2017
2 independent pulse generators
Minimum pulse width 12,5 ns
Single pulse and pulse trains
Individual delay, pulse width and polarity

Noise Figure Measurement with R&S®ZVA
Noise Figure Calculation:
T/R Module Test Italy 2017
=
output
inputDUT SNR
SNRlog10NF
4342143421measNF:
noise
signal
dataCAL:
noise
signal
output
output
input
input
P
Plog10
P
Plog10
==
−
=

Tests of the RX Path
T/R Module Test Italy 2017
2nd source for intermodulation combiner to generate 2-tone signal
LNA for noise figure test

Measurement Results RX Path
-40-30-20-10
010203040
0
1
P1 -30 dBm Ch1 fb Start 2 GHz Stop 3 GHz
Trc11Trc12Trc13Trc14
S21S11S22S21
dB MagdB MagdB MagPhase
10 dB /10 dB /10 dB /1° /
Ref 0 dB Ref 0 dB Ref 0 dB Ref 27.8°
Ca? PCao OffsCa? PCao OffsCa? PCao OffsCa? PCao Smo Offs
•M1 2.500000 GHz 28.885 dB S21 M1
-60-45-30-15
015304560
0
2
P1 -10 dBm Ch2 fb Start 2 GHz Stop 3 GHz
Trc2Trc4Trc7
UTOIM3LOIP3MO
Trc3Trc5
LTOIM3UO
IP3MO
-105
-90
-75
-60
-45
-30
-15
0
15
0
3
P1 -10 dBm Ch3 Arb Rec Start 998.5 MHzStop 1.0025 GHz
Trc6 b2(P1s) dB Mag 15 dB / Ref 0 dBm
b2(P1s)
262728293031323334
30
4
fb 2 GHzCh4 P1 Start -15 dBm Stop 2 dBm
Trc8Trc9Trc10Trc15
UTOIM3UOIP3MOS21
dB MagdB MagdB MagdB Mag
20 dB /20 dB /20 dB /1 dB /
Ref 0 dBm Ref 0 dBm Ref 0 dBm Ref 30 dB
PCal Off PCal Off PCal OffCa? PCal Off
M1 -7.50 dBm 34.866 dBm S21
M1
-2
0
2
4
6
8
10
12
14
0
5
P1 -30 dBm Ch5 fb Start 2 GHz Stop 3 GHz
Trc1 NF21 dB Mag 2 dB / Ref 0 dB Cal NCal PCal Smo
M1 2.500000 GHz 3.9015 dB NF21
M1
T/R Module Test Italy 2017
S-parameters vs. frequency
Intermodulation parameters vs. power
Intermodulation parameters vs. frequency
Noise figure
S21 vs power
Intermodulation spectrum

Test of the TX Path
T/R Module Test Italy 2017

13.616.619.622.625.628.631.634.637.6
25.6
1Trc1Trc2Trc7Trc8
S21S21S11S22
dB MagPhasedB MagdB Mag
10 dB /3° /10 dB /10 dB /
Ref 0 dB Ref 25.6° Ref 0 dB Ref 0 dB
Ca? OffsCa? Smo OffsCa? OffsCa? Smo Offs
M1M1M1M1
2.5000002.5000002.5000002.500000
GHz GHz GHz GHz
28.938 24.404-19.614-22.484
dB °
dB dB
S21
M1M1
M1
M1
25.5
26.0
26.5
27.0
27.5
28.0
28.5
29.0
29.5
28.5
2Trc3Trc4Trc9
S21S21b2(P1s)
dB MagPhasedB Mag
0.5 dB /1° /2 dB /
Ref 28.5 dB Ref 146.8° Ref 18 dBm
Cal Off OffsCal Off Smo OffsOffs
S21
-180
-135
-90
-45
0
45
90
135
180
0
TRG
3Trc5Trc10Trc11
b2(P1s)S21S21
dB MagdB MagPhase
10 dB /10 dB /45° /
Ref 0 dBm Ref 0 dB Ref 0°
Cal OffCal Off
S21
-85
-70
-55
-40
-25
-10
5
20
35
-40
4Trc12Trc13Trc15
UTOIM3UOIP3MO
dB MagdB MagdB Mag
15 dB /15 dB /5 dB /
Ref -40 dBm Ref -40 dBm Ref 35 dBm
IM3UO
Measurement Results TX Path
S-parameter vs. frequency(pulsed )
S21 vs time(pulse profile )
S-parameter vs. power(pulsed )
Intermod. vs power
T/R Module Test Italy 2017

-40
-20
0
20
40
0
1Trc11Trc12Trc14
S21S11S21
dB MagdB MagPhase
10 dB /10 dB /2° /
Ref 0 dB Ref 0 dB Ref 74°
Ca? PCao OffsCa? PCao OffsCa? PCao Smo Offs
M1 2.500000 GHz 21.742 dB S21 M1
-25
-15
-5
5
15
0
2Trc2Trc20Trc21
S12S22S12
dB MagdB MagdB Mag
5 dB /10 dB /0.3 dB /
Ref 0 dB Ref 0 dB Ref 12.9 dB
Ch2Ch2Ch8
Ca? PCal OffCa? PCal OffCal Off
S12
-80
-40
0
40
80
0
3Trc6Trc9
b2(P1s)IM3UO
dB MagdB Mag
15 dB /20 dB /
Ref 0 dBm Ref 0 dBm
Ch6Ch4
PCal Off PCal Off
-50
-30
-10
10
30
0
TRG
4Trc4Trc19
S12S12
PhasedB Mag
45° /10 dB /
Ref 0° Ref 0 dB
Cal OffCal Off
M1 17.6800 µs ------S12
M1
-2.5
1.5
5.5
9.5
13.5
5.5
5Trc1 NF21 dB Mag 2 dB / Ref 5.5 dB Cal NCal PCal Smo
M1 2.186000 GHz 6.0605 dB NF21
M1
-90
-70
-50
-30
-10
-50
6Trc17 b1(P4s) dB Mag 10 dB / Ref -50 dBm
M1 2.500000 GHz ------b1(P4s)
M1
Measurement of complete DUT
S21, S11
Intermod.
Noise Fig
T/R Module Test Italy 2017
S12, S22
Pulse profile
Intermod.
RX Path TX Path
T/R Module Test - Need for Accuracy and Speed
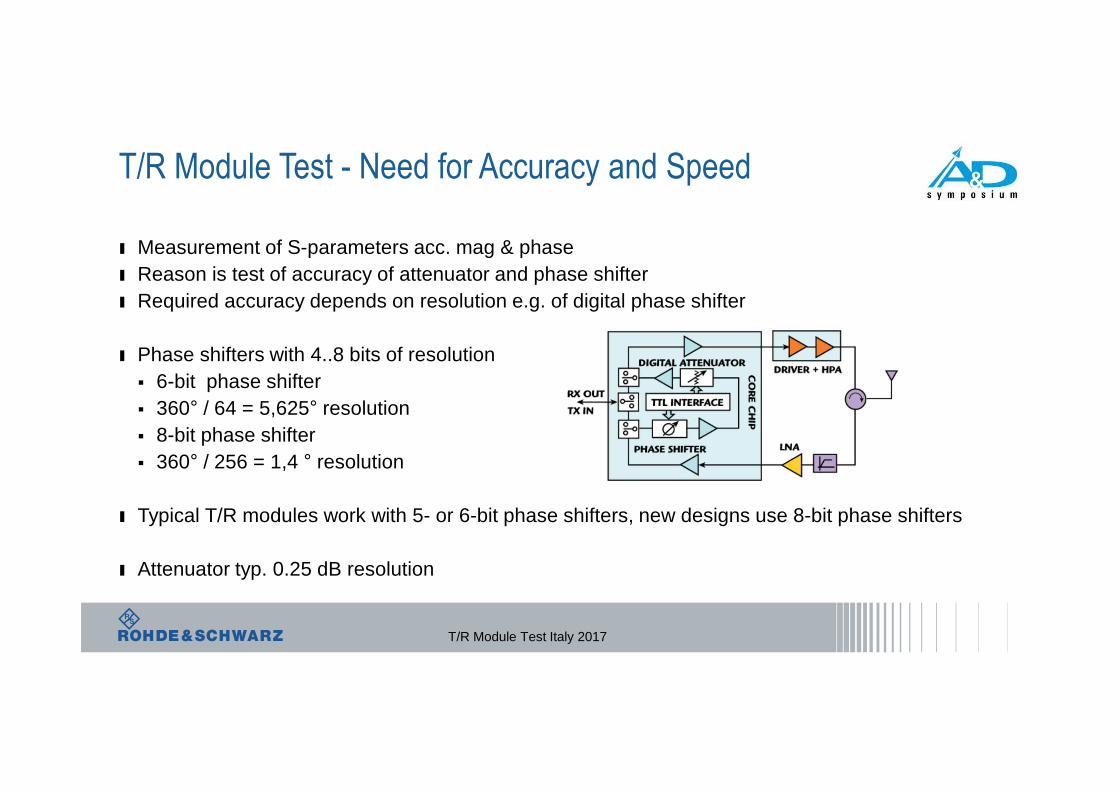
ı Measurement of S-parameters acc. mag & phaseı Reason is test of accuracy of attenuator and phase shifterı Required accuracy depends on resolution e.g. of digital phase shifter
ı Phase shifters with 4..8 bits of resolution� 6-bit phase shifter � 360° / 64 = 5,625° resolution� 8-bit phase shifter� 360° / 256 = 1,4 ° resolution
ı Typical T/R modules work with 5- or 6-bit phase shifters, new designs use 8-bit phase shifters
ı Attenuator typ. 0.25 dB resolution
T/R Module Test Italy 2017

Testing with high Speed
Two different test approaches
Performing CW Sweeps and switching the gain and attenuation states
� Used when frequency switching takes longer than switching DUT states� Widely used so far� Disadvantage: parameters have to be rearranged for documentation
Performing frequency sweeps and switch after every sweep the DUT states
� Used when frequency switching time is shorter than switching DUT states� Advantage: easy documentation of test results� Prefered solution for the customer
T/R Module Test Italy 2017
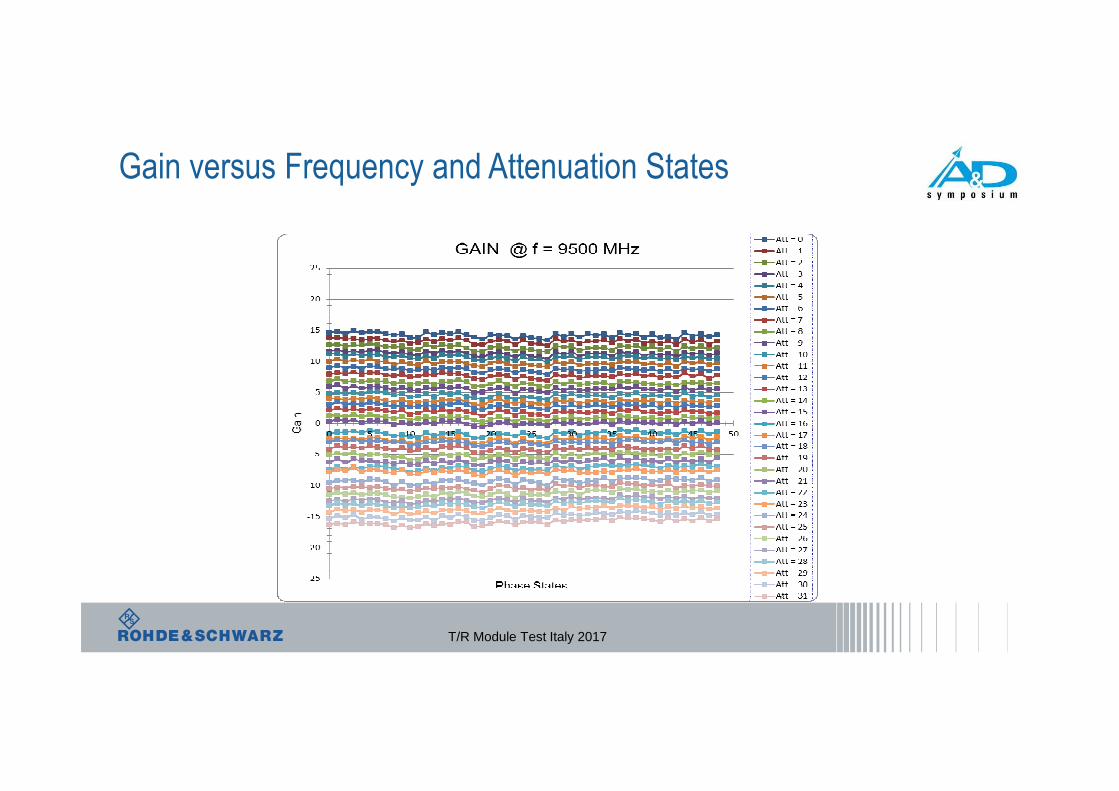
Gain versus Frequency and Attenuation States
T/R Module Test Italy 2017
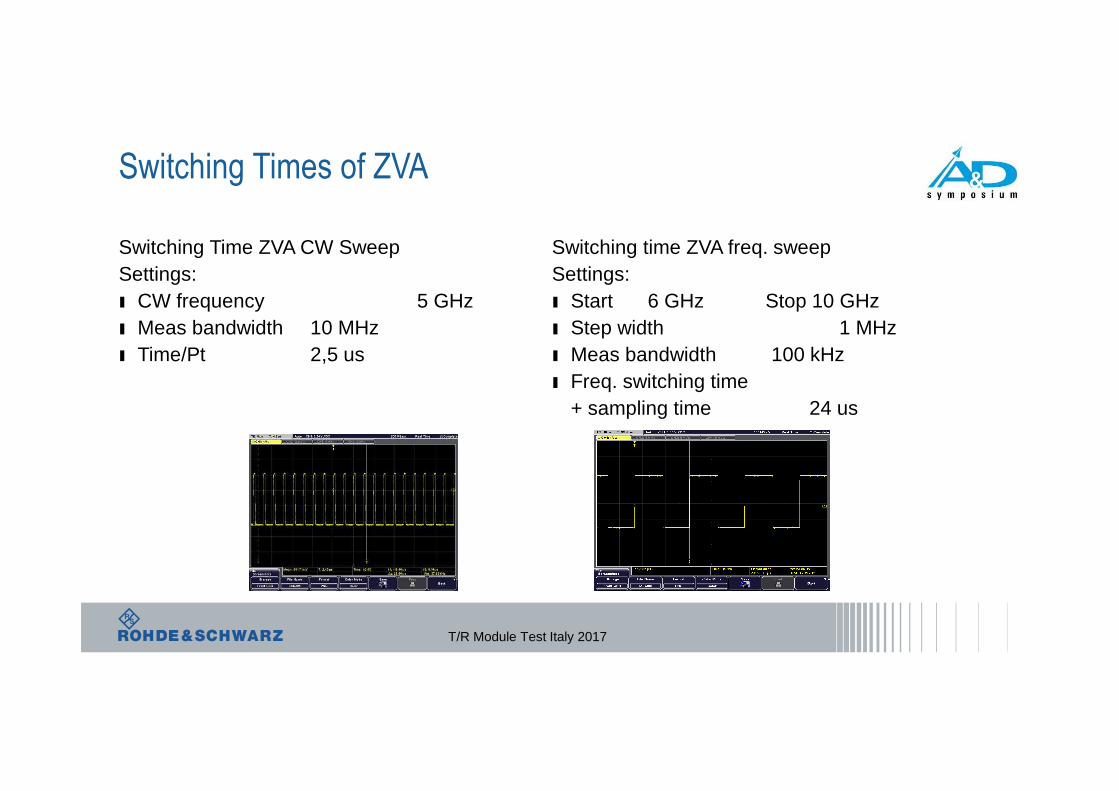
Switching Times of ZVA
Switching Time ZVA CW SweepSettings:ı CW frequency 5 GHzı Meas bandwidth 10 MHzı Time/Pt 2,5 us
T/R Module Test Italy 2017
Switching time ZVA freq. sweepSettings: ı Start 6 GHz Stop 10 GHz ı Step width 1 MHzı Meas bandwidth 100 kHzı Freq. switching time
+ sampling time 24 us

Proposed Scenario Example
ı Switching time CW sweep 3 usı Switching time freq. sweep 12 usı Sampling time (100 kHz) 12 usı State switching time (sst) x us
ı Test time CW sweep� Tswcw (sst) + tsampl = 3 us + 12 us = 15 us
ı Test time freq sweep� tswfreq (sst) + tsmpl= 12 us +12 us = 24 us
⇒ Frequency sweep is faster as soon as state switching time > 12 us⇒ Bottleneck for pulse measurements is pulse period
T/R Module Test Italy 2017

Typical Pulse Scenarios
ı RX test in un-pulsed modeı TX test in pulsed mode (point in pulse)ı Pulse width typically 10 us or wider
� Wide enough for measurement bandwidth of 100 kHz� When pulse width is wider, meas.-bandwdith can be reduced
ı Duty cycle 10% or less� Otherwise DUT will heat up� Typically test time / point > 100 us
⇒ in most cases VNA - switching time of frequency sweep is much faster than DUT - state switching time + pulse period
⇒ state switching was a typical scenario in the past when VNA synthesizers were slow
T/R Module Test Italy 2017

Increase of Test Speed
Multiple Measurements during one PulseProblem: Long measurement time due to low pulse repetition rate and long „ON“ - time
Solution:Several measurements can happen during one pulse with pulse widthof e.g.100 us
ı Test time = switching time + sampling time ı Sampling time 100 kHz IFBw 12 us; ı Freq switching time 12 usı Frequency sweep: 12 us + 12 us = 24 us
=> 4 measurements during one pulse
T/R Module Test Italy 2017

Multiple Measurements during one Pulse
ı Trigger signal for ZVA stops tsmapl before pulse modulator „ON“ time stopsı Ensures data sampling during ON-time of the pulseı Takes several ponts during one pulseı Speeds up measurement in this example by factor 4
T/R Module Test Italy 2017

Tests of the TX Path
Typical measurements tasks� Low input power (..-20 dBm) for small signal� High input power (5..10 dBm) for saturated power� High output power e.g. 43 dBm� Measurements under pulsed conditions
� Measurement in pulsed mode versus frequency, power and time� Transmission (mag / phase) & reflection
� Different phase and gain settings, linear and saturated output power � Pout versus Pin� Intermodulation test with 2-tone signal
T/R Module Test Italy 2017

18.5
19.0
19.5
20.0
20.5
21.0
21.5
22.0
22.5
22.0
1 (Max)
Pb -20 dBm Ch1 fb 1.7 GHz Stop 801
Trc1Trc2Trc3Trc4
S21b2(P1s)a1(P1s)S21
dB MagdB MagdB MagPhase
0.5 dB /0.5 dB /0.5 dB /1° /
Ref 22 dB Ref -0.5 dBm Ref -22.6 dBm Ref -154.56°
M1 401.0 -155.33 °
•Trac Stat:Min:Max:Pk-Pk:Trac Stat:Min:Max:Pk-Pk:
Trc1 S21 21.7643 22.2955 0.5311Trc4 S21
-156.8836 -153.3393
3.5443
dB dB dB ° ° °
S21
M1
Test of TX Path small Signal –
special Challenges
ı Forward S21 and S11 measurement in pulsed modeı High accuracy specs (especially for 8 bit resolution)
� S21 < 1°, < 0,1 dB
ı Pin for small signal test typically -20 dBm or even less
ı Problem: High trace noise of S21 mag & phaseı Trace noise more critical than absolute accuracyı Relative accuracy is necessary to compare the
phase and magnitude states; ı Trace noise typically is the bottleneck
T/R Module Test Italy 2017
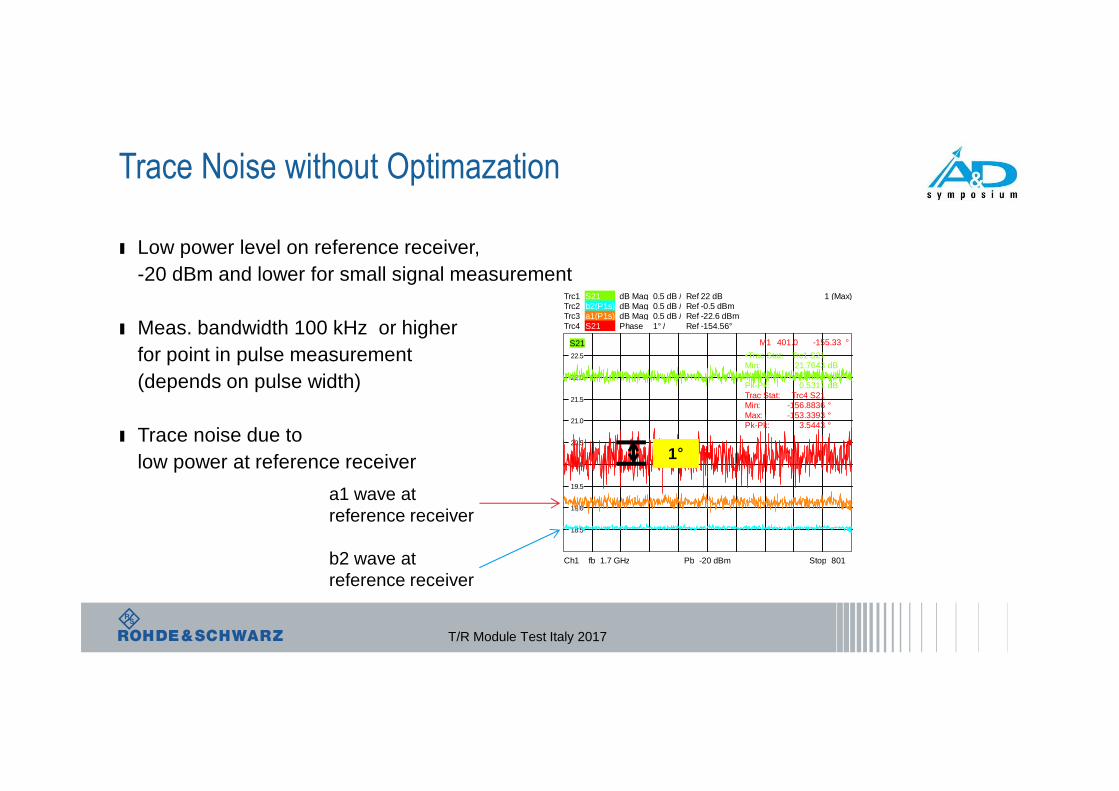
Trace Noise without Optimazation
ı Low power level on reference receiver, -20 dBm and lower for small signal measurement
ı Meas. bandwidth 100 kHz or higher for point in pulse measurement (depends on pulse width)
ı Trace noise due tolow power at reference receiver
T/R Module Test Italy 2017
18.5
19.0
19.5
20.0
20.5
21.0
21.5
22.0
22.5
22.0
1 (Max)
Pb -20 dBm Ch1 fb 1.7 GHz Stop 801
Trc1Trc2Trc3Trc4
S21b2(P1s)a1(P1s)S21
dB MagdB MagdB MagPhase
0.5 dB /0.5 dB /0.5 dB /1° /
Ref 22 dB Ref -0.5 dBm Ref -22.6 dBm Ref -154.56°
M1 401.0 -155.33 °
•Trac Stat:Min:Max:Pk-Pk:Trac Stat:Min:Max:Pk-Pk:
Trc1 S21 21.7643 22.2955 0.5311Trc4 S21
-156.8836 -153.3393
3.5443
dB dB dB ° ° °
S21
M1
a1 wave atreference receiver
b2 wave at reference receiver
1°

Solution for low Trace Noise for
S21 Measurementı Improve of sensitivity of
reference receiver
ı Optimize power level at the reference receivers
� Add attenuation in the source path e.g. byswitchable attenuator and by using theloss of the modulator with increased source power
T/R Module Test Italy 2017

Setup for small Signal TX Measurement
T/R Module Test Italy 2017

Setup for small Signal TX Measurement
- optimized
T/R Module Test Italy 2017

Optimized Trace Noise
reference receiver „low noise“
T/R Module Test Italy 2017
reference receiver „low noise“ + optimized power level
1°
1°

Solution with OSP-TRM
T/R Module Test Italy 2017
OSP-TRM

Phase Measurement
ı Uncertainty ± 0,5°ı Total error (trace noise + systematic error)
T/R Module Test Italy 2017
1°

TX path - saturated Power Measurement
ı Trace noise uncritical compared to small signal
� Output power increased -> increase of step attenuation in b2 receiver � Input power increased ->
� Removal of attenuation in reference path� Use of reference arm of ZVAX coupler� Reference power sufficient for good S/N
ı Relative accuracy e.g. for 8-bit phase shifter better 1°
T/R Module Test Italy 2017

Power Protection for 43 dBm
ı ZVAX-TRM as well as OSP-TRM have high power couplersı Receiver and source protection e.g. by isolators or attenuators required
ı 43 dBm = 20 Wattsı Duty cycle 10 %ı Average power
� 23 dBm or 0,2 Watt
ı 5 W attenuators (37 dBm) are sufficient
T/R Module Test Italy 2017

TX path - saturated Power Measurement
T/R Module Test Italy 2017

Solution with OSP-TRM
T/R Module Test Italy 2017
OSP-TRM
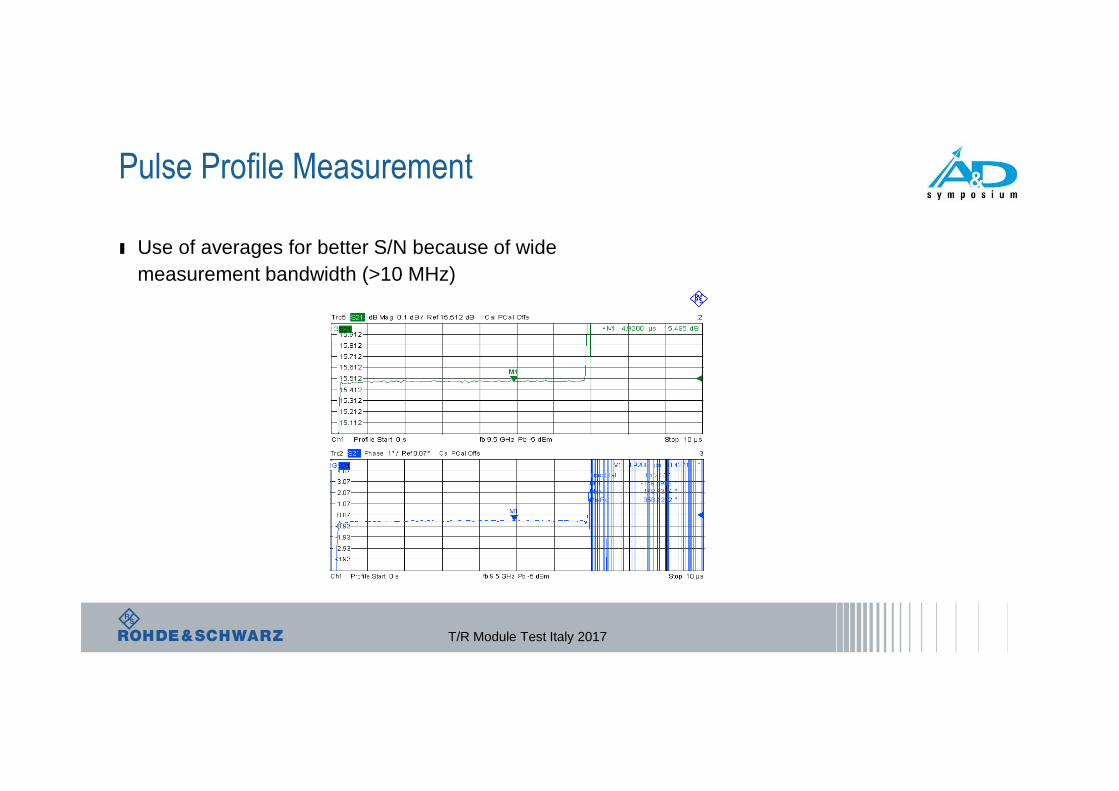
Pulse Profile Measurement
ı Use of averages for better S/N because of wide measurement bandwidth (>10 MHz)
T/R Module Test Italy 2017

TX Harmonics
T/R Module Test Italy 2017
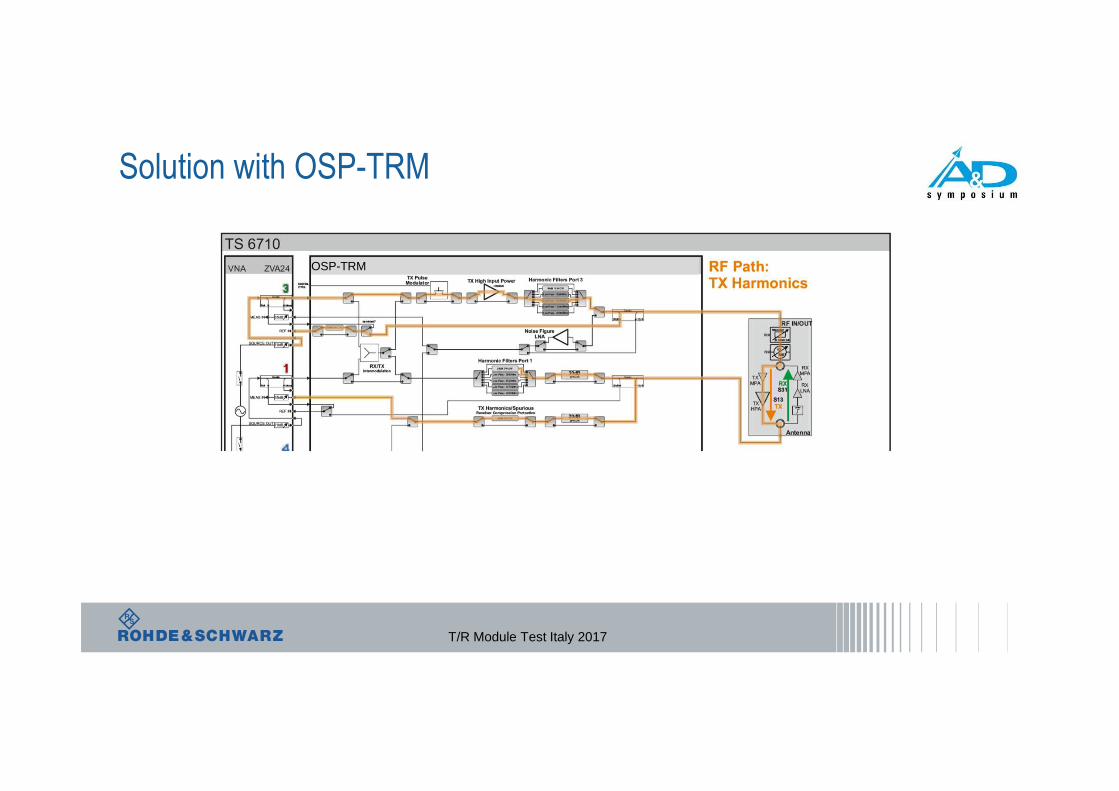
Solution with OSP-TRM
T/R Module Test Italy 2017
OSP-TRM

TX Spur Emission
ı Harmonic measurement at specific frequenciesı Spur search over wide frequency range 10 GHz..20 GHzı Typical settings
� Source in CW mode� Receiver measures 2nd and 3rd harmonic and spurs� Typically also pulsed with wide IF bandwidth
T/R Module Test Italy 2017
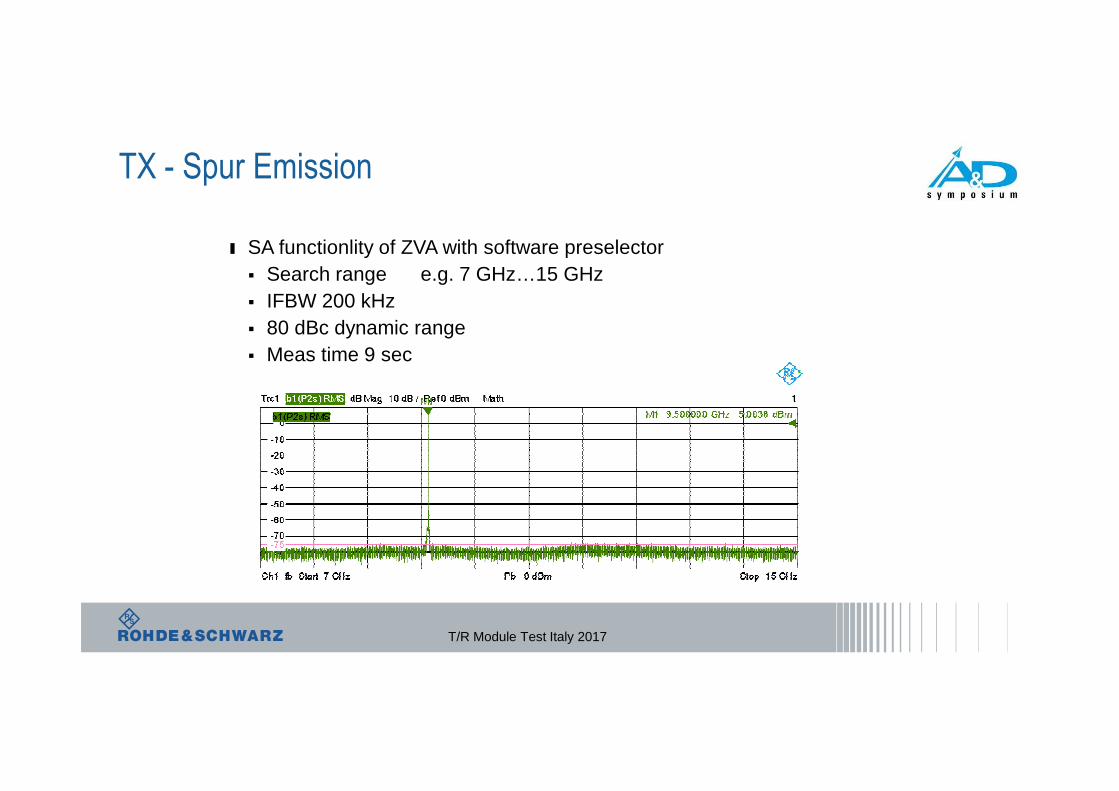
TX - Spur Emission
ı SA functionlity of ZVA with software preselector� Search range e.g. 7 GHz…15 GHz� IFBW 200 kHz� 80 dBc dynamic range� Meas time 9 sec
T/R Module Test Italy 2017

RX Path Small Signal Gain
ı Test under un-pulsed conditionsı Switching of statesı Reflection, gain (mag&phase)
ı Small signal input power -30 dBm and belowı High accuracy specs
� S12 < 0,5°, < 0,05 dBı Full two port calibration necessary
ı Problem:ı Low input power, high gainı Low reference signalı Low power in reverse direction due to high isolation.
T/R Module Test Italy 2017
-20.562-20.462-20.362-20.262-20.162-20.062-19.962-19.862-19.762
-20.162
1
Pb -40 dBm Ch1 fb 2 GHz Stop 801
Trc2Trc9Trc10
a2(P2s)a1(P1s)S21
dB MagdB MagdB Mag
0.1 dB /0.1 dB /1 dB /
Ref -39.8 dBm Ref -20.162 dBm Ref -39.788 dB
PCal Offs PCai OffsCa? PCao Offs
Trac Stat:Min:Max:Pk-Pk:
Trc10 S21 -48.9453 -37.7720 11.1733
dB dB dB
•M1M1M1
101.0101.0101.0
-39.211-40.380-40.220
dBm dBm
dB
a1(P1s)
M1
M1
M1
32.6
33.1
33.6
34.1
34.6
35.1
35.6
36.1
36.6
35.1
3
Pb -40 dBm Ch1 fb 2 GHz Stop 801
Trc1Trc8
S12S12
dB MagPhase
0.05 dB /0.5° /
Ref 26.438 dB Ref 35.1°
Ca? PCao OffsCa? PCao Offs
Trac Stat:Min:Max:Pk-Pk:Trac Stat:Min:Max:Pk-Pk:
Trc1 S12 26.2709 26.4124 0.1415Trc8 S12
34.7779 35.7525 0.9746
dB dB dB ° ° °
M1M1
101.0101.0
26.334 35.085
dB °
S12
M1
M1
RX Path Small Signal Gain
Solutionı Improvement of sensitivity by setting AGC amplifiers for “a” waves to low noise mode
� B wave receiver for forward direction has to remain in auto modeı Increase of source power in the reference channel ı Use of internal coupler of ZVAı Increase of power level for reverse measurement by 20 dB or more.
T/R Module Test Italy 2017

RX small Signal Gain with and without Optimization
ı Identical forward and reverse power
T/R Module Test Italy 2017
ı 20 dB higher reverse power
-20.562-20.462-20.362-20.262-20.162-20.062-19.962-19.862-19.762
-20.162
1
Pb -40 dBm Ch1 fb 2 GHz Stop 801
Trc2Trc9Trc10
a2(P2s)a1(P1s)S21
dB MagdB MagdB Mag
0.1 dB /0.1 dB /1 dB /
Ref -39.8 dBm Ref -20.162 dBm Ref -39.788 dB
PCal Offs PCai OffsCa? PCao Offs
Trac Stat:Min:Max:Pk-Pk:
Trc10 S21 -48.9453 -37.7720 11.1733
dB dB dB
•M1M1M1
101.0101.0101.0
-39.211-40.380-40.220
dBm dBm
dB
a1(P1s)
M1
M1
M1
32.6
33.1
33.6
34.1
34.6
35.1
35.6
36.1
36.6
35.1
3
Pb -40 dBm Ch1 fb 2 GHz Stop 801
Trc1Trc8
S12S12
dB MagPhase
0.05 dB /0.5° /
Ref 26.438 dB Ref 35.1°
Ca? PCao OffsCa? PCao Offs
Trac Stat:Min:Max:Pk-Pk:Trac Stat:Min:Max:Pk-Pk:
Trc1 S12 26.2709 26.4124 0.1415Trc8 S12
34.7779 35.7525 0.9746
dB dB dB ° ° °
M1M1
101.0101.0
26.334 35.085
dB °
S12
M1
M1
-20.562-20.462-20.362-20.262-20.162-20.062-19.962-19.862-19.762
-20.162
1
Pb -40 dBm Ch1 fb 2 GHz Stop 801
Trc2Trc9Trc10
a2(P2s)a1(P1s)S21
dB MagdB MagdB Mag
0.1 dB /0.1 dB /1 dB /
Ref -39.8 dBm Ref -20.162 dBm Ref -39.788 dB
PCal Offs PCai OffsCa? Pca? Offs
Trac Stat:Min:Max:Pk-Pk:
Trc10 S21 -41.9984 -40.8544 1.1441
dB dB dB
•M1M1M1
101.0101.0101.0
-39.226-20.002-41.349
dBm dBm
dB
a1(P1s)
M1
M1
M1
32.633.133.634.134.635.135.636.136.6
35.1
3
Pb -40 dBm Ch1 fb 2 GHz Stop 801
Trc1Trc8
S12S12
dB MagPhase
0.05 dB /0.5° /
Ref 26.438 dB Ref 35.1°
Ca? Pca? OffsCa? Pca? Offs
Trac Stat:Min:Max:Pk-Pk:Trac Stat:Min:Max:Pk-Pk:
Trc1 S12 26.2686 26.3642 0.0956Trc8 S12
34.7887 35.3851 0.5964
dB dB dB ° ° °
M1M1
101.0101.0
26.309 34.981
dB °
S12
M1
M1
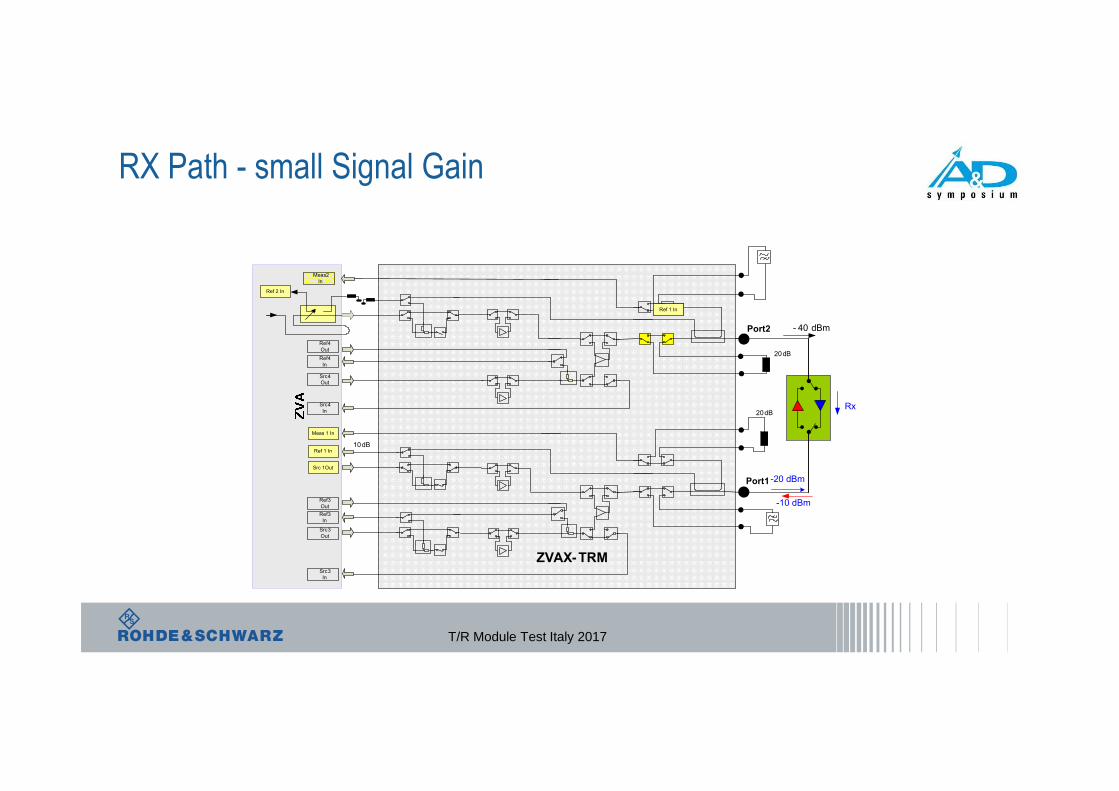
RX Path - small Signal Gain
T/R Module Test Italy 2017
Port 2
Port 1
ZVAX-TRM
Rx
-10 dBm
- 40 dBm
10 dB
20 dB
20 dB
Src 4
In
Ref 4
In
Src 4
Out
Ref 4
Out
Src 3
In
Ref 3
In
Src 3
Out
Ref 3
Out
Meas 2
In
Ref 1 In
Src 1Out
Ref 2 In
-20 dBm
Meas 1 In
Ref 1 InRef 1 In

ZVAX-TRM setup
T/R Module Test Italy 2017
Use ofinternal ZVA coupler
attenuator toboost outputpower

Solution with OSP-TRM
T/R Module Test Italy 2017
OSP-TRM

RX Path – Noise Figure
T/R Module Test Italy 2017

Solution with OSP-TRM
T/R Module Test Italy 2017
OSP-TRM

End
T/R Module Test Italy 2017
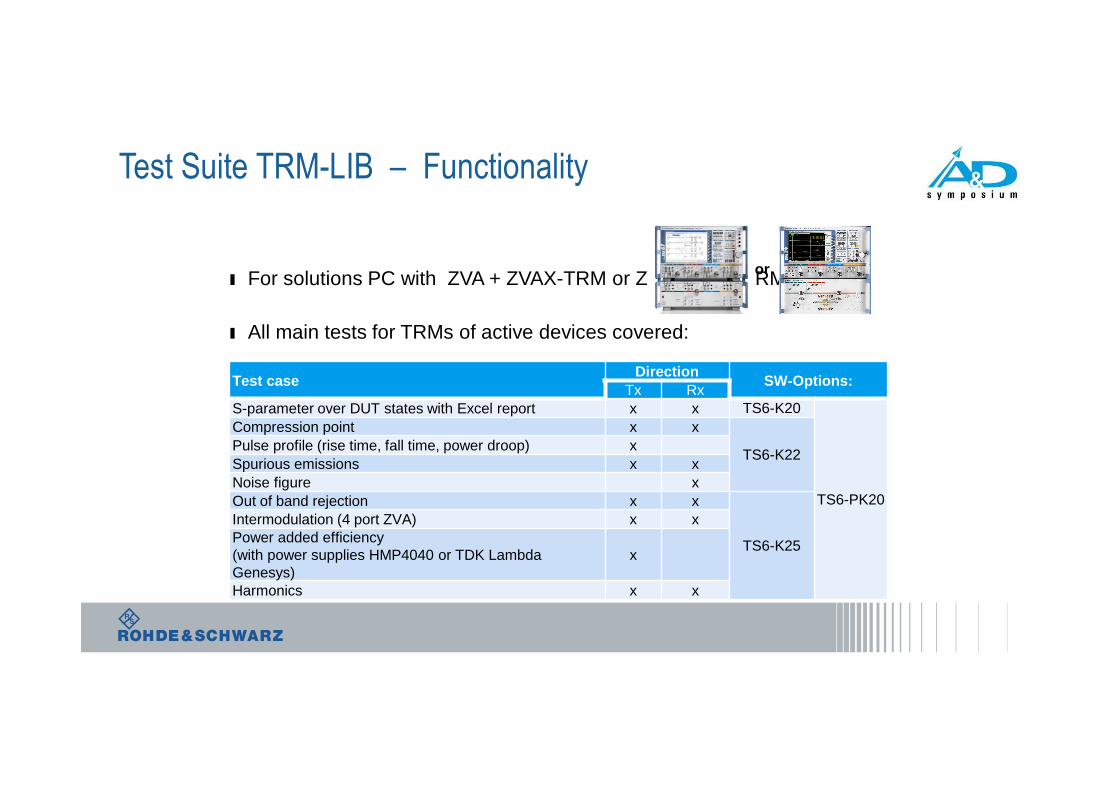
ı For solutions PC with ZVA + ZVAX-TRM or ZVA + OSP-TRM
ı All main tests for TRMs of active devices covered:
Test Suite TRM-LIB – Functionality
T/R Module Test Italy 2017
Test caseDirection
SW-Options:Tx Rx
S-parameter over DUT states with Excel report x x TS6-K20
TS6-PK20
Compression point x x
TS6-K22Pulse profile (rise time, fall time, power droop) xSpurious emissions x xNoise figure xOut of band rejection x x
TS6-K25
Intermodulation (4 port ZVA) x xPower added efficiency (with power supplies HMP4040 or TDK Lambda Genesys)
x
Harmonics x x
or
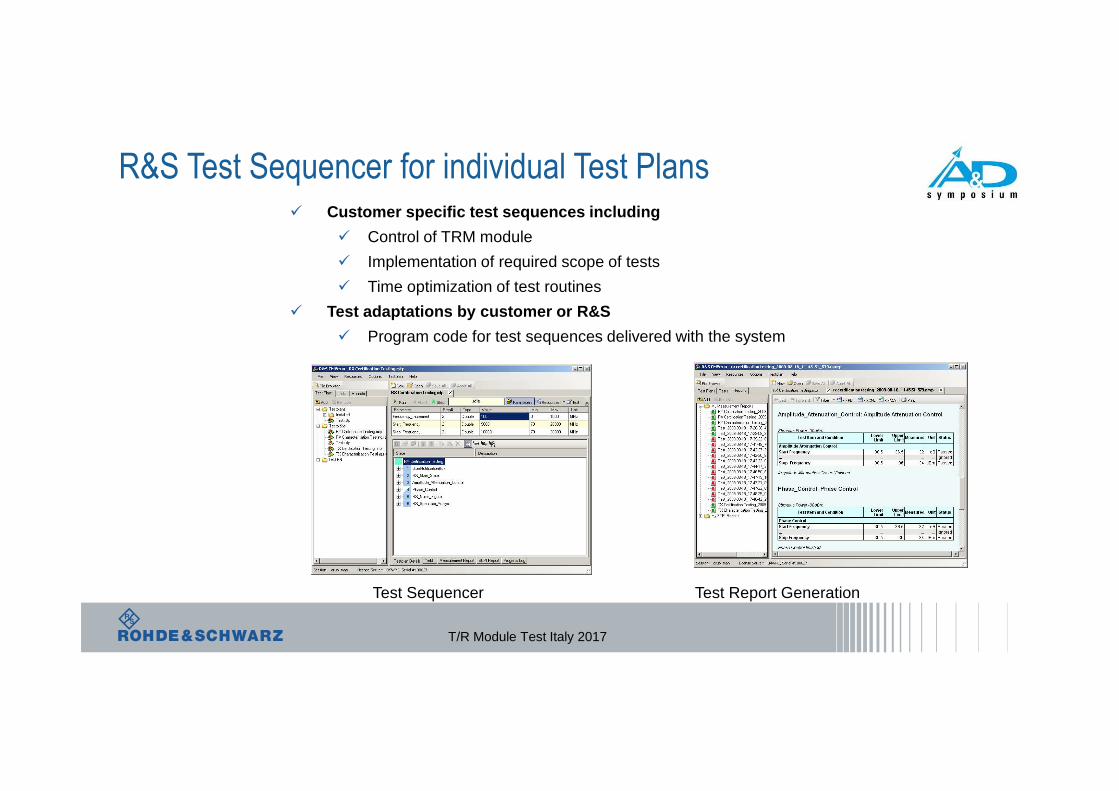
R&S Test Sequencer for individual Test Plans
T/R Module Test Italy 2017
Test Sequencer Test Report Generation
� Customer specific test sequences including
� Control of TRM module
� Implementation of required scope of tests
� Time optimization of test routines
� Test adaptations by customer or R&S
� Program code for test sequences delivered with the system

Real life test time: RX S-Parameter Measurement:DUT: RFcore core chip module
TrmTxSParameter: Parameters
StartFrequency: 9000 MHz
StopFrequency: 10000 MHz
Points: 51
96 gain-phase-combinations
Power: -30 dBm
Bandwidth: 5 kHz
Measurement time: 12 seconds
Resust files:
Pass / fail analysis in report
Statistical analysis
Fast analysis by Excel graphics and measurement data
(Gain vs Freq./ Phase vs. Freq. / Gain vs Phase / Phase vs Gain)
T/R Module Test Italy 2017

Real life test time: TX S-Parameter Measurement DUT: RFcore core chip module
TrmTxSParameter: Parameters
StartFrequency: 9000 MHz
StopFrequency: 9500 MHz
Points: 51
48 phase states / 32 attenuation states
all combinations
Power: -17 dBm
Bandwidth: 200 kHz
Resust files:
Pass / fail analysis in report
Statistical analysis
Fast analysis by 4 Excel files with data and graphics
(Gain vs Freq./ Phase vs. Freq. / Gain vs Phase / Phase vs Gain)
Freqency = 9500
Att Phase Gain
0 0 14,68
1 14,77
2 14,48
3 14,9
4 14,54
5 14,73
6 14,75
7 14,4
T/R Module Test Italy 2017

R&S cTSVP: Fast programming of the Module
� DUT control:
� High Speed Digital Module up to 40 MHz pattern rate and programmable level for DUT control
� Large on board memory to save all DUT commands in advance.
� PXI LVDS digital waveform generator / analyzer Very fast setup of gain / phase, e.g. < 300us
� Real time evaluation of DUT response messages.
� Trigger of R&S ZVA24 for real time test.
� DMM
T/R Module Test Italy 2017