tr-022 bioassay of dieldrin for possible … cancer institute carcinogenesis technical report series...
TRANSCRIPT

National Cancer Institute CARCINOGENESIS Technical Report Series No. 22 1978
BIOASSAY OF
DIELDRIN
FOR POSSIBLE CARCINOGENICITY
CAS No. 60-57-1
NCI-CG-TR-22
U.S. DEPARTMENT OF HEALTH, EDUCATION, AND WELFARE Public Health Service National Institutes of Health


BIOASSAY OF
DIELDRIN
FOR POSSIBLE CARCINOGENICITY
Carcinogenesis Testing Program Division of Cancer Cause and Prevention
National Cancer Institute National Institutes of Health Bethesda, Maryland 20014
U.S. DEPARTMENT OF HEALTH, EDUCATION, AND WELFARE Public Health Service
National Institutes of Health
DHEW Publication No. (NIH) 78-822


BIOASSAY OF DIELDRIN
FOR POSSIBLE CARCINOGENICITY -
Carcinogenesis Testing Program Division of Cancer Cause and Prevention
National Cancer Institute National Institutes of Health
CONTRIBUTORS; This report presents the results of the bioassay of dieldrin for possible carcinogenicity, conducted for the Carcinogenesis Testing Program, Division of Cancer Cause and Prevention, National Cancer Institute (NCI), Bethesda, Maryland. The bioassay was conducted by Stanford Research Institute, Menlo Park, California, initially under direct contract to NCI and currently under a subcontract to Tracor Jitco, Inc., prime contractor for the NCI carcinogenesis bioassay program.
The experimental design and doses were determined by Drs. R. R. Bates1»2, D. C. L. Jones3, D. P. Sasmore3, G. W. Newell3, and R. M. Elashoff^, and Mr. W. E. Davis3. The principal investigator was Dr. D. C. L. Jones; the technical supervisor of animal treatment, observation, and data handling was Mr. W. E. Davis; necropsy and tissue fixation were supervised by Dr. D. P. Sasmore.
Histopathologic examinations were performed by Dr. H. Elster , and the diagnoses included in this report represent his interpretation. Neoplasms and compound-related hyperplastic lesions were reviewed by Dr. W. M. Busey^, who also prepared the interpretive pathology summary included in this report.
Animal pathology tables and survival tables were compiled at EG&G Mason Research Institute'. The statistical analyses were performed by Dr. J. R. Joiner**, using methods selected for the bioassay program by Dr. J. J. Gart . Chemicals used in this bioassay were analyzed at Stanford Research Institute and the analytical results were reviewed by Dr. S. S. Olin^.
iii

This report was prepared at Tracor Jitco under the direction of
NCI. Those responsible for the report at Tracor Jitco were Dr.
Marshall Steinberg**, Director of the Bioassay Program; Drs. J. F.
Robens8 and C. H. Williams
8, toxicologists; Dr. R. L. Schueler
8,
pathologist; Ms. L. A. Waitz8 and Mr. W. D. Reichardt
8,
bioscience writers; and Dr. E. W. Gunberg8, technical editor,
assisted by Ms. Υ. Ε. Presley8.
The statistical analysis was reviewed by members of the
Mathematical Statistics and Applied Mathematics Section of NCI9:
Dr. John J. Gart, Mr. Jun-mo Nam, Dr. Hugh M. Pettigrew, and Dr.
Robert E. Tarone.
The following other scientists at the National Cancer Institute
were responsible for evaluating the bioassay experiment,
interpreting the results, and reporting the findings:
Dr. Kenneth C. Chu
Dr. Cipriano Cueto, Jr.
Dr. J. Fielding Douglas
Dr. Dawn G. Goodman
Dr. Richard A. Griesemer
Mr. Harry A. Milman
Dr. Thomas W. Orme
Dr. Robert A. Squire10
Dr. Jerrold M. Ward
•••Carcinogenesis Testing Program, Division of Cancer Cause and
Prevention, National Cancer Institute, National Institutes of
Health, Bethesda, Maryland.
^Now with the Office of the Commissioner, Food and Drug
Administration, Rockville, Maryland.
^Stanford Research Institute, Menlo Park, California.
^Department of Biomathematics, Center for the Health Sciences,
University of California, Los Angles, California.
iv

^Department of Pathology, David M. Brotman Memorial Hospital,
3828 Hughes Avenue, Culver City, California.
^Experimental Pathology Laboratories, Inc., P.O. Box 474,
Herndon, Virginia.
7EG&G Mason Research Institute, 1530 East Jefferson Street,
Rockville, Maryland.
8Tracor Jitco, Inc., 1776 East Jefferson Street, Rockville,
Maryland.
^Mathematical Statistics and Applied Mathematics Section,
Biometry Branch, Field Studies and Statistics, Division of
Cancer Cause and Prevention, National Cancer Institute, National
Institutes of Health, Bethesda, Maryland.
w with the Division of Comparative Medicine, Johns Hopkins
University, School of Medicine, Traylor Building, Baltimore,
Maryland.
ν


SUMMARY
A bioassay of purified technical-grade dieldrin for possible carcinogenicity was conducted by administering the test chemical in feed to Fischer 344 rats.
Groups of 24 rats of each sex were administered dieldrin at one of three doses, either 2, 10, or 50 ppm, for 104-105 weeks. Matched controls consisted of groups of 24 untreated rats of each sex. All surviving rats were killed at 104-105 weeks.
Body weights of the rats were essentially unaffected by the treatment, but typical signs of organochlorine intoxication including hyperexcitability, tremors, and coma were observed in high-dose males beginning in week 76 and in high-dose females beginning in week 80. Survival was not adversely affected, and adequate numbers of rats were available for meaningful statistical analyses of the incidences of tumors.
A variety of neoplasms occurred in control and treated rats; however, the incidences were not related to treatment.
It is concluded that under the conditions of this bioassay, dieldrin was not carcinogenic in Fischer 344 rats.
vii


TABLE OF CONTENTS
Page
I· Introduction 1
II. Materials and Methods 3
A. Chemical 3
Β · Dietary Preparation ······ 3
C. Animals 4
D. Animal Maintenance 5
E. Subchronic Studies 6
F. Design of Chronic Studies 7
G. Clinical and Pathologic Examinations 7
H· Data Recording and Statistical Analyses 9
III. Results - Rats 15
A· Body Weights and Clinical Signs 15
B. Survival 15
C. Pathology 18
D. Statistical Analyses of Results 19
IV. Discussion 21
V. Bibliography 23
APPENDIXES
Appendix A Summary of the Incidence of Neoplasms in
Rats Fed Dieldrin in the Diet 25
Table Al Summary of the Incidence of Neoplasms in
Male Rats Fed Dieldrin in the Diet 27
Table A2 Summary of the Incidence of Neoplasms in
Female Rats Fed Dieldrin in the Diet 30
Appendix Β Summary of the Incidence of Nonneoplastic
Lesions in Rats Fed Dieldrin in the Diet 35
Table Bl Summary of the Incidence of Nonneoplastic
Lesions in Male Rats Fed Dieldrin in the Diet 35
Table B2 Summary of the Incidence of Nonneoplastic
Lesions in Female Rats Fed Dieldrin in the Diet.... 39
ix

Page
Appendix C Analyses of the Incidence of Primary Tumors
in Rats Fed Dieldrin in the Diet 43
Table CI Analyses of the Incidence of Primary Tumors
in Male Rats Fed Dieldrin in the Diet 45
Table C2 Analyses of the Incidence of Primary Tumors
in Female Rats Fed Dieldrin in the Diet 47
TABLES
Table 1 Design of Dieldrin Chronic Feeding
Studies in Rats 8
FIGURES
Figure 1
Figure 2
Growth Curves for Rats Fed Dieldrin
in the Diet Survival Curves for Rats Fed Dieldrin
in the Diet
16
17
χ

I. INTRODUCTION
Dieldrin (CAS 60-57-1; NCI C00124) is a chlorinated cyclodiene
pesticide. It is also a metabolic conversion product of aldrin,
another pesticide, and can be expected to appear in the
environment following the use of either chemical· Dieldrin was
first introduced in the 1950's for use by cotton growers when the
chemical was found to be more effective than aldrin, and later,
was used as an insecticide for other crops, for public health
pest control, and for mothproofing woolen goods (Federal
Register, 1974).
Based partly on the evidence of the hepatocarcinogenicity of
dieldrin in the mouse, the registration of all products
containing dieldrin was cancelled in 1974 (Federal Register,
1974).
Dieldrin and aldrin were selected for testing in both rats and
mice in the bioassay program in 1969, because data regarding
their carcinogenicity were controversial and often inadequate,
and because there was a potential for long-term human exposure to
residues, particularly in foods. A report on the bioassays of
both chemicals in both species has been published (National
Cancer Institute, 1977). A second abbreviated study of dieldrin
was conducted as a part of a larger study that was designed to

assess the combined effects of a group of known or suspected
carcinogens. Only the results of this second study pertinent to
dieldrin are reported herein.
2

I I . MATERIAL AND METHODS
A. Chemicals
Technical-grade dieldrin was purchased from Shell Development Com
pany, Modesto, California, in a single batch (Lot No. 8-JCD-32)*
The chemical was purified before analysis and use in the bioas
say. Purification was by treatment of a hot hexane solution with
Norit and by filtration, recrystallization from hexane, and
finally, recrystallization from absolute methanol.
The identity and purity of this product were confirmed by
analyses at Stanford Research Institute. The melting point was
179-181°C (literature: 175-176°C), and the elemental analyses (C,
H, CI) were correct for C^He^lo^» the molecular formula of
dieldrin· The identity of the chemical was determined by nuclear
magnetic resonance and infrared spectra, which were in agreement
with the structure and matched the spectra given in the litera
ture. No attempt was made to identify or quantitate impurities·
The chemical was stored at room temperature in capped plastic
bottles.
B. Dietary Preparation
/B)
All diets were formulated every 2 weeks using Low Fat Lab Chow·

(Ralston Purina Co., St. Louis, Mo.). A stock diet containing
250 ppm dieldrin was prepared by first grinding the dieldrin to a
fine powder and then mixing by hand a weighed amount with a small
amount of feed. Corn oil and more feed were then added to give a
final concentration of 250 ppm dieldrin and 3% corn oil, and
final mixing was accomplished with a Hobart blender. Each stock
diet was analyzed for content of dieldrin by a method involving
® extraction, Florisil chromatography, and quantitation by
gas-liquid chromatography. Concentrations of 250 ppm + 25 ppm
were considered acceptable for use in preparing test diets.
Dieldrin at 250 ppm in the stock diet was found to be stable when
held in rat feeders at room temperature for a 2-week period.
To obtain test diets having appropriate concentrations of
dieldrin, the stock diet was diluted, as required, with control
diet containing 3% corn oil and mixed in a Hobart blender. Stock
and test diets were stored at room temperature in covered plastic
containers.
C. Animals
Male and female Fischer 344 rats, obtained through contracts of
the Division of Cancer Treatment, National Cancer Institute, were
used in these bioassays. The rats were obtained from Simonsen
Laboratory, Gilroy, California. On arrival at the laboratory,
4

all animals were quarantined for 2 weeks as an acclimation
period. Following this period, all males gaining less than 25
grams, all females gaining less than 15 grams, and all unhealthy
animals were culled. The remaining animals were assigned to
cages, one per cage, until each cage contained three animals.
Cages were then numbered and assigned to control and treated
groups using a computer-generated randomization table. Rats were
ear-clipped for individual identification.
D· Animal Maintenance
All animals were housed in temperature- and humidity-controlled
rooms. The temperature was maintained at 22°C with a range of
21-24°C, and the relative humidity was maintained at approxi
mately 45%. The room air was changed 10 times per hour and was
maintained under positive pressure to the access halls.
Fluorescent lighting provided illumination 12 hours per day.
Food and water were available axi libitum. Drinking water was
softened, filtered, sterilized with ultraviolet light, and
supplied by means of an automatic watering system.
The rats were housed three per cage in polycarbonate cages
equipped with disposable polyester woven filter tops. Autoclaved
hardwood chips (Iso-Dri®, Becton, Dickinson, and Carworth,
Warrensburg, N. Y.) were used as bedding. The cages were
5

changed, washed, and provided with fresh bedding twice per week.
Filter tops were replaced once per month.
Rats fed dieldrin were housed in the same room as rats treated
with hexachlorophene (CAS 70-30-4), aflatoxin Bx (CAS 1162-65-8),
Aroclor® 1254 (CAS 27323-18-8), or lead (II) acetate (CAS
301-04-2).
E« Subchronic Studies
Subchronic feeding studies were conducted with male and female
Fischer 344 rats to estimate the maximum tolerated dose of
dieldrin, on the basis of which low, mid, and high concentrations
(hereinafter referred to as "low doses11, "mid doses", and "high
doses") were determined for administration in the chronic
studies. In the subchronic studies, dieldrin was added to feed
in concentrations of 25, 50, 100, 200, or 300 ppm. Treated and
control groups each consisted of 15 male and 15 female rats. The
chemical was provided in the feed to the treated groups for 8
weeks.
All rats fed at 200 or 300 ppm dieldrin died within 2 weeks. At
100 ppm, during the first week, body weights of females were less
than those of controls, while those of males appeared comparable
to those of controls. Neuronal necrosis of the brain was noted
on histologic examination of those animals receiving 100 ppm, but

not 50 ppm, dieldrin. The low, mid, and high doses for the
chronic studies were set at 2, 10, and 50 ppm.
F. Design of Chronic Studies
The design of the chronic studies is shown in table 1.
G· Clinical and Pathologic Examinations
All animals were observed twice daily for signs of toxicity and
palpated for masses at each weighing. Animals were weighed
individually every other week for 12 weeks, and every fourth week
for the remainder of the study. Animals that were moribund at
the time of clinical examination were killed and necropsied.
The pathologic evaluation consisted of gross examination of major
tissues, major organs, and all gross lesions from killed animals
and from animals found dead. The following tissues were
routinely examined microscopically from both control and treated
animals: brain, liver, kidney, lung, pituitary, spleen, and
testis. In addition, sections of stomach, thyroid, trachea,
urinary bladder, and uterus were examined from a majority of the
control animals; these tissues were examined from treated animals
only if a lesion was found at necropsy. Gross lesions from any
other tissues in all animals were also examined microscopically.
The different tissues were preserved in 10% buffered formalin,

Table 1. Design of Dieldrin Chronic Feeding Studies in Rats
Sex and Initial Dieldrin Time on Study Treatment No. of in Dietb Treated Untreated Group Animals^ (ppm) (weeks) (weeks)
Male
Matched-Control 24 0 105 Low-Dose 24 2 104 Mid-Dose 24 10 105 High-Dose 24 50 105
Female
Matched-Control 24 0 105 Low-Dose 24 2 104 Mid-Dose 24 10 105 High-Dose 24 50 105
aAll animals were 5 3 + 2 days of age when placed on study.
°A11 diets contained 3% corn oil.

embedded in paraffin, sectioned, and stained with hematoxylin and
eosin. Special staining techniques were utilized when indicated
for more definitive diagnosis·
A few of the tissues selected by design from some animals were
not examined, particularly from those animals that died early.
Also, one animal was missing· Thus, the number of animals from
which particular organs or tissues were examined microscopically
varies, and does not necessarily represent the number of animals
that were placed on study in each group.
H. Data Recording and Statistical Analyses
Pertinent data on this experiment have been recorded in an auto
matic data processing system, the Carcinogenesis Bioassay Data
System (Linhart et al., 1974). The data elements include descrip
tive information on the chemicals, animals, experimental design,
clinical observations, survival, body weight, and individual
pathologic results, as recommended by the International Union
Against Cancer (Berenblum, 1969). Data tables were generated for
verification of data transcription and for statistical review.
These data were analyzed using the statistical techniques
described in this section. Those analyses of the experimental
results that bear on the possibility of carcinogenicity are
discussed in the statistical narrative sections.
9

Probabilities of survival were estimated by the product-limit
procedure of Kaplan and Meier (1958) and are presented in this
report in the form of graphs· Animals were statistically
censored as of the time that they died of other than natural
causes or were found to be missing; animals dying from natural
causes were not statistically censored. Statistical analyses for
a possible dose-related effect on survival used the method of Cox
(1972) for testing two groups for equality and Tarone's (1973)
extensions of Cox's methods for testing for a dose-related trend.
One-tailed Ρ values have been reported for all tests except the
departure from linearity test, which is only reported when its
two-tailed Ρ value is less than 0.05.
The incidence of neoplastic or nonneoplastic lesions has been
given as the ratio of the number of animals bearing such lesions
at a specific anatomic site (numerator) to the number of animals
necropsied (denominator)·
The purpose of the statistical analyses of tumor incidence is to
determine whether animals receiving the test chemical developed a
significantly higher proportion of tumors than did the control
animals. As a part of these analyses, the one-tailed Fisher
exact test (Cox, 1970) was used to compare the tumor incidence of
a control group with that of a group of treated animals at each
dose level. When results for a number of treated groups (k) are
10

compared simultaneously with those for a control group, a
correction to ensure an overall significance level of 0.05 may be
made. The Bonferroni inequality (Miller, 1966) requires that the
Ρ value for any comparison be less than or equal to 0.05/k. In
cases where this correction was used, it is discussed in the
narrative section. It is not, however, presented in the tables,
where the Fisher exact Ρ values are shown.
The Cochran-Armitage test for linear trend in proportions, with
continuity correction (Armitage, 1971), was also used. Under the
assumption of a linear trend, this test determines if the slope
of the dose-response curve is different from zero at the one-
tailed 0.05 level of significance. Unless otherwise noted, the
direction of the significant trend is a positive dose relation
ship. This method also provides a two-tailed test of departure
from linear trend.
A time-adjusted analysis was applied when numerous early deaths
resulted from causes that were not associated with the formation
of tumors. In this analysis, deaths that occurred before the
first tumor was observed were excluded by basing the statistical
tests on animals that survived at least 52 weeks, unless a tumor
was found at the anatomic site of interest before week 52. When
such an early tumor was found, comparisons were based exclusively
on animals that survived at least as long as the animal in which
11

the first tumor was found. Once this reduced set of data was
obtained, the standard procedures for analyses of the incidence
of tumors (Fisher exact tests, Cochran-Armitage tests, etc.) were
followed.
When appropriate, life-table methods were used to analyze the
incidence of tumors. Curves of the proportions surviving without
an observed tumor were computed as in Saffiotti et al. (1972).
The week during which an animal died naturally or was sacrificed
was entered as the time point of tumor observation. Cox's
methods of comparing these curves were used for two groups;
Tarone's extension to testing for linear trend was used for three
groups. The statistical tests for the incidence of tumors which
used life-table methods were one-tailed and, unless otherwise
noted, in the direction of a positive dose relationship.
Significant departures from linearity (P < 0.05, two-tailed test)
were also noted.
The approximate 95 percent confidence interval for the relative
risk of each treated group compared to its control was calculated
from the exact interval on the odds ratio (Gart, 1971). The
relative risk is defined as Pt/pc where pt is the true binomial
probability of the incidence of a specific type of tumor in a
treated group of animals and pc is the true probability of the
spontaneous incidence of the same type of tumor in a control
12

group. The hypothesis of equality between the true proportion of
a specific tumor in a treated group and the proportion in a
control group corresponds to a relative risk of unity. Values in
excess of unity represent the condition of a larger proportion in
the treated group than in the control.
The lower and upper limits of the confidence interval of the
relative risk have been included in the tables of statistical
analyses. The interpretation of the limits is that in
approximately 95% of a large number of identical experiments, the
true ratio of the risk in a treated group of animals to that in a
control group would be within the interval calculated from the
experiment. When the lower limit of the confidence interval is
greater than one, it can be inferred that a statistically
significant result (P < 0.025 one-tailed test when the control
incidence is not zero, Ρ < 0.050 when the control incidence is
zero) has occurred. When the lower limit is less than unity, but
the upper limit is greater than unity, the lower limit indicates
the absence of a significant result while the upper limit
indicates that there is a theoretical possibility of the
induction of tumors by the test chemical, which could not be
detected under the conditions of this test.
13


III. RESULTS
A. Body Weights and Clinical Signs
Mean body weights were essentially unaffected by the doses of
dieldrin used in this bioassay (figure 1). Fluctuations in the
growth curve may be due to mortality; as the size of the group
diminishes, the mean body weight may be subject to wide
variation. At week 40, an intercurrent infection caused respira
tory problems and weight loss, but few animals died. No treat
ment for infection was given, and the animals recovered by the
next scheduled weighing period.
At week 76, clinical signs of central nervous system disorders
such as convulsions, muscle tremors, and nervous behavior were \/
first noted in high-dose males, and around week 80, these signs
were apparent in the high-dose females.
B. Survival
The Kaplan and Meier curves estimating the probabilities of
survival for male and female rats fed dieldrin at the doses of
this study, together with those of the controls, are shown in
figure 2.
In neither sex is the Tarone test result significant at the 0.05
level for positive dose-related trend in mortality over the
15

400
350
300
2 ^ 250 I CD in 5 200 >•
οο CO 1 5 0
M
100
50
MALE RATS
D MATCHED CONTROL
Ο LOW DOSE
φ MID DOSE
Δ HIGH DOSE
300
10 20 30 40 50 60 70
TIME ON STUDY (WEEKS) 80 90 100 110
—
250
200 0
Δ Δ Δ Δ Δ
Δ
0
Δ Δ Δ Δ Δ
150
100 : '
50
FEMALE RATS
D MATCHED CONTROL
Ο LOW DOSE
φ MID DOSE
Δ HIGH DOSE
30 60
TIME ON STUDY (WEEKS)
Figure 1. Growth Curves for Rats Fed Dieldrin in the Diet
16

> > cc D
u_ Ο
Η
οCC Q_
-J
>
D
LL Ο
i CQ
οCC
0 90
0 80
0 7 0
0 6 0
0 5 0
0 40
0 3 0
0 20
0 1 0
0 00
0 90
0 80
0 70
0 60
0 50
0 40
0 30
0 20
0 00
1W| ·—! ώ^Τ- η A·····
1—4.
p Λ··Δ
MALE RATS D MATCHED CONTROL
Ο LOW DOSE
Λ MID DOSE v
Δ HIGH DOSE
15 30 45 60 75 90 105 120 135
TIME ON STUDY (WEEKS)
Δ-:
Δ-: Δ·Δ
FEMALE RATS
D MATCHED CONTROL
Ο LOW DOSE
φ MID DOSE
Δ HIGH DOSE
TIME ON STUDY (WEEKS)
Figure 2. Survival Curves for Rats Fed Dieldrin in the Diet
17

period. In male rats, 67% of the high-dose group, 75% of the
low- and mid-dose groups, and 92% of the matched-control group
lived to the end of the study. In females, 70% of the high-dose
group, 83% of the mid-dose group, and 88% of the low-dose and
matched-control groups survived to termination of the study.
Sufficient numbers of rats of both sexes were available for
meaningful statistical analyses of the incidences of late-
developing tumors.
C. Pathology
Histopathologic findings on neoplasms in rats are summarized in
Appendix A, tables Al and A2; findings on nonneoplastic lesions
are summarized in Appendix B, tables Bl and B2.
A variety of neoplasms were observed in both the control and
treated rats. The incidence of these neoplasms was comparable
among the control and treated animals. Interstitial-cell tumors
of the testes were the most frequently encountered neoplasms in
the control and treated males. The next most commonly seen
neoplasm was leukemia of either the lymphocytic or granulocytic
type, and it generally involved multiple organs. Here again, the
incidence of this neoplastic process was comparable among the
control and treated male rats.
The following neoplasms occurred randomly throughout the control
18

and treated male and female rats: pituitary adenomas, thyroid
adenomas, mammary gland adenomas and/or fibroadenomas, mesothe
liomas involving the body cavities, and uterine endometrial
stromal polyps.
The results of the histopathologic examination indicate that the
administration of dieldrin at the three doses used in this study
did not have a carcinogenic effect in the Fischer 344 rat. With
the exception of interstitial-cell tumors of the testes, a
relatively low incidence of neoplasia was seen in both the
control and treated animals. A variety of incidental neoplastic
processes were seen in both the control and treated rats at an
incidence that would be expected in this strain of rat.
D« Statistical Analyses of Results
Tables CI and C2 in Appendix C contain the statistical analyses
of the incidences of those specific primary tumors that were
observed in at least 5% of one or more treated groups of either
sex. Due to the nature of the pathology protocol, the number of
animals necropsied was used as the denominator.
In male rats, none of the incidences of tumors at any specific
site are statistically significant. In female rats, although the
Cochran-Armitage test result for positive dose-related trend in
the proportions of endometrial stromal sarcoma of the uterus is
19

significant (P = 0.039), this positive finding cannot be estab
lished by the Fisher exact test. Since the Cochran-Armitage test
is made to detect a linear trend, and in this instance only one
incidence (high-dose 2/23 [9%]) is not zero, it is questionable
whether a dose-associated trend has been found. When the
incidences of stromal polyp and stromal sarcoma are combined, the
results indicate a significant difference in the negative
direction, due to the large incidence (13/24 [54%]) in the
control group. The combined incidence of these two tumors in the
four control groups available from this laboratory is 22/95
(23%), of which 13 diagnoses are from this study. There is no
other specific incidence of tumors in female rats that is
statistically significant. Significant results in the negative
direction are also observed in the incidence of interstial-cell
tumor of the testis and the incidence of endometrial stromal
polyp of the uterus.
In some of the 95% confidence intervals for relative risk, shown
in the tables, the value of one is included. This indicates the
absence of positive significant results. It should also be noted
that some of the intervals have an upper limit greater than one,
indicating the theoretical possibility of the induction of tumors
by dieldrin, which could not be detected under the conditions of
this test.
20

IV. DISCUSSION
In this bioassay, dieldrin did not adversely affect the body
weights of the treated rats, but typical signs of systemic
organochlorine intoxication were observed at the high dose from
approximately week 76 in males and week 80 in females. Survival
was not adversely affected, and adequate numbers of rats were
available for meaningful statistical analyses of the incidences
οΕ tumors.
A variety of neoplasms were found in both control and treated
rats, none of which could be attributed to dieldrin. In this
study, the predominant tumors were interstitial-cell tumors of
the testes, which occurred in almost all the males in the control
and treated groups, and granulocytic leukemia, which occurred at
a low incidence in the control and treated groups of both sexes.
Females in each of the control and treated groups also developed
endometrial stromal polyps. Statistically, the incidences of
these tumors were not significant, and the tumors were considered
to be of spontaneous origin.
In another bioassay of dieldrin (National Cancer Institute,
1977), conducted with Osborne-Mendel rats and using time-weighted
average doses of 29 and 59 ppm, the predominant tumors occurred
in the pituitary and thyroid glands, but vere not clearly related
21

to the administration of dieldrin· These tumors were not seen in
the Fischer 344 rats in the present study, using a high dose of
50 ppm. However, the thyroids of the Fischer 344 rats treated
with dieldrin were not routinely examined microscopically.
This bioassay is in agreement with previously published studies
by Fitzhugh et al. (1964) and by Deichmann et al. (1970) using
Osborne-Mendel rats, and by Walker et al. (1969) using Carworth
ffEflFarm strain rats, in which there were no significant
increases in tumors among treated rats.
It is concluded that under the conditions of this bioassay,
dieldrin was not carcinogenic in Fischer 344 rats.
22

V. BIBLIOGRAPHY
Armitage, P., Statistical Methods in Medical Research, John Wiley
& Sons, Inc., New York, 1971, pp· 362-365.
Berenblum, I., ed., Carcinogenicity Testing: A Report jof the
Panel of Carcinogenicity of the Cancer Research Commission
of UICC, Vol. j£, International Union Against Cancer, Geneva,
1969.
Cox, D. R. , Regression models and life tables. J^ R̂ _ Statist. Soc. B34(2):187-220, 1972.
Cox, D. R., Analysis of Binary Data, Methuen & Co., Ltd., London, 1970, pp. 48-52.
Deichmann, W. B., MacDonald, W. E. , Blum, E., Bevilacqua, Μ.,
Radomski, J., Keplinger, M., and Balkus, M., Tumorigenicity
of aldrin, dieldrin and endrin in the albino rat. Industrial
Medicine 19(10):37-45, 1970.
Federal Register, Shell Chemical Co. et al. Consolidated
Aldrin/Dieldrin Hearing. 3£(203):37246-37272, 1974.
Fitzhugh, 0. G. , Nelson, Α. Α., and Quaife, M. L. , Chronic oral
toxicity of aldrin and dieldrin in rats and dogs. Fd.
Cosmet. Toxicol. 2\ 551-562, 1964.
Gart, J. J., The comparison of proportions: a review of
significance tests, confidence limits and adjustments for
stratification. Rev. Int. Statist. Inst. 3^:148-169, 1971.
Kaplan, E. L. and Meier, P., Nonparametric estimation from
incomplete observations. JN. Amer. Statist. Assoc.
53:457-481, 1958.
Linhart, M. S., Cooper, J. Α., Martin, R. L. , Page, N. P., and
Peters, J. Α., Carcinogenesis bioassay data system. Comp.
and Biomed. Res. Tj 230-248, 1974.
Miller, R. G., Jr., Simultaneous Statistical Inference, McGraw-Hill Book Co., New York, 1966, pp. 6-10.
National Cancer Institute, Bioassays of aldrin and dieldrin for
possible carcinogenicity. Technical Report Series No. 21
(DHEW Pub. No. 77-821), 1977.
23

Saffiotti, U., Montesano, R., Sellakumar, A. R., Cefis, F., and Kaufman, D. G., Respiratory tract carcinogenesis in hamsters induced by different numbers of administrations of benzo(a)pyrene and ferric oxide. Cancer Res. 32; 1073-1081., 1972.
Tarone, R. E. , Tests for trend in life table analysis. Biometrika 62(3);679-682, 1975.
Walker, A. 1. T. , Stevenson, D. E., Robinson, J., Thorpe, E., and Roberts, M., The toxicology and pharmacodynamics of dieldrin (HEOD): two-year oral exposures of rats and dogs. Toxicol. Appl. Pharmacol. 15;345-373, 1969.
24

APPENDIX A
SUMMARY OF THE INCIDENCE OF NEOPLASMS
IN RATS FED DIELDRIN IN THE DIET
25


TABLE ΑΙ.
SUMMARY OF THE INCIDENCE OF NEOPLASMS IN MALE RATS FEDDIELDRININTHEDIET
CONTROL DOSE LOW DOSE MEDIUM DOSE HIGH DOSE
MIMALS INITIALLY IN STDDT 24 24 24 24 ANIMALS NECROPSIED 24 24 24 24 AMII1ALS IXAHIMID HISTOPATHOLOGICALLY 24 24 24 24
INTIEGUHENTARY SYSTEM
(24) (24) (24) ANGICSARCOHA 1 (4%) OSTEOSARCOHA 1 (4%)
•SUBCOT TISSUE (24)
ESPIRATORY SYSTEM
*1UVG (24) (24) (23) (22) CARCINOHA, NOS , HBTASTATIC 1 (5%) OSTEOSARCOHA. METASTATIC 1 (4%)
HEMATOPOIETIC SYSTEM
•HU1TIEIE ORGANS (24) (24) (24) (24) LYMPHOCYTIC LEUKEMIA 1 (4%) GRANULOCYTIC LEUKEMIA 1 (4%) 5 (21%) 5 (21%) 5 (21%)
CIRCU1ATCRI SYSTEH
NONE
DIGESTIVE STSTEH
NC Ν f
URIMARY STSTEH
•KIDNEY/CORTEX (24) (24) (23) (23) CARCINCHA.NOS 1 (4%i
* NUMBER OP ANIMALS KITH TISSUE EXAMINED MICROSCOPICALLY • NUHBER OF ANIHALS NECROPSIED
27

TABLE A1. MALE RATS: NEOPLASMS (CONTINUED)
CONTROL DOSE LOW DOSE MEDIUM DOSE HIGH DOSE
iOBINABY BLADDER PAPIILOHA, NOS
(15) 1 (7%)
(1 ) (1)
ENDOCRINE SYSTEM
•PITUITARY ADENOMA, NOS
#THYBOIC SHALI-CELL CARCINOMA ADENOMA, NOS
«PANCREATIC ISLETS ISLIT-CELL CARCINOMA
(24)
(15)
1
(12)
(7%)
(24) 3 (13%)
(6) 1 (17%)
(24) 1 (4%)
(23) 1 (4X)
(1) 1 (10C
(1)
REPRODUCTIVE SYSTEM
•TESTISINTERSTITIAL-CELL TOHOR
(24) 24 (100%)
(24) 23 (96%)
(24) 24 (100%)
(24) 20 (83%)
NERVOUS SYSTEM
NONE
SPECIAL SENSE ORGANS
NCNE
MUSCULOSKELETAL SYSTEM
NONE
BODY CAVITIES
•TUNICA VAGINALIS
MESOTHELIOMA, NOS
(24) (24) (24)
1 (4%)
(24)
ALL OTHEB SYSTEMS
•MULTIF1E ORGANSMESOTHELIOMA. MALIGNANT
(24) (24) (24) y
JLJUU (24)
# NUMEEF OP ANIMALS WITH TISSUE EXAMINED MICROSCOPICALLY • NUMBER CFV ANIMALS NECROPSIED
28

TABLE A1. MALE RATS: NEOPLASMS (CONTINUED)
CONTROL DOSE LOW DOSE MEDIUM DOSE HIGH DOSE
ANIMAL DISPOSITION SUMMARY
ANIMALS INITIALLY IN STUDY 24 24 24 24 NATURAL DEATHS 2 1 6 MCRIEUND SACRIFICE 2 4 5 2 SCHIEULEC SACRIFICE ACCIDENTALLY KILLED TERMINAL SACRIFICE 22 18 18 16 ANIPAL MISSING
§ INCLUDES AUTOLYZED ANIMALS
TUPCR SUFPARY
TOTAL ANIMALS WITH PRIMARY TUPORS* 24 23 24 23 TOTAI PRIMARY TUMORS 29 32 32 29
TOTAL ANIMALS WITH BENIGN TUMCRS 24 23 24 20 TCTAL BENIGN TUMORS 26 26 25 21
TOTAL ANIMALS WITH MALIGNANT TUMORS 3 6 6 8 TOTAL MALIGNANT TUMORS 3 6 6 8
TOTAL ANIMALS WITH SECONDARY TUMORS· 1 1 TOTAL SECONDARY TUMORS 1 1
TOTAL ANIMALS WITH TUMORS UNCERTAINBENIGN OR MALIGNANT 1 TOTAL UNCERTAIN TUMORS 1
TOTAL ANIMALS WITH TUMORS UNCIRTAINPR:EMABY OR METASTATIC TOTAL UNCERTAIN TUMORS
• PB1CMARY TUMORS: ALL TUMORS EXCEPT SECONDARY TUMORS # SECONDARY TUMORS: METASTATIC TUMORS OR TUMORS INVASIVE INTO AN ADJACENT ORGAN
29
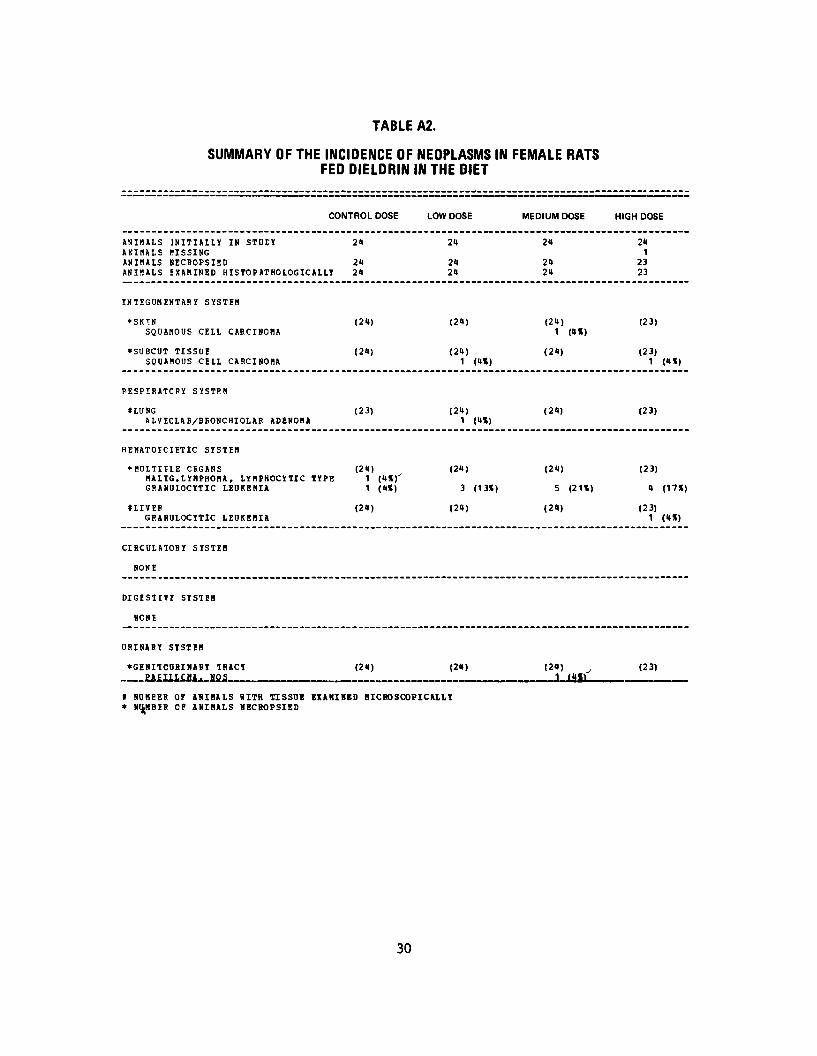
TABLE A2.
SUMMARY OF THE INCIDENCE OF NEOPLASMS IN FEMALE RATS FEDDIELDRININTHED1ET
CONTROL DOSE LOW DOSE
ANIMALS INITIALLY IN STUDY ANIMALS MISSING ANIMALS NECROPSIED ANIMALS EXAMINED HISTOPATHOLOGICALLY
24
24 24
24
24 24
INTEGUMENTARY SYSTEM
*SKTN (24) (24) SQUAMOUS CELL CARCINOMA
•SUBCUT TISSUE (24) (24) SQUAMOUS CELL CARCINOMA 1 (4%)
PESPIRATCRY SYSTEM
#LUNG (23) (24) ALVECLAR/BFONCHIOLAR ADENOMA 1 (4%)
HEMATOECIETIC SYSTEM
•HULTIFLE ORGANS (24) (24) MALIG.LYMPHOMA, LYMPHOCYTIC TYPE 1 (4%)x
GRANULOCYTIC LEUKEMIA 1 <4X) 3 (13%)
#LIVEP (24) (24) GRANULOCYTIC LEUKEMIA
CIRCULATORY SYSTEM
NONE
DIGESTIVE SYSTEM
NCNi
URINARY SYSTEH
•GENITOURINARY TRACT (24) (24) PAEILLCUA. NOS
« NUMBER OF ANIMALS WITH TISSUE EXAMINED MICROSCOPICALLY • NUMBER OF ANIMALS NECROPSIED
MEDIUM DOSE
24
24 24
(24) 1 (4«)
(24)
(24)
(24)
5 (21%)
(24)
(24)
HIGH DOSE
24 1
23 23
(23)
(23) 1 (4%)
(23)
(23)
4 (17%)
(23) 1 (4%)
(23)
30

TABLE A2. FEMALE RATS: NEOPLASMS (CONTINUED)
CONTROL DOSE LOW DOSE
«URINARY BLADDER (14) TRAHSITIONAL-CELL CARCINOMA 1 (7%)
ENDOCRINI SYSTEM
«PITUITARY (2U) (23) ACINCHA, NCS 2 (8X) 7 (30%)
REPRODUCTIVE SYSTEM
•MAMMARY GLANE (24) (24) ADENCHA, NCS 2 (8%) ADENOCARCINOMA, NOS 1 (4%) CYSTADENOHA, NOS 1 (4%) PIEROMA 1 (4%) PIEHCADENOMA 2 (8%)
•UTERUS (22) (10) ADENOCARCINOMA, NOS LEICPYOMA 1 (10%) ENDOMETRIAL STROMAL POLYP 13 (59%) l (70%) ENDOMETRIAL STROMAL SARCOMA
NERVOUS SYSTEM
«ERAIN (24) (24) HEMAHGIOSABCOMA OLIGODENDPCGLICMA 1 (4%) MENINGIOMA
SPECIAL SENSE OPGANS
NONE
MUSCULCSKELETAL SYSTEM
BODY CAVITIiS
« NUMEER OP ANIMALS HITH TISSUE EXAMINED MICROSCOPICALLY * NUMBIR OF ANIMALS NECPOPSIED
MEDIUM DOSE
(24) 4 (17%)
(24)
1 (4%)
(8) 1 (13%)
4 (50%)
(23) 1 (4%)
1 (4%)
HIGH DOSE
(23) 2 (9%)
(23)
2 (9%)
(13)
4 (31%) 2 (15%)
(23)
31

TABLE A2. FEMALE RATS: NEOPLASMS (CONTINUED)
CONTROCONTROLL DOSDOSEE LOW DOSE MEDIUM DOSE HIGH DOSE
ALL CTHEF SYSTEMS
NCNF
ANIPAL USECSITION SDMHABY
ANIMALS INITIALLY IN STUDY NATUFAL DEATHS «CRIEOND SACRIFICE SCHfEULED SACRIFICE ACCIDENTALLY KILLED TERMINAL SACRIFICE AKIPAL HISSING
24 1 2
21
24
3
21
2U 3 1
20
24
7
16 1
ί INCLUDES AUTOLYZED ANIMALS
TUPCR SUPPAFY
TOTAL ANIMALS WITH PRIMARY TUBORS* TOTAL PRIMARY TUHOPS
17 23
17 23
16 19
14 16
TOTAL iNIMALS WITH BENIGN TUHCRS TCTAI BENIGN TUMORS
14 19
13 18
9 9
8 8
TOTAL ANIMALS WITH MALIGNANT 1UMORS TOTAL MALIGNANT TUMCRS
4 α
5 5
9 10
1 8
TOTAL ANIMALS WITH SECONDARY TUMORS· TCTAL SECONDARY TUHCRS
TOTAL ANIMALS WITH TUPCFS UNCERTAINBENIGN OR MALIGNANT
TOTAL UNCERTAIN TUMORS
TCTAL ANIMALS WITH TUMORSPRIMARY OR METASTATIC
TOTAL UNCERTAIN TUHOPS
UNCERTAIN
* PRIMARY TUHCES: ALL TUMORS EXCEPT SECONDARY TUHORS # SECCNCARY TUMORS: METASTATIC 1OHORS OR TUMORS INVASIVE INTO AN ADJACENT CRGAN
32

APPENDIX B
SUMMARY OF THE INCIDENCE OF NONNEOPLASTIC LESIONS
IN RATS FED DIELDRIN IN THE DIET
33


TABLE B1.
SUMMARY OF THE INCIDENCE OF NONNEOPLASTIC LESIONS IN MALE RATS FEDDIELDRININTHEDIET
CONTROL DOSE LOW DOSE MEDIUM DOSE HIGH DOSE
ANIMALS INITIALLY IN STOEY 24 24 24 24 ANIMALS; BECROPSIED 24 24 24 24 ANIMALii EXAMINED HISTOP1THOLOGICALLY 2 4 24 24 24
INTEGUMENTARY SYSTEM
• SKIN (24) (24) (24) (24) CYST, NOS 1 (4%)
*SUBCuT T I S S U E (2U) (24) (24) (24) EPIDERMAL INCLUSION CYST 1 (4%)
RESPIR/lTCRY SYSTEM
•TRACHEA (15) INFLAMMATION, NOS 2 (13%) INFLAMMATION, ACDTE 1 (7%)
ILUNG/EiONCHUS (24) (24) (23) (22) BRONCHIECTASIS 1 (<•*) 1 (4%) 2 (9%) INFLAMMATION, NOS 1 (4%) 1 (4%)
#LUNG (24) (24) (23) (2 1) ATELECTASIS 5 (21%) 1 (4%) 2 (9%) CONGESTION, NOS 14 (58%) 16 (67%) 11 (48%) 8 (36%) HEMORRHAGE 1 (4%) INFLAMMATION, NOS 1 (4%) INFLAMMATION, FOCAL 1 (4%) ABi iCESS, NOS 2 (8%) 2 (8%) 2 (9%) 2 (9%)
HEMATOPOIETIC SYSTEM
• SPLEI'N (23) (24) (2ϋ) ( 2 3) CONGESTION, NOS 1 (4%) P l i ' P C C A L C I F I C NODULE 1 (<•%) INFARCT, NOS 1 (4%)
«LYMPH NCCE (6) (3) (3) LYf|PHANGIECTASIS I ( 1 0 0 % )
# NUMEER OP ANIMALS WITH T I S S U E EXAMINED MICROSCOPICALLY * NUMBliR OF ANIMALS NECROPSIED
35

TABLE B1. MALE RATS: NONNEOPLASTIC LESIONS (CONTINUED)
CONTROL DOSE LOW DOSE MEDIUM DOSE HIGH DOSE
CONGESTION, NOS INFLAMMATION, GRANULOMATOUS REACTION, FOREIGN BODY HISTIOCYTOSIS
1 (17%) 2 (33%)
11 (33%) (33%)
•RENAL LYMPH NODE LYMPHANGIECTASIS
(6) 1 (17%)
(3) (3)
CIRCUIATCRY SYSTEM
•HEART HEMORRHAGE INFLAMMATION, NOS
(1) 1 (100%) 1 (100%)
• HEABlT/ATRIUM DEGENERATION, NOS
(1) 1 (100%)
DIGESTIVE SYSTEM
•LIVER CONGESTION, NOS SCAR HYPERPLASIA, NODULAR ANGIECTASIS .
(24) 12 1 2
(50%) (4%) (8%)
(23) 6 (26%)
(23) 3 (13%)
1 (4%)
(23) 8
4 1
(35%)
(17%) (<»%)
• LIVI.R/CENTRILOBULAR CONGESTION, NOS
(24) (23) (23) (23) 1
•STOMACH DIVERTICULUM EPIDERMAL INCLUSIONCONGESTION, NOS DIVERTICULITIS
CYST
(23)
11
1
(<»%) (4%)
(4%)
(4)
1 (2 5%)
(3)
•CECOM CONGESTION, NOS NECRCSIS, NOS HYPERPLASIA, LYMPHOID
(3) (1) 1
1
(100%)
(100%)
(2)
1 (50%)
• ANUS DIVERTICULUM
(24) (24) (24) (24) 1 (<•%) 1 (4%)
• NUMEER OF ANIMALS WITH TISSUE EXAMINED• NUMBER OF ANIMALS NECROPSIED
MICROSCOPICALLY
36

TABLE B1. MALE RATS: NONNEOPLASTIC LESIONS (CONTINUED)
CONTROL DOSE LOW DOSE
URIM^BY SYSTEM
•KIDNEY (24) (24) CALCOLUS, NOS 1 (<*%) HYDRONEPHROSIS 1 (4%) CYST, NOS PYELONEPHRITIS, NOS 1 (4%) PYELONEPHRITIS, FOCAL
•URINARY BLADDER (15) (1) CONGESTION, NOS 1 (100%) INFLAMMATION, ACOTE
ENDOCRINE SYSTEM
•PITUITARY (24) (24) CONGESTION, NOS 1 (<*%)
•ADRENAL CONGESTION, NOS
•TBiROIE (15) CNFLAHMATION, NOS 1 (7%) 'SODUIE 1 (7%)
REPRODUCTIVE SYSTEM
•SEMINAL VESICLE (24) (24) DILATATION, NOS 2 (8%) HYPERPLASIA, FOCAL
•TESTIS (24) (24) ATROFHY, NCS 1 (4%)
NERVOUS SYSTEM
•ERAIN (24) (23) CONGESTION, NOS 1 (4%) HEMORRHAGE 1 (4%) CALCIFICATION, FOCAL 1 (4%)
SPECIAL SENSE ORGANS
• NUMBER OF ANIMALS WITH TISSUE EXAMINED MICROSCOPICALLY * «UI1BER OF ANIMALS NBCROPSIEC
MEDIUM DOSE HIGH DOSE
(23) (23)
2 (9%) 1 (U%) 2 (9%)
1 (<*%)
(1)
1 (100%)
(2U) (23) 1 (<*%)
(1) 1 (100%)
(1)
(24) (24)
1 (4%)
(24) (24) 1 (4%)
(24) (24) 1 (<•*)
37

TABLE B1. MALE RATS: NONNEOPLASTIC LESIONS (CONTINUED)
CONTROL DOSE LOW DOSE MEDIUM DOSE HIGH DOSE
MUSCULOSKELETAL
NONE
SYSTEM
BODY CAVITIES
•INGUINAL REGION NECROSIS, FAT
(24)2 (8%)
(24)1 (4%)
(24)8 (33%)
(24)3 (13%)
ALL OTREB SYSTEMS
NONE
SPECIAL POHFHOLOGY SUMMARY
NCNE
# NUMBER OF ANIMALS WITH TISSUE EXAMINED* NUMBER OF ANIMALS NECBOPSIEE
BICFOSCOPICALLY
38

TABLE B2.
SUMMARY OF THE INCIDENCE OF NONNEOPLASTIC LESIONS IN FEMALE RATS FEDDIELDRININTHEDIET
CONTROL DOSE LOW DOSE
ANIHALS INITIALLY IN STUDY 24 24 ANIMALS HISSING ANIMALS NECBOPSIED 24 24 ANIHALS EXAMINED HISTOPATHOLOGICALL Υ 24 24
INTEGUMEKTABY SYSTEM
•SKIN (24) (24) EPICEBMAL INCLUSION CYST
•SOBCUT TISSUE (24) (24) HEMOBBHAGE ABSCESS, NOS
RESPIBATOBY SYSTEM
#TBACHEA (21) INFLAMMATION, ACUTE 1 (5X)
#LUNG/EFCNCHUS (23) (24) INFLAMMATION, NOS 1 (4X) 2 (8X)
«LUNG (23) (24) ATELECTASIS 1 (4X) 1 (4X) CONGESTION, NOS 10 (43X) 11 (46X) EDEMA, NOS PETECHIA INFLAMMATION, FOCAL 1 (4X) INFLAMMATION, INTEBSTITIAL 1 (4X) AESCESS, NOS 2 (9X) ADHESION, NOS
HEMATOPOIETIC SYSTEM
«SPLfEN (23) (22) CONGESTION, NOS REACTION, FOBEIGN BODY 1 (4X)
* NUHEEB OF ANIMALS WITH TISSUE EXAMINED MICROSCOPICALLY * NUMBER OF ANIMALS NECBOPSIED
MEDIUM DOSE
24
24 24
(24)
(24)
1 (4X)
(24) 1 (4X)
(24) 4 (17X)
14 (58X)
1 (4X)
1 <»X)
(24)
HIGH DOSE
24 1 23 23
(23)
(23)
(23)
(23) 3 (13X) 6 (26%; 1 (4%) 1 (4%)
(22) 1 (5%) 2 (9X)
39

TABLE B2. FEMALE RATS: NONNEOPLASTIC LESIONS (CONTINUED)
MEDIUM DOSE HIGH DOSE
(2) (2) 1 (50%)
(24) (23)1 (*»%) 3 (13%) 2 (8%)
2 (9%)
(4%)
(Ό (6) 1 (17%)
1 (2*5*) 1 (251)
(1) 1 (100%)
(24) (23)
(24) (23)
2 (8%) 6 (26%)
CONTROL DOSE
HEMATOPOIESIS
#LYMPH NODE (3) LYMPHANGIECTASIS
CIRCULATORY SYSTEM
NONE
DIGESTIVI SYSTEM
#LIVER (24) CCNGiSTION, NOS 3 (13%) INFLAMMATION, GRANULOMATOUS REACTION, FOREIGNNECROSIS, FOCAL NECROSIS, ISCHEMIC
iSTCMACH DIVfFTICULUM CONGESTION, NOS INFLAMMATION, NOS
#CUOD1NUM COMGISTICN, NOS INFLAMMATION, NOS
URINARY SYSTEM
#KIDNEY CALCINOSIS, NOS
#UBINAFY BLADDER CALCULUS, NOS
ENDCCBINi SYSTEM
iFITUITARY CYST, NOS CONGESTION, NOS HEMORRHAGE
BODY 2 (8%)
1 (4%)
(24)
(3)
1 (33%)
(22)
) 1 (7%)
(24)
4 (17%)
LOW DOSE
1 (5%)
(1)
(24) 2 (8%) 1 (4%)
(24) 1 (4%)
(23)1 (4%) 2 (9%)
- - 2 (9%)
# NUMEER OF ANIMALS iITH TISSUE EXAMINED MICROSCOPICALLY * NUMBER OF ANIMALS NECROPSIED
40

TABLE B2. FEMALE RATS: NONNEOPLASTIC LESIONS (CONTINUED)
CONTROL DOSE LOW DOSE MEDIUM DOSE HIGH DOSE
«ADBBKAI (2) (1) CONGESTION, NOS 1 (100%)
REPRODUCTIVE SYSTEH
*HAMIiAFY GLANE (24) (24) (24) (23) HYPERPLASIA, NOS 1 (<•%) HYPERPLASIA, CYSTIC 1 (4%)
•VAGINA (24) (24) (24) (23) NECROSIS, FAT 1 (4%)
• UTF.RUS (22) (10) (8) (13) HYEBCMETRA 2 (9%) 3 (30%) 1 (13%) 1 (8%) CONGESTION, NOS 1 (8%) PYOMETRA 5 (23%) 4 4 (31%) ABSCESS, NOS (5%) (8%) 1 2 (20%) 1
#UTERUS/ENECMFTRIUM (22) (8) (13) INFLAMMATION, NOS (10) 1 (8%) INFLAMMATION, FOCAL 1 (5%) HYPEFPLASIA, NOS 1 (13%) 1 (8%) HYPERPLASIA, CYSTIC 2 (9*)
#CVARY ( 21 ) (3) (1) CYST, NOS 1 (5%) 1 (33%) 1 (100%) ABSCESS, NOS 1 (5%) 3 (100%) CORPUS LUTEUM 1 (33%)
NERVOUS SYSTEM
#BRAIN/PENINGES (24) ( 24 ) (23 ) (23) INFLAMMATION, NOS 1 <<•%)
#BRAIN (24) (24 ) (23) (23) CONGESTION, NCS 1 (4%)
SPECIAL SENSE ORGANS
NONF
MUSCULOSKELETAL SYSTEM
# NUMBER OF ANIMALS WITH T I S S U E EXAMINED MICROSCOPICALLY * »UHI?EF 0 * ANIMALS NECBOPSIEE
41

TABLE B2. FEMALE RATS: NONNEOPLASTIC LESIONS (CONTINUED)
CONTROL DOSE LOW DOSE MEDIUM DOSE HIGH DOSE
BODY CAVITIES
•INGUINAL BEGICN NECROSIS, FAT
•PLSOΕA INFLAMMATION, DOS
(24) 1 (4X)
(24)
(24) 1 (4%)
(24)
(24) 1 (4*)
(24) 1 (4%)
(23)
(23)
ALL OTHER SYSTEMS
NONE
SPECIAL HOBfHOLOGY SUMMARY
NO LESION FEFORTED AN!PAL MISSING/NO NECROPSY
# KUMBER OF ANIMALS H U H TISSUE EXAMINED• KUMBF.R OF ANIMALS NECROPSIED
MICROSCOPICALLY
42

APPENDIX C
ANALYSES OF THE INCIDENCE OF PRIMARY TUMORS
IN RATS FED DIELDRIN IN THE DIET
43


Table CI. Analyses of the Incidence of Primary Tumors in Male Rats Fed Dieldrin in the Dieta
Topography: Morphology
Matched
Control
Hematopoietic System: Leukemia^ 2/24 (8)
Ρ Values0 >
d N.S.
Relative Risk (Matched Control)f
Lower Limit
Upper Limit
Weeks to First Observed Tumor 83
Pituitary: Adenoma, NOSb
0/24 (0)
Ρ Values0 >
d N.S.
Relative Risk (Matched Control)f
Lower Limit
Upper Limit
Weeks to First Observed Tumor
Low
Dose
5/24 (21)
N.S.
2.500
0.459
24.045
74
3/24 (13)
N.S.
Infinite
0.622
Infinite
85
Mid
Dose
5/24 (21)
N.S.
2.500
0.459
24.045
86
1/24 (4)
N.S.
Infinite
0.055
Infinite
97
High
Dose
5/24 (21)
N.S.
2.500
0.459
24.045
80
1/24 (4)
N.S.
Infinite
0.055
Infinite
100

__
Table Cl. Analyses of the Incidence of Primary Tumors in Male Rats Fed Dieldrin in the Dieta
(continued)
Matched Low Mid High
Topography: Morphology Control Dose Dose Dose
Testis: Interstitial-cell
Tumorb
24/24 (100) 23/24 (96) 24/24 (100) 20/24 (83)
Ρ Values0>
d Ρ = 0.009 (Ν) N.S. N.S. N.S.
Relative Risk (Matched Control)f
0.958 0.833
Lower Limit 0.000 — 0.000
Upper Limit 1.043 — 1.200
Weeks to First Observed Tumor 83 74 86 62
aTreated groups received doses of 2, 10, or 50 ppm in feed.
^Number of tumor-bearing animals/number of animals necropsied (percent).
cBeneath the incidence of tumors in the control group is the probability level for the Cochran-
Armitage test when Ρ < 0.05; otherwise, not significant (N.S.) is indicated. Beneath the
incidence of tumors in a treated group is the probability level for the Fisher exact test for
the comparison of that treated group with the matched-control group when Ρ < 0.05 for the
control group; otherwise, not significant (N.S.) is indicated.
^A negative trend (N) indicates a lower incidence in a treated group than in the control group.
eThe probability level for departure from linear trend is given when Ρ < 0.05 for any comparison.
95% confidence interval of the relative risk between each treated group and the matched-
control group.

Table C2. Analyses of the Incidence of Primary Tumors in Female Rats Fed Dieldrin in the Dieta
Topography: Morphology
Hematopoietic System: Leukemia*3
Ρ Valuesc>
d
Relative Risk (Matched Control)f
Lower Limit
Upper Limit
Weeks to First Observed Tumor
Pituitary: Adenoma, NOSb
Ρ Valuesc>
d
Relative Risk (Matched Control)f
Lower Limit
Upper Limit
Weeks to First Observed Tumor
Matched
Control
1/24 (4)
N.S.
79
2/24 (8)
N.S.
101
Low
Dose
3/24 (13)
N.S.
3.000
0.265
150.246
94
7/24 (29)
N.S.
3.500
0.759
31.328
84
Mid
Dose
5/24 (21)
N.S.
5.000
0.622
224.379
70
4/24 (17)
N.S.
2.000
0.321
20.335
98
High
Dose
5/23 (22)
N.S.
5.217
0.652
233.437
82
2/23 (9)
N.S.
1.043
0.081
13.306
105

00
Table C2. Analyses of the Incidence of Primary Tumors in Female Rats Fed Dieldrin in the Dieta
(continued)
Topography: Morphology
Uterus: Endometrial Stromal Polypb
Ρ Valuesc>d
Departure from Linear Trende
Relative Risk (Matched Control)f
Lower Limit Upper Limit
Weeks to First Observed Tumor
Uterus: Endometrial Stromal Sarcoma
Ρ Valuesc>d
Relative Risk (Matched Control)^
Lower Limit
Upper Limit
Weeks to First Observed Tumor
Matched Low Mid High
Control Dose Dose Dose
13/24 (54) 7/24 (29) 4/24 (17) 4/23 (18)
Ρ = 0.047 (Ν) N.S. Ρ = 0.007 (Ν) Ρ = 0.009 (Ν)
Ρ = 0.031
0.538 0.308 0.321
0.231 0.089 0.094
1.179 0.828 0.862
96 104 105 105
0/24 (0) 0/24 (0) 0/24 (0) 2/23 (9)
Ρ = 0.039 N.S. N.S. N.S.
Infinite
0.318
Infinite
104

Table C2. Analyses of the Incidence of Primary Tumors in Female Rats Fed Dieldrin in the Dieta
(continued)
Topography: Morphology
Matched
Control
Low
Dose
Mid
Dose
High
Dose
Uterus: Endometrial Stromal
Polyp or Sarcoma 13/24 (54) 7/24 (29) 4/24 (17) 6/23 (26)
Ρ Values0 >
d N.S. N.S. Ρ = 0.007 (Ν) Ρ = 0.048 (Ν
Departure from Linear Trende
Ρ = 0.026
Relative Risk (Matched Control)f
Lower Limit
Upper Limit
0.539
0.231
1.179
0.308
0.089
0.828
0.482
0.190
1.106
Weeks to First Observed Tumor 96 104 105 104
Mammary Gland: Adenoma, NOSb
0/24 (0) 2/24 (8) 0/24 (0) 0/23 (0)
Ρ Valuesc >
d N.S. N.S. N.S. N.S.
Relative Risk (Matched Control)f
Lower Limit
Upper Limit
Infinite
0.305
Infinite
__
—
—
—
—
Weeks to First Observed Tumor — 104 — —

* U
. S.
GO
VE
RN
ME
NT
P
RIN
TIN
G O
FF
ICE
: 1
97
7
26
0-8
99
/31
65
Table C2. Analyses of the Incidence of Primary Tumors in Female Rats Fed Dieldrin in the Dieta
(continued)
Matched Low Mid High Topography: Morphology Control Dose Dose Dose
Mammary Gland: Fibroadenoma^ 2/24 (8) 0/24 (0) 0/24 (0) 2/23 (9)
Ρ Valuesc>
d N.S. N.S. N.S. N.S.
Relative Risk (Matched Control)f
0.000 0.000 1.043
Lower Limit 0.000 0.000 0.081
Upper Limit 3.283 3.283 13.306
Weeks to First Observed Tumor 105 81
Ui Ο
aTreated groups received doses of 2, 10, or 50 ppm in feed.
^Number of tumor-bearing animals/number of animals necropsied (percent).
cBeneath the incidence of tumors in the control group is the probability level for the Cochran-
Armitage test when Ρ < 0.05; otherwise, not significant (N.S.) is indicated. Beneath the
incidence of tumors in a treated group is the probability level for the Fisher exact test for
the comparison of that treated group with the matched-control group when Ρ < 0.05 for the control
group; otherwise, not significant (N.S.) is indicated.
dA negative trend (N) indicates a lower incidence in a treated group than in the control group.
eThe probability level for departure from linear trend is given when Ρ < 0.05 for any comparison.
95% confidence interval of the relative risk between each treated group and the matched-
control group.


DHEW Publication No. (NIH) 78-822