towards the understanding of the origin of human genetic
TRANSCRIPT

UNIVERSITY OF TARTU
FACULTY OF BIOLOGY AND GEOGRAPHY
INSTITUTE OF MOLECULAR AND CELL BIOLOGY
DEPARTMENT OF EVOLUTIONARY BIOLOGY
Urmas Roostalu
Towards the understanding of the origin of human genetic variation in Eurasia: mtDNA
haplogroup H in the Caucasus
M. Sc. Thesis
Supervisors: M. Sc. Eva-Liis Loogväli Prof. Dr. Richard Villems
Tartu 2004

2
TABLE OF CONTENTS ABBREVIATIONS .........................................................................................................3 DEFINITION OF BASIC TERMS USED IN THE THESIS .....................................3 INTRODUCTION...........................................................................................................4 1. LITERATURE OVERVIEW.....................................................................................5
1.1. Characteristic features of human mtDNA..............................................................5 1.2. mtDNA variation and the origin of modern humans .............................................7 1.3. mtDNA haplogroups and the initial spread of modern humans.............................8 1.4. The spread and topology of haplogroup H...........................................................14 1.5. Upper Paleolithic cultures in the Caucasus and neighbouring areas
in the light of population movements .................................................................18 1.6. The formation of current ethno-linguistic situation in the Caucasus ...................20
2. MATERIALS AND METHODS .............................................................................23 2.1. Samples ................................................................................................................23 2.2. DNA amplification and sequencing.....................................................................25 2.3. Phylogenetic and statistical calculations..............................................................27
3. RESULTS ..................................................................................................................31 3.1. Aim of the study...................................................................................................31 3.2. Subhaplogroup analysis .......................................................................................31 3.3. Summary statistics ...............................................................................................36 3.4. Genetic similarities between populations.............................................................42
4. DISCUSSION ............................................................................................................44 SUMMARY ...................................................................................................................56 SUMMARY IN ESTONIAN ........................................................................................58 PUBLICATIONS ..........................................................................................................61 LITERATURE ..............................................................................................................62 SUPPLEMENTARY MATERIALS ...........................................................................72

3
ABBREVIATIONS BP (years) before present
CRS Cambridge reference sequence
DNA deoxyribonucleic acid
(sub-) hg (sub-) haplogroup
HVS hypervariable segment of the control region of
mitochondrial genome
Kb kilobases (1000 basepairs)
mtDNA mitochondrial DNA
np(s) nucleotide position(s)
PCR polymerase chain reaction
RFLP restriction fragment length polymorphism
RNA ribonucleic acid
DEFINITION OF BASIC TERMS USED IN THE THESIS Haplotype (= lineage) mtDNA sequence with characteristic polymorphisms;
encompasses all identical sequences
Haplogroup a supposedly monophyletic group of lineages,
characterised by specific polymorphisms and designated
with names (uppercase roman letters)
Clade monophyletic unit
Cluster a more relaxed term for clade
Coalescence time time to most recent common ancestor

4
INTRODUCTION Mutations arising in the human genome represent valuable information for analysing
population histories. Due to their lack of segregation and high variability, mitochondrial
genome and Y chromosome have dominated in this field. While mitochondrial DNA
variation allows us to trace maternal lineages, then Y chromosome makes it possible to
describe paternal ones. Studying the spread of haplogroups in different populations
allows us to characterise the phylogenetic relationships between groups of individuals,
by which we could make hypothesis about prehistoric or historic population
movements. By means of different statistical methods it is also possible to draw
conclusions of the demographic past of these populations.
Approximately one half of Europeans bear in their mitochondrial genome a transition at
nucleotide position (np) 7028, which defines haplogroup (hg) H. Therefore the
knowledge about the emergence and initial spread of this clade is of considerable
importance in respect to the origin of European populations. Because of its extensive
postglacial expansion all over western Eurasia as well as northern Africa, and high
diversity, the phylogeography of hg H is more difficult to study, than several other less
frequent hgs in Europe.
The Caucasus region is characterised by ethno-linguistic diversity and by direct location
between Asia and Europe. It has been inhabited by anatomically modern humans since
early Upper Paleolithic and later it has been close to, or in the centre of several
prehistoric and historic developments, important for the understanding of the
demographic history. So far, no special attention has been paid to hg H in the Caucasus
populations. The aim of the current thesis was to start to fill this obvious gap by making
use of the knowledge that has been gathered recently by colleagues elsewhere and also
in our laboratory in the refinement of the topology of the phylogenetic tree and
phylogeography of hg H. Furthermore, the question of the origin of hg H and its spread
is addressed.

5
1. LITERATURE OVERVIEW 1.1. Characteristic features of human mtDNA There are several reasons, why the mitochondrial genome (mtDNA) of humans and
other higher animals have proven to be so useful in phylogenetic analysis. There are
usually 2-8 about 16 Kb long circular mtDNA molecules located in the mitochondrial
matrix (Anderson et al. 1981; Andrews et al. 1999). The mitochondrial genome is very
compact with only a limited share of non-coding sequences present. The control region,
between nucleotide positions (nps) 16024 and 577 is the only long, non-coding part of
its genome and contains essential sequences for replication as well as for transcription
(Larsson and Clayton 1995; Lightowlers et al. 1997). Regardless of its functional
importance, the non-coding region is highly variable. Polymorphic sites are mostly
concentrated in three hypervariable segments (HVS): HVS-1 (positions 16024-16365),
HVS-2 (positions 73-340) and HVS-3 (positions 438-574), from which HVS-1 shows
the largest variability (Lutz et al. 1998; Vigilant et al. 1991). A much faster mutation
rate in this region, when compared with the nuclear genome, is of a great help in
intraspecies phylogenetic analysis and could be successfully used in association with
archaeological data.
However, the molecular clock estimates are to a large extent dependent on the employed
methods. Pedigree/family studies (Cavelier et al. 2000; Heyer et al. 2001; Howell et al.
1996; Parsons et al. 1997; Sigurdardottir et al. 2000; Soodyall et al. 1997), phylogenetic
analyses (Forster et al. 1996) and between species comparisons (Horai et al. 1995;
Pesole et al. 1999; Tamura and Nei 1993; Ward et al. 1991) offer sometimes (in
particular in earlier studies) results that differ in an order of magnitude. It is currently
thought, that pedigree studies may largely rely on mutations in fast evolving sites and
may include slightly deleterious mutations that are afterwards removed from the
mtDNA pool by purifying selection. As a consequence, methods based on phylogenetic
trees (i.e. estimating variation in extant populations, avoiding, as a rule, sampling of
close maternal relatives), “do not see” such transitional, short-living polymorphisms and

6
result in a slower molecular clock estimates. In a wide array of phylogenetic studies, a
rate of 1 transition per 20,180 years in the segment between nps 16090 and 16365, as
proposed by Forster et al. (1966), has been used (see e.g. Kivisild et al. 2003; Maca-
Meyer et al. 2003; Reidla et al. 2003).
Not only does the control region evolve at a fast pace, but also does the mtDNA coding
region genes mutate faster than genes with similar function in the nucleus. It has been
estimated that synonymous sites and small ribosomal RNA evolve about 20 and
transport RNAs about 100 times more rapidly in mitochondria than in their nuclear
counterpart, which might be the result of less strict codon-anticodon pairing (Pesole et
al. 1999).
Another essential property of human mtDNA is that it is inherited only maternally
(Giles et al. 1980). It has been shown that paternal mtDNA is degraded by
ubiquitination shortly after fertilization (Hastings 1992; Sutovsky et al. 2004;
Thompson et al. 2003). Although rare cases have been documented, when this process
is not carried out normally (Schwartz and Vissing 2002), it is generally accepted, that
this does not have any significant impact on reconstructing human population
phylogenies. The lack of recombination between mtDNA molecules (Merrywether et al.
1991) helps to keep combinations of mutations over a long time in the mtDNA pool of a
population. Strictly speaking, the mtDNA is genetically a single locus, irrespective of its
high copy-number per cell. Meanwhile, maternal inheritance of mtDNA makes effective
population size for mtDNA four-fold smaller than for nuclear genes and, therefore,
renders it more sensitive to random genetic drift and to many demographic events in
general.
Phylogenetic analysis and, in particular, many statistical methods used to infer
demographic history scenarios out of empirical data, start from an assumption (even as
a pre-requisite), that mutations (polymorphisms) under inspection are selectively
neutral. There are several tests for neutrality and, by and large, most of the
phylogenetically detected mutations in mtDNA appear to be indeed selectively neutral,
though of course rigorous proofs for neutrality are hard to obtain (see above about the
discrepancies between pedigree and phylogenetic clocks of mtDNA evolution). On the
other hand, a large number of definitely pathogenic mutations have been characterised

7
in mtDNA that manifest as various, usually neuromuscular disorders (for reviews see
Wallace 1995, Wallace et al. 1999)(Brown et al. 2002; Howell et al. 2003; Mackey et
al. 1996).
1.2. mtDNA variation and the origin of modern humans The origin of modern humans (Homos sapiens sapiens) is one of the most fundamental
questions in paleoanthropology. Two main hypotheses have been postulated. According
to the “Out of Africa” model, all modern humans originated in Africa relatively
recently, and while colonizing the rest of the world, they replaced the former hominids
(Cann et al. 1987; Stringer and Andrews 1988). The multiregional hypothesis proposes
gradual evolution of modern humans from Homo erectus on different continents. In
turn, this model allows certain level of recurrent gene flows between continental groups,
in order to explain the observed homogeneity of the present-day humans (Wolpoff et al.
2000; Wolpoff et al. 1984). Recent studies have mainly led credence to the “Out of
Africa” scenario. It has been shown that mtDNA sequence diversity is more than twice
as large in Africans as in populations elsewhere (Yu et al. 2002). While on other
continents star-like tree topology (many relatively short branches originating from
central nodes) prevails, then in African populations there are contrastingly deep
branches (Ingman et al. 2000). The African origin of modern humans is also well
supported by extensive computer simulations (Takahata et al. 2001). By use of different
genetic loci the effective population size of modern humans through the majority of
Pleistocene has been estimated to be around 10,000 individuals, which is also in
discordance with gene flow between continents (Harpending et al. 1998). An interesting
parallel between the “Out of Africa” hypothesis and coalescence ages of human haploid
genetic lineages can be mentioned. While multiregional model claims that the common
African ancestor was Homo erectus, who has emerged around two million years ago,
then the African origin model postulates the origin of modern humans as a separate
species, with the first morphological appearance about 160,000 years ago (Clark et al.
2003). A timeframe between 150,000-200,000 years before present (BP) has been
calculated for the most recent common ancestor of mtDNA lineages in various articles
(Ingman et al. 2000; Maca-Meyer et al. 2001; Takahata et al. 2001). A similar time
estimate has been found for Y chromosome (Underhill et al. 1997). Although the

8
coalescence age of the extant mtDNA and Y-chromosomal pools of a species is not at
all necessarily overlapping with the actual age of the species, it is still a remarkable
coincidence. One needs, however, to stress here that most of our autosomal genes, in
accordance with their much larger effective population size, coalesce between 500,000
and 1,000,000 years ago, thus coinciding or even outdating the split between the
ancestors of Neanderthals (Homo sapiens neanderthalensis) and modern humans, which
has likely occurred about 600,000 years BP in Africa (Takahata et al. 2001).
Indeed, probably the last other hominids that lived simultaneously with modern humans
were Neanderthals − it appears at least true for western Eurasia. Analysis of mtDNA
from fossils has shown that direct genetic continuity between Neanderthals and modern
humans is unlikely, because Neanderthal mtDNAs form a cluster, which is deeply
separated from the found mtDNA variation within modern humans (Caramelli et al.
2003; Krings et al. 1999a; Ovchinnikov et al. 2000). Yet, one may notice here that a
controversial interpretation in favour of interbreeding between Neanderthals and
modern humans, based on morphological features of fossil lower limbs of an about 4
years old child from Portugal, was recently reported (Duarte et al. 1999).
1.3. mtDNA haplogroups and the initial spread of modern humans The oldest human mitochondrial lineage is macrohaplogroup L. It can be further divided
into four haplogroups: L0, L1, L2 and L3 (figure 1). The root of the human mtDNA
tree, inferred using chimpanzee mtDNA sequence as an outlier, lies in between hgs L0
and L1 (Ingman et al. 2000). L0, L1 and L2 clades share an HpaI site at np 3592
(3594T/C) and are widely spread all over Africa (Chen et al. 1995; Mishmar et al. 2003;
Salas et al. 2002). However, the mtDNA diversity in Africa is superficially understood
and it is important to note that several other haplogroups are there present (Kivisild et
al. unpublished information).
L0 has a characteristic distribution in eastern and southern Africa, with distinctive
clades (L0d, L0k) (figure 1) being particularly common among the Khoisan tribes
(Salas et al. 2002). L0 can be considered as one of the earliest branches in L and the
Khoisan speaking Vasikela Khung and Bantu-speaking Biaka Pygmies the most ancient

9
Figure 1. Schematic phylogenetic representation of major mtDNA haplogroups. Circles, squares and triangles mean principal spread in Africans, western Eurasians or eastern Eurasians/Amerinds respectively. Haplogroups M2 to M6 and other M clades represent the majority of southern Asian genepool. Numbers on branches, which indicate most widely used characteristic polymorphisms, are transitions, unless a nucleotide is brought out for transversions. The arrow shows the approximate location of the root, rooted by chimpanzee lineage (based on: Ingman et al. 2000). Data from: (Bandelt et al. 2001; Chen et al. 2000; Chen et al. 1995; Finnilä et al. 2001; Herrnstadt et al. 2002; Kivisild et al. 1999b; Kivisild et al. 2002; Kivisild et al 2003; Kong et al 2003; Maca-Meyer et al. 2001; Macaulay et al. 1999; Mishmar et al. 2003; Richards et al. 2000; Salas et al. 2002; Salas et al. 2004; Schurr et al. 1999; Torroni et al. 2001b).
899416292
5178A16362
10320162981635516362
16304249del10310
10034
1620116265
319716270
5412
16067
793316126162311623316266
6631629016319
10238
637114470161891622316278
16209163112352
16293T163111635516362
16124 10086
861814284
3594
163901380316294
415816114A1612916213
325369316399
10810161871618916311
431216230
166
161291614816172
16188G1627816320
1612916243
1616916327
16172162091621416291
7055
2349161261626416270
186A189C90721629416360
10400
249del
1326316327
483316362
785316298
759816362
10873
1956680161891624916311
1270516223
9bp del16189
126121370816069
4216112511545216126
13368156071592816294
12308
11719
7028
7245801590416298
13104140701618916249
46461133216356
163431590716051
16129C
1617216219
90551622416311
14766
731612616362
16217
9698
16318T
16147G1617216248
1614516176G
64559824
4491
47157196A8584
15487T16298
16220C16311
L3f
L3b
L2d
L2c
L2b
L0a
L1c
L1b
Z
C
DE
G
M
A
X
W
I
N
B
T
J
H
V
R
HV
R9F
R9a
M1
L0d L0f
L0k
L1e
L2
L2a
L3d
L3
L3e
L3g
U6
U5
U4U3U2
U1
UK
K
N9Y
N1
pre-HV2
pre-HV1
U8
U7
N1a
N1b
N1c
HV-1
M7
M9
M8
HV-2HV-3
M2-M6

10
African populations (Chen et al. 2000; Chen et al. 1995; Ingman et al. 2000; Maca-
Meyer et al. 2001). Such conclusions are also supported by Y chromosome data and it
has been suggested that the Khoisan populations and Ethiopians have had much wider
spread before the Bantu expansions that have started some 5 millennia ago (Semino et
al. 2002).
Hg L1 is spread all over Africa. A sub-clade of it (L1b) (figure 1) has emerged probably
in western Africa, where it is nowadays common, but population expansions and
migrations have taken it also to northern and central Africa. In the latter part of the
continent, another cluster of L1 (L1c) diverged. However, probably the oldest of the L1
lineages (L1e) is present in eastern Africa and in central Africa (Mbuti Pygmies), with a
frequency under 6% (Salas et al. 2002).
The expansion of hg L2 started possibly more recently than those of L0 or L1. L2a,
which spread probably as a result of Bantu expansions, is the most frequent cluster in
Africa, comprising around a third of all indigenous lineages. A coalescence age between
59,000-78,000 years BP has been calculated for it (Chen et al. 2000; Chen et al. 1995).
L2b, L2c and L2d have a more westward distribution. From these clades L2d could be
considered as the most ancient clade in hg L2 (Chen et al. 2000; Pereira et al. 2001;
Salas et al. 2002).
African lineages that do not have the HpaI restriction site at nps 3592 belong to
superhaplogroup L3 (figure 1). All Eurasian, Amerindian and Oceanian lineages lack
also this restriction site and have arisen from L3 (Chen et al. 1995; Kivisild et al. 2002;
Maca-Meyer et al. 2001). The beginning of the expansion of hg L3 has been estimated
to be around 50,000-70,000 years BP (Ingman et al. 2000; Maca-Meyer et al. 2001).
Because of its greater frequency and higher diversity in eastern Africa it is thought to
have originated there (Watson et al. 1996). Different sub-clades of L3 have been
characterised so far in Africa. The most frequent of them is L3e (1/3 of all L3 lineages
in sub-Saharan Africa), which probably arose about 46,000 years BP in central or
eastern Africa. During several expansion events numerous sub-clades of L3e have
emerged (Bandelt et al. 2001).

11
It is still widely debated, how the migration out of Africa took place (for a recent
review, see Forster 2004). Some authors suggest the presence of at least two
independent migrations (Kivisild et al. 2000), while others have proposed a single exit
(Forster et al. 2001). Nevertheless, the clades that initially probably moved out of
Africa were two derivates of hg L3 − hgs M and N (figure 1). Because their coalescence
times overlap within the corresponding error margins, it is difficult to distinguish
between their initial spread in Eurasia (Forster et al. 2001; Kivisild et al. 2000). One
may speculate that hg M has emerged as a distinct sub-clade of L3 already in eastern
Africa around 60,000-70,000 years ago, but it might also be that a more ancestral
variant of mtDNA left Africa. It has been suggested that a major population movement
took this haplogroup to southern Asia, where it expanded rapidly, giving rise to hgs E,
G, D, C and Z (figure 1) (Ballinger et al. 1992; Kivisild et al. 2002; Torroni et al.
1993). The most ancient (with deepest coalescence ages) haplotypes of M could be seen
in both Indian tribal and cast populations (Metspalu et al. submitted), as well as in
isolated mountain populations of Papua New Guinea and among some Malaysian
aboriginals. In these populations M is present in high frequency (60%) (Roychoudhury
et al. 2000; Schurr and Wallace 2002). The most probable scenario for the
“demographic history” of hg M1, which is spread in the mtDNA pool in eastern Africa
(Quintana-Murci et al. 1999), northern Africa (Rando et al. 1998; Stevanovitch et al.
2003), the Middle East (Macaulay et al. 1999) and India (Kivisild et al. 1999a), is that it
represents a back migration of hg M from Asia to Africa, because this hg is found in
much higher diversity in India and further eastwards, than in Africa (Maca-Meyer et al.
2001). Hgs M2 and M3 form the majority of southern Asian maternal genepool
(Kivisild et al. 2003). Hgs D and C are present in high frequencies in among
northeastern Asians and Native Americans (Torroni et al. 1993). Hgs G and Z are more
widely spread in northeasten Asia and hg E in southeastern Asia, although there are also
population specific differences from this pattern (Kivisild et al. 2002; Qian et al. 2001;
Schurr et al. 1999; Yao et al. 2002; Yao and Zhang 2002).
The other clade that derives from and is cladistically a sub-hg of L3, is
macrohaplogroup N (figure 1) (Forster et al. 2001; Maca-Meyer et al. 2001).
Haplogroups, originating from N, form the majority of western Eurasian mtDNA pool
(H, N1, J, K, R, T, U, V, W, X), but they are also well present in the eastern Asian

12
mtDNA pool (A, B, R9) and in Amerinds (X, A, B). One of the earliest branches of N is
hg X, present in a low frequency in northern Africa, Eurasia and in Amerinds (Reidla et
al. 2003). Another early offspring from N produced hg A, which has a similar
distribution as aforementioned hgs D and C (Starikovskaya et al. 1998). Hg Y reaches
its highest frequency in eastern and northeastern Asia, although it has been sporadically
detected throughout Asia (Ballinger et al. 1992; Bermisheva et al. 2002; Comas et al.
1996; Kivisild et al. 2002; Schurr et al. 1999). A possible origin in the Amur river
region for this cluster has been postulated (Schurr et al. 1999). Clusters I (subset of N1)
(Kivisild et al. 1999b; Richards et al. 2000) and W are present at a very low frequency
in Europe (under 2%). While I is considered to be relatively old (32,000-58,000 years),
then W is thought to be somewhat younger (18,000-38,000 years). Hg I is more spread
in western and northern Europe and hg W in southern Europe (Richards et al. 1998) as
well as in India (Kivisild et al. 1999b). However, the highest frequency (11%) of hg W
has been found in Finns, which is though likely a result of a founder effect or population
bottleneck (Meinila et al. 2001).
One branching of macrohaplogroup N has produced internal node R. Branches of
mtDNA phylogenetic tree that derive from R encompass the majority of the western
Eurasian mtDNA variation (figure 1). In addition, hgs B and R9 (including F and R9a)
diverged from R, but are mainly distributed in southeastern Asia, while B is also well
present in Amerinds (Kivisild et al. 2002; Torroni et al. 1993; Yao et al. 2002; Yao and
Zhang 2002). Hg B is in addition characteristic to some Polynesian populations (up to
100% in some of them) (haplotypes with 9bp deletion in Ballinger et al. 1992; Redd et
al. 1995; Sykes et al. 1995; Lum and Cann 1998). Furthermore, Indian populations are
particularly rich in so far poorly described, largely Indian-specific branches of R of deep
coalescence ages (Kivisild et al. 2003; Metspalu et al. submitted), suggesting that the
initial colonization of Eurasia by modern humans brought ancestral, undifferentiated R
mtDNAs to South Asia, where they underwent further differentiation locally.
Hg U, which branches from the R node (figure 1), encompasses almost 20% of
European maternal lineages (Torroni et al. 1996). Its origin has been suggested to lie in
the Near East (Maca-Meyer et al. 2003; Richards et al. 2000). Several sub-hgs have
been described in hg U. U5 is thought to represent the first expansion of modern

13
humans in Europe, where this cluster has diversified during the last 40,000 years and is
present at a frequency below 10%. A migration to the Near East from there is probable
(Richards et al. 2000). U1 is distributed mainly in the Near East and Mediterranean
Europe (Macaulay et al. 1999), where it allegedly expanded during the Middle Upper
Paleolithic, 20,000-30,000 years BP (Richards et al. 2000). Interestingly, sub-hg U2 has
specific sub-branches in India that differ from a variant present in Europe, whereas the
two subsets of U2 have split likely more than 50,000 years BP (Kivisild et al. 1999a).
A small sub-hg U3 shows a remarkably star-like tree topology and a spread in the
Caucasus, the Near East and northern Africa. A coalescence age of about 30,000 years
BP has been calculated for it in the Caucasus region populations, from where it
probably started to spread (Krings et al. 1999a; Maca-Meyer et al. 2001; Metspalu et al.
1999). Likewise to U1, U4 originates in the Middle Upper Paleolithic (Richards et al.
2000). The highest frequencies for it have been observed in Siberia, among Kets,
Nganasans and Mansis, where it accounts for 15-30% of mtDNA lineages (Derbeneva
et al. 2002a; Derbeneva et al. 2002b; Tambets et al. 2000b). On the other hand, in
western Europe its frequency does not exceed 5% (Helgason et al. 2001). Hg K, which
is nested inside hg U8, has a non star-like topology and a frequency below 10% in
European populations (Herrnstadt et al. 2002; Richards et al. 2000).
Hgs J and T form another clade (figure 1), branching out from R and comprising about
20% of European maternal lineages. Both of these hgs have likely an origin in the Near
East, in the Upper Paleolithic, but there are sub-hgs in them, which can be characterised
with star-like topology and a probably Neolithic spread in Europe (Richards et al. 1998;
Richards et al. 2000). It is thought that hg JT may encompass another earlier branch R2
(it shares one coding region transition with the JT clade) with a specific, covering
mostly Iran and western India, phylogeography, with a signal for an expansion about
40,000 years BP – i.e. around the transition between Middle and Upper Paleolithic (M.
Metspalu et al., submitted; Quintana-Murci et al. 2004).
The final large cluster of R is HV (figure 1), which most likely started to expand around
40,000 years BP in the Near East/Caucasus/India area, giving rise to clades H and V
(Metspalu et al. 1999). These represent probable sister clades. While hg H is definitely
older, than the Last Glacial Maximum, then the spread of hg V marks the postglacial

14
recolonization of Europe from the Iberian refugium during the last 15,000 years. The
highest frequency of V has been detected in Basques, where it includes around 20% of
maternal lineages. In the majority of European populations it is present under 5%
(Torroni et al. 1998; Torroni et al. 2001a). The elevated frequency and diversity of pre-
HV clusters (pre-HV1 and pre-HV2) could be seen in Arabian (15%) and HV cluster in
the South-Caucasus (7-13%) and Iraqi populations (10.6%). With a lower frequency
(under 6%) these clusters are as well present in a wide range of western Eurasian
populations (Al-Zahery et al. 2003; Kivisild et al. 1999b; Metspalu et al. 1999; Tambets
et al. 2000a; Torroni et al. 1997). It has been suggested that HV-1 clade, which is
spread in central and eastern Mediterranean and northeastern African populations, has
expanded from the Caucasus region around 30,000 years ago (Tambets et al. 2000a).
1.4. The spread and topology of haplogroup H Hg H is the most frequent mtDNA cluster in western Europe, where it comprises over
40% of maternal lineages (table 1). There is a gradual decline in its occurrence towards
the East, which becomes particularly evident outside Europe. In the Anatolian
peninsula, the Caucasus region and in the Near Eastern populations its frequency lies
generally between 20 and 30%. More East and South, in Central Asians, northeastern
Africans and the Arabian peninsula populations its frequency drops under 20%. The
furthest away places from Europe, to where H hg has expanded, are eastern Siberia,
Inner Asia and India (if we neglect the places inhabited during and after the Colonial
Era). It is interesting to note, that the frequency of this cluster is two times as large in
northwestern Africans, than in northeastern Africans, which might be due to population
movements between the Iberian peninsula and Africa. It appears that hg H has hardly
penetrated to sub-Saharan Africa – a few variants present both in Ethiopians (Kivisild et
al, in preparation) and in Senegalese (Rando et al., 1998) seem to mark the southern
boundary for this dominant Caucasoid variant of maternal lineages among the native
populations of this continent. The Cambridge Reference Sequence (CRS), which is used
as a reference for numbering nucleotides in the mitochondrial genome, being the first
mtDNA genome sequenced in full (Anderson et al. 1981), belongs to hg H and is the
most common HVS-1 haplotype in Europeans. Phylogenetic networks, based on HVS-1
polymorphisms, show that hg H has a very star-like topology. Several branches that

15
Table 1. Haplogroup H frequency in various populations
Population Frequency (%) Source
Basques 50.0 (Torroni et al. 1998) Bosnians and Slovenians 47.5 (Malyarchuk et al. 2003) Poles 45.2 (Malyarchuk et al. 2002) French 44.7 (Cali et al. 2001; Dubut et al. 2004) Ukrainians 44.0 (Malyarchuk and Derenko 2001a) Bulgarians 43.0 (Richards et al. 2000)
Germans 43.0 (Hofmann et al. 1997; Richards et al. 2000; Torroni et al. 1996)
Portuguese 42.9 (Pereira et al. 2000) Mordvinians 42.2 (Bermisheva et al. 2002) Icelanders 41.4 (Helgason et al. 2001) England and Wales 40.8 (Helgason et al. 2001) Swedes 40.8 (Torroni et al. 1998) Finns 40.4 (Meinila et al. 2001)
Russians 40.1 (Malyarchuk and Derenko 2001a; Malyarchuk et al. 2002)
Greeks 37.6 (Richards et al. 2000) Italians 33.3 (Torroni et al. 1997) Armenians 30.9 (Tambets et al. 2000a) Palestinians 30.8 (Richards et al. 2000) Tatars 30.7 (Bermisheva et al. 2002) Adygeis 28.0 (Macaulay et al. 1999; Torroni et al. 1998)
Anatolian populations 25.0 (Calafell et al. 1996; Comas et al. 1996; Kivisild et al. 2003; Richards et al. 2000; Tambets et al. 2000a)
Syrians 24.6 (Richards et al. 2000)
northwestern Africans 23.3 (Corte-Real et al. 1996; Pinto et al. 1996; Rando et al. 1998)
Udmurts 21.8 (Bermisheva et al. 2002) Iraqis 19.9 (Al-Zahery et al. 2003) Georgians 17.3 (Tambets et al. 2000a) Iranian populations 17.1 (Kivisild et al. 2003) Kazakhs 14.4 (Comas et al. 1998; Yao et al. 2000) Arabians 12.9 (Kivisild et al. 2003) western Siberian populations 12.5 (Derbeneva et al. 2002a; Derbeneva et al. 2002b) Bashkirs 12.2 (Bermisheva et al. 2002) northeastern Africans 12.2 (Krings et al. 1999b; Stevanovitch et al. 2003) Yemenites 9.8 (Torroni et al. 1998) Inner Asia (Uighurs, Kirghiz, Altaians, Khakassians, Buryats, Tuvinians, Mongols) 8.8 (Comas et al. 1998; Derenko et al. 2003; Kolman et
al. 1996; Yao et al. 2000) Druzes 2.6 (Torroni et al. 1998) Yakuts 2.6 (Fedorova et al. 2003) Indian populations 2.4 (Kivisild et al. 2003) most commonly involve only 1-2 mutations span out from the central node. The latter
on the other hand is quite large, containing about 1/3 of sequences (Richards et al. 1998;
Richards et al. 2000). Such a topology is associated with a recent rapid population
expansion. Nevertheless, drawing meaningful conclusions from hg H HVS-1 trees is
related with significant difficulties, rising from the possibility of multiple mutational

16
hits at a single nucleotide. Therefore the internal clustering of hg H is needed, which is
based on coding region polymorphisms and slowly mutating positions in the control
region. Using coding region data Finnilä et al. (2001) partitioned hg H into nine clades,
from which two most frequent ones were named according to the nomenclature. These
were H1, with a transition at np 3010 and H2, with a transitions at nps 4769 and 1438
(Finnilä et al. 2001). Subsequently mtDNAs bearing transitions at nps 7028 and 6776
were named H3 and with transitions at nps 7028, 3992, 4024, 5004 and 14582 are
referred to as H4 (Herrnstadt et al. 2002). Now also H5 (456, 16304), H6 (239, 16482),
H7 (4793), H8 (13101C, 16288), H9 (6869, 9804), H10 (14470A) and H11 (8448,
13759) have been characterised (figure 2). All these positions are transversions, unless
specially indicated. Sub-hg H6 defined by Quintans et al. (2004) by transition at np
3915 is likely a sub-clade of a larger cluster (identified by 239 and 16482), which could
be seen on the phylogenetic network of Loogväli et al. (accepted). Therefore a
correction of the nomenclature should be applied. A similar situation is with sub-hg
H11, where mutation 4336 defines a sub-clade, whereas 456 is likely the most basal
marker (Loogväli et al. accepted; Quintans et al. 2004).
While the resolution of hg H tree is improving, yet little is known about the spread of
specific sub-clades. Table 2 summarises the frequencies from Loogväli et al (accepted)
and Finnilä et al (2001) (Finns). The frequencies for some of the polymorphisms have
been described in Galicia. The most common sub-hg there is H1 (39%), followed by H3
(18%) and H2 (7%) (Quintans et al. 2004). Thus, from the known results from various
populations, H1 appears to be the most frequent sub-hg of hg H. The highest frequency
of H1 can be seen in southwestern Europe and in northern and central Finland, where it
covers over 40% of H hg lineages, therefore resembling to some extent the spread of hg
V (Finnilä et al. 2001; Loogväli et al. accepted; Quintans et al. 2004; Torroni et al.
1998; Torroni et al. 2001a). The topology of H1 is similar to that of H, being extremely
star-like (Finnilä et al. 2001; Herrnstadt et al. 2002; Loogväli et al. accepted). Sub-hg
H2 is more frequent in eastern Europe and Central Asia. The frequency of other H sub-
hgs remains generally under 10% of H samples in European populations. H3 has its
frequency maximum in southwestern Europe. H4, H5, H7 and H11 do not show any
clear geographical distribution. H6 and H8 are on the other hand

17
Figure 2. Phylogenetic network of haplogroup H mtDNAs (Loogväli et al. accepted)
1617216093
16209
1627016189
1629416148
16193
16039
16086
1630416311
16299
16093
16261
-73d+
16301
G9380A
G16482A
16188
G9380A
-13100k+
1612916278
-73d+
-951e+
16192
16167
-9066f+
16093
16249
16344
16080
16311
16192
16300
16176
16301
16311
16189
16185
16209
16093
16079
16189
16114
A16482G
16362
16311
16111
-73d+
16290
16093
16243
16092
16169
16362
16271
16093
16304
16093
16362
16189
1620916261
T5004C
+13757a-
16266
16093
d16183
1619316291
16178
16344
16166
16129
16169
16162
16092
16172
16311
16051
16265
16297
16092
16218
16235
16129
16354
16224
16075
-73d+
16300
16172
C456T
1627416291
16325
16261
16126
16327
16240
16234
16301
16092
16257
1629316357
16249
16075
16124
16298
16266
16250
16189
16342
16298
16243
16288
16320
16362
16086
16311
16291
16174
1609316354
16304
-4449e+
-4769i+
16311
1617216355
16362
16192
Eastern Slavs
16356 -4332h+
-4793j+
Volga-Ural FU speakers
Finns
T6776C
Estonians
Slovaks
French
Balkan peoples
Turks
Near Eastern peoples
Central Asian peoples
Altaians
+8446b-
G3915A
C456T
16304
+3007c-
16311
+5003g-
16311
16294
21
345
678
16070
-73d+
16325
H1
H2
H2a1
H3H4
H11a
H5
H5a
H7
H6H8
H6a1
H6a
H2a
H1aH1b
H1f
16245
+13757a- 16162
T239C
H6b
G16482A
16167

18
Table 2. Frequencies of H sub-haplogroups (% from H)*
H1 H2 H3 H4 H5 H6 H7 H8 H11 3010 4769 6776 5004 456 16482 4793 13101C 8448
VUFU 34.0 0.0 0.0 4.0 0.0 4.0 8.0 0.0 8.0 FIN 45.2 12.9 6.4 0.0 3.2 0.0 0.0 0.0 0.0 EST 38.0 8.0 6.0 0.0 2.0 4.0 2.0 0. 0 2.0 SLA 32.1 11.5 4.2 1.8 1.8 5.4 1.2 0.0 6.0 SVK 18.0 4.0 4.0 4.0 8.0 6.0 2.0 2.0 12.0 FRA 26.0 4.0 12.0 0.0 8.0 6.0 8.0 0.0 0.0 BAL 12.0 0.0 8.0 0.0 6.0 8.0 6.0 0.0 4.0 TUR 16.0 2.0 0.0 4.0 4.0 0.0 2.0 2.0 2.0 NE 14.0 6.0 0.0 6.0 2.0 8.0 2.0 6.0 2.0 CAIA 6.1 14.3 2.0 0.0 0.0 18.4 6.1 10.2 4.1 * Data from Loogväli et al (accepted) and Finnilä et al (2001). Abbreviations: VUFU-Volga-Uralic Finno-Ugrians; FIN- Finns; EST- Estonians; SLA- Russians, Ukrainians; SVK- Slovaks; FRA- French; BAL- Greece, Croatians, Albanians; TUR- Turks; NE- Near East populations. several times more common in the Asian mtDNA hg H pool than in European one
(Loogväli et al. accepted). However, it is important to note that the sample sizes in these
studies are far too small to reveal specific geographical differences in case of the less
frequent sub-clusters.
On the basis of the comparative analysis of HVS-1 diversity it has been thought, that hg
H appeared first in the Near East. In the study of Richards et al. (2000) however the
Near East was defined as a very large area, spanning from the Caucasus in the North to
the Arabian peninsula in the South and from Egypt/Sudan in the West to Iran in the
East. From different H sub-hgs H6 shows the highest diversity and coalescence age,
especially among Altaians (Loogväli et al. accepted). Taken together, hg H originates
likely outside Europe in the Upper Paleolithic. On the other hand the territory, which
has been suggested for this event, is almost as large as Europe.
1.5. Upper Paleolithic cultures in the Caucasus and neighbouring areas in the light of population movements In order to interpret the results of archaeo-genetic studies one has to know the
archaeological data from the studied regions about the specific timeframe. The
Caucasus region has been settled since the earliest times of hominid presence outside
Africa. In fact the Homo ergaster remains found in Dmanisi, Georgia, and dated to 1.81
millions of years, are the oldest ones in Europe (de Lumley et al. 2002). Nevertheless,
when considering mtDNA phylogeography and hg H, then the period starting from the

19
appearance of modern hominids to the Near East and Europe is what matters (bearing in
mind the genetic discontinuity between modern humans and Neanderthals).
It is currently accepted, that modern humans arrived to Europe together with
Aurignacian industry at least 32,000 years BP (Churchill and Smith 2000) (some
questionable dates of the Aurignacian are even older than 40,000 years as shown in
Conard and Bolus 2003). It is suggested that one of the main colonization routes of
Europe was through the Danube corridor, as the Aurignacian in eastern Europe and
southern Germany is a couple of thousand years older than in western Europe (Churchill
and Smith 2000; Conard and Bolus 2003; Villaverde et al. 1998). In several areas
industries with transitional characteristics precluded the Aurignacian. These are for
instance evident in Moldova, Crimea and near the Don, where the Mousterian and
Micoquien were also significantly late (Kozlowski and Otte 2000).
The “true” eastern European Aurignacian could be divided into two technocomplexes:
the flake-blade (Krems-Dufour) and the blade Aurignacian. The blade Aurignacian is
possibly older of the two. Several hypotheses have been postulated on the origin of it,
including those, suggesting it to have been in the Altai area (Otte and Derevianko
1996), in Levant (Cohen and Stepanchuk 1999), or in Europe (Conard and Bolus 2003).
The flake-blade Aurignacian was widely spread in eastern Europe and the Near East.
The origin of it is equally unclear. For instance, it has been thought that it spread as a
result of immigration from the Balkans (Kozlowski 1992). Since Baradostrian industry
in western Iran has been classified as Aurignacian (Zagros Aurignacian), it has been
linked with the origin of the flake-blade technocomplex (Olszewski and Dibble 1994).
At the moment it is difficult to draw any final conclusions about the origin and initial
spread of these archaeological cultures, as there is a shortage of reliable radiocarbon
dates, especially from outside Europe.
The Caucasus Early Upper Paleolithic could be characterised with its similarity with
neighbouring areas and mixed Aurignacoid/Perigordian/Gravettian appearance. Several
transitional industries have been revealed in the Caucasus as well as those, belonging to
flake-blade technocomplex. It is important to note the early emergence of geometric
microliths, distinctive to later Gravettian industries. It is still arguable, whether the
Upper Paleolithic industries in the Caucasus are of external origin or developed locally

20
(Cohen and Stepanchuk 1999; Nioradze and Otte 2000). Because of several
characteristic features some archaeological sites have been linked with the Zagros
Aurignacian and support the idea of Zagros origin of the flake-blade Aurignacian
(Cohen and Stepanchuk 1999). Since the relatively close geographic proximity, such
similarities between the Caucasus and western Iran are not surprising. They might even
have their roots in earlier times, as the Zagros type Mousterian was likely widely spread
in the Caucasus (Golovanova and Doronichev 2003). West from this region, in Turkey,
at Karain, the emergence of the Zagros type Aurignacian has been dated to 28,000 years
BP (14C) (Yalcinkaya and Otte 2000). In Central Asia there are less Aurignacian sites
and these might be younger than those in Iran or in the Caucasus. An input from
precluding Mousterian industries is detectable in all of them and none of the sites found
have clear analogy in neighbouring regions (Vishnyatsky 1999).
The Aurignacian was eventually replaced by Gravettian industries. Again, the oldest
dates (29,000 14C years BP) come from Swabian Jura, Germany (Conard and Bolus
2003; Housley et al. 1997). However, southeastern Europe or Spizinian culture in East
European Plain have also been linked with the origin of Gravettian (Cohen and
Stepanchuk 1999). In a few thousand years this culture colonized the majority of
Europe (25,000 14C years BP in Spain) (Arsua et al. 2002). The typical Gravettian
developed also in the Caucasus (Nioradze and Otte 2000). Because the Gravettian
stayed through the Last Glacial Maximum, then in respect of the Caucasus it is
important to note that especially the western part of it was a likely refugium area for
several animal and plant species, perhaps also for humans, as there where favourable
climatic conditions. It is believed, that it was one of the very few areas in Europe, where
broadleaved forest was present during the Last Glacial Maximum (Tarasov et al. 2000).
1.6. The formation of current ethno-linguistic situation in the Caucasus It is thought that the Neolithic groups from the Levant region did not advance to the
Caucasus. Farming is in spite there probably of local origin or developed as a result of
contacts with other populations (Renfrew 1991). The Early South-Caucasian (Trans-
Caucasian) archaeological culture, which existed between 5400-4000 years ago, has
been linked with Hurrians, who became a dominating ethnic group in the whole Middle

21
East. The place of origin of Hurrians and thus the Early South-Caucasian culture has
been placed in the nowadays Armenia (Greppin and Diakonoff 1991). In the northern
part of the Caucasus, Maikop culture appeared around 5000 years ago. From 2900 years
BP rich and well-organised kingdoms or chiefdoms developed in the Caucasus,
interacting with civilizations to the South. Among them, the most powerful one was
Urartu, which flourished from 2900-2600 years BP, with its centre near Lake Van. At
the same time Cimmerians emerged probably from the Caucasus region bordering
Urartu. Whilst being largely a nomadic group, they precluded later Scythians in eastern
Europe and around the Black Sea. At the same time it is considered not likely that
Cimmerians formed a uniform nation (Kristiansen 1998). The Caucasus region is
nowadays one of the most linguistically diverse ones in the world (figure 3). It is
Figure 3. Languages spoken in the Caucasus region. Map from CEO. (Note that Abazians are in the text and in literature generally spelled as Abazins)

22
also important to note, that the origin of Indo-European languages is placed in eastern
Anatolia. The Armenian and Greek languages form one of the oldest branches beside
Tocharian language that diverged from the ancestral Indo-European language (Gray and
Atkinson 2003). It is not clear, how the Indo-European language was introduced to
Armenia. Nevertheless, it is evident that there are several loans from the precluding
Hurrian and Urartian languages. A close connection between these languages and
Dagestan languages has also been proposed (Greppin and Diakonoff 1991). The arrival
of Altaic languages is even more recent and they came here probably from the Eurasian
steppes (Renfrew 1991). Analysis of mtDNA, Y-chromosome and Alu-insertion
polymorphisms has revealed that there is no correlation between genetic and linguistic
distances and populations group rather together with their geographic neighbours.
(Nasidze et al. 2001; Nasidze et al. 2003; Nasidze and Stoneking 2001). The population
sizes of major ethnic groups are brought out in table 3.
Table 3. Population of major ethnic groups from the Caucasus Nation/ ethnic group Local population1 Population over all countries Azerbaijanians2 6,069,453 7,059,000 Armenians 3,197,000 6,000,000 Georgian3 3,981,000 4,103,000 Chechens 956,879 1,000,000 Kabardinians 443,000 647,000 Avars 556,000 601,000 Ossetians 402,0004 593,000 Lezgins 257,000 451,000 Dargins 365,000 371,000 Adygeis 125,000 300,000 Kumyks 282,000 282,500 Karachais-Balkars 236,000 241,000 Ingushs 237,438 237,438 Abkhazians 101,000 105,000 Tabasarans 98,000 98,000 Nogaies 75,000 75,000 Abazins 34,800 44,900
Data from Ethnologue (2004). 1In case of ethnic groups from Russia the population in Russia is shown. 2Azerbaijanians do not include South-Azerbaijani speakers from Iran and other countries (24,364,000). 3Georgians do not include Mingrelians (500,000) and Svans (35,000). 4Ossetians in Russia (North Ossetia).

23
2. MATERIALS AND METHODS 2.1. Samples Clustering of samples to sub-hgs was carried out on 257 mtDNAs from the Caucasus
region, which all possessed transition at np 7028 (Appendix 1). This sample set was
composed of 60 individuals from Dagestan (DAG) (26 Dargins, 14 Avars, 11 Lezgins, 9
Tabasarans), 49 Armenians (ARM), 32 Adygeis (ADY), 30 Ossetians (OSS), 26
Nogaies (NOG), 24 Karachais (KAR), 23 Georgians (GEO), 13 Abazins (ABA) (all
previously unpublished). 50 individuals from the Near and Middle East had been
previously analysed for coding region polymorphisms in Loogväli et al (accepted). In
those mtDNA-s from them, which did not cluster to any of the sub-hgs, the position
7645 was controlled. Similarly the presence of H15 as well as that of H4 was analysed
in Italians and in Spanish mtDNA-s. Achilli et al. (personal communications) had
divided H mtDNA-s into clusters H1, H2, H3, H5 and H7 by RFLP analysis of 360
Italians and 82 individuals from Spain. Those mtDNA-s (with the exception of 4
Italians and 3 samples from Spain) that could not be classified into these sub-hgs were
analysed for the presence of -5003DdeI site (H4) and +7640SacI site (H15) in the
current study. Thus 141 Italians and 26 samples from Spain were analysed.
The first hypervariable region of 5636 samples belonging to mtDNA hg H were selected
for HVS-1 analysis. These cover the whole area of spread of the aforementioned
haplogroup. Samples were divided into groups, based on geographic or ethnic affinities.
Data sources and groups were as follows. 1. Levantine populations (LEV): 17 Syrians
and 45 Jordanians from Richards et al. (2000), 6 Druzes from Macaulay et al. (1999),
35 Palestinians from Di Rienzo and Wilson (1991) and from Richards et al. (2000), and
41 Lebanese, 21 Syrians, 40 Jordanians (unpublished); 2. Caucasus populations
(CAU): 26 North Ossetians, 9 Kabardinians and 13 Adygeis from Macaulay et al.
(1999), 14 Azerbaijanians from Richards et al. (2000) and 59 Armenians, 23 Georgians,
35 South Ossetians, 9 Kabardinians, 55 Adygeis, 39 Nogaies, 26 Karachais, 26 Dargins,
11 Lezgins, 14 Avars, 9 Tabasarans, 13 Abazins (unpublished); 3. Turkey populations

24
(TUR): 97 Turks and 11 Kurds from Richards et al. (2000), 9 Turks from Calafell et al.
(1996), 10 Turks from Comas et al. (1996) and 94 Turks (unpublished); 4.
Indians/Pakistanis (IPK): 12 Pakistanis from Quintana-Murci et al. (2004) and 32
individuals from India/Sri-Lanka (unpublished); 5. Central Asians (CAS): 8 Kazakhs
from Comas et al. (1998), 4 Kazakhs from Yao et al. (2000), 63 Kazakhs, 16 Uzbeks,
15 Tadjiks (unpublished); 6. Inner Asians (IAS): 11 Uighurs and 15 Kirghiz from
Comas et al. (1998), 5 Uighurs from Yao et al. (2000), 7 Altaians and 2 Buryats from
Derenko et al. (2002a), 2 Buryats from Derenko et al. (2003), 8 Mongols from Kolman
et al. (1996), 18 Altaians, 23 Tuvinians (unpublished); 7. Populations from the
Arabian peninsula (ARA): 16 individuals from Kuwait, 15 from Saudi-Arabia, 6 from
Oman and 4 from Yemen (unpublished); 8. Northwestern Africans (WAF): 33
individuals from Morocco, 5 from West-Sahara, 5 from Mauritania and 2 from Senegal
from Rando et al. (1998), 20 individuals from Algeria from Corte-Real et al. (1996), 5
from Morocco from Pinto et al. (1996), 27 from Morocco (unpublished); 9.
Northeastern Africans (EAF): 10 Egyptians, 6 Nubians and 1 Sudanian from Krings
et al. (1999b), 5 Egyptians from Stevanovitch et al. (2003), 22 Egyptians (unpublished);
10. Volga-Ural region Finno-Ugric speakers (UFU): 178 individuals from
Bermisheva et al. (2002); 11. Volga-Ural region Turkic speakers (URT): 112
individuals from Bermisheva et al. (2002); 12. Native Siberians (SIB): 14 Mansis from
Derbeneva et al. (2002b), 2 Kets and 2 Nganassans from Derbeneva et al. (2002a), 8
Nenets from Saillard et al. (2000), 5 Yakuts from Fedorova et al. (2003), 1 Yakut from
Derenko et al. (2002b), 40 Khants, 34 Selkups (unpublished); 13. Ukrainians (UKR):
8 individuals from Malyarchuk and Derenko (2001a) and 121 individuals
(unpublished); 14. Iraq/Iran (IRA): 6 individuals from Iran and 27 from Iraq from
Richards et al. (2000), 69 from Iran (unpublished); 15. Greeks (GRC): 47 Greeks from
Richards et al. (2000) and 31 mainland Greeks and 82 individuals form Crete
(unpublished); 16. Estonians (EST): 178 individuals (unpublished); 17. Norwegians
(NOR): 151 individuals from Helgason et al. (2001), 104 from Opdal et al. (1998), 28
from Passarino et al. (2002), 17 from Dupuy and Olaisen (1996), 14 from Richards et
al. (2000); 18. Germans (DEU): 103 individuals from Lutz et al. (1998), 72 from
Richards et al. (2000), 31 from Hofmann et al. (1997); 19. Great Britain (GBR): 541
individuals from England and Scotland from Helgason et al. (2001); 20. Finns (FIN):

25
163 individuals from Meinila et al. (2001), 51 (including Karelians) from Sajantila et al.
(1995), 36 from Kittles et al. (1999), 14 from Richards et al. (1996, 2000), 11 from
Lahermo et al. (1996), 9 from Pult et al. (1994), 21. Russians (RUS): 85 individuals
from Malyarchuk et al. (2002), 46 from Orekhov et al. (1999), 19 from Malyarchuk and
Derenko (2001a); 22. Icelanders (ISL): 164 individuals from Helgason et al. (2000),
20 from Sajantila et al. (1995), 5 from Richards et al. (1996); 23. Czechs (CZE): 35
individuals from Richards et al. (2000) and 38 DNA-s (unpublished); 24. French
(FRA): 87 individuals from Dubut et al. (2004), 61 from Cali et al. (2001), 23 from
Rousselet and Mangin (1998); 25. Latvians (LAT): 132 individuals (unpublished); 26.
Hungarians (HUN): 47 individuals (unpublished); 27. Swedes (SWE): 111 individuals
(unpublished); 28. Balkan populations (BAL): 69 Bosnians and 49 Slovenians from
Malyarchuk et al. (2003); 29. Poles (POL): 202 individuals from Malyarchuk et al.
(2002); 30. Portuguese (PRT): 99 individuals from Pereira et al. (2000), 28 from
Corte-Real et al. (1996); 31. Swiss (CHE): 70 individuals from Dimo-Simonin et al.
(2000), 45 from Pult et al. (1994); 32. Italians (ITA) (mainland and Sardinia): 32
individuals from Richards et al. (2000), 328 individuals (unpublished); 33. Spanish
populations (ESP) (including Basques): 101 individuals from Larruga et al. (2001),
71 from Corte-Real et al. (1996), 82 from Torroni et al. (1999), 52 from Crespillo et al.
(2000), 6 from Pinto et al. (1996).
2.2. DNA amplification and sequencing Amplification reactions were performed on 10 – 20 ng of template DNA in a 25-µl
volume (buffer: 750mM trisHCl pH 8.8, 200mM (NH4)2SO4, 0.1% Tween plus 10mM
tartrazine and 5% Ficoll 400)(1:10 of this concentration in the final volume). There
were 3 units of termostable DNA polymerase in the final volume. The concentration of
MgCl2 in the final reaction was 2.5 mM, that of oligonucleotides was 0.2 pmol/µl and
dNTP mixture was 0.1mM. Oligonucleotide sequences used in DNA amplification are
listed in table 4. Generally 37 PCR cycles were used, containing 94oC for 5 seconds,
52oC for 5 seconds and 72oC for 15 seconds, after an initial heating at 94o for 30
seconds. Such basic conditions were modified according to need. The enzymes used in
RFLP analysis could be seen in table 4 and on figure 2. Incubation with restrictases
(0.3-0.5 units per reaction) was done overnight. All questionable results were rechecked

26
Table 4. Primers used in RFLP or allele-specific PCR #
Sequences F 5’-436-CCCAACTAACACATTATTTTC*T 456; allele-specific-PCR R 5’-743-GATCGTGGTGATTTAGAGGGT F 5’-870-CAGGGTTGGTCAATTTCGTG 951; 950 MboI R 5’-1080-TCTAATCCCAGTTTGGGTC F 5’-2981-ACGACCTCGATGTTGGATCAGGACATCGC 3010; 3008 Bsh1236I R 5’-3168-GAAGGCGCTTTGTGAAGTAGG F 5’-4308-GGAGCTTAAACCCCCTTA 4336; 4332 Eco47I R 5’-4505-GGTAGAGTAGATGACGGGTTGGGC F 5’-4711-CCGGACAATGAACCATAACCAATACTACCA 4769; 4770 AluI R 5’-4969-CAACTGCCTGCTATGATGGA F 5’-4711-CCGGACAATGAACCATAACCAATACTACCA 4793; 4793 BsuRI R 5’-4969-CAACTGCCTGCTATGATGGA F 5’-4925-CCTTCTCCTCACTCTCTCAATC 5004; 5003 DdeI R 5’-5171-TCAGGTGCGAGATAGTAGTAG F 5’-6757-TTATCGTGTGAGCACACCAT*C 6776; allele-specific-PCR R 5’-7131-CGTAGGTTTGGTCTAGG F 5’-7458-GAATCGAACCCCCCAAAGCTGGTTTCAAGC 7645; 7640 SacI R 5’-7817-GGGCGATGAGGACTAGGATGATGGCGGGCA F 5’-8374-ACTAAATACTACCGTATGGCCCACCATAATTACCCC 8448; 8448 SspI R 5’-8628-GGAGGTGGGGATCAATAGAGG F 5’-9230-CCCACCAATCACATGCCTAT 9380; 9380 Hin6I R 5’-9848-GAAAGTTGAGCCAATAATGACG F 5’-12744-CCTATTCCAACTGTTCATCG 13101; 13100 MspI R 5’-13154-ATTAGTGGGCTATTTTCTGC F 5’-16453-CCGGGCCCATAACACTTGGG 16482; 16478 Bpu10I R 5’-5-GAGTGGTTAATAGGGTGATAG
#Amplified sequence or endonuclease restriction site is shown in the first column. The first number refers to the polymorphic position, the second number indicates the restriction site it affects. F or R indicate forward or reverse primers. Number in front of the sequence indicates the position of the 5’ nucleotide of the primer. Mutation at np 3010 was detected by PCR using mismatched primer with the 3’ end adjacent to np 3010 and a G at np 3008. When the 3010 mutation is present, it loses a Bsh1236I site. Allele-specific PCR was used to detect nucleotide state at positions 456 and 6776, with 3’ alternative nucleotide shown after asterisk (*). by direct sequencing. PCR primers were destroyed using exonuclease I and free
deoxynucleotides were eliminated by shrimp alkaline phosphatase (both from
Amersham Pharmacia Biotech). Following reactions were carried out in 10-µl volume,
using 5µl of purified PCR product and 2µl DYE premix, 1µl of oligonucleotide
(5pmol/µl) and 2µl of buffer (buffer (400mM Tris-HCl, pH 8.3, 110µl/ml BSA) plus
25mM MgCl2 and deionized water in a relation of 5:4:11). The DYE premix is the
DYEnamic ET Terminator Cycle Sequencing Kit from Amersham Pharmacia Biotech.
The DYE reaction involved 37 cycles (94oC for 20 seconds, 50oC for 15 seconds and
60oC for 1 minute). The labelled product (10µl) was precipitated using sodium acetate

27
plus dextran (2µl) (1.5M NaCH3COO, pH>8/EDTA (250mM) plus 20mg/ml red
dextran mixed in relation 1:1) and 96% ethanol (30µl) (30 minutes at -20o). After
centrifugation and washing DNA was suspended in 10µl of MegaBACE loading
solution and sequenced by MegaBACETM 1000 Sequencer (Amersham Biosciences).
Sequences were analysed using PolyPhred 4.0 or SeqLab (GCG Wisconsin Package 10,
Genetics Computer Group).
2.3. Phylogenetic and statistical calculations Phylogenetic network was drawn by Network 4001 program (Fluxus-Engineering).
Reduced median algorithm (rho set at 2) was used (Bandelt et al. 1995), followed by
median joining (epsilon set at 0) (Bandelt et al. 1999). Transitions were weighted, by
weights 1 (16093, 16129, 16189, 16304, 16311 and 16362) and 2 (16172, 16209,
16278, 16293) and 4 (all other HVS positions). For transversions and coding region
polymorphisms weight 8 was given. Weights correspond to the rate of evolution of
different nucleotide positions (Allard et al. 2002; Hasegawa et al. 1993; Malyarchuk
and Derenko 2001b). The result was manually redrawn using netViz 3D 6.50.00.
Similarities between sub-hg frequencies were found by principal component analysis,
which was calculated in XLSTAT 7.0. Parametric (Pearson) analyses with varimax axis
rotation were done and the results are shown on plots, where Euclidean distances
between points approximate the Euclidean distances in the original space. Frequency
map of sub-hg H2 was drawn in Surfer 7.0.
Coalescence ages for sub-hgs were calculated on networks, by means of average
transitional distance from the root haplotypes (rho-ρ). In case of HVS-1 analysis the rho
value was calculated from the number of mutations per individuals (without
constructing networks). One transitional step between nps 16090-16365 was taken equal
to 20,180 years (Forster et al. 1996). Standard deviations for the estimates from
networks were calculated as in Saillard et al. (2000).
In HVS-1 comparisons the mtDNA sequence between nps 16090 and 16365 was
analysed. The following formulas were used in computing population genetics statistics:

28
Gene diversity: )1(1
ˆ1
2∑=
−−
=k
iip
nnH
It is the probability that two randomly chosen haplotypes are different in the sample
(Nei 1987). In this formula n is the number of gene copies in the sample, k is the
number of haplotypes and pi is the sample frequency of i-th haplotypes.
Mean pairwise difference: ∑∑= <
=k
i ijijji dpp
1
ˆθπ µθ fe2N=
dij is the number of mutational differences between haplotypes i an j in a sample, k is
the number of distinct haplotypes and pi and pj are the respective frequencies of
haplotypes i and j. Nfe represents the female effective population size and µ the mutation
rate (Tajima 1983).
Tajima’s D:)ˆˆ(
ˆˆ
sVar
sDθπθ
θπθ
−
−= , where
∑−
=
= 1
1
1ˆ
n
i i
Ssθ
S is the number of polymorphic (segregating) sites in a sample of sequences and n is the
number of sequences. In Tajima D test θ is estimated independently from the number of
polymorphic sites and from the average mismatch in the sample. Differences between
the two results are due to selection or demographic processes (Tajima 1989; Watterson
1975). The significance of Tajima D values were calculated as in Tajima (1989).
These indices as well as mismatch distributions were calculated using the Arlequin
package (Schneider et al. 2000). Rate heterogeneity parameter α was taken equal to 0.26
(Meyer et al. 1999).
To estimate the population, where the haplogroup first started to expand, a summary
index was calculated. The standardized values of diversity indices as well as the fraction
of haplotypes not shared with other populations (= unique) from the total number of
haplotypes in a population, and the total frequency of unique haplotypes were averaged
over all estimated indices. Diversity indices could show high results in case of at least
two scenarios: a) when haplogroup emerged in the analysed population showing high

29
values and only some of the lineages expanded out from there; b) in case a population is
inhabited from several different locations, resulting in the admixture of lineages. To
distinguish between the two scenarios the number of unique haplotypes as well as their
frequency was considered. Namely when a population is inhabited from other locations,
then it is likely that there are less such lineages that are not present elsewhere. In the
current thesis at first the standardized values (z-scores) of the diversity and uniqueness
values were calculated, using the following formula:
( )stdev
mean-xz =
By doing this, the values are transformed so that their new mean is 0 and standard
deviation is 1. The z-scores maintain the relative differences between populations. If the
original dataset has a normal distribution, then z-scores can directly be transformed to
significance indices. Therefore the normality of data was checked on histograms or with
normality tests provided in NCSS 2000. A z-score of +/-1.96 is the critical significance
value for two-tailed distributions, being equal to p=0.05. To take uniqueness values and
diversity indices together, the average z-score was calculated.
Lineage sharing was analysed by tripartite similarity index:
RSUT ××=
2log
)),max(),min(1log(
acbacb
U ++
+=
2log
)1
),min(2log(
1
++
=
acb
S
2)2(log
)1log()1log(ca
aba
a
R ++⋅
++
=

30
In these formulas a and b are the number of not shared characters (in this case
haplotypes) and c is the number of shared characters (haplotypes) between the two lists
(populations). Therefore this index is strictly a mathematical comparison, without any
biological assumptions and allows to find the similarities between populations of
different size. The results range from zero to one (Tulloss 1997).
Distance/Similarity matrixes were further analysed by multidimensional scaling, which
was carried out in MS Excel add-in XLSTAT 7.0. Nonparametric, ordinal-2 type
analyses with 1000 iterations per dimension and 10 repetitions were calculated. The
results for two dimensions are shown on graphs.

31
3. RESULTS 3.1. Aim of the study The main aims of the present thesis were to:
a) show the variability of human mtDNA hg H in the Caucasus region populations
b) demonstrate the placement of H hg samples from the Caucasus among other
populations
c) find the likely location, where H hg started to expand
3.2. Subhaplogroup analysis 257 mtDNA-s from the Caucasus region were assigned to sub-haplogroups by detecting
the presence of 13 polymorphisms, characteristic to 10 sub-hgs (table 5, figures 4 and 6,
Appendix 1). The most frequent sub-hg in the Caucasus populations is H1 (14%, this
and the following percentages represent the frequency in respect to H) (table 5, figure
4). It is unevenly distributed through the region, with a frequency as high as 37% in
Karachais and dropping under 5% in Georgians. Second most frequent clade is H2, with
an overall frequency comparable to that of H1 (11%). It is particularly common in
Dagestan populations (27%) and in Karachais (21%). There was no H2 detected among
Ossetians and Adygeis. H3 is present at a very low frequency (less than 1%). H4 was
only detected in populations from the South-Caucasus (Armenians, Georgians) and
from Dagestan. The frequency of H4 in Armenians is nearly 10%, being similar to H1.
Its frequency in of it in Italians was 2% (7 individuals with HVS-1 and HVS-2
polymorphisms: 16126-195; 16239-16519; 16239-16519; CRS; 16172-16189-16213-
152-207; 16519; 263). One individual from Spain was also assigned to H4 (HVS-1/2:
73), making its frequency there 1.3%. H5 is spread over the region, with highest
frequency in Georgians (17%), being the most abundant sub-hg in their sample.
Relatively high occurrence of H5 could be also seen among Karachais and Nogaies. H6,
H7, H8, H11 and H15 are spread in a frequency under 10 % in various populations.

32
Table 5. Sample sizes and subhaplogroup frequencies in the Caucasus populations (% in respect to H haplogroup).
-300
8Bsh
1236
I
+476
9Alu
I
6776
-500
3Dde
I
456
+164
82B
pu10
I
+479
3Bsu
RI
+131
01M
spI
-844
8Ssp
I
+764
0Sac
I
N (t
otal
)
N (H
)
H1 H2 H3 H4 H5 H6 H7 H8 H11 H15
Tot
al
Armenians 193 49 8.2 6.1 0.0 10.2 4.1 4.1 6.1 2.0 0.0 6.1 46.9 Ossetians 201 23 6.7 0.0 0.0 0.0 3.3 0.0 0.0 0.0 0.0 6.7 16.7 Georgians 138 34 4.3 4.3 0.0 4.3 17.4 0.0 4.3 0.0 0.0 0.0 34.8 Adygeis 159 56 23.5 0.0 2.9 5.9 0.0 2.9 0.0 0.0 0.0 0.0 35.3 Karachais 106 28 37.5 20.8 0.0 0.0 12.5 0.0 0.0 0.0 8.3 0.0 79.2 Nogaies 183 13 21.4 10.7 0.0 0.0 7.1 3.6 3.6 7.1 3.6 0.0 57.1 Abazins 63 24 7.7 15.4 0.0 0.0 0.0 7.7 0.0 0.0 7.7 7.7 46.2 Dagestan pop. 274 30 8.9 26.8 1.8 0.0 1.8 8.9 1.8 1.8 0.0 1.8 53.6 Caucasus (total) 1317 257 14.0 11.3 0.8 3.1 5.1 3.9 2.3 1.6 1.6 2.7 46.3
Figure 4. Haplogroup H subhaplogroup frequencies in the Caucasus populations (ABA- Abazins, ADY- Adygeis, ARM- Armenians, DAG- Dagestan populations, GEO- Georgians, KAR- Karachais, OSS- Ossetians, NOG- Nogaies).

33
H15 is described here the first time. In order to get a preliminary picture of its spread
outside the Caucasus region populations, its presence was analysed in 27 individuals
from the Near and Middle East, who did not belong to any of the established sub-hgs of
H (Loogväli et al. accepted). Two individuals from them were assigned to this clade
(both with an HVS-1 haplotype 16256-16352), making its frequency there 4%. This is
comparable to that in the Caucasus region. The frequency of H15 in Italians was found
to be 1.4% (5 individuals with HVS polymorphisms: 16256-16352; 16456; 16093-
16456; 16265T; CRS). No H15 was detected in Spanish populations. On the whole,
almost a half (46%) of the mtDNA lineages belonging to hg H in the Caucasus were
classified to sub-hgs (table 5, figure 4). The number was the largest among Karachais
(79%) and smallest among Ossetians (17%).
Principal component analysis of sub-hg frequencies allows to visualise the similarities
of hg H samples in the studied populations. The two most informative dimensions were
plotted on graphs. From figure 5 (A) one could see that Ossetians and Adygeis as well
as Abazins and Dagestan populations are placed closely. Armenians are separated from
the rest because of the elevated frequency of H4 and Karachais because of H1 and H11.
Georgians lie apart from other populations as a result of the high occurrence of H5,
whereas Nogaies are separated by the frequency differences for H8. Secondly, a plot of
the Caucasus populations against a large number of other populations (figure 5, B) was
constructed (data taken from Loogväli et al, accepted). Here it is evident that the
majority of populations form one group. Central and Inner Asians are separated from
the rest by relatively frequent presence of H6 and H8. The Dagestan populations are
located closest to them as a result of the frequency of H6. The South-Caucasus
populations form the second group of outliers, specified mainly by the frequencies of
H4 and H5. Closest to these populations are people living in Turkey, in the Near and
Middle East and some Caucasus region populations (Ossetians and Adygeis).
Samples can be compared in more details by constructing phylogenetic networks. The
network of hg H genomes in the Caucasus populations (figure 6), shows that there are 7
unresolved reticulations present. One of them is between H1 and H15. Position 3010 is
one of the fastest evolving positions in mtDNA coding region, being present in hgs C,

34
D, H, J, L2, L3 and U (Finnilä et al. 2001; Herrnstadt et al. 2002; Loogväli et al.
accepted). Meanwhile, transition at np 7645 has been previously described only in hg P
CAU
DAGABA
NOG
KAR
ADY
GEO
OSSARM
-5
0
5
-5 0 5Factor 1 (26.9%)
Fact
or 2
(23.
6%)
CAU
DAGABA
NOG
KAR
ADY
GEO
OSS
ARM
CIA
NMETUR
BALFRASLK
SLAEST
FIN
VUF
-5
0
5
-5 0 5Factor 1 (24.5%)
Fact
or 2
(20.
1%)
Figure 5. Principal component analysis of haplogroup H sub-haplogroup frequencies in the Caucasus and other Eurasian populations (data from this study and Loogväli et al, accepted). Abbreviations: ARM- Armenians, OSS- Ossetians, GEO- Georgians, ADY- Adygeis, KAR- Karachais, NOG- Nogaies, ABA- Abazins, DAG- Dagestan populations, CAU- all Caucasus region populations together, CIA- Central and Inner Asians, VUF- Volga-Ural region Finno-Ugric speakers, SLK- Slovaks, SLA- Russians and Ukrainians, BAL- Balkan people, TUR- Turks, FRA- French, EST- Estonians, FIN- Finns, NME- Near and Middle East populations.
A
B

35
Figure 6. Phylogenetic network of haplogroup H in the Caucasus populations. Blue numbers indicate positions analysed by RFLP or allele-specific PCR. Black numbers are HVS-1 positions - 16000. Node sizes are proportional to the number of individuals.
261311
126
172
93
93
189
129
16286221
+7640SacI
-300
8Bsh
1236
I
150
211
129
24826
4
35335
6
362
311
352
256
325362
261456
311
111
129
-300
8Bsh
1236
I
356
256
+76
40Sa
cI
390
192
352212
+7640SacI
+7640SacI
352
256
311
148319
27435 4
+4769Alu I
- 95 0
Mb o
I
145126
256150
399
292
399
291
235
362
227
187
172
189
311
316
+16
478B
pu10
I
362
+4793BsuRI
-5003DdeI
93
168
260
284
456
248129184
6776
192261
156
218
92
162
189298
293
244
209
354
368 295
193
29221
3
221
188
-938
0Hin
6I
362
293
218
297
362
111
176
114
362
325
300
18926
1
134
263
288
+131
00Msp
I
218
261
189295
289
270
34270
311304
184
304
209
311189
+4332Eco47I
207
311
129
157
456
189
246
117
234
19285
362297
209
189
288
360
325
278
94
273
-8448SspI
311
214
48
234
320
248
362
183
93
189
328
10 ARM8 OSS 8 ADY8 DAG 6 NOG4 GEO 2 KAR
311
92
ArmeniansGeorgians
Adygeis
NogaiesAbazinsKarachais
Dagestan populations
Ossetians
12
3
4
5
305
92
304

36
(Ingman et al. 2000; Kivisild et al. 2002). Therefore, it appears justified to assume, that
mutation at np 3010 has emerged (at least) twice in the phylogeny of hg H. In this light,
we have included mtDNA genomes that possess both of these transitions − 3010 and
7645 − to subhaplogroup H15. All other unresolved reticulations involve only HVS-1
polymorphisms or an HVS-1 position and a coding region position.
Among the most star-like clusters in hg H is H1 (figure 6). Its coalescence age is 26,300
(standard error: 7500) years. Sub-hg H2 is generally not star-like, with two divergence
events (figure 6). Both, the more basal H2 and its sub-clade H2a, defined by MboI
restriction site at np 950, have the coalescence age estimate around 29,000 years BP
(29,000 with a standard error of 9900 and 29,500 with a standard error of 10,400 years,
respectively). One of the least tree like clades is H6, with an age of 58,500 (standard
error: 18,200) years. 17.9% of all lineages were clustered in the central note (CRS
sequence, as far as HVS-1 is concerned, with no subhaplogroup markers found yet).
The frequency of mtDNA genomes falling into the central node was the highest in
Ossetians (26.7%) and in Adygeis (23.5%). No such lineages were found in Abazins.
3.3. Summary statistics To study the placement of maternal lineages of the populations living in the Caucasus
region among other Caucasoids, i.e. western Eurasians and North Africans, an extensive
analysis was carried out, based on the HVS-1 polymorphisms of 5636 individuals
worldwide. Table 6 summarises the results of diversity calculations as well as those
related to the relative number and frequency of unique haplotypes. It can be seen that
these indices are high among various populations. This makes the finding of the
population(s), richest in presumably ancestral traits, very complicated. Thus far, no
clear geographical clustering based on diversity became apparent. Yet, lowest values
appear to be more typical for populations, which lie at the border areas of H hg spread.
The only group of populations, among whom hg H diversity is significantly different,
are native Siberians. Mean pairwise differences show significantly lower values among
Siberian populations as well as in northwestern Africans. The fraction of unique
haplotypes (U/H) is in a better correlation with hg H expansion from the Near
East/Caucasus region, although populations like Norwegians and Portuguese, are also

37
Table 6. Genetic diversity and haplotype uniqueness statistics of haplogroup H samples in various populations. Aligned by average z-scores. Bold z-scores indicate significant differences (p<0.05).
Population/Region N(H) Ĥ θπ U/H U freq. rho z (Ĥ) z(θπ) z (U/H) z(U freq.) z (rho) Average z-score Caucasus populations 381 0.919 2.856 0.492 0.245 1.294 0.70 1.22 2.22 1.99 1.01 1.43 Arabian peninsula populations 63 0.943 2.735 0.375 0.222 1.286 1.15 0.86 0.76 1.54 0.95 1.05 Levantine populations 205 0.906 2.707 0.443 0.220 1.234 0.45 0.77 1.61 1.48 0.62 0.99 Czechs 73 0.932 2.871 0.302 0.178 1.343 0.95 1.26 -0.15 0.65 1.31 0.81 Ukrainians 129 0.925 3.004 0.284 0.155 1.388 0.82 1.66 -0.38 0.18 1.60 0.78 Icelanders 189 0.916 2.629 0.367 0.180 1.302 0.65 0.54 0.67 0.68 1.05 0.72 Estonians 178 0.931 2.828 0.322 0.135 1.337 0.93 1.13 0.10 -0.23 1.28 0.64 Swiss 115 0.919 2.602 0.333 0.174 1.217 0.71 0.46 0.24 0.56 0.52 0.50 Indians/Pakistanis 44 0.866 2.547 0.435 0.250 0.932 -0.31 0.29 1.51 2.10 -1.30 0.46 Poles 202 0.869 2.865 0.342 0.134 1.312 -0.24 1.25 0.35 -0.25 1.12 0.44 Iraq/Iran populations 102 0.891 2.465 0.385 0.196 1.118 0.18 0.05 0.88 1.01 -0.12 0.40 Turks and Kurds 167 0.916 2.629 0.313 0.162 1.216 0.65 0.54 -0.02 0.31 0.51 0.40 Germans 206 0.907 2.605 0.330 0.155 1.199 0.48 0.47 0.19 0.18 0.40 0.35 Central Asians 106 0.901 2.697 0.286 0.142 1.226 0.36 0.74 -0.36 -0.09 0.58 0.25 Greeks 160 0.899 2.535 0.322 0.156 1.156 0.31 0.26 0.10 0.21 0.13 0.20 Inner Asians 91 0.931 2.662 0.200 0.143 1.275 0.93 0.64 -1.43 -0.07 0.88 0.19 Northeastern Africans 44 0.885 2.348 0.348 0.182 1.091 0.05 -0.30 0.42 0.72 -0.29 0.12 Italians 354 0.871 2.302 0.371 0.167 1.093 -0.21 -0.44 0.71 0.42 -0.27 0.04 French 171 0.903 2.331 0.320 0.146 1.082 0.40 -0.35 0.07 0.00 -0.34 -0.04 Great Britain populations 541 0.873 2.417 0.358 0.131 1.100 -0.18 -0.10 0.55 -0.30 -0.23 -0.05 Latvians 132 0.893 2.800 0.184 0.076 1.333 0.21 1.05 -1.62 -1.42 1.26 -0.11 Balkan populations 118 0.893 2.287 0.234 0.119 1.119 0.22 -0.48 -1.00 -0.56 -0.11 -0.39 Russians 150 0.902 2.480 0.207 0.080 1.153 0.38 0.09 -1.34 -1.34 0.11 -0.42 Spanish populations 339 0.860 2.177 0.365 0.112 0.995 -0.43 -0.81 0.64 -0.69 -0.90 -0.44 Hungarians 47 0.882 2.364 0.214 0.128 1.085 -0.01 -0.25 -1.25 -0.37 -0.32 -0.44 Finns 284 0.867 2.290 0.265 0.060 1.113 -0.28 -0.47 -0.61 -1.74 -0.15 -0.65 Swedes 111 0.928 2.397 0.136 0.054 1.135 0.88 -0.16 -2.22 -1.86 -0.01 -0.67 Portuguese 127 0.798 1.899 0.377 0.181 0.866 -1.60 -1.64 0.79 0.71 -1.72 -0.69 Norwegians 314 0.808 1.923 0.388 0.140 0.889 -1.40 -1.57 0.92 -0.12 -1.58 -0.75 Volga-Ural region Finno-Ugric speakers 178 0.825 2.030 0.333 0.079 0.955 -1.08 -1.25 0.24 -1.36 -1.15 -0.92 Volga-Ural region Turkic speakers 112 0.856 2.034 0.231 0.098 0.955 -0.50 -1.24 -1.04 -0.97 -1.15 -0.98 Northwestern Africans 97 0.818 1.700 0.281 0.093 0.814 -1.22 -2.24 -0.41 -1.08 -2.05 -1.40 Native Siberians 106 0.673 1.788 0.222 0.132 0.877 -3.97 -1.97 -1.15 -0.28 -1.65 -1.80

38
quite divergent, as far as the fraction of unique haplotypes are concerned. Still, the
corresponding ratio is significantly high only in the Caucasus populations and
significantly low in Swedes. It is interesting to notice that Indian and Pakistani hg H
genomes are rich in unique haplotypes, though the total frequency of hg H in South
Asia is by far lower than in Europe. Rho values reflect average time since the beginning
of expansion of hg H in a population. It is significantly different only in northwestern
Africa, where it corresponds to approximately 16,400 years. The highest average age
has been found for the Ukrainian hg H pool, where it is about 28,000 years.
When one calculates an average over all of the standardized diversity and haplotype
uniqueness values, then none of the samples differs significantly from the rest (table 6).
Nevertheless, it is evident that there is a relatively large gap after the Caucasus people,
who lead this particular ranking. Northwestern Africans and native Siberians are in a
similar way at the bottom of the list. All the indices considered, except for gene
diversity, have a normal distribution and therefore their z-scores correspond to
probabilities. The normality of the distribution of gene diversity is affected by Siberian
populations. An outlier status of native Siberians is supported also by such
characteristics as the mean pairwise difference and rho. To analyse, whether some other
populations gain significance levels if the Siberian sample is eliminated, the z-scores
were recalculated correspondingly. Indeed, without Siberian populations included, hg H
diversities in Norwegians and in Portuguese becomes significant (z-scores -2.14 and -
2.41, respectively). At the same time, the z-scores of the total frequency of unique
haplotypes in the Caucasus drops to 1.95. The rank of population relative to each other
does not change, when z-scores are averaged.
In most of the samples Tajima D index is significantly negative, ranging from -2.5 in
Norwegians to -1.1 in Siberians (if we treat the Caucasus population together as one)
(table 7). In the majority of the studied populations it is between -2.0 and -2.51, thus
showing a very uniform situation. The value is not significantly negative only in native
Siberians (p>0.05). The mismatch distributions could be seen on figure 7. Distinctively
multimodal distributions are characteristic only for Siberians and in populations in
India/Pakistan region. Populations in Levant, Caucasus, Turkey, Iraq/Iran and
northeastern Africa have unimodal distributions with a relatively low curve. On the

39
other hand, populations from the Volga-Ural region as well as northwestern Africans
and Swedes show sharp peaks.
Table 7. Tajima D index of H haplogroup in various populations. Population/Region Tajima D Population/Region Tajima D Karachais -1.004a Czechs -2.253c Siberian natives -1.109a Central Asians -2.266c Georgians -1.156a Armenians -2.268c Ossetians -1.482a Balkan populations -2.275c Latvians -1.749b Russians -2.286c Indians/Pakistanis -1.770b Great Britain populations -2.290c Abazins -1.786b Swiss -2.291c Inner Asians -1.798b Northeastern Africans -2.310c Icelanders -1.832b Greeks -2.317c Azerbaijanians -1.893b Northwestern Africans -2.323c Kabardinians -1.908b Poles -2.333c Finns -1.948b Italians -2.375c Estonians -2.042c Turks and Kurds -2.378c Swedes -2.069c French -2.383c Hungarians -2.095c Caucasus populations (total) -2.384c Arabians peninsula populations -2.110c Levantine populations -2.420c Nogaies -2.127c Spanish populations -2.422c Volga-Ural region Finno-Ugric speakers -2.172c Germans -2.470c Adygeis -2.211c Portuguese -2.488c Ukrainians -2.219c Iraq/Iran populations -2.503c Dagestan populations -2.237c Norwegians -2.507c Volga-Ural region Turkic speakers -2.247c
a- p>0.05; b- p<0.05; c- p<0.01 To investigate, whether the elevated mtDNA diversity in the Caucasus region people
might be a consequence of large number of different populations grouped together, they
were split apart geographically. The diversity values could be seen in table 8. The
results of some populations (Abazins, Azerbaijanians, Kabardinians) should be treated
with caution, because of their small sample size. Therefore the z-scores in comparison
with all other populations were calculated only for the largest samples. Still it is evident,
that several populations have high diversity values. For instance Ossetians, Nogaies and
Armenians show the 3-rd, 4-th and 8-th highest gene diversity values among all
populations, provided we neglect Abazins and Azerbaijanians, who even have higher
values. Considering mean pairwise differences Karachais rank the 1-st, Ossetians the 2-
nd (being also significantly different from the rest) and Armenians the 5-th over all
populations, if we do not include Abazins who have a higher value than the rest.

40
0
10
20
30
40
0 2 4 6 8 10 12 14
EAFLEVARAIRA
0
10
20
30
40
0 2 4 6 8 10 12 14
IPKSIBIASCASWAF
0
10
20
30
40
0 2 4 6 8 10 12 14
GBRFRAITAPRTESP
0
10
20
30
40
0 2 4 6 8 10 12 14
RUSUKRPOLCZE
0
10
20
30
40
0 2 4 6 8 10 12 14
LATESTFINUFUURT
0
10
20
30
40
0 2 4 6 8 10 12 14
DEUISLCHENORSWE
0
10
20
30
40
0 2 4 6 8 10 12 14
CAUOSSADYNOGARMDAG
0
10
20
30
40
0 2 4 6 8 10 12 14
BALGRCTURNORHUN
Figure 7. Mismatch distributions of H haplogroup in different populations. Abbreviations: ARA- Arabian peninsula populations, BAL- Balkan populations, CAS- Central Asians, CAU- Caucasus region populations, CHE- Swiss, CZE- Czechs, DEU- Germans, EAF- northeastern Africans, ESP- Spanish populations, EST- Estonians, FIN- Finns, FRA- French, GBR- Great Britain populations, GRE- Greeks, HUN- Hungarians, IAS- Inner Asians, IPK- Indians/Pakistanis, IRA- Iraq/Iran populations, ISL- Icelanders, ITA- Italians, LAT- Latvians, LEV- Levantine populations, NOR- Norwegians, POL- Poles, PRT- Portuguese, RUS- Russians, SIB- native Siberians, SWE- Swedes, TUR- Turks and Kurds, UFU- Volga-Ural region Finno-Ugric speakers, UKR- Ukrainians, URT- Volga-Ural region Turkic speakers, WAF- northwestern Africans.

41
Table 8. Genetic diversity and haplotype uniqueness characteristics of haplogroup H in the Caucasus region populations. Bold z-scores indicate significant differences (p<0.05). Population/Region N (H) Ĥ θπ U/H U freq. rho Average z-score Abazins 13 0.987 3.907 0.250 0.250 1.769 Adygeis 68 0.797 2.725 0.333 0.221 1.206 z-scores (Adygeis) -1.58 0.71 0.32 1.19 0.35 0.20 Armenians 59 0.927 2.868 0.355 0.254 1.305 z-scores (Armenians) 0.82 1.13 0.60 1.78 0.97 1.06 Azerbaijanians 14 0.956 2.754 0.182 0.071 1.214 Dagestan* 60 0.859 2.465 0.444 0.317 1.133 z-scores (Dagestan) -0.43 -0.05 1.76 2.88 -0.11 0.81 Georgians 23 0.885 2.583 0.333 0.217 1.217 Kabardinians 18 0.895 2.702 0.231 0.167 1.222 Karachais 26 0.908 3.244 0.091 0.039 1.539 Nogaies 39 0.931 2.639 0.191 0.103 1.231 z-scores (Nogaies) 0.90 0.46 -1.54 -0.88 0.50 -0.11 Ossetians 61 0.953 3.178 0.231 0.180 1.492 z-scores (Ossetians) 1.30 2.04 -1.01 0.48 2.13 0.99 *Dagestan populations: summarised as indicated in p. 24.
Dagestan nations show the highest number of unique haplotypes. Armenians are the 2-
nd in the Caucasus region and the 12-th overall in this aspect. These populations have
also the highest total frequency of unique haplotypes among all populations (p<0.05 in
case of Dagestan). Adygeis and Georgians have a high frequency of such lineages. The
first of the latter has the 3-rd highest number of mutations per haplotypes. In case of
several Caucasus region populations (Abazins, Karachais, Ossetians) the rho values are
higher than elsewhere, corresponding to average ages of hg H over 30,000 years. The
highest average z-score is present in Armenians (1.06) followed by Ossetians (0.99).
After them come the Arabian peninsula populations (0.96), Levantine populations
(0.91) and Dagestan populations (0.81). Adygeis ranked 16-th after Germans and
Nogaies 24-th, after French.
Because the particular method depends critically on sample size, mismatch distribution
patterns are shown only for the largest samples from the Caucasus region (Ossetians,
Adygeis, Nogaies, Armenians, Dagestan populations) (figure 7). From here it is evident
that mismatch patterns are unimodal in all of these populations, in except of Adygeis. In
the latter case the samples with small number (under 2) of mutations in their mtDNA
HVS-1 dominate. Meanwhile, Tajima D test shows negative values for all the Caucasus
region populations, ranging from -1 to -2.2. In case of Karachais, Georgians and
Ossetians the values are though not significantly negative (p>0.05).

42
3.4. Genetic similarities between populations In order to analyse the dispersal of hg H and the place of the hg H pool of the Caucasus
region among the corresponding pools elsewhere, genetic similarities between
populations in respect of hg H HVS-1 diversity were calculated. The multidimensional
scaling based on tripartite similarity index matrix (Appendix 2) is shown in figure 8 (A).
The stress value for the two dimensions was 0.217. Because of a quite a high stress
value, the placement of populations on higher number of dimensions was also assessed.
However, because there were no significant changes in the partitioning of populations,
only a two-dimensional plot is shown. European populations are more concentrated to
the upper part of the graph, opposing Asian populations. The Near East/Caucasus region
populations lie between the two, on the right side of the graph. The placement of
northeastern Africans among the Asian group and northwestern Africans within the
European group is indicative. One also finds that the hg H pools of the Turkic and
Finnic speakers of the Volga-Ural region are similar to each other as they are to the
corresponding pools of Swedes, Finns and Estonians. Close to them lie East Slavonic
Ukrainians and Russians. Norway is apart from other Scandinavian populations and lies
closer to Great Britain and Spain. Several populations (Siberians, Indians/Pakistanis,
Inner Asians, Arabian peninsula populations) from the border areas of H haplogroup
spread, are placed distally from the others.
It has been interesting to establish whether the individual populations of the Caucasus
region form a natural single cluster, based on HVS-1 polymorphisms. Therefore, the hg
H pool in the Caucasus was subtracted between individual populations and the
similarities were reassessed (Appendix 3). The two-dimensional graph (stress value:
0.221), presented in figure 8 (B) shows that the Caucasus populations oppose most of
other populations and, at the same time, differ considerably among themselves.
Interestingly, the Inner Asian, northeastern African and Indian/Pakistani pools lie
somewhat inside the Caucasus group. Within the subset of the Caucasus populations,
Armenians lie somewhat apart from others. Nogaies, on the other hand, are expectedly
situated nearer to Central Asians and native Siberians.

43
Figure 12. Multidimensional scaling of tripartite similarity indices of H haplogroup populations: A- Caucasus populations grouped together; B- Caucasus populations split apart. Abbreviations: ABA- Abazins, ADY- Adygeis, ARA-populations from Arabian peninsula, ARM- Armenians, AZE- Azerbaijanians, BAL- Balkan populations, CAS- Central Asians, CAU- the Caucasus region populations, CHE- Swiss, CZE- Czechs, DAG- Dagestan populations, DEU- Germans, EAF- northeastern Africans, ESP- Spanish populations, EST- Estonians, FIN- Finns, FRA- French, GBR- Great Britain populations, GEO- Georgians, GRE- Greeks, HUN- Hungarians, IAS- Inner Asians, IPK- Indians/Pakistani, IRA- Iraq/Iran populations, ISL- Icelanders, ITA- Italians, KAB- Kabardinians, KAR- Karachais, LAT- Latvians, LEV- Levantine populations, NOG- Nogaies, NOR- Norwegians, OSS- Ossetians, POL- Poles, PRT- Portuguese, RUS- Russians, SIB- native Siberians, SWE- Swedes, TUR- Turks and Kurds, UFU- Volga-Ural region Finno-Ugric speakers, UKR- Ukrainians, URT- Volga-Ural region Turkic speakers, WAF- northwestern Africans.
ESPNOR
DEU
FIN
GBR
IRA
UKR
GRCEST
ITA
RUSBALSWE
POL
CHEPRT
CZE ISLFRA
HUN
LAT
ADY
KAB
NOG
DAG KAR
ARM
LEV
GEO
AZE
OSS
ABAEAF
WAF URT
SIB
UFU
IPK
TUR
CAS
ARA
IAS
-1.5
0
1.5
-1.5 0 1.5Dimension 1
Dim
ensi
on 2
UFU
SIB
EAF
URT
GRC
ITA
UKR
IRA
TUR
IPK
LEV
CAU
ARA
WAF
CAS
IAS
ESTHUNSWE
FRA
LAT
PRT
CHEBAL
POL
DEU
GBRNOR
ESPISL
CZE
FIN
RUS
-1.5
0
1.5
-1.5 0 1.5Dimension 1
Dim
ensi
on 2
A
B

44
4. DISCUSSION Due to its location between the Near East, Europe and Central Asia, genetics of the
Caucasus region populations may have an important role in the reconstruction of the
dispersal of modern humans, including from the very beginning of the colonization of
Eurasia. During tens of thousands of years, one might expect that the genepool of the
people inhabiting the Caucasus has been affected by many migrations. On the other
hand, bearing in mind its early Upper Paleolithic occupation, there exists a possibility
that some lineages, which are by now widely spread in western Eurasia, might have
emerged there. The topology of H hg has been recently studied in great depth at the
level of complete sequences (Finnilä et al. 2001; Herrnstadt et al. 2002). However, so
far this new knowledge has not been extracted and used for representative
phylogeographic publications, though some of such investigations are under way,
including at least one being accepted for publication (Loogväli et al.).
Meanwhile, none of the studies, devoted to hg H phylogeography, have paid special
attention to the Caucasus populations. Therefore, one of the main aims of the current
thesis was to analyse the variability of hg H pool of the Caucasus region populations.
Altogether, a total of 257 mtDNAs were assigned to 10 sub-hgs (table 5, figure 4, figure
6). Of these, H15 is described here for the first time and shows a frequency under 10%
in various Near Eastern or Caucasus populations. There is a decline in its frequency
towards the West, as it is 1.4% in Italians and it was not detected in Spanish samples.
From the nine remaining sub-hgs analysed here, three show their highest frequencies in
the Caucasus populations. In particular, the clade H2 has a frequency of 27% in the
Dagestan populations, 21% in the Karachais and 11.3% in the Caucasus populations in
average (table 5, figure 4). Considering it’s relatively high frequency in Central/Inner
Asians (14.3%) and in eastern Slavs (11.5%) as well as in Finns (12.9%) (Finnilä et al.
2001; Loogväli et al. accepted) in respect to western European populations, one may
suggest its origin in eastern Europe/northwestern Asia (figure 9).

45
Figure 9. Spatial frequency distribution of subhaplogroup H2. Abbreviations: ADY- Adygeis, ARM- Armenians, BAL- Balkan populations, BAS- Basques, CAIA- Central and Inner Asians, DAG- Dagestan populations, EST- Estonians, FRA- French, GAL- Galician population, GEO- Georgians, ITA- Italians, KAR- Karachais, NME- Near and Middle East populations, OSS- Ossetians, PRT- Portuguese SLA- Russians and Ukrainians, SPA- Spaniards, SVK- Slovaks, TUR- Turks, VUF- Volga-Ural region Finno-Ugric speakers. Data from this study (Caucasus region populations), Loogväli et al. (accepted) (BAL, CAIA, EST, FRA, NME, SLA, SVK, TUR, VUF), Quintans et al. (2004) (GAL), Pereira et al. (2004) (BAS, PRT, SPA) and from Achilli et al. (personal communications)(ITA). In case of the Caucasus populations one should also consider the possibility of a
founder effect. Yet, the presence of several 3-step long branches inside H2 in the
Caucasus pool of hg H suggests its deep coalescence age in the area − around 29,000
years BP. When compared with the data from Loogväli et al.(accepted), then the age of
H2 in the Caucasus is older than elsewhere. Therefore, it is not excluded that, that H2
may have originated in the Caucasus region some 30,000 years BP. Note that the
coalescence age of a clade is a minimum estimate for its real time depth. In this respect,
it is worthwhile to notice that according to recent data, the transition from Middle to
Upper Paleolithic (and, accordingly, the appearance of modern humans) in the Caucasus
took place about 34,000 14C years BP (Bar-Yosef, personal communication)- an
estimate that lies well within the signal boundaries given by sub-hg H2 .

46
H4 has its frequency maximum in Armenians (10%). In all other populations studied so
far it has remained under 6% (Loogväli et al. accepted; Quintans et al. 2004). This sub-
hg possesses numerous coding region mutations at its root (Herrnstadt et al. 2002;
Loogväli et al. accepted). High frequency of likely ancient H4 in southern Caucasian
Armenians speaks in favour of the hypothesis that haplogroup H has originated from
that region.
It could be seen that a second, but smaller peak of the frequency of sub-hg H2 is present
in Basques (figure 9). Also, there is a small rise in the frequency of sub-hg H4 as well in
the Iberian peninsula populations (Quintans et al. 2004). However, it is important to
note that direct genetic connections between these regions are questionable and for
instance have been rejected by previous Y-chromosome (Nasidze et al. 2003, Nasidze et
al. 2004), mtDNA (Nasidze et al. 2004, Nasidze and Stoneking 2001) and HLA allele
analyses (Sánchez-Velasco and P. F. Leyva-Cobián 2001). Also, there is a sharp
difference between these regions in the frequency of haplogroup V for instance
(Tambets et al. 2000a, Torroni et al. 1998, Torroni et al. 2000).
It appears from the results of the current thesis that sub-hg H5 has also its frequency
maximum in the Caucasus H hg mtDNA pool (tables 2 and 5). It occurs most frequently
in Georgians (17.4% in contrast to frequencies under 10% in western Europeans,
Central/Inner Asians and the Near Eastern populations) (Loogväli et al. accepted;
Quintans et al. 2004). At the same time H5a, which is a sub-clade of H5, has a very low
frequency and diversity in the Caucasus populations. These characteristics of H5a in the
Caucasus populations are at odds with the results from European populations (Loogväli
et al. accepted).
On the whole, the most frequent sub-hg in the Caucasus region is H1. This result is not
really surprising, because H1 is almost universally the most frequent sub-clade of hg H
(table 2) and has a complex, not yet entirely resolved inner structure (figure 2). Its
frequency in the Caucasus is nevertheless lower than in western European populations,
but higher than in Central/Inner Asians, a tendency contributing to a general West-East
clinal distribution of this clade in western Eurasia. Still, in several populations of the
Caucasus, other sub-hgs, such as H2, H4 and H5 have occasionally frequencies equal to
that of H1 or even higher (table 5, figure 4). The only other geographic area analysed so

47
far, where H1 is not dominating the local hg H genepool, is in Central/Inner Asia, where
H6 is instead the most frequent variety of hg H (Loogväli et al. accepted). The
coalescence age of H1 in the Caucasus (21,600 years) is roughly comparable to that
found by Loogväli, et al. (accepted) for the rest of western Eurasia.
However, contrary to conclusions drawn by some authors (Barbujani et al. 1994;
Nasidze et al. 2001) who did not see clear clines of “allele frequencies” in the Caucasus,
a more detailed analysis, like that carried out here, allow to see informative patterns.
One such is provided by sub-hg H1. Indeed, all major populations south of the High
Caucasus – Armenians, Georgians and South Ossetians have sub-hg H1 at significantly
lower frequencies in their mtDNA pools (table 5, figure 4). Furthermore, this cline
follows well a more general pattern of the distribution of H1 in an interesting way (see
tables 2 and 5). While the frequency of sub-hg H1 is in general higher in the north (e.g.
38% in Estonians, 34% in Volga-Ural region Finno-Ugric speakers, 32% in Eastern
Slavs) compared to the mtDNA pools in south (16% in Turks, 14% in the Near Eastern
populations, 12% in Balkan populations), then the South Caucasus, in contrast to most
of the North Caucasus populations, forms a region of the lowest occurrence of sub-hg
H1. Such distinctively low frequency of hg H1 seems to extend northwards alongside
the eastern Pontic, which is visible in Abazins (table 5, figure 4). It is commonly
accepted that Abazins have descended from the proto-Abkhazian tribes, who inhabited
the coastal areas of the sea, from where they supposedly migrated to their nowadays
territory between the 8th and 14th century. Nevertheless, bearing in mind the complexity
of H1 (figure 2), a more detailed discussion of it would be premature.
Principal component analysis of the Caucasus region populations (figure 5) reveals
large differences. At first, the South-Caucasus group of populations lies apart from
other populations in the region. Also Nogaies differ from the rest, primarily because of
the high frequency of sub-hg H8. This latter finding is not unexpected, bearing in mind
their known descent from one of the constituents of the successors of the Golden Horde,
a multiethnic political unit generated by the early 13th century westwards invasion of
Mongols, carrying with them even a larger portion of Kipchak-Turkic speaking Central
Asian tribes. Indeed – the mtDNA pool of the Central/Inner Asian populations has the

48
highest share of sub-hg H8 detected thus far (table 2) and the found overlap with the
Nogay mtDNA pool is therefore a document of an existing genetic link.
Karachais appear also different (figure 5). Here, however, their status as “outliers” is
caused by elevated frequencies of sub-hgs H1 and H11, though, like Nogaies, they
speak a language that belongs to western Kipchak (Turkic) family of languages.
Interestingly, the pattern of H sub-hgs distribution (elevated frequencies of H1 and H11)
in Karachais is particularly similar to that, found by us earlier in the Volga-Ural region
populations (tables 2 and 5, figure 4). At the same time, it is also not really dissimilar
from a general pattern for the northern Pontic-Caspian East Europeans, including Slavic
people. This finding fits well with a one line of self-identification of Karachais that
derives them from an Alanian/Sarmatian ancestry – i.e. to pastoral nomads who
occupied for long periods a large part of the steppe belt North of the Black Sea and the
Caspian. According to another self-identification scenario, Karachais descend from
Khazars, which at the peak of its expansion extending from the Urals to Dnepr River. In
any case, the geographic link points to the same direction – to the steppe belt north from
the Caucasus.
A very high level of between population diversity has also been demonstrated in case of
Alu polymorphisms (Nasidze et al. 2001) and mtDNA hypervariable region analysis
(Nasidze and Stoneking 2001; Nasidze et al. 2004) as well as for Y chromosome data
(Nasidze et al. 2003; Nasidze et al. 2004). However, in most cases such summary
differences in frequencies have only a limited heuristic value because they document an
obvious: a mechanical sum of complex, long-lasting effects of genetic drift (including
possible population bottlenecks with following founder effects) in small populations,
and of possible admixtures due to migrations in pre-historic and historic times.
When other European and Asian populations are added to the analysis of H sub-hg
frequencies, then two groups separate from others (figure 5B). Firstly, Central/Inner
Asians appear as clear outliers with their position defined by H6 and H8 frequencies.
Similar position for Central Asians has been shown for mtDNA control region analysis
without considering distribution in haplogroups (Comas et al. 1998). That, however, is a
trivial result because the mtDNA pool of Central Asians, in a sharp contrast to almost
all of the Caucasus populations, encompasses about a half or more maternal lineages,
49
specific for east Asian populations (Kivisild et al. 2003). The sum of hg H variation in
Dagestan populations is genetically between Central/Inner Asians and other
populations. Although sub-hg H6 has reached its maximum frequency in Central and
Inner Asians, the question of its origin remains obscure. Namely, there are deep, 4-step
long, branches both in Central and Inner Asian populations (figure 2) as well as in the
Caucasus (figure 6). The second group separating clearly from the rest by the
frequencies of H4 and H5 (relatively low frequency of sub-hg H1 was discussed above)
consists of the South-Caucasus populations. Smallest distances to the latter group have
populations from Levant and Turkey. The latter result has been shown also for HLA
alleles (Arnaiz-Villena et al. 2002) and for Y-chromosome data (Nasidze et al. 2003).
At the same time mtDNA analysis of control region polymorphisms without studying
specific haplogroups, has shown their greater similarity to European populations than to
those from the Near East (Nasidze and Stoneking 2001). However, when mtDNAs from
their neighbouring populations, Kurds and Iran, were added, then the Caucasus
populations appeared more similar to the Near East than to European populations
(Nasidze et al. 2004).
To gain further knowledge about hg H in the Caucasus region and compare it with other
populations, a summary variability of hg H HVS-1 region from the whole area of spread
of this clade was analysed. This analysis, though allowing to operate with much larger
data sets, has also well-known limitations. Namely, high mutation rate in the
hypervariable region of the mitochondrial genome creates ambiguities in the underlying
phylogeny, whereas the extent of them is not a priori even known (Howell et al. 1996,
Loogväli et al., accepted). Nevertheless, the positive aspect is not only an order of larger
sample size available, but also in the fact that in doing so, all haplogroup H variants are
brought for consideration – i.e. not only those, where we are reasonably confident that
we deal with monophyletic sub-clusters. Therefore it appears to be well justified to
carry out such an analysis as a preliminary search for patterns.
With a total of 5636 individuals included, this is the largest statistical and genetic
analysis of the haplogroup carried out so far. Diversity measures and characteristics
based on the occurrence of unique haplotypes in different regions/populations and
groups of populations, have shown that these indices have quite similar values, with

50
only a few populations showing significantly different result (table 6). Taking the
results together, a particular place occupied by the “Caucasus pool” of hg H emerges. In
this respect, they are followed by hg H among Semitic speaking populations living in
the Arabian peninsula and the Levant. The Caucasus populations have the largest
number of unique haplotypes in respect to other haplotypes. They have also the second
highest frequency of such haplotypes after Indians/Pakistanis. However, one needs to
stress here that an overall frequency of hg H in South Asians (India/Pakistan) is by far
lower than in the Caucasus populations. It is likely that the latter have acquired hg H
lineages via a multitude of small migrational events over Holocene (Kivisild et al. 1999;
Metspalu et al., submitted), resulting in a present-day pattern that is characterised by
high variation, but with no locally developed sub-clades of their own. Hg H diversity in
the Caucasus region is 8-th overall and the mean pairwise difference is ranked the 4-th
(table 6). On the basis of the rho statistic it ranks as the 7-th.
A high total diversity in the mtDNA hypervariable region in the Caucasus relative to
European populations has been shown earlier, but in that case the samples from the
Near East had even higher vales (Nasidze et al. 2004; Nasidze and Stoneking 2001). For
Y chromosome the diversity in the Caucasus is also significantly higher than in Europe,
but also higher than in the Near East, being only second after Central Asia (Nasidze et
al. 2003). One needs of course to add here that comparing general Y-chromosomal (or,
for that matter, mtDNA) variation in Central Asian and Caucasus populations is quite
another matter: the first being an extensive admixture zone for profoundly different
western and eastern Eurasian genetic heritage and the latter being overwhelmingly
“Caucasoid”. And because haplogroup H is a western Eurasian variety of human
maternal lineages, variation within it should not be directly compared with
aforementioned general, pan-Eurasian variables.
Returning to hg H, it was found that more clearly than populations with high diversity
and likely ancestral position, the ones with low diversity/haplotype uniqueness values
stand out (table 6). Such are the hg H pools in native Siberians as well as in
northwestern Africans and in Scandinavians (Swedes, Norwegians). The Volga-Ural
region populations and Portuguese have also relatively lower diversity and smaller
number/lower frequency of unique hg H haplotypes. Such results are in concordance

51
with the hypothesis that hg H originates from outside Europe (Richards et al. 2000;
Torroni et al. 1998). At the same time they allow to point out the Caucasus as the place,
where the extant hg H variation is closest to the putative “ancestral” variation, from
where the expansion of this hg has started.
The mismatch profiles are significantly ragged in case of Indian/Pakistani and Siberian
hg H pools (figure 7). In all other populations they have a more or less unimodal
distribution. Multimodal mismatch distributions might indicate alterations from
demographic expansions, like population bottlenecks or, as well be the results of a
colonization in distinctive multiple waves, as it was suggested above for hg H in
India/Pakistan region. In cases of population expansions, a unimodal, bell-shaped,
distribution is generated (Harpending et al. 1998; Schneider and Excoffier 1999). It has
been noted, that the distributions of pairwise differences are difficult to interpret and
that they do not make use of all the sequence data (Schneider and Excoffier 1999).
Therefore, only the main differences between the mismatch curves can be reliably
interpreted. This is why we limit here with a notion that hg H in all populations, except
for native Siberians and Indians/Pakistanis are characterised with a sign suggesting
demographic expansion. Ambiguity of such a conclusion, extrapolated to a population,
is self-evident: it is beyond doubt that the South Asian (Indian/Pakistani) population has
expanded enormously since the beginning of Upper Paleolithic. Yet, this ambiguity
supports an opinion that hg H has entered the South Asian gene pool recently and
perhaps episodically, in a form of multiple micromigrations.
The scenario of considerable population expansion is further supported by the notion of
significantly negative Tajima D values (table 7). Here only Siberian populations do not
have a significantly negative value, but also Indians/Pakistanis have a value closer to
zero. It has been suggested that values, nearer to zero, specify constant population size
in contrast with more negative values, indicative of expansion (Aris-Brosou and
Excoffier 1996).
It might be nevertheless argued that the high diversity values and number of unique
haplotypes in the Caucasus is the result one may expect for a region where many
different populations are brought together. Indeed, the Caucasus is splintered into
numerous ethnic groups (figure 3). For this reason, hg H pools of the populations
52
behind this diversity were analysed separately. This, however, neither reduced the
diversity, nor altered the ancestral position of the Caucasus region (table 8). For
instance, Armenians, Ossetians and Dagestan populations still show high average z-
scores of the studied diversity/uniqueness statistics. Considering diversity and haplotype
uniqueness statistics separately shows high values also for other Caucasus region
populations. However, we note that the elevated average z-score for Ossetian hg H is
largely due to the presence of very few distinct lineages, not found so far elsewhere. It
can be seen in table 5 and figure 4 that only a minor fraction of Ossetian hg H mtDNAs
belong to known sub-hgs. From figure 6 it is evident, that haplotype 189-360-325 and
its derivate 189-360-325-288 encompass 20% of the Ossetian hg H sample. Such
haplotypes have not been found in any other populations (see sample sources), raising
therefore significantly the frequency of unique haplotypes and suggesting a
bottleneck/founder effect scenario in the demographic history of Ossetians. This
conclusion is strongly supported by a general pattern of the spread of all mtNDA
haplotypes in Ossetians (data not shown) and may have a historic explanation, because
Ossetians are popularly considered as descendants from tribes that lived earlier in
lowlands, North of the Caucasus, but defeated by Huns at the end of 4th century, found
refugee behind Kuban and Terek, being pushed further towards high mountains by
Mongols, Russians and other invaders.
High mtDNA diversity for Armenians has been noted previously, estimated as the
second after that for the Middle East populations (Nasidze and Stoneking 2001; Nasidze
et al. 2004). Y chromosome diversity on the other hand was in Armenians higher than
in the Near East, but lower than in Central Asia (Nasidze et al. 2003). Still, in all of
these cases Armenians appear as the most diverse of the Caucasus populations. This has
been attributed to regional differences inside Armenia. For instance the mountainous
regions in the East and South have been proposed to be different from others (Weale et
al. 2001). In our study the ancestry of Armenian samples was traced back to different
parts of Armenia, Georgia, Azerbaijan and Turkey, illustrating the fact that the historic
Armenia was a much larger territory than that occupied by the present Republic of
Armenia. At its height, the Greater Armenia reached deep into eastern Anatolia down to
the Mediterranean and many of the historically important places for Armenians lie
around lakes Van and Urmia, close to North Mesopotamia. Figure 6 shows that the
53
Armenian hg H genepool is much more heterogeneous than that of Ossetians. Most of
the Armenian haplotypes involve only one to two individuals and there are only three
haplotypes with three individuals (each forming 6% of total sample). Interestingly, two
of the latter haplotypes (189-295 in H7 and 354-145-126 in H2) have not been
described elsewhere (see sample sources). This very high diversity, combined with the
relatively high frequency of hg H among western Asian populations, makes the source
of the Armenian mtDNA pool worth of deeper investigation in future.
From Tajima D values it could be seen that several populations from the Caucasus
region (Karachais, Georgians, Ossetians) do not have a significantly negative value
(table 7). This might be indicative of fluctuations in population size, diminishing the
effect of initial expansion. Similar to the situation in Siberia the populations in the
Caucasus are often small and therefore more easily affected by genetic drift.
An average coalescence age for hg H could be calculated for the rho values presented in
table 6. The highest estimates were achieved for some Caucasus populations (between
26,000 to 31,000 years). This is comparable or slightly higher from the previously
published estimates (23,200-28,400 years for Near Eastern samples) (Richards et al.
2000). It is tempting to speculate that the same migration waves that carried early hg H
variants out of the Caucasus/eastern Anatolia, took as well some other mtDNA clades
alongside. For instance, a similar coalescence age has been shown for U3 in the
Caucasus region and it has been proposed to have originated there (Metspalu et al.
1999). Comparable results have been acquired for HV-1 clade (Tambets et al. 2000a).
The lineage sharing method applied in the current study is an additional tool for
analysing differences between populations. Comparing all populations together, by
means of multidimensional scaling, possible individual erroneous (sampling biases etc)
results between pairs of populations are minimised. Nevertheless, in case of the
populations, where the haplogroup is recent, quantisation of similarities may well be
misleading because of the lack of distinctive haplotypes, shared with other populations.
For instance, haplotypes shared between Czechs and northestern Africans are among the
most common ones, or single-step derivatives thereof. Furthermore, such mutations
could have emerged multiple times.

54
In general hg H pools in European populations can be distinguished from that in Asians,
with the exception of a few populations (figure 8A). Between population differences are
also larger in Asians than in Europeans. Such a picture agrees with a more recent
divergence age of hg H in Europe (Richards et al. 2000). The Caucasus/
Anatolian/Levantine (roughly: the Near Eastern) populations form a separate group with
an intermediate position between Asian and European populations. On the one hand this
might be the result of an admixture, in the Near East, of Asian and European mtDNA
lineages. On the other hand, in a view of the high genetic diversity and number of
unique haplotypes in the region, as well as bearing in mind general geographic
considerations, it seems more plausible that the spread of hg H in the continental Asia
for areas east of the Near East, and possibly in Europe, has originated from there.
Clustering of the Caucasus regions populations together with populations from the Near
East is consistent with the aforementioned results from Alu insertions (Nasidze et al.
2001) and Y-chromosome data (Nasidze et al. 2003; Nebel et al. 2001). It has been
shown that the addition of Kurds and Iranian samples to the Near Eastern mtDNA
control region dataset increases the similarity between the Near Eastern and the
Caucasus populations, which are otherwise more similar to European populations
(Nasidze et al. 2004; Nasidze and Stoneking 2001). In case of H hg samples the
Caucasus is rather similar to Levant and Turkey (Turks and Kurds), but not so much to
Iran (figure 8A). The placement of the Caucasus closer to Near East is in a general
concordance with the results of sub-hg frequencies presented in the current thesis
(figure 5).
It is interesting to note that hg H of the Caucasus and the Near Eastern and Anatolian
populations are close to that among some Mediterranean populations, like Italians and
Greeks (figure 8A). Therefore, it might be possible that hg H has colonized Europe
along the Mediterranean coast, though probably not only. Furthermore, Mediterranean
involves regions where hg H could have survived during the Last Glacial Maximum.
Northeastern African hg H groups together with that among Peninsular Arabians and
the Near Eastern populations, while the northwestern Africans are in this respect more
similar to European populations (figure 8A). Gene flow / lineage sharing between the
Iberian peninsula and northwestern Africa has been shown for some mitochondrial

55
lineages (Bosch et al. 2001; Rando et al. 1998, Torroni et al. 1998, 2001). Hence, it is
probable that the migrations across Gibraltar involved also hg H.
Inside Europe two clusters can be identified. One of them includes hg H of eastern
European populations (Latvians, Estonians, Swedes, Finns, Russians, Ukrainians, the
Balkan nations and the Volga-Ural region populations), while the other group is made
of hg H of northwestern and southern European populations (Spain, Germans, Great
Britain, Norwegians and Italians). Such a genetic landscape may result from two
(several) separate colonization waves after the Last Glacial Maximum- one of them
originating from southwestern and the other from southeastern Europen glacial refugia .
Among the best known, the Francocantabrian in the southwest and the “Periglacial” in
the Ukraine, are well documented archaeologically, but several others may have existed
as well (Dolukhanov, 1997; Taberlet et al. 1998; Tarasov et al. 2000; Torroni et al.
1998; Torroni et al. 2001a).
Finally, it must be noted that approximately only a half of haplogroup H lineages that
exist in the Caucasus area populations, have been sequestered into monophyletic sub-
haplogroups, not to add that this fraction varies considerably from population to
population. One may speculate that the remaining fraction of haplogroup H lineages –
i.e. the unclassified portion, consists of sub-clades that are specific to and shared
between the Caucasus populations. Consequently, the internal heterogeneity in the area
would decrease. It is also possible that the so far “hidden” haplogroups bring the
Caucasus people closer to either of their neighbours – in the South or the North. To find
answers to questions like that, further efforts are needed, in particular to obtain more
complete mtDNA sequences that would allow to identify novel clades.

56
SUMMARY The knowledge about the spread of human mtDNA hg H is of great importance, when
taking into account its high frequency in western Europe. Analysing its variability in
different populations could help us to understand both the initial settlement of Europe as
well as more recent population movements. From the results of the current thesis it is
possible to conclude, that hg H is very diverse in the Caucasus populations. Different
subhaplogroups reach their highest frequency in different populations, allowing in some
cases to trace probable migrations to the Caucasus region or yet in another cases
distinguish clades/populations, which have likely been themselves main contributors to
outward migrations. As a result of the low frequency of the most common European H
sub-haplogroup (H1), the populations South of the High Caucasus differ from the
populations North of it. At the same time other subhaplogroups reach their highest
frequencies, found so far, in the South-Caucasus populations. One of the sub-
haplogroups (H4), which has previously been shown to possess many coding region
polymorphisms at its root, reaches its highest described frequency in Armenians.
Another clade (H2) has also a relatively high frequency in the Caucasus, with the
highest described occurrence in the Dagestan populations and Karachais. Considering
its highest calculated age in the Caucasus populations (around 30,000 years), as well as
its frequent presence in neighbouring Central Asian and eastern European H haplogroup
genepools, it is likely that the origin of it could be traced in the Caucasus region. A
novel sub-haplogroup (H15) is described in the current thesis, which shows its highest
frequency in the Near East/Caucasus region and a decline towards the West.
The presence of several preglacial clades in the H haplogroup phylogenetic tree in the
Caucasus region populations indicates a relatively high age of H haplogroup in the
Caucasus populations, when compared with European ones. Such a scenario is further
supported by an extensive analysis of the first hypervariable segment of mitochondrial
DNA. It is apparent that the H haplogroup genepool in the Caucasus is very diverse and
rich in unique lineages. Therefore it is possible to conclude that the origin of H

57
haplogroup expansion, which started around 30,000 years ago, can be traced in that
region. This is especially the case of Armenian H haplogroup genepool, which is
particularly rich in characteristics, likely indicating greater age. Similarities, which are
based on haplogroup H first hypervariable segment polymorphisms, make it possible to
cluster Caucasus populations together with other Near Eastern populations. In addition,
eastern European populations group apart from western, suggesting at least two
postglacial recolonization routes.

58
SUMMARY IN ESTONIAN
Inimese geneetilise varieeruvuse päritolu Euraasias: mtDNA haplogrupp H Kaukaasias
Mitokondriaalse DNA varieeruvus võimaldab tänu emapoolsele päritavusele ja suurele
liigisisesele diversiteedile analüüsida selle genoomi fülogeograafiat ja kasutada saadud
andmeid inimkonna demograafilise ajaloo rekonstrueerimiseks. Umbes pooled inimesed
Euroopas omavad oma mitokondri genoomis mutatsiooni positsioonis 7028, mis
defineerib nende kuuluvuse haplogruppi H. Viimase varieeruvuse uurimine aitaks
seetõttu oluliselt kaasa Euroopa kaasaegsete populatsioonide päritolu küsimuse
lahendamisele.
Käesoleva töö eesmärkideks oli uurida haplogrupp H varieeruvust Kaukaasias ning selle
alusel analüüsida sealsete populatsioonide omavahelisi seoseid osas, mis haarab nende
„emaliine”. Selleks määrati armeenlaste, grusiinide, osseetide, nogaide, adõgeede,
abazade, karatšaide ja Dagestani rahvuste hulgast valitud 257 haplogrupp H mtDNA
genoomi kuuluvus üheksasse seni defineeritud subhaplogruppi. Lisaks neile üheksale
subhaplogrupile kirjeldati siin uus subhaplogrupp, mille esinemist vaadeldi lisaks
kirjeldatud Kaukaasia proovidele veel itaallaste, hispaanlaste ja Lähis Ida
populatsioonide hulgas. Kasutades statistilisi meetodeid võrreldi tulemusi nii Kaukaasia
populatsioonide/regioonide siseselt kui ka eelnevalt saadud analoogsete andmetega
Euroopa ja Aasia populatsioonide kohta. Lisaks sellele viidi läbi laiaulatuslikum
statistiline analüüs 5636 H haplogruppi kuuluva indiviidi mitokondriaalse DNA esimese
hüpervarieeruva regiooni nukleotiidse järjestuse põhjal.
Käesoleva töö tulemustest ilmneb, et H haplogrupp on Kaukaasias väga divergentne.
Tulenevalt subhaplogruppide sagedustest on võimalik leida märke migratsioonist nii
Kaukaasiasse (näiteks Nogaide H haplogrupi sarnasus Kesk-Aasia omaga ning
Karatšaide vastav sarnasus põhjapoolsete slaavi ning soome-ugri rahvaste H
haplogrupiga) kui ka Kaukaasiast välja (H2 ja H4 klaadide ekspansioon). Tulenevalt H
haplugrupi subhaplogruppide levikust, on võimalik üksteisest geneetiliselt eristada

59
populatsioone, mis jäävad Kaukaasia peaahelikust põhja ja lõunasse. Viimastele on
iseloomulik H1, sagedasima Euroopa H subhaplogrupi, vähene esinemine ning teiste,
mujal harvade subhaplogruppide (H4, H5) suurem sagedus. Subhaplogrupp H2 on
erakordselt sage uuritud Dagestani populatsioonides (27% H haplogruppi kuuluvatest
indiviididest) ning Karatšaide hulgas. Arvestades tema suurimat vanust Kaukaasia
populatsioonides (umbes 30,000 aastat) ning suhteliselt sagedast esinemist Ida-
Euroopas ning Kesk-Aasias, on võimalik järeldada, et selle klaadi ekspansiooni sai
alguse Kaukaasia piirkonnast. Subhaplogruppi H4 on varasemalt iseloomustatud suure
hulga kodeeriva regiooni mutatsioonide paiknemisega teda defineerival harul, mis
korreleerub suurema vanusega. Seega võib armeenlaste H haplogrupi geenitiiki, kus
vastav klaad omab suurimat suhtelist sagedust uuritud populatsioonides, iseloomustada
samuti suurema vanusega. Antud töös kirjeldati esmakordselt subhaplogruppi H15, mis
on kõige sagedasem Lähis Idas ja Kaukaasias ning mida leidub järjest harvemini
Euroopas lääne poole minnes.
H haplogrupi hüpervarieeruva regiooni andmed kinnitavad suure geneetilise diversiteedi
esinemist Kaukaasia populatsioonides, kus lisaks on palju selliseid haplotüüpe, mida
pole mujal kirjeldatud. H haplogrupi võrdlev analüüs Euraasia erinevates popu-
latsioonides näitab Kaukaasia populatsioonide suuremat lähedust Lähis Ida populatsi-
oonidele. Samas on Kaukaasia populatsioonide haplogrupp H geenitiigid kirjeldatavad
siiski tervikuna, sest nad moodustavad grupi, mis on eristatav teiste Euroopa ja Lähis-
Ida populatsioonide mtDNA valmitest. H haplogrupi hüpervarieeruva regiooni
polümorfismide põhjal on võimalik eristada omavahel Aasia ja Euroopa populatsioone.
Viimaste hulgas on täheldatavad aga kaks grupeeringut, mida võib tõlgendada kui
(vähemalt) kahe erineva jääaja järgse rekoloniseerimise raja olemasoluna.
Eelnevat kokku võttes võib seega järeldada, et H haplogrupi ekspansioon algas
tõenäoliselt Lõuna-Kaukaasiast, eeldatavasti Ülemise Paleoliitikumi varases, viimase
suure jääaja eelsel, perioodil. Siinkohal on oluline lisada, et arheoloogia andmeil toimus
Kaukasuse piirkonnas üleminek Keskmiselt Ülemisele Paleoliitikumile ca 32,000 –
35,000 aasta eest. See dateering, tuginedes otsestele arheoloogilistele andmetele, on
seega heas kooskõlas geneetilisest andmestikust tuleneva signaaliga haplogrupi H
ekspansioonist Kaukasuses ca 30,000 aasta eest.

60
ACKNOWLEDGEMENTS First of all I wish to thank my supervisors. Professor Richard Villems for creating all
possibilities for the current study and for critically reviewing the current thesis. I am
particularly indebted to Eva-Liis Loogväli for expert practical and theoretical
introduction to the field and instructions throughout this work.
I would like to express my gratitude to Professor Antonio Torroni for allowing me to
study and work in his laboratory in the University of Pavia, Italy, during the fall of 2003
(supported by EC Framework Programme grant GENERA, QLAM-2001-00455) and to
all staff members and students in Pavia, in particular to Alessandro Achilli. My special
thanks belong to Professor Elza Khusnutdinova, for an access to a large collection of
different DNA samples of the Caucasus area populations that I have used above.
Specific thanks to Ildus Kutuyev who has collected them, to him and Marina
Bermisheva, Katrin Kaldma, Ene Metspalu, Maere Reidla for providing me with data on
their early work on the Caucasus mtDNA variation, as well as to Toomas Kivisild, Oleg
Balanovsky, Kristiina Tambets, Larissa Damba, Jüri Parik, Maria Golubenko, Helle-
Viivi Tolk, Erwan Pennarun and others for sharing unpublished at that time “collective
data” on HVS-I sequences of mtDNA hg H.
I am indebted to Jaan Lind for expert technical help in DNA sequencing and I wish to
express deep gratitude towards all people working and studying at the Department of
Evolutionary Biology and Estonian Biocentre, for all kinds of help and for creating a
friendly and relaxed working atmosphere.
Finally, I wish to thank sincerely all anonymous voluntary donors of DNA samples used
in my study: without their generous gift, nothing would have been possible.

61
PUBLICATIONS Loogväli E.-L., U. Roostalu, B. Malyarchuk, M .V. Derenko, T. Kivisild, E. Metspalu,
K. Tambets, M. Reidla, H.-V. Tolk, J. Parik, E. Pennarun, S. Laos, A. Lunkina,
M. Golubenko, L. Barac, M. Pericic, O.P. Balanovsky, V. Gusar, E.K.
Khusnutdinova, V. Stepanov, V. Puzyrev, P. Rudan, E.V. Balanovska, E.
Grechanina, C. Richard, J.-P. Moisan, A. Chaventre, N.P. Anagnou, K.I. Pappa,
E.N. Michalodimitrakis, M. Claustres, M. Gölge, I. Mikerezi, E. Usanga, R.
Villems. Disuniting uniformity: a pied cladistic canvas of mtDNA
haplogroup H in Eurasia. Mol Biol Evol., accepted for publication

62
LITERATURE Caucasus Environment Outlook (CEO) 2002; www.gridtb.org/projects/CEO/index.htm
Ethnologue: Languages of the World, 2004; www.ethnologue.com
Allard M.W, K. Miller, M. Wilson, K. Monson and B. Budowle. 2002. Characterization of the Caucasian
haplogroups present in the SWGDAM forensic mtDNA dataset for 1771 human control region sequences.
Scientific Working Group on DNA Analysis Methods. J Forensic Sci 47:1215-1223
Al-Zahery N., O. Semino, G. Benuzzi, C. Magri, G. Passarino, A. Torroni and A.S. Santachiara-Benerecetti. 2003.
Y-chromosome and mtDNA polymorphisms in Iraq, a crossroad of the early human dispersal and of post-
Neolithic migrations. Mol Phyl Evol 28:458-472
Anderson S., A.T. Bankier, B.G. Barrell et al. (11 co-authors). 1981. Sequence and organization of the human
mitochondrial genome. Nature 290:457-465
Andrews R.M, I. Kubacka, P.F. Chinnery, R.N. Lightowlers, D.M. Turnbull and N. Howell. 1999. Reanalysis and
revision of the Cambridge reference sequence for human mitochondrial DNA. Nature Genet 23:147
Aris-Brosou S. and L. Excoffier. 1996. The impact of population expansion and mutation rate heterogeneity on DNA
sequence polymorphism. Mol Biol Evol 13:494-504
Arnaiz-Villena A., E. Gomez-Casado and J. Martinez-Laso. 2002. Population genetic relationships between
Mediterranean populations determined by HLA allele distribution and a historic perspective. Tiss Antig
60:111-121
Arsua J.L, V. Villaverde, R. Quam, A. Gracia, Lorenzo, C, I. Martinez and J.-M. Carretero. 2002. The Gravettian
occipital bone from the site of Malladetes (Barx, Valencia, Spain). J Hum Evol 43:381-393
Ballinger S.W, T.G. Schurr, A. Torroni, Y.Y. Gan, J.H. Hodge, K. Hassan, K.-H. Chen and D.C. Wallace. 1992.
Southeast Asian mitochondrial DNA analysis reveals genetic continuity of ancient mongoloid migrations.
Genetics 130:139-152
Bandelt H.-J., J. Alves-Silva, P.E.M. Guimaraes et al. (12 co-authors). 2001. Phylogeography of the human
mitochondrial haplogroup L3e: a snapshot of African prehistory and Atlantic slave trade. Ann Hum Genet
65:549-563
Bandelt H.-J., P. Forster and A. Röhl. 1999. Median-joining networks for inferring intraspecific phylogenies. Mol
Biol Evol 16:37-48
Bandelt H.-J., P. Forster, B.C. Sykes and M.B. Richards. 1995. Mitochondrial portraits of human populations using
median networks. Genetics 141:743-753
Barbujani G., G.N. Whitehead, G. Bertorelle and I. Nasidze. 1994. Testing hypotheses on processes of genetic and
linguistic change in the Caucasus. Hum Biol 66: 843-864
Bermisheva M.A, K. Tambets, R. Villems, E.K. Khusnutdinova. 2002. [Diversity of mitochondrial DNA haplogroups
in ethnic populations of the Volga-Ural region of Russia]. Mol Biologiya 36:990-1001
Bosch E., F. Calafell, D. Comas, P.J. Oefner, P.A. Underhill and J. Bertranpetit. 2001. High-resolution analysis of
human Y-chromosome variation shows a sharp discontinuity and limited gene flow between northwestern
Africa and the Iberian peninsula. Am J Hum Genet 68:1019-1029

63
Brown M.D, E. Starikovskaya, O. Derbeneva, S. Hosseini, J.C. Allen, I.E. Mikhailovskaya, R. Sukernik and D.C.
Wallace. 2002. The role of mtDNA background in disease expression: a new primary LHON mutation
associated with Western Eurasian haplogroup J. Hum Genet 110:130-138
Calafell F., P. Underhill, A. Tolun, D. Angelicheva and L. Kalaydjieva. 1996. From Asia to Europe: mitochondrial
DNA sequence variability in Bulgarians and Turks. Ann Hum Genet 60:35-49
Cali F., M.G. Le Roux, R. D'Anna, A. Flugy, G. De Leo, V. Chiavetta, G.F. Ayala and V. Romano. 2001. mtDNA
control region and RFLP data for Sicily and France. Int J Legal Med 114:229-231
Cann R.L, M. Stoneking and A.C. Wilson. 1987. Mitochondrial DNA and human evolution. Nature 325:31-36
Caramelli D., C. Lalueza-Fox, C. Vernesi et al. (8 co-authors). 2003. Evidence for a genetic discontinuity between
Neandertals and 24,000-year-old anatomically modern Europeans. Proc Natl Acad Sci USA 100:6593-6597
Cavelier L., E. Jazin, P. Jalonen and U. Gyllensten. 2000. MtDNA substitution rate and segregation of heteroplasmy
in coding and noncoding regions. Hum Genet 107:45-50
Chen Y.-S., A. Olckers, G. Schurr, A.M. Kogelnik, K. Huoponen and D.C. Wallace. 2000. mtDNA variation in the
south African Kung and Khwe and their genetic relationships to other African populations. Am J Hum
Genet 66:1362-1383
Chen Y.-S., A. Torroni, L. Excoffier, A.S. Santachiara-Benerecetti and D. Wallace. 1995. Analysis of mtDNA
variation in African population reveals the most ancient of all human continent-specific haplogroups. Am J
Hum Genet 57:133-149
Churchill S.E. and F.H. Smith. 2000. Makers of the Early Aurignacian of Europe. Yearbook of Physical Anthropol
49:61-115
Clark J.D, Y. Beyene, G. Woldegabriel et al. (10 co-authors). 2003. Stratigraphic, chronological and behavioural
contexts of Pleistocene Homo sapiens from Middle Awash, Ethiopia. Nature 423:747-752
Cohen V.Y. and V.N. Stepanchuk. 1999. Late Middle and Early Upper Paleolithic evidence from the East European
Plain and Caucasus: a new look at variability, interactions, and transitions. J World Prehist 13:265-318
Comas D., F. Calafell, E. Mateu, A. Peréz-Lezaun, J. Bertranpetit. 1996. Geographic variation in human
mitochondrial DNA control region sequence: the population history of Turkey and its relationship to the
European populations. Mol Biol Evol 13:1067-1077
Comas D., F. Calafell, E. Mateu et al. (9 co-authors). 1998. Trading genes along the Silk Road: mtDNA sequences
and the origin of Central Asian populations. Am J Hum Genet 63:1824-1838
Conard N.J. and M. Bolus. 2003. Radiocarbon dating the appearance of modern humans and timing of cultural
innovations in Europe: new results and new challenges. J Hum Evol 44:331-371
Corte-Real H.B, V.A. Macaulay, M.B. Richards, G. Hariti, M.S. Issad, A. Cambon-Tomsen, S. Papiha, J. Bertranpetit
and B.C. Sykes. 1996. Genetic diversity in the Iberian Peninsula determined from mitochondrial sequence
analysis. Ann Hum Genet 60:331-350
Crespillo M., J.A. Luque, M. Paredes, R. Fernandéz, E. Ramirez and J.L. Valverde. 2000. Mitochondrial DNA
sequences for 118 individuals from northeastern Spain. Int J Legal Med 114:130-132
de Lumley H., D. Lordkipanidze, G. Féraud, T. Garcia, C. Perrenoud, C. Falguères, J. Gagnepain, T. Saos, P.
Voinchet. 2002. Datation par la méthode 40Ar / 39Ar de la couche de cendres volcaniques (couche VI) de
Dmanissi Géorgie) qui a livré des restes d’hominidés fossiles de 1,81 Ma. C R Palevol 1:181-189
Derbeneva O.A, E.B. Starikovskaya, N.V. Volodko, D.C. Wallace and R.I. Sukernik. 2002a. [Mitochondrial DNA
variation in the Kets and Nganasans and its implications for the initial peopling of northern Eurasia].
Genetika 38:1554-1560

64
Derbeneva O.A, E.B. Starikovskaya, D.C. Wallace and R.I. Sukernik. 2002b. Traces of early Eurasians in the Mansi
of Northwest Siberia revealed by mitochondrial DNA analysis. Am J Hum Genet 70:1009-1014
Derenko M.V, T. Grzybowski, B.A. Malyarchuk et al. (8 co-authors). 2003. Diversity of mitochondrial DNA
lineages in South Siberia. Ann Hum Genet 67:391-411
Derenko M.V, B.A. Malyarchuk, G.A. Denisova et al. 2002a. (8 co-authors). [Molecular genetic differentiation of the
ethnic populations of South and East Siberia based on mitochondrial DNA polymorphisms]. Genetika
38:1409-1416
Derenko M.V, B.A. Malyarchuk and I.A. Zakharov. 2002b. [Origin of Caucasoid-specific mitochondrial DNA
lineages in the ethnic groups of the Altai-Sayan region]. Genetika 38:1292-1297
Di Rienzo A. and A.C. Wilson. 1991. Branching pattern in the evolutionary tree for human mitochondrial DNA. Proc
Natl Acad Sci USA 88:1597-1601
Dimo-Simonin N., F. Grange, F. Taroni, C. Brandt-Casadevall and P. Mangin. 2000. Forensic evaluation of mtDNA
in a population from south west Switzerland. Int J Legal Med 113:89-97
Dolukhanov, PM. 1997. The Pleistocene-Holocene transition in northern Eurasia: envisonmental changes and human
adaptations. Quat Int 41/42: 181-191
Duarte C., J. Mauricio, P.B. Pettitt, P. Souto and E. Trinkhaus. 1999. The early upper paleolithic human skeleton
from the Abrigo do Lagar Velho (Portugal) and modern human emergence in Iberia. Proc Natl Acad Sci
USA 96:7604-7609
Dubut V., L. Chollet, P. Murail, F. Cartault, E. Béraud-Colomb, M. Serre, N. Mogentale-Profizi. 2004. mtDNA
polymorphisms in five French groups: importance of regional sampling. Eur J Hum Genet 12:293-300
Dupuy B.M. and B. Olaisen. 1996. mtDNA sequences in Norwegian Saami and main populations. Adv Forensic
Homogen 6:23-25
Fedorova S.A, M.A. Bermisheva, R. Villems, N.R. Maksimova and E.K. Khusnutdinova. 2003. Analysis of
Mitochondrial DNA Lineages in Yakuts. Mol Biologiya 37:643-653
Finnilä S., M.S. Lehtonen and K. Majamaa. 2001. Phylogenetic network for European mtDNA. Am J Hum Genet
68:1475-1484
Forster P. 2004. Ice Ages and the mitochondrial DNA chronology of human dispersals: a review. Phil Trans R Soc
Lond B 359:255-264
Forster P., R. Harding, A. Torroni and H.J. Bandelt. 1996. Origin and evolution of Native American mtDNA
variation: a reappraisal. Am J Hum Genet 59:935-945
Forster P., A. Torroni, C. Renfrew and A. Röhl. 2001. Phylogenetic star contraction applied to Asian and Papua
mtDNA evolution. Mol Biol Evol 18:1864-1881
Giles R.E, H. Blanc, H.M. Cann and D.C. Wallace. 1980. Maternal inheritance of human mitochondrial DNA. Proc
Natl Acad Sci USA 77:6715-6719
Golovanova L.V. and V.B. Doronichev. 2003. The Middle Paleolithic of the Caucasus. J World Prehist 17:71-140
Gray R.D. and Q.D. Atkinson. 2003. Language-tree divergence times support the Anatolian theory of Indo-European
origin. Nature 426:435-439
Greppin J.A.C. and I.M. Diakonoff. 1991. Some effects of the Hurro-Urartian people and their languages upon the
earliest Armenians. J Am Orient Soc 111:720-730
Harpending H.C, M.A. Batzer, M. Gurven, L.B. Jorde, A.R. Rogers and S.T. Sherry. 1998. Genetic traces of ancient
demography. Proc Natl Acad Sci USA 95:1961-1967
Hasegawa M., A. Di Rienzo, T.D. Kocher and A.C. Wilson. 1993. Toward a more accurate time scale for the human
mitochondrial DNA tree. J Mol Evol 37:347-354

65
Hastings I.M. 1992. Population genetic aspects of deleterious cytoplasmic genomes and their effect on the evolution
of sexual reproduction. Genet Res 59:215-225
Helgason A., E. Hickey, S. Goodacre, V. Bosnes, K. Stefansson, R. Ward and B. Sykes. 2001. mtDNA and the
islands of the North Atlantic: estimating the proportions of Norse and Gaelic ancestry. Am J Hum Genet
68:723-737
Helgason A., S. Sigurdardottir, J.R. Gulcher, R. Ward and K. Stefansson. 2000. mtDNA and the origin of the
Icelanders: deciphrering signals of recent population history. Am J Hum Genet 66:999-1016
Herrnstadt C., J.L. Elson, E. Fahy et al. (8 co-authors). 2002. Reduced-median-network analysis of complete
mitochondrial DNA coding-region sequences for the major African, Asian, and European haplogroups. Am
J Hum Genet 70:1152-1171
Heyer E., E. Zietkiewicz, A. Rochowski, V. Yotova, J. Puymirat and D. Labuda. 2001. Phylogenetic and familial
estimates of mitochondrial substitution rates: study of control region mutations in deep-rooting pedigrees.
Am J Hum Genet 69:1113-1126
Hofmann S., M. Jaksch, R. Bezold, S. Mertens, S. Aholt, A. Paprotta and K.-D. Gerbitz. 1997. Population genetics
and disease susceptibility: characterization of central European haplogroups by mtDNA gene mutations,
correlation with D loop variants and association with disease. Hum Mol Genet 6:1835-1846
Horai S., K. Hayasaka, R. Kondo, K. Tsugane and N. Takahata. 1995. Recent African origin of modern humans
revealed by complete sequences of hominoid mitochondrial DNAs. Proc Natl Acad Sci USA 92:532-536
Housley R.A, C.S. Gamble, M. Street and P. Pettitt. 1997. Radiocarbon evidence for the Lateglacial human
recolonization of Northern Europe. Proc Prehist Soc 63:25-54
Howell N., I. Kubacka and D.A. Mackey. 1996. How rapidly does the human mitochondrial genome evolve? Am J
Hum Genet 59:501-509
Howell N., R.J. Oostra, P.A. Bolhuis, L. Spruijt, L.A. Clarke, D.A. Mackey, G. Preston and C. Herrnstadt. 2003.
Sequence analysis of the mitochondrial genomes from Dutch pedigrees with Leber hereditary optic
neuropathy. Am J Hum Genet 76:1460-1469
Ingman M., H. Kaessmann, S. Pääbo and U. Gyllensten. 2000. Mitochondrial genome variation and the origin of
modern humans. Nature 408:708-713
Kittles R.A, A.W. Bergen, M. Urbanek, M. Virkkunen, M. Linnoila, D. Goldman and J.C. Long. 1999. Autosomal,
mitochondrial, and Y chromosome DNA variation in Finland: evidence for a male-specific bottleneck. Am
J Phys Anthropol 108:381-399
Kivisild T., M.J. Bamshad, K. Kaldma et al. (12 co-authors). 1999a. Deep common ancestry of Indian and western-
Eurasian mitochondrial DNA lineages. Curr Biol 9:1331-1334
Kivisild T., K. Kaldma, M. Metspalu, J. Parik, S.S. Papiha, R. Villems. 1999b. The place of the Indian mtDNA
variants in the global network of maternal lineages and the peopling of the Old World. In: Deka R, Papiha
S.S, Chakraborty R (eds) Genomic Diversity: Applications in Human Population Genetics. Kluwer
Academic/Plenum Publishers, p 135-152
Kivisild T., S.S. Papiha, S. Rootsi et al. (17 co-authors). 2000. An Indian ancestry: a key for understanding human
diversity in Europe and beyond. In: Renfrew C, Boyle K (eds) Archaeogenetics: DNA and the population
prehistory of Europe. McDonald Institute Monographs, Cambridge, p 267-275
Kivisild T., S. Rootsi, M. Metspalu et al. (15 co-authors). 2003. The genetic heritage of the earliest settlers persists
both in Indian tribal and caste populations. Am J Hum Genet 72:313-332
Kivisild T., H.-V. Tolk, J. Parik, Y. Wang, S.S. Papiha, H.-J. Bandelt and R. Villems. 2002. The emerging limbs and
twigs of the East Asian mtDNA tree. Mol Biol Evol 19:1737-1751

66
Kolman C.J, N. Sambuughin and E. Bermingham. 1996. Mitochondrial DNA analysis of mongolian populations and
implications for the origin of New World founders. Genetics 142:1321-1334
Kong Q.-P., Y.-G. Yao, C. Sun, H.-J. Bandelt, C.-L. Zhu and Y.-P. Zhang. 2003. Phylogeny of East Asian
mitochondrial DNA lineages inferred from complete sequences. Am J Hum Genet 73:671-676
Kozlowski J.K. 1992. The Balkans in the Middle and Upper Paleolithic: the gate to Europe or a cul-de-sac? Proc
Prehistoric Soc 58:1-20
Kozlowski J.K. and M. Otte. 2000. La formation de l'Aurignacien en Europe. L'Anthropologie 104:3-15
Krings M., H. Geisert, R.W. Schmitz, H. Krainitzki and S. Pääbo. 1999a. DNA sequence of the mitochondrial
hypervariable region II from the Neandertal type specimen. Proc Natl Acad Sci USA 96:5581-5585
Krings M., A.H. Salem, K. Bauer et al. (10 co-authors). 1999b. mtDNA analysis of Nile river valley populations: A
genetic corridor or a barrier to migration? Am J Hum Genet 64:1166-1176
Kristiansen K. 1998. Europe before history. Cambridge University Press, Cambridge
Lahermo P., A. Sajantila, P. Sistonen, M. Lukka, P. Aula, L. Peltonen and M.L. Savontaus. 1996. The genetic
relationship between Finns and the Finnish Saami (Lapps): analysis of nuclear DNA and mtDNA. Am J
Hum Genet 58:1309-1322
Larruga J.M, F. Diez, F.M. Pinto, C. Flores and A.M. Gonzales. 2001. Mitochondrial DNA characterisation of
European isolates: The Maragatos from Spain. Eur J Hum Genet 9:708-716
Larsson N.-G. and D.A. Clayton. 1995. Molecular genetic aspects of human mitochondrial disorders. Ann Rev Genet
29:151-178
Lightowlers R.N, P.F. Chinnery, D.M. Turnbull and N. Howell. 1997. Mammalian mitochondrial genetics: heredity,
heteroplasmy and disease. Trends Genet 13:450-455
Loogväli E.-L., U. Roostalu, B.A. Malyarchuk et al. (30 co-authors). accepted. Disuniting uniformity: a pied cladistic
canvas of mtDNA haplogroup H in Eurasia. Mol Biol Evol
Lum J.K. and R.L. Cann. (1998) mtDNA and language support a common origin of Micronesians and Polynesians in
Island Southeast Asia. Am J Phys Anthropol 105:109-119
Lutz S., H.-J. Weisser, J. Heizmann and S. Pollak. 1998. Location and frequency of polymorphic positions in the
mtDNA control region of individuals from Germany. Int J Legal Med 111:67-77
Maca-Meyer N., A.M. Gonzales, J.M. Larruga, C. Flores and V.M. Cabrera. 2001. Major genomic mitochondrial
lineages delineate early human expansions. BMC Genetics 2:13
Maca-Meyer N., A.M. Gonzalez, J. Pestano, C. Flores, J.M. Larruga and V.M. Cabrera. 2003. Mitochondrial DNA
transit between West Asia and North Africa inferred from U6 phylogeography. BMC Genetics 4:15
Macaulay V.A, M.B. Richards, E. Hickey, E. Vega, F. Cruciani, V. Guida, R. Scozzari, B. Bonné-Tamir, B. Sykes
and A. Torroni. 1999. The emerging tree of west Eurasian mtDNAs: a synthesis of control-region
sequences and RFLPs. Am J Hum Genet 64:232-249
Mackey D.A, R.-J. Oostra, T. Rosenberg et al. (11 co-authors). 1996. Primary pathogenicmitochondrial DNA
mutations in multigeneration pedigrees with Leber hereditary optic neuropathy. Am J Hum Genet 59:481-
485
Malyarchuk B.A. and M.V. Derenko. 2001a. Mitochondrial DNA variability in Russians and Ukrainians:
Implications to the origin of the Eastern Slavs. Ann Hum Genet 65:63-78
Malyarchuk B.A. and M.V. Derenko. 2001b. [Variation of human mitochondrial DNA: distribution of hot spots in
hypervariable segment I of the major noncoding region]. Genetika 37:991-1001
Malyarchuk B.A, T. Grzybowski, M.V. Derenko, J. Czarny, K. Drobnic and D. Miscicka-Sliwka. 2003.
Mitochondrial DNA Variability in Bosnians and Slovenians. Ann Hum Genet 67:412-425

67
Malyarchuk B.A, T. Grzybowski, M.V. Derenko, J. Czarny, M. Wozniak and D. Miscicka-Sliwka. 2002.
Mitochondrial DNA variability in Poles and Russians. Ann Hum Genet 66:261-283
Meinila M., S. Finnila and K. Majamaa. 2001. Evidence for mtDNA admixture between the Finns and the Saami.
Hum Hered 52:160-170
Merrywether D.A, A.G. Clark, S.W. Ballinger, T.G. Schurr, H. Soodyall, T. Jenkins, S.T. Sherry and D.C. Wallace.
1991. The structure of human mitochondrial DNA variation. J Mol Evol 33:543-555
Metspalu E., T. Kivisild, K. Kaldma, J. Parik, M. Reidla, K. Tambets and R. Villems. 1999. The Trans-Caucasus and
the expansion of the Caucasoid-specific human mitochondrial DNA. In: Deka R, Papiha S, Chakraborty R
(eds) Genomic Diversity: Applications in Human Population Genetics. Kluwer Academic/Plenum
Publishers, New York, p 121-133
Meyer S., G. Weiss and A. von Haesler. 1999. Pattern of nucleotide substitution and rate heterogeneity in the
hypervariable regions I and II of human mtDNA. Genetics 152:1103-1110
Mishmar D., E. Ruiz-Pesini, P. Golik et al. (10 co-authors). 2003. Natural selection shaped regional mtDNA variation
in humans. Proc Natl Acad Sci USA 100:171-176
Nasidze I., E.Y.S. Ling, D. Quinque et al. (14 co-authors). 2004. Mitochondrial DNA and Y-chromosome variation
in the Caucasus. Ann Hum Genet. online early
Nasidze I., G.M. Risch, M. Robichaux, S.T. Sherry, M.A. Batzer and M. Stoneking. 2001. Alu insertion
polymorphisms and the genetic structure of human populations from the Caucasus. Eur J Hum Genet
9:267-272
Nasidze I., T. Sarkisian, A. Kerimov and M. Stoneking. 2003. Testing hypothesis of language replacement in the
Caucasus: evidence from the Y-chromosome. Hum Genet 112:255-261
Nasidze I. and M. Stoneking. 2001. Mitochondrial DNA variation and language replacements in the Caucasus. Proc R
Soc Lond B 268:1197-1206
Nebel A., D. Filon, B. Brinkmann, P.P. Majumder, M. Faerman and A. Oppenheim. 2001. The Y chromosome pool
of Jews as part of the genetic landscape of the Middle East. Am J Hum Genet 69:1095-1112
Nei M. 1987. Molecular evolutionary genetics. Columbia Universiy Press, New York, NY, USA
Nioradze M.G. and M. Otte. 2000. Paleolithique superieur de Georgie. L'Anthropologie 104:265-300
Olszewski D.I. and H.L. Dibble. 1994. The Zagros Aurignacian. Curr Anthropol 35:68-75
Opdal S.H, T.O. Rognum, A. Vege, A.K. Stave, B.M. Dupuy and T. Egeland. 1998. Increased number of
substitutions in the D-loop of mitochondrial DNA in the sudden infant death syndrome. Acta Paediatr
87:1039-1044
Orekhov V., A. Poltoraus, L.A. Zhivotovsky, V. Spitsyn, V. Ivanov and N. Yankovsky. 1999. Mitochondrial DNA
sequence diversity in Russians. FEBS Letters 445:197-201
Otte M. and A. Derevianko. 1996. Transformations techniques au Paleolithique de l'Altai (Siberie). L'Anthropol et
Prehist 107:131-143
Ovchinnikov I., A. Götherström, G.P. Romanova, V.M. Kharitonov, K. Liden, W. Goodwin . 2000. Molecular
analysis of Neanderthal DNA from the northern Caucasus. Nature 404:490-493
Parsons T.J, D.S. Muniec, K. Sullivan et al. (8 co-authors). 1997. A high observed substitution rate in the human
mitochondrial DNA control region. Nat Genet 15:363-368
Passarino G., G.L. Cavalleri, A.A. Lin, L.L. Cavalli-Sforza, A.-L. B¸rresen-Dale and P.A. Underhill. 2002. Different
genetic components in the Norwegian population revealed by the analysis of mtDNA and Y chromosome
polymorphisms. Eur J Hum Genet 10:521-529

68
Pereira L., V. Macaulay, A. Torroni, R. Scozzari, M.-J. Prata and A. Amorim. 2001. Prehistoric and historic traces in
the mtDNA of Mozambique: insights into the Bantu expansions and the slave trade. Ann Hum Genet
65:439-458
Pereira L., M.J. Prata and A. Amorim. 2000. Diversity of mtDNA lineages in Portugal: not a genetic edge of
European variation. Ann Hum Genet 64:491-506
Pereira L., M. Richards, A. Alonso, C. Albarran, O. Garcia, V. Macaulay and A. Amorim. 2004. Subdividing mtDNA
haplogroup H based on coding-region polymorphisms − a study in Iberia. Int Congr Series 1261: 416-418
Pesole G., C. Gissi, A. De Chirico and C. Saccone. 1999. Nucleotide substitution rate of mammalian mitochondrial
genomes. J Mol Evol 48:427-434
Pinto F., A.M. Gonzalez, M. Hernandez, J.M. Larruga and V.M. Cabrera. 1996. Genetic relationship between the
Canary Islanders and their African and Spanish ancestors inferred from mitochondrial DNA sequences.
Ann Hum Genet 60:321-330
Pult I., A. Sajantila, J. Simanainen, O. Georgiev, W. Schaffner and S. Paabo. 1994. Mitochondrial DNA sequences
from Switzerland reveal striking homogeneity of European populations. Biol Chem Hoppe Seyler 375:837-
840
Qian Y.P, Z.-T. Chu, Q. Dai, C.-D. Wei, J.Y. Chu, A. Tajima, S. Horai. 2001. Mitochondrial DNA polymorphisms in
Yunnan nationalities in China. J Hum Genet 46:211-220
Quintana-Murci L., R. Chaix, S. Wells et al. (14 co-authors). 2004. Where West meets East: The complex mtDNA
landscape of the Southwest and Central Asian corridor. Am J Hum Genet 74:827-845
Quintana-Murci L., O. Semino, H.-J. Bandelt, G. Passarino, K. McElreavey and A.S. Santachiara-Benerecetti. 1999.
Genetic evidence of an early exit of Homo sapiens sapiens from Africa through eastern Africa. Nature
Genet 23:437-441
Quintans B., V. Alvarez-Iglesias, A. Salas, C. Phillips, M.V. Lareu and A. Carracedo. 2004. Typing of mitochondrial
DNA coding region SNPs of forensic and anthropological interest using SNaPshot minisequencing. For Sci
Int 140:251-257
Rando J., F. Pinto, A.M. Gonzalez, M. Hernandez, J.M. Larruga, V.M. Cabrera and H.-J. Bandelt. 1998.
Mitochondrial DNA analysis of Northwest African populations reveals genetic exchanges with European,
Near-Eastern, and sub-Saharan populations. Ann Hum Genet 62:531-550
Redd A.J, N. Takezaki, S.T. Sherry, S.T. McGarvey, A.S. Sofro and M. Stoneking (1995) Evolutionary history of the
COII/tRNALys intergenic 9 base pair deletion in human mitochondrial DNAs from the Pacific. Mol Biol
Evol 12:604-615
Reidla M., T. Kivisild, E. Metspalu et al. (40 co-authors). 2003. Origin and diffusion of mtDNA haplogroup X. Am J
Hum Genet 73:1178-1190
Renfrew C. 1991. Before Babel: speculations on the origins of linguistic diversity. Camb Archaeol J 1:13-23
Richards M., H. Corte-Real, P. Forster, V. Macaulay, H. Wilkinson-Herbots, A. Demaine, S. Papiha, R. Hedges, H.-J.
Bandelt and B. Sykes. 1996. Paleolithic and neolithic lineages in the European gene pool. Am J Hum Genet
59:185-203
Richards M.B, V.A. Macaulay, H.-J. Bandelt and B.C. Sykes. 1998. Phylogeography of mitochondrial DNA in
western Europe. Ann Hum Genet 62:241-260
Richards M., V. Macaulay, E. Hickey et al. (34 co-authors). 2000. Tracing European founder lineages in the Near
Eastern mtDNA pool. Am J Hum Genet 67:1251-1276
Rousselet F. and P. Mangin. 1998. Mitochondrial DNA polymorphisms: a study of 50 French Caucasian individuals
and application to forensic casework. Int J Legal Med 111:292-298

69
Roychoudhury S., S. Roy, B. Dey et al. (10 co-authors). 2000. Fundamental genomic unity of ethnic India is revealed
by analysis of mitochondrial DNA. Curr Sci 79:1182-1192
Saillard J., P. Forster, N. Lynnerup, H.-J. Bandelt and S. Norby. 2000. mtDNA variation among Greenland Eskimos:
the edge of the Beringian expansion. Am J Hum Genet 67:718-726
Sajantila A., P. Lahermo, T. Anttinen et al. (10 co-authors). 1995. Genes and languages in Europe: and analysis of
mitochondrial lineages. Genome Res 5:42-52
Salas A., M. Richards, T. De la Fe, M.-V. Lareu, B. Sobrino, P. Sanchez-Diz, V. Macaulay and A. Carracedo. 2002.
The making of the african mtDNA landscape. Am J Hum Genet 71:1082-1111
Salas A., M. Richards, M.-V. Lareu, R. Scozzari, A. Coppa, A. Torroni, V. Macaulay and A. Carracedo. 2004. The
African diaspora: mitochondrial DNA and the Atlantic slave trade. Am J Hum Genet 74:454-465
Sánchez-Velasco and P. F. Leyva-Cobián. 2001. The HLA class I and class II allele frequencies studied at the DNA
level in the Svanetian population (Upper Caucasus) and their relationships to Western European
populations. Tiss Antig 58:223-233
Schneider S. and L. Excoffier. 1999. Estimation of past demographic parameters from the distribution of pairwise
differences when the mutation rates vary among sites: applications to human mitochondrial DNA. Genetics
152:1079-1089
Schneider S., D. Roessli and L. Excoffier. 2000. Arlequin ver. 2.000: A software for population genetics data
analysis. Genetics and Biometry Laboratory, University of Geneva, Switzerland.
Schurr T.G, R.I. Sukernik, Y.B. Starikovskaya and D.C. Wallace. 1999. Mitochondrial DNA variation in Koryaks
and Itelmen: population replacement in the Okhotsk Sea–Bering Sea region during the Neolithic. Am J
Phys Anthropol 108:1-39
Schurr T.G. and D.C. Wallace. 2002. Mitochondrial DNA diversity in Southeast Asian populations. Hum Biol
74:431-452
Schwartz M. and J. Vissing. 2002. Paternal inheritance of mitochondrial DNA. New Engl J Med 347:576-580
Semino O., A.S. Santachiara-Benerecetti, F. Falaschi, L.L. Cavalli-Sforza and P.A. Underhill. 2002. Ethiopians and
Khoisan share the deepest clades of the human Y-chromosome phylogeny. Am J Hum Genet 70:265-268
Sigurdardottir S., A. Helgason, J.R. Gulcher, K. Stefansson and P. Donnelly. 2000. The mutation rate in the human
mtDNA control region. Am J Hum Genet 66:1599-1609
Soodyall H., T. Jenkins, A. Mukherjee, E. du Toit, D.F. Roberts and M. Stoneking. 1997. The founding
mitochondrial DNA lineages of Tristan da Cunha Islanders. Am J Phys Anthropol 104:157-166
Starikovskaya Y.B., R.I. Sukernik, T.G. Schurr, A.M. Kogelnik and D.C. Wallace. 1998. mtDNA diversity in
Chukchi and Siberian Eskimos: implications for the genetic history of ancient Beringia and the peopling of
the New World. Am J Hum Genet 63:1473-1491
Stevanovitch A., A. Gilles, E. Bouzaid, R. Kefi, F. Paris, R.P. Gayraud, J.L. Spadoni, F. El-Chenawi and E. Beraud-
Colomb. 2003. Mitochondrial DNA sequence diversity in a sedentary population from Egypt. Ann Hum
Genet 68:23-39
Stringer C.B. and P. Andrews. 1988. Genetic and fossil evidence for the origin of modern humans. Science 239:1263-
1268
Sutovsky P., K. Van Leyen, T. McCauley, B.N. Day and M. Sutovsky. 2004. Degradation of paternal mitochondria
after fertilization: implications for heteroplasmy, assisted reproductive technologies and mtDNA
inheritance. Reprod Biomed Online 8:24-33
Sykes B, A. Leiboff, J. Low-Beer, S. Tetzner and M. Richards. (1995) The origins of the Polynesians: an
interpretation from mitochondrial lineage analysis. Am J Hum Genet 57:1463-1475

70
Taberlet P., L. Fumagalli, A.-G. Wust-Saucy and J.-F. Cosson. 1998. Comparative phylogeaography and postglacial
colonization routes in Europe. Mol Ecol 7:453-464
Tajima D. 1983. Evolutionary relationship of DNA sequences in finite populations. Genetics 105:437-460
Tajima D. 1989. Statistical method for testing the neutral mutation hypothesis by DNA polymorphism. Genetics
123:585-595
Takahata N., S.-H. Lee and Y. Satta. 2001. Testing multiregionality of modern human origins. Mol Biol Evol 18:172-
183
Tambets K., T. Kivisild, E. Metspalu et al. (10 co-authors). 2000a. The topology of the maternal lineages of the
Anatolian and Trans-Caucasus populations and the peopling of Europe: some preliminary considerations.
In: Renfrew C, Boyle K (eds) Archaeogenetics: DNA and the Population Prehistory of Europe, Cambridge,
p 219-235
Tambets K., H-V. Tolk, T. Kivisild et al. (14 co-authors). 2000b. Complex signals for population expansions in
Europe and beyond. In: Bellwood P, Renfrew C (eds). Examining the farming/language dispersal
hypothesis. McDonald Institute Monographs, Cambridge, p 449-457
Tamura K. and M. Nei . 1993. Estimation of the number of nucleotide substitutions in the control region of
mitochondrial DNA in humans and chimpanzees. Mol Biol Evol 10:512-526
Tarasov P.E, V.S. Volkova, T. WebbIII et al. (10 co-authors). 2000. Last glacial maximum biomes reconstructed
from pollen and plant macrofossil data from northern Eurasia. J Biogeogr 27:609-620
Thompson W.E, J. Ramalho-Santos and P. Sutovsky . 2003. Ubiquitination of prohibitin in mammalian sperm
mitochondria: possible roles in the regulation of mitochondrial inheritance and sperm quality control. Biol
Reprod 69:254-260
Torroni A., H.-J. Bandelt, L. D'Urbano et al. (8 co-authors). 1998. mtDNA analysis reveals a major Late Paleolithic
population expansion from southwestern to northeastern Europe. Am J Hum Genet 62:1137-1152
Torroni A., H.-J. Bandelt, V. Macaulay et al. (30 co-authors). 2001a. A signal, from human mtDNA, of postglacial
recolonization in Europe. Am J Hum Genet 69:844-852
Torroni A., F. Cruciani, C. Rengo et al. (12 co-authors). 1999. The A1555G mutation in the 12S rRNA gene of
human mtDNA: recurrent origins and founder events in families affected by sensorineural deafness. Am J
Hum Genet 65:1349-1358
Torroni A., K. Huoponen, P. Francalacci, M. Petrozzi, I. Morelli, R. Scozzari, D. Obinu, M.-L. Savontaus and D.C.
Wallace. 1996. Classification of European mtDNAs from an analysis of three European populations.
Genetics 144:1835-1850
Torroni A., M.T. Lott, M.F. Cabell, Y.S. Chen, L. Lavergne and D.C. Wallace . 1994. mtDNA and the origin of
Caucasians: identification of ancient Caucasian-specific haplogroups, one of which is prone to a recurrent
somatic duplication in the D-loop region. Am J Hum Genet 55:760-776
Torroni A., M. Petrozzi, L. D'Urbano et al. (9 co-authors). 1997. Haplotype and phylogenetic analysis suggest that
one European-specific mtDNA background plays a role in the expression of Leber hereditary optic
neuropathy by increasing the penetrance of the primary mutations 11778 and 14484. Am J Hum Genet
60:1107-1121
Torroni A., C. Rengo, V. Guida et al. (9 co-authors). 2001b. Do the four clades of the mtDNA Haplogroup L2 evolve
at different rates? Am J Hum Genet 69:1348-1356
Torroni A., R. I. Sukernik, T.G. Schurr, Y.B. Starikorskaya, M.F. Cabell, M.H. Crawford, A.G. Comuzzie and D.C.
Wallace. 1993. mtDNA variation of aboriginal Siberians reveals distinct genetic affinities with Native
Americans. Am J Hum Genet 53:591-608

71
Tulloss R. 1997. Assessment of Similarity Indices for Undesirable Properties and a new Tripartite Similarity Index
Based on Cost Functions. In: Palm M, Chapela I (eds) Mycology in Sustainable Development: Expanding
Concepts, Vanishing Borders. Parkway Publishers, Boone, North Carolina, p 122-143
Underhill P.A, L. Jin, A.A. Lin, S.Q. Mehdi, T. Jenkins, D. Vollrath, R.W. Davis, L.L. Cavalli-Sforza and P.J.
Oefner. 1997. Detection of numerous Y chromosome biallelic polymorphisms by denaturing high-
performance liquid chromatography. Genome Res 7:996-1005
Vigilant L., M. Stoneking, H. Harpending, K. Hawkes and A.C. Wilson . 1991. African populations and the evolution
of mitochondrial DNA. Science 253:1503-1507
Villaverde V., J.E. Aura and C.M. Barton. 1998. The Upper Paleolithic in Mediterranean Spain: A Review of Current
Evidence. J World Prehist 12:121-198
Vishnyatsky L.B. 1999. The Paleolithic of Central Asia. J World Prehist 13:69-122
Wallace D.C. 1995. Mitochondrial DNA variation in human evolution, degenerative disease, and aging. Am J Hum
Genet 57:201-223
Wallace D.C., M.D. Brown and M.T. Lott. 1999. Mitochondrial DNA variation in human evolution and disease.
Gene 238:211-230
Ward R.H, B.L. Frazier, K. Dew-Jager and S. Pääbo. 1991. Extensive mitochondrial diversity within a single
Amerindian tribe. Proc Natl Acad Sci USA 88:8720-8724
Watson E., K. Bauer, R. Aman, G. Weiss, A. von Haeseler and S. Pääbo. 1996. mtDNA sequence diversity in Africa.
Am J Hum Genet 59:437-444
Watterson G. 1975. On the number of segregating sites in genetical models without recombination. Theor Popul Biol
7:256-276
Weale M.E, L. Yepiskoposyan, R.F. Jager, N. Hovhannisyan, A. Khudoyan, O. Burbage-Hall, N. Bradman and M.G.
Thomas. 2001. Armenian Y chromosome haplotypes reveal strong regional structure within a single ethno-
national group. Hum Genet 109:659-674
Wolpoff M.H, J. Hawks and R. Caspari. 2000. Multiregional, not multiple origins. Am J Phys Anthropol 112:129-
136
Wolpoff M.H, X.Z. Wu and A.G. Thorne. 1984. Modern Homo sapiens origins: a general theory of hominid
evolution involving the fossil evidence from East Asia. In: Smith F, Spencer F (eds) The origins of modern
humans: a world survey of the fossil evidence. Liss, New York, p 411-483
Yalcinkaya I. and M. Otte . 2000. Debut du Paleolithique superieur a Karain (Turquie). L'Anthropologie 104:51-62
Yao Y.-G., Q.-P. Kong, H.-J. Bandelt, T. Kivisild and Y.-P. Zhang. 2002. Phylogeographic differentiation of
mitochondrial DNA in Han Chinese. Am J Hum Genet 70:635-651
Yao Y.-G., X.-M. Lü, H.-R. Luo, W.-H. Li and Y.-P. Zhang. 2000. Gene admixture in the Silk Road region of China-
evidence from mtDNA and melanocortin 1 receptor polymorphism. Genes Genet Syst 75:173-178
Yao Y.-G. and Y.-P. Zhang. 2002. Phylogeographic analysis of mtDNA variation in four ethnic populations from
Yunnan Province: new data and a reappraisal. J Hum Genet 47:311-318
Yu N., F.-C. Chen, S. Ota, L.B. Jorde, P. Pamilo, L. Patthy, M. Ramsay, T. Jenkins, S.-K. Shyue and W.-H. Li. 2002.
Larger genetic differences within Africans than between Africans and Eurasians. Genetics 161:269-274

72
SUPPLEMENTARY MATERIALS Appenix 1. The classification of individuals to H sub-haplogroups (first columns indicate RFLP analysis or allele specific PCR results, HVS-1 data is shown in the third column and numbers under populations show individuals with specific haplotype and subhaplogroup marker combinations) ARM GEO ADY DAG NOG ABA KAR OSS -3008Bsh1236I CRS 1 3 2 4-3008Bsh1236I 264-353 1 -3008Bsh1236I 261-325-362 1 -3008Bsh1236I 256-311-352 1 -3008Bsh1236I 189-356-362 1 4 -3008Bsh1236I 189-211 1 -3008Bsh1236I 150-189 1 -3008Bsh1236I 129-248 1 -3008Bsh1236I 093-183-189 1 -3008Bsh1236I 456 311 1 -3008Bsh1236I 221 1 -3008Bsh1236I 162 5 -3008Bsh1236I 129 1 -3008Bsh1236I 93 1 3 -3008Bsh1236I 86 2 +4769AluI CRS 6 1 +4769AluI -950MboI 354-362 1 2 +4769AluI -950MboI 292-354-399 1 +4769AluI -950MboI 292-354 1 +4769AluI -950MboI 256-354 1 +4769AluI 235-291-399 1 2 +4769AluI 187-227-362 3 +4769AluI 172-189-274 1 +4769AluI -950MboI 150-354 1 +4769AluI -950MboI 126-145-354 3 +4769AluI -950MboI 092-305-354 1 +4769AluI -950MboI 354 1 1 +4769AluI 354 1 +4769AluI 274 1 -8448SspI 278-293-311 1 1 -8448SspI 273-278-293-311 1 -8448SspI 094-278-293-311 1 +7640SacI 256-352 2 +7640SacI 356 1 +7640SacI 192-390 1 +7640SacI 212-256 1 +7640SacI -3008Bsh1236I 129 1 +7640SacI -3008Bsh1236I 111 1 456 209-304-311 1 456 207-304 1 456 189-304 1 456 342 1 456 311 1 456 +4332Eco47I 304 1 1 1
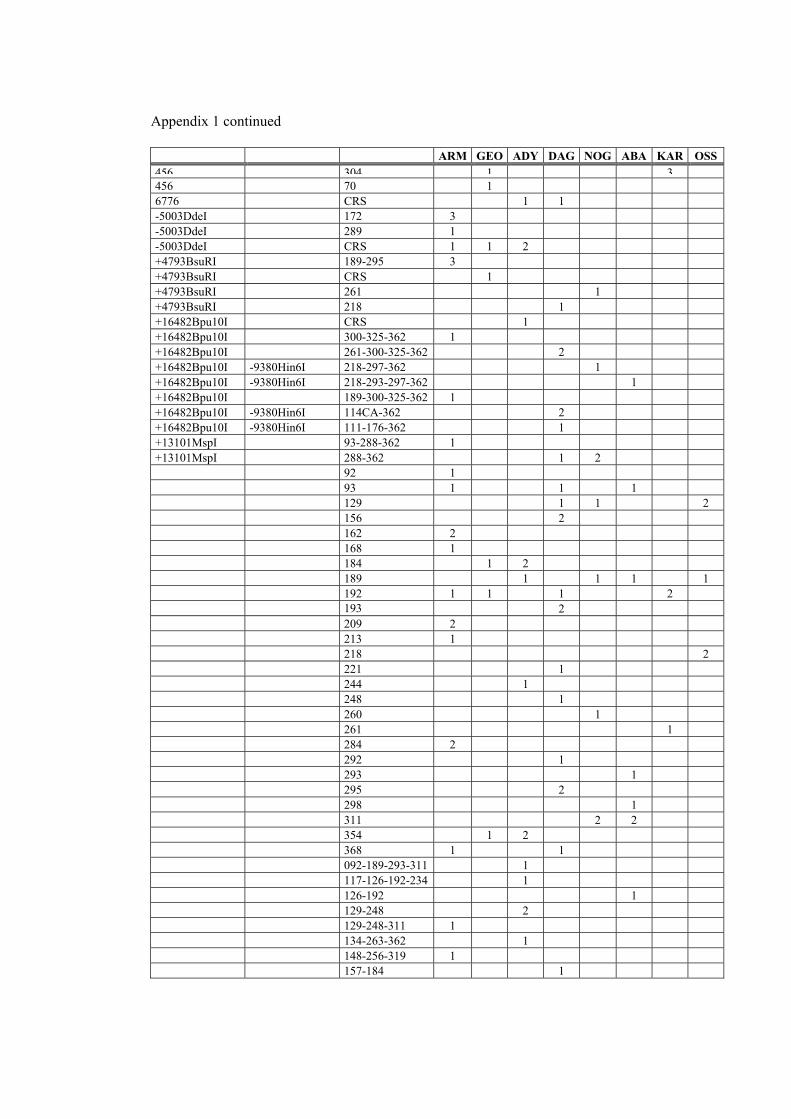
73
Appendix 1 continued ARM GEO ADY DAG NOG ABA KAR OSS 456 304 1 3456 70 1 6776 CRS 1 1 -5003DdeI 172 3 -5003DdeI 289 1 -5003DdeI CRS 1 1 2 +4793BsuRI 189-295 3 +4793BsuRI CRS 1 +4793BsuRI 261 1 +4793BsuRI 218 1 +16482Bpu10I CRS 1 +16482Bpu10I 300-325-362 1 +16482Bpu10I 261-300-325-362 2 +16482Bpu10I -9380Hin6I 218-297-362 1 +16482Bpu10I -9380Hin6I 218-293-297-362 1 +16482Bpu10I 189-300-325-362 1 +16482Bpu10I -9380Hin6I 114CA-362 2 +16482Bpu10I -9380Hin6I 111-176-362 1 +13101MspI 93-288-362 1 +13101MspI 288-362 1 2 92 1 93 1 1 1 129 1 1 2 156 2 162 2 168 1 184 1 2 189 1 1 1 1 192 1 1 1 2 193 2 209 2 213 1 218 2 221 1 244 1 248 1 260 1 261 1 284 2 292 1 293 1 295 2 298 1 311 2 2 354 1 2 368 1 1 092-189-293-311 1 117-126-192-234 1 126-192 1 129-248 2 129-248-311 1 134-263-362 1 148-256-319 1 157-184 1
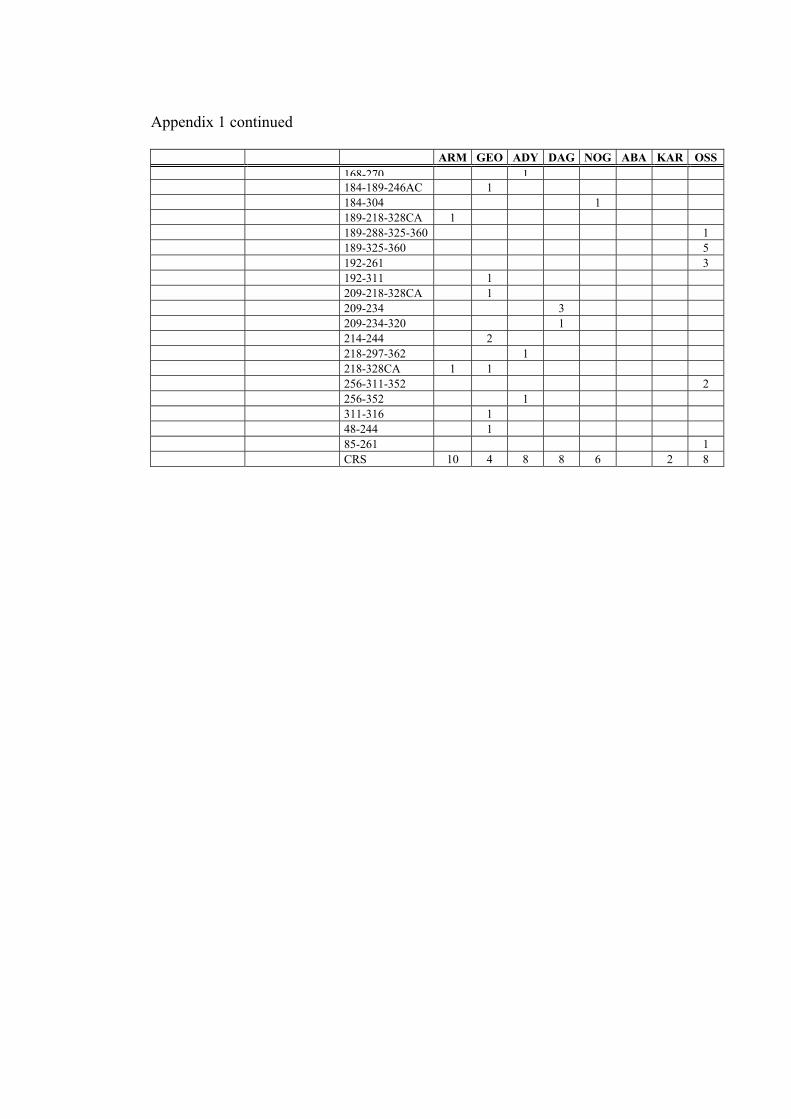
74
Appendix 1 continued ARM GEO ADY DAG NOG ABA KAR OSS
168-270 1 184-189-246AC 1 184-304 1 189-218-328CA 1 189-288-325-360 1 189-325-360 5 192-261 3 192-311 1 209-218-328CA 1 209-234 3 209-234-320 1 214-244 2 218-297-362 1 218-328CA 1 1 256-311-352 2 256-352 1 311-316 1 48-244 1 85-261 1 CRS 10 4 8 8 6 2 8

75
Appendix 2. Tripartite similarity indices between H haplogroup samples in various populations LEV CAU TUR IPK CAS IAS ARA WAF EAF URT UFU SIB UKR IRA GRC ITA EST LEV 1.000 0.180 0.217 0.093 0.142 0.113 0.112 0.100 0.116 0.098 0.108 0.058 0.129 0.126 0.166 0.146 0.090 CAU 0.180 1.000 0.225 0.060 0.124 0.110 0.092 0.075 0.077 0.125 0.107 0.060 0.157 0.138 0.177 0.194 0.152 TUR 0.217 0.225 1.000 0.063 0.130 0.098 0.135 0.110 0.114 0.131 0.155 0.063 0.175 0.136 0.253 0.205 0.132 IPK 0.093 0.060 0.063 1.000 0.162 0.186 0.176 0.145 0.151 0.174 0.162 0.174 0.121 0.114 0.119 0.067 0.119 CAS 0.142 0.124 0.130 0.162 1.000 0.196 0.148 0.126 0.159 0.228 0.180 0.116 0.210 0.169 0.185 0.114 0.218 IAS 0.113 0.110 0.098 0.186 0.196 1.000 0.132 0.104 0.087 0.184 0.128 0.156 0.145 0.144 0.129 0.091 0.129 ARA 0.112 0.092 0.135 0.176 0.148 0.132 1.000 0.129 0.111 0.157 0.148 0.148 0.114 0.142 0.144 0.091 0.144 WAF 0.100 0.075 0.110 0.145 0.126 0.104 0.129 1.000 0.111 0.134 0.126 0.087 0.099 0.087 0.144 0.125 0.127 EAF 0.116 0.077 0.114 0.151 0.159 0.087 0.111 0.111 1.000 0.119 0.111 0.115 0.119 0.111 0.152 0.067 0.117 URT 0.098 0.125 0.131 0.174 0.228 0.184 0.157 0.134 0.119 1.000 0.341 0.176 0.198 0.136 0.171 0.149 0.238 UFU 0.108 0.107 0.155 0.162 0.180 0.128 0.148 0.126 0.111 0.341 1.000 0.190 0.210 0.099 0.169 0.105 0.201 SIB 0.058 0.060 0.063 0.174 0.116 0.156 0.148 0.087 0.115 0.176 0.190 1.000 0.153 0.115 0.085 0.059 0.156 UKR 0.129 0.157 0.175 0.121 0.210 0.145 0.114 0.099 0.119 0.198 0.210 0.153 1.000 0.130 0.195 0.179 0.195 IRA 0.126 0.138 0.136 0.114 0.169 0.144 0.142 0.087 0.111 0.136 0.099 0.115 0.130 1.000 0.160 0.152 0.129 GRC 0.166 0.177 0.253 0.119 0.185 0.129 0.144 0.144 0.152 0.171 0.169 0.085 0.195 0.160 1.000 0.175 0.200 ITA 0.146 0.194 0.205 0.067 0.114 0.091 0.091 0.125 0.067 0.149 0.105 0.059 0.179 0.152 0.175 1.000 0.158 EST 0.090 0.152 0.132 0.119 0.218 0.129 0.144 0.127 0.117 0.238 0.201 0.156 0.195 0.129 0.200 0.158 1.000 NOR 0.129 0.152 0.170 0.084 0.088 0.092 0.101 0.091 0.072 0.173 0.150 0.073 0.157 0.145 0.141 0.188 0.161 ESP 0.159 0.189 0.172 0.080 0.173 0.077 0.107 0.117 0.079 0.155 0.133 0.070 0.160 0.081 0.184 0.201 0.164 DEU 0.137 0.155 0.170 0.078 0.105 0.110 0.086 0.097 0.066 0.173 0.127 0.067 0.178 0.122 0.140 0.145 0.140 GBR 0.150 0.182 0.178 0.070 0.126 0.077 0.085 0.103 0.078 0.136 0.126 0.070 0.184 0.114 0.137 0.202 0.197 FIN 0.138 0.130 0.162 0.141 0.178 0.112 0.150 0.130 0.097 0.201 0.197 0.164 0.233 0.163 0.147 0.154 0.259 RUS 0.156 0.161 0.217 0.175 0.188 0.114 0.146 0.146 0.119 0.277 0.255 0.140 0.252 0.194 0.217 0.200 0.264 ISL 0.138 0.122 0.175 0.141 0.178 0.092 0.130 0.130 0.118 0.201 0.197 0.101 0.189 0.146 0.131 0.103 0.163 CZE 0.119 0.098 0.104 0.135 0.135 0.103 0.102 0.212 0.064 0.159 0.135 0.161 0.180 0.168 0.104 0.130 0.184 FRA 0.146 0.161 0.170 0.137 0.164 0.131 0.103 0.116 0.080 0.166 0.164 0.109 0.196 0.144 0.165 0.183 0.190 LAT 0.133 0.108 0.157 0.178 0.252 0.213 0.185 0.161 0.121 0.365 0.297 0.208 0.214 0.119 0.189 0.141 0.274 HUN 0.079 0.067 0.099 0.132 0.154 0.142 0.135 0.107 0.062 0.164 0.200 0.208 0.132 0.090 0.131 0.083 0.148 SWE 0.141 0.141 0.166 0.156 0.236 0.144 0.186 0.121 0.129 0.328 0.215 0.158 0.238 0.167 0.183 0.173 0.282 BAL 0.139 0.174 0.189 0.125 0.264 0.199 0.176 0.094 0.101 0.310 0.224 0.149 0.250 0.200 0.212 0.138 0.262 POL 0.124 0.168 0.212 0.090 0.144 0.086 0.098 0.085 0.076 0.223 0.156 0.091 0.212 0.114 0.218 0.165 0.218 PRT 0.147 0.146 0.160 0.112 0.202 0.105 0.103 0.103 0.110 0.206 0.149 0.074 0.172 0.124 0.175 0.152 0.159 CHE 0.160 0.121 0.173 0.136 0.172 0.146 0.144 0.107 0.113 0.194 0.228 0.117 0.187 0.144 0.224 0.128 0.224

76
Appendix 2 continued
NOR ESP DEU GBR FIN RUS ISL CZE FRA LAT HUN SWE BAL POL PRT CHE LEV 0.129 0.159 0.137 0.150 0.138 0.156 0.138 0.119 0.146 0.133 0.079 0.141 0.139 0.124 0.147 0.160 CAU 0.152 0.189 0.155 0.182 0.130 0.161 0.122 0.098 0.161 0.108 0.067 0.141 0.174 0.168 0.146 0.121 TUR 0.170 0.172 0.170 0.178 0.162 0.217 0.175 0.104 0.170 0.157 0.099 0.166 0.189 0.212 0.160 0.173 IPK 0.084 0.080 0.078 0.070 0.141 0.175 0.141 0.135 0.137 0.178 0.132 0.156 0.125 0.090 0.112 0.136 CAS 0.088 0.173 0.105 0.126 0.178 0.188 0.178 0.135 0.164 0.252 0.154 0.236 0.264 0.144 0.202 0.172 IAS 0.092 0.077 0.110 0.077 0.112 0.114 0.092 0.103 0.131 0.213 0.142 0.144 0.199 0.086 0.105 0.146 ARA 0.101 0.107 0.086 0.085 0.150 0.146 0.130 0.102 0.103 0.185 0.135 0.186 0.176 0.098 0.103 0.144 WAF 0.091 0.117 0.097 0.103 0.130 0.146 0.130 0.212 0.116 0.161 0.107 0.121 0.094 0.085 0.103 0.107 EAF 0.072 0.079 0.066 0.078 0.097 0.119 0.118 0.064 0.080 0.121 0.062 0.129 0.101 0.076 0.110 0.113 URT 0.173 0.155 0.173 0.136 0.201 0.277 0.201 0.159 0.166 0.365 0.164 0.328 0.310 0.223 0.206 0.194 UFU 0.150 0.133 0.127 0.126 0.197 0.255 0.197 0.135 0.164 0.297 0.200 0.215 0.224 0.156 0.149 0.228 SIB 0.073 0.070 0.067 0.070 0.164 0.140 0.101 0.161 0.109 0.208 0.208 0.158 0.149 0.091 0.074 0.117
UKR 0.157 0.160 0.178 0.184 0.233 0.252 0.189 0.180 0.196 0.214 0.132 0.238 0.250 0.212 0.172 0.187 IRA 0.145 0.081 0.122 0.114 0.163 0.194 0.146 0.168 0.144 0.119 0.090 0.167 0.200 0.114 0.124 0.144 GRC 0.141 0.184 0.140 0.137 0.147 0.217 0.131 0.104 0.165 0.189 0.131 0.183 0.212 0.218 0.175 0.224 ITA 0.188 0.201 0.145 0.202 0.154 0.200 0.103 0.130 0.183 0.141 0.083 0.173 0.138 0.165 0.152 0.128 EST 0.161 0.164 0.140 0.197 0.259 0.264 0.163 0.184 0.190 0.274 0.148 0.282 0.262 0.218 0.159 0.224 NOR 1.000 0.225 0.211 0.250 0.177 0.213 0.167 0.149 0.202 0.120 0.114 0.223 0.158 0.189 0.165 0.186 ESP 0.225 1.000 0.203 0.199 0.179 0.165 0.150 0.133 0.203 0.145 0.149 0.203 0.161 0.191 0.237 0.178 DEU 0.211 0.203 1.000 0.189 0.156 0.173 0.145 0.160 0.194 0.117 0.088 0.193 0.180 0.201 0.132 0.177 GBR 0.250 0.199 0.189 1.000 0.176 0.172 0.194 0.117 0.214 0.128 0.086 0.214 0.151 0.203 0.139 0.166 FIN 0.177 0.179 0.156 0.176 1.000 0.279 0.208 0.177 0.224 0.241 0.155 0.310 0.248 0.177 0.177 0.201 RUS 0.213 0.165 0.173 0.172 0.279 1.000 0.197 0.203 0.191 0.331 0.116 0.202 0.249 0.219 0.177 0.260 ISL 0.167 0.150 0.145 0.194 0.208 0.197 1.000 0.139 0.172 0.202 0.175 0.310 0.210 0.127 0.247 0.219 CZE 0.149 0.133 0.160 0.117 0.177 0.203 0.139 1.000 0.137 0.139 0.151 0.172 0.183 0.118 0.131 0.135 FRA 0.202 0.203 0.194 0.214 0.224 0.191 0.172 0.137 1.000 0.194 0.147 0.257 0.186 0.194 0.156 0.183 LAT 0.120 0.145 0.117 0.128 0.241 0.331 0.202 0.139 0.194 1.000 0.167 0.286 0.229 0.198 0.135 0.214 HUN 0.114 0.149 0.088 0.086 0.155 0.116 0.175 0.151 0.147 0.167 1.000 0.215 0.160 0.140 0.144 0.169 SWE 0.223 0.203 0.193 0.214 0.310 0.202 0.310 0.172 0.257 0.286 0.215 1.000 0.321 0.219 0.272 0.300 BAL 0.158 0.161 0.180 0.151 0.248 0.249 0.210 0.183 0.186 0.229 0.160 0.321 1.000 0.204 0.286 0.221 POL 0.189 0.191 0.201 0.203 0.177 0.219 0.127 0.118 0.194 0.198 0.140 0.219 0.204 1.000 0.162 0.175 PRT 0.165 0.237 0.132 0.139 0.177 0.177 0.247 0.131 0.156 0.135 0.144 0.272 0.286 0.162 1.000 0.176 CHE 0.186 0.178 0.177 0.166 0.201 0.260 0.219 0.135 0.183 0.214 0.169 0.300 0.221 0.175 0.176 1.000

77
Appendix 3. Tripartite similarity index values between H haplogroup samples in the Caucasus and elsewhere ARM GEO OSS AZE KAB ADY NOG KAR DAG ABA ARM 1.000 0.124 0.082 0.164 0.031 0.112 0.086 0.130 0.111 0.031 GEO 0.124 1.000 0.108 0.249 0.180 0.150 0.129 0.249 0.145 0.058 OSS 0.082 0.108 1.000 0.193 0.231 0.233 0.244 0.153 0.162 0.151 AZE 0.164 0.249 0.193 1.000 0.145 0.118 0.235 0.237 0.193 0.145 KAB 0.031 0.180 0.231 0.145 1.000 0.198 0.183 0.145 0.036 0.141 ADY 0.112 0.150 0.233 0.118 0.198 1.000 0.176 0.159 0.095 0.116 NOG 0.086 0.129 0.244 0.235 0.183 0.176 1.000 0.335 0.171 0.089 KAR 0.130 0.249 0.153 0.237 0.145 0.159 0.335 1.000 0.114 0.145 DAG 0.111 0.145 0.162 0.193 0.036 0.095 0.171 0.114 1.000 0.075 ABA 0.031 0.058 0.151 0.145 0.141 0.116 0.089 0.145 0.075 1.000 LEV 0.136 0.070 0.103 0.094 0.070 0.080 0.105 0.059 0.102 0.047 TUR 0.149 0.064 0.165 0.090 0.039 0.074 0.128 0.090 0.104 0.039 IPK 0.087 0.134 0.210 0.194 0.191 0.141 0.163 0.144 0.098 0.191 CAS 0.104 0.119 0.178 0.097 0.122 0.109 0.185 0.148 0.124 0.122 IAS 0.107 0.162 0.237 0.100 0.167 0.145 0.184 0.100 0.118 0.098 ARA 0.103 0.090 0.195 0.126 0.125 0.080 0.143 0.094 0.151 0.061 WAF 0.130 0.059 0.108 0.126 0.093 0.053 0.143 0.062 0.085 0.061 EAF 0.114 0.120 0.203 0.171 0.082 0.136 0.110 0.127 0.189 0.082 URT 0.111 0.075 0.215 0.132 0.104 0.166 0.198 0.186 0.111 0.104 UFU 0.104 0.070 0.155 0.097 0.097 0.133 0.185 0.173 0.080 0.097 SIB 0.089 0.096 0.140 0.103 0.209 0.070 0.212 0.213 0.034 0.101 UKR 0.114 0.076 0.117 0.077 0.061 0.103 0.136 0.124 0.101 0.093 IRA 0.143 0.057 0.167 0.099 0.079 0.110 0.055 0.039 0.133 0.079 GRC 0.128 0.104 0.167 0.123 0.087 0.115 0.153 0.123 0.167 0.070 ITA 0.083 0.042 0.084 0.050 0.034 0.067 0.084 0.067 0.088 0.059 EST 0.095 0.051 0.167 0.088 0.070 0.115 0.136 0.123 0.098 0.105 NOR 0.060 0.031 0.125 0.073 0.042 0.093 0.105 0.073 0.072 0.053 ESP 0.087 0.040 0.078 0.060 0.040 0.089 0.130 0.080 0.078 0.060 DEU 0.075 0.034 0.100 0.057 0.034 0.077 0.090 0.057 0.088 0.034 GBR 0.077 0.035 0.095 0.052 0.044 0.069 0.096 0.078 0.067 0.052 FIN 0.131 0.061 0.156 0.127 0.105 0.096 0.140 0.105 0.095 0.105 RUS 0.164 0.052 0.187 0.107 0.071 0.117 0.156 0.125 0.098 0.071 ISL 0.092 0.040 0.135 0.084 0.062 0.096 0.161 0.105 0.108 0.083 CZE 0.102 0.069 0.084 0.095 0.070 0.063 0.134 0.071 0.065 0.046 FRA 0.103 0.041 0.133 0.097 0.069 0.079 0.136 0.069 0.063 0.069 LAT 0.138 0.077 0.169 0.135 0.106 0.119 0.203 0.163 0.090 0.106 HUN 0.081 0.068 0.124 0.072 0.108 0.060 0.201 0.148 0.060 0.071 SWE 0.122 0.067 0.171 0.117 0.093 0.172 0.178 0.165 0.124 0.140 BAL 0.135 0.085 0.205 0.132 0.109 0.228 0.189 0.155 0.115 0.087 POL 0.111 0.052 0.114 0.092 0.052 0.101 0.143 0.105 0.064 0.065 PRT 0.104 0.076 0.145 0.078 0.077 0.127 0.150 0.117 0.155 0.058 CHE 0.089 0.059 0.170 0.101 0.080 0.112 0.155 0.101 0.099 0.101