towards global carbon pricing: direct and indirect linking
TRANSCRIPT

Rob Dellink, Stephanie Jamet, Jean Chateau and Roman Duval, OECD
JEL Classification: H23, 041, Q54
Please cite this paper as:
Towards Global Carbon Pricing: Direct and Indirect
Linking of Carbon Markets
Dellink, R.B. et al (2010), “Towards Global Carbon Pricing : Direct and Indirect Linking of Carbon Markets”, OECD Environmental Working Paper No. 20, 2010, OECD publishing, © OECD.
doi : 10.1787/5km975t0cfr8-en

Unclassified ENV/WKP(2010)6 Organisation de Coopération et de Développement Économiques Organisation for Economic Co-operation and Development 04-Aug-2010 ___________________________________________________________________________________________
English - Or. English ENVIRONMENT DIRECTORATE
ENVIRONMENT WORKING PAPER NO. 20 TOWARDS GLOBAL CARBON PRICING: DIRECT AND INDIRECT LINKING OF CARBON MARKETS
By R.B. Dellink, S. Jamet, J. Chateau and R. Duval, OECD
JEL codes: H23, O41, Q54 Keywords: Climate mitigation policy, emissions trading systems, general equilibrium models.
All OECD Environment Working Papers are available at www.oecd.org/env/workingpapers
JT03287211
Document complet disponible sur OLIS dans son format d'origine Complete document available on OLIS in its original format
EN
V/W
KP(2010)6
Unclassified
English - O
r. English

ENV/WKP(2010)6
2
OECD ENVIRONMENT WORKING PAPERS
This series is designed to make available to a wider readership selected studies on environmental issues prepared for use within the OECD. Authorship is usually collective, but principal writers are named. The papers are generally available only in their original language English or French with a summary in the other if available. The opinions expressed in these papers are the sole responsibility of the author(s) and do not necessarily reflect those of the OECD or of the governments of its member countries. Comment on the series is welcome, and should be sent to either [email protected] or the Environment Directorate, 2, rue André Pascal, 75775 PARIS CEDEX 16, France.
---------------------------------------------------------------------------
OECD Environment Working Papers are published on www.oecd.org/env/workingpapers
---------------------------------------------------------------------------
Applications for permission to reproduce or translate all or part of this material should be made to: OECD Publishing, [email protected] or by fax 33 1 45 24 99 30.
Copyright OECD 2010
ENV/WKP(2010)6
3
ABSTRACT
Emissions trading systems (ETS) can play a major role in a cost-effective climate policy framework. Both direct linking of ETSs and indirect linking through a common crediting mechanism can reduce costs of action. We use a global recursive-dynamic computable general equilibrium model to assess the effects of direct and indirect linking of ETS systems across world regions. Linking of domestic Annex I ETSs leads to moderate aggregate cost savings, as differences in domestic permit prices are limited. However, the economy of the main seller, Russia, is negatively affected by the real exchange rate appreciation that is induced by the large export of permits. The cost-saving potential for developed countries of well-functioning crediting mechanisms appears to be very large. Even limited use of credits would nearly halve mitigation costs; cost savings would be largest for carbon-intensive economies. However, one open issue is whether these gains can be fully reaped in reality, given that direct linking and the use of crediting mechanisms both raise complex system design and implementation issues. The analysis in this paper shows, however, that the potential gains to be reaped are so large, that substantial efforts in this domain are warranted.
JEL codes: H23, O41, Q54 Keywords: Climate mitigation policy, emissions trading systems, general equilibrium models.

ENV/WKP(2010)6
4
RESUME
Les systèmes d’échange de droits d’émission peuvent jouer un rôle considérable dans le cadre d’une politique climatique efficace par rapport aux coûts. Le couplage direct de ces systèmes, aussi bien qu’indirect à travers un mécanisme commun d’attribution de crédits, peut réduire les coûts de l’action. Nous utilisons un modèle mondial dynamique récursif d’équilibre général calculable pour évaluer les effets du couplage direct et indirect des systèmes d’échange de droits d’émission dans les différentes régions du monde. Le couplage des systèmes d’échange nationaux des pays visés à l’annexe I entraîne de faibles économies dans l’ensemble, car les différences de prix entre permis nationaux sont limitées. Cela étant, l’économie du principal vendeur - la Russie - est mise à mal par l’appréciation du taux de change réel due aux fortes exportations de permis. Les économies que pourraient réaliser les pays développés grâce à des mécanismes efficaces d’attribution de crédits d’émission semblent très importantes. Un recours même limité à ces crédits permettrait en gros de réduire de moitié les coûts de l’atténuation ; les économies à forte intensité de carbone sont celles qui feraient le plus d’économies. Il reste à savoir cependant si, concrètement, ces avantages pourraient être exploités en totalité, compte tenu des problèmes complexes de conception et de mise en œuvre que posent tant le couplage direct que les mécanismes d’attribution de crédits. L’analyse présentée dans ce rapport montre toutefois que les avantages à en tirer peuvent être si grands qu’il se justifie de déployer des efforts considérables dans ce domaine.
Codes JEL : H23, O41, Q54 Mots clés : Politique d’atténuation du changement climatique, systèmes d’échange de droits d’émission, modèles d’équilibre général.

ENV/WKP(2010)6
5
FOREWORD
This paper was prepared by R.B. Dellink, S. Jamet, J. Chateau and R. Duval from the OECD, and is based on analysis published in the OECD 2009 book ‘The Economics of Climate Change Mitigation: Policies and Options for Global Action Beyond 2012’. An earlier draft was reviewed by the Working Party on Structural Policies in May 2010. The current draft version will be presented at the annual GTAP conference.
This document does not necessarily represent the views of either the OECD or its member countries. It is published under the responsibility of the Secretary General.
The authors would like to thank Jean-Marc Burniaux, Jan Corfee-Morlot, Helen Mountford, Cuauhtemoc Rebolledo-Gomez from the Organisation for Economic Co-operation and Development for their input, suggestions and comments.

ENV/WKP(2010)6
6

ENV/WKP(2010)6
7
TABLE OF CONTENTS
ABSTRACT ................................................................................................................................................... 3
RESUME ........................................................................................................................................................ 4
FOREWORD .................................................................................................................................................. 5
EXECUTIVE SUMMARY ............................................................................................................................ 9
1. Introduction .................................................................................................................................... 11 2. Methodology .................................................................................................................................. 13
2.1 Short description of the ENV-Linkages model ......................................................................... 13 2.2 Calibration and baseline projection........................................................................................... 14
3. Simulation results ........................................................................................................................... 15 3.1 Direct linking of carbon markets in the Annex I regions .......................................................... 15 3.2 Indirect linking of carbon markets through a common crediting mechanism........................... 21
4. Alternative set ups for linking ETSs .............................................................................................. 26 4.1 Alternative baselines for CDM credits...................................................................................... 26 4.2 Alternative policies: binding sectoral caps in non-Annex I countries ...................................... 27
5. Practical issues raised by linking .................................................................................................... 29 6. Concluding remarks ....................................................................................................................... 31
REFERENCES ............................................................................................................................................. 32
ANNEX 1. KEY CHARACTERISTICS OF THE ENV-LINKAGES MODEL ......................................... 34
ANNEX 2. CONSTRUCTING A BUSINESS-AS-USUAL BASELINE PROJECTION ........................... 37

ENV/WKP(2010)6
8
Tables
Table A1. ENV-Linkages model sectors ................................................................................................... 34 Table A2. ENV-Linkages model regions .................................................................................................. 35
Figures
Figure 1. Impact of linking regional Annex I ETSs on carbon prices and emission reductions in the A1act scenario ........................................................................................................................... 16
Figure 2. Impact of linking regional Annex I ETSs on mitigation policy costs under the A1act scenario...................................................................................................................................... 17
Figure 3. Impact of linking Annex I regional ETSs on carbon leakage and the output losses of energy intensive industries1 across linked regions under the A1act scenario in 2020 ......................... 20
Figure 4. Impact of allowing access to a well functioning crediting mechanism on mitigation policy costs in each Annex I region under the A1act scenario ............................................................. 22
Figure 5. Impact of a well functioning crediting mechanism on carbon prices under the A1act scenario 23
Figure 6. Geographical distribution of offset credit buyers and sellers by 2020 under the A1act scenario...................................................................................................................................... 24
Figure 7. Estimated gains from direct linking across Annex I ETSs that are already linked through a crediting mechanism ................................................................................................................. 25
Figure 8. Impact of an alternative baseline for the crediting mechanism on leakage and the price of CERs ......................................................................................................................................... 27
Figure 9. Mitigation costs under an international ETS in Annex I and binding sectoral caps in non Annex I regions ......................................................................................................................... 28
Figure A1. Structure of production in ENV Linkages ............................................................................... 36 Figure A2. Projected GHG emissions1 by country/region (2005-2050, Gt CO2eq) ................................. 38

ENV/WKP(2010)6
9
EXECUTIVE SUMMARY
Putting a price on greenhouse gas (GHG) emissions through market-based mechanisms such as carbon taxes and emissions trading systems (ETSs) is a key element in building up a cost-effective climate policy framework. ETSs can also play an important role in scaling up international funding for climate action, which can enhance countries’ participation in a broad and ambitious mitigation policy. The revenues from carbon taxes, or proceeds from auctioned emission permits can be substantial, and in our simulations amounts to more than 2% of GDP in 2050 in Annex I countries alone under a scenario where GHG emissions are cut by 50% relative to 1990 levels.
Implementing ETSs and allowing international trading of the associated permits, i.e. linking domestic carbon markets, can achieve the dual goal of increasing the environmental ambition and the cost-effectiveness of international mitigation action. Compared with a fragmented approach, under which a number of regions would meet their emission reduction objectives in isolation, direct or indirect linking of ETSs can reduce mitigation costs by fostering partial or even full convergence in carbon prices, and thus in marginal abatement costs, across the different ETSs. This paper numerically assesses the economic effects of direct and indirect linking of ETSs in the Annex I region, using the OECD global recursive-dynamic computable general equilibrium model ENV-Linkages.
Our results first confirm the general rule that the greater the difference in carbon prices across countries prior to linking, the larger the cost savings from linking. Countries with higher pre-linking carbon prices gain from abating less and buying cheaper permits. Countries with lower pre-linking prices benefit from abating more and selling permits, although their economy may be negatively affected by the real exchange rate appreciation triggered by the large permit exports (the Dutch disease effect). Under an illustrative 20% emission cut (relative to 1990 levels) in each Annex I region by 2020, if domestic Annex I ETSs were linked permit buyers would include Canada, Australia and New Zealand and, to a lesser extent, the European Union and Japan. Russia would be the main seller. By allowing carbon prices to converge across linked schemes, linking also has the benefit of reducing competitiveness impacts, especially in regions with higher pre-linking carbon prices.
Secondly, the cost-saving potential for developed countries of indirect linking through well-functioning crediting mechanisms appears to be very large, reflecting the vast low-cost abatement potential in a number of emerging and developing countries. Even limited use of CERs amounting to 20% of Annex I emission reductions would already almost halve mitigation costs in these countries, and raising this cap on the use of offset credits would bring further cost reductions. Cost savings would be largest for the more carbon-intensive Annex I economies, such as Australia, Canada and Russia. China has the potential to be by far the largest seller, and the United States the largest buyer in the offset credit market, each of them accounting for about half of transactions by 2020 under the illustrative mitigation scenario mentioned above.
Thirdly, the mitigation cost savings from direct linking of ETSs in Annex I countries are much smaller than those from indirect linking through a well-functioning crediting mechanism. This finding essentially reflects the much greater heterogeneity in marginal abatement costs between Annex I and non-Annex I countries than among Annex I countries themselves, as well as the much greater low-cost

ENV/WKP(2010)6
10
abatement potential available in non-Annex I countries. In fact, under the illustrative scenario considered in this paper, allowing Annex I regions to meet up to 50% of their domestic commitments through the use of offsets would trigger major carbon price convergence, thereby exhausting the gains from linking and making direct linking of little additional value.
These gains from linking are unlikely to be fully reaped in reality. Both direct linking and the use of crediting mechanisms require careful set-up of the regulatory issues. In particular, setting up a well-functioning sectoral or other large-scale crediting mechanism may prove a major challenge. The analysis in this paper shows, however, that the potential gains to be reaped are so large that substantial efforts in this domain are warranted.
ENV/WKP(2010)6
11
1. Introduction
Putting a price on greenhouse gas (GHG) emissions through price mechanisms such as carbon taxes and emissions trading systems (ETSs) can go a long way towards building up a cost-effective climate policy framework. Indeed these price instruments are intrinsically cost-effective as they equalise marginal abatement costs across individual emitters while giving them continuing incentives to search for cheaper abatement options through both existing and new technologies.
While experience with GHG emissions taxes remains limited (e.g. Sweden), the international community has made some progress towards implementing ETSs. Several domestic/regional GHG emission trading or cap-and-trade schemes are already in place (including the EU-ETS in the EU, RGGI in the USA, the Norwegian ETS and emission trading in Japan) or are emerging (e.g. Mexico, South Korea; see OECD (2009) for a full overview). These vary significantly in terms of their target, size, and other design features. At present there are virtually no direct links between these systems, other than the link between the EU and Norwegian ETSs. Yet, as more ETSs are expected to emerge in the future, direct linking is likely to gain prominence.
Linking can also occur “indirectly” when multiple ETSs allow part of the emission reductions to be achieved in countries outside the ETS, for example through a common offset or crediting mechanism. The existence of “flexibility mechanisms” – such as the Clean Development Mechanism (CDM) of the Kyoto Protocol – enable emission reduction commitments under the ETSs to be met by undertaking emission reductions – often referred to as offsets – in other geographical areas. When different ETSs accept credits from a common crediting mechanism, this induces some convergence in permit prices and thereby some indirect linking between the ETSs.
Compared with a fragmented approach, under which a number of regions would meet their emission reduction objectives in isolation, direct or indirect linking of ETSs can reduce mitigation costs by fostering partial or even full (in the case of direct linking) convergence in carbon prices, and thus in marginal abatement costs, across the different ETSs (Jaffe and Stavins, 2007, 2008). Linking can also reduce carbon leakage, which arises when emission reductions in one set of countries are partly offset by increases in the rest of the world. This is straightforward for indirect linking, which lowers carbon prices in all regions covered by ETSs. Direct linking may also reduce carbon leakage by alleviating the very high carbon prices and the associated leakage that could otherwise prevail in certain regions. Other significant, but difficult to quantify, gains from (direct) linking arise from enhanced liquidity of permit markets.
The economic aspects of linking ETSs has received a fair amount of attention in the literature already. Tuerk et al. (2009) provide a good non-technical introduction into the main issues involved. A more fundamental analysis of different architectures of linking is given in e.g. Flachsland et al. (2009), Jaffe and Stavins (2007, 2008). Anger (2008) provides a numerical assessment of linking the EU-ETS to other ETS systems, and investigates the role of the CDM, but uses a fairly limited two-sector partial equilibrium model.
This paper aims at numerically assessing the economic effects of direct and indirect linking of ETSs in the Annex I regions.1 To this end, we use the OECD global recursive-dynamic computable general equilibrium model ENV-Linkages. ENV-Linkages provides numerical projections for GHG emissions, economic activity and economic growth in a multi-sector, multi-gas setting for the major world regions. The global general equilibrium approach ensures that all major feedback mechanisms that link the economies are taken into account.
1 Annex I regions are those countries that have agreed to reduce their greenhouse gas emissions under the Kyoto Protocol.

ENV/WKP(2010)6
12
Our results first confirm the general rule that the greater the difference in carbon prices across countries prior to linking, the larger the cost savings from linking. Countries with higher pre-linking carbon prices gain from abating less and buying cheaper permits. Countries with lower pre-linking prices benefit from abating more and selling permits, although their economy may be negatively affected by the real exchange rate appreciation triggered by the large permit exports (the Dutch disease effect). Under an illustrative 20% emission cut (relative to 1990 levels) in each Annex I region by 2020, if domestic Annex I ETSs were linked permit buyers would include Canada, Australia and New Zealand and, to a lesser extent, the European Union and Japan. Russia would be the main seller.
Secondly, the cost-saving potential for developed countries of well-functioning crediting mechanisms appears to be very large, reflecting the vast low-cost abatement potential in a number of emerging and developing countries. Even limited use of CERs amounting to 20% of Annex I emission reductions would already almost halve mitigation costs in these countries, and raising this cap on offset credits use would bring further cost reductions. Cost savings would be largest for the more carbon-intensive Annex I economies, such as Australia, Canada and Russia. China has the potential to be by far the largest seller, and the United States the largest buyer in the offset credit market, each of them accounting for about half of transactions by 2020 under the illustrative mitigation scenario mentioned above.
Thirdly, the mitigation cost savings from direct linking of ETSs in Annex I countries are much smaller than those from indirect linking through a well-functioning crediting mechanism. This finding essentially reflects the much greater heterogeneity in marginal abatement costs between Annex I and non-Annex I countries than among Annex I countries themselves, as well as the much greater low-cost abatement potential available in non-Annex I countries. In fact, under the illustrative scenario considered in this paper, allowing Annex I regions to meet up to 50% of their domestic commitments through the use of offsets would trigger major carbon price convergence, thereby exhausting the gains from linking and making direct linking of little additional value,
These gains from linking are unlikely to be fully reaped in reality. Both direct linking and the use of crediting mechanisms require careful set-up of the regulatory issues. In particular, setting up a well-functioning sectoral or other large-scale crediting mechanism may prove a major challenge. The analysis in this paper shows, however, that the potential gains to be reaped are so large that substantial efforts in this domain are warranted.
The set-up of this paper is as follows: Section 2 briefly outlines the methodology used, with a focus on the specification of the ENV-Linkages model. Section 3 presents the results of the numerical simulations and identifies the main outcomes of the analysis. Some sensitivity analysis is carried out in Section 4. Section 5 discusses how direct and indirect linking could be established in practice, while Section 6 concludes.

ENV/WKP(2010)6
13
2. Methodology
2.1 Short description of the ENV-Linkages model
The OECD ENV-Linkages model is a recursive-dynamic neo-classical Computable General Equilibrium (CGE) model. It is a global economic model to study the economic impacts of environmental policies. The ENV-Linkages model is the successor to the OECD GREEN model for environmental studies (Burniaux, et al. 1992). In the version of the model used here, the model represents the world economy in 12 countries/regions, each with 25 economic sectors (see Annex 1), including five different technologies to produce electricity. A fuller model description is given in OECD (2009); here we just present the main features of the model.
All production in ENV-Linkages is assumed to operate under cost minimisation with an assumption of perfect markets and constant return to scale technology. The production technology is specified as nested CES production functions in a branching hierarchy (cf. Annex 1). This structure is replicated for each output, while the parameterisation of the CES functions may differ across sectors. Adjustments are made for specific sectors, including the agricultural sectors and non-fossil fuel based electricity technologies by specifying a factor endowment specific to the sector that represents natural resource use. The nesting of the production function for the agricultural sectors is further re-arranged to reflect substitution between intensification (e.g. more fertiliser use) and extensification (more land use) of activities.
The model adopts a putty/semi-putty technology specification, where substitution possibilities among factors are assumed to be higher with new vintage capital than with old vintage capital. This implies relatively slow adjustment of quantities to price changes. Capital accumulation is modelled as in the traditional Solow/Swan neo-classical growth model.
The energy bundle is of particular interest for analysis of climate change issues. Energy is a composite of fossil fuels and electricity. In turn, fossil fuel is a composite of coal and a bundle of the “other fossil fuels”. At the lowest nest, the composite “other fossil fuels” commodity consists of crude oil, refined oil products and natural gas. The value of the substitution elasticities are chosen as to imply a higher degree of substitution among the other fuels than with electricity and coal.
The structure of electricity production assumes that a representative electricity producer maximizes its profit by using the five available technologies to generate electricity using a CES specification with a large value of the elasticity of substitution. The production of the non-fossil electricity technologies (net of GHG and expressed in TeraWatt per hour) has a structure similar to the other sectors, except for a top nesting combining a sector-specific natural resource, on one hand, and all other inputs, on the other hands. This specification acts as a capacity constraint on the supply of these electricity technologies.
Household consumption demand is the result of static maximization behaviour which is formally implemented as an “Extended Linear Expenditure System” (Lluch, 1973; Howe, 1975). A representative consumer in each region – who takes prices as given – optimally allocates disposal income among the full set of consumption commodities and savings. Saving is considered as a standard good and therefore does not rely on a forward-looking behaviour by the consumer. The government in each region collects various kinds of taxes in order to finance government expenditures. Assuming fixed public savings (or deficits), the government budget is balanced through the adjustment of the income tax on consumer income.
International trade is based on a set of regional bilateral flows. The model adopts the Armington specification, assuming that domestic and imported products are not perfectly substitutable. Moreover,

ENV/WKP(2010)6
14
total imports are also imperfectly substitutable between regions of origin. Allocation of trade between partners then responds to relative prices at the equilibrium.
Market goods equilibria imply that, on the one side, the total production of any good or service is equal to the demand addressed to domestic producers plus exports; and, on the other side, the total demand is allocated between the demands (both final and intermediary) addressed to domestic producers and the import demand.
ENV-Linkages is fully homogeneous in prices and only relative prices matter. All prices are expressed relative to the numéraire of the price system that is arbitrarily chosen as the index of OECD manufacturing exports prices. Each region runs a current account balance, which is fixed in terms of the numéraire. One important implication from this assumption in the context of this paper is that real exchange rates immediately adjust to restore current account balance when countries start exporting/importing emission permits.
2.2 Calibration and baseline projection
The process of calibration of the ENV-Linkages model is broken down into three stages. First, a number of parameters are calibrated, given some elasticity values, on base-year (2001) values of variables. This process is referred to as the static calibration. Each of the 12 regions is underpinned by an economic input-output table for 2001, based on the GTAP 6.2 database (Dimaranan, 2006). Second, the 2001 database is updated to 2005 by simulating the model dynamically to match historical trends over the period 2001-2005; thus all variables are expressed in 2005 real USD. Third, the business-as-usual (BAU) baseline projection is obtained by defining a set of exogenous socio-economic drivers (demographic trends, labour productivity, future trends in energy prices and energy efficiency gains) and running the model dynamically again over the period 2005-2050. The main elements in designing the BAU projection are described in Annex 2. More details are given in OECD (2009); here, we only present the main elements.
The BAU baseline scenario assumes that there are no new climate change policies implemented, and projects future emissions on the basis of assumptions on the long-term evolution of output growth, relative prices of fossil fuels and potential gains in energy efficiency. It thus provides a benchmark against which policy scenarios aimed at achieving emission cuts can be assessed.
The BAU projection is based on the so-called conditional convergence assumption that income levels of developing countries converge towards those in developed countries over the coming decades (for details, see Annex 2 and Duval and de la Maisonneuve, 2010). Average annual world GDP growth (in constant purchasing power parity – PPP – in 2005 USD) is assumed to be around 3.5% between 2006 and 2050. This is slightly lower than the 2000-2006 average. Overall, average world GDP per capita in constant PPP USD is expected to rise more than three times between 2006 and 2050.
World emissions of the greenhouse gases carbon dioxide (CO2), methane (CH4), nitrous oxide (N2O), hydro fluorocarbons (HFCs), per fluorocarbons (PFCs) and sulphur hexafluoride (SF6) have roughly doubled since the early 1970s, and are expected to double again, reaching about 72 gigatons CO2 equivalent (Gt CO2eq) in 2050, excluding emissions from land-use, land-use change and forestry. Critical drivers of projected emissions for the period until 2050 other than GDP growth include assumptions about future fossil fuel prices and energy efficiency gains in line with IEA projections (IEA, 2008). Finally, the BAU projection assumes that the EU Emissions Trading Scheme (EU-ETS) will be sustained in the future, with a gradual convergence in the carbon price to USD 25 per tonne of CO2 and a stabilisation at this level (in real terms) beyond 2012.

ENV/WKP(2010)6
15
3. Simulation results
In order to illustrate the effects of linking different regional ETSs, the ENV-Linkages model is used here to run an illustrative mitigation scenario (A1act). In the case of this scenario without linking, each Annex I region is assumed to use an ETS to cut its GHG emissions unilaterally below 1990 levels by 20% by 2020 and by 50% by 2050. We assume that permits are fully auctioned to all sectors in all countries covered by the ETS. On its own, this commitment would be insufficient to achieve ambitious climate objectives. World emissions would still rise by about 20% and 50% by 2020 and 2050 respectively, versus about 85% by 2050 in a baseline scenario with no further mitigation policy action (BAU). It would, therefore, need to be fairly rapidly tightened and/or supplemented with further action, including in non-Annex I countries if a stringent long-term stabilisation target is to be met. Nevertheless, this illustrative A1act scenario is reasonably realistic given the emission reductions as pledged by Annex I countries in the Copenhagen Accord and, most importantly, it yields a number of lessons about the economic impacts of linking.
3.1 Direct linking of carbon markets in the Annex I regions
Improving cost-effectiveness
Direct linking occurs if the tradable permit system’s authority allows regulated entities to use emission allowances from another ETS to meet their domestic compliance obligations. Direct linking can be “two way” if each system recognises the others’ allowances, or “one way” if one system recognises the other system’s allowances but the other does not reciprocate. Linking ETSs directly tends to lower the overall cost of meeting their joint targets by allowing higher-cost emission reductions in one ETS to be replaced by lower-cost emission reductions in the other. Once ETSs are linked, this cost-effectiveness is achieved regardless of the magnitude of the initial emission reduction commitment across countries or regions as trading of emission allowances ensures that marginal abatement costs of individual emitters are equalised. The initial allocation of allowances does have a distributional effect as it determines the direction of the trade flows. The potential gains from linking are greater the larger the initial difference in carbon prices – and thereby in the marginal costs of reducing emissions – across individual ETSs.
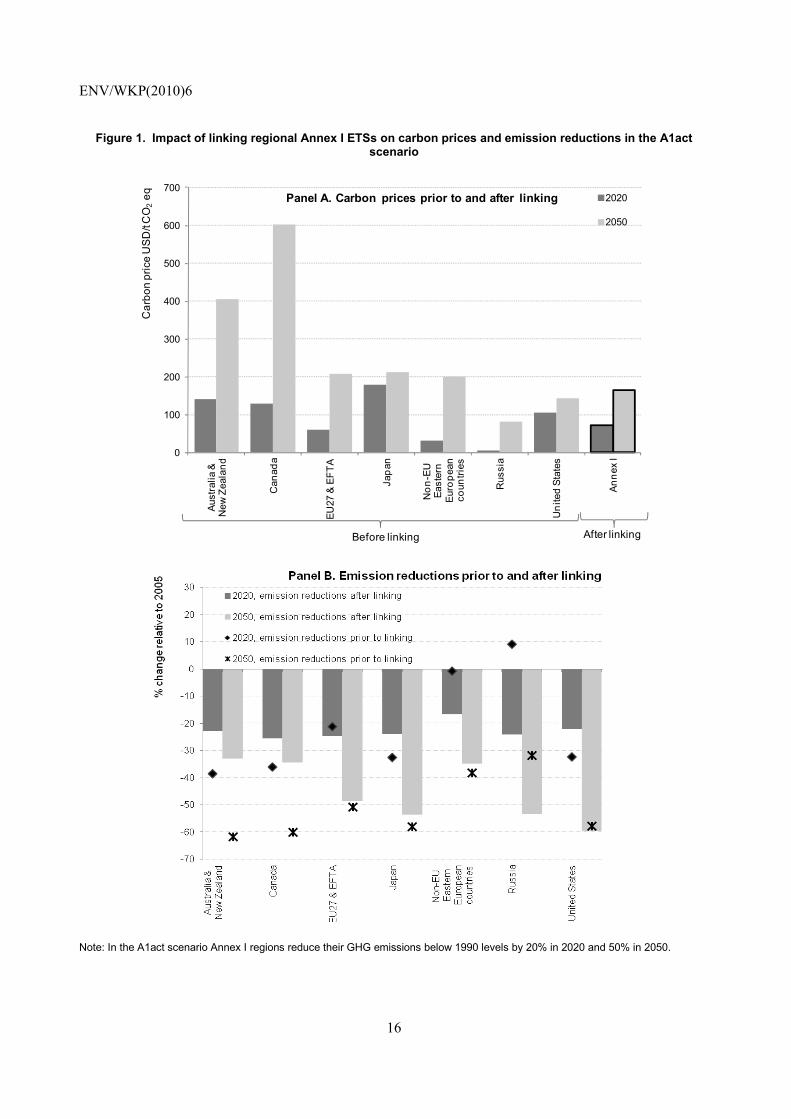
Simulations of the A1act scenario under alternative assumptions about trading possibilities (“linked” or “not linked”) among Annex I countries show that the reduction in mitigation costs is fairly limited in our illustrative scenario. This is mainly because carbon price differences prior to linking are estimated to be relatively small across the larger Annex I economies that account for the bulk of Annex I GDP (Figure 1 Panel A). Linking substitutes additional emission reductions in regions that had lower marginal abatement costs before linking (especially Russia, Figure 1, Panel B) for emission increases in the others (Figure 1 Panel B).
ENV/WKP(2010)6
16
Figure 1. Impact of linking regional Annex I ETSs on carbon prices and emission reductions in the A1act scenario
0
100
200
300
400
500
600
700
Aust
ralia
&
New
Zea
land
Can
ada
EU27
& E
FTA
Japa
n
Non
-EU
East
ern
Euro
pean
coun
tries
Rus
sia
Uni
ted
Stat
es
Anne
x I
Car
bon
pric
e U
SD/t C
O2
eq Panel A. Carbon prices prior to and after linking 2020
2050
After linkingBefore linking
Note: In the A1act scenario Annex I regions reduce their GHG emissions below 1990 levels by 20% in 2020 and 50% in 2050.

ENV/WKP(2010)6
17
Figure 2. Impact of linking regional Annex I ETSs on mitigation policy costs under the A1act scenario
-7.0
-6.0
-5.0
-4.0
-3.0
-2.0
-1.0
0.0Au
stra
lia &
New
Zea
land
Can
ada
EU27
& E
FTA
Japa
n
Non
-EU
Ea
ster
n Eu
rope
an
coun
tries Rus
sia
Uni
ted
Stat
es
Anne
x I
Miti
gatio
n co
st (i
ncom
e eq
uiva
lent
var
iatio
n
rela
tive
to b
asel
ine,
in %
)
Panel A. 2020
Without linking
With linking
-25.0
-20.0
-15.0
-10.0
-5.0
0.0
Aust
ralia
&N
ew Z
eala
nd
Can
ada
EU27
& E
FTA
Japa
n
Non
-EU
Ea
ster
n Eu
rope
an
coun
tries Rus
sia
Uni
ted
Stat
es
Anne
x I
Miti
gatio
n co
st (i
ncom
e eq
uiva
lent
var
iatio
n re
lativ
e to
bas
elin
e, in
%)
Panel B. 2050
Without linking
With linking

ENV/WKP(2010)6
18
In the unlinked case, meeting their domestic caps alone is found to cost Annex I regions about 1.5% and 2.8% of their income equivalent variation on average by 2020 and 2050, respectively (Figure 2). However, the associated reduction in overall mitigation costs for Annex I countries is just under 10%, or about 0.2 percentage points of income by 2050 (Figure 2, Panel B). Larger gains from linking could be found under more heterogeneous emission reduction commitments by Annex I countries than considered here.2
In addition to improving the overall cost-effectiveness of the linked ETS system, linking is expected to benefit each participating region (e.g. Jaffe and Stavins, 2007). The larger the change in the carbon price after linking, the larger the income gain, other things being equal. In turn, the carbon price level prior to linking depends on the size of the country’s commitment, as well as on the availability of cheap abatement opportunities. In the A1act scenario considered here, countries with lower pre-linking carbon prices (mainly Russia) gain because the equilibrium price of the linked system exceeds their pre-existing marginal abatement costs, enabling them to abate more and sell the saved permits with a surplus, while conversely regions with higher pre-linking carbon prices (Australia & New Zealand, Canada, Japan) benefit from the lower carbon price.
While such basic reasoning suggests that permit trading among Annex I regions could benefit all participants, various market imperfections complicate the picture. In our model simulation, non-EU Eastern European countries – which together form the “Rest of Annex I” region of the ENV-Linkages model – are actually found to lose from linking by 2050 (Figure 2). This is because their large permit exports lead to a real exchange rate appreciation, which in turn results in a fall in the exports and output of their manufacturing sector, where scrapping capital entails costs. Nevertheless, these “Dutch disease” effects are particularly large in the ENV-Linkages model, partly due to the assumption of fixed net international capital flows.. More broadly, the OECD ENV-Linkages model incorporates many market imperfections and distortions and, therefore, the impact of permit trading on each participating region has to be interpreted in a second-best context. One important consequence of this is that capital allocation in the BAU scenario is not optimal. As countries sell permits abroad, imports must rise and/or other exports must decline in order to satisfy the exogenous balance-of-payments constraint. Restoring the external balance requires an appreciation of the real exchange rate, which triggers costly reallocation of capital across sectors, reduces aggregate output and, in some cases, lowers income and welfare.
2 Sensitivity analysis confirms these small gains from direct linking, at least for relatively realistic distributions of commitments among Annex I countries.
ENV/WKP(2010)6
19
Mitigating competitiveness concerns
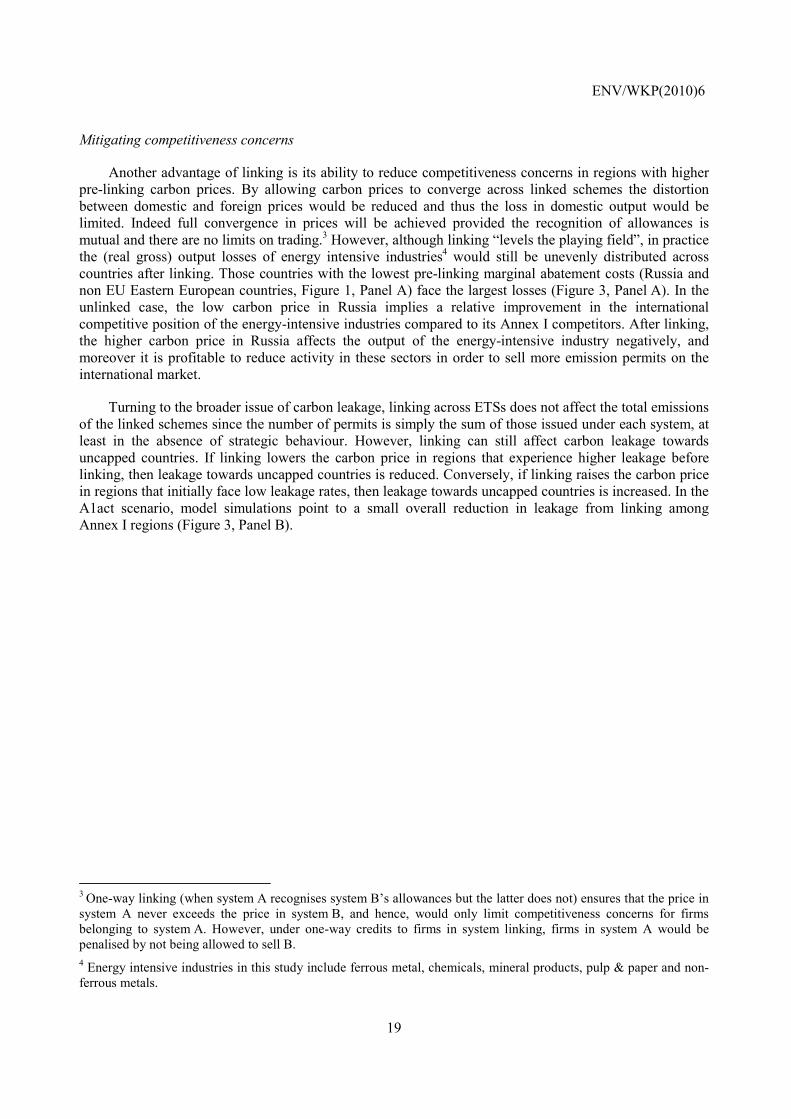
Another advantage of linking is its ability to reduce competitiveness concerns in regions with higher pre-linking carbon prices. By allowing carbon prices to converge across linked schemes the distortion between domestic and foreign prices would be reduced and thus the loss in domestic output would be limited. Indeed full convergence in prices will be achieved provided the recognition of allowances is mutual and there are no limits on trading.3 However, although linking “levels the playing field”, in practice the (real gross) output losses of energy intensive industries4 would still be unevenly distributed across countries after linking. Those countries with the lowest pre-linking marginal abatement costs (Russia and non EU Eastern European countries, Figure 1, Panel A) face the largest losses (Figure 3, Panel A). In the unlinked case, the low carbon price in Russia implies a relative improvement in the international competitive position of the energy-intensive industries compared to its Annex I competitors. After linking, the higher carbon price in Russia affects the output of the energy-intensive industry negatively, and moreover it is profitable to reduce activity in these sectors in order to sell more emission permits on the international market.
Turning to the broader issue of carbon leakage, linking across ETSs does not affect the total emissions of the linked schemes since the number of permits is simply the sum of those issued under each system, at least in the absence of strategic behaviour. However, linking can still affect carbon leakage towards uncapped countries. If linking lowers the carbon price in regions that experience higher leakage before linking, then leakage towards uncapped countries is reduced. Conversely, if linking raises the carbon price in regions that initially face low leakage rates, then leakage towards uncapped countries is increased. In the A1act scenario, model simulations point to a small overall reduction in leakage from linking among Annex I regions (Figure 3, Panel B).
3 One-way linking (when system A recognises system B’s allowances but the latter does not) ensures that the price in system A never exceeds the price in system B, and hence, would only limit competitiveness concerns for firms belonging to system A. However, under one-way credits to firms in system linking, firms in system A would be penalised by not being allowed to sell B. 4 Energy intensive industries in this study include ferrous metal, chemicals, mineral products, pulp & paper and non-ferrous metals.

ENV/WKP(2010)6
20
Figure 3. Impact of linking Annex I regional ETSs on carbon leakage and the output losses of energy intensive industries1 across linked regions under the A1act scenario in 2020
-25-23-21-19-17-15-13-11-9-7-5-3-1135
Aus
tralia
&N
ew Z
eala
nd
Can
ada
EU
27 &
EFT
A
Japa
n
Non
-EU
E
aste
rn E
urop
ean
coun
tries R
ussi
a
Uni
ted
Sta
tes
Out
put (
rela
tive
to b
asel
ine,
in %
) Panel A. Output of energy-intensive industries in Annex I regions
Without linking
With linking
0.0
1.0
2.0
3.0
4.0
5.0
6.0
7.0
Without linking With linking
% Panel B. Carbon leakage rate2 (Annex I as a whole)
1. Energy intensive industries include chemicals, metallurgic, other metal, iron and steel industry, paper and mineral products. 2. The carbon leakage rate is calculated as: [1-(world emission reduction in GtCO2eq)/(Annex I emission reduction objective in
GtCO2eq)]. It is expressed in per cent. When the emission reduction achieved at the world level (in GtCO2eq) is equal to the emission reduction objective set by Annex I (in GTCO2eq), there is no leakage overall, and the leakage rate is 0.

ENV/WKP(2010)6
21
Other potential benefits from direct linking
Linking can also deliver a number of other benefits that go beyond the scope of the gains that can be illustrated with a CGE model such as ENV-Linkages. In particular, linking schemes can improve cost-effectiveness by increasing the size and liquidity of carbon markets. In the A1act scenario presented above where Annex I ETSs are linked, the size of the carbon market is projected to reach 2.5% of Annex I GDP in 2020. A larger market size tends to dampen the impact of unanticipated shocks, thereby lowering overall carbon price volatility and enhancing incentives for firms to make emission reduction investments.5 Furthermore, transaction costs are expected to be smaller in a larger, more liquid market, especially if some regional schemes are too small to foster the development of institutions for reducing such costs. Larger market size also reduces problems that may arise if some sellers or buyers have market power (Hahn, 1984). Finally, market liquidity can lower the cost of insuring against carbon price uncertainty by fostering the development of derivative markets.
Compared with a global emissions trading system, it has also been argued that a linked system of regional ETSs may be an easier way to reflect the principle of “common but differentiated responsibilities and respective capabilities” across regions, and thereby to extend participation to developing countries (Jaffe and Stavins, 2007). Permit allocation rules make it possible to differentiate across regional commitments and costs under a top-down approach. However, such differentiation can also be achieved through regions’ own assessment of their responsibilities and reflecting their specific national circumstances – as revealed de facto by their target choice – under a bottom-up approach. The gains from linking Annex I ETSs to potential non-Annex I country ETSs would be larger than those achieved through linking within Annex I only, if the heterogeneity in pre-linking carbon prices (and hence in commitments or actions) between Annex I and non-Annex I is higher than within Annex I.
3.2 Indirect linking of carbon markets through a common crediting mechanism
Improving cost-effectiveness
Linking can also occur “indirectly” when at least two different ETSs allow part of their emission reductions to be achieved in other countries, as can happen for example through a common crediting mechanism such as the Clean Development Mechanism (CDM), which is one of the flexibility mechanisms of the Kyoto Protocol.
The CDM allows emission reduction projects in non-Annex I countries – i.e. developing countries, which have no GHG emission constraints – to earn certified emission reduction (CER) credits, each equivalent to one tonne of CO2eq. These CERs can be purchased and used by Annex I countries to meet part of their emission reduction commitments. In principle, assuming that developing country emitters do not take on binding emission commitments in the near future, well-functioning crediting mechanisms could improve the cost-effectiveness of GHG mitigation policies in developed countries, both directly and indirectly through partial linking of their ETSas well as reduce carbon leakage and competitiveness concerns by lowering the carbon price in developed countries.6
5 Carbon price volatility may still increase in one of the two schemes if the other is subject to larger and/or more frequent shocks, and is large enough to have significant influence on the overall carbon price after linking. 6 Additionally, indirect linking can boost clean technology transfers to developing countries; and facilitate the implementation of explicit carbon pricing policies in developing countries at a later stage by putting an opportunity cost on their GHG emissions. These elements are, however, not captured in our model simulations.

ENV/WKP(2010)6
22
Well-functioning crediting mechanisms appear to have very large potential for saving costs, reflecting the vast low-cost abatement potential existing in a number of emerging and developing countries, particularly China. Compared with the scenario A1act without direct linking between Annex I countries, allowing Annex I countries to meet 20% of their unilateral commitments through reductions in non-Annex I countries is estimated to reduce their mitigation costs by roughly 40% (Figure 4).
Figure 4. Impact of allowing access to a well functioning crediting mechanism on mitigation policy costs in each Annex I region under the A1act scenario
-7.0
-6.0
-5.0
-4.0
-3.0
-2.0
-1.0
0.0
Aust
ralia
&N
ew Z
eala
nd
Can
ada
EU
27 &
EFT
A
Japa
n
Non
-EU
Ea
ster
n E
urop
ean
coun
tries R
ussi
a
Uni
ted
Stat
es
Ann
ex IM
itiga
tion
cost
(inc
ome
equi
vale
nt v
aria
tion
rela
tive
to
base
line,
in %
)
Panel A. 2020
Without crediting mechanism
With crediting mechanism, 20% limit on use of offset credits
With crediting mechanism, 50% limit on use of offset credits
-20.0
-18.0
-16.0
-14.0
-12.0
-10.0
-8.0
-6.0
-4.0
-2.0
0.0
Aust
ralia
&N
ew Z
eala
nd
Can
ada
EU27
& E
FTA
Japa
n
Non
-EU
Ea
ster
n Eu
rope
an
coun
tries Ru
ssia
Uni
ted
Stat
es
Anne
x IMiti
gatio
n co
st (i
ncom
e eq
uiva
lent
var
iatio
n re
lativ
e to
ba
selin
e, in
%)
Panel B. 2050
Without crediting mechanism
With crediting mechanism, 20% limit on use of offset credits
With crediting mechanism, 50% limit on use of offset credits
Note: In the A1act scenario Annex I regions reduce their GHG emissions below 1990 levels by 20% in 2020 and 50% in 2050.
Raising the cap on offsets allowed from 20% to 50% would bring substantial further benefits. Cost savings are found to be largest for those Annex I regions that would otherwise face the highest marginal abatement costs – and, therefore, the highest carbon price levels (Figure 5) – and/or are most carbon-intensive. Australia & New Zealand, and Canada fall into both categories, while Russia falls into the latter. Non-Annex I regions would enjoy a slight income gain from exploiting cheap abatement opportunities and selling them profitably in the form of offset credits. In this illustrative scenario, China

ENV/WKP(2010)6
23
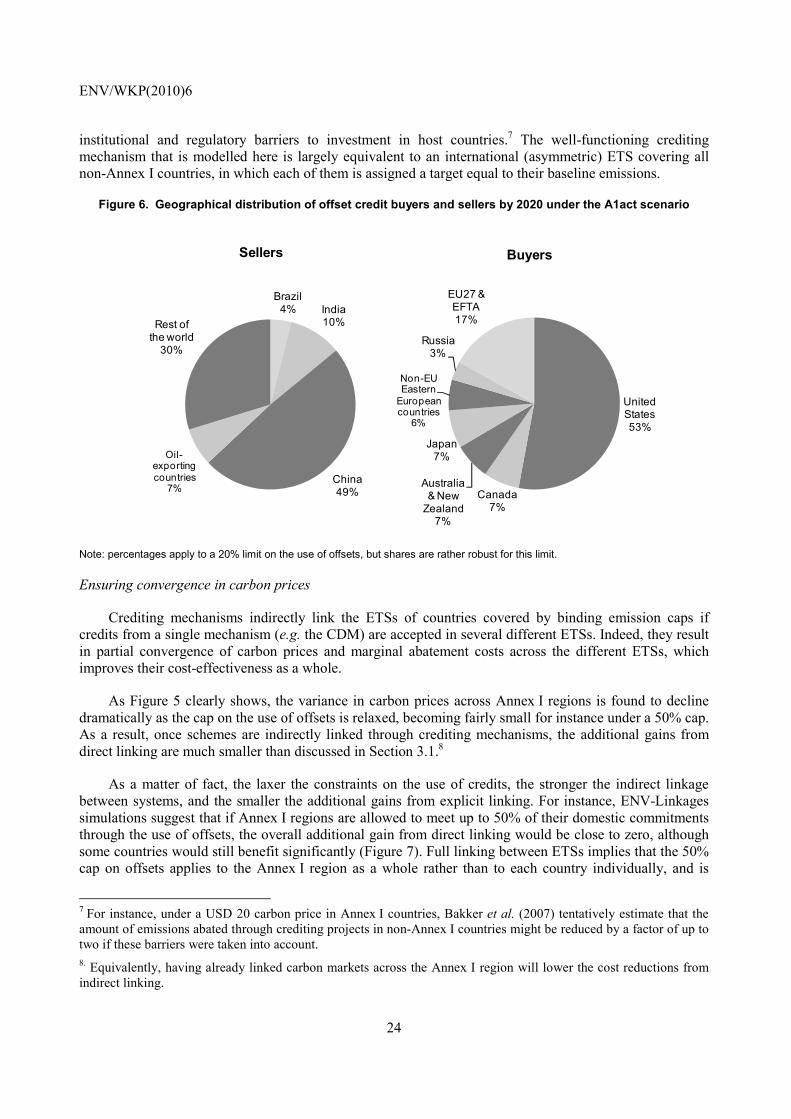
would be by far the largest seller and the United States the largest buyer in the offset credit market, accounting for about half of worldwide sales and purchases by 2020, respectively (Figure 6).
Figure 5. Impact of a well functioning crediting mechanism on carbon prices under the A1act scenario
0.0
20.0
40.0
60.0
80.0
100.0
120.0
140.0
160.0
180.0
200.0
Aus
tralia
&N
ew Z
eala
nd
Can
ada
EU
27 &
EFT
A
Japa
n
Non
-EU
E
aste
rn
Eur
opea
n co
untri
es
Rus
sia
Uni
ted
Sta
tes
Non
-Ann
ex I
USD
/ t C
O2eq
Panel A. 2020
Without crediting mechanism
With crediting mechanism, 20% limit on use of offset credits
With crediting mechanism, 50% limit on use of offset credits
0.0
100.0
200.0
300.0
400.0
500.0
600.0
700.0
Aus
tralia
&N
ew Z
eala
nd
Can
ada
EU
27 &
EFT
A
Japa
n
Non
-EU
E
aste
rn E
urop
ean
coun
tries R
ussi
a
Uni
ted
Sta
tes
Non
-Ann
ex I
USD
/ t C
O2eq
Panel B. 2050
Without crediting mechanism
With crediting mechanism, 20% limit on use of offset credits
With crediting mechanism, 50% limit on use of offset credits
One caveat to these cost saving and trade flow estimates is that they assume a crediting mechanism
with no transaction costs and no uncertainty on delivery, as is apparent from the very low projected offset prices in these simulations (Figure 5). In practice, there are numerous market imperfections and policy distortions which may prevent some of the non-Annex I abatement potential from being fully reaped. These include transaction costs and bottlenecks, information barriers, credit market constraints, and
ENV/WKP(2010)6
24
institutional and regulatory barriers to investment in host countries.7 The well-functioning crediting mechanism that is modelled here is largely equivalent to an international (asymmetric) ETS covering all non-Annex I countries, in which each of them is assigned a target equal to their baseline emissions.
Figure 6. Geographical distribution of offset credit buyers and sellers by 2020 under the A1act scenario
Brazil4% India
10%
China49%
Oil-exporting countries
7%
Rest of the world
30%
Sellers
United States53%
Canada7%
Australia & New
Zealand7%
Japan7%
Non-EU Eastern
European countries
6%
Russia3%
EU27 &EFTA17%
Buyers
Note: percentages apply to a 20% limit on the use of offsets, but shares are rather robust for this limit.
Ensuring convergence in carbon prices
Crediting mechanisms indirectly link the ETSs of countries covered by binding emission caps if credits from a single mechanism (e.g. the CDM) are accepted in several different ETSs. Indeed, they result in partial convergence of carbon prices and marginal abatement costs across the different ETSs, which improves their cost-effectiveness as a whole.
As Figure 5 clearly shows, the variance in carbon prices across Annex I regions is found to decline dramatically as the cap on the use of offsets is relaxed, becoming fairly small for instance under a 50% cap. As a result, once schemes are indirectly linked through crediting mechanisms, the additional gains from direct linking are much smaller than discussed in Section 3.1.8
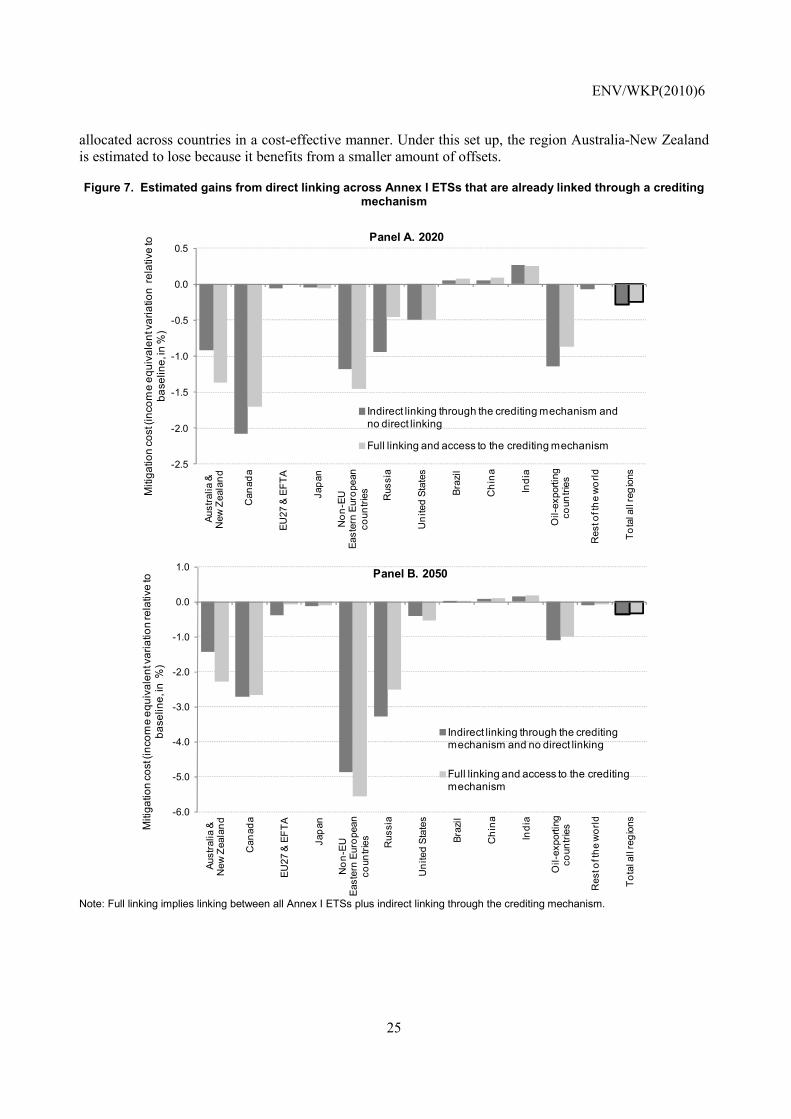
As a matter of fact, the laxer the constraints on the use of credits, the stronger the indirect linkage between systems, and the smaller the additional gains from explicit linking. For instance, ENV-Linkages simulations suggest that if Annex I regions are allowed to meet up to 50% of their domestic commitments through the use of offsets, the overall additional gain from direct linking would be close to zero, although some countries would still benefit significantly (Figure 7). Full linking between ETSs implies that the 50% cap on offsets applies to the Annex I region as a whole rather than to each country individually, and is
7 For instance, under a USD 20 carbon price in Annex I countries, Bakker et al. (2007) tentatively estimate that the amount of emissions abated through crediting projects in non-Annex I countries might be reduced by a factor of up to two if these barriers were taken into account. 8. Equivalently, having already linked carbon markets across the Annex I region will lower the cost reductions from indirect linking.
ENV/WKP(2010)6
25
allocated across countries in a cost-effective manner. Under this set up, the region Australia-New Zealand is estimated to lose because it benefits from a smaller amount of offsets.
Figure 7. Estimated gains from direct linking across Annex I ETSs that are already linked through a crediting mechanism
-2.5
-2.0
-1.5
-1.0
-0.5
0.0
0.5
Aust
ralia
&N
ew Z
eala
nd
Can
ada
EU27
& E
FTA
Japa
n
Non
-EU
Ea
ster
n Eu
rope
an
coun
tries Rus
sia
Uni
ted
Stat
es
Braz
il
Chi
na
Indi
a
Oil-
expo
rting
co
untri
es
Res
t of t
he w
orld
Tota
l all
regi
ons
Miti
gatio
n co
st (i
ncom
e eq
uiva
lent
var
iatio
n re
lativ
e to
ba
selin
e, in
%)
Panel A. 2020
Indirect linking through the crediting mechanism and no direct linking
Full linking and access to the crediting mechanism
-6.0
-5.0
-4.0
-3.0
-2.0
-1.0
0.0
1.0
Aust
ralia
&N
ew Z
eala
nd
Can
ada
EU27
& E
FTA
Japa
n
Non
-EU
Ea
ster
n Eu
rope
an
coun
tries Rus
sia
Uni
ted
Stat
es
Braz
il
Chi
na
Indi
a
Oil-
expo
rting
co
untri
es
Res
t of t
he w
orld
Tota
l all
regi
ons
Miti
gatio
n co
st (i
ncom
e eq
uiva
lent
var
iatio
n re
lativ
e to
ba
selin
e, in
%)
Panel B. 2050
Indirect linking through the crediting mechanism and no direct linking
Full linking and access to the crediting mechanism
Note: Full linking implies linking between all Annex I ETSs plus indirect linking through the crediting mechanism.
ENV/WKP(2010)6
26
4. Alternative set ups for linking ETSs
4.1 Alternative baselines for CDM credits
The choice of a project baseline against which certified emission rights (CERs) are granted does not only have an impact on the volume of credits generated, but also matters for carbon leakage. This is because an emissions baseline established before the project is implemented can vary depending on the assumptions made about policies and projects in other sectors and regions, and their effect on output and emissions within the project boundary. Three approaches can be identified in setting a baseline:
1. Accounting for the impact of all other CDM projects on the project’s expected emissions. If these other projects lower the international carbon price and thus reduce leakage from countries covered by binding emission caps within the project boundary, they should lower the project’s emission baseline. This would be the “theoretically correct” baseline under current UNFCCC guidelines. However, implementing this approach is complex and costly, and would likely remain so even under a scaled-up CDM.
2. Excluding the impact of all other projects on the project’s expected emissions. Because of the complexity and cost of the first approach, the CDM Executive Board currently takes as the baseline the project’s emission level under a scenario where some countries – currently most of the Annex I countries – have emission commitments while the rest of the world does not. This therefore does not account for the effect of other CDM projects on the output from, and therefore credit generated by any particular project. Implicitly, this assumes that all individual CDM projects have a marginal effect on the world economy. This is the approach that is adopted in the base simulations in Section 3.
3. Setting the baseline as the BAU emission level in a hypothetical “no world action” scenario where no country has binding emission commitments. In this case, CDM projects would receive fewer credits than under approach 1, as they would be required to more than offset any leakage within the project boundary resulting from binding emission caps in other sectors and regions. However, this approach would ceteris paribus imply either a lower credit volume than approach 2, or more domestic action in host countries. This alternative addresses some of the concerns with current practice whereby “market leakage” is not taken into account in CDM baselines (cf. Vöhringer et al, 2006), and this section analyses to what extent it will affect the model results.
Under all three approaches, Kallbeken (2007) finds that the CDM lowers the carbon price differential between countries that face binding emissions caps and other countries, and thereby reduces leakage (all other factors being equal). However, these leakage reductions are typically smaller under approach 2 as used in Section 3. This is because approach 2 does not account for the fact that implementing all other CDM projects together reduces international carbon prices, leakage and thereby the projected emissions of any other project considered.
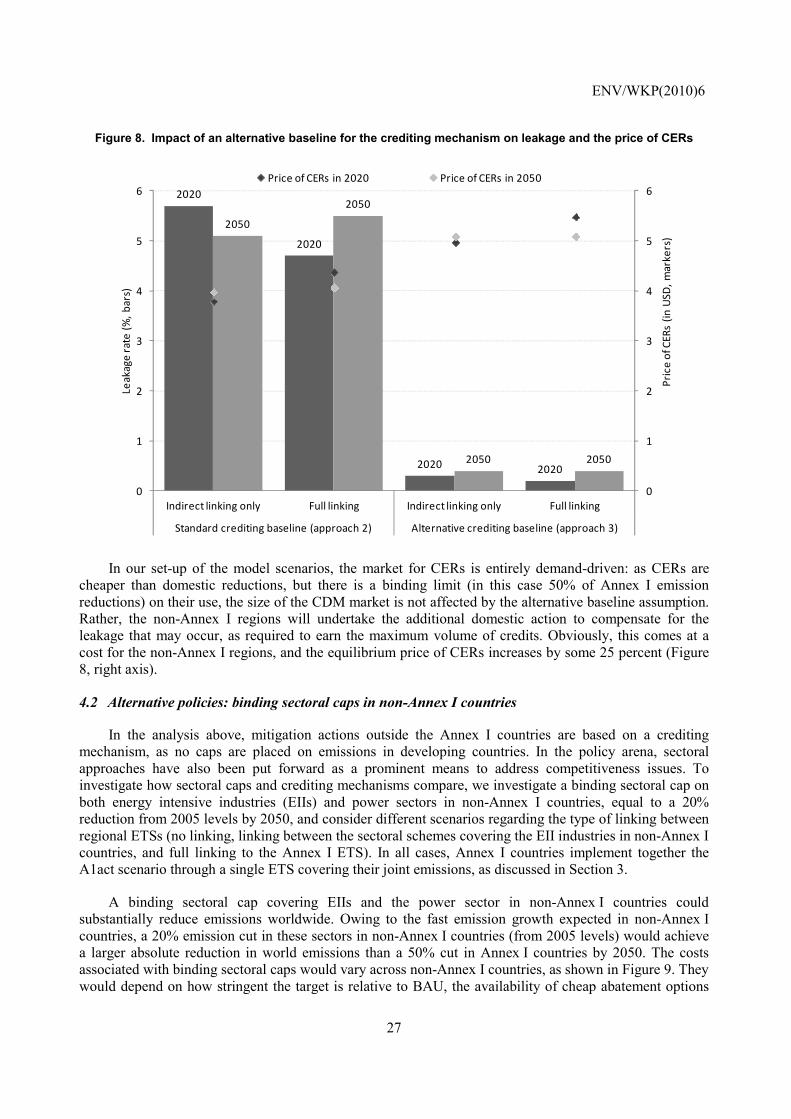
Figure 8 shows how the alternative definition of the baseline for assigning credits using approach 3 could virtually eliminate the leakage from the Annex I mitigation actions. The figure shows both the cases of indirect linking only (i.e. there is no direct linking of ETSs in Annex I countries) and full linking (i.e. both indirect linking through the crediting mechanism and direct linking of Annex I ETSs).
ENV/WKP(2010)6
27
Figure 8. Impact of an alternative baseline for the crediting mechanism on leakage and the price of CERs
2020
2020
2020 2020
2050
2050
2050 2050
0
1
2
3
4
5
6
0
1
2
3
4
5
6
Indirect linking only Full linking Indirect linking only Full linking
Standard crediting baseline (approach 2) Alternative crediting baseline (approach 3)
Pric
e of
CER
s (in
USD
, mar
kers
)
Leak
age
rate
(%, b
ars)
Price of CERs in 2020 Price of CERs in 2050
In our set-up of the model scenarios, the market for CERs is entirely demand-driven: as CERs are cheaper than domestic reductions, but there is a binding limit (in this case 50% of Annex I emission reductions) on their use, the size of the CDM market is not affected by the alternative baseline assumption. Rather, the non-Annex I regions will undertake the additional domestic action to compensate for the leakage that may occur, as required to earn the maximum volume of credits. Obviously, this comes at a cost for the non-Annex I regions, and the equilibrium price of CERs increases by some 25 percent (Figure 8, right axis).
4.2 Alternative policies: binding sectoral caps in non-Annex I countries
In the analysis above, mitigation actions outside the Annex I countries are based on a crediting mechanism, as no caps are placed on emissions in developing countries. In the policy arena, sectoral approaches have also been put forward as a prominent means to address competitiveness issues. To investigate how sectoral caps and crediting mechanisms compare, we investigate a binding sectoral cap on both energy intensive industries (EIIs) and power sectors in non-Annex I countries, equal to a 20% reduction from 2005 levels by 2050, and consider different scenarios regarding the type of linking between regional ETSs (no linking, linking between the sectoral schemes covering the EII industries in non-Annex I countries, and full linking to the Annex I ETS). In all cases, Annex I countries implement together the A1act scenario through a single ETS covering their joint emissions, as discussed in Section 3.
A binding sectoral cap covering EIIs and the power sector in non-Annex I countries could substantially reduce emissions worldwide. Owing to the fast emission growth expected in non-Annex I countries, a 20% emission cut in these sectors in non-Annex I countries (from 2005 levels) would achieve a larger absolute reduction in world emissions than a 50% cut in Annex I countries by 2050. The costs associated with binding sectoral caps would vary across non-Annex I countries, as shown in Figure 9. They would depend on how stringent the target is relative to BAU, the availability of cheap abatement options

ENV/WKP(2010)6
28
(the shape of the marginal abatement cost curve), the carbon intensity of output, and whether international permit trading between EIIs in non-Annex I countries is allowed. In the illustrative scenario considered here, India is found to incur larger mitigation costs than China, mainly due to its faster projected BAU emission growth, which in turn reflects in part faster population growth. However, that gap would be reduced substantially if international permit trading (internal linking) was allowed across non-Annex I regions. While non-Annex I countries face a smaller emission reduction relative to BAU than Annex I countries (-25% versus -30% by 2020 and -40% versus -60% by 2050 for total emissions) and benefit from their larger potential to reduce emissions more cheaply, non-Annex I countries would incur larger costs (more than 3% of their joint income in 2020, compared to less than 1.5% for Annex I countries), reflecting their higher carbon intensity, particularly by 2020, and the concentration of mitigation efforts in EIIs only.
Figure 9. Mitigation costs under an international ETS in Annex I and binding sectoral caps in non Annex I regions
50% cut in Annex I regions and 20% cut in EEIs and power sector in non-Annex I regions by 2050
-25.0
-20.0
-15.0
-10.0
-5.0
0.0
Aus
tralia
&N
ew Z
eala
nd
Can
ada
EU
27 &
EFT
A
Japa
n
Non
-EU
Eas
tern
E
urop
ean
coun
tries
Rus
sia
Uni
ted
Sta
tes
Ann
ex I
Bra
zil
Chi
na
Indi
a
Oil-
expo
rting
co
untri
es
Res
t of t
he W
orld
Non
-Ann
ex I
Miti
gatio
n co
st (i
ncom
e eq
uiva
lent
var
iatio
n re
lativ
e to
bas
elin
e, in
%
) Without any linking
With direct linking within non-Annex I sectoral schemes
With full linking between Annex I economy-wide and non-Annex I sectoral schemes
Note: All scenarios combine a 50% emission cut in Annex I (relative to 1990 levels) and a 20% cut in EIIs and the power sector in non-Annex I (relative to 2005 levels) by 2050.
Linking sectoral ETSs in non-Annex I countries to economy-wide ETSs in Annex I countries could
also generate aggregate economic gains by exploiting the heterogeneity of (marginal) abatement costs between the two areas. As Figure 9 shows, these additional gains are limited, and mostly concentrated in the Annex I countries. Note also that such linking could have significant redistributive effects across countries. Therefore, allocation rules may need to be adjusted upon linking to ensure that the gains from linking are shared widely across participating countries.

ENV/WKP(2010)6
29
5. Practical issues raised by linking
While linking ETSs either directly or indirectly can be an important step towards the emergence of a single international carbon price, it raises a number of difficulties and risks in practice that will need to be addressed. These concerns can not in general be analysed within the context of the model.
One of the major risks associated with a linked system of several independent and heterogeneous ETSs and crediting mechanisms is that its overall environmental performance could be weak. This is partly because the region with the lower carbon price ex ante has an incentive to relax its cap in order to generate additional revenue from exporting allowances – and a larger gain from linking more broadly once systems are linked (Helm, 2003; Rehdanz and Tol, 2005). In order to alleviate this, the region with the higher carbon price may also relax its target, thereby triggering a "race to the bottom". Another source of environmental concern is that linking would automatically lead to the spreading across regions of provisions to contain the cost of mitigation (cost-containment measures), such as carbon price caps ("safety valves") and the use of crediting mechanisms (see OECD, 2009; Ellis and Tirpak, 2006; Jaffe and Stavins, 2007; and Flachsland et al. 2009). For example, the use of the safety valve implies that the overall target is relaxed once the price cap is reached, while in the absence of linking the scheme without any safety valve would retain control over its own target.9 Likewise, linking to an offset credit system whose environmental integrity is weaker than that of an ETS could raise environmental concerns in countries that have more restrictive policies regarding the use and quality of offsets.
Linking would automatically lead to the spreading of a number of other design features specific to one particular scheme, such as provisions for credits to be banked or borrowed from future commitment periods. As a result, governments in the linked regions would lose control over several features of their existing ETS. The impact of linking an ETS with intensity targets to an ETS with absolute targets depends on the permit allocation rules. If the cap on emissions in the system with the intensity target is set ex ante on the basis of projected GDP growth, then that scheme is de facto equivalent to an ETS with an absolute cap, and linking does not affect overall emissions. By contrast, if the permit authority of the intensity target scheme regularly adjusts the supply of permits in order to meet its intensity target, overall emissions will fluctuate. Overall environmental performance does not have to be undermined if emissions merely fluctuate around the level that would prevail under absolute caps, but it could be affected if GDP growth is higher than anticipated, or if the intensity target system creates an incentive to increase production and emissions in order to obtain additional credits, as could be the case under firm or sector-level (as opposed to economy-wide) intensity targets.
Against this background, in order to facilitate future linking, participating governments should seek to agree on their targets and the ETS design features to be harmonised prior to linking, including cost containment measures, decisions to link to another system, and how to co-ordinate monitoring, reporting and verification efforts (OECD, 2009; Haites and Wang, 2006). However, this has not happened so far in practice. Centralised institutions that support implementation of the UNFCCC, the Kyoto Protocol, and any future protocol could help by providing an international framework to discuss issues of linking national and regional ETSs.
Although linking ETSs tends in general to lower the mitigation cost of each of the participating regions, it also affects the distribution of costs within schemes. Within regions where linking leads to a carbon price increase, permit sellers gain while permit buyers lose, (and vice versa within regions where linking results in a carbon price decline). However, these distributional effects are similar in nature to those of international trade, and as such they do not provide a compelling argument for limiting linking. Some of
9. Partly for these reasons, the EU directive on linkage currently forbids linking the EU-ETS to a scheme featuring a safety valve.

ENV/WKP(2010)6
30
the associated political economy problems can be reduced through permit allocation rules if necessary, for instance through allowing transitory grandfathering10 upon linking in regions with lower pre-linking carbon price.
In its current form, the CDM raises a number of concerns that are comparatively greater than those arising from direct linking and which, if not addressed, will undermine its ability to deliver the expected benefits. The so-called additionality criterion, under which only emission reductions that can be attributed to the mitigation project give rise to carbon credits (technically called Certified Emission Rights, or CERs), is key to ensuring the environmental integrity of the CDM. Otherwise, CERs would amount to a mere income transfer to recipient countries without reducing GHG emissions. In practice, it has been argued that a large share of CDM projects do not bring about actual reductions in emissions (ECCP, 2007; Schneider, 2007; Wara and Victor, 2008). The CDM can also create perverse incentives to raise initial investment and output in carbon-intensive equipment, so as to get emission credits for reducing emissions later, depending on expectations about how future baselines will be set. Another incentive problem is that the large financial inflows from which developing countries may benefit under a future CDM could undermine their willingness to take on binding emission commitments at a later stage (OECD, 2009).
A number of other risks stem from the development of increasingly large carbon markets as more countries undertake mitigation actions. For instance, the size of carbon markets is estimated to reach 2.3% of GDP in Annex I countries by 2050 under the linked A1act scenario11, and 5% of world GDP under a global ETS that stabilises overall GHG concentration below 550 ppm CO2eq.12 Three major risks can be identified that would have to be addressed:
• Lack of market liquidity. Liquid primary markets foster the emergence of derivative instruments that would lower the cost for firms to insure against future carbon price uncertainty. Liquid markets would also reduce the opportunities for market manipulation. Market liquidity could be enhanced through the regular spot sales of short-term permits, allowing banking and ensuring credible commitments on future mitigation policies.
• Risk associated with the development of derivative markets. This risk will be partly addressed by identifying and certifying financial market authorities responsible for carbon markets.
• A counterparty risk that could lead to market dysfunction as a large share of current trading is conducted through bilateral over-the-counter negotiations between participants. This risk can be mitigated by extending the access to clearinghouses and/or introducing penalties for performance failure in contracts.
10 Grand-fathering consists in allocating permits for free on the basis of historical emissions. 11 In the case with direct linking, this is slightly less (2.1% of Annex I GDP), as carbon prices are lower. 12. By comparison, for instance, in 2007 the US sub-prime mortgage market (total outstanding amount of sub-prime loans) amounted to about 9.5% of US GDP, or about 3% of world GDP at current exchange rates (OECD, 2007).

ENV/WKP(2010)6
31
6. Concluding remarks
Both direct and indirect linking of emissions trading schemes (ETSs) can help to reduce the cost of international climate mitigation action. In the long run, it is essential to achieve ambitious global emission reductions at low cost, and this paper has provided evidence that linked ETSs can play a pivotal role in this regard. However, various design issues will have to be addressed for direct and indirect linking to deliver their full benefits. Furthermore, market mechanisms are unable to deal with all the market imperfections (monitoring, enforcement and asymmetric information problems) which prevent some emitters from responding to price signals. Therefore, a broader mix of policy instruments in addition to emissions pricing will likely be needed. But while multiple market failures arguably call for multiple policy instruments, poorly-designed policy mixes could result in undesirable overlaps.
ETSs can also play an important role in scaling up international funding for climate action, and provide incentives for persuade countries to participate in a broad and ambitious mitigation policy. The size of the carbon market can be substantial, and in our simulations amounts to more than 2% of GDP in 2050 in Annex I countries alone. Implementing ETSs and allowing international trading of the associated permits, i.e. linking domestic carbon markets, can thus achieve the dual goal of increasing the environmental ambition and the cost-effectiveness of international mitigation action. This is essential for a successful international climate policy framework in the coming years.

ENV/WKP(2010)6
32
REFERENCES
Anger, N. (2008), “Emissions trading beyond Europe: linking schemes in a post-Kyoto world”, Energy Economics 30, 2028-2049.
Bakker, A., et al. (2007), “Carbon Credit Supply Potential Beyond 2012: A Bottom-up Assessment of Mitigation Options”, Energy Research Centre of the Netherlands Report ECN-E—07-090.
Burniaux, J-M., G. Nicoletti and J. Oliveira Martins (1992), “GREEN: A Global Model for Quantifying the Costs of Policies to Curb CO2 Emissions”, OECD Economic Studies, 19 (Winter).
Castles, I. and D. Henderson (2003a), “Economics, Emission Scenarios and the Work of the IPCC”, Energy and Environment, Vol. 14, No. 4.
Castles, I. and D. Henderson (2003b), “The IPCC Emission Scenarios: an Economic-Statistical Critique”, Energy and Environment, Vol. 14, No. 2-3.
Dimaranan, B.V., Editor (2006). Global Trade, Assistance, and Production: The GTAP 6 Data Base, Center for Global Trade Analysis, Purdue University.
Duval, R. and C. de la Maisonneuve (2010), “Long-Run Growth Scenarios for the World Economy”, Journal of Policy Modeling, Vol. 32, No. 1.
Easterly, W. and R. Levine (2001), “It’s Not Factor Accumulation: Stylized Facts and Growth Models”, World Bank Economic Review, Vol. 15, No. 2.
ECCP (2007), European Climate Change Platform Meeting Report, October.
Ellis, J. and D. Tirpak (2006), “Linking GHG Emission Trading Systems and Markets,” OECD/IEA, http://www.oecd.org/dataoecd/45/35/37672298.pdf.
Flachsland, C., R. Marschinski, and O. Edenhofer (2009), "Global Trading versus Linking: Architectures for International Emissions Trading," Energy Policy 37, 1637-1647.
Haites, E., and X. Wang (2006), “Ensuring the Environmental Effectiveness of Linked Emissions Trading Schemes, Margaree Consultants Paper 2006-5.
Hall, R. and C. Jones (1999), “Why Do Some Countries Produce So Much More Output than Others?”, Quarterly Journal of Economics, Vol. 114, No. 1.
Helm, C. (2003), “International Emissions Trading with Endogenous Allowance Choices”, Journal of Public Economics, Vol. 87.
Howe, H. (1975), “Development of the extended linear expenditure system from simple saving assumptions”, European Economic Review 6, 305-310.

ENV/WKP(2010)6
33
Lluch, C. (1973), “The extended linear expenditure system”, European Economic Review, Vol. 4, p. 21-32.
IEA (2008), World Energy Outlook 2008, Paris.
Jaffe, J. and R. Stavins (2007), “Linking Tradable Permit Systems for Greenhouse Gas Emissions: Opportunities, Implications, and Challenges”, IETA report.
Jaffe, J. and R. Stavins (2008), Linkage of tradable permit systems in international climate, FEEM Nota di Lavoro 90.2008, Milan.
Kallbekken, S. (2007), “Why the CDM will Reduce Carbon Leakage”, Climate Policy, Vol. 7, No. 3.
Nakicenovic, N., et al. (2000), Special Report on Emission Scenarios. Working Group III, Inter-Governmental Panel on Climate Change (IPCC), Cambridge University Press, Cambridge.
OECD (2004), Sources of Economic Growth, Paris.
OECD (2007), Financial Market Trends, No. 94, Paris.
OECD (2009), The Economics of Climate Change Mitigation: Policies and Options for Global Action beyond 2012, Paris.
Rehdanz, K. and R.S.J. Tol (2005), “Unilateral Regulation of Bilateral Trade in Greenhouse Gas Emission Permits”, Ecological Economics, Vol. 54, pp. 397-416.
Schneider, L. (2007),” Is the CDM Fulfilling its Environmental and Sustainable Development Objectives? An Evaluation of the CDM and Options for Improvement”, Report prepared for WWF, Öko-Institut, Berlin.
Tuerk, A., M. Mehling, C. Flachsland and W. Sterk (2009), “Linking carbon markets: concepts, case studies and pathways”, Climate Policy 9, 341-357.
Vöhringer, F., T. Kuosmanen and R. Dellink (2006), “How to Attribute Market Leakage to CDM Projects”, Climate Policy, Vol. 5, No. 5.
Wara, W. and D. Victor (2008), “A Realistic Policy on International Carbon Offsets”, Working Paper No.°74, Stanford University.

ENV/WKP(2010)6
34
ANNEX 1. KEY CHARACTERISTICS OF THE ENV-LINKAGES MODEL
Table A1. ENV-Linkages model sectors
1) Rice 14) Food Products
2) Other crops 15) Other Mining
3) Livestock 16) Non-ferrous metals
4) Forestry 17) Iron & steel
5) Fisheries 18) Chemicals
6) Crude Oil 19) Fabricated Metal Products
7) Gas extraction and distribution 20) Paper & Paper Products
8) Fossil Fuel Based Electricity 21) Non-Metallic Minerals
9) Hydro and Geothermal electricity 22) Other Manufacturing
10) Nuclear Power 23) Transport services
11) Solar& Wind electricity 24) Services
12) Renewable combustibles and waste electricity 25) Construction & Dwellings
13) Petroleum & coal products 26) Coal

ENV/WKP(2010)6
35
Table A2. ENV-Linkages model regions
ENV-Linkages regions GTAP countries/regions
1) Australia & New Zealand Australia, New Zealand
2) Japan Japan
3) Canada Canada
4) United States United States
5) European Union 27 & EFTA
Austria, Belgium, Denmark, Finland, Greece, Ireland, Luxembourg, Netherlands, Portugal, Sweden, France, Germany, United Kingdom, Italy, Spain, Switzerland, Rest of EFTA, Czech Republic, Slovakia, Hungary, Poland, Romania, Bulgaria, Cyprus, Malta, Slovenia, Estonia, Latvia, Lithuania
6) Brazil Brazil
7) China China, Hong Kong
8) India India
9) Russia Russian Federation
10) Oil-exporting countries Indonesia, Venezuela, Rest of Middle East, Islamic Republic of Iran, Rest of North Africa, Nigeria
11) Non-EU Eastern European countries
Croatia, Rest of Former Soviet Union
12) Rest of the world Korea, Taiwan, Malaysia, Philippines, Singapore, Thailand, Viet Nam, Rest of East Asia, Rest of Southeast Asia, Cambodia, Rest of Oceania, Bangladesh, Sri Lanka, Rest of South Asia, Pakistan, Mexico, Rest of North America, Central America, Rest of Free Trade Area of Americas, Rest of the Caribbean, Colombia, Peru, Bolivia, Ecuador, Argentina, Chile, Uruguay, Rest of South America, Paraguay, Turkey, Rest of Europe, Albania, Morocco, Tunisia, Egypt, Botswana, Rest of South African Customs Union, Malawi, Mozambique, Tanzania, Zambia, Zimbabwe, Rest of Southern African Development Community, Mauritius, Madagascar, Uganda, Rest of Sub-Saharan Africa, Senegal, South Africa.

ENV/WKP(2010)6
36
Figure A1. Structure of production in ENV Linkages
Non – CO2 GHG
Domestic goods and services
Demand for Intermediate goods and services
Demand forLabour
Value-added plus energy
Imported goods and services
Demand for Capital and Energy
Substitution between material inputs and VA plus energy (σp)
“Armington» specification” (σm)
Substitution between material inputs (σn)
Demand for Energy
Demand for Capital and Specific factor
Capital Specific factor Demand by region of origin
Substitution between VA and Energy (σv)
Substitution between Capital and Specific Factor (σE)
Substitution between Capital and Specific Factor (σk)
Gross Output of sector i
Net-of-GHG Output Non-CO2 GHG Bundle
Substitution between GHGs Bundle and output (σGhg)
Sub. between GHG (σemi)
CO2

ENV/WKP(2010)6
37
ANNEX 2. CONSTRUCTING A BUSINESS-AS-USUAL BASELINE PROJECTION
Assumptions about drivers of GDP
Baseline economic scenarios underlying climate change projections – such as those developed for the IPCC (Nakicenovic et al., 2000) – typically assume that there will be some gradual convergence of income levels towards those of most developed economies. A similar approach is taken here, but special emphasis is put on integrating some of the current theoretical and empirical knowledge on long-term economic growth, and making transparent assumptions about the drivers of GDP growth over the projection period (for discussion of assumptions, detailed results and data sources, see Duval and De la Maissonneuve, 2010).
A “conditional convergence” hypothesis is incorporated into the projections. Following past research (e.g. Hall and Jones, 1999; Easterly and Levine, 2001), and based on a standard aggregate Cobb-Douglas production function with physical capital, human capital, labour and labour-augmenting technological progress, GDP per capita is first decomposed as follows for 2005:
)/()/(/ )1/(tttttttt PopLhAYKPopY αα −=
where Yt/Popt, Kt/Yt, At, ht, and Lt/Popt denote the level of GDP per capita (using PPP exchange rates to convert national GDPs into a common currency), the capital/output ratio, total factor productivity (TFP), human capital per worker and the employment rate, respectively. α is the capital share in aggregate output.
Based on this, long-term projections are then made for each of the four components so as to project the future path of GDP per capita:
• Long-term annual TFP growth at the “frontier”, defined as the average of the “high-TFP” OECD countries, is 1.5%. The speed at which other countries converge to that frontier is assumed to tend gradually towards 2% annually.
• Where it is currently highest, the human capital of the 25-29 age group is assumed to level off, based on past experience. The speed at which other countries converge to that frontier is assumed to tend gradually towards a world average between 1960 and 2000. The human capital of the working-age population is then projected by cohorts.
• Capital/output ratios in all countries gradually converge to current levels in the United States, which is implicitly assumed to be on a balanced growth path. In other words, marginal returns to capital converge across countries over the very long term in a world where international capital is mobile.
• Employment projections combine population, participation and unemployment scenarios. We have used the United Nations population projections (baseline scenario). In those OECD countries where participation is currently highest, future retirement ages are partially indexed to life expectancy. Elsewhere, participation rates gradually converge to the average in “frontier” countries. Unemployment rates converge to 5%.

ENV/WKP(2010)6
38
This framework was applied to 76 countries, covering 90% of the world’s GDP and population in 2005. For all other countries, the productivity convergence scenario to labour productivity or GDP per capita was applied instead of TFP. The approach followed addresses recent criticisms of economic projections using market exchange rates, which form the vast majority of scenarios in the literature (e.g. Castles and Henderson, 2003a, 2003b). This is achieved in two ways: (i) By using purchasing power parities (PPPs), not market exchange rates, to compare initial income per capita levels; (ii) by assuming faster future productivity growth in tradable than in non-tradable industries, in line with historical patterns. Reflecting this “Baumol-Balassa-Samuelson” effect, the real exchange rate of fast-growing countries typically appreciates. Therefore, the GDP PPP per worker path produced by the ENV-Linkages model combines both a volume effect (GDP growth in constant national currency) and a relative price effect (the real exchange rate appreciation), with the former being the main driver of emissions.
Assumptions about other drivers of emissions
The BAU scenario was developed on the basis of the pre-crisis surge of the international crude oil price, and therefore assumed that it would culminate at USD 100 per barrel (in real 2007 prices) in 2008, stay constant in real terms up to 2020 and increase steadily thereafter up to USD 122 per barrel in 2030. Beyond that horizon, oil exporters’ crude oil supply is projected to decelerate gradually, roughly reflecting reserve constraints, and resulting in a sustained rise in the real crude oil price beyond 2030 at 1% annually between 2030 and 2050. The international price of natural gas is assumed to follow the international crude oil price up to 2030, but this link then weakens somewhat, reflecting a higher assumed long-term supply elasticity for natural gas than for oil. Coal prices are projected to rise only modestly (in real terms) beyond their recent levels. The price of steam coal is assumed to reach USD 100 per tonne in 2008, in line with the assumption of a high long-term supply elasticity. International Energy Agency (IEA, 2008) energy demand projections were used to calibrate future energy efficiency gains. These assume a gradual weakening of the relationship between economic growth and energy demand growth, especially after 2030.
Figure A2. Projected GHG emissions1 by country/region (2005-2050, Gt CO2eq)
-
5
10
15
20
25
30
35
40
45
50
55
60
65
70
75
2005 2010 2015 2020 2025 2030 2035 2040 2045 2050
Gt CO2 eq
Rest of the world (29%)
BRIC (45%)
Rest of OECD (5%)
USA (13%)
Western Europe (8%)
Note: Countries/regions in this figure are based on the 12-regions aggregation of the ENV-Linkages model. Korea, Mexico and Turkey are included in the Rest of the World (ROW). 1. Excluding emissions from Land Use, Land-Use Change and Forestry. Number in brackets represents percentage share of total emissions in 2050.