towards design of prognostics and health management
TRANSCRIPT

Available online at www.sciencedirect.com
2212-8271 © 2016 The Authors. Published by Elsevier B.V. This is an open access article under the CC BY-NC-ND license (http://creativecommons.org/licenses/by-nc-nd/4.0/).Peer-review under responsibility of the scientific committee of the The 5th International Conference on Through-life Engineering Services (TESConf 2016)doi: 10.1016/j.procir.2016.10.128
Procedia CIRP 59 ( 2017 ) 122 – 132
ScienceDirect
The 5th International Conference on Through-life Engineering Services (TESConf 2016)
Towards Design of Prognostics and Health Management Solutions for Maritime Assets
Octavian Niculita a*, Obinna Nwora a, Zakwan Skaf b aGlasgow Caledonian University, Glasgow, G4 0BA, UK
bCranfield University Cranfield, MK43 0AL, UK
* Corresponding author. Tel.: +441412731816. E-mail address: [email protected]
Abstract
With increase in competition between OEMs of maritime assets and operators alike, the need to maximize the productivity of an equipment and increase operational efficiency and reliability is increasingly stringent and challenging. Also, with the adoption of availability contracts, maritime OEMs are becoming directly interested in understanding the health of their assets in order to maximize profits and to minimize the risk of a system’s failure. The key to address these challenges and needs is performance optimization. For this to be possible it is important to understand that system failure can induce downtime which will increase the total cost of ownership, therefore it is important by all means to minimize unscheduled maintenance. If the state of health or condition of a system, subsystem or component is known, condition-based maintenance can be carried out and system design optimization can be achieved thereby reducing total cost of ownership. With the increasing competition with regards to the maritime industry, it is important that the state of health of a component/sub-system/system/asset is known before a vessel embarks on a mission. Any breakdown or malfunction in any part of any system or subsystem on board vessel during the operation offshore will lead to large economic losses and sometimes cause accidents. For example, damages to the fuel oil system of vessel’s main engine can result in huge downtime as a result of the vessel not being in operation. This paper presents a prognostic and health management (PHM) development process applied on a fuel oil system powering diesel engines typically used in various cruise and fishing vessels, dredgers, pipe laying vessels and large oil tankers. This process will hopefully enable future PHM solutions for maritime assets to be designed in a more formal and systematic way. © 2016 The Authors. Published by Elsevier B.V. Peer-review under responsibility of the Programme Committee of the 5th International Conference on Through-life Engineering Services (TESConf 2016).
Keywords: PHM; maintenance; maritime; vessels, FDI
1. Introduction
Regardless of their application, modern ships and vessels are becoming highly automated assets and are increasingly dependent on complex systems to deliver their main functions. The interaction of such complex systems brings an entire new set of challenges for the designers, operators and maintainers of such vessels. These challenges are becoming even more demanding when degradation of these assets occurs in service.
Three different design approaches are typically used to deal
with degradation of components/sub-systems/systems over
time in order to guarantee operational reliability: re-design, built-in redundancy, prognostics and health management. When a given design is not meeting the safety and reliability requirements, re-design of the asset/sub-systems/component is the selection of choice. Traditionally, to ensure safety and reliability, the majority of the critical systems on a vessel/ship were over-engineered taking advantage of built-in redundancy. In case of a fault or a severe functional failure, the redundancy features were activated (manually or automatically) and the vessel/ship was able to complete the mission/journey. This design philosophy was also adopted due to the lack of communication with shore. Traditionally, once
© 2016 The Authors. Published by Elsevier B.V. This is an open access article under the CC BY-NC-ND license (http://creativecommons.org/licenses/by-nc-nd/4.0/).Peer-review under responsibility of the scientifi c committee of the The 5th International Conference on Through-life Engineering Services (TESConf 2016)

123 Octavian Niculita et al. / Procedia CIRP 59 ( 2017 ) 122 – 132
ships had left the port/docking facilities they were completely isolated from communication with shore. The introduction of radio on ships changed the dynamic of technical support offered to the crew (in case of a ship failure), but now the industry is experiencing a radically step change in this field through the introduction of telecommunications that allow digital signals to be passed in both directions (to and from the ship) at significant rates independent of ship’s location worldwide. According to a DNV-GL study [1], currently, the maritime industry contributes to the growth in deployment of VSAT (Very Small Aperture Terminals) equipment on board ships. According to the same report, the number of active maritime VSAT installations quadrupled from 2008 (6,001) to 2014 (21,922), and it is predicted that the number will exceed 40,000 by 2018. It is envisaged that by 2020, most classed vessels will be broadband capable. Also, the VSAT network capacity is increasing owing to the introduction of new high throughput satellite (HTS) systems, with two to ten times higher throughput than classical satellites. The overall VSAT network capacity over maritime regions has the potential of a tenfold growth to some 200 Gbps in 2025, implying a massive increase in data transfer rates and decreased cost per bit for the connected vessels. In this context, designing new ships might take a different approach through the introduction of prognostics and health management capabilities to be able to tackle fault detection and fault isolation but also to be able to make predictions by estimating the remaining useful life and end of life for a particular component/sub-system/system of the ship. The adoption of PHM capability on ships/vessels will support of change in the way these assets are maintained and operated with the overall goal of improving asset availability. If the state of health or condition of a system, sub-system or component is known, condition-based maintenance can be carried out and system design optimization can be achieved thereby reducing the total cost of ownership. A study carried out by Wartsila highlighted a reduction between 5% and 15% when comparing the yearly costs of conventional maintenance to the condition based maintenance costs of a dual fuel engine of Liquefied Natural Gas (LNG) vessels [2]. The maritime industry sector is currently defining information based processes to prevent the unexpected failures. The main objective of making prediction of the unexpected failures is to increase the overall asset availability / or even decrease the operating expenditure. The information based process requires data to be fully functional therefore monitoring must be comprehensive, continual and should be targeting the right parameters of the system at the right time by the right people. Only in this way, data can be accurately transformed into meaningful information capable of supporting informed operational decisions of the ship/vessel by increasing business performance. The structure of the paper will be as follows: Section 2 next articulates the problem statement. A brief description of the target system will be presented in Section 3. Section 4 presents the methodology adopted to identify and optimize the number of sensors capable of detecting and isolating a set of functional failures affecting the target system. Section 5 will gather the concluding remarks.
2. Problem statement
Stringent safety and reliability of safety critical systems in maritime industry sector necessitate the need for fault detection and fault isolation in order to support system reconfiguration. With increasing competition in maritime industry, it is important that the state of a critical component is known before a ship/vessel embarks on a new mission/journey. Any breakdown or malfunction in any system during operation offshore will lead to a large economic losses and sometimes cause accidents. A report published in 2015 by the Swedish club shows that within 2012-2014 the following findings, as shown in Table 1, were documented [3].
Table 1. Highlights of the Swedish club report [3]
Machinery claims Total costs ($)
487 187.6M
Main engine & Fuel Oil System Claims
Average claim per vessel
46% of Total machinery claims 545000
Most expensive main engine claim Average cost per claim
Bearing failure 1.6M
Since the above mentioned study was a follow up of a
similar study gathering data related to failures occurred in vessels insured between 2005-2011, it is worth highlighting the findings of the study related to the top 3 causes of damage by numbers
Table 2. Top 3 causes of damage by number, 2005 - 2011 [4]
Cause Number Average costs ($)
Incorrect maintenance and/or repairs
33 741,354
Fuel management 27 318,000
Lubrication failure 23 1,194,000
Table 3. Top 3 causes of damage by number, 2012 - 2014 [3]
Cause Number Average costs ($)
Incorrect maintenance and/or repairs
17 849,000
Lubrication failure 13 926,000
Fuel management 8 324,000
The data presented in tables 2 and 3 demonstrates that
maintenance and repairs arena for maritime requires significant improvements as over the last decade it accounted for nearly 50% of the total causes of damage on ships [3][4]. A large percentage of these claims are related to inefficient fault detection and fault isolation procedures. A common cause of these practices is related to the fact that, traditionally,

124 Octavian Niculita et al. / Procedia CIRP 59 ( 2017 ) 122 – 132
the maintenance plans and activities are specified after the design of a ship is finalized. A new asset design paradigm with maintenance in mind actually occurs at the moment in other industry sectors (i.e. aerospace, energy, transportation) [5],[6] and [7]. This new design paradigm fully supports assets engaged in availability contracts. A detailed study on servitization and remote technologies concludes that some industry sectors are more likely to adopt the PHM capability than the others [8]; however the maritime industry sector was not evaluated in this study. The adoption of PHM capability comes with its own challenges and issues [9] and studies on how to specify requirements, how to architect such functions on large platforms and how to deploy PHM on large fleets have been carried out in the aerospace industry sector over the last decade [10], [11], [12] and [13]. The new maintenance aware design approach could improve the maintainability of ships and vessels throughout the entire life cycle of these assets. In order to deploy such a maintenance aware design paradigm and to integrate the development of the PHM design within the generic engineering ship design process, it is important to understand the stakeholders and the data sources that might contribute towards this goal. The stakeholders of a typical PHM development process are the system designers, reliability-availability-maintainability personnel, PHM analysts, operators, and the technical support, maintenance and logistics teams. Each of these parties is using dedicated tools and methods to carry out specific analysis to their area of expertise. The main challenge throughout the design process of the entire ship is to synchronize these analyses at various stages throughout different technical and business gates.
Latest research in maritime industry puts forward the idea
of a digital twin [14]. According to a DNV-GL study, the digital twin will be used as a virtual test bench to improve performance of a system as well as an information management system supporting the workflow, reducing development costs and time [15]. The digital twin concept can also support third party verification, facilitating a more automatic and systematic approach in testing, safety assurance and certification. The vision of digital twin allows new design routes by enabling different stakeholders to populate the digital twin of a ship/vessel with models and evaluate in advance how the system will operate as a whole. From an operational perspective, the digital twin design philosophy might offer several possibilities for evaluating performance and criticalities in near real-time and suggesting corrective actions, when coupled with operational data from (sensor-instrumented) equipment. Over time, increasingly detailed virtual models will be continuously populated with information collected on board, accelerating the development of industrial big data and smart analytics platforms for operation and maintenance (in a hybrid manner – a mix of data-driven, model-based and experience-based approaches). The authors of this platform state that new technologies that leverage the use of ontology-based reasoning, functional modeling, multi-physics simulation, machine learning, and big data can also be explored as part of the digital twin framework. The novelty of this work is the attempt in solving a very specific modeling element of the digital twin
framework – the design of the PHM solution for a system within a ship/vessel by using functional analysis. Overall, the research gap addressed by this paper focuses on the design of the PHM solution for a maritime asset by employing lessons learned from aerospace industry sector.
3. The Target System
According to a study presented by Tide Water International in 2015 [16], fuel and lubricants, and maintenance practices contribute to about 70% of vessel operating costs. Notwithstanding, it is important that certain factors must be met in order to reduce operating cost and thereby reducing total cost of ownership (TCO). From the tables 4 and 5 below it can be observed repair and maintenance cost increased largely due to scheduled and unscheduled repair and maintenance activities which is a major driver for downtime. Vessel downtime coming as a result of dry docking, major repairs, and maintenance practices can have substantial effect on the company’s generated revenue and increase the operating cost.
Table 4. Vessels revenues [16].
Vessel Revenues
2015 % 2014 % 2013 %
Americas
$ 505k 35 410k 29 327k 27
Asia/Pacific
$ 150k 10 154k 11 184k 15
Middle East/
North Africa
$ 205k 14 186k 13 149k 12
Sub-Sahara
Africa/Europe
$ 606k 41 666k 47 569k 46
Total vessel
revenues
$ 1,468,000 1,418,461 1,229,998
Table 5. Vessel operating costs [16].
Vessel Operating Costs
2015 % 2014 % 2013 %
Crew costs
$ 428k 29 396k 28 356k 27
Repair and maintenance
$ 173k 12 177k 13 132k 11
Insurance and loss reserves
$ 17k 1 19k 1 20k 1
Fuel, lube and supplies
$ 88k 6 125k 9 104k 8
Other
$ 126k 9 125k 9 104k 8
Total vessel operating costs
$ 834k 57 795k 56 692k 56
It can be observed from table 5 that the total operating cost
of the company increased between the year 2013 to 2015

125 Octavian Niculita et al. / Procedia CIRP 59 ( 2017 ) 122 – 132
which amounts to about 57% of the total vessel asset with a large number coming from repair and maintenance cost. Maintenance cost in this context is dependent on quality of equipment used on board the vessel and the type of maintenance strategy being adopted. It is widely accepted that if the annual maintenance cost of any organization exceeds 5% of the total asset value, then the organization is experiencing financial difficulties.
By analyzing the data between the years 2013-2015, the
average maintenance cost was about 12% ($161235) of the total vessels assets. This amount exceeds 5% of operating cost. Looking at these issues from the operational point of view, reducing the operating cost and thus, increasing vessel revenue efficient maintenance schemes are needed to analyze difficult and frequent interrelated indicators needed to identify and justify the need for monitoring critical components of the vessel.
A significant number of ship systems vendors realized that
they cannot justify maintenance of these assets as just another expense and currently, condition monitoring solutions are offered to ship/vessel integrators. On the other hand, these solutions are further deployed by the ship/vessel integrator in an isolated manner to tackle isolated problems that might have, or not, isolated causes. Very often faults propagate throughout the system, sometimes, with unexpected outcomes. It is the job of the PHM analysts to carry out diagnostic analysis to be able to correctly detect and isolate these faults when they are occurring in service in order to fully support the preventive maintenance of these ships/vessels. A recent DNV GL study [15] presenting the current status of the adoption of condition monitoring technologies in the maritime industry identified three major phases of implementations:
Definition of an effective diagnostic system Moving towards an effective prognostics system Migrating to integrated, real-time, risk-based
maintenance This paper addresses the first phase of the implementation
by presenting a PHM development process capable of identifying and optimizing the sensor set solutions to be deployed on a complex maritime system in order to support the diagnostic function (fault detection and fault isolation). An instantiation of this PHM development process is presented on a fuel oil delivery system for a typical marine diesel engine.
The reliability of the fuel oil delivery system is important
in the operation of the marine diesel engine. The primary job of the fuel system is to inject precise amount of pressurized fuel into the engine for internal combustion to take place. Its operation and maintainability is important to the working of the engine and this system is directly responsible for performance of the ship. Its complex and dynamic nature makes it difficult to keep system performance stable. This instability gives rise to system malfunction which can lead to potential failures. Fuel system failure will bring about reduced
performance, increased wear and tear on engine components, and engine failure. In order to continuously monitor the health of the system, it is important to understand the different units, components, parts that make up the fuel system but also their function and the effects of faults on these functions.
In this paper, a typical fuel oil system currently used to
power up diesel engine, typically used in various cruise and fishing vessels, dredgers, pipe laying vessels and large oil tankers, was selected.
A top level diagram of the system is depicted in Fig. 1. A more detailed representation of this system (adapted from [17]) is captured in Fig. 2.
It comprises of four major subsystems: - Fuel Transfer System - Fuel Separating System - Fuel Feed/Booster System - Fuel Circulation/Injection System
The fuel oil delivery system contains the following components:
Pumps - these are used to transfer fuel throughout the
system. Separators - the separators are used for fuel purification
and removal of solids. Suction Strainers - these are responsible for the removal of
coarse particulate matter such as solid debris that may damage rotating equipment i.e. fuel pump.
Filters - filters are responsible for the removal of water from the fuel, the type of filters used in the removal of water from fuel is known as coalescing filters.
Tanks - the tanks are used for fuel storage; day tanks are equipped with heaters to regulate fuel viscosity, while the bunker tank uses a heating system to maintain the fuel above pour point temperature of 40°c to 50°c.
Coolers - coolers are normally installed in the return line after the engine. The coolers are used as viscosity control in the event that the fuel in the day tank exceeds stated minimum viscosity limit.
Pipes - pipes are used to transport material throughout the system. Classification societies such as DNV, BV classify pipes into different class or categories depending on the temperature, pressure or flow through the pipe.
Valves - valves are used to regulate and control the flow of fuel in the system .The function of the relief valve is to limit the maximum pressure in a system, while the venting valve is used to maintain pressure and remove air present in the clean fuel line coming out of the engine before it is reintroduced into the system via the de-aeration tank and the clean fuel leak tank.
Heaters - the heater is used to maintain the viscosity of the fuel for maximum consumption. The power of the heater is controlled by the viscometer using the thermostat as a backup control.

126 Octavian Niculita et al. / Procedia CIRP 59 ( 2017 ) 122 – 132
Fig. 1. Fuel system – High Level Block Diagram (adapted from [8])
Fig. 2. Fuel system – Sub-system and component level breakdown (adapted from [17])
SuctionStrainer
Feed PumpSeparator
Unit
SettlingTank
DayTank
Separator Separator
Feeder/BoosterUnit
Diesel Engine
Leak FuelClean Tank
Leak FuelDirty tank
BunkerTank
OverflowTank
SludgeTank
E-1-
V-1
P-1-
V-6
V-5 E-5 M
V-4
E-6-E 6
E-2
V-2
V-3
E-4E 4
V 4
-
M
V-7V
V-8
V-9
E-7
V-10
M
E-8
V-12
M
V-14
V-15
V-16
V 14
I-2
E-9
E-10E 10
V-18FILTER
FLOWMETERE
De-
aerationtank
E-17
ENGINE
V
V-24
V-25
V-26
P-11
V-30 V-31
E-21
V-32
M
22
E-22SAFETYFILTER
1
LEAKFUELTANK
(DIRTY)
LEAKFUELTANK
(CLEAN)
BUNKERTANK
HEATER
VISC
OSIT
YM
ET
ER
V-34 V-35
E-23
-9
SETTLING
TANK
DAYTANK
OVERFLOWTANK
SLUDGETANK
SUCTIONSTRAINER
TRANSFERPUMP H
EA
TE
R
FE
ED
PU
MP
FE
ED
PU
MP
SEP
AR
AT
OR
UN
IT
HE
AT
ER
SEPARATOR
SEPARATOR
FE
E
SUCTIONFILTER
SUCTIONFILTER
SUCTIONFILTER
FUEL FEEDPUMP
FUEL FEEDPUMP
D
FEEDER/ BOOSTER UNIT
COOLER
CIR
CU
LA
TIO
NP
UM
P
VE
NT
ING
VA
LV
E
V-10
E-23
PRESSURECONTROL
VALVECOOLER
CLEAN FUELRETURN LINE
CL
EA
NF
UE
LR
ET
UR
NL
INE
CL
EA
NF
UE
LR
ET
UR
NL
INE
DIR
TY
FU
EL
RE
TU
RN
LIN
E
DIRTY FUELRETURN LINE
DIR
TY
FU
EL
RE
TU
RN
LIN
E
CLEAN FUELRETURN LINE
CL
EA
NF
UE
LR
ET
UR
NL
INE
TR
AN
SFE
RU
NIT
CIRCULATION UNIT
INJECTION UNIT
L
P-12
AEEEEEEN
E
R

127 Octavian Niculita et al. / Procedia CIRP 59 ( 2017 ) 122 – 132
4. Methodology
4.1. PHM Design
In order to be able to design the PHM function for a given system, the PHM analysts must assess the effects of faults throughout the entire system, faults that are typically occurring in service. The authors of this paper decided to employ a prognostic and health management development process currently employed in the aerospace industry. The main three phases of the PHM design process is presented in Fig. 3. The PHM design process is divided into three distinct phases: functional analysis (phase 1), failure analysis (phase 2), identification and optimization of instrumentation capable of supporting the PHM function (phase 3). This process targets the functional analysis (typically carried out during conceptual and preliminary design phases of a given asset) as the foundation for the development of PHM applications for that asset. A successful instantiation of this process was presented in [18] for the development of the PHM solution for UAV fuel systems. The process itself calls out the functional breakdown as a method to assess the effects of functional faults of a system by carrying out, in a systematic model-based manner, a Functional Failure Mode Effects and
Fig. 3. PHM Design Process
Criticality Analysis (FFMECA) at the system level. When a failure occurs in a component, it might develop some symptoms but in every single case it will affect the function of that component.
In order to construct a model that will gather the
information related to functional failures, the functional breakdown of the entire system under investigation was carried out. Maintenance Aware Design environment (MADe™), a commercial-of-the-shelf software tool by PHM Technology [19] capable of supporting such a modeling activity was employed within the first phase of PHM design process. The crisp functional taxonomy adopted from [20] and employed by MADe was utilized to construct a functional model of the entire fuel oil delivery system. A full representation of the functional model of this system is depicted in Fig. 4.
A detailed description of the function of each individual sub-system (and its components) and other auxiliary components are presented in the following section.
4.1.1 Functional decomposition
Bunker tank – Function: to store/to transfer A bunker tank serves as the main storage hub of the
marine diesel fuel. The size of a bunker tank varies from ship to ship from 150 cubic meters to 3500 cubic meters. The main function of the bunker tank is to pump fuel into the system ready for operation. For the diesel fuel to be pumped out of the bunker tank the temperature inside the bunker tank must be between 40°c to 50 °c. This is made possible by a steam plant in order to avoid clogging of the fuel which affects the operation of the suction strainer and the feed pump.
Settling tank– Function: to store/ to supply This is where the fuel pumped from the bunker tank is
allowed to settle for a while. Separation of water particles from the fuel oil occurs through gravity. The water particles and dirt is sent to the sludge tank. The temperature of the settling tank should be between the range of 20°c - 40°c.
Day tank– Function: to transport This can be sometimes referred to as the service tank.
This is where the clean fuel coming from the settling tank after separation, required to run the main engine is stored.
Leak fuel tank (Clean Fuel) – Function: to transfer This is where clean fuel drained by gravity from the
Fig. 4. MADe Fuel system functional model

128 Octavian Niculita et al. / Procedia CIRP 59 ( 2017 ) 122 – 132
engine is collected and stored. The fuel in this tank can be pumped backed to the day tank without separation.
Leak fuel tank (Dirty fuel) – Function: to store This leak fuel tank is used to store spills from the hotbox
of the engine. The spills are collected and drained by gravity through the dirty fuel connection.
Sludge tank– Function: to store Sludge tank acts as the storage point of all dirty leak fuel
collected from the engine, and where other viscous mixture of liquid and solid contaminant are stored.
De-aeration tank– Function: to refine The de-aeration tank is used to remove entrained air and
other gaseous components in the excess fuel leak line before it is re-introduced to the fuel feed system.
Over-flow tank– Function: to store The overflow tank is used to store clean fuel coming
from the spilled from the settling tank during separation. Fuel Transfer Unit– Function: to transfer The fuel transfer sub-system transfers fuel from the
bunker tank to the settling tank. Fuel Separating Unit – Function: to separate The fuel entering the day tank must be cleaned to remove
any form of residue or distillate. The fuel treatment or the fuel separating system does this by the use of an efficient separator. The separator unit separates the fuel from water and dirt.
Fuel Feed Unit– Function: to increase The function of the fuel feed sub-system is to increase
the pressure of the heated fuel coming out of the day tank. The fuel feed system also has an in built cooler which cools down the heated fuel and feeds it into the de-aeration tank. A flow-meter is used to monitor the fuel consumption provided that the meter is installed in the feed line from the day tank.
Fuel Circulation System– Function: to increase The circulation pump maintains the pressure of the fuel
entering the fuel injector and circulates the fuel in the system.
Fuel injector unit– Function: to supply The fuel injector sub-system is responsible for injecting
fuel into main engine. The fuel injection system achieves this by pressurizing and injecting the right amount of compressed fuel into the combustion chamber of the main engine.
Power System– Function: to convert The power system is responsible for supplying voltage to
drive electromechanical components of the fuel system such as actuators, pumps’ motors, and control valves.
Control System– Function: to control The control system is responsible for generating signals
(discrete or continuous) to manipulate the position of valves, to control the speed of various pumps, to change between different operating modes in order to enable system to deliver its function.
The construction of the functional mode is actually instrumental in generating a platform that allows the propagation of functional failure throughout the system as each individual function is underpinned by three major
elements: the input flow(s); the output flow(s); the causal relationship (between the input and output flow(s)) – the last one can be positive or negative depending on the physics underpinning each particular component.
For example: the input flows for a fuel pump are: the hydraulic energy (as pressure) available at the inlet and the mechanical energy (as angular velocity) from the pump’s motor. The output flow of the same component is the hydraulic energy (as volumetric flow rate). The causal relationships between the input flows and the output flow are positive as they are representing the direct proportional physics governing a pump (the higher the motor angular velocity results in more flow being produced by the pump; the higher the pressure at the inlet having the same immediate effect - more flow generated in the system). Since the output flow(s) of a component C1 are matching the input flows of another component (C2) assuming C1 is physically connected to the C2, a mechanism that allows the propagation of a fault resulting in a deviation from normality of the output flow of C1 throughout the C2 component is obtained. The breakdown of every single sub-system (unit) of the fuel system is captured in Fig. 5 to Fig. 8.
4.1.2 Functional failure mode diagrams
Once the functional layer has been fully defined, the second phase of the PHM design process addresses the characterization of functional failures affecting the system in service. As part of this phase, MADe™ Design module was employed to populate the failure diagram for each individual component of the fuel system. Failure diagrams are composed by causes, mechanisms, faults and symptoms all being linked to the functional failures (inability of the component to fulfill the function by delivering the output flow(s) – previously defined). Potential causes leading to a functional failure consider design, assembly or reassembly, maintenance, manufacturing operation and transportation criteria. In the same way, mechanisms considered in this modeling activity target corrosion, elastic deformation, electrical/electronic, fatigue, fracture, material degradation, material decomposition, material interface, material transfer, plastic deformation, software, state change and wear. The actual faults (not to be confused with the functional failure) considered the bulk change, chemical connections, chemical properties, electrical connection/property, mechanical connection, mechanical property, operator, shape change, software and surface change. Using MADe’s taxonomy, the failure diagrams for every single component of the system were constructed.
Fig. 9 presents the failure diagram of a control valve: seven types of causes can lead through two different mechanisms to five different types of faults all of them being linked to the functional failure of not being able to regulate the hydraulic energy (as flow rate) down the line. Data from various stakeholders is instrumental at this stage: designers, reliability-availability-maintainability experts, technicians, operators should be contributing in this exercise in order to ensure correctness through construction

129 Octavian Niculita et al. / Procedia CIRP 59 ( 2017 ) 122 – 132
of the simulation model. Having this information as part of a model-based platform, specific set of faults can be injected to investigate and assess the effects of faults throughout the system. Historically, the development of condition monitoring solutions has been driven by sensor vendors by targeting isolated solutions to isolated problems. The functional approach allows the analysis to be carried out at the system level. In the context of this paper, 13 functional failures occurring at the sub-system and component level were considered. These functional failures and their failure response are captured in Table 6.
Table 6. Top 13 functional failures affecting a vessel fuel system considered for the analysis
Component Flow property Failure response
Bunker tank Pressure Low
Day tank Pressure Low
De-aeration tank Flow rate High
Filter (Fuel Feed System) Contamination High
Fuel Circulation System Flow rate Low
Fuel Injection System Angular velocity
Low
Fuel Separating System Pressure Low
Fuel Transfer Pump (Fuel Transfer System)
Pressure Low
Fuel Transfer System Flow rate High
Pipe 10 Pressure Low
Settling tank Pressure Low
Suction strainer (Fuel Transfer System)
Contamination High
4.1.3 What-if PHM analysis As part of the third phase of the PHM design, what-if
scenarios for specific sets of functional failures that are typically occurring in service must be carried out. Using the causal relationships mapped out within the functional layer, these 13 functional failures were propagated throughout the entire system to investigate the effects of these faults, at the system level.
A propagation table gathering the functional failure signatures (read their effects on other components/functional flows) was generated and the effects of 13 failures over 41 different system parameters was documented. It is envisaged that trying to document these effects manually can be a time consuming task prone to significant errors. A summary of the effects captured by the propagation table is captured in Table 7.
Table 7. Functional failure effects Level of indenture Effects Matrix size
Fuel oil system 41 13x41
Fuel transfer sub-system 3 2x3
Fuel separation sub-system 12 1x12
Fuel circulation sub-system 8 2x8
Fuel injection sub-system 11 4x11
In the third phase of the PHM Design, the propagation
table was then used to identify the minimum number of sensors capable of detecting these failures but also isolating all of them.
For the scenario described in this paper, MADe™ PHM
analysis have been employed and an optimization algorithm described in [21] was used to identify within the propagation table the features (and the combination of features) specifics to each of the 13 functional failures considered for the analysis.
A total number of sensor set solution were generated for
this scenario: a number of 71 different sensor set solutions (containing 6 sensors each) are able to provide a 100% detection rate; while 49 sensor set solutions having 7 sensors are only offering a 80% fault coverage. In all 49 cases, the failure responses of the Day tank and the Pipe 10 are identical. This part of the PHM Design analysis aims to identify any possible ambiguity groups (in these 49 cases – ambiguity groups are of size 2) - each Ambiguity Group (AG) also highlights the failures that cannot be recognized using the currently allocated set of sensors. For these particular scenarios, additional tests or instrumentation has to be specified (at a specific cost) to better support the fault isolation task.
Fig. 5. MADe Separation unit functional model
130 Octavian Niculita et al. / Procedia CIRP 59 ( 2017 ) 122 – 132
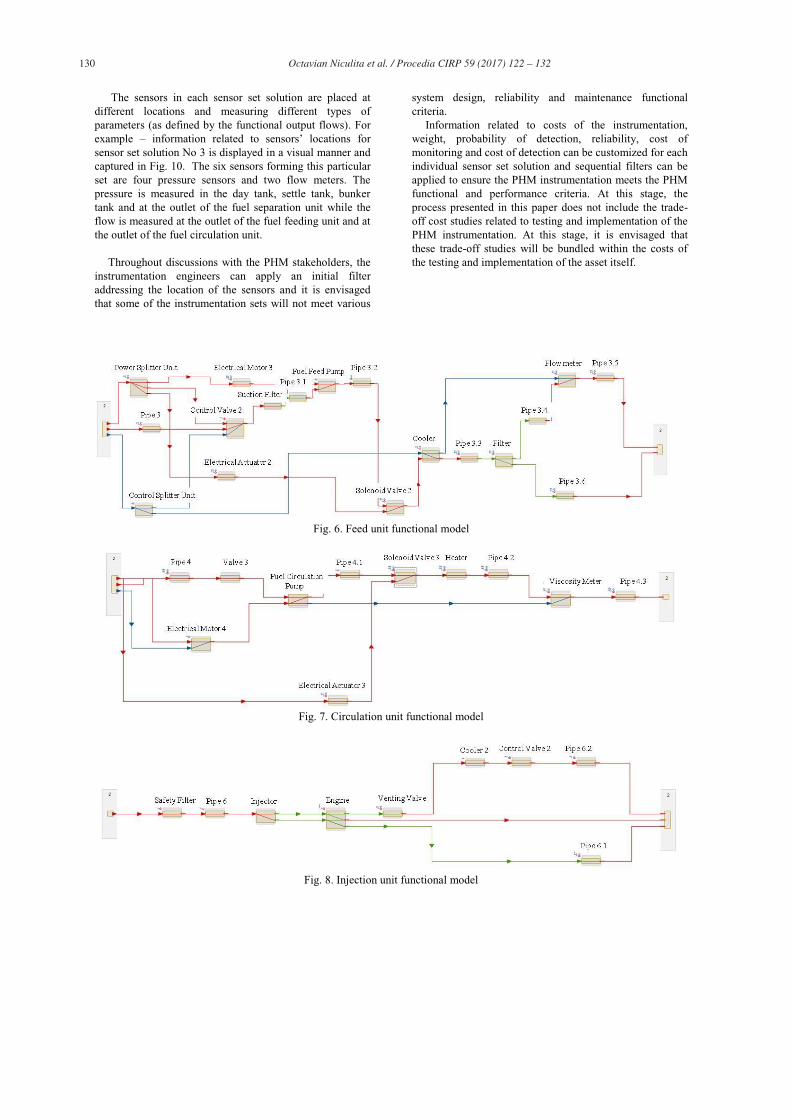
The sensors in each sensor set solution are placed at different locations and measuring different types of parameters (as defined by the functional output flows). For example – information related to sensors’ locations for sensor set solution No 3 is displayed in a visual manner and captured in Fig. 10. The six sensors forming this particular set are four pressure sensors and two flow meters. The pressure is measured in the day tank, settle tank, bunker tank and at the outlet of the fuel separation unit while the flow is measured at the outlet of the fuel feeding unit and at the outlet of the fuel circulation unit.
Throughout discussions with the PHM stakeholders, the
instrumentation engineers can apply an initial filter addressing the location of the sensors and it is envisaged that some of the instrumentation sets will not meet various
system design, reliability and maintenance functional criteria.
Information related to costs of the instrumentation, weight, probability of detection, reliability, cost of monitoring and cost of detection can be customized for each individual sensor set solution and sequential filters can be applied to ensure the PHM instrumentation meets the PHM functional and performance criteria. At this stage, the process presented in this paper does not include the trade-off cost studies related to testing and implementation of the PHM instrumentation. At this stage, it is envisaged that these trade-off studies will be bundled within the costs of the testing and implementation of the asset itself.
Fig. 6. Feed unit functional model
Fig. 7. Circulation unit functional model
Fig. 8. Injection unit functional model

131 Octavian Niculita et al. / Procedia CIRP 59 ( 2017 ) 122 – 132
Fig. 9 Control valve - Failure diagram (incl. causes, mechanism, faults and the functional failures)
Fig. 10. PHM Sensor set solution
5. Concluding remarks
In this paper we have presented an instantiation of a Prognostics and Health Management development process for a critical system of a maritime asset. The PHM design process integrates a system level design process that includes design, reliability and maintainability concepts through an engineering decision model that can be exploited in the early stages of the design process (conceptual and front end engineering design (FEED)). A breakdown of various approaches related to design decisions when dealing with system’s failures was investigated. Re-design and built-in redundancy is still widely adopted in the maritime industry sector and the PHM capability is still in its early days. Currently there are no standards or common approaches in developing prognostics and health management solutions, at the system level. Our view is that, for far too long, the adoption of the PHM function for a given system was influenced by the sensor manufacturers. Since the OEM of maritime assets have realized the benefits of having a clear picture on the health the critical components of their systems, a more
structured approach in designing in the PHM function is required. The PHM design process, presented in this paper, was divided into three distinct phases: system functional breakdown and causal relationship analysis (Phase 1), failure mode effects and criticality analysis (Phase 2), identification and optimization of instrumentation capable of supporting the PHM function (Phase 3). The functional modelling approach which employs functions and flows was used to describe the vessel fuel oil delivery system. Then, failure diagrams (the connection between cause(s)-mechanism(s)-fault(s)-symptoms(s) and functional failures) were defined for all system’s components and functional failure effects and criticality analyses (FFMECA) were carried out in order to characterize the effects of faults throughout the entire system. Finally, different sensor set solutions was identified by using the functional approach. Using a model based approach allows the engineering PHM analysis process to be efficiently repeated for a various design configurations at early stages of the engineering design process before costly decisions are made. Also, the process can be recalled at any stage in the product lifecycle to update the structure (i.e. different components/configuration as a result of possible upgrades)

132 Octavian Niculita et al. / Procedia CIRP 59 ( 2017 ) 122 – 132
or data content (additional information related to causes, mechanisms, faults or criticality of these elements) of the system model in order to further optimize the system configuration (incl. instrumentation) that is capable of guaranteeing maximum system’s availability in service.
References
[1] DNV GL. Ship connectivity. Strategic Research and Innovation. Position Paper 4-2015. [2] Wärtsilä. Performance optimisation improves business efficiency and reduces the total cost of ownership (Accessed July 2015). 2012 [3] Swedish Club. Main engine damage study. Corporate communicate
5105pr1500/ E8. 2015 [4] Swedish Club. Main engine damage study. Corporate communicate
1211P R1500/SB. 2012 [5] Jennions, I. K. Integrated Vehicle Health Management – Perspectives
on an Emerging Field, ISBN 978-0-7680-6432-2. 2011 [6] Jennions, I. K. Integrated Vehicle Health Management – Business Case
Theory and Practice, ISBN 978-0-7680-7645-5. 2013a [7] Jennions, I. K. Integrated Vehicle Health Management – The
Technology, ISBN 978-0-7680-7952-4. 2013b [8] Grubic, T. Servitization and remote monitoring technology: A literature
review and research agenda. Journal of Manufacturing Technology Management, Vol. 25 Iss: 1, pp.100 – 12. 2014
[9] Hess, A., Calvello, G., Frith, P., Engel, S. J., Hoitsma, D. Challenges, issues, and lessons learned chasing the “ Big P”: real predictive prognostics part 2. In: IEEE 2006 Aerospace Conference. 2006
[10] Rajamani, R., Saxena, A., Kramer, F., Augustin, M. et al. Developing IVHM Requirements for Aerospace Systems. SAE Technical Paper 2013-01-2333, doi:10.4271/2013-01-2333. 2013
[11] Keller, K., Baldwin A., Ofsthun, S. Swearingen, K., Vian, J., Wilmering, T. and Williams, Z., 2007. Health management engineering environment and open integration platform. IEEE Aerospace Conference, Big Sky, Montana, USA, Paper #1319. 2007
[12] Cortez, J., Keller, K., and Poblete, J. Establishing an approach to systematically improve the effectiveness of fleet support. IEEE AutoTest Conference, Sep 8-11, Salt Lake City, UT. 2008a
[13] Cortez, J., Keller, K., and Poblete, J. Systematic improvement of fleet operations by integrating enterprise health and maintenance data. IEEE Aerospace Conference, March 1-8, Big Sky, MT, Paper #1340. 2008b
[14] Ludvigsen, K. B., Jamt, L. K., Husteli, N., & Smogeli, Ø. Digital twins for design, testing and verification throughout a vessel’s life cycle. COMPIT. 2016
[15] DNV GL. Beyond condition monitoring in the maritime industry. Strategic Research and Innovation. Position Paper 6-2014.
[16] Tidewater International. Tide’s Water Annual Report. 2015 – Available from www.tdw.com.
[17] Wärtsilä. Auxpac Product Guide. 2014 [18] Niculita, O., Jennions, I.K., Irving, P. Design for diagnostics and
prognostics: A physical-functional approach. Aerospace Conference. 2013.
[19] MADe, PHM Technology. www.phmtechnology.com [20] Pahl, G., Beitz, W., Engineering Design: A Systematic Approach, Springer-Veriag, NY, 1988. [21] Rudov-Clark, S. J., Ryan, A.J., Stecki, C.M., Stecki, J., Automated
design and optimization of sensor sets for Condition – Based Monitoring, Sixth DSTO International Conference on Health & Usage Monitoring, 2009.