towards an understanding of staggering effects in
TRANSCRIPT

JID:NUPHA AID:19152 /FLA [m1+; v 1.137; Prn:9/01/2012; 10:06] P.1 (1-21)
Available online at www.sciencedirect.com
Nuclear Physics A ••• (••••) •••–•••www.elsevier.com/locate/nuclphysa
Towards an understanding of staggering effectsin dissipative binary collisions
M. D’Agostino a,b,∗, M. Bruno a,b, F. Gulminelli c, L. Morelli a,b,G. Baiocco a,b,c, L. Bardelli d,e, S. Barlini d, F. Cannata b, G. Casini d,
E. Geraci f,e, F. Gramegna g, V.L. Kravchuk g, T. Marchi g,h, A. Moroni i,A. Ordine j, Ad.R. Raduta k
a Dipartimento di Fisica dell’Università, Bologna, Italyb INFN, Bologna, Italy
c CNRS, UMR6534, LPC, F-14050 Caen cédex and ENSICAEN, UMR6534, LPC, F-14050 Caen cédex, Franced INFN, Firenze, Italye INFN, Catania, Italy
f Dipartimento di Fisica dell’Università, Catania, Italyg INFN, Laboratori Nazionali di Legnaro, Italy
h Dipartimento di Fisica dell’Università, Padova,Italyi INFN, Milano, Italyj INFN, Napoli, Italy
k NIPNE, Bucharest-Magurele, POB-MG6, Romania
Received 19 June 2011; received in revised form 20 September 2011; accepted 25 November 2011
Abstract
The reactions 32S+ 58,64Ni are studied at 14.5 A MeV. Evidence is found for important odd–even effectsin isotopic observables of selected peripheral collisions corresponding to the decay of a projectile-likesource. The influence of secondary decays on the staggering is studied with a correlation function technique.It is shown that this method is a powerful tool to get experimental information on the evaporation chain,in order to constrain model calculations. Specifically, we show that odd–even effects are due to interplaybetween pairing effects in the nuclear masses and in the level densities.© 2011 Elsevier B.V. All rights reserved.
* Corresponding author at: INFN, Bologna, Italy.E-mail address: [email protected] (M. D’Agostino).
0375-9474/$ – see front matter © 2011 Elsevier B.V. All rights reserved.doi:10.1016/j.nuclphysa.2011.11.011
JID:NUPHA AID:19152 /FLA [m1+; v 1.137; Prn:9/01/2012; 10:06] P.2 (1-21)
2 M. D’Agostino et al. / Nuclear Physics A ••• (••••) •••–•••
Keywords: NUCLEAR REACTIONS 58,64Ni(32S, X), E = 14.5 MeV/nucleon; measured fragment yield and chargedistribution; deduced reaction mechanism features, odd–even effects, secondary evaporation, relative kinetic energycorrelation functions. Comparison with GEMINI evaporation model. GARFIELD detector array and ring counter
1. Introduction
Experimental studies of odd–even effects in fragment production have been performed since along time. Nevertheless the analysis of these results has not produced clear-cut conclusions abouttheir interpretation [1–5]. A priori, these effects point to the pairing residual interaction and itsdependence on temperature. Getting experimental information on this issue is of importance bothin nuclear physics [6] and in nuclear astrophysics [7,8]. Understanding the origin of odd–eveneffects is also relevant for studies on symmetry energy [9], which can be linked to the isotopicdistributions [10] if these latter are not too much perturbed by secondary decays [11–13].
In theoretical studies no staggering is associated to the finite temperature yields, but odd–eveneffects appear in the asymptotic yields after evaporation [14,15]. This observation suggests thatodd–even effects are low temperature effects associated to the evaporation phase. Two physicalingredients which can in principle be associated to odd–even effects exist in evaporation mod-els, namely level densities and binding energies. Then the question arises whether the observedstaggering in the production yields is just a straightforward consequence of the pairing effect innuclear masses.
This problem was recently raised in Ref. [2], where odd–even effects in the reaction p + Fe at1 A GeV at the FRS were studied. The idea proposed in that paper is that indeed nuclear massesdetermine the observed staggering through the last step of the evaporation chain1: the hypothesisis that, independent of the initial thermodynamic condition of the excited pre-fragments, the verylast evaporation step concerns either a neutron or a proton, depending on the relative separationenergies of the two particles. The staggering in the yields would then reflect the staggering inthe neutron–proton separation energies due to the pairing and Wigner term in the mass formula.This idea predicts correctly the trend of the observed staggering in the experiment at the FRS.However it does not reproduce the amplitude of the staggering quantitatively: the experimentaloscillations are less important than the ones predicted in this simple scenario. This suggests thatthe previous evaporation steps may also play a role.
In a recent paper [16], we have reported on an experimental study of staggering in S + Nicollisions at 14.5 A MeV. To explore in detail the possible relationship of odd–even effects tothe isospin of the emitting sources, we have measured the yields of isotopes for reaction pairsdiffering only in the values of the isospin. We have shown that important odd–even effects existin carefully selected peripheral events, while they are masked in central collision by the stronglydecreasing behavior of the production yield as a function of the fragment size. A detailed studyof the most probable decays that can contribute to the yield of the different isotopic chains hasadditionally indicated that the lowest emission threshold for particle production cannot be theunique factor governing the staggering, and a quantitative control on the population at the last-but-one evaporation step is important to assess the physical origin of the staggering.
1 Throughout the paper, we will implicitly define the last step of the evaporation chain as the last particle emission.This decay does not necessarily lead to the ground state of the daughter nucleus, but the subsequent gamma emissionchain does not modify the isotopic yields and does not need to be considered for the purpose of this paper.
JID:NUPHA AID:19152 /FLA [m1+; v 1.137; Prn:9/01/2012; 10:06] P.3 (1-21)
M. D’Agostino et al. / Nuclear Physics A ••• (••••) •••–••• 3
To make progress on this issue, in the present paper we estimate directly from experimentaldata the effect of secondary evaporation on the staggering using a correlation function basedtechnique. No specific model is assumed for the source characteristics and decay probabilities.We show that odd–even effects are already present in fragment yields excited above the particleemission threshold, in qualitative agreement with GEMINI calculations.
This indicates that in order to quantitatively understand the observed staggering, both pairingeffects on the nuclear masses and on the level densities should be considered.
2. Experimental distributions
The measurements were performed at the TANDEM–ALPI acceleration system of the Leg-naro National Laboratory. The detecting device is composed by the GARFIELD detector [17]covering almost completely the angular range of polar angle from 30◦ to 85◦ and an annularthree-stage detector (Ring Counter) [18] covering laboratory forward angles from 5.3◦ to 17.5◦.The detecting device can identify from light charged particles to heavy fragments with an energythreshold of the order of few hundreds of A keV.
The results here presented come from the comparison of the data for the two reactions32S + 58Ni and 32S + 64Ni at 14.5 A MeV. As explained in detail in Ref. [16], the sorting ofthe measured events as a function of the centrality has been performed with the method of the“shape analysis” [19], as in other intermediate and high energy experiments performed with� 4π detectors [20,21]. Events characterized by the detection of at least 50% of the total incom-ing parallel momentum were studied as a function of the total detected charge. Due to the energythresholds, the quasi-target products are not detected, so that “peripheral” events can be selectedby the additional conditions Ztot � 25 and θflow � 40◦. A comparison to the GEMINI [22] evap-oration code suggests that for both reactions these events are associated to the evaporation from aquasi-projectile source with 〈E∗〉 ≈ 1 A MeV, 〈Z〉 ≈ 16, 〈A〉 ≈ 32, and a triangular distributionof angular momentum between Jmin = 0h and Jmax = 16h. More details on the experiment anddata selection can be found in Ref. [16].
Odd–even effects in the decay of this source are clearly established even in relatively inclu-sive observables. This is shown in Fig. 1 [16], which displays the elemental fragment (Z � 3)distribution for the two reactions.
The charge (mass) distributions presented in this paper, unless explicitly stated, have beennormalized to the number of events and therefore they represent the elemental multiplicity of agiven charge (mass).
To highlight the odd–even effects, the bottom panel of Fig. 1 displays the ratio between theelemental charge distribution and a smoothed distribution obtained by a parabolic interpolationof the measured yields over 5 consecutive points.
Considering that for almost all the isotopically resolved yields (that is up to Z = 8) the mostabundant isotope of each element is N = Z, as shown in Fig. 7 of Ref. [16], the staggeringobserved in the global distributions Fig. 1 can be interpreted as dominance of even–even isotopesover odd–odd ones as one would naively expect from the pairing contribution in the isotopemasses.
The striking persistence of pairing effects in the fragmentation phenomenon which is thoughtto occur at finite temperature, has been tentatively interpreted in Ref. [2] as an effect of the laststep of the evaporation chain. This decay is almost deterministically established by the Q-valueof the decay to the daughter nucleus energy states which lie below the threshold for particle

JID:NUPHA AID:19152 /FLA [m1+; v 1.137; Prn:9/01/2012; 10:06] P.4 (1-21)
4 M. D’Agostino et al. / Nuclear Physics A ••• (••••) •••–•••
Fig. 1. (Color online.) Elemental fragment (Z � 3) distribution from the decay of the quasi-projectile source formedin 32S + 58Ni (full symbols, dashed line) and 32S + 64Ni (open symbols, full line). Upper part: Fragment distributionnormalized to the total number of peripheral events. Bottom part: Ratio of the fragment distribution by a smootheddistributions obtained by a parabolic interpolation over 5 consecutive points. Lines are drawn to guide the eye.
emission. This latter is maximal if the daughter nucleus presents an extra binding due to pairing,since the pairing shift increases the particle emission threshold.
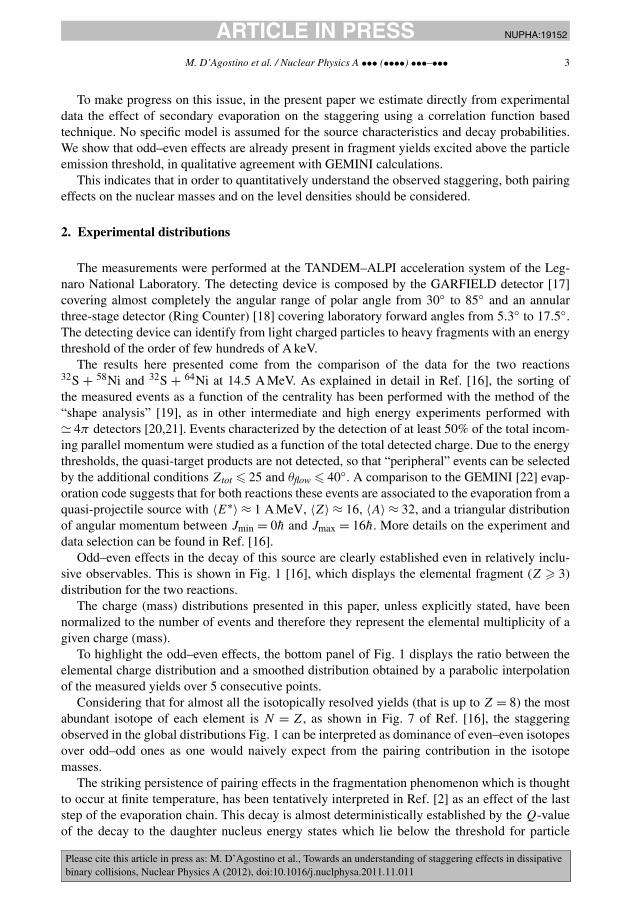
This simple explanation however only holds if the last evaporation step changes the isotopiccontent N − Z of the decaying nucleus. This is indeed the case if the last evaporation stepconcerns only neutron and proton evaporation, but not if the last emitted particle is an α particle.It comes out that the nucleon decay channel is dominant for N = Z + 1 isotopes, but the sameis not true for N = Z. This is demonstrated in Fig. 2, which compares the energy of the firstparticle-unstable level [23,24] of a given daughter nucleus, to the particle emission thresholds ofthis latter, as obtained from mass differences. In this figure, in order to disentangle the staggeringbehavior from the rapidly decreasing trend of the mass distribution, the measured yield of eachisotope is normalized to the total detected yield for the considered element.
We can see that in the case of the N = Z + 1 isotopic chain the first particle unstable stateapproximately coincides with the Q-value for neutron emission, which presents a staggeringbehavior due to the pairing term in the nuclear mass. This trend is nicely followed by the experi-mental yields for both reactions, as shown in Fig. 2 [16]. In the case of the N = Z isotopic chain,which is responsible of the global staggering behavior of the elemental distribution, the situationis less clear. Indeed the lowest emission threshold for N = Z light nuclei typically corresponds toα decay, with the only exception of 14N. The α decay preserves the isospin difference N −Z andthus shows a smooth behavior, which does not correspond to the staggering trend of the yields.This in turn means that the extra yield of even–even isotopes cannot be simply due to the energy
JID:NUPHA AID:19152 /FLA [m1+; v 1.137; Prn:9/01/2012; 10:06] P.5 (1-21)
M. D’Agostino et al. / Nuclear Physics A ••• (••••) •••–••• 5
Fig. 2. (Color online.) Fragment (3 � Z � 8) isotopic distribution normalized to the total elemental yield for 32S + 58Ni(full symbols) and 32S + 64Ni (open symbols) corresponding to the isotopic chain N = Z (upper part) and N = Z + 1(lower part). For each isotopic chain, the panels on the right show the energy of the lowest unstable state (thick lines)decaying in a given daughter isotope, the Q-value for alpha decay (open squares) and the neutron (Sn) and proton (Sp)separation energies.
balance of the last evaporation step, but has to be related to the isotopic population of the excitednuclei prior to their last decay by particle emission.
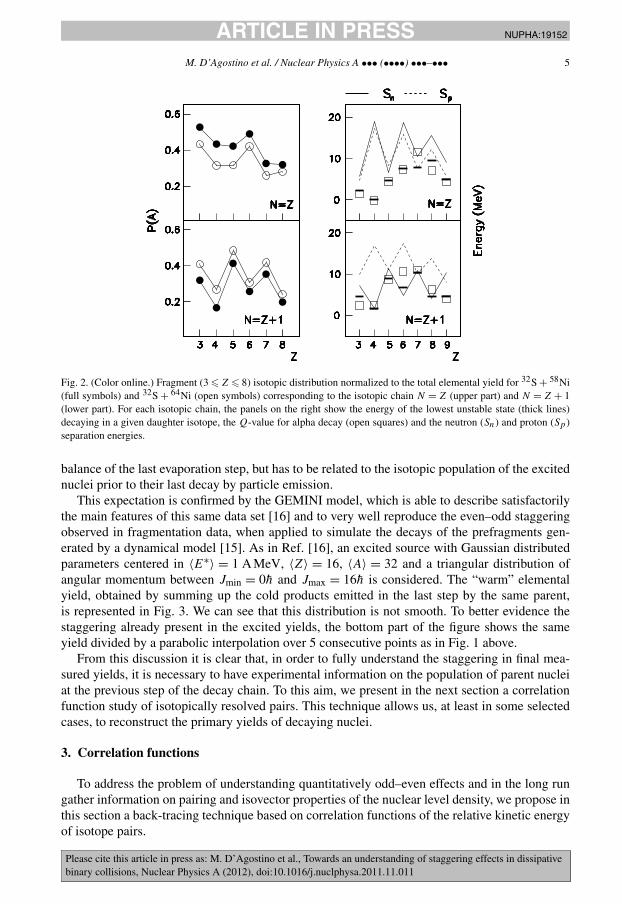
This expectation is confirmed by the GEMINI model, which is able to describe satisfactorilythe main features of this same data set [16] and to very well reproduce the even–odd staggeringobserved in fragmentation data, when applied to simulate the decays of the prefragments gen-erated by a dynamical model [15]. As in Ref. [16], an excited source with Gaussian distributedparameters centered in 〈E∗〉 = 1 A MeV, 〈Z〉 = 16, 〈A〉 = 32 and a triangular distribution ofangular momentum between Jmin = 0h and Jmax = 16h is considered. The “warm” elementalyield, obtained by summing up the cold products emitted in the last step by the same parent,is represented in Fig. 3. We can see that this distribution is not smooth. To better evidence thestaggering already present in the excited yields, the bottom part of the figure shows the sameyield divided by a parabolic interpolation over 5 consecutive points as in Fig. 1 above.
From this discussion it is clear that, in order to fully understand the staggering in final mea-sured yields, it is necessary to have experimental information on the population of parent nucleiat the previous step of the decay chain. To this aim, we present in the next section a correlationfunction study of isotopically resolved pairs. This technique allows us, at least in some selectedcases, to reconstruct the primary yields of decaying nuclei.
3. Correlation functions
To address the problem of understanding quantitatively odd–even effects and in the long rungather information on pairing and isovector properties of the nuclear level density, we propose inthis section a back-tracing technique based on correlation functions of the relative kinetic energyof isotope pairs.
JID:NUPHA AID:19152 /FLA [m1+; v 1.137; Prn:9/01/2012; 10:06] P.6 (1-21)
6 M. D’Agostino et al. / Nuclear Physics A ••• (••••) •••–•••
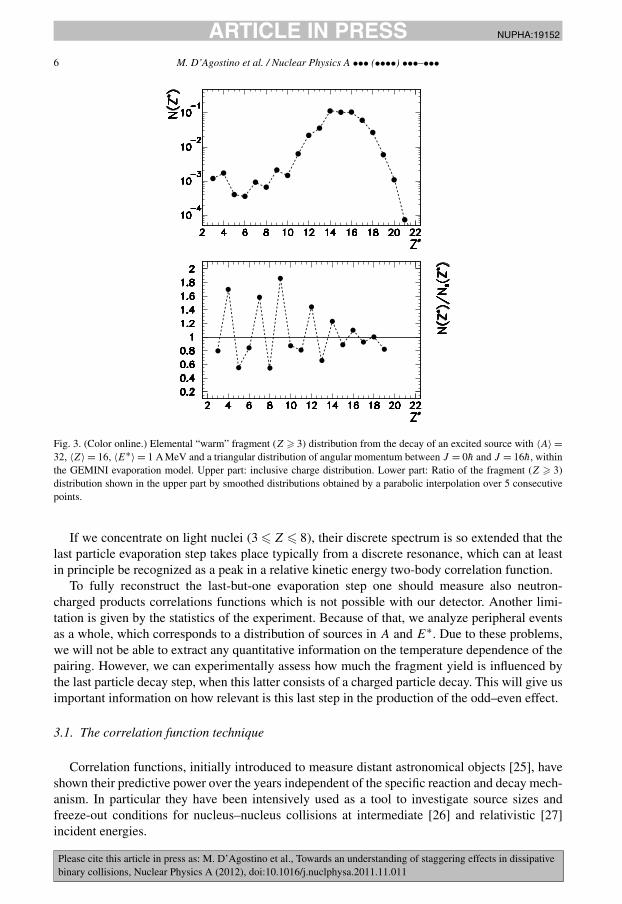
Fig. 3. (Color online.) Elemental “warm” fragment (Z � 3) distribution from the decay of an excited source with 〈A〉 =32, 〈Z〉 = 16, 〈E∗〉 = 1 A MeV and a triangular distribution of angular momentum between J = 0h and J = 16h, withinthe GEMINI evaporation model. Upper part: inclusive charge distribution. Lower part: Ratio of the fragment (Z � 3)distribution shown in the upper part by smoothed distributions obtained by a parabolic interpolation over 5 consecutivepoints.
If we concentrate on light nuclei (3 � Z � 8), their discrete spectrum is so extended that thelast particle evaporation step takes place typically from a discrete resonance, which can at leastin principle be recognized as a peak in a relative kinetic energy two-body correlation function.
To fully reconstruct the last-but-one evaporation step one should measure also neutron-charged products correlations functions which is not possible with our detector. Another limi-tation is given by the statistics of the experiment. Because of that, we analyze peripheral eventsas a whole, which corresponds to a distribution of sources in A and E∗. Due to these problems,we will not be able to extract any quantitative information on the temperature dependence of thepairing. However, we can experimentally assess how much the fragment yield is influenced bythe last particle decay step, when this latter consists of a charged particle decay. This will give usimportant information on how relevant is this last step in the production of the odd–even effect.
3.1. The correlation function technique
Correlation functions, initially introduced to measure distant astronomical objects [25], haveshown their predictive power over the years independent of the specific reaction and decay mech-anism. In particular they have been intensively used as a tool to investigate source sizes andfreeze-out conditions for nucleus–nucleus collisions at intermediate [26] and relativistic [27]incident energies.
JID:NUPHA AID:19152 /FLA [m1+; v 1.137; Prn:9/01/2012; 10:06] P.7 (1-21)
M. D’Agostino et al. / Nuclear Physics A ••• (••••) •••–••• 7
This same methodology is at the basis of very powerful model-independent imaging tech-niques [28] and is routinely used to determine the spectroscopic characteristics of dripline nucleiproduced in direct reactions [29]. This flexibility of the correlation function tool makes it a verysound and powerful technique to experimentally access loosely bound and unbound states.
Experimentally the two-particle correlation function may be defined as:∑( �p1− �p2)
2/2μ=Erel
Y12( �p1, �p2) = C[1 + R(Erel)
] ∑( �p1− �p2)
2/2μ=Erel
Y1( �p1)Y2( �p2), (1)
where Y12 is the two-particle coincidence yield of a given pair of particles with their individualmomenta �p1 and �p2, respectively, and the Yi( �pi) are the single particle yields for the two particlesmeasured under the same impact parameter selection but not in the same event. The summationson both sides of the equation run over pairs of momenta �p1 and �p2 corresponding to the same binin relative energy Erel. The correlation function describes how the correlation between interactingparticles measured in the same event differs from the underlying two-particle phase space. Thisphase space can be modeled by mixing the single particle distributions of particles from differentevents [30]. The correlation constant C is chosen [31] as the ratio between the total (integratedover momentum) number of generated mixed events and the total number of coincident yields:C = ∑
Y12/∑
(Y1Y2).To investigate the decay of particle unbound states it is necessary to consider the modifications
of the two particle phase space by the long range Coulomb and short range nuclear interactionsand to disentangle these contributions. We have chosen to parametrize the Coulomb contributionby an empirical expression [32,33]
1 + RCoul(Erel) = 1 − exp[−(Erel/Ec)
γ]
(2)
which vanishes at zero relative energy and reaches unity at large relative energy. Thisparametrization was recently shown [34] to be flexible enough to well reproduce the backgroundof fragmentation reactions in the Fermi energy domain.
Given this relationship, we obtain a practical expression for the correlation function as a func-tion of relative energy Erel
1 + R(Erel) = 1 + RCoul(Erel) + Rnuc(Erel), (3)
where
Rnuc(Erel) = 1
(2S1 + 1)(2S2 + 1)
h3
4πVf μ√
2μErele−Erel/Teff
× 1
π
∑i
(2Ji + 1)Γi/2
(Erel − E∗i )2 + Γ 2
i /4(B.R.). (4)
Here S1 and S2 are the spins of the considered particles, μ is their reduced mass, Vf is theeffective emitting source volume, Teff is the associated effective temperature, Ji , E∗
i , Γi are thespin, excitation energy and width of the level i, and (B.R.) is the branching ratio for decay to themeasured channel. It is worth mentioning that this parametrization has been successfully usedin fragmentation reactions not only to reproduce measured correlations, but even to deduce spinand parity of excited states unknown to traditional spectroscopic studies [34].
Only levels where spins, excitation energies, widths of the levels and branching ratios were ex-perimentally measured [23,24] were considered. Some modifications in the widths were allowedto account for the finite efficiency of the detection apparatus, as it will be discussed in detail in
JID:NUPHA AID:19152 /FLA [m1+; v 1.137; Prn:9/01/2012; 10:06] P.8 (1-21)
8 M. D’Agostino et al. / Nuclear Physics A ••• (••••) •••–•••
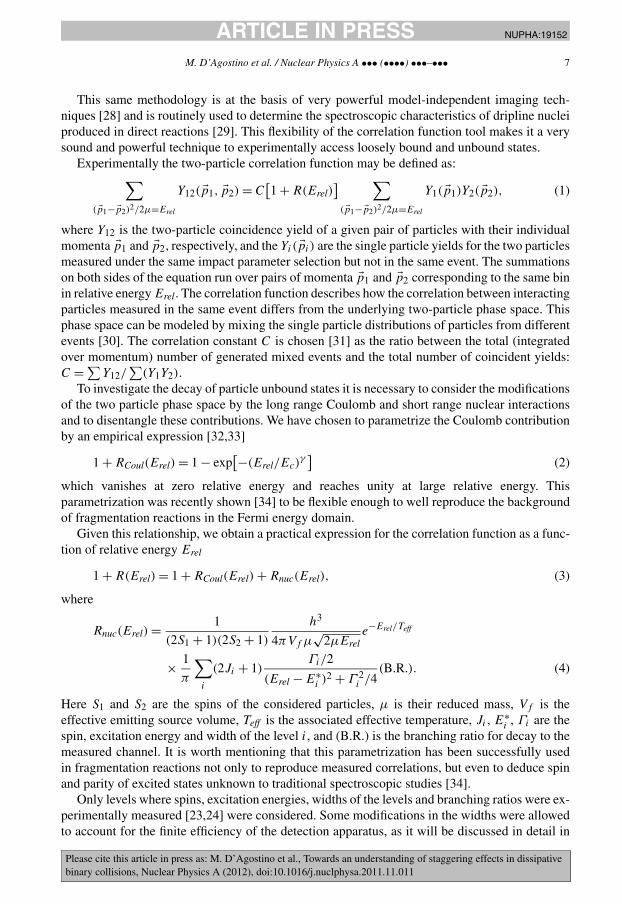
Fig. 4. (Color online.) Upper part: d–α relative kinetic energy correlation function (symbols) measured in peripheral32S + 58Ni collisions and fitted through Eq. (4) (thick solid line). The obtained Coulomb background (thin solid line)is also indicated together with its uncertainties (dashed lines). Middle part: experimental population of primary 6Liparent (symbols) and single excited state contributions (thin lines) together with their sum (thick line) as a functionof the excitation energy: E∗ = Erel + QV , with QV = Q-value of the decay. Lower part: extracted Ni Breit–Wignercontributions of the different populated excited states.
the next section. The Coulomb background parameters Ec, γ are free parameters of the fit. Thesame is true for the parameters Vf , Teff , which would represent a physical source volume andtemperature only in the idealized situation of a single decay step of a fully equilibrated source inthe absence of any collective flow and experimental deformation. Qualitatively, collective energycomponents act in the direction of increasing Vf in respect to a physical volume, which leadsto a suppression of high-lying resonances, while efficiency issues point to an increase of Teff inrespect to a physical temperature, with an opposite effect on the resonant population. Because ofthis correlation, the parameter space is degenerate and no physical meaning can be attributed tothe Vf , Teff values extracted from Eq. (4).
3.2. Extraction of primary fragments
Examples of typical correlation functions and resulting fits via Eq. (4) are shown in the toppanels of Figs. 4 and 5. The errors associated to the fit parameters Ec, γ produce an upper andlower bound for the estimated Coulomb background, which are indicated by the dashed lines.
Primary yields are calculated by multiplying the nuclear contribution R − RCoul of the corre-lation function for the uncorrelated yield of Eq. (1), Ycor(E
∗) = (R(E∗) − RCoul(E∗))
∑E Y1Y2
[32,33]. This experimentally reconstructed primary population is shown by full symbols for someselected nuclei in the middle panel of Fig. 4 and bottom panels of Figs. 5, together with the con-tributions from the different parent excited levels entering in Eq. (4), shown as lines. The bottompanel of Fig. 4 additionally shows the extracted Breit–Wigner distribution of the different popu-
JID:NUPHA AID:19152 /FLA [m1+; v 1.137; Prn:9/01/2012; 10:06] P.9 (1-21)
M. D’Agostino et al. / Nuclear Physics A ••• (••••) •••–••• 9
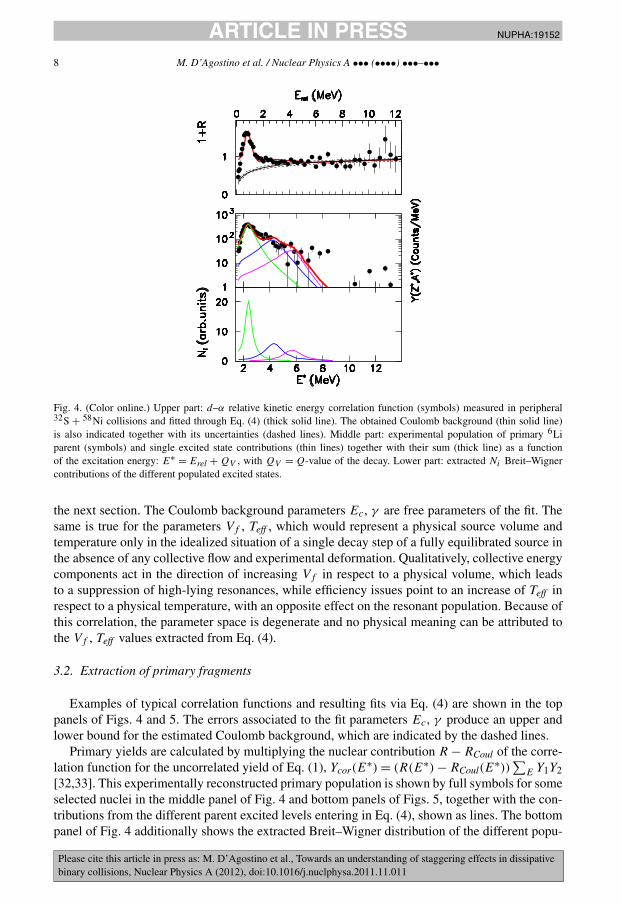
Fig. 5. (Color online.) Upper part: representative relative kinetic energy correlation functions (symbols) of differentisotopes measured in peripheral 32S + 58Ni collisions and fitted through Eq. (4) (thick solid line). The obtained Coulombbackground (thin solid line) is also indicated together with its uncertainties (dashed lines). Lower part: experimentalpopulation of primary parents (symbols) and single excited state contributions (thin lines) together with their sum (thickline) as a function of the excitation energy: E∗ = Erel + QV , with QV = Q-value of the decay. From left to right: α–α
correlations and corresponding excited states of 8Be (a view of the correlation function around 3 MeV is shown in theinsert), α–6Li correlations and corresponding excited states of 10B, p–13C correlations and corresponding excited statesof 14N.
lated excited states. We can notice that the peaks of the correlation function closely correspond tothe resonant energies. It is also interesting to remark that the different excited states significantlycontribute to a large interval of relative energy which extends relatively far from the resonancepeak in a non-symmetric way. The lack of symmetry is due to the combined effect of the phasespace factor 1/
√(Erel2μ12) which deforms the Breit–Wigner distributions, the suppression fac-
tor exp(−Erel/Teff ) which accounts for temperature and the distribution of the uncorrelated yieldY1Y2 of Eq. (1), Maxwellian-like shaped, as well as non-equilibrium effects that can be presentin the sample. Further distortions come from efficiency effects and will be discussed in the nextchapter. The errors of the reconstructed yields are calculated by taking into account the statisticsof correlated and uncorrelated pairs in each bin of relative energy and the propagation of theerrors on Ec and γ in the Coulomb background subtraction.
The systematic error in the reconstructed yield can be estimated by the difference be-tween this correlated yield Ycor(E
∗) and the expected resonant yield from Eq. (4), Yres(E∗) =
Rnuc(E∗)
∑E Y1Y2. This latter quantity is shown by thick lines in Figs. 4, 5.
The main uncertainty is associated to the highest relative energies, due to the lack of statisticsof the data, the possible inadequacy of Eq. (2) to correctly account for all the different sources ofbackground and to the incomplete spectroscopic information of the tables of Refs. [23,24].
The global capability of Eqs. (2), (3), (4) to extract the yields of excited parents was checkedfor the ideal case of only one level plus the Coulomb interaction, with a simulation performedwith the SMM model [36], by letting decay a 6Li in its first excited state. The reconstructedprimary yield corresponds to 99.6% of the SMM generated and filtered resonant 6Li population.
The total primary population of a given isotope at the last-but-one evaporation step Y(A∗,Z∗)is calculated by integrating over the excitation energy the primary yields given in the bottom partof Figs. 4 and 5. The primary yields obtained by this procedure for the unstable 8Be have beenalready reported in Fig. 2.

JID:NUPHA AID:19152 /FLA [m1+; v 1.137; Prn:9/01/2012; 10:06] P.10 (1-21)
10 M. D’Agostino et al. / Nuclear Physics A ••• (••••) •••–•••
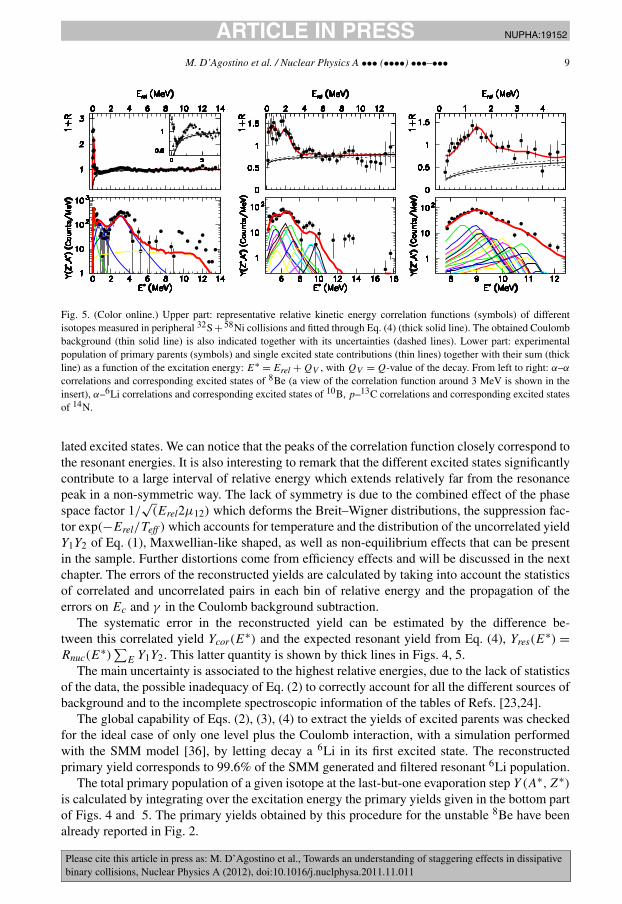
Fig. 6. (Color online.) Upper part: relative kinetic energy correlation functions (symbols) of different isotopes measuredin the whole sample of 32S + 58Ni collisions and fitted through Eq. (4) (line). The obtained Coulomb background is alsoindicated together with its uncertainty (dashed lines). Lower part: experimental population of primary parents (symbols)and single excited state contributions (thin lines) together with their sum (thick line) as a function of the excitation energy:E∗ = Erel + QV , with QV = Q-value of the decay. From left to right: p–13C correlations and corresponding excitedstates of 14N, t–α correlations and corresponding excited states of 7Li.
Interestingly enough, some excited levels which energetically lie above the lowest thresholdfor particle emission in the daughter nucleus contribute to the data. To give an example, most ofthe correlated yield associated to the α+ 6Li correlation function presented in Fig. 5 is associatedto excited levels of 10B around E∗ = 6.6 MeV, lying about 300 keV above the threshold for the6Li decay in α + d and below the separation energy for the neutron emission for this daughternucleus. Since the α + d correlation function (shown in Fig. 4) was measured, it should beinteresting for this case to perform a 3-body decay correlation α + α + d to calculate the amountof primary 10B fragments before their last step of the decay.
Unfortunately, due to the limited statistics associated to the peripheral sample, we can neitherperform 3-body correlations nor show other cases of successive decays. To show however that theα + 6Li is not a single case of possible ternary decays, we analyzed the whole sample, obtainedfor the detected events without any selection on the collision mechanism. In Fig. 6 we show thecorrelation function p + 13C, already shown in Fig. 5 for peripheral events.
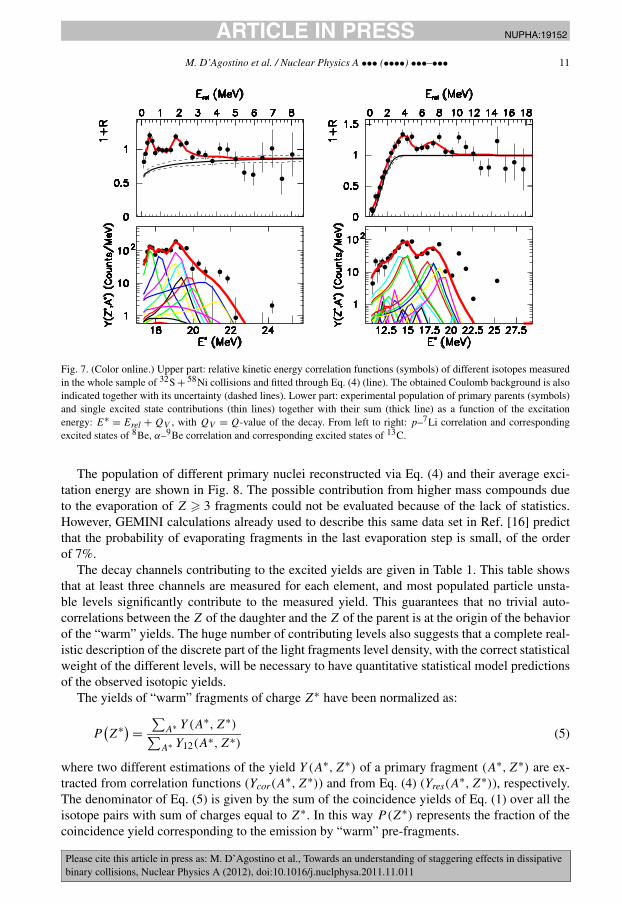
The fact that high-lying resonances appear more clearly in the inclusive sample shows that ahigher statistics would allow to explore a higher range of excitation energies of the parent nuclei,and have a better reconstruction of the evaporation chain. We also show in Fig. 7 the p + 7Licorrelation function, corresponding to the decay of 8Be∗. The excitation energy of the parent8Be∗ overcomes of about 2 MeV, with non negligible yield, the threshold for α + t emissionof 7Li∗, which is below the separation energy for neutron emission. Also the correlation functionfor t + α is measurable, as shown in Fig. 6.
These examples show that the emission is not necessarily associated to the lowest particleemission threshold, but it depends in a more complicated way on the history of the evaporationchain.
JID:NUPHA AID:19152 /FLA [m1+; v 1.137; Prn:9/01/2012; 10:06] P.11 (1-21)
M. D’Agostino et al. / Nuclear Physics A ••• (••••) •••–••• 11
Fig. 7. (Color online.) Upper part: relative kinetic energy correlation functions (symbols) of different isotopes measuredin the whole sample of 32S + 58Ni collisions and fitted through Eq. (4) (line). The obtained Coulomb background is alsoindicated together with its uncertainty (dashed lines). Lower part: experimental population of primary parents (symbols)and single excited state contributions (thin lines) together with their sum (thick line) as a function of the excitationenergy: E∗ = Erel + QV , with QV = Q-value of the decay. From left to right: p–7Li correlation and correspondingexcited states of 8Be, α–9Be correlation and corresponding excited states of 13C.
The population of different primary nuclei reconstructed via Eq. (4) and their average exci-tation energy are shown in Fig. 8. The possible contribution from higher mass compounds dueto the evaporation of Z � 3 fragments could not be evaluated because of the lack of statistics.However, GEMINI calculations already used to describe this same data set in Ref. [16] predictthat the probability of evaporating fragments in the last evaporation step is small, of the orderof 7%.
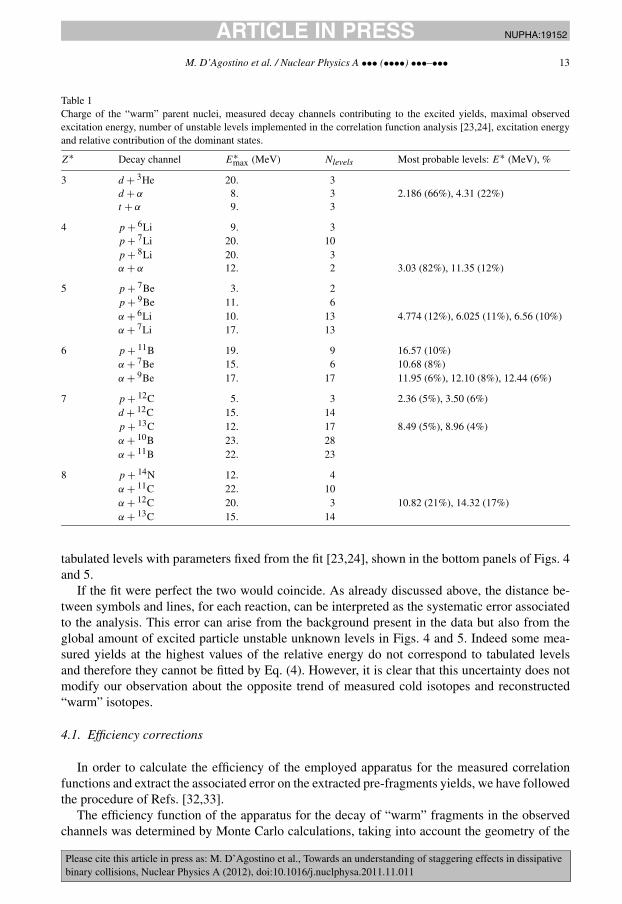
The decay channels contributing to the excited yields are given in Table 1. This table showsthat at least three channels are measured for each element, and most populated particle unsta-ble levels significantly contribute to the measured yield. This guarantees that no trivial auto-correlations between the Z of the daughter and the Z of the parent is at the origin of the behaviorof the “warm” yields. The huge number of contributing levels also suggests that a complete real-istic description of the discrete part of the light fragments level density, with the correct statisticalweight of the different levels, will be necessary to have quantitative statistical model predictionsof the observed isotopic yields.
The yields of “warm” fragments of charge Z∗ have been normalized as:
P(Z∗) =
∑A∗ Y(A∗,Z∗)∑
A∗ Y12(A∗,Z∗)(5)
where two different estimations of the yield Y(A∗,Z∗) of a primary fragment (A∗,Z∗) are ex-tracted from correlation functions (Ycor(A
∗,Z∗)) and from Eq. (4) (Yres(A∗,Z∗)), respectively.
The denominator of Eq. (5) is given by the sum of the coincidence yields of Eq. (1) over all theisotope pairs with sum of charges equal to Z∗. In this way P(Z∗) represents the fraction of thecoincidence yield corresponding to the emission by “warm” pre-fragments.

JID:NUPHA AID:19152 /FLA [m1+; v 1.137; Prn:9/01/2012; 10:06] P.12 (1-21)
12 M. D’Agostino et al. / Nuclear Physics A ••• (••••) •••–•••
Fig. 8. (Color online.) Upper part: isotopes reconstructed (in at least one of their lowest lying particle unstable excitedstates) by the correlation function technique in the two data sets. Lower part: extracted population of the different primaryfragments (left) and their average excitation energy (right) for the 32S + 58Ni (full symbols and dashed lines) and32S + 64Ni (circles and full lines) data set. Panels a, b: peripheral sample. Panels c, d: all well detected events.
It is evident that the reconstructed “warm” yields keep on showing the staggering, and the factof restricting the analysis to the peripheral sample (panels a, b in Fig. 8) does not modify theobserved trend. This result means that the reaction dynamics or the previous evaporation chain,essentially coming from continuum states, play a role in establishing odd–even effects, and theselatter are not a simple effect of the energetic balance of the last evaporation step.
Particularly striking is the fact that this staggering shows an opposite trend in respect to theexperimental asymptotic distributions shown in Fig. 1. This fact can be qualitatively understoodas a level density effect: even–even nuclei have a lower density of levels at low energy becauseof the pairing gap, which leads to a reduced population at the last-but-one evaporation step.
4. Systematic errors and corrections
In Fig. 8 the filled (32S + 58Ni) and empty (32S + 64Ni) circles are associated to the numericalintegration of the estimated correlated yield Ycor , once the Coulomb background is subtracted.The error bars give statistical errors as well as the error propagation of the fit parameters. Con-versely the lines correspond to the integral of the fitting function Eq. (4) Yres containing all
JID:NUPHA AID:19152 /FLA [m1+; v 1.137; Prn:9/01/2012; 10:06] P.13 (1-21)
M. D’Agostino et al. / Nuclear Physics A ••• (••••) •••–••• 13
Table 1Charge of the “warm” parent nuclei, measured decay channels contributing to the excited yields, maximal observedexcitation energy, number of unstable levels implemented in the correlation function analysis [23,24], excitation energyand relative contribution of the dominant states.
Z∗ Decay channel E∗max (MeV) Nlevels Most probable levels: E∗ (MeV), %
3 d + 3He 20. 3d + α 8. 3 2.186 (66%), 4.31 (22%)t + α 9. 3
4 p + 6Li 9. 3p + 7Li 20. 10p + 8Li 20. 3α + α 12. 2 3.03 (82%), 11.35 (12%)
5 p + 7Be 3. 2p + 9Be 11. 6α + 6Li 10. 13 4.774 (12%), 6.025 (11%), 6.56 (10%)α + 7Li 17. 13
6 p + 11B 19. 9 16.57 (10%)α + 7Be 15. 6 10.68 (8%)α + 9Be 17. 17 11.95 (6%), 12.10 (8%), 12.44 (6%)
7 p + 12C 5. 3 2.36 (5%), 3.50 (6%)d + 12C 15. 14p + 13C 12. 17 8.49 (5%), 8.96 (4%)α + 10B 23. 28α + 11B 22. 23
8 p + 14N 12. 4α + 11C 22. 10α + 12C 20. 3 10.82 (21%), 14.32 (17%)α + 13C 15. 14
tabulated levels with parameters fixed from the fit [23,24], shown in the bottom panels of Figs. 4and 5.
If the fit were perfect the two would coincide. As already discussed above, the distance be-tween symbols and lines, for each reaction, can be interpreted as the systematic error associatedto the analysis. This error can arise from the background present in the data but also from theglobal amount of excited particle unstable unknown levels in Figs. 4 and 5. Indeed some mea-sured yields at the highest values of the relative energy do not correspond to tabulated levelsand therefore they cannot be fitted by Eq. (4). However, it is clear that this uncertainty does notmodify our observation about the opposite trend of measured cold isotopes and reconstructed“warm” isotopes.
4.1. Efficiency corrections
In order to calculate the efficiency of the employed apparatus for the measured correlationfunctions and extract the associated error on the extracted pre-fragments yields, we have followedthe procedure of Refs. [32,33].
The efficiency function of the apparatus for the decay of “warm” fragments in the observedchannels was determined by Monte Carlo calculations, taking into account the geometry of the
JID:NUPHA AID:19152 /FLA [m1+; v 1.137; Prn:9/01/2012; 10:06] P.14 (1-21)
14 M. D’Agostino et al. / Nuclear Physics A ••• (••••) •••–•••
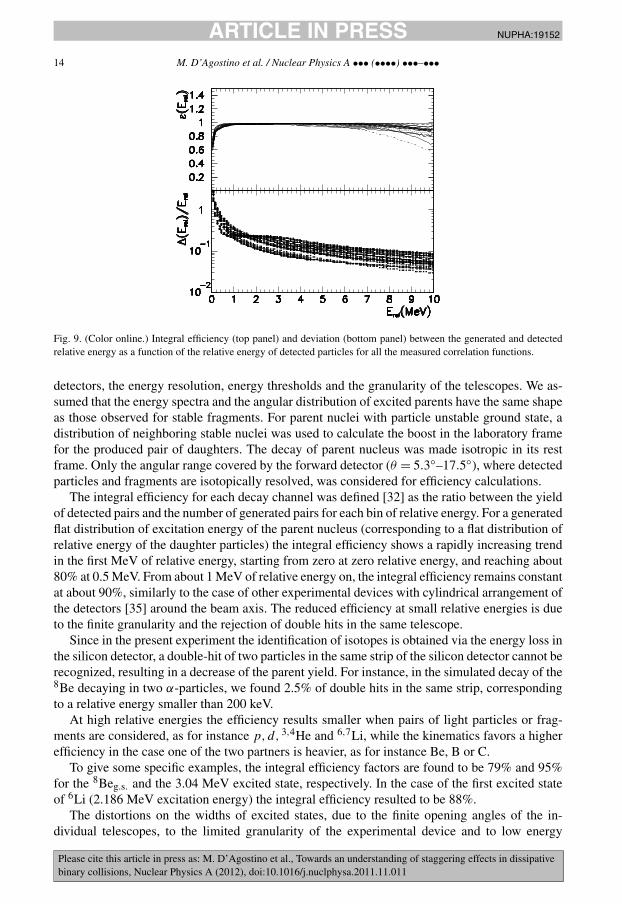
Fig. 9. (Color online.) Integral efficiency (top panel) and deviation (bottom panel) between the generated and detectedrelative energy as a function of the relative energy of detected particles for all the measured correlation functions.
detectors, the energy resolution, energy thresholds and the granularity of the telescopes. We as-sumed that the energy spectra and the angular distribution of excited parents have the same shapeas those observed for stable fragments. For parent nuclei with particle unstable ground state, adistribution of neighboring stable nuclei was used to calculate the boost in the laboratory framefor the produced pair of daughters. The decay of parent nucleus was made isotropic in its restframe. Only the angular range covered by the forward detector (θ = 5.3◦–17.5◦), where detectedparticles and fragments are isotopically resolved, was considered for efficiency calculations.
The integral efficiency for each decay channel was defined [32] as the ratio between the yieldof detected pairs and the number of generated pairs for each bin of relative energy. For a generatedflat distribution of excitation energy of the parent nucleus (corresponding to a flat distribution ofrelative energy of the daughter particles) the integral efficiency shows a rapidly increasing trendin the first MeV of relative energy, starting from zero at zero relative energy, and reaching about80% at 0.5 MeV. From about 1 MeV of relative energy on, the integral efficiency remains constantat about 90%, similarly to the case of other experimental devices with cylindrical arrangement ofthe detectors [35] around the beam axis. The reduced efficiency at small relative energies is dueto the finite granularity and the rejection of double hits in the same telescope.
Since in the present experiment the identification of isotopes is obtained via the energy loss inthe silicon detector, a double-hit of two particles in the same strip of the silicon detector cannot berecognized, resulting in a decrease of the parent yield. For instance, in the simulated decay of the8Be decaying in two α-particles, we found 2.5% of double hits in the same strip, correspondingto a relative energy smaller than 200 keV.
At high relative energies the efficiency results smaller when pairs of light particles or frag-ments are considered, as for instance p,d, 3,4He and 6,7Li, while the kinematics favors a higherefficiency in the case one of the two partners is heavier, as for instance Be, B or C.
To give some specific examples, the integral efficiency factors are found to be 79% and 95%for the 8Beg.s. and the 3.04 MeV excited state, respectively. In the case of the first excited stateof 6Li (2.186 MeV excitation energy) the integral efficiency resulted to be 88%.
The distortions on the widths of excited states, due to the finite opening angles of the in-dividual telescopes, to the limited granularity of the experimental device and to low energy
JID:NUPHA AID:19152 /FLA [m1+; v 1.137; Prn:9/01/2012; 10:06] P.15 (1-21)
M. D’Agostino et al. / Nuclear Physics A ••• (••••) •••–••• 15
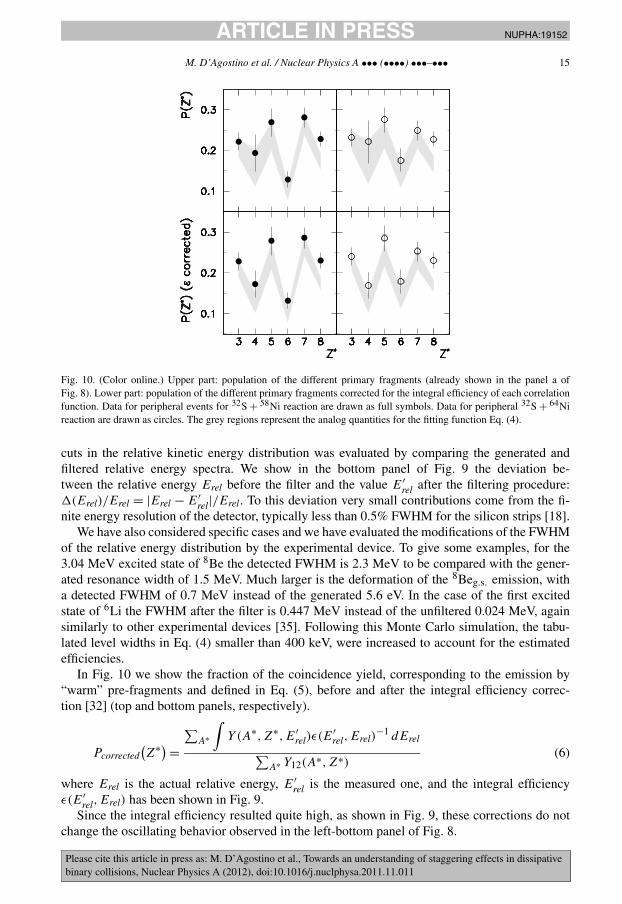
Fig. 10. (Color online.) Upper part: population of the different primary fragments (already shown in the panel a ofFig. 8). Lower part: population of the different primary fragments corrected for the integral efficiency of each correlationfunction. Data for peripheral events for 32S + 58Ni reaction are drawn as full symbols. Data for peripheral 32S + 64Nireaction are drawn as circles. The grey regions represent the analog quantities for the fitting function Eq. (4).
cuts in the relative kinetic energy distribution was evaluated by comparing the generated andfiltered relative energy spectra. We show in the bottom panel of Fig. 9 the deviation be-tween the relative energy Erel before the filter and the value E′
rel after the filtering procedure:�(Erel)/Erel = |Erel − E′
rel|/Erel. To this deviation very small contributions come from the fi-nite energy resolution of the detector, typically less than 0.5% FWHM for the silicon strips [18].
We have also considered specific cases and we have evaluated the modifications of the FWHMof the relative energy distribution by the experimental device. To give some examples, for the3.04 MeV excited state of 8Be the detected FWHM is 2.3 MeV to be compared with the gener-ated resonance width of 1.5 MeV. Much larger is the deformation of the 8Beg.s. emission, witha detected FWHM of 0.7 MeV instead of the generated 5.6 eV. In the case of the first excitedstate of 6Li the FWHM after the filter is 0.447 MeV instead of the unfiltered 0.024 MeV, againsimilarly to other experimental devices [35]. Following this Monte Carlo simulation, the tabu-lated level widths in Eq. (4) smaller than 400 keV, were increased to account for the estimatedefficiencies.
In Fig. 10 we show the fraction of the coincidence yield, corresponding to the emission by“warm” pre-fragments and defined in Eq. (5), before and after the integral efficiency correc-tion [32] (top and bottom panels, respectively).
Pcorrected(Z∗) =
∑A∗
∫Y(A∗,Z∗,E′
rel)ε(E′rel,Erel)
−1 dErel∑A∗ Y12(A∗,Z∗)
(6)
where Erel is the actual relative energy, E′rel is the measured one, and the integral efficiency
ε(E′rel,Erel) has been shown in Fig. 9.
Since the integral efficiency resulted quite high, as shown in Fig. 9, these corrections do notchange the oscillating behavior observed in the left-bottom panel of Fig. 8.
JID:NUPHA AID:19152 /FLA [m1+; v 1.137; Prn:9/01/2012; 10:06] P.16 (1-21)
16 M. D’Agostino et al. / Nuclear Physics A ••• (••••) •••–•••
4.2. Estimation of neutron decay
A limitation of our analysis is the systematic absence of neutron-decaying states in our recon-struction of excited levels, due to the lack of neutron detection. It is interesting that wheneveran excited state has a known and finite probability of decaying through charged particle emis-sion, the excited yield can be entirely reconstructed through Eq. (4) even if this channel is lessimportant than neutron emission. However many excited states exist, especially in neutron richisotopes, for which the charged particle branching ratio is negligible and that therefore are notincluded in our analysis.
One may then wonder if this systematic lack may be at the origin of the inverse staggeringdisplayed in Figs. 8, 10.
To estimate the contribution of neutron decay we start writing the total yield of a given primaryfragment (A∗,Z∗) as the sum of charged particle decay and neutral decay channels:
Y(A∗,Z∗) =
∑i
Y(A∗,Z∗, i
)(B.R.)ich +
∑i
Y(N∗,Z∗, i
)(B.R.)in
= Ych
(A∗,Z∗) + Yn
(A∗,Z∗) (7)
where the sum runs over the particle unstable levels of the considered isotope, (B.R.)ich(n)
is the
branching ratio of level i to charged (neutral) channels, and by definition (B.R.)ich + (B.R.)in = 1.By writing the yield of each level Y(A∗,Z∗, i) as a function of its spin, Boltzmann factor and
branching ratios and by integrating the level contributions, one gets the total yield Yn(ch)(A∗,Z∗):
Yn(ch)
(A∗,Z∗) = g
(A∗,Z∗)∑
i
(2Ji + 1) exp(−E∗
i /T)(B.R.)in(ch) (8)
where T is the average emission temperature, and the function g depends on the consideredisotope (A∗,Z∗), on the characteristics of the emitting source (energy, mass, charge and angularmomentum), but does not depend on the considered level i. Indeed the dependence on the level,i.e. on the good quantum numbers E∗
i , Ji , is already explicitly factorized in Eq. (8) under thehypothesis that the emission is governed by statistical laws.
If for a given isotope at least one energy level i exists such that (B.R.)ich �= 0, then we canconsider the ratio:
f(A∗,Z∗) = Yn(A
∗,Z∗)Ych(A∗,Z∗)
=∑
i=1(2Ji + 1) exp(−E∗i /T )(B.R.)in∑
i (2Ji + 1) exp(−E∗i /T )(B.R.)ich
. (9)
This implies that we can build a correction factor for each isotope:
Y(A∗,Z∗) = Ych
(A∗,Z∗)(1 + f
(A∗,Z∗)) (10)
where Ych(A∗,Z∗) = Ycor(res)(A
∗,Z∗) represents the reconstructed, efficiency corrected yieldobtained through correlation functions of charged decay products.
An example of this neutron correction is given by Fig. 11, which gives the mass distributionof reconstructed primary oxygen isotopes. For this correction we have considered in Eq. (9) allthe tabulated particle unstable excited states up to the maximal excitation energy experimen-tally accessed in the charged channel decays. For the temperature parameter T we have takenT = 2.5 MeV, i.e. the average temperature measured by excited states thermometers for thissame sample. This is consistent with the measured excitation energy of the peripheral sample,
JID:NUPHA AID:19152 /FLA [m1+; v 1.137; Prn:9/01/2012; 10:06] P.17 (1-21)
M. D’Agostino et al. / Nuclear Physics A ••• (••••) •••–••• 17
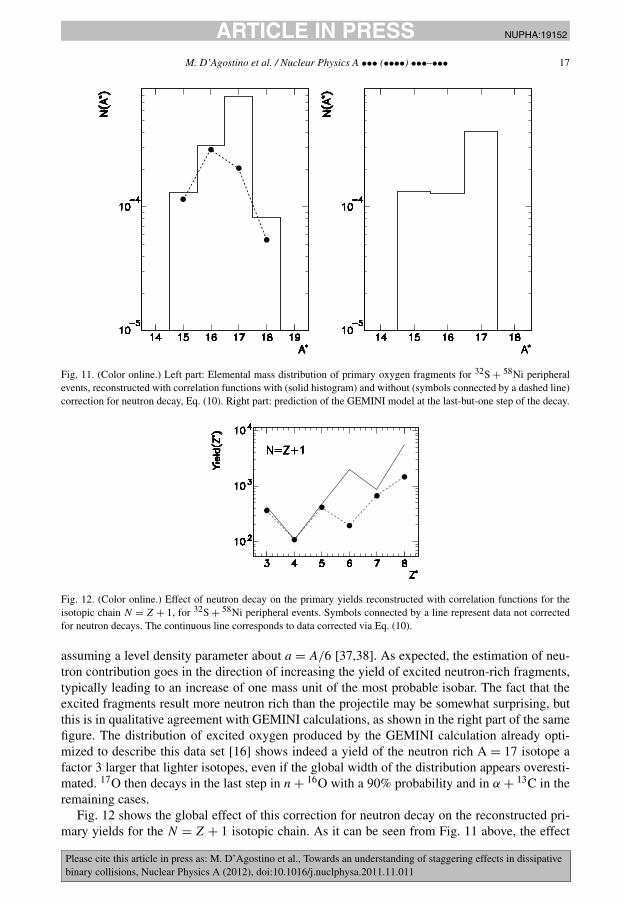
Fig. 11. (Color online.) Left part: Elemental mass distribution of primary oxygen fragments for 32S + 58Ni peripheralevents, reconstructed with correlation functions with (solid histogram) and without (symbols connected by a dashed line)correction for neutron decay, Eq. (10). Right part: prediction of the GEMINI model at the last-but-one step of the decay.
Fig. 12. (Color online.) Effect of neutron decay on the primary yields reconstructed with correlation functions for theisotopic chain N = Z + 1, for 32S + 58Ni peripheral events. Symbols connected by a line represent data not correctedfor neutron decays. The continuous line corresponds to data corrected via Eq. (10).
assuming a level density parameter about a = A/6 [37,38]. As expected, the estimation of neu-tron contribution goes in the direction of increasing the yield of excited neutron-rich fragments,typically leading to an increase of one mass unit of the most probable isobar. The fact that theexcited fragments result more neutron rich than the projectile may be somewhat surprising, butthis is in qualitative agreement with GEMINI calculations, as shown in the right part of the samefigure. The distribution of excited oxygen produced by the GEMINI calculation already opti-mized to describe this data set [16] shows indeed a yield of the neutron rich A = 17 isotope afactor 3 larger that lighter isotopes, even if the global width of the distribution appears overesti-mated. 17O then decays in the last step in n + 16O with a 90% probability and in α + 13C in theremaining cases.
Fig. 12 shows the global effect of this correction for neutron decay on the reconstructed pri-mary yields for the N = Z + 1 isotopic chain. As it can be seen from Fig. 11 above, the effect

JID:NUPHA AID:19152 /FLA [m1+; v 1.137; Prn:9/01/2012; 10:06] P.18 (1-21)
18 M. D’Agostino et al. / Nuclear Physics A ••• (••••) •••–•••
Fig. 13. (Color online.) Upper part: efficiency corrected population of the different primary fragments as extracted fromcorrelation function. Lower part: estimation of the primary yields with a correction for neutron decay from Eq. (10). Forboth panels the reconstructed yield is normalized to the detected yield of the same element. Data for peripheral eventsfor 32S + 58Ni reaction are drawn as full symbols. Data for peripheral 32S + 64Ni reaction are drawn as circles.
of this correction on N = Z and N = Z − 1 is small, while the statistics for the isotopic chainN = Z + 2 is too low to make reliable estimations.
Odd–even effects persist in Fig. 12, showing that the absence of neutron detection cannot beat the origin of the observed staggering.
We show in Fig. 13 the yields of primary fragments, corrected for neutron decay contributions,normalized to the measured yield of the same element. Due to the impossibility of evaluating thenon-coincident yield of neutral channels, we cannot indeed use the normalization of Eq. (5) andFigs. 8, 10.
We can see that the effect of neutron decay is more sizable in the more neutron rich sourceespecially for oxygen isotopes, and slightly reduces the observed staggering. From a qualita-tive point of view, the same staggering observed for reconstructed primary fragments (Fig. 8) ispresent, again opposite to the trend of measured cold isotopes of Fig. 2.
GEMINI calculations again confirm our findings. Fig. 14 presents the same theoretical calcu-lation as Fig. 3 above, where the solid line corresponds to an incomplete reconstruction of thelast-but-one evaporation step obtained by ignoring neutrons decaying channels, as it is done inthe experimental data. The similarity between the full and dashed curves in Fig. 14 confirms thatthe trend of the experimental “warm” distribution at the last-but-one evaporation step of Fig. 8 isnot qualitatively distorted by the lack of neutron detection.
5. Conclusions
In this paper we have reported on an experimental study of staggering in 32S + 58Ni and32S+ 64Ni collisions at 14.5 A MeV, performed with the TANDEM–ALPI acceleration system atthe Legnaro National Laboratory. The data collection was assured by the GARFIELD apparatuscoupled to a high resolution annular detector for correlation measurements, the Ring Counter.

JID:NUPHA AID:19152 /FLA [m1+; v 1.137; Prn:9/01/2012; 10:06] P.19 (1-21)
M. D’Agostino et al. / Nuclear Physics A ••• (••••) •••–••• 19
Fig. 14. (Color online.) Elemental “warm” fragment (Z � 3) distribution in the GEMINI model, with the same conditionsas in Fig. 3 above. Solid lines: neutron decaying parents are not considered in the reconstruction of the excited yield.
Important odd–even effects are seen in the intermediate mass fragment yields as well as in theresidue yields produced in the decay of a quasi-projectile sources formed in peripheral collisions.
For the light fragments (3 � Z � 8), which are the only ones isotopically resolved by theexperimental apparatus, the discrete spectrum of excitation energy of “warm” pre-fragmentsextends over a wide energy range which can overcome the neutron and proton emission thresh-olds. This allows a partial reconstruction of the excited fragment yields prior to their last decay,through a model-independent correlation function technique.
This analysis shows that the distribution of excited fragments displays odd–even effects withan opposite sign in respect to the asymptotic distributions. This important result has a two-foldconsequence. First, the quantitative understanding of the odd–even effect needs a global controlof the evaporation chain. Second and more interesting, the understanding of the staggering cannotbe attributed to the pairing effect of nuclear masses alone, but is also influenced by pairingand isospin effects in the level density. We expect it to be especially sensitive to the pairingeffects in the level density via the back-shift parameter [39], and thus potentially useful to gatherinformation of the temperature dependence of nuclear pairing.
First preliminary calculations with the GEMINI model confirm that staggering effects arepresent during the evaporation chain. The GEMINI distribution at the last-but-one evaporationstep is in good qualitative agreement with the experimental correlation function data. This ishowever only a first step in the comparison, and further work is needed to fully constrain thelevel densities and different ingredients of the statistical calculations. Indeed it has been alreadyobserved [4,16] that important deviations appear when the behavior is analyzed in different iso-topic chains. Limiting ourselves to the elemental distribution, an important discrepancy concerns

JID:NUPHA AID:19152 /FLA [m1+; v 1.137; Prn:9/01/2012; 10:06] P.20 (1-21)
20 M. D’Agostino et al. / Nuclear Physics A ••• (••••) •••–•••
the relative yield of Li and Be isotopes, which is inverted in the calculation in respect to thetrend shown by the experiment. Different explanations can be invoked to understand this dis-crepancy. First, the GEMINI code makes a switch from the Hauser–Feshbach formalism, usedto describe light nuclei (Z � 3) evaporation, to the Bohr–Wheeler formalism, used to treat theemission of complex fragments heavier than Li. The absence of a unified description of fissionand evaporation may be at the origin of the observed discrepancy. Moreover, the Be/Li ratio inthe GEMINI code is sensitive to the value of the maximal angular momentum, which is poorlyconstrained in the experimental sample. Another problem concerns the treatment of the discreteparticle unstable spectrum, which in GEMINI as in the other existing codes is approximatedthrough a continuum level density. Our analysis shows that the discrete particle unstable stateshave to be explicitly included with their correct statistical weight, because they dominate the lastevaporation step of light fragments.
From the experimental point of view, it is important to stress that the reconstruction of excitedyields is only partial and some efforts should be made in the future to improve the situation.
The first is to improve the detector granularity so that more resonant states can be observed inthe correlation functions. Our group is presently upgrading the set-up in this direction.
Moreover, a more abundant statistics is clearly needed for this exclusive analysis. In particular,since one would follow the evolution of the decay with increasing source excitation energy (i.e.the impact parameter), it is important to collect sufficient statistics to allow correlation functionsanalysis for bins of inelasticity.
In addition the analyses presented in this paper and those of Ref. [16] have to be performedfor reactions where systematically the isospin of the emitting source is varied, by changing thecombination of projectile and targets.
Finally, neutron detection would also be highly desirable to precisely trigger on the N/Z ofthe source and have a more quantitative control on isotopic effects on the last step of the de-excitation chain. However the branching ratios of the different decays for particle unstable levelsof light fragments are typically experimentally known, or can be calculated through Hauser–Feshbach calculations. As we have explained, a sufficiently complete measurement of a givenisotope through correlation functions can then allow to get also some quantitative informationon the population of n-decaying levels. Alternatively this information can be deduced from themodels if these latter are sufficiently constrained.
This will in the long run not only allow us to understand the origin of odd–even effects, butalso to reconstruct primary fragments and thus access the thermodynamic information at the timeof fragment formation, that is the temperature dependence of pairing and symmetry energy.
Acknowledgements
The authors are indebted to R. Cavaletti, L. Costa and A. Paolucci for the technical supportduring the experiment, M. Loriggiola for preparing the targets and M. Ottanelli for having real-ized the target-holder control system.
The authors also wish to thank the accelerator staff of the Tandem–Alpi complex of LNL(Laboratori Nazionali di Legnaro) for having provided high quality beams. The authors alsowish to thank the LNL Program Advisory Committee, for the strong encouragement to completeour analyses.
One of the authors (Ad.R.R.) gratefully acknowledges the kind hospitality of INFN, Sezionedi Bologna, where the work was partially done.
This work was supported in part by grants of Alma Mater Studiorum (Bologna University).

JID:NUPHA AID:19152 /FLA [m1+; v 1.137; Prn:9/01/2012; 10:06] P.21 (1-21)
M. D’Agostino et al. / Nuclear Physics A ••• (••••) •••–••• 21
References
[1] L.B. Yang, et al., Phys. Rev. C 60 (1999) 041602, and references quoted therein.[2] M.V. Ricciardi, et al., Nucl. Phys. A 733 (2004) 299, arXiv:1007.0386v1.[3] G. Cardella, Limiting Collaboration, private communication;
I. Lombardo, et al., Int. J. Mod. Phys. E 20 (2011) 1066;I. Lombardo, et al., Phys. Rev. C 84 (2011) 024613.
[4] E. Bonnet, J.P. Wieleczko, et al., Int. J. Mod. Phys. E 17 (2009) 2359;G. Ademard, et al., Phys. Rev. C 83 (2011) 054619.
[5] E. Geraci, et al., Nucl. Phys. A 732 (2004) 173.[6] A. Schiller, et al., Phys. Rev. C 63 (2001) 021306(R).[7] N. Chamel, et al., Phys. Rev. C 81 (2010) 045804.[8] A. Fantina, et al., Phys. Lett. B 676 (2009) 140.[9] M. Colonna, F. Matera, Phys. Rev. C 71 (2005) 064605.
[10] S. Wuenschel, et al., Phys. Rev. C 79 (2009) 061602(R).[11] Ad.R. Raduta, F. Gulminelli, Phys. Rev. C 75 (2007) 044605.[12] R.J. Charity, et al., Phys. Rev. C 63 (2001) 024611.[13] C. Dorso, et al., arXiv:1105.0050v1.[14] A. Ono, AIP Conf. Proc. 884 (2007) 292.[15] J. Su, F. Zhang, B. Bian, Phys. Rev. C 83 (2011) 014608.[16] M. D’Agostino, et al., Nucl. Phys. A 861 (2011) 47.[17] F. Gramegna, et al., Nucl. Instr. Meth. A 389 (1997) 474;
IEEE Nucl. Science Symposium, Rome, 16–22 October 2004.[18] A. Moroni, et al., Nucl. Instr. Meth. A 556 (2006) 516.[19] J. Cugnon, D. L’Hote, Nucl. Phys. A 397 (1983) 519.[20] N. Marie, et al., Phys. Lett. B 391 (1997) 15.[21] M. D’Agostino, et al., Phys. Lett. B 368 (1996) 259.[22] R.J. Charity, Phys. Rev. C 82 (2010) 014610.[23] F. Gulminelli, D. Durand, Nucl. Phys. A 615 (1997) 117.[24] http://www.nndc.bnl.gov/nudat2/.[25] R. Hanbury Brown, R.Q. Twiss, Philos. Mag. 45 (1954) 663;
R. Hanbury Brown, R.Q. Twiss, Nature (London) 177 (1956) 27;R. Hanbury Brown, R.Q. Twiss, Nature (London) 178 (1956) 1046.
[26] D.H. Boal, C.K. Gelbke, B.K. Jennings, Rev. Mod. Phys. 62 (1990) 553.[27] M.A. Lisa, et al., Ann. Rev. Nucl. Part. Sci. 55 (2005) 337.[28] V. Henzl, et al., arXiv:1108.2552v1, and references therein.[29] J. Lecouey, et al., Phys. Lett. B 672 (2009) 6.[30] R. Trockel, et al., Phys. Rev. Lett. 59 (1987) 2844.[31] O. Shapiro, D.H.E. Gross, Nucl. Phys. A 573 (1994) 143.[32] J. Pochodzalla, et al., Phys. Rev. C 35 (1987) 1695.[33] T.K. Nayak, et al., Phys. Rev. C 45 (1992) 132.[34] W.P. Tan, et al., Phys. Rev. C 69 (2004) 061304(R).[35] M. Assenard, INDRA Collaboration, SUBATECH 97-15, LPPC97-11.[36] J.P. Bondorf, A.S. Botvina, A.S. Iljinov, I.N. Mishustin, K. Sneppen, Phys. Rep. 257 (1995) 133.[37] J. Toke, W.J. Swiatecki, Nucl. Phys. A 372 (1981) 141.[38] A.V. Voinov, et al., Phys. Rev. C 76 (2007) 044602.[39] Y. Alhassid, G.F. Bertsch, L. Fang, Phys. Rev. C 68 (2003) 044322.