towards a settlement structure for kerala, part iii
TRANSCRIPT

University of Nebraska - Lincoln University of Nebraska - Lincoln
DigitalCommons@University of Nebraska - Lincoln DigitalCommons@University of Nebraska - Lincoln
Community and Regional Planning Program: Faculty Scholarly and Creative Activity Community and Regional Planning Program
8-1967
Towards a Settlement Structure for Kerala, Part III Towards a Settlement Structure for Kerala, Part III
A. M. Salim School of Planning and Architecture, New Delhi
K. G. Nadarajan School of Planning and Architecture, New Delhi
Nirmal Brito Mutunayagam University of Nebraska-Lincoln, [email protected]
Follow this and additional works at: https://digitalcommons.unl.edu/arch_crp_facultyschol
Part of the Urban, Community and Regional Planning Commons
Salim, A. M.; Nadarajan, K. G.; and Mutunayagam, Nirmal Brito, "Towards a Settlement Structure for Kerala, Part III" (1967). Community and Regional Planning Program: Faculty Scholarly and Creative Activity. 13. https://digitalcommons.unl.edu/arch_crp_facultyschol/13
This Article is brought to you for free and open access by the Community and Regional Planning Program at DigitalCommons@University of Nebraska - Lincoln. It has been accepted for inclusion in Community and Regional Planning Program: Faculty Scholarly and Creative Activity by an authorized administrator of DigitalCommons@University of Nebraska - Lincoln.

PAR T - III.
TOWARDS A SETtLEMENT STRUCTURE FOR K~RALA.
C HAP T E R - XIV. a
SU':\fM!\PY OF FINDD1GS AND OBSERv.I'fIONS, AND
AND CONCLUSIO.rS DRAWN FOR PLANNING PURPOSES.
14.1 The summary of findinvs and observ~tions
drawn be re are b'l.sed on the studies oondu<:"'ted In
the earlier Chapters. An attempt is made in this
Chapter to relate all the studies and inter-knit
a fairly good matrix tor future guidance tn planning
the set t.leant struoture of Kerala. Some of the
conclusions drawn here are based on field observ-
ations and qualitative as well as quantiati_
aspects are brought out in ditter~nt contexts.
L~ND AND RESOURCES:
14.2 (1) Keralai. a distinct entity bounded
on the east bv the western ghats and on the west
by Arabian-sen.
(2) The area of the State i. 15003 squa.re miles
and the width varies from 7 miles in the north and
south to 15 ailes at the Centre. The coast 11ne
extends over 360 miles.
(3) The St;\ te oan be' di vi,ed into t.hree natural
divisioDJI; the low V-lIl(lfi constitute 10.131 of the.
area and a popul~tion density of 2,946 persons per
square lIile, the midLand with 4i.21% ot the area
and a popul:ition density of 1,633 pe rsona pc r nq.
mile. and the highland with 48.66~ of the area ilnd
a population density of 319 persons per square mile.
(4) The low lands have alluvial sotl, the
midlands latri tic soil and the hip:hlani's are covered
with forest soil. This reflects on the crop pattern
of coconuts and palldy in the low ltn(\8, cash crops
and pnddy 1n the hi,p lands, which again is a
re tson for the differential distribution of the
population.
(5) The area oan be administratively and caltur-
alty divided into three entitles, the Tr~vqncore
area, the eoohin area and the Kozh1kone area, eR,oh
h'"ving a major oity on the sea COtlst, - vIz.
Trlvandrull, Ernakulam and CaBout.
(6 ) The 8t'ite get s the S.W. & N.E. lion soan
rainfa ~ 1. and thiS 0' aooounts fa r the Ius} grovth
of vaget ttion. The temperature vllries from 10°,
to 80°, exoept 1n the hl"hlands where It is 30°,
to 60°,.
~
(1 ) The entire lan~ Is divided by rivers
running e~st to west ~nd the low lano is still cut
into pieces by a number ot bac.kwatera and lak(~s,
neoe .sl tll.tin, the population in the low land to
ooncentr:lte in the available RIllce, of oourfle within
the already exi at In~ soat te 1"'. •
(8) 21.35~ ot the ar~'~'l ot Kerala is under the
to rests and estates on the e1st,lnd they restrict
the tonaation ot BettIel8ents in thlt are"ts, except
for the Pal.?h'l.t gap whioh is 'inhabi te<1.
(9) The lonl ... west CO"lst of 360 mih~s is sub-
jected to sea erosion, except tor the 24 miles
ne ar Cannano re wh i chi s rocky.
(10) The net area 80wn is 53.5~ of the total
11 re!'l , and the percenta~e ot fallow 1].n,1 Is only
O.8~. The total oropped area Is 66.2~ which again
reflects the reasoning th<lt extensive cultivatioD
is an lmprobabilty In Kerals.
(11) The oultivation is mostly l'D~trket oriented ,.'
and this necessitates a good tr&nsportatlon net
worl~ •
(1a) Even tho,t,.h lan(l produotivlty is high
(1105 lbs: ot rioe p('.r aore of land) the re Is

a gap of 50~ in food production.
(i3) The superiority of Kerf\Ia's cropping. pat'tern
owes allegience to the large number of high yielding
plant:'ttion orops' l~ke tea. oOffee, rub'be!-, pepper,
Ca rd8110 II, ginger, cooon ,tt, arecanut. oa..hew nut,
etc.
(i4) 15' of Kerala's torests are loca •• d in
Kottayam, Trich ,r. Quilin and 'Kozhikode, thereby
diminishin" the land that can be P'lt to habitable .; L -; ~ ~ : ~
uses. This ret.leOts on the size of settlellients
and the struct:ue.,.of setlle'ilents in these are'l8,
(15 ). 5~ 0 f the paddy produotion of the St:lte
is con oentr*'ed in the eli striota ot Pal fYhat f 'rrichur
&: lCozbikorle • This conolusively proves that the
distribution system will ~et itselt oriented more
towards the Caliout Town which bas ahown entrepre-
neurahip in trade and oommeroe to r the region.
(1.6) 1f)~ of the tea production oomes trom Kottayam
distriot. The rubber plr:'!.nt~t ions are also 110 ~ly
ooncentrated' In this disetrict. Hence, even though
the max.iaua width of Keralais 15 ailes, at this
seotion, the forest. and estates occupy nearly 55

ailes width, le~ving wide a cross country distance
of 20 miles to Em~kulam oity.
(17) Out 01 a tot'll hydel power potential ()f I
2.50 1I1llon ktlowatts. at 60" load "lo.or only
25" of the power potential has been exploited.
Tbe power in Ker~lla oosts only 1.7 ps. per K.W.ll. of
productidn. and is one of the oheapest in 1nf11a.
(18) Tbe tail race of the rivers are subjected
to snliie intrusion s from the wea. This has
ne 08 ssi t'l ted the oonsttuot ion 0 f dyJ{e s in the
Kuttanad area ne'lr Alleppey, - tbe' grau~lI'Y of
Kerala.
(i9) Thet" r1 ve T'S provide an exce Ilent RyA 1, ell
of water transport as an inter-link'lve betwnen
settlemen t s.
(20) Only 15% of the irrigat ion ,potenti'~18 of
the rivers h,\ve been tapped. But it lIa\' be seen
tbtt the wggedne ss of the midland m::ikes it ext reme ly
costly to provide irri.r~ti,m faoilities in some
areas.
(21) On an aver 'ge the reven!.1e troll forests in
Ke ral Ii 1 s 1ls.10/- per aore and ttl is cont ributes the
_jor eoono.y ot ICe rala.
(22) The torests, _ , protect' the mldb.nd and
the lOW 1,1l'lda tro • • 011 eroston, ,l.Dd to a lnrg.
extent their removal In no W:"ly i8 lldvo f'! lted. ;'\lso
they are oontro lIin,,- the macl'o-clll1 \te of the !1Itate
to a oetain extent.
(23) The wood trom the forests is floated In
the" rive ra, ,tod thi s has an advant tg,e 0 t h uVinl
a oont 1ntou8 at retob Of settlement. al.lng the
rivera.
(2.) Abo*t 15~ ot the rorest area 1s with private
pl.rtlea. The lar,e extent ot forests with tho
state lI'1kes it an econOlllcal fe!lalbl11ty for
scientifio tltl11satil)n. There Is not any scope
for extenston ot forest ••
(25) '!'be fishery 1"8 SOllro.s of Ke r~la consi st
ot inland and marine fish. A numher of oonrlo
'm18erlted fishing villa, •• nre to'lnd :lll along the
sen~. ooast.
(26) The yield of 'fish trom sea today is only
1/1 to 1/10 of q possible exploit~ble stook ;nd
the Are,,- UDf'er fishing la only 1/12 of the potent j, a1
•

area. This reSOtll'"oe hCl.S to be uti J ised in a more
soientifio m~nner.
(21) Thele are a number of landing bays, tlshin~
harbo:t r8, eto. along the oonst line.
/
(28) The State lacks in basic .ioeral resources
to r industrialisation, except for the mineral
snnds along the beach, especially between Chavarn
and Kayani ~tl tam. But clay i. found 1s abundance I
in different part. of the State. Also Itme-stone
is available in the bottom of the backwate rat
especially in the Vembanad lake.
(29) The landscape and the topographic fe~ture8
are potential resources of Kemla for Tourism.
14.3 PEOPlE AND ACTIVITIES:
(1) The population of Kerala i8 169.03 lakhs
in 1961 with anannual growth of 2.4 peroent. Kerala
ocoupies 1.22 ~ of the area of India and accommodates
3.85~ of her population • •
(2 ) The overall population density is 1i21 penons
per square mile.
(3) The' per capita oultlvahleland in Xerala
is only 0.35 acres.

(4) The midland .... ha. the largest pOt)ul:1.t10n,
but the low land has the highest dens1ty. This
i;:t so mainly due to the popul at ion concentr it ions
in the major urban oenL res along the OO:lst 11ne.
(5) The sex ratio 1s 1022 temales p:'r 10:,)()
males, the low lands having the highest sex r ttio
since the lone migrat10n bas been from the low
land tothe a1dland and then to the highlands.
(6) The age structure of Kerala revea.ls th It
41 ~ of tbe po Jmlation Is be low the age of 14 and
53.5~ is between t'lie age groups of 15 .. 59. This
ShOlfS the base heavy physanied which eXi sts in
K'rala.
(7) The literacy in Ker~la is 46.85~ - 51.97~
'n the case of males and 38.9~ in the case of
females. The popul ation in the lowland has the
. highest literacy with 50.87~. Next comes the
mid-land with 46.77~ and the higb land with 39.47".
82.3" of the literatee live in rural areas and
i7.7" live in urban areas. The high liter1cy will
aooouut for a superior variety of man power.·

(8) 92~ of the population speak Malayalnm
and 40~ of them oan understand English.
(9) There are three distinct Coste groupings
in Ker'l.la; the lIindus, mixed with all cnst(~s, but
predollin:ltlng in South Kerrlla, the Christ1.nl'ls
pre dollio at ing Central Ke}8 la wh •• e most 0 f the
plantations are situated, and the Mus limB predomi-
n~ting the Malabar scene. where busines~ is conce-
ntrated.
.. (iO) The propo,..' 'ion of Binda. is Cf:.a lly
distrib;.ted in urban and rural areas, "hile Christi'ms
are in rural areas in higher pro po rtions and
Muslims are in urban areas, JIkt in higher proportions.
This partly reveals the predolltnance of Chri8tians
in plant.lt ion ero pping t and oash oro pping. The
Muslims are in the bllsine8s and se !'Vioe fie los
IDO Rtly. whi Ie the Hind1l8 are .distributed equtlily
in all seotors.
(ii) The mortality rate i8 decrea8ing very
fast and the birth rate i8 increasing. resulting
in a population explosion.
(i2) The migration outside Kerala h'ls been
of the 0 rdcr of 2.3" ot the total popilLltion.
(13) The nllllber 01 dweillngs In rural n.reas
are Inoret'tsing at a taster rate than those In urban
areas. Also the number of p':rsons hou~eh ,lel 1s
about 6.
(14.) 84 .89~ of the popul'ltton Uve in ru:ral
anns and 15,11% of the population in: urb;~:n :1reas.
But the rate of growth 0 r urban pop!lla lion in th
lnst deoade has been 60.52%.
(uS) The pro:x:lml ty of p~pulat10n in rural
areas CODles to 55.11.~ and the per capita !Ire"") of
land ls 0.65 aores.
(16) 15.54~ 01 the population living in
"Vllia ge 8" (ru ral ar~ as) hAve a po pu l·:tt i on of 5000
and above.
(11) Ot the urban popul ation or 15.11", 1 .44."
of total population of 'Cera la Hre ooncent rllted in
towns of Classes II r and to VI· - i.e. sml'd.l towns
whioh are 1I0J"S or 91m111r to a rural areas in Kerals,
except for the urban activities in the core of urban
area. Only 5.39~ of the total popul'ltion is in
Class I towns and 1.14." ls In Class II fow·ns.

,
(18) Tbe taluks which. have recorded a higher
rate ot 1norease in po pul atioD than that of the
stat.e B.". either in north lCerala (receiving migrate'
people in 1 ts rural a reas in large nUllbe rs) or in
the south (acoullUla.ting pettple tor adainistrttion.
tun ct iODS ) •
(19) 16 •• " of the rural popl11 ltion al'e oon-
migrants. the rest being mip.r)luts ill 1 ;)61.
(ao) The highest proportion of rural to rural
l'lig:rfltion is 1n KottaYAII district - tor plantHtion
labour. • •• ~ ot the rural inhabitants are inter
distriot migrants on. an avert.,e. Tbe new settlern"nts
in North fl'Id 8011th "pnad Ttiluks and the development
of plant tltions 1n Kottayana district _ have absorbed
the bulk ot their m1gr: t tion. a/a of the migrants
from ~ldrRs are concentrated in Kottayam district.
(2J) Urban to ·rural mif.rat,ion wa.s also noted
in 1961, because of the 16-c::k of eaployment chan~;Js
1n tile urban areas. 13.8~ of the urban popul;lt1on
are non.migrants. This shows that the movement of
people troll urban to rural areas and rurnl to rural
areas are not that pre@lTlin;lnt 1n difterenti tion.
But urban artF1S at Erll'lkulam district has the l1.rgest
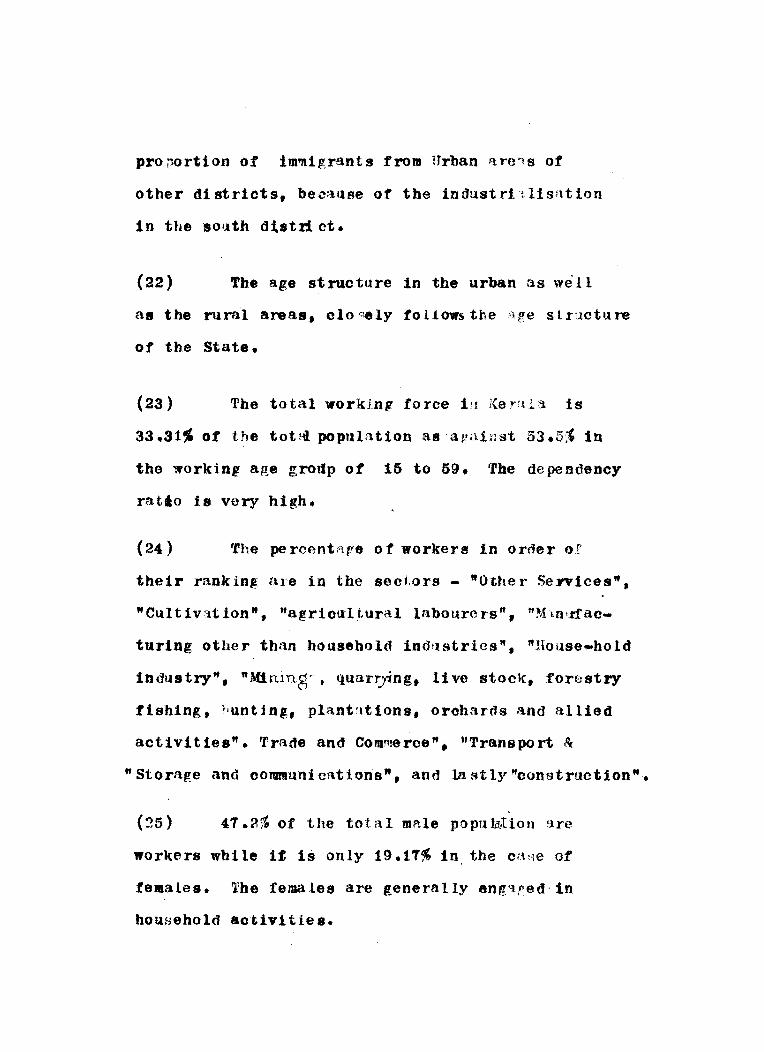
proiJOrtion of im"lligrants from Urban Ilrc"lS of
other districts, bec:ll1se of the indust.ri'tllsation
1n the loath dj.stri ct.
(22) The age at ruc tu re 1n the urban as we 11
as the rural areas, olosely foUOWsthe 'ige structure
of the State.
(23) The total workin, force ill l(eY~ll,'l is
33 .31~ of the tOtfil. popnlation as a#ai~1st 53 .5~ 1n
the workin~ age grodp of 15 to 59. Tbe dependency
ratio is very high.
(24) The peroentape of workers in order or
their ranking llre in the sectors - "Other Se:rVices".
"CuI t IV1.t ion". ftagriotllt,ural laboure rs", "M.n,1'!ac
turing other tban household ind!tstrics". "House-hold
industry" f "Mining', quarrying, 11 ve stock, forestry
fishing. hunt j ng, pla,nt~ltions. orchards and allied
activities". Trade and COlD'1lOrOe", tlTransport '\
"Storage and oommuni cations", and ].a stly "oonstruction".
(25) 47 .2~ of the total lInle popula:Hon ';lre
workers while l' 1s only 19.1T~ tn, the oase of
female 8. 'llbe lema les are generally ang'i.red' in
household aotivities.

(26) Cannanme, Palghnt, Kottay~m. Allepney.
(lullon ann Triv~lndrl1l'll districts hne the "{ !"hest
percent"t'e of male wo rkers in the prinn ry sector.
Except Alleppey, Quilon ftnd 'l'rlvandrum distriots.
all oth~r ~istrict8 b'1.ve thehighest per~'I.~nt "[fe at
female "0 rkera in prhnry sector.'
(27) Kozhikode t Triohur and Bma \.l!alll have
the highest peroent' ge ot worke:rs in the terti i1 ry
sector; most ly beoause of "'Trade and COlll':'lerce"
nnd"otLer Services".
(28) In the oaso ot the 'i:eondary sector" the
distribution shows that Alleppey (Cotr). Qutlon
(Ca.llllew) ;lod 'l'rivandru. (textiles) districts have
the highest peroentap.e ot workors 1n secono")r;y
sector.
(:?9) But in all. these CRses it ca.n be noted
tl, t the oti'er (]ist,-lcts tollow suit very closely~
Thus we h;l.ve 47% of tbe w.)rJ.cill~ fo Tce enr"! red in
pri~ayY sector and t9.3~ and 33 .7~ 1n second'lry
and terti fry seeton:; respectively.
(ao) But in all these ca.~es it e:tn he noted
that the other districts tollow S tit very closely.

Thus we have 4T~ of the working tOTce eng';!ed in
prinaary sector and 19 .3~ and 33 .7~ in 8eoond \ry
Clnd teriti"try sectors I'.Cspeo'tively.
(31) The p;,~r capita income in Keralais only
lfs.23t/- T' Is shou Id not be takcn rts an i!JI~(F of
f)TOSperlty, since the normal Malayalee get.s most
of ~hi9 daily tood needs trom his g'1.rdan, crops,
cash crops and food crops.
(32) The inc rea se of female" workc r in the
tert fa ry sector i 8 rlthe r sl'l.ggl sh.
(33) Develop".,n t'il ~otivit:i~s are moving into
the remotest rural fl~as also, and henoe there h;l.s
been a. very sharp inore!'tse of workers in the t·rtiary
sector.
14.4 THE EVOUJTION OF THE SETTLE'{EWf' PA ,rf'EI~N
(1) The land of Keralawas reclaillcd i'rom the
sea by some If\ tl1!"'al toroes.
(2) The dl~trlbutJun of land among the nobles
anfl Chicftain s by rulers of Kerala led to the
8c 1 tterin, of sottlem0nts.
(3) The til Ie r8 owned the land in the 6irly
stnres, but latf'r on, a.shltt1ng of the land to the
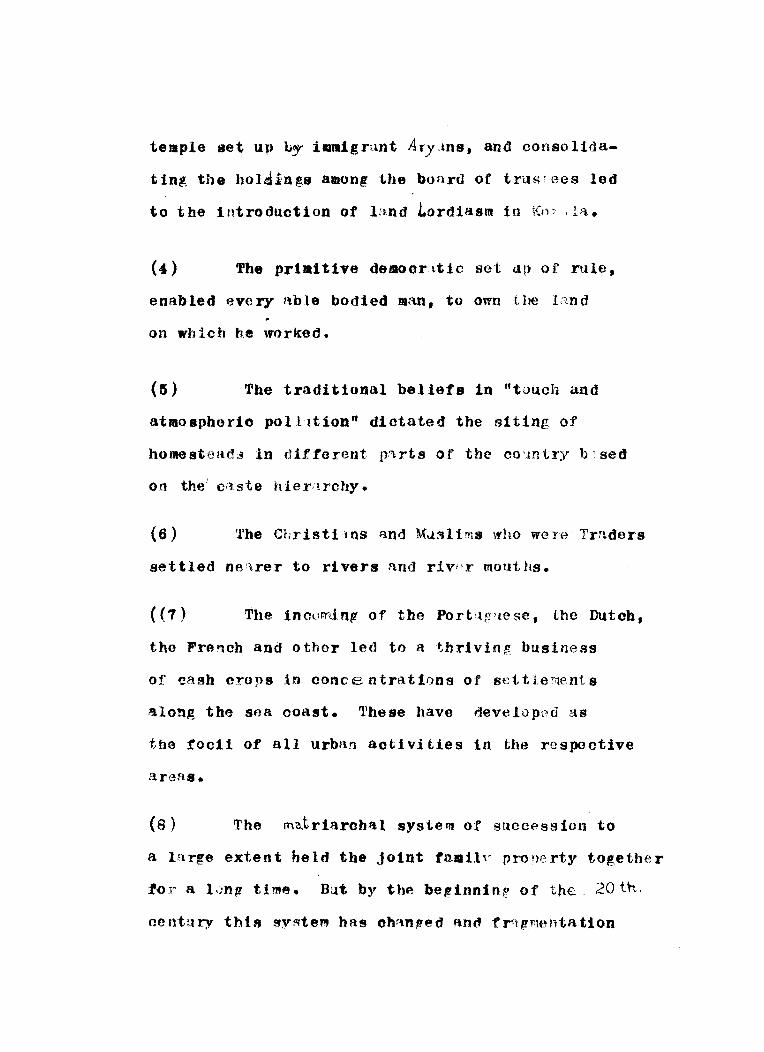
temple set up by illllaigrant Ary,tns. and consolida
ting the holdilngs among the board of trus tees led
to the introduction of land L.ordiasm in Kn: ,1,'1.
(.) Tbe primitive demoorl.tic set u.p of rule,
enabled eve ry able bodied ma.n. to own t he Lind
on which he worked.
(5) The traditional beliefs in "touch and
atmospherio pollItloD" diotate'.! the siting of
homestead;5l in different p1.rts of the co'mtry h'sed
on the i c,lste hie r;lrchy.
(6) fl'be elirist! lOS and Mol:'91ims who warp Traders
settled nen.rer to rivers and riv"T mOllths.
({7) The inoomin, of the Port!1p-"18Se, the Dutoh,
the Frenoh and other led to a thriving business
of cash cro!JS in concentrations of settlef!lents
along the sea coast. These have developed as
the tocii of all urban activities in the respective
areOS.
(8) The ma.triarch'll system of succflssion to
a large extent held the joint tD.1I11v pron('rty togeth{~r
for a I,JnIl time. Bilt by the beginninr of the 20 tho
century this s:v~te", bas oh::tn~ed flnd fr~l'~tentation
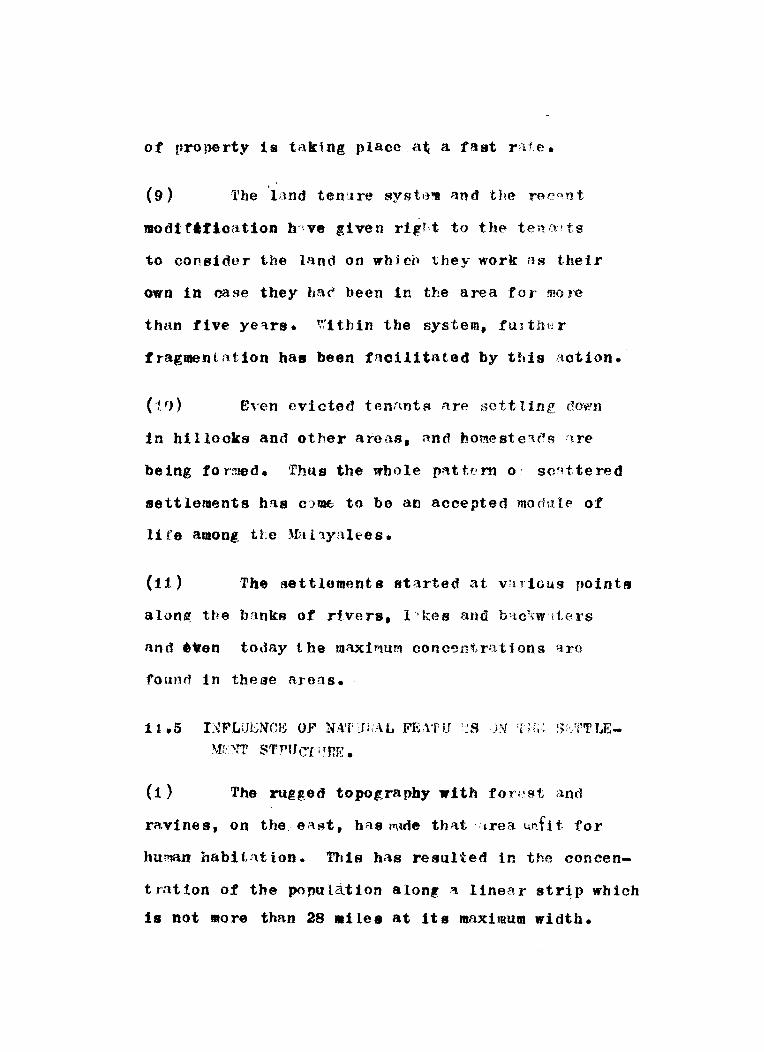
of property is taking placca1( a fast rat,e.
(9) The Innd ten', re system an d the recf'l'1 t
l'Iod1f'tication h'lve given rigTt to th~ tenn:'lS
to oonsider the land on wbjc~ they work Bs their
own in oa~e they ha(' been in the area for mOl'e
than five yeqrs. ~lthln the system, fUJthcr
fraglllentation has been fllol1itated by this aotion.
(1.1)) EYen evioted tennntR Ilre- settling: do·"vn
in hillooks anl' other a.reas, and homeste1.(~s'tre
being to rmed. 'rhus the wbole pat t(· rn o· SC~lt te red
settlements bas CODKt to be all aooepted module of
life among ttc ~fu11yalees.
(11) The settlollonts started at v'Hious points
along the banks of rf.vers, l'kes and l):ic\:wd,(~rs
and even today the maxil>1urn conc")n~; r~1 t ion S 'Iro
found In these areas.
1 t.5 I~-1FLUENr,g OF NA'l' JiAL FK\'fU '~S )1'1 ,/:;1,: S>:'CTf.JE
\fL'lT ~TPUCT;mE.
(1) The rugged topography with for"st. ilnd
rH.vines, on the.ei-\st, has I'lllde thl\tirea. \.In.f1 t for
human babi tat ion. This has resulted in the concen-
t ration of the population alon@: a linear str~p which
1. not more than 28 miles at its maximum width.

(2) ,{'he hi~h der:r~e of aC0essibi U t" of the
constal belt (with waterway, railways a'lri l'o,Q]ways)
resl.lltef"f in 26.4-8" of the popul"1tion beinr"ccorlllDO-
dated in this strip. The major urba.n oentr;.;s have
developed in t1\ ~s section of the co un try.
(3) lhe midl~nd accounts for 48.66% of the
poPtll 1tion S11100 the area 6s mo,-e th-1.n th t of
the CO;lstJ:t.l belt, and the land can t.'e suLjected
to the edt1 vation of hiph t1",1<'!ing cash cr.ps.
Also the low?r *idlqn~s h~ve the same accessibility
as the Coastal belt. Hirhl'T up, the popal ':tion
gets itself distributed to a 8p~rse popul~tion in
the high ranp.es.
(4) The pushing back of the popu tut ion in
linear levels necessitated the intrOduction of
movement. 'fhe C\TOSS roads which were (if1ded, ,Illd
the rivers, divided the whole could,rv in sepmerlts
or a grid, the hotMIeteads bein~ 8tu~4ld in hetween.
Df (5) Out/92 towas j.n Kerala, 47 --(It'e aI,tng
0,0 se I. cO;'ust or nearer to i t,:!2 of these being
m·dor -towns. The only excent10n is ne~r the P(,lp,h~t
(6) Max1'f1UII ut1lisat10Dtt of ttle Iflnd 1s possible
in the roast land an'! midland, where the 110l1.e8

can be san.dwiched botweem tj'tres, ano this
tAciliated the sc~tterlng ot settlements, ~nd
h1,ber r'lensiti.t.es of populntlon in ti e fire's.
(7) The faot wti-ll remains t1:nt lhe M~layalee
prefers the privloy of his own fanGed COI11;)ouno at a
rlistance troll*'t his neighbour'. hOil Ie. :1"8 ,'ensi ty
of trees and otber garden crops render8~-f' each
hOllse invisible troll tbe next.
(8) Row ho ISBS are r,·.rely fo;md,'n· tIl t to
only in loc>'lit.ies were the Tamll Jlrl'lbmins live. _ Ii", r .. o.l!Y
The "tInt system" of housing io/noR':!xi t'H~t in
KeTala.
(9) Soc i a lly no Malayalee wi Ii sub-Ie this
l"Csi<':ence to another family. With n the family,
sh~r1n, the acoommoctatlon is au accept~d mod~le , '"
of life.
(10) The entrepreneurship is fo'~nd mostly in
the ooastal bel·t beciluse ot certain lIa.1 01" social
and politioal pulls anrl historical accirteats.
(12) The !JIovement ch!}~nels on Innl~ ~"er~
usually sited on b1rher grollnd, with the homestl;!a(]
slonin~ towrds the valley (pa'dy 'field).
(13) 'jlhe lvail"lbility ot brackish w'Hcrfor
retting husks in the backwaters, initi~ted the cotr

industry, whioh in tum brought in its ,,'ake higher
concent rat Ions of poltllat ion a1 ')0 I! the coasts of the
back wa.ters.
14. The coast line which is the base for fishing
of Kerala, ini t tated the faster growth of urban and
rural settlements In this belt. Cochin port has been
the fOCUS of most of the activities in a large hinter-
land.
16. The sea co~st is subject to sea erosion ~long
its entire length, but for the 24 miles near Cannanore. \
The nuoleated settlements of the fisher fdk are affected
by this oalamity.
16. Nucleated settlements are found in project
sites (hydro electric and irrigation scehemes) and 1n
major plantations. 'fhese are mainly ,,,n the eastern
part of Keral". Usually a linear development along the
access routes, conneots such sett lements with the
other areas, un less the set tiement is deep tn the forest.
17. Since the surface utilisation and crop pattern
ha<o been stabill(~ed through oenturies of triiiI''l.nd
error, the tOl'1latilm of sett lements too are restricted
within theinnabiterl area. Even then Keralt is short
of 50'-'{, of her foor! requirements.

14.6 'l'lIE URBAN SE'l'T LEMENT STRUCTUHE.
1. Kerala' s urb"tnisa tio n is peculi:i r in the
se~'i3e th.'t t th., collection of prod:lce of the hinterl:'tnd,
along with the .'1'm1ni strnt ive'lctivi ties slowly chanred
the f:lce of the villago by ch'lnpe in occupiltic10Cll str!tcture t
eil;l?ci~lLy tOW':lrds the terti'lry sector of aetivities.
2. OWillf. to the scattere(l nature of the settle
ment St it W'1S necessary to hlve collect!')n contre s at
~ to 3 miles from thssettloments (homesteads).
3. 'rhe better connected andlarger urbfln centres
ch:lnred i ts (~har;l.cter 1ind in slow stapes they acc:lmul 1 tec1
the reqitirements of the hinterland in terms of services
and facilities. 'l'hese semi-nucleations of non-residenti'll
units are called "Pural urban knots".
4. The percentage of urban lJO',ulation in Keral.
in 1961 was 15.11 of the total pOJulatiun. Theaverage
urban pOpul'ltion density wa.s 5,919 persons f) r square
m11e.
5. A stntus classifie;'ltion uf towns in Kepl1a
brinps theul under • Muriol Ital COrpOTl1.ti. .nB or to ""ns,
c:1ntonmt'nt s ;mrl non-Muniei :):\1 towns.
6. Thet.e \Vele 92 towns in Keral:l in 1:)61. Of
tlH~ se 4- arc c lass I c1 tie s, - nIl be ing "llong tho sea
coast, - I are class II towns - on ty ~ are in the mi,nrmd
rinrlone in the highlan~' - 31 are el'1ss III towns, :3,'3 nre

olass IV towns, 18 'll"8 class V towns a 00 one is a
class VI town. • Class III towns hrtve risen from 12 in
1951 to 31 in 1961. This shows the rlistribution of
services ::\n(l facilities ane! the evolution of tertialY
sector activities that are taking plaee in Keral.':! at ..
different f)()ints.
7. A functional olassification of the town reve;11s
that 1.09% of the total number of towns come unoer tra·:e
:'lnti commeroe, 40.221 unclor ntanufactilring, 2.17~ un{~er
transport and c:Dmmtnication. :'Utel 56.52% under other
services. Some of these towns have other important
functions:. also. For example, IJ.<'lrt of ~'>:riltingrton Island, a
thou~h classified fl43 a service town, is/port town.
8. Continuity of urban oharllcteristif!s, possibility
of satisfactory COT!1''lutat ion, ,mel economic inter-oependence
Of functiuns helped in aIrivinr at cert'\ln l!,roU;iS of
to'cns, a 11 'llong the sea CO:lst at 'I'rlvnndrulU, Ernakul"lm,
Calicut :-\nff Cannanore. The constituent units under these
grour)s have two or more functions to perform. These town
groups develop into a complex organism with lBututal
dependent units.
9. Urban clusters were found at Cannanore(formed of
10 to\ms)t Kozhikode (7 towns), Ernakulam(4 towns) and
Triv'l.ndrull (6 towns). This indicates I!rowing urbnni-I
sation '1.lon#! the low land.

10. Such olusters were tounn at reasonable proxim1ty
in Cannanore (with two olu~ters of 10 town~ and 2 towns),
i.n Kozhikode (3 olusters to form 11 towns), Ern~tkalHII
{one cluster of 7 towns} :10(; J'rivQndruJn (on€' cluster
of '1 and t.he 0 t.he r of 3). If a ring, is thrown yound
each 01 aste r the ring would touch, each 0 Lbe r formin:: f\~"Y",
eitller an elong~ted/8 or similar fi~.ure.
11. 49.4% of the urblln populfltion is in these four
conurbat ion coaplexes. In Cann~Ulore cluster, the highest
conoent rat io n is of class t II towns, nbile fo r Kozhikode
Ernakulnm anfl 'frivan<'lrum oomplexes, the hlrhest
concentration is in class I only.
1 ,) .... In the la!3t (hCai~e the gro'wth of arban pop u. lilt ion
has heen 60.53%. Pfl1ghat :lnl1 I(ottayalll distriots
regi ster(~d a fall in urbanislttion - the for'oor being a
rice producing centre nn!l the latter a lJla,jor cash crop
13. Class I tOims are increasint! stea(iily in popul!ltion.
while cl;'\ss II towns have (leolined in pOO'lla:t10n growth,
wl~ile class III towns have a hi~h .. r rate of growth
both in poplJlltion size and nambel'. Class IV "1Od V towns
. have shwwn fluotuations in Po pill ation growth. Henoe it
ls class III & IV towns whicb are going to show
differences in po ptllation growth in the COIling decades.
14. '{'he functional clnss!ticl1tion of town:' '1nd their
t!.-GWth show th'lt the popul!1tion in service towns are
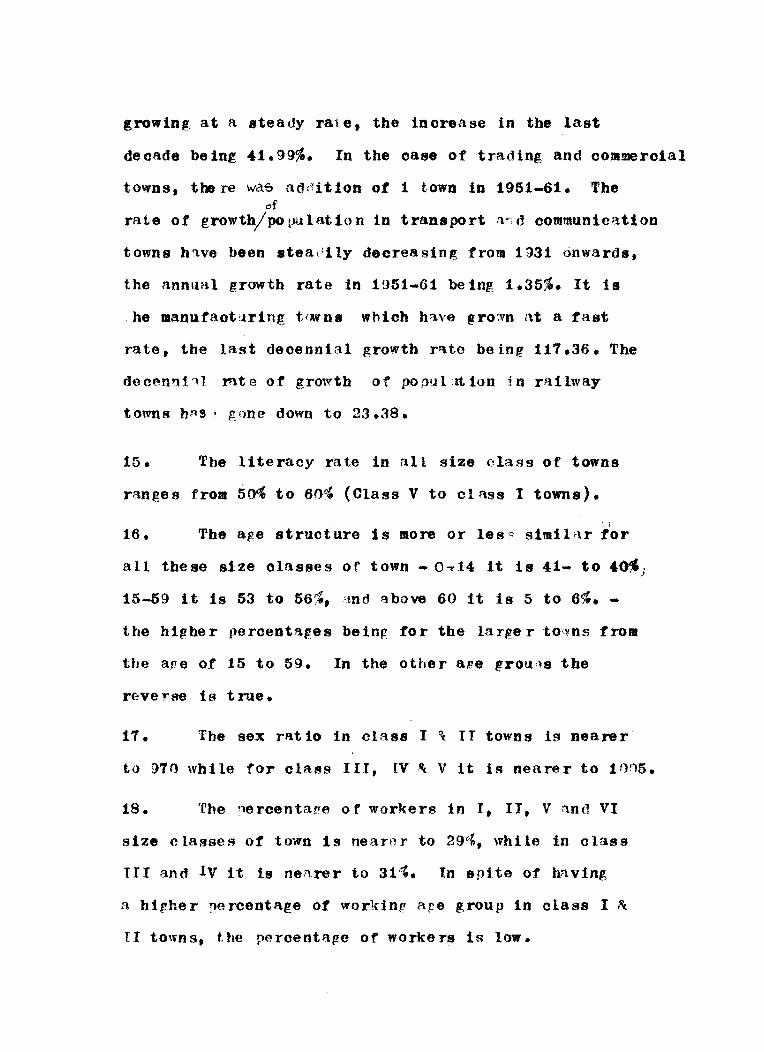
growing at a steady rate, the increase in the last
deoade being 41.99~. In the case of trading and commercial
towns, the re wa-o addition of 1 town in 1951-61. The of
rate of growth/pot)l..llation in transport :V',(j oommunication
towns h~ve been steal1ily deoreasing from 1931 onwards,
the annua.l growth rate in 1951-61 be ing 1.35~. It Is
he lIanufaotllring towns which bllve gro,vn at a fast
rate, the last deoennial growth rato being 117.36. The
decenn!"l rnte of growth of popul:ttion in rllilway
towns bl'ls . tone down to 23.38.
15. The literacy rate in all size elass of towns
ranges from 5~ to 60{ (Class V to class I towns).
, \
16. The age struoture is more or les:'l sim11;lr for
all these s1ze classes of town - 0.,,:1.4 it is 41- to 4~. )
15-59 It is 53 to 56~~, 'lnd above 60 it is 5 to 6~. -
the hil!her percentages beinl! for the larger to(vns from
the ape ot 15 to 59. In the other ave grou:ls the
reve:rse is true.
17. The sex rat io in class I ~ II towns is nearer
to 970 while for olass III, IV '" V it is nearer to 11)')5.
18. The neroentarre Qf workers in I, II, V llnd VI
size classes Qf town is nearer to 29";, \vhile in class
TIl and IV it is nen.rer to 31'1. In spite of &"l.ving
a hirher neroentage of working are group 1n class I &:
rI towns, the percenta(!e of workers is low.

19. The aver;1.re gross dens ty of po'lUlltion in size
clitss of to,!'n trol'!'l II to VI >lre 1235fJ, 5(1),), 360"), 3550,
4150, persons reT, square lIIi1e rpsnectively;nd in
class r town it is 119!)"). The density of ocml 'ied
l'tHtirtentilll ho'~sfls nr'e 1730, 1910, 750, 550, 550 '~nd
61) for size class of towns from I to VI re:;pectively.
'rhe Ylercentllge of hou~e-holr1~ tC"J the number of hOllsee,
shows thtt 1t v'lries between 102 and 110., 'to the
fiI~ntber of per~ons per housHhold is ne>lrer to G.;!.5 for
a 11 8 i z e c 1'\ 'i se~ 0 f town s •
20. The m;:tximum cOf)centratilll of workers in urbln
areas as :::\ whole is in other services, ina11 classes of
tOt,"ns - v<lryin{l from 32 to 51 :,. Next t.o th isis rlllnut
ncturinp- (7 to 30~)t except in case of class n :, uwns
-+ i ch h Ret r8i'e arll1 conl"e rce (11 to ~(y~) in the second
r:c:nk. Of the fem,'11e worke rs the l::trgest proportion
(26 to 38<)18 in the catepory, householrJ indll stry.
~1. In the urb'\n qreas of the state 62'~ ml1on~
the non-workers are fel1'l!leB. 901 of the total
popul:1ti'1n S"'IeCik "'ll"wa!a/1\ in urban are~s.
?2. The immif- ratlm tv urban ,'l.r,);'\s shows th t.
ErnakuV'l1l district has 30:' \vhilc Kozhiko<e ~lnf' Triv:HHlrum
d1 st riot hilve on Ly'3 •• fl'he Tri Viln 11rull ' 01 ty h'18 11. 7~;~
ot its j'lOl:llatLm 'l~ il1'l'tligratl,)n, \ I laWley Munici"lity
11.5~. Cattetlt Murlicinlltty with 11.t3 'lnd Ern,"Icul m
'.1Ilnici,)llity h'iS 10.6.

23. A study of cities reve \15 tlFtt 70 to 95 % of t! e
develo~ed ~rea of the city is un "er residential cum-
ap:ricultural uses, the other t:lnduses bainr very
meagre, but tor roarls ~nn streets (4 to 7~). The
service s and f~c iIi t ie s in the towns Flre at easi ly
:lccessible points - \- to 11 miles for 80'~ of the
po pu llt io n. The work cen tres are :11 SO ve ry ne'lr. 80"
of the lO~n(1 hils :1 v'llue of above f!<II.5f)'1!_ !)i!T cent
(1/1,')'1th of :tn aCle). The houslnr. situation is '11so 15
sllt1 stactory, but the po,"1 :ltion C'ensity/as hlph as
1 '? .O()O po rsons ner 8'111 lre mi Ie. The concent ration
of pO;lUlatton In dtfferent olass groups or caste
groups is also evident to a certain degree, 'Y'ith
limits.
14.7 TIIE r.UP. ~ L UPBAN PHENOMENA.
1. In rural areas, the location of services,
fa.cilities like shops, dea lin~ in !l11 tyj)(:~s of goods,
ilOst offices, sohools <\nd other public building,s are
found in and nround ju~ction8 where a lIinor collector
road or the major highway lIeets the inter-village road
or toot paths or IlGe. The •• soots emerge as sellli
nucleated a reas of resi(lential ln~ non-residential
uses. We call tl!ese :IS "rural urban knots'!.

Cities and to~ns 1n Karals have a sprinkle
of such knots around thea. They serve as the "S6~i
Urban InIcleus" and attract the scattered settlements
towards it for oertatn basic needs of life.
3. "Dwellings, paths Bnd places ot asseably"
provide the lIatrix tor our settlement structure.
Dwelling in Kerala tor. only a part of the landscape
of the habitat. It is intenroven into the matrix of
spatia.l distributim. The soattering of settle".lents
(homeste~ds) necessitated the siting of p~ths for
lIovellent between the different parts of the hUllan
environment. Many a town or a vill~e grows around
a shrine, and we have the plncH of assellbly. In
Kerala "Paths !nd ~laoes of assembly" underwaat a
series of changes. Peo ·le were so mobile that
Trading centr"s and rlweilings were sited nearer to
the transportation routes. The road junotions
provided the ideal spot for markets and trading
centres, ~nd these beca .. the places of assembly.
The rural-Urban knot has oe_tain ad"nis-
tration offices like vil~e registrars' Otfloe,
Pancbayat Offi.:e, Poli~e St",tion. etc •• a weekly or

bi_weekly market place, a few religious institutionj,
a number of shops dealing in 1II09t of the modern
goods, etc.
5. The main economic activity of such centres
is defined wi thin the hinterland of a radius of
Ii to 3 miles for daily needs and 5 to 8 miles for
speeial neecs. The middle income group pltronizes
such centro'S. and rarely m,oney flows tn from external
sources. lIenee the rrowth ot suoh centres is very
slow.
6. Tbe People en gaged In trade and COllUlerce ,~
here hnve to depend on other ocou~ltions like house.
hold IndlH,tries or agriculture as the lIain SOUTce
of in oollle •
• MOst of the aotivities in rural urban knots -
are confined to ret'lil trade, eduo;ltion, a.nd prote
ssional ocoupation.
8. The social and economio changes in the rur~l
areas are introduced thlOugh these knots.
9. The knot oonsi sts ot a string of 15 to 60
shops, administrative oftioes, residentia 1 buildinl!s.
eto. tor a distance ot 2 to 3 furlont:!s along the
roads (the longer distanoe being along the major road).
The densitv 01 population at this spot is higher.
10. Locating industries in suoh areas has
given an ill{"Mttus to t he growth of the rural-urban
knot, but the. rioh agrioultural lan~ is put to
non_agrioultural use in very fast strides."
11. All rural-urb~n knots function as an
8dllinistr::ttive, sooN, oommuni<'ation and oommeroial
centre, servtnl! two or three outlying revenue villages
or parts of viII ages. In oertain knots one 01"
two of these function may be predollinn .• t.
12. The produoe of the hinterland flows into
the "leno ts" aDd the finished goods fT01ll major urban
oentres get distributed to t be rural people through
suoh knots.
13. In sprea(~ing the ur~an influenoes, the
rural-urban knots playa key role.
14. Availability of faoillties like electtio
power, lIovelllent channels, eto. helps the area to
aooumulate nonaagrloultural ~otivitie8.
15. The oontinous ohain of non-indastrial uses
are not BUte than 15 to 60 feet deep from the ro~d
slde. 'l'he land i"lilediately behind this is puhto

intensive agrio'tl ture.
16. The size of knot. var" with the nature ot
the aooess routes Rnd the type of other interseotions.
The influenoe area also varies fro. plaoe to place
depehding on the density ot population, ruggedness
of the terrain and size of knots.
iT. For spectal taoilities like hospitals,
weekly aarket_, etc. the area ot intluence v~ries
fro. 5 to 7 miles ~us.
18. Rural urban knots closer to aajor oities
or towns oontain lesser number ot speoial taoilities
in most the o~ses.
19. Aaon~st the scattered settlements there
is alwa,. a linear pattern 0 f dispersal along the
tT';:lnsportation routes, be it a river, a road. a
railway or a canal or the sea coast and it i. evident
in foot hills or immetiatel.y above high flood level,
or wheBe the land is divided into narrow strips by
the backwaters, lakes and rivers.
~O. The aooessibility of the homestead to the
transportation ·route is all the more important, since
the garden produoe and the cash pwduce have to be
moved wi th Ie 1st efton to the ne!lrest market.

21. The line Jlr strips of paddy field between
hillooks neoessitated the siting of houses on high
ground adj aoent to it. In the oElse of land which
is subjected to floo~ing also, the siting of the
hOfMsteads 1s in a row just beyond flooding area.
On the foot htlls when the land JU"it below is opened
up, the lInear htmaIJ habi tat ton springs up. All the
more along the transport;1tion routes this is a oomDlOn
phenomenon.
22. The settlements of the Christl •• s , Muslims
and non Malayalee Hindus hwe a oertain nucleated
oharaoter within a dispersal.
23. Trade and Co~merce neoessitated the siting
of hOllestearls along the transportation roates and
to~ it is an accepted module of development.
24. The line~r pattern is residential oum agri-
oultural uses interspersed with short lengths of
non agricultural uses.
15. This development has not reaohed the stage
of aouteness to oalltor Immedt me dev'elopment, exoept
at inte~.sec.tlon. of roads where the intensity and nearness
to the transportat ion routes 16:21. ~OU'l'&e i,ef danger fnom
f~st moving traffl0.
26. Along railway lines an (1 rivers and canals,
the line,r developllent has resul ted in new transport
~tion routes being opened out on land.
14.8 THE RURAL URBA N FEIAl' IONSHIPS •
1. The rural urban dichotomy which is q'11te
explicit' in other parts of India, is both phvsically
and social.ly non-existant In 1I0'::t p1lrts of Kenlla,
except the 11igh ranges.
2. In Kerala the physical phenomenon ls of
the town thinning out into homesteads, :l'ld getting
infused into the homesteaf:S of the villape, still
furtther thinning up to a certain liml t and then densl
tying as we reaoh ne l.rer to the IUral urban knot or
a rural market, and the phenomena repeat. Thus
there is a physical oontinuity of settlements.
3. Even though in towns a sli~ptly c •• paot
nature 01' houses and shops are found, btlt stll1 the
basiC unit of settle!l1f!nt remains the hOllse and the
compound wtth garden crops.
The "rural-urban knots" link up the rural
and urban settlements socially, thereby resalting tn
rural-urban oontinuum:,
5. But as we aove towards the oity the dittuaion
tnoreases, and the importance ot the rural-urban
continuum is lost because the normal Malayalee i.
of the introvert lfl. ture for lIost of the requirements
of pri V'lte It f'e •
6. Physically the neIlrest rural -urban knot or 40
the village centre caters to therural population, for
daily needs, But when it is a question of certain servi
ces ~nd facilities of q hirher order, tb~ normal
~bla)'alee i. drawn tow> ras tbe neareat major town,
of tan by-pasaing the amall town.(popul'ttion size of
be low 20,000),
7, Henoe two systefls of' para 11el hierarchy
work for all functional purposes. One is the "rural
system", the interdependenoy being trom the homestead,
to tbe I'!lral urban knot or market centre to any town
be it minor or .aJor. The seoond one is the "urban ~
systea- with the oity on top followed by the Major
towns ax(.istriot Headquarters) and then any of the
towns or rural-urban kmots.
I. A diffusion of the order of f~nctional

hierarchy is the .. be~~een the urban and rural
syste.s when we try to inte rlink them. The se sys tems
also vary in the COllstal belt, the .iefland and high Ian d.
9 •. • . ,Ii The incidence of a large number of towns
in the coastal bolt bY'eaks up the hierarchy. While
in the hlg,hlanlls. the JdllZ'&ZllkJ[.existence of lesser
numb')r 4tf interlinks st'lbilises the hier'--;rchy. This
is true for all functions of life whe~h.r it is work,
recreation. educ~tiont health facilitIes, service.,
eo.meree, etc.
10.. A clear hierarchy of settlements exist.
for administtative functiontll ranging fro'!! the capital
of t)'e state to the District Heac1quarte rs. the Taluk
Head9uzrrters and the Pnnehay.ats or revenue villages.
11. Since ev(!ry villallo has educational facili-
ties health_ tacil1tlew, services like electricity,
rural water su})ply, sbops, eonllllanlca.tlon linAs, etc.
to a oertain stlndard, the interdepenrtency mainly
oomes from the intensified specialisation in each
Unit. Also all the uni ts are into rconnecte ••
12. The multi_tooii lineal urban development is
quite visible alonl. the sea coast.
13. In oentral Travancore area. since the populated
midland areB stretohes further beyond the direct
influence of the Constal urban centres. a system
of intermediary towns aot as a link to the hinterland.
14. The agricill tural produotion pattern and the
well developed interl1nka~es h tve resulted in direct
transhiplllent froll the production. point ,., . to the
nearest *0'"' whioh has thlt seotor 01 the eoonomy
in tensified.
15 • The re Iationship through degrees of dependenoy
froll a produotion point to a OODSullption point does
Dot hold good for Kerala.
1. While the concept ofa vill11e in other parts
of India i8 assooi ated with a oluster of hOll.ses. and
su rrotin ded by .,nst areas 01 uninhabited 1:\01181 arable al"e
land, 1n Kerals the houses/always separate, concealed
in frf\gl'~nt groves. draped" ove-r- " by pePiJer vine
whose clustering produce inte~ingled with the area,
constitutes a portion ot the wealth of the possessor;
in the lItOTe open parts, they Fl re el1lb080med in the
'lut>h fol!;"lge of the JaCk.4 and Ahoga. and in the low
lands, they .. e surrounded by the luxuriant groTth of
paills.

2. Thu8 the unit of 8Httlefl'fent in Kerala is
a homestead. where the man lives, .ork .... ·, reoreates
and earna hi8 livelihood. Such Units are acatter:;d all
over the oountr,y aide, but for the 8hort atrach of
paddy field which are not more than one furlong in
widtb. Henoe we have a vast expanse of lsolilted
bomestead8.
3. Irr'spectlv~ of cil,ste, oVule or cre'~dt this
module of lifp, is acee ~te(l thro:lgh out the state adverse
toporraphtcPl.1 or n.dministrativt' conditions. In the
hi{~hlanrt8 W~ find semi-nucleations and nucleat ions of
settlements. Dut in the coastal plains only in the
caee of the very poorer section of th .. : ;leople and the
fisher folk. we find' the semi-nucleated or nucleated
se t t lament 8. ,
4. Th~ term ff;Vill:.i. ge" in Kerala only represents
an adllini8trati. uni t and ~ot a physical or s'}cial
entity, and there i8 no "ablldi" (Built up nucleated
area) for a village • •
5. Continuous chllnges to the territotial boundaries
m!tJte the distin at i,on of a study of village b:lsed on
size groupinrs. ot little significance.
6. Kerala hlls an aver'lge popul'ltion of 9122
persons in a vi 11a "e. This gl veil the idea th'\t
our vill~ge8 ~re large. The average areas of a
viI Lag,e is 9.25 squnre ",tIes. The dens1 !,y of ~
popul!ltion too is/faot!>r whioh inore~se~ the nU"1ber
ot people ill a vitlage 1n Kerala.
7. In Kerala 60.11~ ot the villages have a
populat ion 1)1 above 10,000, Bnd 28 .88~ Bre 1n the
si7.e oIaets 5000-9999. Henoe 89~ of our vil1A.ges have
a popul1tion above 5000. Any urban activity moving
into these Aore:ts '''ill change the face of the
vl11a~e into an urban unit.
8. In all the distriots 69.1~ ot the villages
fall in the populttion stze ot above 5000. In . ~
Ernali:ulaa, Kottayam, Alleptl8Y, Quilon and Trivandrua,
:aore 'than 50~ of the total rural popult'ltion live in
vi; t ::.gas at 10,01')0 and abo ve popu la! ion.
9 • The larpe, aye r'lte area of marly 20 square
• iles aooount forth. high population in villages 01
Kottayam and Quilon.
to. Tbe Une;1r road lIlileage in !'Ural a.reas
(villa pes) varies between 0.45 and 1.1 lIiles per square
mile 01 area.
11. The district with 101'1eat miles of rO'ld per ha~
tho lSflnd of popultttloni the highest perc"nt~ . ."e of
non-workers. Thus mobility is one of the factors
which i8 keepin! the people.in employment.
12. In the oase of worke rs "CuI ti vators" leqd the
peroentale,followed by "othe r servioes" an d ft;l.gricul_
tural labourers". T!ese are f01[owe(1 by "or';;:ers in
"mining, quarryin8, tore atJ"Y, etv.", and thcm nho'.HJehol d
indtlstry" Manufacturing other tllan household in,'lstry
comes last. which shows th~l.t the rural POllulaUon is
least engaged in the major industrial seotor.
13. Pal~.hat and Alleppey ·.U~:tric:s account for
a high percentage of \Yorke rs eJlploy~d in "agr1cillture".
since they are the gr",D'lriea of Kerala.
14. l'he proportion of '11ales and females amon,
til. "non-worke.rs" is in the ratio 2&3. A large seotion
of the females are enga,ed in household duties.
15. , Surely geogr:\ph1cal deter.tnt SII will not
explain the soattered nature 0'" hOllestelld in the
rursl ,lreaa of Kerala.
It is seen tlJ1t wi thin the sallie
area b 1.v1nr. _ile.r topographical fe k'l1ures, the
'{'amil lirahllins live in clu6tprs wll110 the
local people. even it they:are poor, ltve in isolated
homesteads.
16. Where the poorer sectioD of the Muslinls and
Cbr ist i.1ns live, the re are seml-n'lcle;ltions ot
settlement s •
11. The type of garden cro!')ping ano c':sh crop)lng 50
needs cOllstnnt nare/that the farllu~rs live on the
samet plt')t in wh ich they 8J:-e \Vo rkj ng.
18. The different variatloDs in the lan~ tenure
system, be Ipad the poorer section of the populltton
to ciaim title to the land on which the~r ,"ere .. vlrking.
But this enoo'lra,ed the sCllttHred pattern of settle-
ment 8.
19. 'fhe practise otuntouchabill ty and even
pollutton due tOlroximity, and the vertical hierarchy
in caste8, the settlements were scattered f-lr :lnd
wide.
20. The areas ocouped by the op;llent class have
hi~ber land values. Today ev,'n the richer 1n the
lower ca<:Jte Zli"e ahle to purohase lan~ 1n locali.ie8
whe re the high ,\ r e"fi ste 11 va.
21. The caste hierarchy 1s at In& slowly replaced
by the 01a!=l8 hierarchy. EYen then a certain a.ollnt
ot class hierarohy within one's personal life exists.
22. The settlements of fisher folk. are semi-
nucleated al()ng the sea coa*t. But thi s is often
within a scattered pattern of settleMents.
23. Tbe joint family system followed by the
higher caste peorle and emulated by the other sections,
1s slowly vanishing. This is lending to more scatterinl
of home.tea~s. even thourh within a seatter it is
a semi-nucleation.
24. Some fam,ors of presti ge \f11ioh have affeoted
the suttluruent:' pattorn are size of oompound, tho size
of dwel tinga, the number of out hOises, lIaterials of
construotion, size of ftgate_houc:e" an;; ownership of
landed property.
25. Apart from the b o sic reqilt rements of wate r,
and r1rden produce, certain other appurtenances like
the ont tIe sbed, out hOUfe, paddy thrn.shin{f plltfo rm,
etc. are oonsidered to be essential for the homestead.
This will vary with the finanoial st'1,tas of the owner.
26. The markets, shops, etc. in the rural areas are
used by all clasRes of people.
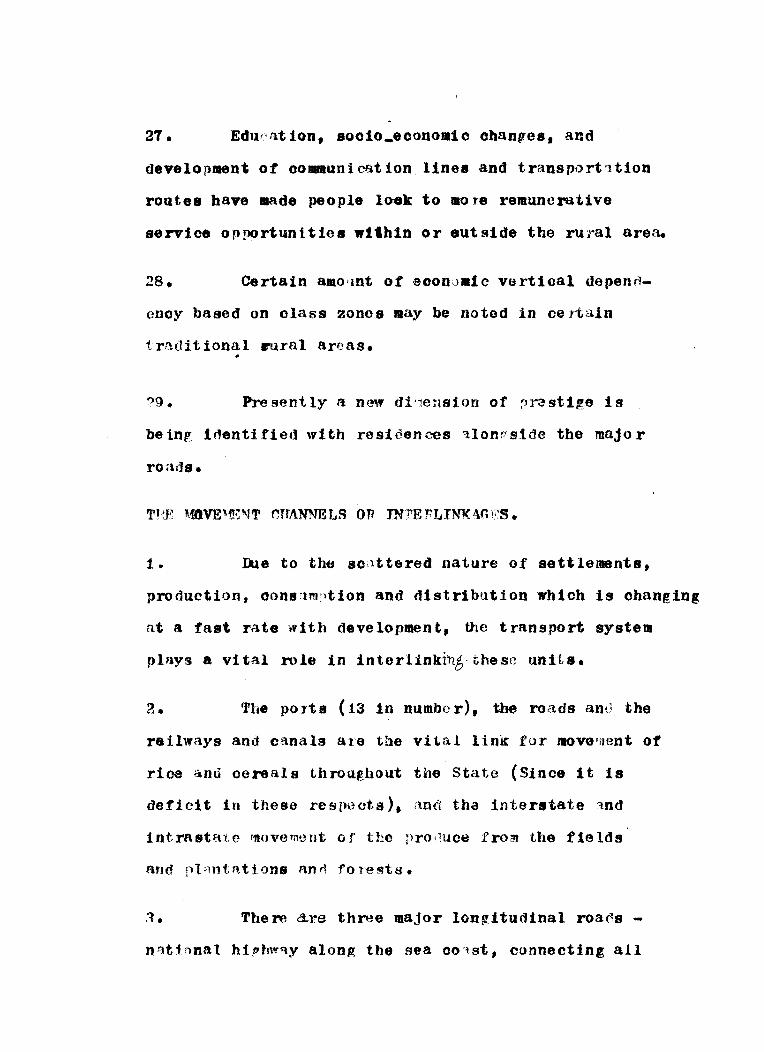
27. Edu"'/lt ion, soclo_economic changes, and
development of co_uni cat ion lines and transp.)rt'l tion
routes have .ade people look to lIore remunerative
service opportunities within or 8utside the rural area.
oncy based on class zones may be noted in ce rtaln
trrtditional .:ural areas • .
'>9. Presently tl new di';ensf,on ot prostige is
beln, identi.fied with resi6enoos 'llonr"side the major
roads.
1 .. Due to the sC;lttered nature of settlements,
production, oon8~lm')tion and dl stribution which is ohanging
at a fast rate with development, the transport system
plays a vi tal role in interlinkinh' these units.
2. The ports (13 in number), the roads anti. the
railways and oanals a1'e the vital link for JIOve'tlent of
rice &no oereals throi.l~hout the State (Since it is
deficit in these realh}ct.s), and tha interstate :ind
int.rastate 1110Ven1'..Hit of the pro,1uce from the fields
and plantations Rn~ forests.
There dre three major lon~itudinal roa~s -
nat10nal hlphwSlY along the sea CO'tat, connecting all
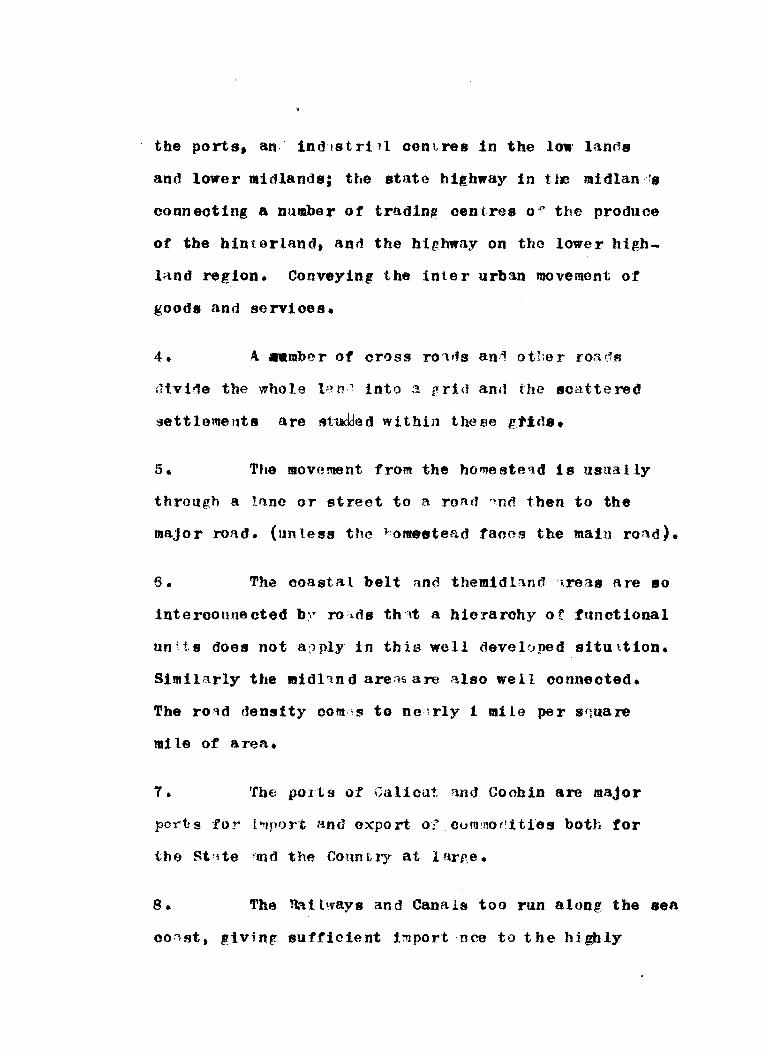
the ports, an 1ndlstrill oentres 1n the low lan~s
and lower midlands; the state h1ghway 1n the midlan '!s
conneoting a nllmber of trading oentres o'P the produce
of the hinterland. and the highway on the lower high
land region. Conveying the inte r urban IDOvement of
goods and servioes.
dtvii1e the whole V~n~ into :1 grid and the scattered
settlements are studded within these gttda.
5. The movement from the hOlltoste'ld is usually
through a lane or street to a rond 'lfln then to the
major road. (llnless the l-'omeatead faces the main road).
6. The ooastal belt ano themidl!ln(/treaa are so
interoonne cted b\' l"O'1ds th'1t a. hierarchy 0 f fUnctional
units does not a;)ply in this well fleveloped situttion.
Similarly the midl'lnd are:1S are also well oonneoted.
The ro~d density CODl'S to ne1rly 1 mile per Sfluare
'lillIe of a rea.
7. 'fbe ports of Galiout and Cochin are major
pOl"ts for i"lpor't and export 0::", commor'itfes both for
the St'lte ftlld the Conntry at large.
8. The Railways and Canals too run along the 8e8
OO:1st t ~ivi nr. sufficient import 'nee to t he hi gbly

d&nsified are1.S. The riTers ~re n>tVipable in their
lower renches, :Scdhat aD inter:-,.oonnectioD betwHen the
sea coast and the m1dlan~ areas on w~ter is possible.
Onl)~ inthe Palghat gap, I he railways run along the
width of the State.
A study reveals th3.t on many of the trans-
portatton I'outes in Kel"aJa, there is 6 spare capacity,
to handle increased traffl c.
10. rrhere aH~ consiiJernlJle regional di.6pari tic'S
between the Malabl'lr and Trawancore C,}cbin fl·re8.s. l 'he
former is relatively least served by commanic .tioD
roll te t3.
11. The maximal economito u setu Iness of the
St."t.tes Hi~hway i~et to be achieved.
The vehicle densi ty in Kerallt is :2 .14 pc r
mile of TOarl or 1.54 pe r sql.ltre mi Ie ~f area. Thi s
itRelf' reflects the high mobility of the populfl.t!OD.
13. The inland w;.te"ways aye at pte sent connect!n,
They are the ohespost mode or trlnS;lOrt. A proposed
programrae of iullustrLlli'i1.tion along the major 131gbways
wi 11 gone ra~.c a oOl1side rable volume of t rnffic for the
waterway s.
1,1. TrtvAnrlru11l, Coch1n and Caliout (within an

ye'lr) wl11 be accessrlie by airways.
15. The minor ports in ICe ralaa are pene x*t tog
the econo1lY from fishing, and many a settle'lont
jepend on them.
16. The transport system of Kern La plowed a
vi; al role in the linear development a.ud 1\180 in
the sC>ttte ring of set tlemei.t s. But In the C'lse of
11ne'lr develo'"\Jft~nt, the depth from the road is not
Rlore than 3 :)10 ts.
1,(,.11
~patlal distrtbutlln :
1. 'l'he prog re S8 of the indust rtal sector in
Keralnhas been quite lapressive in the l,tst decade.
" . . Regional speoiali sations, Like textile
industry in Cannanoy'. and 'trivantJrum districts,
fo rest b!l!l1ed in r'llst rie I!J in Kozhikode, Qui Ion 1J1d
, Kottn"am f!istricts, ~a8bew influstry in Ql1ilon district.
A,ro-lnse~ inrhlQtries in Palghn.t and 'frichl1r districts,
Coir tni"'Jstry in Allep'ley dtstr:l .. ct lind medlu1I and
lare:e ge1.l8 industries in Emllkulatl district, are
notod In the OOUTse of the studies.
The urban centrt.'s have been accumul:ltlng
the medium and hO'tsehl)ld ind 18Lrie8 ether than

-Cashew ano Cot~. while the large scale industries
are In rural are'lS in the outskirts ot the major
urban areas.
4. The small scale inuustrial units lOc'lted
usually away from tile urban areas have local emt re
preneurship and have regional speoiallsations as
explained alre~dy.
5. The \ndustrial estat"s" ioc 'tted on the
outskirts of our urbail areas h ~ve not attract{~d indus
tries t:) shift their looatlons troliuTban areas. These
are cre fltlng Dew problems.
d.
?!FttE'rials, capital ,,\11" entrepreneuHihip are the
stum~ing blooks against rapid indlstri~lisation in
Kerala.
7. The produotivity of the~· industrial seclor
is also low.
8. In the ntrtal areas, the ind"!stries Co-exist
wi tb the rural l'lndsoape.
9. Sinoe labour, power nnd water are available
in all po.,rts of Kerala, and acc6ssibi 11 ty is also good,
the .ajor factor se(?IBS to be inuustrial ellJ,.epreneurship

whicb if ::l.t 1111 it is existing it does so in the
cities of the lowland region.
10. Ca ~li tal intensive industries it, ve oro ,iped
up along the urban a reas in the low la.nt's. Hen ee
the flow of rl'lW materials and industrial linishe(t
prodtlcts hve to be in a transverse direction to the
coast line.
11. Agro_b'lsetJ In,l Holtries and forest based
industries have dom!n ~ted the in<NstriF\1 scene of
the 8t 1ta •
12. Tbe other industries stand only secon~ to
the above 8~id inriltstries, since Kerala 1s in the
f1 rst stqpe of industri al dev~ lopment.
13. Cast~ '1nd class affi li1.tions hlVe played
thei r dominant T) le in the 0"'110 Tship of the, indus trial
sector.
14. .tlhe nunher 0 f te'·l"'ntcal Jl!'rsonnel is l"\rge
in cotltlHl te:-t1. tGS :Ut l ver,r low in Crtshew.
15. 'Economic facto~ sand historicql acc:i<ents have
a piTt in determining the loca.tion patt'm of the
industriEfs. Today the political forc'-'s too weigh down
factors of ln~~strial location.

16. The entrepreneur ohoose. a particular place for
e8tablishin~ the industry blsed on hi. personal
convent •• ce.=: This is going to o,tfset the pVlnn('d
dE!velopment of the Stlte '!lna the functional disposition
of our settle"!lent stractare unle88 a strong oontrol
over in\1ustrial loc*tioD is effeoted.
17. 'Nie 10c:ltion factor of inrlllstr-i.es revpals
thl:lt there is a skewness In ft1strib'lt1on of" the
industries in t he different parts of the St'ltC.
18. '1'0 a c~~ttain ext\'nt. the agro-b''1Sed
in(Llstries a.re toc::lted in the respeative hinterlanfts
where raw llutBrial is ;,\vailable.
C HAP T E. R' - XV.
AN A'1'TEMP1TO CI)NCEPI'UALISE THE EXISTING SET'l'I"EygNT S'J1RUCTURE IN KERALA.
16.1 An attempt to conceptualise an existing settlement structure can be mqde in this context only by the ~road studies and conclusions already. drawn out in the cotlrse 0 r this work. A micro-,study of diffe rent areas, which 1\re I1pecimcns in thems. I ves lIay revea.l the provisional n;tture of the concept. But as a general background to the whole theory of a functionsl dependency this concept holds goods for different parts of Kerala.
16.2 Taking Kerala as a whole and breaking up th, hierarchy of fUBctions of different settlement based on their administrative import~nce, it has been found th'lt the hierarchy exiq·ts. But coming to other functions like services and facilities, it is seen that two systems of fUnctional hierarchies are there. One is the rural system consisting of a home.tead, a rural-urban knot and any town. The second is the urban system consisting of a Town, a Majot town and n City.
15.3 As noted 1n "Loclt10n and Space Economy" il'!.
a meaningful system of groups/regions may be conceived as patterned and structured. Wlthin the system thcre may be a regular ordering of cities. Such aa ordering may range froll halliets, through villates, towDS,' aDd reglonal cities, up to primate cities. (Cities of nth order). Each order will be assoicated with a specitlc spatial spread of hinterland or tributary
area. The Itnterland of a city in any given order
fully oontains the hinterland or a finite number ot
oitie. of the next lower order (which have smaller
size hinterlands). Moreover, corresponding to each
other there i. both a detini Le number of tun etion •
whioh e~ch city of that order performs, and a • population size typi cal for eaoh oi ty ot th ~t order.
The theoretioal underpinning for suoh a system was
first developed by Losoh and then 1BO:re theoritical
mate rials together wi th empbe rical tindin~! s pro •••
that such a system works in a r~tional society where
inter-oonnections are tewe r; and distanoes are lIore.
15.4 Among the perceptive materials which best
indi eate the relation of economic ba se to cent ral
plaoe ordering are those developed by ,hilbrtck.
Seven broad oategories or or{~ors ot function exists
and they c an be depicted as tollows r IJbe first order
cate~ory oovers oonsumption whioh is oonduoted in the
household est·"lbl ishl'llent (resilient ial Unit.). The second
order c!\tep-ory covers retail tr\de. the third-order
whole sale tr:ule, the fourth-order 18 tor t ransh1pment.
the tifth for exchange. the sixth to 1 c,)ntrol and" the
seventh for leadership_ This is the seven told

hierarchy ot nested fun etions corresponding to seven
neste., orders ot Plreal units of or~ lnisntton. Corres-
ponding to each order, of function)is an Qrder in
the hierarchy of nodal points .As already indic\ted
the household establishment.the tirst-order Central
plaoe. performs the first a.nd only the first oategory
of funoti,)n8 (-I.e. oonsumption). Tbe second order
Central plaoes are clUsters ot retail (inclUding service)
aotivit!es, sunh as prim~rily oharaoterised in villages
and hamlets. WI thin the hIl1terl:ulfJ. ot eaoh seconc'!_ plQce
order centr"l,l/are a finite nllllber of first-or<fer
establishments. The third-order Central pl'\ces are
olusters of not only retaIl aotivitIes, but also
whole sale aotivities; th~y e"race a finite number
of first ordE'r pl1toes. And so forth Finally, the
seventh order Central pl~ce. of whioh there i8 only
one, is a oluster of leadership actIvIties as well
as all othe r (lower order) tunctions. Its hinterland
covers the entire system ot cities (regions) anc'! th.s
includes a finite number ot eacb of the lower order
cent ral places.
15.4 In Kerala's context thore does exi9t a
knot or small town), and a control point (Distriot

head quarters) and the leadership is llh'en by the
Capital (TrivandJ"lJRI). The inteJ'lllediary stages of
whole sale, TTanshipRlent and exchange go into all
or anyone 0 r the above mentioned places. j;'or example,
the point of transhipment for most of the ,~)ods
produced in the ru ral areas fire the homesteads (1f
they ,''-1''8 large) or the rural-urban knots (if they are
at le:tst 6 to'S miles fro. the nearest town lor the
nearest town. Sometimes these also serve as pOints
of transhipment. Whole-sale is always identified
with the district headquarters.
CASe STUDIES For ESL\BLISHING THE CO~Cg fIT"
1S.5 Thus we see that there are really two, .in
closed systems functioning/Kerala, (as explained
e'trlier) both for eoonollic activities'\ftd for service
requirements. For this,oase studies 'vere conducted
taking Kerals as a whole, and then the three regions,
Caliout, Ernakulam and Trivandrum. Tri van drum in
the south of Kerala 18 the leader8hip point. For
our discussions we llIay call. this as a "Control Point"
for the whole 8tate. Pal~bf'tt i8 the m~Jor produotion
centre of our rice reqll1relllents. and Calicut i8 a
major nmrket oentre tor all produce8 in the ar(,a.

\
ErnaJrulam at the centre of the State is a f:'l.st develop
ing industri'll Ilrea. (',onst naotf.ng a t riang Ie with at
Callcut, Palghat and Trivllndrum, we arrive/a POirlt
nearer to the Centre' of pravity of this triu.ngle.
For the spatilll distribution of the centre., we shall
oonsider EmakulaJl to be suoh a point. Now the apex
of the tri;'lngle ,at Palghat is Oil lIed the re ',:ouree
feeder, the Control point is Trivandrum. and the
"distributor potnt" is Callcut whicb bas the .... *x
entrepreneursbip for business (Trade ~nd Commerce).
Tbe point Ernakula. is oalled the "industrial activity
@'en~rator" for our purpo~les. Thus we see that each
or these paints have a seotor of the activities in
life acoentuated or intensified in them. Thus Ernaku-
lall even though a Cent ro of trade and commeroe, it
htlsi ts indllstrill seotor acoentu.a.ted. Similar is
the O::lse with the other centres. In this relative
set up each caD work only if it depen('ls on the other
three. This thoory is strongthened bv the tact thtt
Ernak lllam Is fllDcti)nally an ind lstriill cent re. Palghat
h:1.s 514 rice and oil mills in the town, which procoss
the paddy tor lIovement into other areas. Ctlicut
w1th Beypore port is taking up 35~ otthe trade and by
commercial 'tctivi ty 1n the aren as given/the tr;;,ffio

study oonduoted fo r the expansion of Beypore port
and for preparing the regional plan. Of Callout. area.
A subjective statement is made here, about the entre
preunership of bUliness activity in this area. It
is aore olear froa a statement aade else-where in
this work. Even goods fro. border states are brought
to Caliout tor distribution. Thus the four Centres O~
are interdependent for' one activity/another, because
of their intensive engagement in one sector of activity.
i5.6 A Olse study of Ernakulam area shows that
62~ of the fish (15 to 20 tones per day) in Ponnani
'Woves into Emakula-n for distribution and export.
Aiaillrly from the tea estates and plantf:'l.tion ftas
in Munnar. Deviiolaa, Uduabanchola, and Vandiperiyar
on an average 250 truoks per'day laden with the produoe
fro. these areas move into EmakulWl. Pormerly
Kottayaa and MOovatbpuzha in the midland region were
ihe oollectlng cent res tor thletH' produce. Bat their
hinterland 1s s.aller now because of the strong pull
ot Ernakula.. AIIO, the raw Cashew nltt required for
the factoriel in Qu1lon, (1n spite of having a port
at Qu1lon) and the tinished packed oashew move from
and to Ernakulam respeotively_ The raw Cashew is
imported fro. Africa, and the Cashew 1s exported to

toreign oountries. Also the fish oatches in
QuiloD and Neendakara IRove into Emalulaa in lorries.
All these are tacili tated because of the shorter
distan ats (about 90 miles from Ernakulaa to Ponnani
and Quilon) and the good roads for movement of goods
and f'\rti cles. A further enquiry in the departmental
sto:re at llunnar reTealed th~t t the finished goods
are taken from Emakulam to Munnar and lml'1lade for
distribution. Similarly at a lower level of habita
tions, the movement of different artioles to Ernakulam
and the drawing back of other finished goods from
Ernakulam were noted to understand the inter-dependency
of the settleaents for goOd, and servioes. For the
Ernakulaa area, Enaakulall is the IIlajor oentre tor
adainistr*ionJedumtioD, (even a Dew University
Centre has been opened here) and henlth facilities
(34 institutions with 535 beds). Similar studies
were done for the Caliout area and the Quilon area.
S1nce Trivllndrua is only an ada1n1str:lt1ve Centre,
it was not considered tor eTolv1ng the concept.
15.1 Wh11e draw1ng the influenoe l1ne diagrams
the following observations were made:
(i) A strong horizontal axis and a oompar1t1vely
weak ve'lttical axis results in the influence line taking

t},e shape of a parlllbola, aw the oo-ordinate distance
increase - longer than baIt the latus reotWl, it the
Centre of study' 1s taken as the foous. The ttquation
to the parabola is ot the fo~ y2 • ax where the
latU8 rectumi 1s a.
(2 ) The parabola flattenB to an ellipse a8
we oome nearer and nearer to the axis. This is based
on the direct influence of the towns in the midland
and low land areas with the major Urban foous. Thus
the toous ot tbe par~bola ia tbe Centre of Pull in
the region.
(3 ) Here tbe foci I are equidi stant (ne:\rly
200 Kma. ) and are tbe maJor centres along the
ooast line - Trtvandrum, Ernakula., Callout, Manga-
lore, eto.
An interesting feature noted was tbat the
tIa tte.ing ot the ellipse reaul ted in two fool1
wbich were spatially existing tawas In Kerala.
Thls then beoome8 the Bubsldi~ry oentres for the
_jor urban toct!. Forming ot suoh s.ller ellipses
by the rlitferent funotional lnfluenoe lines results
in ~o mare '0011, whleb become subsidary Centres.
Por example J In the EruakUlaa area. we bad Cbowgh'lt

and Kayallkulfllll as the two _jor tocii (botb b'tving
a population between 40,000 and 50,000 and both are
munioipali ties) the major indus t:ry be in, fishing.
The next two focii are Vaikoll and Parur (18,000 to
21,000 popul,tion), both being centres of reli"iol.l.8
importance and agro-based industries, !.lnd Taluk
headquarters. Simil,rly we have C'tanganore and Alleppey
8S two other focii of 8n e1li088 between the tomer
two ellipses. Thus the breaking up result s in a
DU"lber of centres of attraction, whioh conclusively
prove tha.t a strict hierarchical order of fun etions
will not be a practioal solution to the settlement
struoture for Kerala. But there does exist a hierar-
obiesl system of .... urban centres along the sea
coast (in size only).
BASIS FOR rrHE CONGEPT:
15.8 The interaction is a function of the square
of the distance between settlements and their poten
tials of growth. An incremental decrease in the
vari'l.tions of potentials and distances, lead to a
second degree C!lrve,. The fo roe deoreases faster in
the transverse di~ction as we move upwards along
tbe transverse axis from a foous. A nearest equation
to sucb a curve oan be of the fora y2 • t(x) or
y2 • ax where 'a' is the. latus rectum ot a parabola
The nearest linear fi~ure to suoh a curve is a
trian,le. Thi. 1. taken· as the fii'lr8 tor the
15.9 As we move downwards from tbe top of the
~abola, the curve flattens, beoause the higher in
denst ty of population/tbe lower reaohes, oonstt tute
a greater pull in both direction8. Dut~ard8 the
highlands in tbe lateral directton to thetran8ver8e
axis the pull i. deoreased beoause of tbe ruggedness
of the topography and the decrease in den8ity of
population. The greater pull in the Jlir1lands and
low lands along the lateral direction to the trans
ver8e axl. of the parabola, re8ults in carving out
an infl~tenoe area, the nearest approxail1lf\tlon of
which will be a seai ellipse. ~aking this as the
order of b .. aking tp the influence areas, a n imber
of ellipse. oan be fOTlled wlt~ a number of tooil
which form urban n,.oleations, along the sea ooa.t.
15.10 Hence we 'lre left with two form s of inte rde-
pendenoy in the oontext of the settlement structare
in ·Kerala.

(i) The elJ6p88& whioh torm the influence
area and generate the urban tocii; and
(2) The triangle whioh has one seotor of
activity intensitied at sach oorner ot the triangle,
to tunction $1& an interdependent net work.
15.1i In the tirst oase, the .umber of urban
oent res along the influence lines, can orf'ate the
necessclry nUOl'l'ltion tor a hierarohy Of slze tor
settlement"s to l~ established varying in size trolD
the .ajor urban tocii on the coast are to t.he mlni
towns in the hi,hlan'~s.
15.12 The stud les conducte.d in the exi sting
situation reveals tor most ot the immediate require_
ments the .ural settlement is a closed entity, by
and large going as tar as the rural market centre. A
homestead to market oentre relationship we may take
to be of the order ot a distanc:a ot i IIlle. It the
rural....urban knot 1& within this distance, the rural
lIarket 100 se s 1 t& importance. Then the rural urban
knot ls the oolleotion and distribution centre. The
rural urban knot ls selt-suttioent 1n the oase ot
day to day requirement 8 tor any specia 11 sed serv6ce
the rural J!.Ople move to any of the towns in the
viointty, not netessBrily to the nt'Ptreat one. Here
the population ••• ot a village is not the criterion
tor deciding the 1nfluenoe ot ::\ nelrby town or
urban oentre; blt the distance and the degree of the
mobil1ty and 1 t v'lriesfrom hOM stend to homestead.
Rence the t.irst system in the rural hier1rchy of
settlements is from a homestead to a market oentre
or "rural - urban knot- and then to a town. In
the~8e of the urban syte. we .ay have a distr10t
headquarters (Major urban oentre for administrative
eduea'10nal and health services); the next order
should be a Taluk Headquarter,. But hf!re, since 1Il0st
of the .f''lc 111 t i8S 'lyallable in a D1 strict Headquarters
in a sJlaUp.r degree is provided, .the 1ntt"O'vert aotion
of mO'Yelftent takes plaoe: The nert order in the
hierarohy May be a small town. But,a stUdy of suoh
t~reveals that they too act as a olosed system.
Hence any movement between these centres gets itself
if!entltied with a specialised activi ty to Jl t,"ir
higher de~ree than looally available. Bence from
a small town, the i •• edlat8 force of movement is wh.ic.h
tow9.rds a la*'re town,jmay be the District Headquarte Y1J.
Henoe in the Urban sy~tem we have the city, the dis_
trict headquarters (or a l:l'ge town) and any other
town as the oonsti tuents 0 t a hie rarohy of functions.
So the oonoept ot inter_dependena,y between sett1e-
ments for ~. specialised or intensified activity was

thought ot. The module adopted tor tbis is the
trillngle whio.h..,..- has been explained already. A
breaking up of the major ttiangle by the Centre
ot ~ravity into .maller tri8.n~,les and "\ still fur_
tber splitting into smaller triangles through the
oentres ot gravity, will lead t<> the location of
a number ot nodes ; the size and functions of the se
centres of grJ3.vity being reb.ted to the importance
in which they have been split up. Thus the first
centre of gravity will be a major industri-=tl oentre,
the seoond major industrial oentre, ~y be a secondary
industrial. resource or distribution Centre. All
other aotivities can go into any of these Centres
based on the local situation.
FLEXIBILITY OF THE CONCEPl's
15.13 In a situation~ like Kerala. wbere the
mobility 18 very high, any oonoept applied on an
eXisting stabilised sltu~tion should have some
tlexibi lity 1n approaoh. The b:''l.8io to nat a triangle
can ohange into a line or a point as and when two
or lIore .ajor tunction. gets itselt identified with
one oentre. On applic\tion of the ooncept on the

spa.tial trnme work, it will be necessary to have a
sYHte. of major nodes. "hidl will accWIlUlate- one
or DlOTe of the sectolrs jn one way or al1other. But
the flexibility of the concept should not be misused
to fi t 1n a oertain 10cRt ion without due re spect to
the underlyin, principle of creAting a dyn~mic
economy, th It has to flow in different directions
to est'lblish the inter-dependenoy ot the different
unit s in the Ret t lellent struoture. Thus a physical
and economic dynamisms put on the spatial frame
work will ore-lte tho necessary soclal ch t ngf"8 for
a better living and faster develonment of the country •
•
C HAP T E R - XVI.
AIMS AND OBJECTIVES OF THE JlROPO $D SETTLE~fENT
STRUCTUtE FOR KEAALA
16.1 Definite aim. and obj ect'i ves evolved
troa case studi.s and concepts to be applied, will
result in the ordering of a settlement structure
that i. reactive to economic developaent. social
chan~s and physical manitestations. The.e aims
and objectives have been broadly drawn out tor the
physical, sotial and eoonomic taotors ot the .ettle
aent structure to be evolved. The positive and
negative torce. th'lt accentuate and restriot our
thinking are given below:
16.2 The .restrictive torces are:
(a> Bugged topography leading to ditficulties
in .stablishing links in all areas.
(b)
(0 )
S<nttered .ett lements resulting in high
cost of dispersing services, utilities and
tacilities.
Pres.ure on land tor oultivation re8ulting
in non-availability of s,~zeable agricultural
land.

(d)
(e)
(t)
(, )
(h)
(i)
(J )
8carcity of minerals for rapid industrial-
isation.
Popul~tion growth and concentration along
the low land areas.
Er08ion of aea coast and aol1 eroaion due
to extended aonsoons.
Neces.ity of labour intensive endeavours
in industrialisation in the initial atagee.
Existence ot idle capital which will not
.ave into the hands of the entrepreneural
olass.
Stro~g beliet in Traditional values of
Lite and models of life.
High incidence of unemployment and un mr
employment •
(k) Existence of oa .. te atfiliations.
(1) Slow ohanges in attitudes to housing in
urban areas.
(m) I
An oft ohanging political machinery with
chanting Polioies and progrA.mmes.

(n) Fragmentation of rich agrioultural land.
(0) Labourtt'oubles.
(p) Lack of oapital and entrepreunership in
establishing large scale industries.
16.3 Tbe positive foroes are:
(a) High Ii teraey of ;\ large working force.
(b) Distr1bution of services and 'facilities
allover tbe oountry in a r:ltional way.
(0) Existenoe of rioh forests and plantations
(d) Availability of radio active sands a10ng
the ooast.
(.) 111gb potentials in hydro-eleotrio power
production, irrigation and water supply
sch. es.
(t) Positive urban influence in rural are~ ..
(,) High reaotivi ty to politioal oh'lnges for
deve 1 opllen t •
(b) Availability ot skilled :~d unskilled
labour •.
(i) A fairly good transportation system of
roads. railways, airways, waterways. etc.
(k) High potent1als tor tisheries.
(1) An enchanting landecape rioh in Tourist
•• .' -~ interest and yalue.
(0 ) Ap1aarance ot rural urban knots as
connecting links between rural and urban
areas.
16.4 Oonsirlering these negative and positive
toroes, the following ai",s and objectives haYe been
put forth.
1. The area under the forests is to be kept
the saute. . This is the aajor sector contribut ing
to the 8con01l)" of Kerala, cad .crener they control
soil eros1on and silting up of rivers and reserYo1rs.
Major transportltion routes are not to be laid out
in these areatJ" sin oe opening up a fo rest area beyond
the a1n1fta requirements tor conveyance of the
forest produce, will result in new settlements
crop ling up in such valuable lands.
The hyde1 potent ials of the riYers are to
be explOited, and some of the aajor projeot sites are
to be cbanled into tourist atrractlon sites. But
a lil'llitation is impoaerl in cencentrating people
bere.(not more than 5000 persons), to avoid the
toreRt areas adjoining these projects from being
deforested.
(3) The use ot agrioultural land tor non-
agrioul tu:; '.11 use s tu be disoouraeed. Only 56~ ot
Kerala's land area caD be brought under the plougb.
This n ••• s8itates alternate e.ploy~ent channels to
be opened up to absorb the rural tolk who are thron
ott the land.
Cattain semi-nucleations 111<. minor rural
urban knots are to aotiyated with eoonomio aotty1ty
1n the form of rural industries whioh can proce8s
the produce in the arAB. To avoid the spreadilll.. ot
urban aotivi.ies which cover up the agrioultural
land. these nuoleations are to be cordoned out within
an a rea ot 2 to 4: square lIiles, We call these settle
ments as "NIni towns".
(5) lfajor Sem-nucleations should be accentuated
thro:.tgh the injection of aotivities leading to concen
tr.tioD ot popul'lti~n.; thereby releasing the pre saure

on the rural land.
(6) The -Jor urban centres are to be looated
aloDg the sea oonst and on one side ot the Hational
Righ-way. The other side of the National highway
which is a potential areas tor urban aotivities.
should be controlled by effective p;,11cies and
planning.
(1 ) No ao re additional land area should be
brought under roads or other communioatioD lines
,unless it is very essential. It possible all these
routes hnve to be taken either above or below the
ground. Cross-roads are to be t,lken over the water
oouraes. thereby s~ving rioh agricultural land.
(8) MA.J or rural and forest areas should bot
be dist,lrbed by injection ot aajor urban centres
iD these traots.
Ru ral urba.nkllots are to: re_ill' a8
8erv10e oentre,s to the imBdi ate lIeighbourbood ot
soattered aettle_ita. But the form and pattern of
tbese knots .ay be adjusted to suit the local oonditions.
(10) Nucle!ltions are to be encouraged whereever
possible. but 1n keeping with the orderly growth of

other oentres.
(11) Linear non-residential growth, ot habita-
tions along the major transportat ion rout1es are to
be removed where-ever neoessary. and also to be
restriotod through striot polioies.
(*2) The hierarohy of settlements should follow
the direotiaa.'of flow of goods and serv1ces.- th'lt
is fro. the ooast totbe highlands. 1n a desoend1ng
order.
(13) Optimum land utilisation and cropping
pattern 1s to be followed. Fragmentation of land
ShO!lld be stopped and joint tam1ly life should be
enooll rage'"
(1.) Ieerala should be .ore reI iant on cash
crop. and plantations than on tood orops. Intensive
oultiv~tlon is advooated, and not by ohanging the
areas under oash orops and plantations for extensive
oultlvttion.
(Hi) In the intial stage s of eoonom10 develop
ment medium soale industrial development i. aimed a. and 1n the latter stages a shitt towards large soale

industr1alisat ion will be TlEcessary. In the rural
areas labour intensi va rural econolllY' based indlstries
~re to be started. In small towns the industrial
development i. to be through saall scale industries
while in the major urban aro't. eapital intensive
industries shoulrl be introduoed.
(11) Exoessive conoetrat10nin the rural areas
ls to be disooura~ed by exploiting tbe present
tendenoy of nrdl population to move toward. tbe low
lands.
(11) Stronl urban co_uniti.s should be si ted
all along tbe sea OO'1st. Tbis will aot cts a strong
poli_ical to~e to demand se7Yices, conveniences
and aatety. The result w.1ll be a planned developaent
and tight againat the aea.
(18) The conatruction ot some type ot sea
protection wor'~ will be imperative in the later stalres
of developtlen t. At tb i s st'tge by lng,'sious planning
thi 8 can se rYe two parpo se 8 si~tLltaneou.f,!J - one as a sea
protectionwork and the other as a movement channel

for the traffio of that period.
(19 ) The fl at sy stem of residences should be
sited only 1n the II ajor urban oentres. Ae far aa
feasible _n should be allowed to lllve on the ground.
(20) Un •• ploY1Jl8nt ot a oertain percent~.ge of
the population .hUllJ.d be there, bec::luse the'se persons
serve as the oonnecting link tor intiatlng urban
li1e in rural areas.
(211 Caste aff i -tiat ions should be discouraged
tor all publ1c purposes. But tor private I1fe this
affiliation will h'We a social oontrol in III~ts
aotivit1es.
(22) Education should be, oriented towards
tndustrial training and development.
(23) The utilities and 8e"iOI'. should be
distributed at taltly reasonable limits to keep the
scattered settle_nts tn pr'Oxi,m1ty to those sources.
(24) The tribal people shodld in stuges be
brought to the rural areas or "Ilinl towns" tor initiating

thea to a modem way of Ii fe.
(25) The rich torHsts and plantationsshoul d
be tapped on a soientifio bllS1.. 'fhe neighbouring
sIDall towns lIay be equipped with sraal1 soale
indUstries ba.sed on a proportion of these produots.
(26) Regional disparities are to be elimi..,ted
Fo r this the deTelop. nt sho!lld be in linear strips
along the breadth of Ke tala. Ditference bttweera urban
and rural lite h;lS to be toned down in 8tagell, and
a satistaotory oollaunity development i& aimed at.
(21) In the initial 8tage., elloh urb"ul centre
along the COi18t May have Its own utili ties. But
In the later stage this ha.8 to be brought under
a grid systelJl of supply.
\ (28 ) A .'ighted dlst.ribution of Industri:il
aotiTitie& in eaob area, depending on the nature of
indUstry, whloh isounditioned to the partioular
area, i. aimed at.
(29) Minor gaps between the econollY of the
urb8D an(f rnal areas are tobe bridged by bringing
in an inter-dependency of the settlements.

C HAP T E R - XVII
METHODOLOGY IN ARFIVING AT THE SETTLEM&liT STRUCTURE
AND ANALYSES
1T.1 A stqdy of the settlement struoture of
Kerala reveals that for the efficient funotionms'
of a soattered pattern of settlements the funotional
spots haye to be at varied distances in the low, land,
aid land and high l~md. The density of distribution
of popu htlon determines the det!r&e of introvert
dependency tb It oan be allowed for the functional ele
ments in a spot. The spot and t e distance theory
holds good here r !ther than the node nn rt the arf'a
theory. More over there has to be two system of
hierarchical aetilen_nta - the rural system and the
urb'ln system. ". The rural system may consist of "hollesteads", "rural
area centres", "rural_urban knots" and urban oentres".
All these are pointa and not areas th,t are oonsidered
here. Similarly tor the urban sygtell thereoan be
"Urban Centres", "Major Urban Centres" and "Cities"
Tl:6s latter oategory too has to be taken as the oentroid
pOints of all foroes and not"as the areas. When
oons ideringaell ~8:t.wtJ!l, .R" aat. .a~a., :die pAlJNi'.><LtiaB.
stu ••• gat; aJ<!~ "By .. e.. tag , ex •• pt wlratt eaRstdenti
such points, and not areas, the population size does
not I18.ke meaning, except when considered on the over
all intluence of a centre. Thus~ when a oertain
tun otion has gone into a spot, the point creates a
zone ot attraotion. Tbe zone ot attraotion is decided
by the density ot population distribution and the
dist,lnce ot travel or tr:.wel tiae. The fourth dimension
In planning 18 important here.
Depending on the nearneS8 of the Rmajor
urban oentre" to the "homestead", the degree of
dependenoy varies. Henoe it was tinally decided to
have a three 00 me red functional interdependenoy
diagram as the basis of evolving a knitted settlement
struotun for Kerala. Here one point of the triangle,
will be a " .. souroe teeder", the other a "distribu*o.
pOint" and the third a "Control pOint". The centroid
of the trfangle decidefi:; the Centre of aotivi ty which
we c:111 the "industrial activity oentre". The control
points aay be Taluk Headqllarters, District headquarters
or capital of the St:-tte; the "distributor points" are
places of intensive trade and commeroial aotivities
or centre were educational or he:l1th ,faoilities are
provided and the "reso'lrce feed8r" Is the pOint from
whioh labour, resouroes, etc. flow into the other
points. The "industrial activity generator" being
the oentre of gravity of the triangle, it will
funotion as the basic nucle.'ltion within a scatter of
settlements. From the basic con oept further nuclea_
tions and subdivisions oan be made by breaking up the
s.aller triangles untl1 we reach the hOllestead,
which aots· as the basi c resource feeder. It would
be better it an ~tra-area aatrix is worked out based
on the location ot the different spots In the basic
triangle. Conslderlnp- the optimization of 8i ther the
tilDe element or happiness, n linear prol!ramme may be
peep:lI'ed wi th the above aatrix and the variable •
.tJri~)iC .ay. considered. This is highly mathematical
in treatment and hence it is not tried here.
11.3 While ap'llying this diagram on the spatial
pattern of distribution of the eXisting settle1t1ent6,
the apex of the triangle has to point tow:\rds the
le8s dense area. in the triangle. Thus the base
heavy triangle will reflect the P9pulation density
distributIon, whloh de~lnds the neces8ity of having
more and more centres for interweaving the different
settle_nts tOlether by mutual tUllctiunal interdepen-
dency_ This again can be ach1eved only it one sector
in each 0 f the oebt:t8s in the basic form 18 accentuated
or intensitied, oreating the urge to move tn to that
cent 1'e for the particular aotiv! ty. Bare the sp6t
beoomes the important source of inter-relation and
not the tmaediate area of the urban orIUral -urban
oentre, of the intrin8io intluenle area.
1T.4 Ba8in~ our theory on these aspeots, the
methodology in planning the sett lement struoture ot
Kerala had to be oriented on a regional per8peotive
with the basic concept remaining the same. This
necessitates certain optimal oaloulation8 which harl
to be 8ubjective 1n certain case8. But a rational
apor-011Ch i8 made wherever pos8ible.
The methodology adopted in this case may
be summed up as follows:
(1 ) Establishing a distribution of occupation11
pattern of optimum working force, at saturation level
of urbanisation.
(2) An analY8i8 of land neede on the basis "-
ot the Ocottp1ltional structure, by effecting a properly
balanced break·up of this pattern.
(3 ) By oOBlparitive analysis of Olval1:lble land.
proportionate figure8 in terms of area8 of v~riou8
components (exolu,'lng hOl1sing) are evolved, after

checking how tar these r8{IUirellenta 1I,1y be accommodated.
The methodology in urban planning lHlSe(l 'I
on the -.ulti nuolel1, linear urban oentres is
applied to find out the land needs for urbaniz~tion,
housing, industry. oO:ltflerOe, transport, et •• of the
urbanlsqble popuillt ion, (which May • .,an all Po flU I at ion i th.o5e engaSe.J in
excepting agrlcultuMl and al11ed aotlvltios} A -
(5 ) Pinally the econollio 1I0des into whicb
these aotivities lIay be plough*d in, based on the
basic concept, are determined on a spatial basis.
(6 ) Reduotion of all the above taetua 1 data
to different units of settlements on a sp1tlal b,a.si8
80 th:,t 11 flow ot econollY between the fl1 fferent units
ot settlements 1s aohieved.
17.6 SATlj'RA'rION LEVBL OF (JRB\NI~AT IONs
The satur.tiora level of urban1antton 1n
any oountry lIainly depends on the- speed At which "
eoonollic development proceeds Rnd the land available
for urbn.n iSllt ion • Ot course advancement tn teohnolo,y
may decide otherwise. For our purpose, we prooeed;"
on the basis ot the availability of land th .'¢ can be
• put to urban U8e8 without hindering agriculture and

oash oropping. It 1s found that at an aver'lf:e
gross density of 65 persons perbeotare (double of what
is existing in Karala; at present). and the av l.ilable
land area tor urbanisation (T5~ of the l~nd th t
cannot be ptlt to cultivation or forests or pastu.re
the urban population works out to 160 lakhs approxi-
mately.
POPUL \TION PROJECTION FOR 2000 A.n.
The POPUl~ltion projeotL)ns were p·l.sed
on the I!eometric ·r~te of ~rowth ot populiltton given
by P2 = P1 (1+r)n. But the limitations imposed in
the inittal oaluc'ltions are
(a) 'lbe estimated mortality and ferlillty
patterns used for this proJection may not reflect
the actual Blortl.lity and fertility levels of the
population in Ker3la.
(b) In the computation of these estimates
the effects of migration have been ignored beoause ..
of the nOD_availability of reliable data of migr4nts
by age ~roups. Of cou .. se it has been noted that the
St tte 1s losing poptll~tlon as a net effect of i_ig
ration and e"igration. Bence the proJected populn.tion
fi~.ure. are 11~·~ely to be over estimates to this extent.
(c) The aS8umjrt ion of constant fe.rttli ty may
not be correct especially because the family planning
progrV:1I!le is be int. oarriedout in an intensive manne r

throughout the COll~ !'lnff people are becoming more
and .ore consciou8 of family plannln~. But no data
regC\""(~l1ng the reductlon 1n fertility rates dae to
family planning activities are re_dily 4available.
(d) It's not alwa.ys correct to l"tssume thnt
the expectation 01 life remaln8 8tatic without any
Ch}l.ng. froll the previous decade or it i8 tncretsing
at the same rate as in the previous decade. Actually
the expectat10n of Ii fe my be incrna81n g at a lesser
rlte or it may be remnln1ng 11I0re or les8 static after
attqining certnln stage at a different rate. In the
absen~·e of reliable <'f:tta, nothing can be said about
this definitely.
(e) In the ab senpe of :the specific fertility
rates it has been a8sumed that the sex ratio I1t
birth i8 105 males to iOO ".ales.
11.8 An avel"age ofrrowth rates of popul'ltion
b.qaed on (1) fertility rates are the 8ame as that of
196i, Mortality rnte rellains the sa.me A.s thn.t ot 1961"
and effects of mi,r~tlon are negligible and (2)
Perti!t ty rates Are tIe sa_ a8 ln 1961 t Mortality
deena8es tn the S!.'lnte rRte ~8 tn the previo .IS decade
and effect. ot 8igrttlon are ne@,ltgible, are given

1n the following tables
Year Annual r'l t e of growth of population over the previous
. decade.
1951-61 2.48
1961-71 2.34-
1971-81 2.18
1981-91 1.99
1991-2000 1.80
17.9 In the second methorl of projection, the
growth r'\te of poplll'l.tlon WllS assumed to (tecrease by
5~ in the 11 rst decade t b~" 1t)~ in the second decade
::tnd by 151t in the third deotlde and 2~ in the fourth
de~ade of po pull.t ion est il!l~t ion. The resultant
annnal growth r:ltes are 2.48, in 1951-61, 2.36 in
1961-71, 2.12 in 1971-81, 1.80 1n 1981-91, and 1.46
in 1991-2000. Here the assumption made ia as given
by a high birth rate in the fi ret dec ~de, a llediuJI
birth rn'. in the senond decade, ~ low birth r~te in
the fourth deoftde. Tile l\SRUmpt ions made are estimates
riven by the experts in family planning bqsed on the
stUfcesstul operation of the pror.rammes.
11.10 Coming to the popi.tliltion projeotioDs done
by theexpert oommitt.ee on population projectioDs set

up by the Planning Co_1 s810n, the following assump
tion s were .ade.
(ti) The present levels of @eneral fertility
rate in the Sttt. are tnken to correspond to the
estimated birth, rntes tor 1951-61 as g1ven in the
"Life tables" issued by the Reliatr&r General of Census.
Gene ral fertility rate was t ,ken to decline by 5~
during 1966-10, 10~ daring 1971-15, 20~ during 1916-80,
and sOJr on, which Were also the assumed T'1tes ot
decline for '111 India Wlder "Preterr~d Projections",
(b) The value of State" expectltionsof lite
for 1951-60 Centred at 1956 was taken. The dltferen
tl~-\l rates of futue il1lp,.ove~nt 1n expect,ltion ot lite
por year cla18sitlBd according to the level of expec
t~t ion of Ii fe bas been takm as tollows:
(c)
1956-10
0.8
1910-80
0.65
1980-90
0.45
1990-2000
0.20
Since the effect ot migrttion on the state
h~8 been very 8mall except in~abn~mal circumstances
this faotor 1s ignored in making the projectlon,
leaving it to the margin in the rate of nntural increase
assumed to take caB. ot it to the extent it oan.
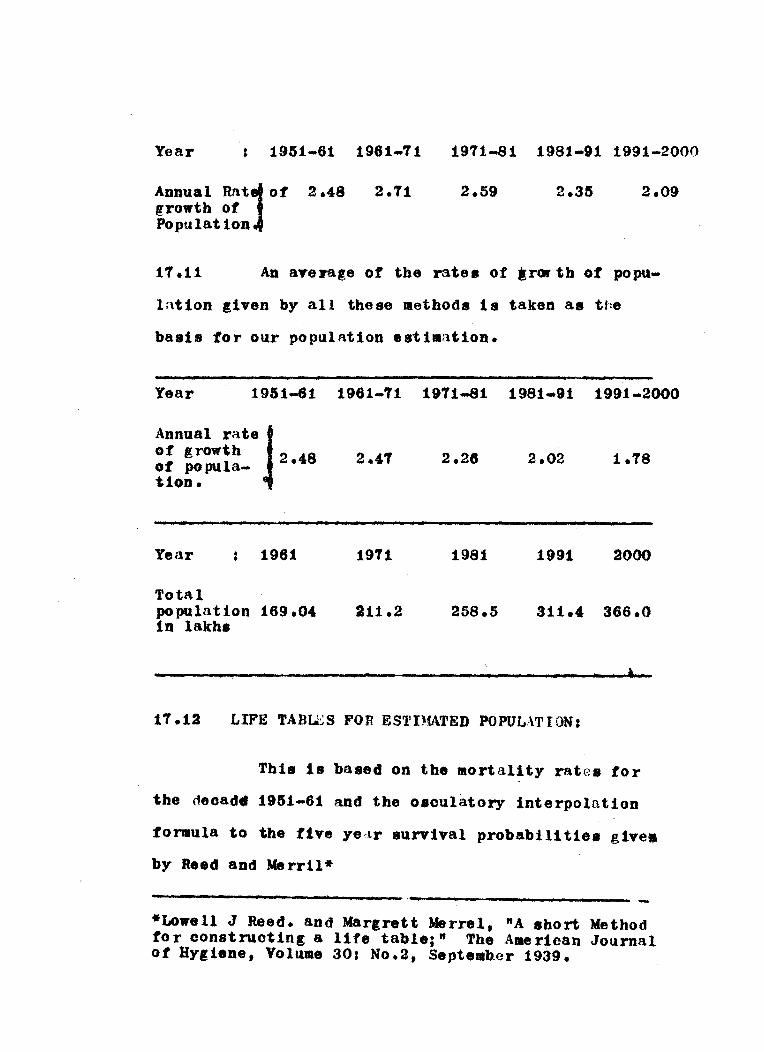
Year : 1951-61 1961-71
Annual Ratj of growth of PopulatioD
2.71
1971-81 1981-91 1991-2000
2.35 2.09
17.11 An aTerage of the rates of irt»' th of popu-
lat10D g1ven by all these method II 111 taken all ttle
ball1s tor our populat10n ellt1.at10J'l.
Year 1961-61 1961-71 1971-81 1981-91 1991-2000
Annual rate J of growth 2.8 of popula- • t10n •.
Year : 1961
Total population 169.04 in lakhs
1971
211.2
2.26 2.02 1.78
1981 1991 2000
258.5 311.4 366.0
17.12 LIFE TAHLES FOR ESTHfATED POPULATION:
Tb1. is based on the mortality rates for
the oeoad_ 1951-61 and the 08culatory interpolat10n
tonula to the five yeclr sUrYival probabili tie8 give.
by Reed and Merr11*
----------------------------_.--------------------*Lowell J Reed. and Margrett Merrel, itA short Method fo r oonstructing a life table;" Tbe A_ rican Journal of Hygiene, Volume 30: No.2, Septemb.er 1939.
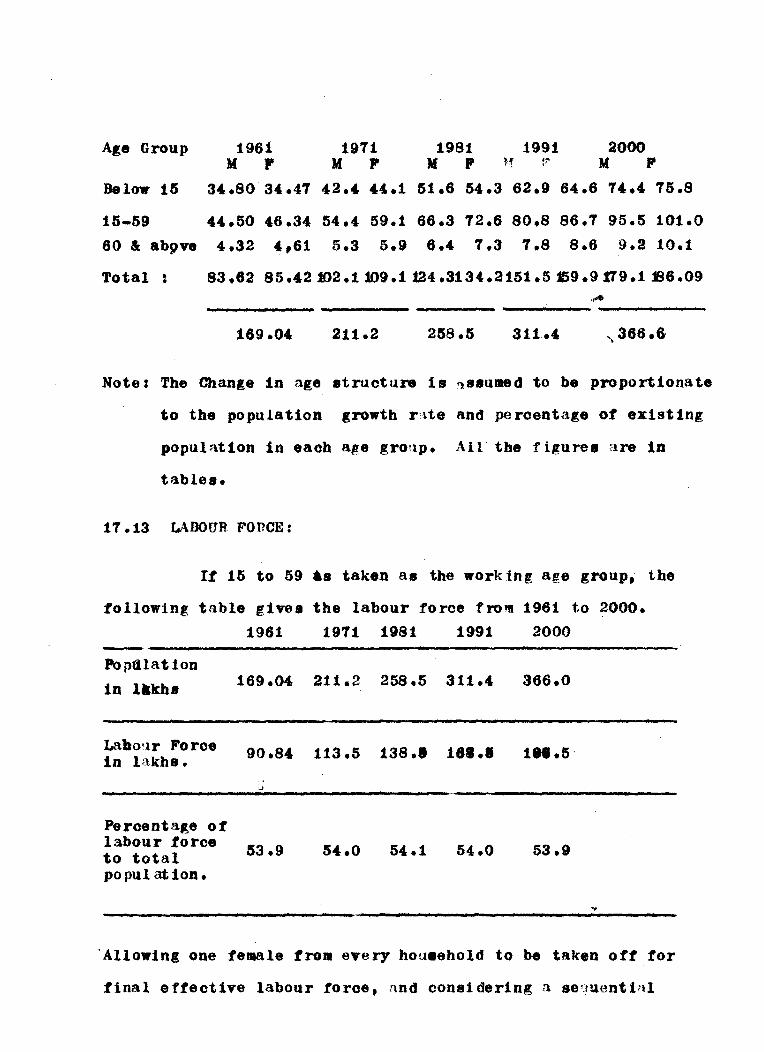
A~e Group 1961 1911 1981 1991 2000 M P M P M P H !~ M P
Below Hi 3'.80 34.41 42., '4.1 51.6 54.3 62.9 64.6 1 .... 4 15.8
15-59 44.50 46.34 54.4 59.1 66.3 12.6 80.8 86.1 95.5 101.0
60 &: ab9" 4.32 ... ,61 5.3 5.9 6 .... 1.3 1.8 8.6 9.2 10.1
Total : 83.62 85 .... 2102.1109.1124.3134.2151.5159.9119.1 ti6.09 .....
169.0 ... 211.2 258.5 311.4 ,.366.6
Note: The Change in age structure is ~ssumed to be proportionate
to the population growth ra,te and percentage of existing
population in each age gro>lp. All the figures are 1n
tables.
11.13 LABOUR FOnCE:
It 15 to 59 •• taken as the work in g age group, the
tollowing table gives the labour force from 1961 to 2000.
1961 1911 1981 1991 2000 -~
Pop.nat ion
in llikhs 169.04 211.2 258 .5 311.4 366.0
LahO'.lr Force 90.84 113.5 138.' lSI.1 lM.5" 1n lakhs.
..J
Percentage of labour torce
53.9 5 .... 0 54.1 54.0 53.9 to total po pul at ion.
'Allowing one female tro. every houeehold to be taken ott tor
tinal eftect ive labour force. :lnd cons1 daring a se'!uent tal

increase in percentage ot employment trom this labour
torce, ot the order ot 60~ in 1961 to 85~ in 2000
the ettecttve lahour torce wtll be
Ettecttve 1961 1971 1981 1991 2000 labour 56.0 71.2 92.1 11.5 135.1 Force In lakhs
.. ~ ot total 33.3 34.2 36.6 36.2 37.0 po pul:1 tlon
11.14 Thus· the optimum labour torce In 2000 A.D.
ls 136.1 laths - 31~ ot the total population. For
developed eoonday the oecupational pattern 18 ot the
orde r ot 16 to 20~ ot the workers in the prim lJ)"
sector, 40 to 46~ in the •• cond;:lry sactorlDd 35 to
4~ in the tartary sector.* Considering Kerals's
agra~ian eoonomy, it is suggested that the optimum
working tor"e break up can be ot" the order ot 25" tn
prh,ary sector, 38~ in the secondt'lry sector:.nd 37~
in the tertiary sector. by 2000 A.D. The tollo.lng
t~bl. gives the changes th·lt are to be etfected in
arriv1ng at the stage wise variation in occupation
structure •
"*Conditions of economic progress" by Colin Clark.
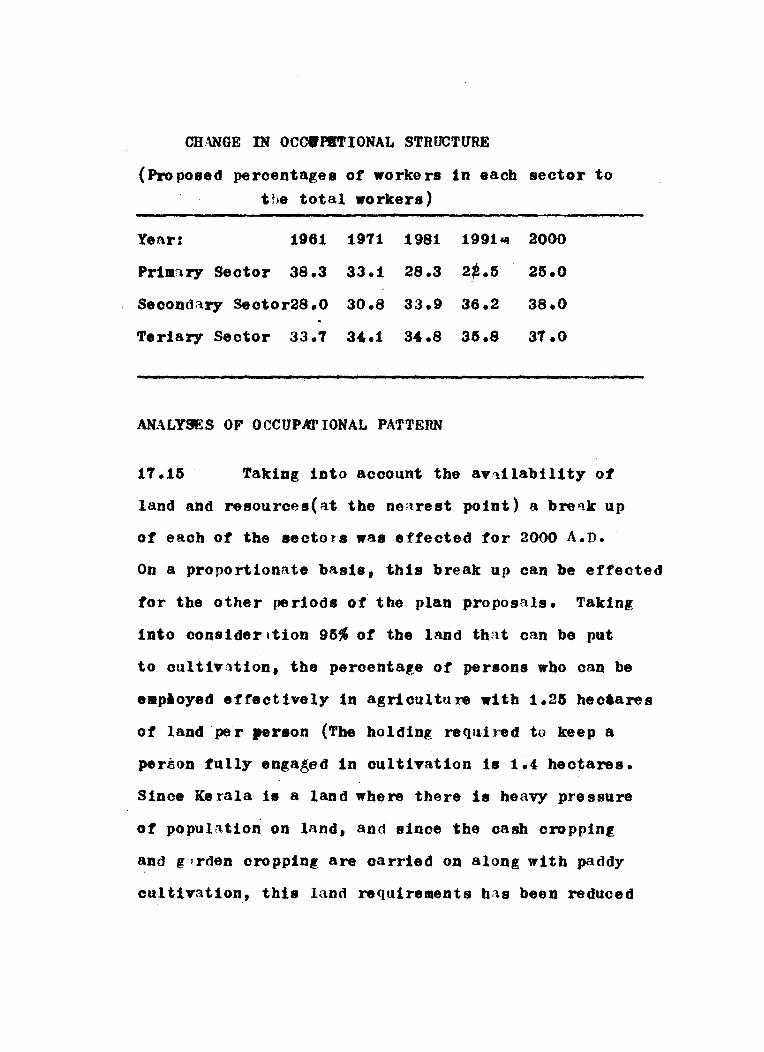
CHANGE IN OCctrPJITIONAL STRUCTURE
(Prop08ed percentage8 of worke r8 1n eacb sector to
the total worker8)
Year: 1961 1971 1981 1991 fit 2000
Primary Sector 38.3 33.1 28.3 2~.5 25.0
Seoondary Seotor28.0 30.8 33.9 36.2 38.0
Teriary Sector 33.7 3'.1 3'.8 35.8 37.0
ANALYSES OF OCCUPMIONAL PATTERN
17.15 Taking into acoount tbe av~tlability of
land and resource8(at tbe nearest point) a break up
of eaob of tbe 8ectors was effected for 2000 A.D.
On a proportionate basts, tbis break up can be effected
for the other periods of the plan proposals. Taklng
into considerltion 95~ of tbe land tb'lt can be put
to Qultlv!ltion, tbe peroentage of persons wbo can be
e.ployed effect1vely in agriculture with 1.25 bec.ares
of land per ,erson (Tbe bolding required to keep a
person fully enga~ed 1n cultivation i8 1.4 bectares.
Since Kerals i8 a land wbere there i8 beavy pressure
of population on land, and 8ince tbe oasb cropptng
and gtrden oropping are oarried on along witb paddy
oul ti vatton., tbis land requirements bas been reduced

to 1.25 he cta,-e:) is found to be 12~ of the effe ctive
working force. Simil'trly in the case 01 fores~r'y';-,
taking an effective working area of 5~ of the forests,
(this is necessary to keep on the regenerating process)
and the man power re'l;lired tor telling, removal and
regenerC\tion ot trees in this a reas, (allowing 25~
deduction on the usual man power required, sin a:t by
2000 A.D., in some of the processes in forestry
mechanisation wi 11 co_ into vogue) the percentage of
effective labour foroe employed in forestryy will be
0.60. A similar analysis based on the land th.~t can
be under plantations i. 2.9~ tor live-stook the
employment potential is 0.9~ ot the effective labour
torce lnd for fishing, based on the assUIIPtion that
6~ ot OUr fishing grounds will be utilised tor
fishtng operations, and a lIechanisation ... ilar to
that of Japan will be in Vogue in 2000 A.D., the
percentage of effective workers that can lJeeng:ttied
in this activitv is 6.50. Hence 2.1~ ot the effective
working torce will have to be in allied activi.ies.
conneoted with the primary sector.
11.16 For the second'try seotor based on the
projeotions worked out by the Industries department
tor 1981, simllar proportions were applied to calculate

the peroentare ot workers in eaoh of its oonstituent
aotivities in 2000 A.D. The following tlble fives
the break up.
Catetl,ory
Mining and quarr,ting Household in~ustry Manufaoturing other than t, housellold industry
Construction
Total
Peroentage of effective labour.
38.0
11.11 It l18y be lDted here, considering the
importanoe of ho~sehold industry in Kerala, a fairly
good percentage of the effective working torce bus
been brought under this sector. Since the tertil'\ry
sector ot Kerals 1s at present at par w1th the
stratum of economically developed countries as far as
the peroentl,. of workers in'that sector are concerned,
a proportionate break up has been made in this case
also. The follOWing table gives the details'
Category ~ ot eftective working torce.
Tracie and Commeroe 1.1
Transport and Communic<l,t ions 5.8
Other Services* 24.1
Total: 31.0

Thew. break ups lead to an effective f01"lllul'1 t 10n
ot the functional inter-dependency of the proposed
settlement struoture for Kerala. In the next Chapter
the further break up of auch activities to the
di Iferent unit s in the settlell8nt structtlre i8
attempted with dUe "re,ard to the particular potential
whlch the unit reveals a. a rrowth module.
p
*As per "Vellodi Comaissions" report on the administrative lIaoh1ner,y ot Ker~18, a 25~ cut 1n m8n power 1n this sector 1 s also into oonsl deration .(* on. ~,,"evlOu.s
pa5e )
•
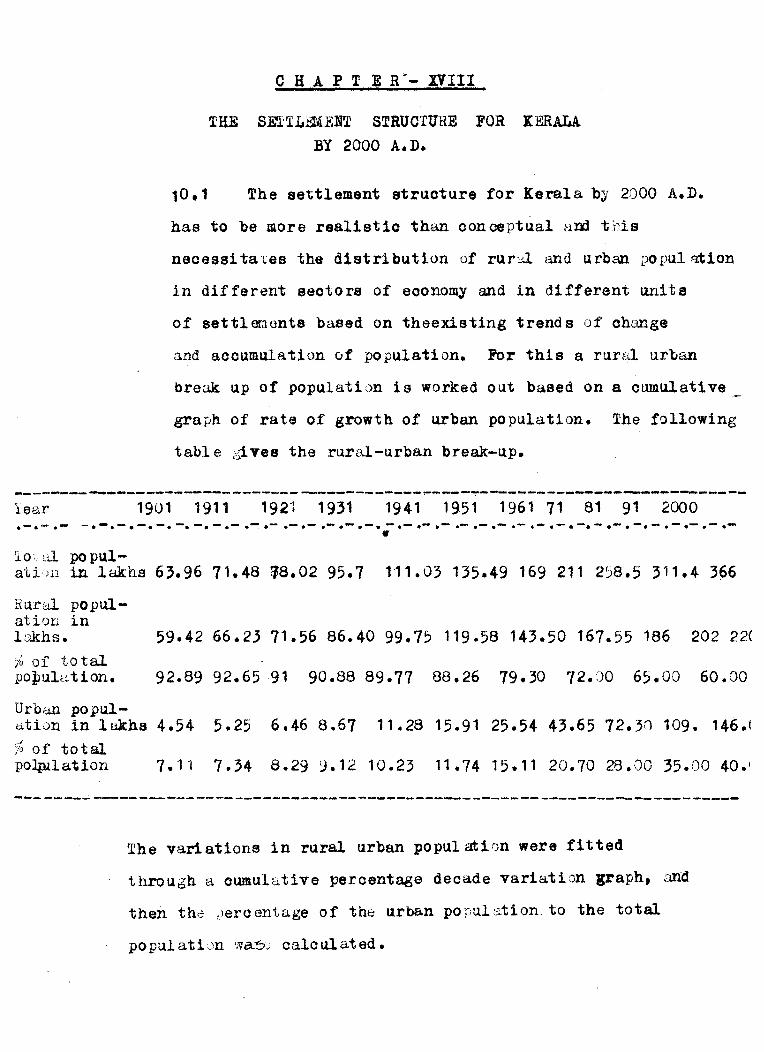
C HAP T E R~- XVIII
THE SE'ITLrlI1ENT STRUCTURE FOR KERALA
BY 2000 A.D.
10.1 The settlement struoture for Kerala by 2000 A.D.
has to be more realistio than conceptual and this
necessi ta tes the distribution of rur:U. and urban popul ation
in different seotors of eoonomy and in different units
of settlements based on theexisting trends of ahrIDge
and accumulation of population. For this a rtlr~.J. urban
bre:ik up of populatLm is worked out based on a. cumulative
graph of rate of growth of urban population. The following
table o~ve8 the rur8~-urban break-up.
--------~--------------------------------~----~---------~------------------lear 1901 1911 1921 1931 1941 1951 1961 71 81 91 2000 .-.-.- -.-.-.-.-.-.-.-.-.-.-.-.-.-.-.-.-.-.-.-~.-.-.-.-.-.-.-.-.-.-.-.-.-.-
II
10) cU popul-atim in lakhs 63.96 71.48 ~8.02 95.7 1"11.03 135.49 169 211 258.5 311.4 366
Rura.l popul-ation in lukhs. 59.42 66.23 71.56 86.40 99.75 119.58 143.50 167.55 186 202 22(
7~ of total population. 92.8992.6591 90.88 89.77 88.26 79.30 72.()0 65.00 60.00
Urbi:.lll po pul-Qtion in lukhs 4.54 5.25 6.46 8.67 11.28 15.91 25.54 43.65 72.30 109. 146.( j~ of total po1p1latlon
~------~-----------------------------------------------~--------------------
The vari ations in rural urban popul stion were fitted
through a oumulative peroentage deoade variation graph, ~:m:d
then the ,Jercentage of the urban po;::ul';l.tlon. to the total
populatl.::n wa~; oaloulated.

18.2 The seorJlld stageof the analysis towards proposing
a settlement struoture for lCerala was to dietribute the
total population based on the relative potentials of the
areas under conaiderati~n. The primary distribution was
made on the relative multiple indices worked out lor each
of the distriots as related to
1. Rate of growth of population in the district.
2. Density of population.
3. Literacy level of the population.
4. Housing stock in the district.
5. Workers in primary s\~ctor.
6. Workers in secondary sector.
7. Worker3 in tertiary sector.
8. Area of the district (leaving aside forests)
9. Accessibility in terms of rOa·j density
10.Number of urban centres.
11.Nwmber of rural urban knots.
12. urban populatl)n.
18 ~ 3 All these fa.ctors were takEll as a proportion of
the population of the distriot. Similar proportions
were wocked out for the stat e. Taking eaoh of these
proportions for the distriot as Xl, X2, ••••• , In and the
similar proportion for the state as N1, N2 ••• Nn
the multiple indi ces for eJ..ch distriot were oalcul ated
as N1 X1 + NlX2. To •• t N1 2 X1 2 "" i then the relative ind ioes
N1+ N2+N2 ••••• N12 for each district was cal cuI a'ted and the popul:.cttion
distribution on this basis. Similarly taking each
district, the population was distributed t~ong the taluks
in a similar Illanner.

18.4 URBAN POPULAXIO N DISTRIBUTION.
The stLld1es reveal the existence of certain
phenomena in urban concentrat1o!s. Based on that t. the
Llrban areas were divided as follows for the distribution
of po ilul ation.
1. The conLlrbatic complexes of. Trivandrum,
Ernakul am and C.aJ.icut.
2. The "knot ad urban corrido rs ft of "Quilon
Kilikollur-Ku.ndra" and "Haripad-Kayamkulam-
Ma vel ikara-Ch angannur, T i ruvsll ;;., ChangliD.c...che rry
3. The urban complexes of Cannanore, Trichur,
Wadakkancherry, Kunnamktllam C howgh at ,
Irit,j alakuda, end Cha! akud~ "
4. 'l'he linear urban growth of iellicherry
Mahe, Badagarajand HosdLlrg-Nileshwar
K~.t1llga.d; lCottayam-l!.'t twnannLlr j and All ep 1'ey
AmbalapLlzha.
5. Other urban centres of class III, and Class IV.
6. Urban centres of class V and maj or rur::l urban
knot, including declassified towns.
18.5 The percentage ·distributions of populatio.ri for
each of these units worked out based on their'existing
percentage of popQlation. DLle to limitations of time and
non-availability of all data leading to the calculations
of potentials bf these oentres, an attempt has not been
made in th3.t d1reotion.

,
18.6 It is found that 45% of the ~rban population
will have to be concentrated in the ~rban focii - 1rivandr~m
Ernak~lam and Kozhikode, the intra distrib~tion being on
"the proportion 50,39,31 percentages (This is based on the
averages of the popul at ion concentration in th,. e ,areas and
the percentage of location factor of ind~stries. A
similar analysis gives the IjOpulation distributi0n among
the diff er.:n t centres as follows
1. Urban focii
2. Knotted arban corridors.
3. Urban complaxes
- 45"
4. Linear urban growth s -6.40"
5. Urban centres of
class II &; II sizes - 25.15%
6. Urban centres of
class V size and maj or rural. urban knots.
No tes 1he di stributionof population for "1 ,.'li
towns " is to be made from the last category of
p.ban centres.
18.7 Also based on the potentials of urban centres,
in taluks, the distribution of ,; population is effeoted.
rfhis is then oheoked with the different oen tres in which
the popi.1lation has been distri bu"ted based on the category
of urban oentres. Since the basis for regional vl3.riations
could not be worked out,. adjustments wi thin each distriot
in urban PO)i.1l ation was made taking into coneid eration
the available area for ~rb:~n activities."
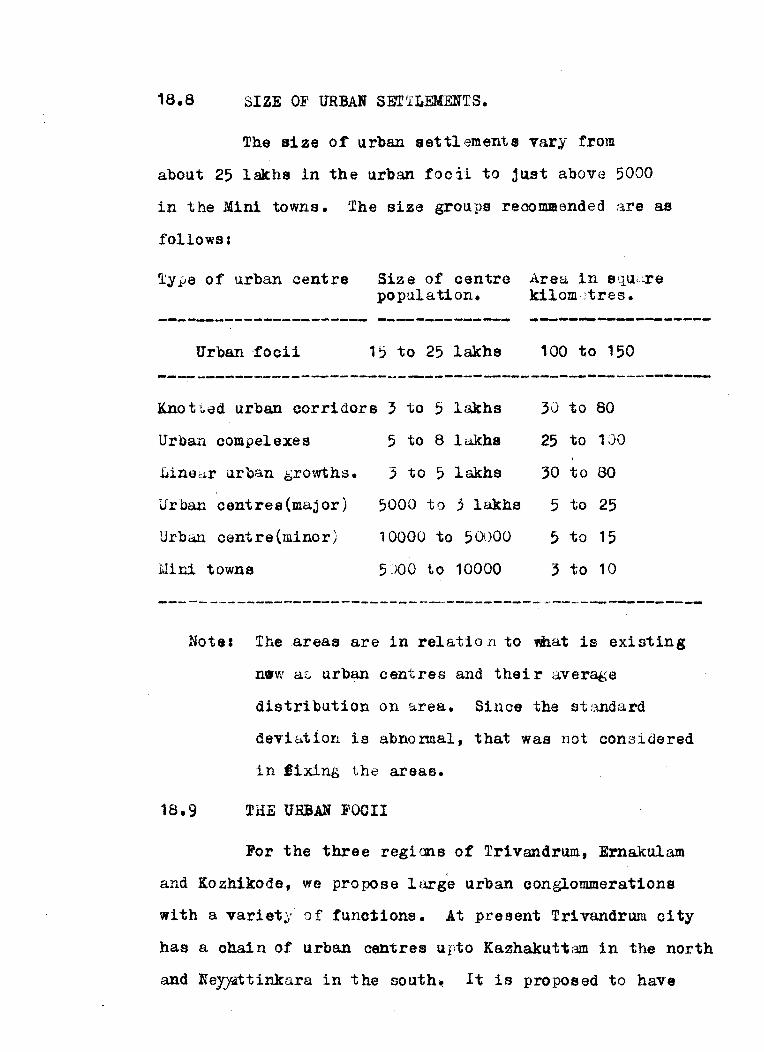
18.8 SIZE OF URBAN SETTLEMENTS.
The size o~ Qrban settlements vary from
aboQt 25 laths in the Qrban focii to j~st above 5000
in the Mini towns. The size groups recommended are as
follows:
Type of urban centre Size of centro Area in squ.-~e population. kilom .;tres.
---------------------- -----------~~ ~~-~-------------~-
Urban ·[ocii 1~ to 25 lakhs 100 to 150
~-----------------------.---------------------~------------
Knot Led Qrban oorridors } to 5 lakhs 30 to 80
Urban compel exes 5 to 8 lukhs 25 to 100
Linear urban growths. :> to 5 lakhs 30 to 80
Urban centres (maj or) 5000 to 3 lakhs 5 to 25
Urban oentre (minor) 10000 to 50000 5 to 15
Mini towns 5 JOO to 10000 3 to 10
Note: The areas are in relatio n to what is existing
now as urban centres and thei r a.verage
distribution on area. Since the st:mdard
deviation is abnormal, that was 110t considered
in fixing the areas.
18.9 THE URBAN ]'0011
For the three regians of Trlvandrum, Ernakulam
and Kozhikode, we propose large Qrban oonglommeratlons
with a variety of functions. At present Trlvandrwn city
has a ohain of Qrban centres upto KazhakQttam in the north
and NeJJ~tinkara in the south. It is proposed to have
this as a maJor urban focii for administration, high
educat ion, commeJrce]!andn industrial acti vi ty for the
Trav~core area. But to avoid the overstressing of the
major highway we propose this urban unit on the west side
of this major :u.ghway. The area 5<J.ndwiched between the
sea coast and the major highway is to be the urbanised
area. About 100 yards fro,. the sea ooast and 200 ye,rds
east of the major,ighway, restrictions in building cons
truction are to be enforced and these areas can be brought
under rich .cooonut plcmtations(.Already most of this
area is under rich COOOllut gardenf» The size of this
urban un! t is about 20 lakhs po.,Iillation in an area
of 13P square kilometres. The average gross density of
popu~tion works out to nearly 150 persons per hectare.
The predominan.t fUYlctiDn of t his centre will be I
"leadership" or as a Itcontrol point". Trade and commerce
and industry can go in to diversify the eoonomy. But
intensive a.cti vi ties in this direction are flot recomm.ended.
Since that will affeot the interdependency of the other
settlements and the interactions between different urban
units in the area.
18.10 The Kn~akul ;:lIll focii will be the major urbf.al
centre for the Cochin region. This will sxtend from
Parur on the north to Fort Cochin in the south ilnd Alwaye
and Perumbavoor in the east. l'he poptUation in this
centre will be 25 lakhs in2000 A.D., conoentrated in an
area of 148 squ: . ..:.re kilometres, and the average gross ,.c
densi ty will be 170 pers,ans '!per heotare. The area will
have predominance in industria.l activities. Also
major administrati v ca, educati,)n<i, and oommercial
(lotivi ties required for the Cochin region are to the
located in the unit. Functionally it is a centre of
attraction of the hinterl<:md. In delimiting the
urban area, the swne prinoipl e as appli ed in the
~rivandrum urban focii is advocated.
18.11 The Kozh1.kode urban fooii will be the major
oentre for commercial activities within Kerala and
outside Kerala. This releases the pressure of traffic
on Cochin port and thereby opens up a oentre of
attraction for the Malabar area. The major idea is to
concentrate the urban population and release the rur~ll
land for agriclll t Ilral acti vi ties. The popul atio , in
this Ilni t will be 18 lakhs and it will extend from
Elathllr to Kadalu.ndi on the north and soath respectively
and to Kommeri on the east, (all adjoining urban centres),
the to tal area being 125 squ.are kilometres. ':the gro ss
densi ty of po pulation will be 14? persons per hectare.
18.12 Thus the inter-regioail differences a~e
elimina ted to a large extent in the case of di stri button
of the major oentres. The predominanoe of one seotor
of activity brings in an int~rdependence between thes0
units. Ihis is the principle on whioh the whole system
is spaiia1.1y established.

18.13 THE OTHER URBAN UNITS.
The populat10n sizes, functions, and variations
in the different Ilrban units are est ::tblished on the basic
module of the functional inter dependency diagram.
The plans attached will reveal th:_ fl1:1ctions and sizes
a.nd the relative inter-linka.ges between the different
settlemErlts. The hierarchy in size is aohieved from
the major urba,n centres alone the sea coast to the
minor centr'?s along t he hi gh ranges. lJ.'he flo'N of goods
services, etc. is to be in the transverse axis to the
sea coast. Except for t'la m,).jor functio:r...s, each settle
ment,be it rural or urban,is to have the basic require
ment s for an effi cient functioning of £;. Bet tl em.:.;n t -
administrative, educ:ttior..al industrial :i.1"1d oommercial.
activiti's. ri'he degree of th'~Be activities can vary
from the urban settle:Jlents on the coa.st line to the
urban oentres on the highlands in a descending order.
The aocentuations or intensification of one sector or
another iB each of the settlements is based on the
present trand shown by the settlement - in terms of
an i:nd~x:.' of the workers inthe corresponding sector.
Since a list of the number of establishments in each
set tl anent is not avail a bl a, a phy sica..! analysis ',vas
ruled out wi th this as the baf.lia.
18.14 THE HIERARCHY 0]1 SET TLEM »ITS •
Between the three major urban focii a. number of
towns are sited in a continuous strip all along the sea oo~
and on one side of the National Highway. The v~riation
in sizes arc followed in the order of small er towns nearer
to t.he major centr8s and larger ones away from it. The
specialisations in these to'.vns for a limited hinterland
is also worked out in the plana. The penultimate aim
is to have a contin:.lous chain of urban centres on thewest
of the major highwaJ a.nd connected by ::m expressway (in
the lai ter phase of the ;,rogrE!;.D.ming) passing alonG the
sea ooast, on a sea erosion control work.
18.15 The next aiis of development 1s the major state ,
highway runIling along the midlands of Kerala. Major
urban centres interspersed with 3 or more smaller urban
centres along this axis· is proposed. Again the functions
are based on the spatial ooncept applied. This type of
development is necessary in the wider areas of K.erala in
Kozhilcode district' and in Kottayam district. ~lhe third
order in the hierarchy will ~~urban centres along the
transportation route in the lower centres ba.sed on their
administrative importance, have been sited alo!~ a loop . leading frOID the lower highl~ds to the interior of
plCJlltd.tions and fores ts in the east in Kottayam distriot.

Thus a size hierarchy here is mostly based on the
potential shown by the oentre and on the rate of growth
of population for the last three decades.
18.16 HI FRARCHY 0 F :nnmT IONS.
Two systems of hierarchy are folLCJ19 ed; introducing
thl;; rllrul-urbun knots and tha mini-towns in their
res;::;ec±i ve posit ions on the s t-,a-t ial. madill e applied through
the concept. Certain variations were necdssary to ~~oid
the nearness of certain m~L,ior urban settlements to the
minor ones. The distancea in the spal;ial concept in
10 cutin@, Ilrban centres are varied as we move from the
sea coast towards the highL:nds, the distances being more
in the latter case, because of l,~sser dense areas. A
uniform distribiltion would have gi v,::n a .etter s1Jacing
bl;;tween I1rban settlements, but the intricacj.8s of regional
economy and variations r.1a.kes it difficl11 t to .bave such a
syste ,. of distribution. In the t'I','O systems of hierarchy,
the rural system consists of homestead in the rl1ruJ. area,
u ruruL-tlrban knot and 811:; town, the functions V.ToYing
frOlll il1;llediate consumption to retail tradec:md ul. so from
~)r'im.::.u:'j school to hitih scno()l or co1186e in the t(W'In
as i'ci.r US the function of.~d:lCati m is considered, ~n(:
from a cl.inlc ·to a hospi tc.,:.l in t he case of heal th f'loili ties.
In c.dmintstrati ve hierarchy too this oan be thG l~egree of
v,,~'iatir)llS in functions. .8l1t it is stated here th8.t this
is no1. esseni. ially a stric1thierarchy which will function

in the relative sense. A mioro analysi s of each
area may reveal the variations and hence each Ilni t is
a planninb problem for the plcmller. This i~~ especially
so, since the settlements are all interknitted and
the distances are so short, and mobility so high
th'Ol.t hiera.rchy in an ascending degree of dependency
will not funciion. But an interpendancy can be there
if each unit is specie:J.ised in one sector of c.;l.ctivity.
So no attempt is made here to differentiate distinct
hierarchical functions for the settl3m011ts. Also for
no two persons in one unit, the distance to the nearest
town or urban centre is the s arne, because the set;.l anent s
are soattered.
18.17 INDUSTRIAL srr RUOTURE AND FLO'll OF ECONOMY •
The m~jor urban focii will attraot the major
industries and the ffi.:::diwn scale industries. The major
urbun centres like thd Knotted u.rban oorridors, the
linsCir urban growth and the llrban complexes will have
to accommodute th~ medium scale industries in Keralu.
7hese centres are distribu·t;ed spatially on a regional
ba~Jis. Ihe next low:!' order functioniL indllstrialisation
!ilY the small scal e industries - have car,. to be si ted in the
urban centre (minor). ':he major rural urban knots and
the: mini towns ~ill absorb the rural. activity aased
industries of consuIDrtion and r~Lea.se. fl'he spatial
distriblltion of the size classes of urb~n centres,
creates the b.ierar.ch~y for this functions or activity -

the order desoending from the major urban fooii on
th8 sea coast to the small town, mini towns and the
major tara! urban knots nearer to the highls.nds
i'he prooessed food material s from the major rurc;l
urban knots and mini towns flows illto the other
uni t.s of the area, whlle the factorym<:.lllufl1ctured
and finished goods from the m<..Ljor urban centres moves
into the mini towns and major rural urban knots for
consumption. Thus a aelative flow of economy in both
direotions is made feasible.
18.18 THE SvCIil.1 SlHUCTURE A!;D r:;UE:~L URB,~N T{EL,\'IIONSHIP.
The unemploJ,m;c'r:t of 15:<' of this 'MOrkin;:.~ force
benorl:tLes the potential fc;r the i1"fusion of urban life
in TUr~u. areas throuLh their idle contacts with the
urban areas. l'he condi tioning of the rural am urban
economy will help inbridging the gap in r,ercard tc' ir:come
and also at the same time the demand of a largt7 urban
populatLn: on .. he food ?roduotion of th...; rura.l~opul ation
will gene rat e th.e eoonomi cacti vi t J1 in these rural
areas through the major rural-urb:ul knots and the
mini to..vns, may help in chl.nging the trad i tional v _,:1 ue s
of life which are not in keeping with the tecr~logical
changes. There ar-e ppssi bi 1i ties ·bf a class hierarchy
being istablished in private life, but for all other
,ul1rpoaes since every man has to de:cend on anothe' for one
of his f!Inctions in life, the class hierarchy laC\)' not be
determined for the smooth running of the social life.
Neither will this oreate tensions in society. The
services and facilities will be distributed on a
proportionate soale in all centres, since the people
are politically vers reaotive.Moreover in a scattered
pattern of settl t"iuent s, the distribution of se r'Vic es
dud facilities will ~:.e costly, but have to be done at any
cost. Hence a coll.ege may, go 1ll1:;o a. village or rLlral
area, if the forces of pull a~e more. BLlt this will
not b.ffeot thd int~rdepGndency of the settlEments as
long as one sector of activities is accentuated or
intensified in a unit.
18.19' WHY THE MAJOR URBAN CFliTRl .5HOULD .BE ALONG
lHE S:!:! COAST?
1. The cent res are already served by a road,
railway :.md canal and sea.
2. Urban growth and semi-nuoleations are
alont, this axis.
3. ~he low lands is subjected to Qccasional floode
usually result ing in the land being kept as 'jV'aste land.
This -8l' be profitably used for urban aotivities with
little reclainat ion.
4. A concentration of tete urban population
between the road and sea results in a unified system
for utilities and movement channels.

5. Each urban centre absorbs certri:.'l activities
~~nd in due course a cont inui ty helps in choosing the pl,~ce
of abode and type of occupation for the geople. Individual
choice is possible.
6. The concentration of pop;ll '..l.tion releasee the
hinterland for agricultural uses.
'7. fhis conoentr&tion will be a positive foroe
to implQment sea erosion control works.
8. The continuity of a system e;f oentres rece-d.ing·
from the major urban centre in the rf:'a coast to JIlI1 forest
on th~u.*t can ae established, vdth due regard to the
differential densities.
9.
:"voided.
1 O.
Disturb~mces in the rural area. oan be
Intermedi::te areas between the urban centres
nlong the S(~a coest C':tn be put to industri::.tl use, or
!!lade tourist attr0.ction centres, hivh dens! ty residential
i.;.Teas in the suburbs, etc. The ref ionc1.1 studies will
reve.:....l this.
11. Each of these centres [;.long the cOD.stline
Can h;,we one sector in it accentua.ted or intensified
like centres b~';sed on industry, commerce, fisbing, etc.
Thus a continuity of activities and a diversified
economy is possible, ench asset depending upon another
for 'me of its activities.
18.20 THE MOVEMENr CHANNELS AND THEIR REL".TIONS
WITH me SETTL3t1ENT STRUCTURE.
The longitudinal location of movement channels
along the length of Kerala, helps in the transition
from the urban concentrations on the major high way
to the medj .. um urban centres on the state highway and
in turn the small towns, alonf the highway on the lower
hill ranges, towns along the highway on the lo\"er hill
ranges, £;nd finally the forests ~nd large pI :mtationa.
The trnnsverse movement channels (roads und canals)
serve as effective routes for movement of finished goods
i.nto ihe hinterlands, the medium to,\'o. servin£, as a
tr[tnshipmont point in cert::lin cases. Also the resources
and produces from the hinterluI.ld flows into the urban
centres Llong these channels. Thus a linear strip from
the west to et.st is the unit of ref~if)m~,ll)lti.nninr in
Keraltt. Since the areaS where the settlements are
scattered <:..re served by systems of transverse,
longitudln~.J. and other ro.~;tds, it is not advisable to
cover up "ny more IBnd with roads. Interrupted linear
development of residentiul uses mlJ¥ exist for a long
time to come, since it has been an established way of
living. Here the transporta-:;ion rOULE'S become all
the [jore important. Social presti~e has encouraged
people to cons truct dwellings nearer to the road, but
ti:'Jis should be restricted through sui tc~ble l:l,ws.

18.21 A knitted structure of urban concentrations
along the CO£"1Bt line will call in more overall planning.
In the final s. age it is e.dvisnble to h:1Ve good systems
for all utilities. The proper functioning of the urban
concentration movements, ~~n be achieved only if the
Lind on one side of the n';~1.tional highway is releL',sed
from urban uses.

TABLE NO, I
APMlNJ:STl\ATIVE PIVISIONS QF KEBALA - 19EU,
- - ... - .., ------- - - - ....... - - - - ... - - .. - - - -Distriot Taluk No. of Revenue
villages
- - - - - - - - - - - - - - ... _----- - - - ...... - ....
Cannanore Kasargod. 79
Hosdrug 35
Taliparamba 46
Cannanore 30
Tallioherry 49
North Wynad 11
Kozh1kode Badagara 47
QUflandy 57
Kozh1kode 71
Tirur 73
Ernad 64
South Wynad 20
Palghat Perintalmanna 59
Ponnani 46
ottappalam 61
Palghat 52
Alathur 47
Chittur 39
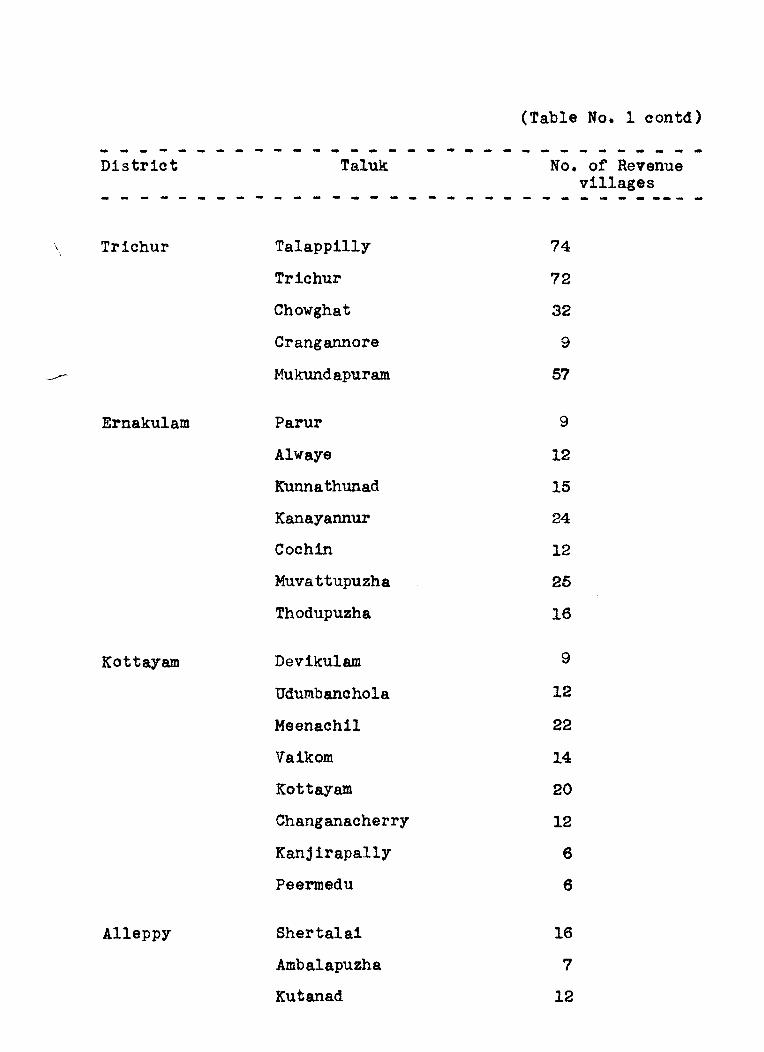
(Table No. 1 contd)
......... - ------_ .. .. .. ... - --- ....... - .. - - .. - ~ .. - ... District Taluk No. of Revenue
villages .. - - - - ........ - - - - -- ... .. .. ... - .. ... - - ..... .. -- - ..
\ Trichur Talappilly 74 \
Trichur 72
Chowghat 32
Crangannore 9
MukUndapuram 57
Ernakulam Parur 9
Alwaye 12
Kunnathunad 15
Kanayannur 24
Cochin 12
Muvattupuzha 25
Thodupuzha 16
Kottayam Devikulam 9
Udumbanchola 12
Meenaohi1 22
Vaikom 14
Kottayam 20
Changanacherry 12
Kanjirapally 6
Peermedu 6
Alleppy Shertalai 16
Ambalapuzha 7
lCutanad 12

D1str1ct Taluk
(Table No.1 contd.)
No. of Revenue v1llages - ~ - - - - ~ - - - - ~ - - - ~ - - - - ~ ~ ~ -- ~ - - - ~ ~ ~ -
Th1ruvalla 18
Chengannur 14
Karth1gapally 17
Mave11kara 15
QU110n Pathanamth1tta 19
Kunnathur 16
Karunagapally 11
QU1lon 19
Kottarakara 18
Pathanapuram 16
Tr1vandrum Ch1ray1nk1l 28
Tr1vandrum 26
Neyattinkara 20
Nedumangad 20
- - - - ~ ~ - -- - - - - - - ~ - - - - - - - - - - ~ ~ - - - - - -
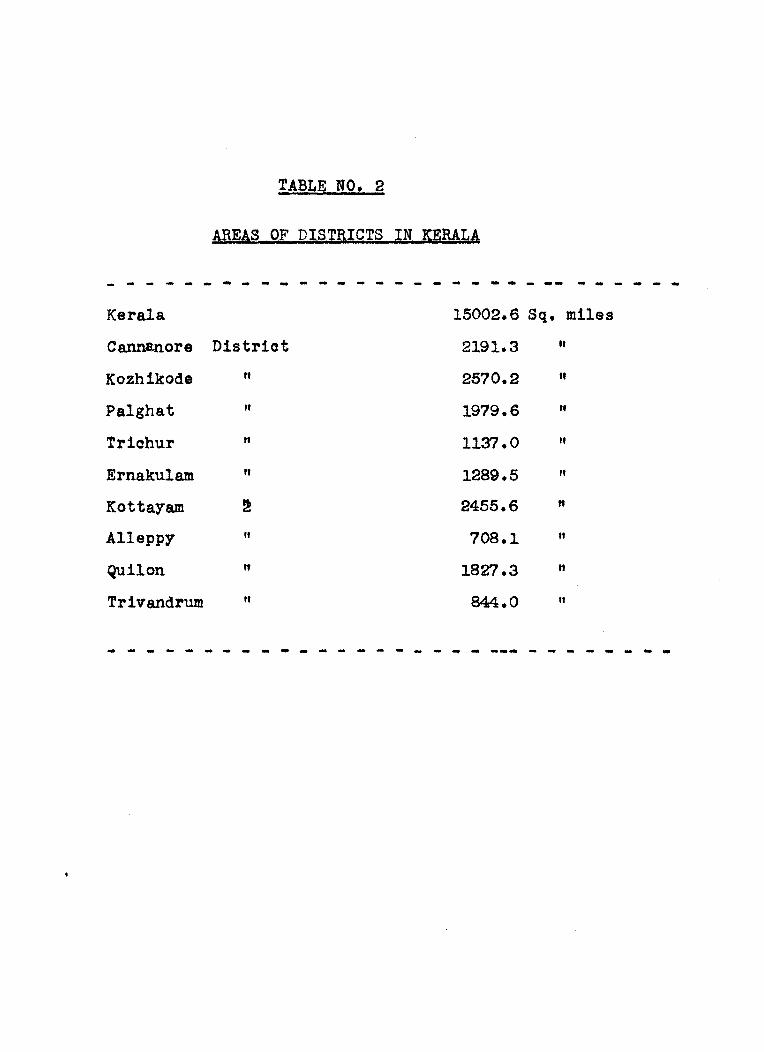
~ABLE NO.2
AREAS OF DISTRICTS IN KERALA
- - - - ~ - - ~ - - - -- ~ - - - - -- - -- - - - - - -Kera1a 15002.6 Sq. miles
Cannanore Distriot 2191.3 tt
Kozhikode " 2570.2 It
Pa1ghat It 1979.6 It
Triohur It 1137.0 " Ernaku1am " 1289.5 " Kottayam 2 2455.6 " Al1eppy " 708.1 It
Qui10n " 1827.3 " Trivandrum " 844.0 tt
- - - - - -- - - - - ~ - - - ~ ~ - -- -~~ - - - - - - ~ ~

last
TABLE NO.3
RIVERS OF KERALA
- - - - - - - - - - - - - - - - - - - - - ... - - - ---River
Total Length in miles catchment/
drainage in sq. miles
Total annual run-off
in m.cft.
------ - - ~ - - -- - - - - - - - - - - - ~ -Manjeshwar Oppa1a Shr1ya Kumb1a Mogra1 Chandrag1ri Ka1nad Baka1 Chittari Ni1eshwar Karingote Kavv8.Y'i Perlmamba Ramapuram Kuppam Va1apattanam Anjarakandy Te11icherry (Ponna-
yam) Mahe Murat (Kuttiyadi) Korapuzha Ka11ayi Beyp6te (Cha1iyar) Kada1undy Pooraparamba Tirur Bharathapuzha Keacheri Karuvannuur Cha1akudY Periyar Muvattupuzha Meenachi1 Manima1a Pamba Achankoi1 Ka11ada Ithikkara Vamanapuram
(Attinga1) Karamana Nerrar
Flowing Rivers Kabbani Bhavani Pambar
10 31 38 &t
21 65
5
1~ 29 40 14 25 12 44 70 40
18 34 46 25 14
105 81
5 30
156 m 30 90
142 75 42 B7
110 80 75 35
50 42 35
14 C 93 D
218 D 10 D 47 D
482 C 6 D
101 D 31 D 74 D
230 D 32 C
110 D 13 C
207 D 460 D 43t c 24 C 90 D
166- 0 232 D ~ 37 C 1085 D 430 C
9 11 55C
2100 D 98 D
320 D 536 D
2040 D 588D 456 D 310 D 763 C 446 a 600 C moa
336 D 250 D 191 D
762 a 220 C 148 D
3000 20000 43000
2100 9150
110200 1300 2040 7000
16500 50360
6870 23600
2790 44700 97700
8700
4300 18200 46980 25500 7200
185000 77300
1560 9500
311800 16000 42000
100000 378200
93680 96270 72570
222800 76000 76000 42000
52000 38750 29600
145000 27000 84000

fABLE 10.
THE DECEJJNlAL VABIA.TION 11 POPULATIOI IS AS GIVEN BELOW: d
R!oa4- Pergent,,_ of deoennlal Varlation
1881 - 91 + 11.5.,
1891 - 1901 + 9.84
1901 - 11 + 11.75
1911 - 21 + 9.16
1921 - " + 21.85
19" - 41 + 16.04
1941 - 51 + 22.82
1951 - 61 + 24.76
-~ .. ----.---- ----------- • i ___ - .. _-------- ... - -

T.t.JLE BO.6
tiE POPt1LAfIOI' IN lBlWtA nOM ,," '0 '261
lYE h,!!l!j1oa
18" 2,"',996 Per.on
1875 5,059,959 .. 1881 5,219,141 .. .1891 5,82',181 .. 1901 6,396,262 .. 1911 7,147,673 .. 1921 7,802,127 tt
1931 9,507,050 .. 1941 11,0" ,541 .. 1951 ",549,118 .. 1961 16.90',115 .. ., - ... -----.---................ -- .. ---- .............. _... -...... _- ... ----
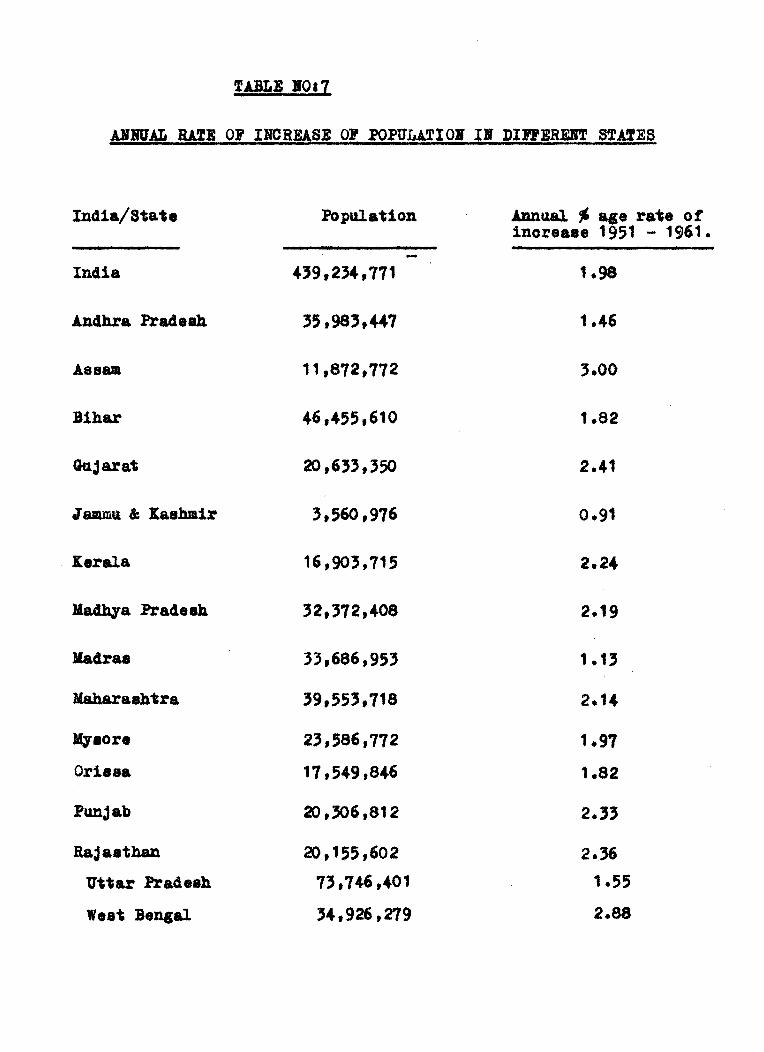
ABln1AL IU.!) OF lEREAS) 07 POPULATIOI II' DlPJ'IREft STAtES
India/State Population Alml18l. ~ .. e rate of increase 1951 - 1961.
India 439,2}4.,771 1.98
Andhra Pradesh 35,983,447 1.46
AsaaJI 11,872,772 '.00
Bihar 46,455,610 1.82
Gujarat 20,63',350 2.41
Jammtl & Xasbmil' 3,560,976 0.91
I:el'ala 16,903,715 2.24
!f.a.dhya Pradeeh 32,372,408 2.19
!f.adra8 33,686,953 1.13
Maharashtra 39,553,718 2.14
14801'. 23,586,772 1.97
Ori8sa 17,549,846 1.82
Punjal:» 20 ,306 ,812 2.'3
Rajasthan 20,155,602 2.36 Uttar Pradesh 73,746,401 1.55
West Beneal '4.926 ,279 2.88

TAiLE 10.8
DEBSITY OF POP!lkATIOIl IN ,mALA - 18"-1961
Year .0. of persona Per· Sq.M1le Per Sq.Km.
1836 176 68
1875 "7 1'0
1881 '48 1'4
1891 '88 150
1901 426 165
1911 476 184
1921 520 201
19'1 "4 245
1941 7'5 284
1951 go, '49
1961 1127 4'5
-'-'.. -----.--... ~--~-----... --~-..... ----.------.. --..

TABLE 10110
PROPJIITT OJ' POPULJrION IN KERALA
Proximity
Year - in metre, in yards.
18" "0.47 142.68
1875 94.17 102.99
1881 92.72 101.40
1891 87.78 96.00
1901 83.75 91.59
1911 79.2' 86.65
1921 75.8, 82.93
19" 68.70 75.1,
1941 ".77 '9.74
1951 57.55 62.94
1961 51.52 56.34

PEa OMI!, AlE! ,01 hAlfD .. 18"-1961
Year Per oaplia area
111 &Or ••
1836 3.64 1.47
1875 1.90 0.77
1881 1.84 0.74
1891 1.'5 0.67
1901 1.50 0.61
1911 1.3' 0.5'
1921 1.23 0.,0
19" 1.01 0.41
1941 0.87 0." 1957 0.71 0.29
1961 0.57 0.2'
.. _-_ ... ----....... ~-....-. .. ----... -----.-..--------~-- ..... ....

f.A.Bl'.rB 10 I
AgIA AND POpYLA±IOB BY IATUgAH DIVISIOI-196'
Percent ... of .at~al d1vision &l"a. popalatlon
-
48." ".79
Mid land 41.21
Low land 10."
Ba of per.one per st. 1IUa
"9
16"
2946
.. ow.- .--. ........ _-... __ ••• _ .. _ •• ,., ______ .. _ .... ______ ... ___ .. _____ 1,,_-,_ .1 •• _ ..... ------.. ~ ............... -------....... -........... - ... -- ... --........ --............ - . __ ...... -. --~-
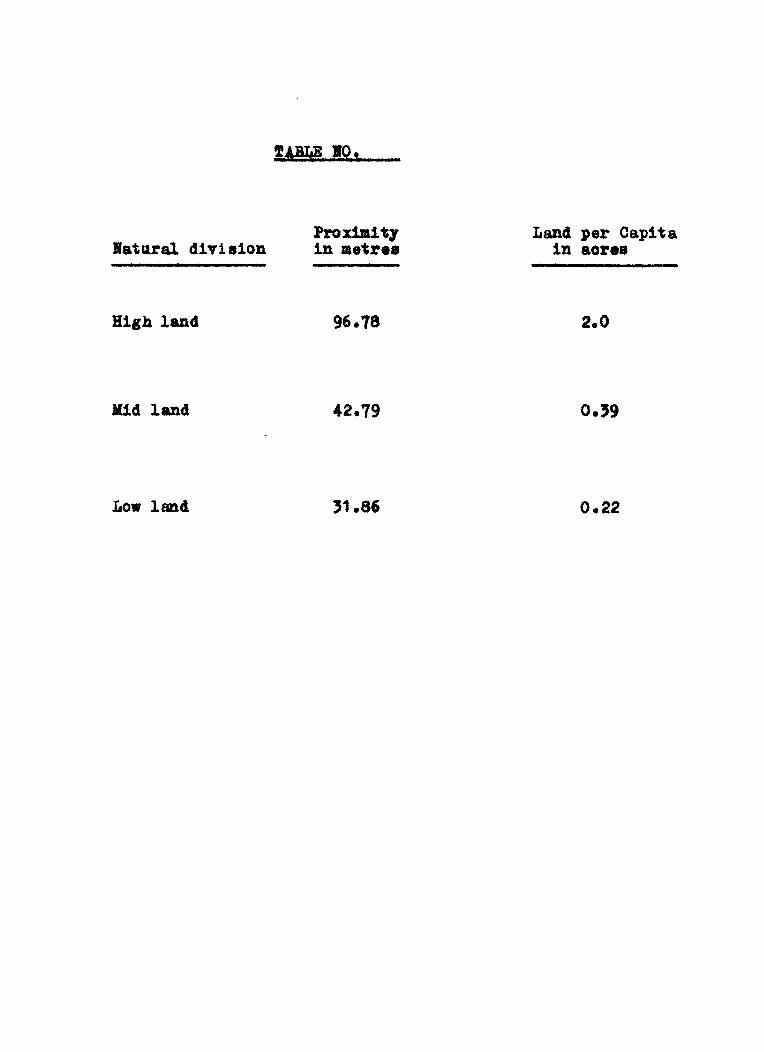
latRral d1vi.1on
HiSh land
tie! lane!
Low lancl
!ABLB lIO.
Prox1mitl in lIetre.
96.78
42.79
'1.86
Lancl per Oapita in aore.
2.0
0.22

TABLE 1'0&
SEX RATIO IN KERALA 129 1 - 1961
Year No. ot female./l000.ale. -1901 1004
1911 1008
1921 1011
19" 1022
1941 1027
1951 1028
1961 1022
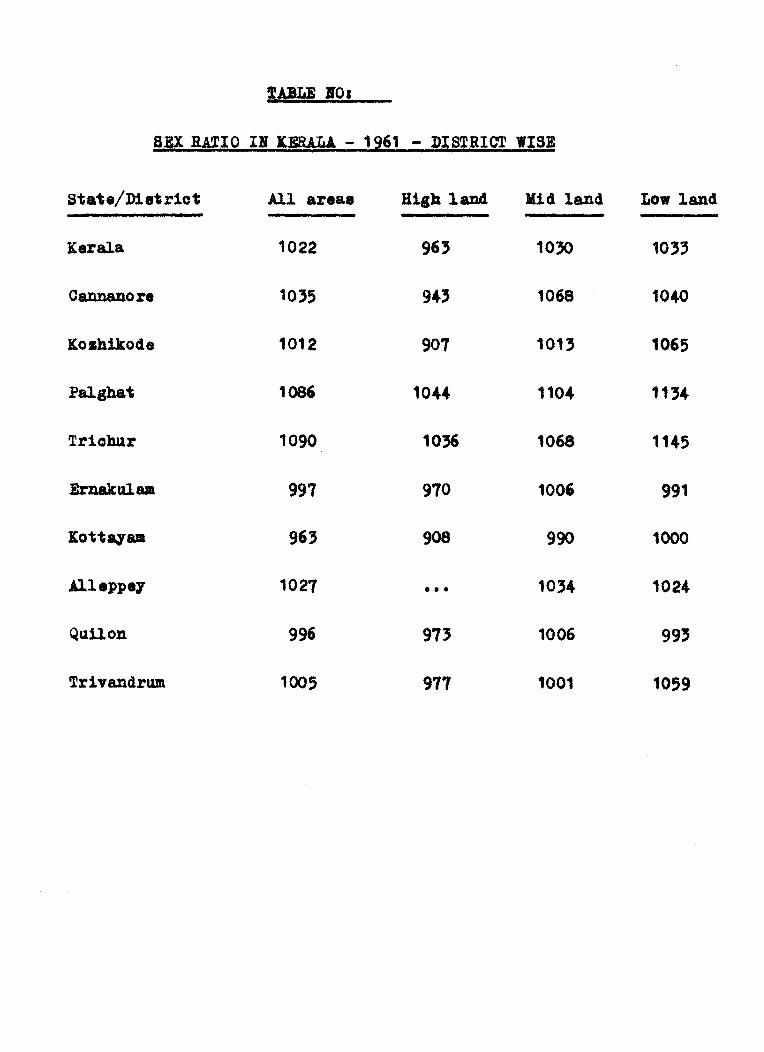
WLE .0.
SEX WIO II KERALA - '261 - DISTRICT WISE
Sta~./D1strict All areas Higb land Kid land Low land
Kerala 1022 9" 10:50 10"
Cannanore 10'5 94' 1068 1040
Xoshikode 1012 907 1013 1065
Pal gut 1086 1044 1104 1'"
Trichllr 1090 1036 1068 1145
Ernaltw.aa 997 970 1006 991
Xot~ay .. 96' 908 990 1000
Alleppey 1027 ••• '0'4 1024
QUUOll 996 97' 1006 99'
Triv&J1drum 1005 977 1001 1059
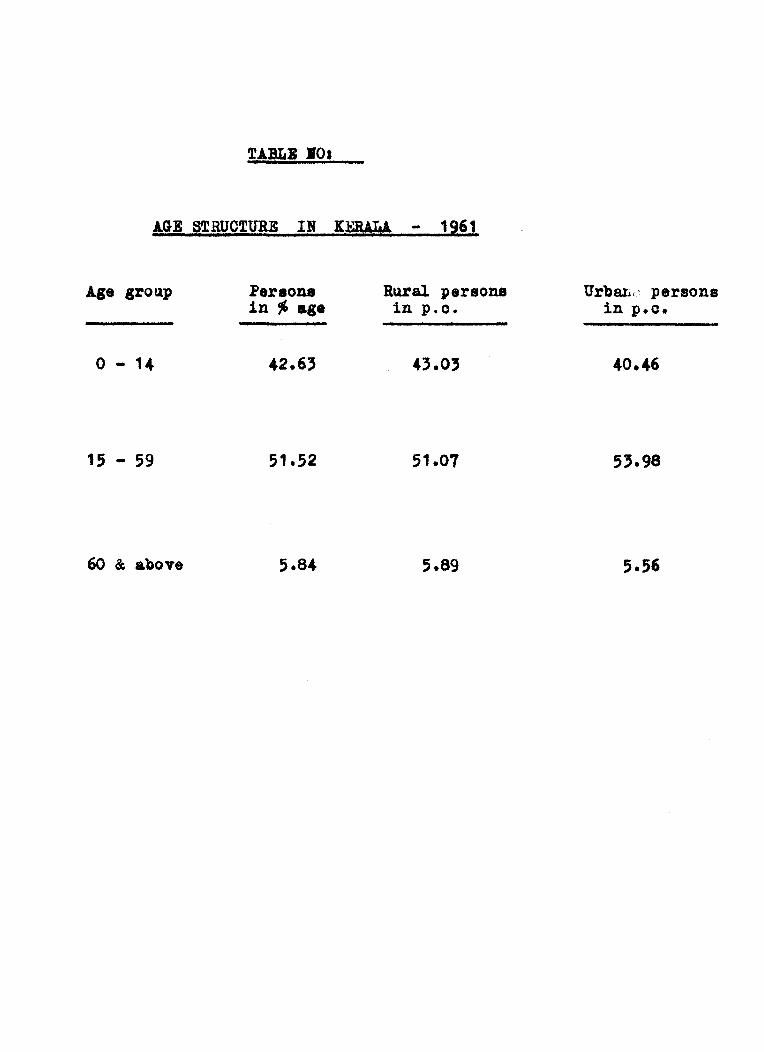
.AGE STRUCTURE IN KERALA - 1961
.Ase srotJ.p
o - 14
15 - 59
60 &; above
Peraona in ~ as.
42.6'
51.52
RtJ.ral persons in p.o.
51.07
5.89
Urb8l.i.,~ persona in p.o.
40.46

Ages 0,1,2,' & 4
5-9 and 10-14
15-19 to '0-'4
'5-'9 to 45-49 -
65-69
70 + -
lemalea les8 than malea - fll1ctuating.
lea8 than malea but progressively inoreasing.
Hiper than malea progressively inoreasing I1pto 25-29.
less than male. - steadily decreasing.
Higher than males - progressively increa.iq.
Higher than males.
" " •

TABLE .0,
LANGUAGE SPOXE' IN XERALA
Langa8.&<; Ifo./100oo of total populat1on
1961 1951
.E~aya1. am 9595 9541
Te.:a1l 26' 29'
Hind 1 2 2
ICannada '5 " Telluga 22 27
Xonkani 20 26
Karath1 11 14
Gajerat1 Nil 1
Others 52 6'

NO. 18.
CAP,\CrfV TO UNI}}<~T'S'h\ND ENGLISH.
stnte!nlst riot
Kerala
Cannanore
Kozhlkorte
Triohur.
l~rnllkula.m
Kott ayam
Alleppey
Qul10n
Trl \"ftn druDl
•• •• J
No. of parsons speFlkJ.!1[y l:nr. 1lsh/
10000 MRlayalam s~cnkinr populat ion.
398
261
209
281
423
481
520
543
526.

TABLE lIO:
PERCP!AGE GROWTH OF DIJ'FERENT OAf!IH
Decade/Period General Popln. Growth of Growth of Growth of Growth Hindu.. Ohristians Muslims
1901 - 11 11.75 8.92 24.51 14."
1911 - 21 9.16 6.08 24.98 7.64
1921 - '1 21.85 19.20 '4.85 19.40
1931 - 41 16.04 11.25 21.98 15.99
1941 - 51 22.82 24.55 24.82 26.05
1951 - 61 24.76 2'.2' 26.95 27.05
1901 - 61 164.27 1 '5.17 305.77 17'.94

TABLE .lOs
Birth rat. Death rate Growth rat. Infant death rate
-stat. 8.'7 70.95
Rural 36 • 2
Urban ,1.,
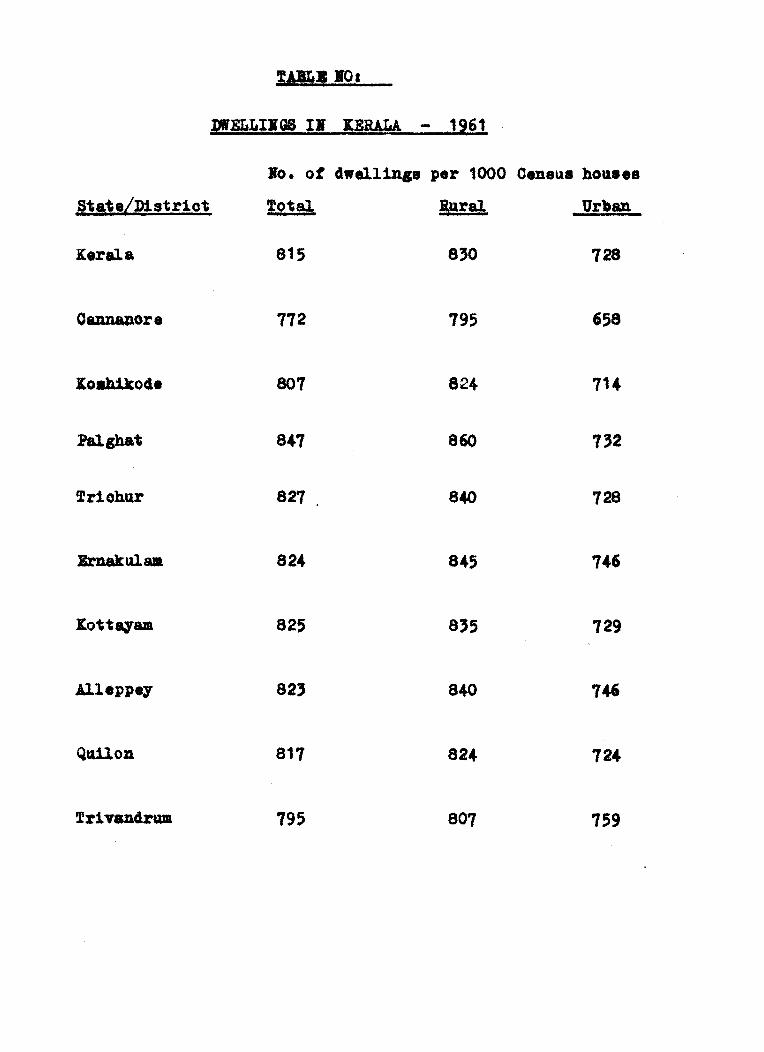
!AlLIIO.
])!ELLIIGS II' I.;gALA - 1~61
JJO. of clwell1np per 1000 Oen.tl. hOllse.
Siate/Di.trioi !foial Kllral Urban
Kerala 815 8'0 728
OunalJore 172 195 658
I.oahikocle 807 824 114
847 860 "2 !friohu 827 840 728
824 845 746
Xoiiqam 825 8', 729
.Alleppe;y 82' 840 746
Qtl1l0Jl 817 824 724
!frivandrwa 795 807 759

tpLB :10.
IPR'I BOLDS ,I 'IIAL! - 1 9"
State/Di8tr1ct 110. of oenS1l8 h01l8.holds per 1000 08118118 hollae
Total Rural Ur_an
Kerala 8" 844 758
797 817 699
:loshlkode 819 829 76'
869 88' 749
!rlohur 8'2 845 "'9
848
Kottqaa 846 749
.Al.l.ppel 854 .,62
QIlUon 826 8" 756
Trlvandrwa 83' 844 802

IOUSEHOLD DENSITY II XERALA - 1961 ....
State/District Persons/ho~.ehold
Total Rural Urban
Xerala 5.79 6.19
Caxmore 6.08
ltozhiltode 5.80 6. ·7'
Pal ghat
Triohur
6.01 6.16
Xottayam 5.65
Alleppel 5.66 5.61
Quilon 6.18
TrivandrWl

!'ABlE NO: aA
RURAL AND URBAN POPULATION
Populat.ion ~ age decade variatloD Year Rural Urban Rural Urban
1901 5941163
1911 6623012 624661 + 11.41 + 15.44
1921 "1155661 + 23.22
1931 8640102 866948
1941 9903140 1128401 + 14.62 + 38.16
1951 11951926 1591192 + 20.15 + '1.01
1961 2554141 + 20.00 + 60.52

TABLE NO:25
~~ON MIGRANTS IN RURAL AREAS OF KERALl-196l
State/District ~on migrants/lOOn rural population .......
Kerala 154
Cannanore 102
Kozhikode 153
Palghat 180
Trichur 734
Ernaklilaa 712
Kottaya. 628
Alleppey 804
Qllilon 181
Trivandru. 838

TABLE NO:26
IMMIGRANTS IN RURAL AREAS 0 .. KERALA-1961
state /Dllt ri ot ~lgrants/1000 rural population.
KeralA 112
C'annanore 191
Kozhikoo e 113
Pal,bat 112
Trlohur 203
Ernakulall 163
Kottayall 221
Alleppey 143
Quilon 162
Trlyandrwa llT

,ABlE MO: 2T
IMMIGRANTS FROM RURAL AREAS OF ONE DIS1.'RICT TO RURAL AREAS OF iWO"THER nI§iilRICT - 1961. ,
S'tate/Dlstriot Immigrants/1000 Rural population
Kerala
Cannanore 14
Kozhlkode 56
Pal&hat 20
Tl'lobur 35
Emakulu 41
Kottayaa 69
Alleppey 34
Qullon 45
Trlvandrtlll 11
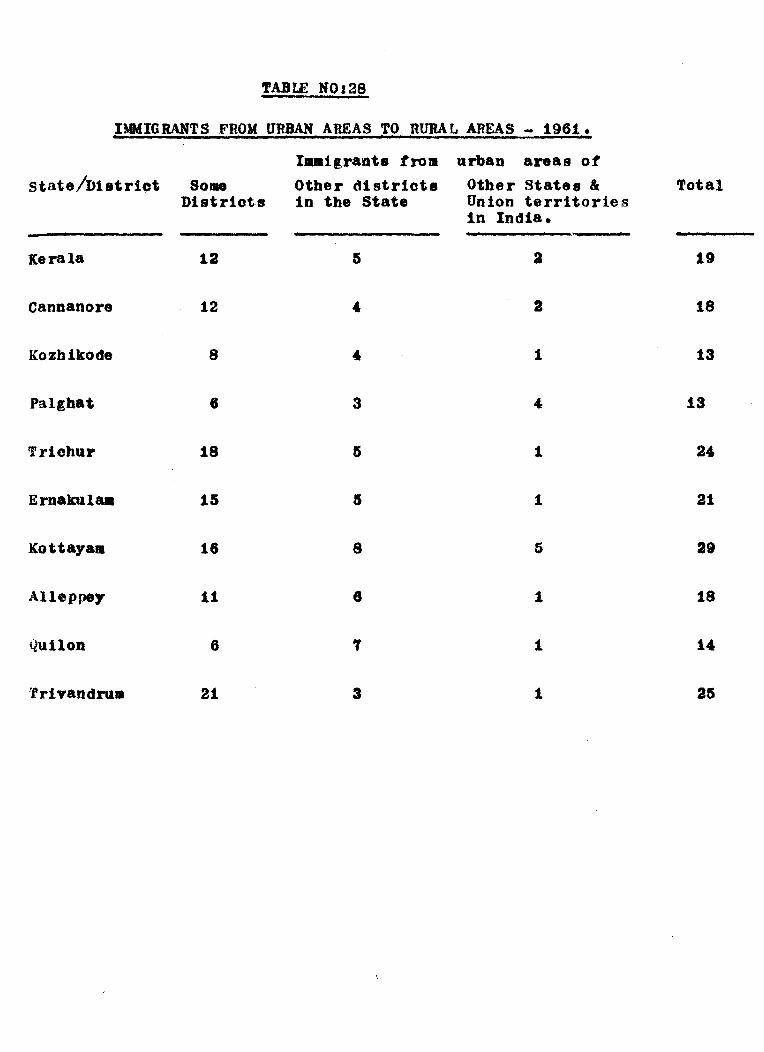
TABLE HOl2S
IMMIGRANTS FROM URBAN AREAS TO RURAL AREAS - 1961. -I_tlrants from urban areas of
state/Distriot So_ Other districts Other States & Total Districts in the State Union territories
In Indla.
Kerala 12 a 19
Cannanore 12 2 18
Kozblkode 8 1 13
Palghat 6 3 13
Trichur 18 1 24
Ernakal_ IS 1 21
Kottayaa 16 8 29
Alleppe)" 11 8 1 18
Quilon 6 T 1 14
'frlvandna.. 21 3 1 25

TABLE NOs29
Taluk
25~ below that ot the S tat.
Chirayinkil
Karuaaga pa lly
Ponnant
Neyyatinkara
Karthlgapally
Qutloa
Amba la pllzha
Trlvandrwa
Trlohllr
Shertalal
Kllnnathunacl
Mavellkara
Kottarakara
"
, ot atgranta to rural populat1on
11.85
13.52
13.14
15.02
15.83
15.95
15.91
16.12
16.24
IT .04
11.5T
18.26
18.29

Within 2~~ of that of the State
J-anganore 18.62 Ottapalam. 18.6' Coohin 19.21 Paru 19.22 Ohengamulr 20.10 .Alway_ 20.55 Ohowghat 20.78 Xanayannllr 21.2' Vaikoa 21.'9 KwmathlU' 21.82 .edwraangad 21.95 Cannanore 22." Perinthalmarma 22.41 Talapp11l1 22.59 Th1ruvalla 2'.20 Hosdrug 2'.21 Ernad 2,.67 Xozh1kode 2'.72 Qu11anq 24.69 Kottqaa 25.02 Badagara 25.11 Pal ghat 25.16 Alathur 25.94 Ohanganaohery 25.94 Muvattupuzha 26.'7 lCasaragod 26.85 Kuttanad 27.07 Alemaoh1l 27.91 KL1k:undapuram 28.09 Oh1ttlU' 28.20

25" abo"ftt that of the State
Pathanapl1ram 31.35
Tellioherry 3'.87
Pathanamthitta 31.92
Trtchl1r 33.57
Thodt.tpl1Bha 34.58
T &lip araba 35.56
Kanjirap&lly 41.02
North Wynad 42.78
SOl1th Wynad 50.90
Devicolam 52.97
Peert.tmade 56.50
Udumbanchola 84.09
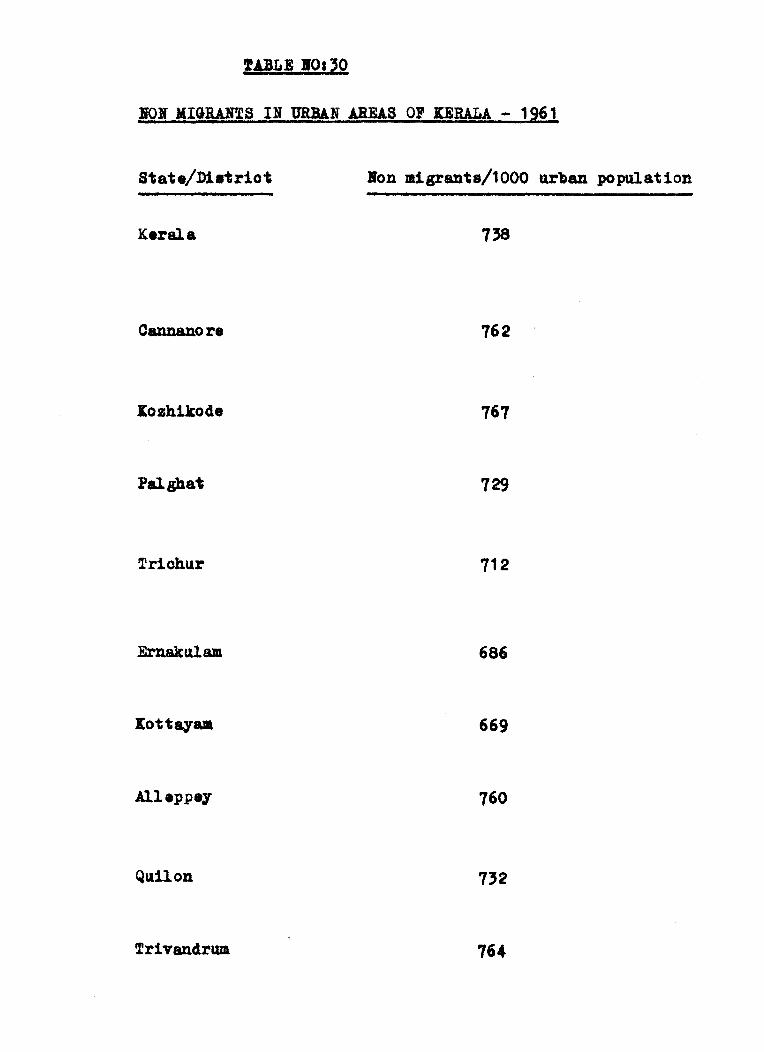
!jl!LE .0.,0
1:0. MIGRAH~S IN trRBAN AREAS OP DRALA - 1261
State/District Bon aigrants/1000 ttrban population
Kerala 738
Oannanore 762
:to zhllto de 767
Palgha" 729
Trlchllr 712
686
Xottayaa 669
Alleppey 760
Q1l11on 732
Trlvandrum 764

!ABLE .0:31
IDIGB.AI!S II T1lllWI' AUAS lRQII THE SAME DISTRICT 0' I:ER4LA - 1961
State/metr1ot Imm1grants/1000 urban populat1on
x: eral a 121
Cannanore 104
1:0 zh1ko de 115
Pal ghat 150
Tr1char 170
116
I:ottayam 163
Alleppe1 129
Qu.110n 111
Tr1vandrwll 90

fABLE IO: '2
IWIIGlWf.rS IN UlUWf AREAS PROM OTHER DISTRICTS Ili URALA-1961
State/Di8trlot
X.rala
Oannanore
Xo.bikod.
Pal ghat
Tr1chur
Ernak 111811
)[ottqam
QI1110n
Trlvandrwa
Immigrant. per 1000 uban popl1latlon
48
'6
'5
49
70
95
45
57
41

;pt(MIQIWfTS III URBAN AREAS OF KERALA. - 1961.
st at e/D1stri ot Immigrants from u.rban areas of
Some Other distriots Other States and distriot in the state Union Territories Tot a 1
in India
Kerala 29 12 79
Cannanore 65 20 13 98
Kozhikode 41 23 ,. 74
Palghat 22 29 19 70
Triohu.r 32 25 7 64
Ernakul811 47 45 17 109
Kottqam 35 5 66
Alleppey 23 '1 5 59
Qu,11on 25 41 13 79
Trivandrwa 34 23 16 7"
~II!LIOGRAPHY
1. Gutkind, E.A. :
2. I Sard, Walter :
3. Fisher, Jack, C.
4. F.tiedman, J &: Alonso, W.
"International History of City Development", Vol. I, Urban development in Central Europe, Vol. II, Urban development in the Alpine and Scandinavian countries, and Vol. IIIl Urban development in Southern Burope, Spa n and Por~ugal, The free Press, New York I Macmillan Ltd., London 1967.
"Methods of Regional Analysis" : An Introduction to Regional Science, Philadelphia; The Technology Press of the M. I.I. & John Wiley and Sons, Inc. New York London, 1960.
Yugoslavia - A multinational State -Regional dif.ference and administrative response", Cornell University, Chandlier publishing company, California, 1966.
"Regional Development and Planning" M.I.I. Press, Massachusetts, Institute of Technology, Cambridge, Massachusetts, 1965.
5. Dickinson, Robert, E. "City, Region and Regionalism", London, Routledge and Kegan Paul, 1952.
6. Humlum, Johannes : "Land Planning Problems" - A Proposal for co·.ordinnted Danish country and regional programme with a national zone pla~; University of !rchus, Munksgards Forlas, Kobenhaven, 1966.
7. Prot. Tinbergen, J. I "Essays on regional and world Planning" Paper 18, National Council of Applied Economic Research, New Delhi, 1966.
8. Hilber Siemer, L. I "The Na1n re of Cities ft, Chicago, Paul Theobald & Co, 1950.
9. Hilber Siemer, L. I "A New Regional Pattern", Chicago, Paul Theobald & Co, 1954.
10. Turner, Roy (Ed) : "India's Urban future", Berkely I California University Press, 1962.
11. Richard, Nelson, L. : "The Selection of retail locations It, F.N. DOdge Corporation, New York, 1958.

12. Miller, Marshal, J. I "New life for cities" around the World", California University Press, 1962.
13. Gutkind, E.A. : "Revolution of Envlronment", London, Kagan, Paul, London 1946.
14. Brayne, F.L. I "Better Vlllages", Madras, OXford University Press, 1937.
15. Slater, (Ed.) : IISome South Indian Vl1lages", Madras, University of Madras, 1937 •
• "iTillage settlements of Delhi &: Punjab", Melbourne University, School of Architecture, 1965.
17. Sharp, Thomas : "A.1"la.tomy of Villa.ges ", Harmonds W'orth Hiddlesex, 1946.
18. Marricott Mckim I "Village India It, The University ot Chicago Press, Chicago, 1955.
19. Innes &: Evans : "Madras District Gazetteers" - Malabar, Madras, Govarnmant or 14adras, 1951.
20. Logan, W'. I "Malabar Manual rt, Madras, Government of Madras, 1951.
21. Nagamayyar : "The Tr.:rrancore state Manual ", Trivandrum, Government of Travancore, 1940.
22. Menon, Padmanabha,K.P. : "History of Kerala", - Coohin, Choohin Government press, 1937.
23. Pi1lai, Velu : "The Travancore state Manual", Trivandrum Government of Travancore, 1940.
24. Sreenivas, H.S. (Ed.) "Indian Villages", Madras, 1952.
25. Mumford, Lewis, I "Culture of oities" - Beaker &: Warberg 1946.
26. Pisher, Jaek, (Ed.) : nCity and Regional Planning in Poland, New York, Cornell University Press, 1966.
27. Rev. Samuel, Mathan, P.L.S. : "The Land ot Charity - A Deseriptive aecount of Travancore and its people", London, John Snow & Co., 1871.
1. Devassy, M.K.
2. "
3. It
4. tt
5. "
REPORTS
I "Census of India", 1361, Volume VII, Kerala, Part I A (i1) General Report, Delh1, 11anager of Publication~, 1961.
I Census of India", 1961, Vol. VII, Kerala Village Survey Monogl·aphes of Travandrum. Quilon, Alleppey, Kottaym, Ernakulam , Triohur, Palghat
1 Kozhikode, and Cannanore
Distriots # Delh , Manager of Publications, 1961.
I "Census of India", 1961, Vol. VIII Kerala. District Census Handbooks for Tr vandrum QUilon, Alleppy, Kottayam, Ernakulam Trlchur, Palghat, Kozhikode, and Cannan ore Districts; Delhi, Manager of Publications.
* Census of India, Vol. VII, Karala s Report on Rousing Establishments and Housing ap,d Esta.b11shment Tables: Delh1, Hanager of Publications, 19M.
:
6. Government of Karala I Administrative and other Reports
7. It
/8. n
9. "
10. tt
of all Depa~tments in Government of ~erala, from 1951 to 1966; Trivandrum, Govornment ~ress, (respective years).
J Statistlcf.J.l abstracts of StatlstlfJs Department, Trivandrum.
I Labour and Industries Reviews : (QUarterly) Trivandrum, Government Press, 195~ to 1966.
: First, Second, and third Five Year Plans and Draft report of' Fourth Plan.
a "An Economio Rev1ev tt , 1961 to t 66, Trivandrum, Government Dress.

UNPUBLISIUijD THESIS OF SCHOOL Of PLANNING AND ARCH ITECTT.IDE. NPf D~UU
1. Varghese, Mathew : "Cochin and Ernakulam Towns" - A Planning study, 1960.
2. Ganapathy, K. : ttTrivandrum City, A Planning study", 1961.
3. Poulose, Thomas : KdU~al1Tl.Town - an Outline Development Plan, 1963.
4. Thomas C.K. I QUilon Town - An outLtne Development Plan, 1963.
5. Malietkal Josepr.. : HCochill and its env1ron(3" - An Outline Development Porposals, 1964.
6. Varghese Kuruvilla I A future urban pattern for Alleppy J 1964.
7. Stan1W D.
8. John v.r.
, Structure of Rural settle~ents in Kerala, 1964.
: Inland water transport in Kerala, 1965.
9. Alexander Joseph, K. , Linear Development in Kerala, 1966.
,10. Pillai, Shunmugham, P .K. : Rural urban knots in Kerala. 1966.
11. Philip, Mathew, I A fishing village in Kcralu, 1966.
SEMIN~ PAP~EQ §; 0XUER PAPEIG &: JOURHAU!
1. Government of Kerala : Seminar on Fourth Five Year Plan, Trivandrum, Government press, 1964.
2. iCUrup R.S. and Population gro\"th in Kerala, Trivandrmn, George K.A. (Eds.) Government Press, 1966.
3. United Yations : (ECAFE)
Seminar on Planning tor urban and Regional De"{elopmen t, N8goya, Secretariat of ECAFE, 1966.
4. Menon, Kesava, K.P. (ed.) "Mathrubhoomi Panchavalsara Pathippu tt (r-ralayalam)! Erlla.kulam, Hathrubhoomi Printing & Pub ishing CompanY, 1966.

5. Jaromier stran :
6. Janaki V.A.
"An experimental model of a system of Central Towns and cities", Czeohoslova!<;:ia It, Ekistlc ";, The Athen~ Publishing Centre, Athens, 1967, Harch.
"Geographical hasis ror tho Distribution of Rural settlel'lents in Kerala." - Baroda Journa.l of ~~.S. UniverSity Vol. II, No.2, October 1963.
7. Government of India: "All Inrtia Economic Conference for Kerala," Papers read in that Seminar - 1966.
8. Jayachandran, T.N. : "Report or. consolidation of holdings", Tri ~landrum 40 Board of Rvenue - 1962.
9. Pillai, KunJan, Suranad : Journal of Kerala, University Oriental ~anuscrlpts Library, Vol IX 'rJo. 3, John Snow a'1d Co,. London 1371.
10. Pillai, V.R.
11. Taneja K.O.
: "Land Reforms in Travllnoore Cochin ", Indian Journal of Eoonomics, 1;)49.
: ItGro·..rth of population in India - 1960-61 Economic t-Ieakly, '101 XVI No. 36, 37.
12. Illustrated Weekly a Accent on Kera1a, September 12, 19, 1965.
13. Rao M.S .A. s "Social Changes in Kerala, Sooiologieal Eulletin, Vol. 2, No.2, 1953.
14. Dr. Eichi Isomura : "Urbcmis8.t1on in Japan tt, Delhi, U.N. Seminar
Paper t 1360.
15. National Council of Applied Economio Research : Market Towns and spatial development in India l New Delhi, 1965.
16. Berry, J.t.
17. Lewis John, P.
18. Gopal Bhargava
: Policy a~d Implioations of an urban location model for the Kanpur Region, Kanpur, Secretariat of Kanpur Seminar, 1:367.
s Industrial and urban development in Kanpur region, Kanpur, Secretariat of Kanpur Seminar, l~67.
I Rural-urban dimensional planning for India I Khadi Gramodyog, Bombay, Khadi and Village Industries Commission 1967.