towards understanding of human settlement growth in …. full coverage began ... classification of...
TRANSCRIPT

Towards understanding of human settlement growth in South Africa
Naledzani Mudau, Thomas Tsoeleng, Morwapula MashalaneHuman Planet Iniatiative, University of Twente, Enschede,
12-15 September 2017
In South Africa, urbanisation has increased from 52% in 1990 to 62% in 2011 (South African Institute of Race Relations, 2013)
Urbanisation in South Africa is attributed to abolishment of apartheid pass laws, rural-urban migration and natural population growth
Urbanisation in South Africa results in urban sprawl , proliferation of informal settlements and inequality
Effective and Sustainable urban planning
Mapping and monitoring of human settlement developments
Introduction
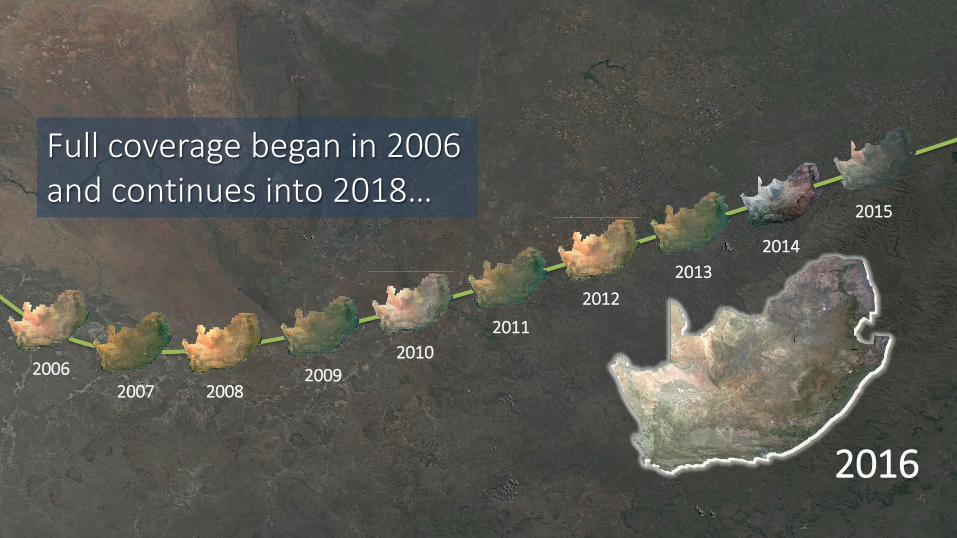
20072006
2008
20102009
20112012
20132014
2015
2016
Full coverage began in 2006 and continues into 2018…
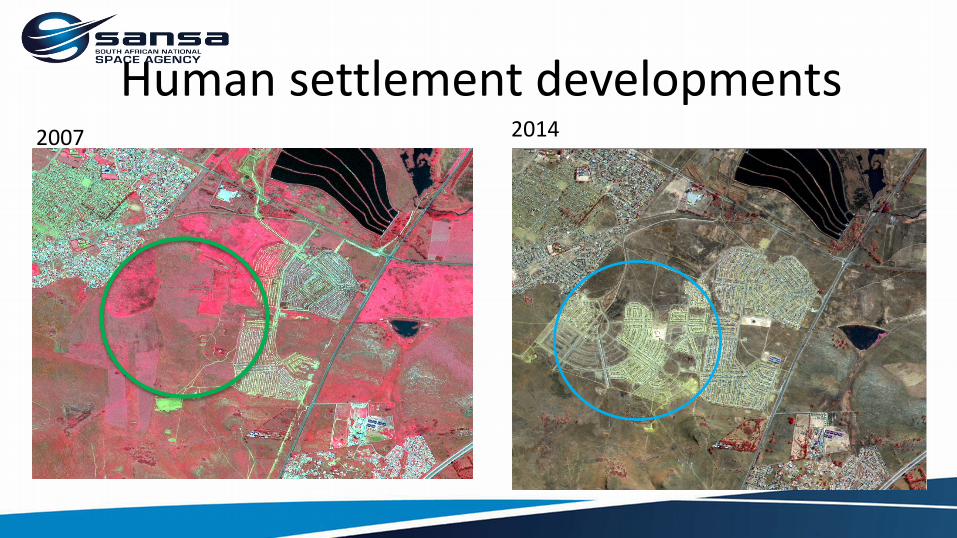
Human settlement developments2007 2014
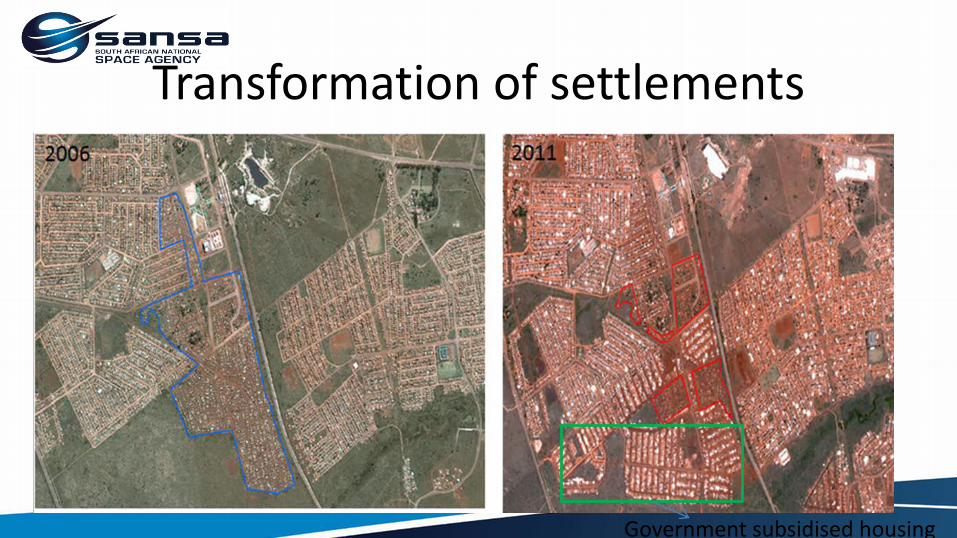
Transformation of settlements
Government subsidised housing
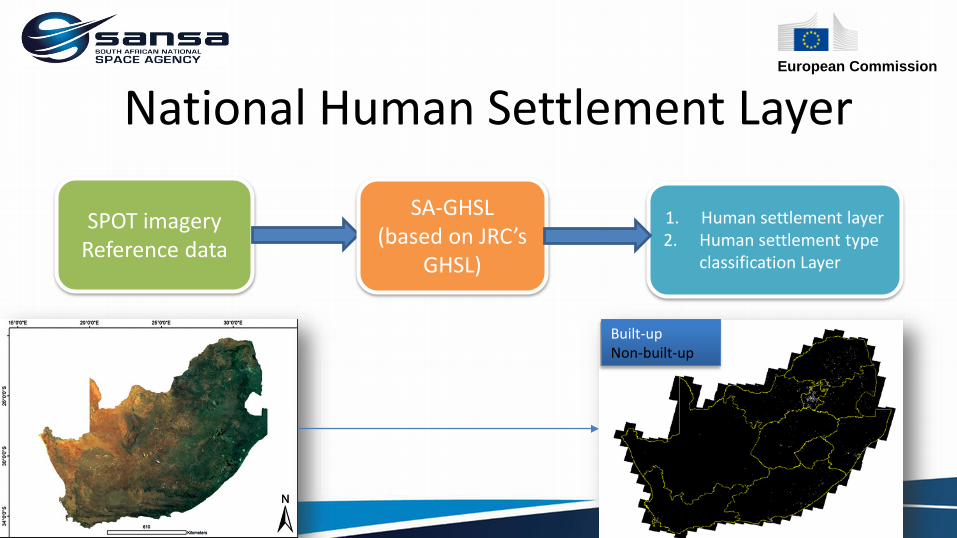
National Human Settlement Layer
SPOT imageryReference data
SA-GHSL(based on JRC’s
GHSL)
1. Human settlement layer2. Human settlement type
classification Layer
Built-upNon-built-up
European Commission
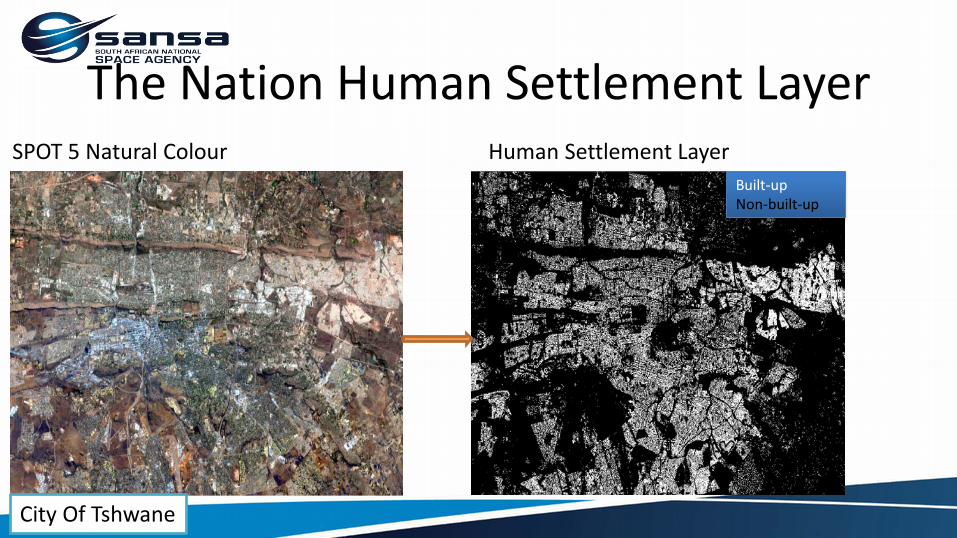
The Nation Human Settlement LayerSPOT 5 Natural Colour Human Settlement Layer
City Of Tshwane
Built-upNon-built-up
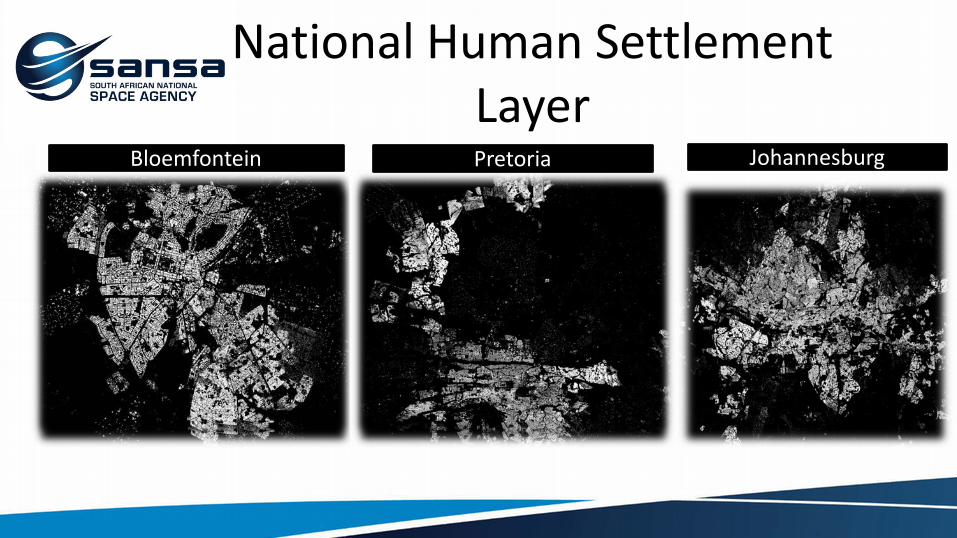
National Human Settlement Layer
Bloemfontein Pretoria Johannesburg
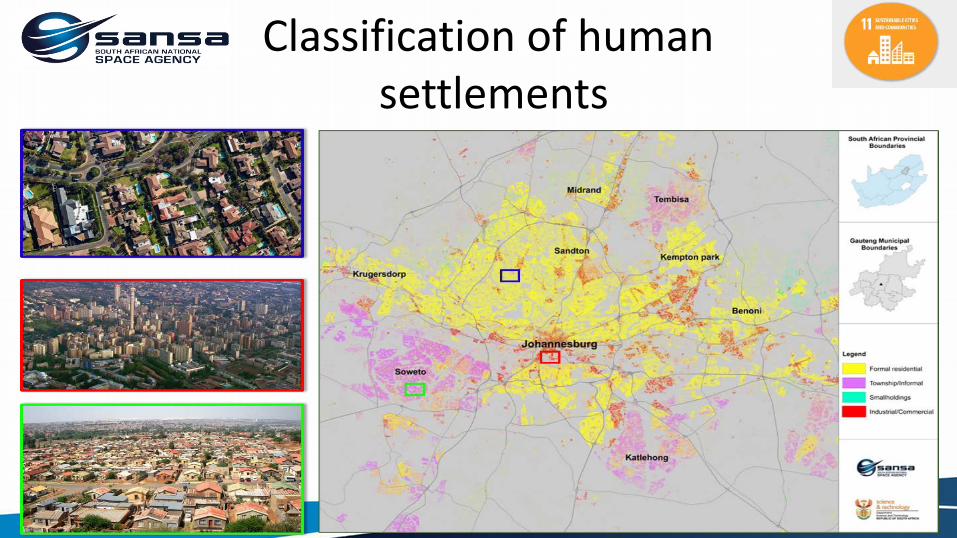
Classification of humansettlements
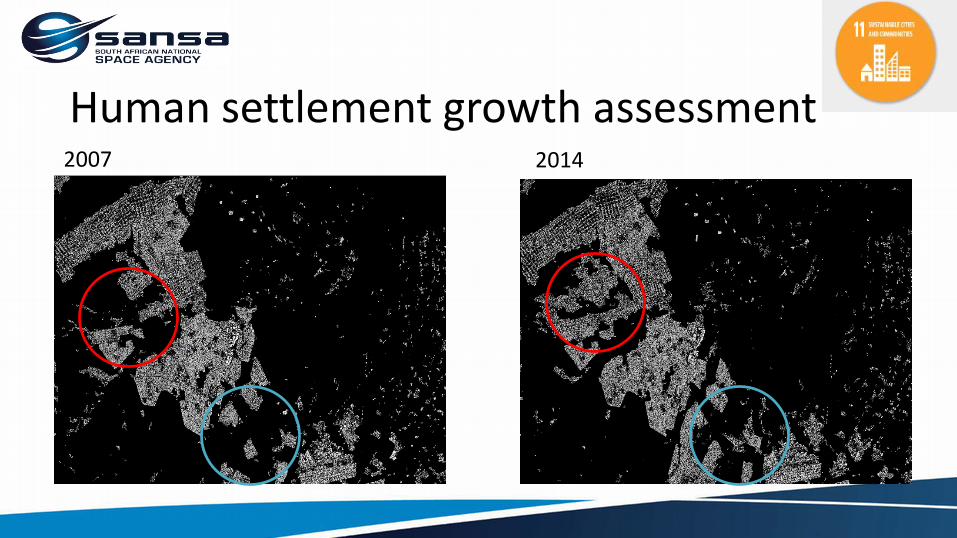
Human settlement growth assessment 2007 2014
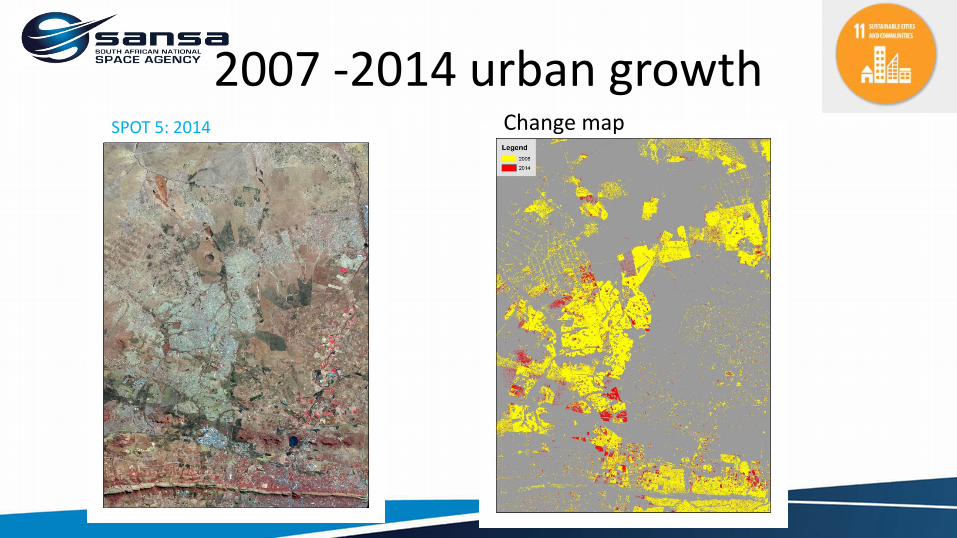
2007 -2014 urban growthSPOT 5: 2014 Change map
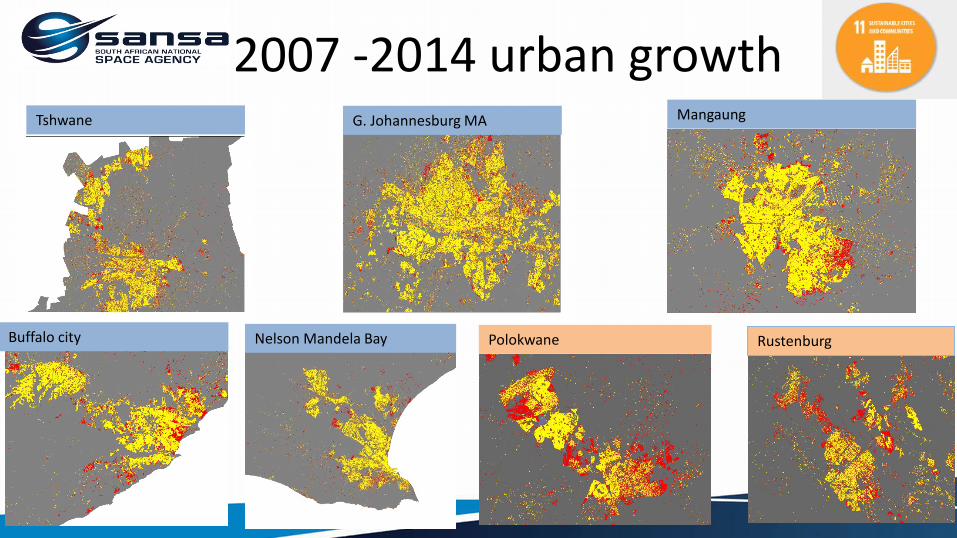
2007 -2014 urban growthTshwane G. Johannesburg MA Mangaung
RustenburgPolokwaneBuffalo city Nelson Mandela Bay
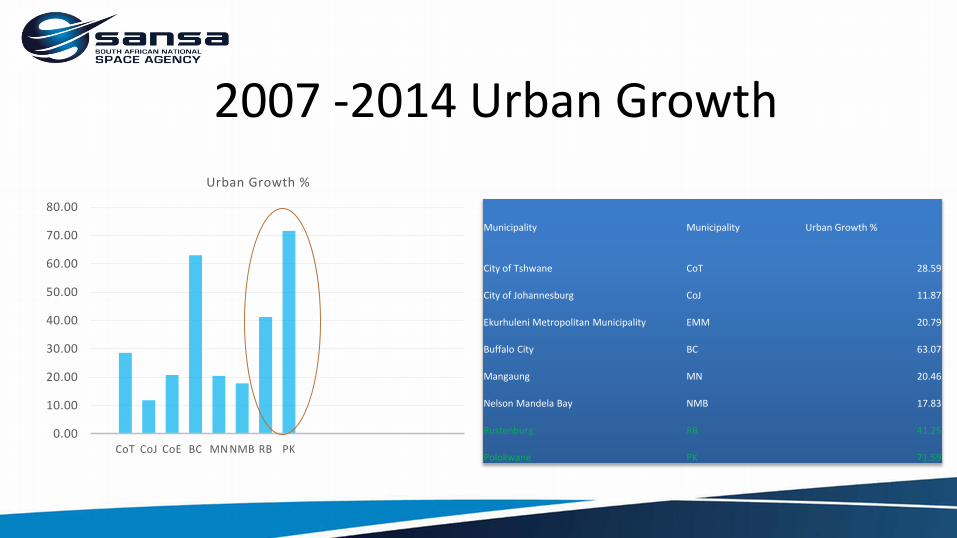
2007 -2014 Urban Growth
Municipality Municipality Urban Growth %
City of Tshwane CoT 28.59
City of Johannesburg CoJ 11.87
Ekurhuleni Metropolitan Municipality EMM 20.79
Buffalo City BC 63.07
Mangaung MN 20.46
Nelson Mandela Bay NMB 17.83
Rustenburg RB 41.25
Polokwane PK 71.59
0.00
10.00
20.00
30.00
40.00
50.00
60.00
70.00
80.00
CoT CoJ CoE BC MN NMB RB PK
Urban Growth %
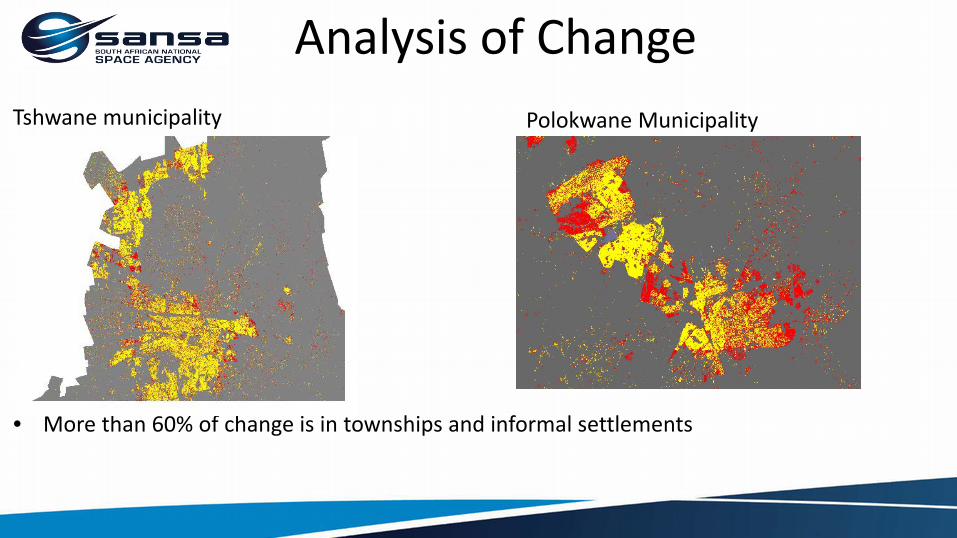
Analysis of ChangeTshwane municipality
• More than 60% of change is in townships and informal settlements
Polokwane Municipality
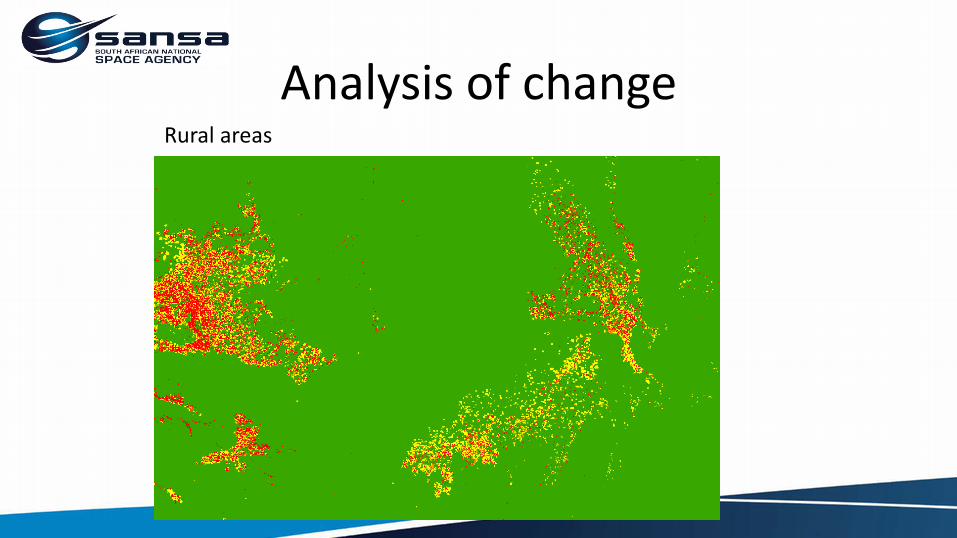
Analysis of changeRural areas
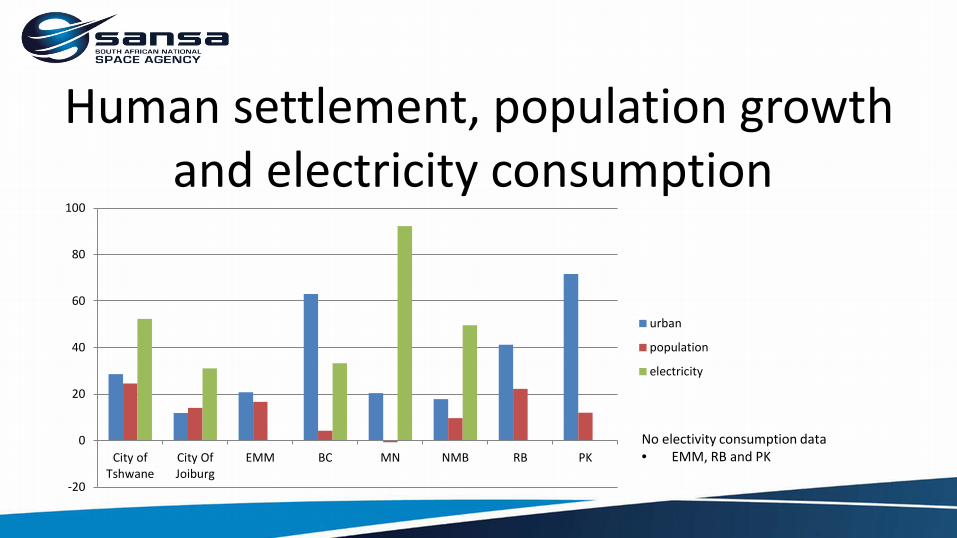
Human settlement, population growth and electricity consumption
-20
0
20
40
60
80
100
City ofTshwane
City OfJoiburg
EMM BC MN NMB RB PK
urban
population
electricity
No electivity consumption data• EMM, RB and PK
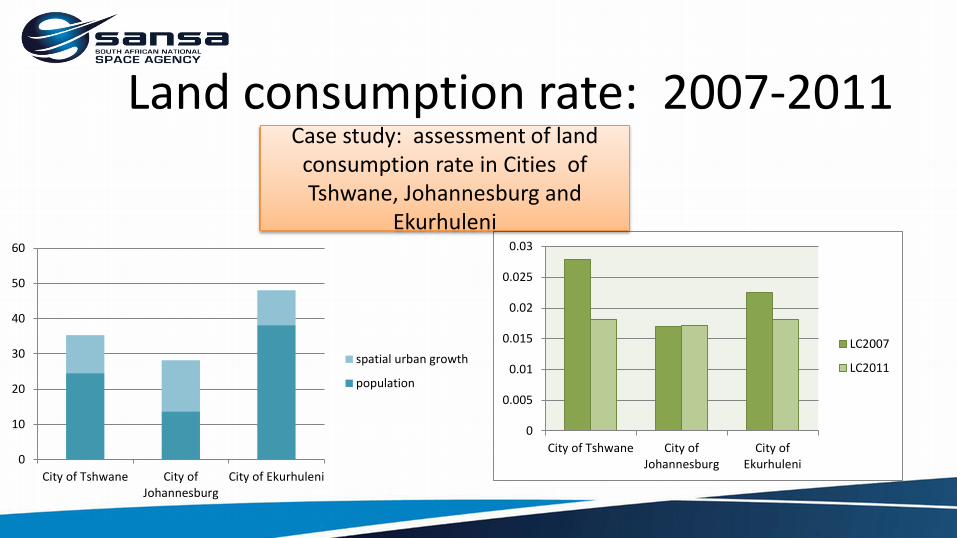
Land consumption rate: 2007-2011
0
10
20
30
40
50
60
City of Tshwane City ofJohannesburg
City of Ekurhuleni
spatial urban growth
population
0
0.005
0.01
0.015
0.02
0.025
0.03
City of Tshwane City ofJohannesburg
City ofEkurhuleni
LC2007
LC2011
Case study: assessment of land consumption rate in Cities of Tshwane, Johannesburg and
Ekurhuleni
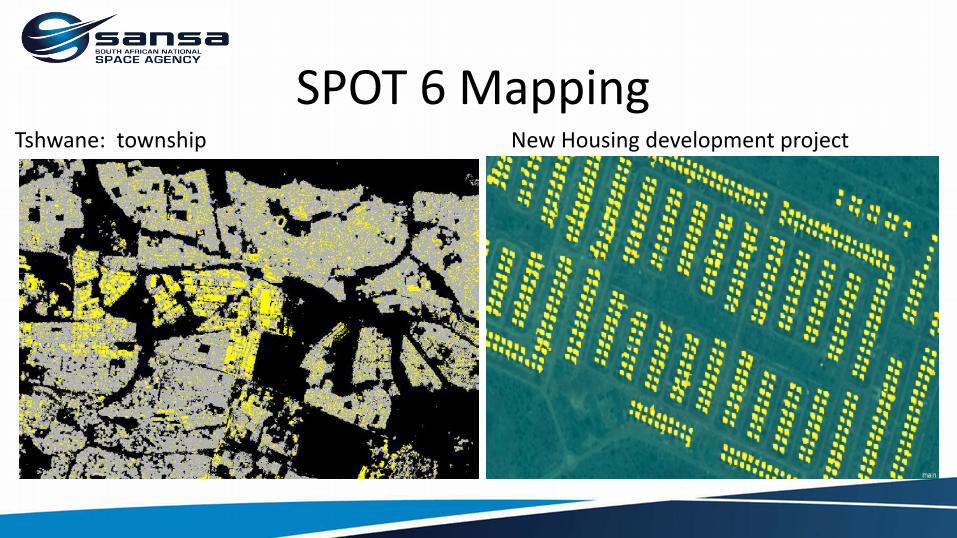
SPOT 6 MappingTshwane: township New Housing development project
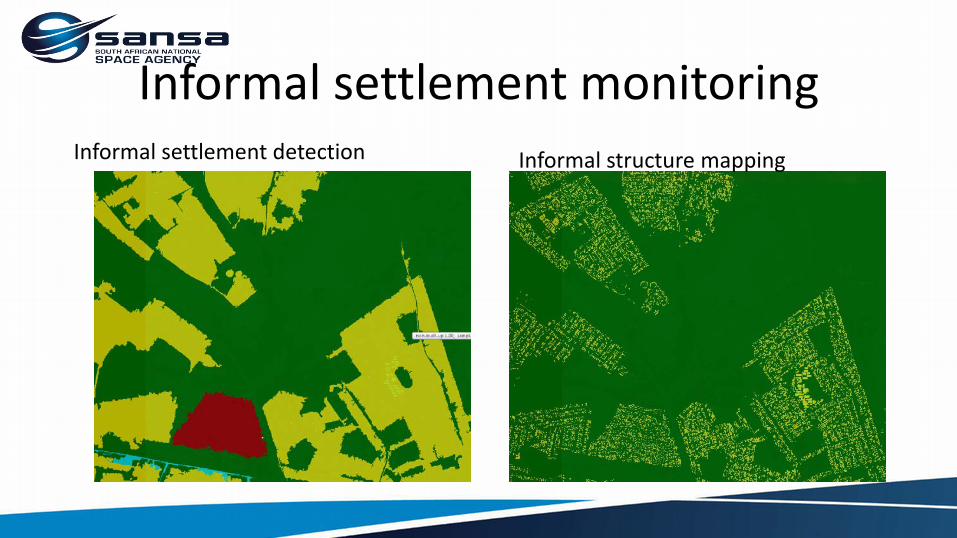
Informal settlement monitoringInformal settlement detection Informal structure mapping
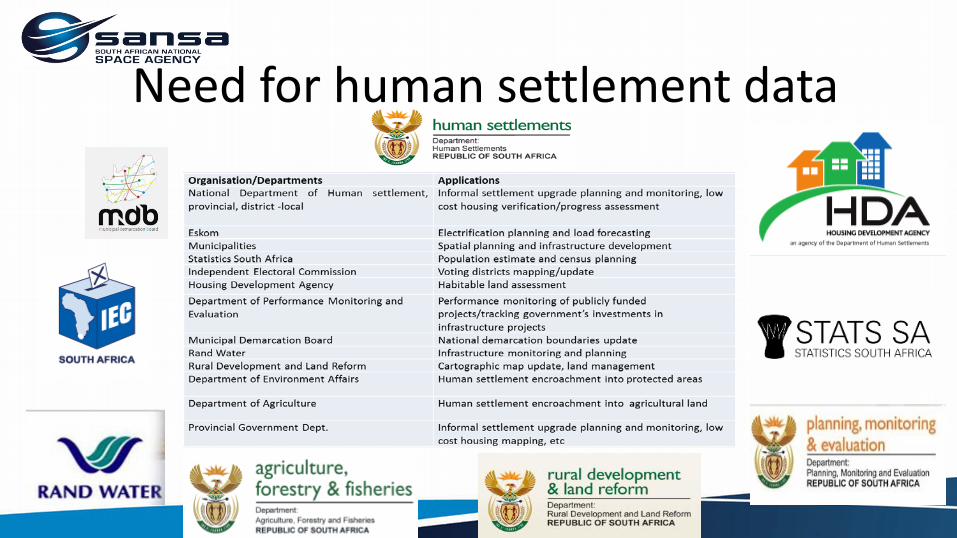
Need for human settlement data