towards a new trade policy on market access for …
TRANSCRIPT

U N I T E D N AT I O N S C O N F E R E N C E O N T R A D E A N D D E V E L O P M E N T
IDENTIFYING A POSITIVE AGENDA AMONG CHALLENGES AND OPPORTUNITIES
TOWARDS A NEW TRADE POLICY ON MARKET ACCESS FOR MYANMAR
UNCTA
DUNITED NATIONS
TOWARDS A NEW
TRADE POLICY ON MARKET ACCESS FOR M
YANMAR IDENTIFYING A POSITIVE AGENDA AM
ONG CHALLENGES AND OPPORTUNITIES

i
U N I T E D N AT I O N S C O N F E R E N C E O N T R A D E A N D D E V E L O P M E N T
Geneva, 2021
Identifying a positive agenda among challengesand opportunities
TOWARDS A NEW TRADE POLICY ON MARKET ACCESS FOR MYANMAR
ii
© 2020, United Nations
This work is available through open access, by complying with the Creative Commons licence created for intergovernmental organizations, at http://creativecommons.org/licenses/by/3.0/igo/.
The designations employed and the presentation of material on any map in this work do not imply the expression of any opinion whatsoever on the part of the United Nations concerning the legal status of any country, territory, city or area or of its authorities, or concerning the delimitation of its frontiers or boundaries.
Photocopies and reproductions of excerpts are allowed with proper credits.
This publication has not been formally edited.
United Nations publication issued by the United Nations Conference on Trade and Development.
UNCTAD/ALDC/2019/4
eISBN: 978-92-1-004790-6

iii
Acknowledgments
This study has been drafted by Stefano Inama, Chief, Enhanced Integrated Framework and Technical Assistance, and Pramila Crivelli, Goethe University, as part of a EIF funded technical assistance project entitled “Trade Policy Advice for Myanmar”.

iv
ContentsAcknowledgments ..............................................................................................................................................iii
Abbreviations and acronyms ............................................................................................................................viii
Summary of findings .......................................................................................................................................... ix
1. A new trade policy and a positive agenda for Myanmar 1
1.1 Overview of Myanmar trade performance and export pattern ........................................................... 1
1.2 Overview of exports of selected sectors ........................................................................................... 3
1.3 The actual positioning of Myanmar in the international trade scene and potential leading role of an ASEAN least developed country agenda ........................................................................... 5
2. Myanmar and the emerging trade challenges – The erosion and loss of preferential market access and rules of origin and the quest for alternatives 7
2.1 The erosion and/or loss of trade preferences .................................................................................... 7
2.2 The quest for alternatives: Which partner for an FTA ...................................................................... 11
2.3 Building new trade initiative with the European Union in view of the European Union-ASEAN FTAs ...... 14
2.3.1 The European Union reform of rules of origin: what did it mean for Myanmar? ................................ 14
2.3.2 The European Union’s free trade agreements with ASEAN members: Implications for Myanmar .... 18
3. RCEP and CP-TPP – Challenges and opportunities 21
3.1 Measuring cost and opportunities of RCEP .................................................................................... 23
3.1.1 Getting increased market access for Myanmar exports to RCEP partners ...................................... 23
3.1.2 Structuring the tariff offers of Myanmar under RCEP ....................................................................... 26
3.1.3 Getting better market access to India ............................................................................................. 28
3.2 Joining the CP-TPP ........................................................................................................................ 29
3.3 Myanmar trade relations with Japan: From GSP to ASEAN FTA and beyond .................................. 33
4. Addressing SPS issues with China and other partners 35
5. A positive negotiating agenda for Myanmar at multilateral and regional level 38
Annexes 41
v
Figures
Figure 1-1: Myanmar export destination 2010 (left) and 2017 (right), excluding HS chapter 27 .........................1
Figure 1-2: Export shares of natural gas (HS 27) to China, Thailand and rest of the world ................................3
Figure 1-3: Export share by HS chapters, 2010 (left) and 2017 (right), excluding HS chapter27........................4
Figure 2-1: Utilization of preferential scheme ....................................................................................................7
Figure 2-2: Preferential imports granted by QUAD to Myanmar, 2017 (millions of United States dollars) ............8
Figure 2-3: European Union imports of garments of HS 61 and HS 62 from LDCs .........................................15
Figure 2-4: European Union imports of HS 61 and HS 62 from Myanmar .......................................................15
Figure 2-5: Tariff lines most imported to the European Union from Myanmar at six-digit level, and utilization rates (2017) .................................................................................................................................16
Figure 3-1: RCEP, ASEAN, CP-TPP and DFQF preferences: Overlapping memberships .................................21
Figure 3-2: Myanmar export shares to RCEP/TPP markets and to the rest of the world, 2016 .......................22
Figure 3-3: Myanmar export shares to RCEP markets and to the rest of the world, 2017 ...............................23
Figure 3-4: Myanmar export shares to CP-TPP markets and to the rest of the world, 2017 ............................31
Figure A.1: Myanmar export share by destination ...........................................................................................42
Figure A.2: Myanmar export values to selected countries/regions (millions of United States dollars) ...............43
Figure A.3: Exports to ASEAN, China, India and rest of world ........................................................................44
Figure A.4: HS 61 export shares by destination ..............................................................................................45
Figure A.5: Evolution of Myanmar exports to the European Union-28: chapters 61 and 62 (2010–2017) ........45
Figure A.6: Tariff lines most imported to the European Union from Myanmar at the six-digit level, and utilization rates (2013) ...........................................................................................................46
Figure A.7: Tariff lines most imported to the European Union from Myanmar at the six-digit level, and utilization rates (2015) ...........................................................................................................46
Figure A.8: European Union GSP utilization rates of HS 61 of selected countries ...........................................47
Figure A.9: European Union GSP utilization rates of HS 62 of selected countries ...........................................47

vivi
Tables
Table 1: New market prospects for Myanmar most exported products – China and India as possible recipients of Myanmar supply capacity, 2017 ..................................................................................10
Table 2: Market access and rules of origin provisions – Comparison across FTAs .........................................12
Table 3: SPS, TBT and services provisions – comparison across FTAs .........................................................13
Table 4: Investments, ISDS, labour and environment clauses – comparison across FTAs ..............................13
Table 5: European Union imports from Myanmar under EBA impact by sector (millions of United States dollars) .....................................................................................................16
Table 6: European Union-27 most imported product of HS 61 and HS 62 at four-digit level (United States dollars) from Myanmar (2018): a country comparison................................................17
Table 7: European Union – Viet Nam FTA RoO on Myanmar’s most-exported goods to the European Union in 2017 ..................................................................................................................................17
Table 8: Overlapping trade preferences available to Myanmar with RCEP and CP-TPP partners: comparative table on market access (MA) and rules of origin (RoO) .................................................22
Table 9: Market access and rules of origin treatment of most-exported products from Myanmar to RCEP partners in 2017 (sorted in descending values, cumulative export share <75 per cent) ....................25
Table 10: Myanmar most-imported products from RCEP member countries, 2017 (sorted in descending values, cumulative import share <48 per cent) .................................................................................27
Table 11: Indian imports from Myanmar in 2015 at the tariff line level (UR < 70 per cent, PM > 2pp, MFN received > 200 thousands, in thousands of United States dollars) ..................................................28
Table 12: Indian imports from LDCs in 2015 (UR < 70 per cent, PM > 2pp, MFN received > 80 million, in thousands of United States dollars)..............................................................................................29
Table 13: Market access and rules of origin treatment of most-exported products from Myanmar to CP-TPP partners in 2017 (sorted in descending values, cumulative export share < 55 per cent) .....32
Table 14: Japanese imports from Myanmar and utilization rates under ASEAN and GSP, 2017 (sorted in descending order of MFN dutiable imports > $2 million) ...................................................33
Table 15: Total SPS measures imposed by Myanmar’s partners by products (sorted in descending values of Myanmar’s exports > $5 million, MMR export share > 5 per cent, Total SPS > 3) ........................36
Table 16: Myanmar’s most-exported products to European Union-27 in 2017 ................................................48
Table 17: Changes of provision on regional cumulation in the European Union GSP reform in 2011 ...............48
Table 18: European Union-Singapore, European Union–Republic of Korea and European Union–Viet Nam FTA PSRO HS 61, HS 62 ................................................................................................................49
Table 19: Australian imports from Myanmar and utilization rates (thousands of United States dollars) – 2017 (sorted in descending order of MFN received imports (> $300,000), filtered: UR < 70 per cent, PM > 2pp) ................................................................................................................49
Table 20: Republic of Korea imports from Myanmar and Utilization Rates (thousands of United States dollars) – 2017 (sorted in descending order of MFN received imports (> $1 million), filtered: UR < 70 per cent, PM > 2pp) ..........................................................................................................50
Table 21: European Union imports from Myanmar with low GSP utilization in 2017 (< 70 per cent, PM > 2, in thousands of United States dollars)..............................................................................................50
Table 22: United States imports from Myanmar with low GSP utilization in 2017 (< 70 per cent, PM > 2, in thousands of United States dollars) .................................................................................................51

viivii
Table 23: Myanmar exports to RCEP member countries and principal export destinations within the region, 2017 (sorted in descending values, cumulative export share < 75 per cent) ...................52
Table 24: Myanmar exports to CP-TPP member countries and principal export destinations within the region, 2017 (sorted in descending values, cumulative export share < 65 per cent) ...................53
Table 25: Japanese Imports from Myanmar and utilization rates under ASEAN and GSP, 2017 (sorted in descending order of MFN dutiable Imports < = $2 million) .............................................54
Table 26: Non-tariff measures imposed by Myanmar’s partners (sorted in descending values of total NTM, MMR exports > $4 million) ...............................................................................................................55
Table 27: Non-tariff measures imposed by Myanmar’s partners by product (sorted in descending values of total NTM, MMR exports > $5 million, share in total trade > 5 per cent, total NTM > 3) ...............56
Table 28: Bilateral SPS measures imposed by Myanmar’s partners by products (sorted in descending values of Myanmar’s exports, MMR exports > 500,000; bilateral SPS > 1) ......................................57
Table 29: Identification of possible detterent bilateral SPS measures imposed by Myanmar’s partners (sorted in descending values of Myanmar’s exports to the world > $13 million, $5,000 < MMR exports to partner < 1 million, bilateral SPS >= 2) ............................................................................58
viiiviii
Abbreviations and acronyms
ACFTA ASEAN-China Free Trade Agreement
AEC ASEAN Economic Community
ASEAN Association of Southeast Asian Nations
ATIGA ASEAN Trade in Goods Agreement
BIT Bilateral Investment Treaties
CDP Committee for Development Policy
CP-TPP Comprehensive and Progressive Agreement for Trans-Pacific Partnership
CRO Committee on Rules of Origin
DFQF duty-free quota-free
DTIS Diagnostic Integration Study
EBA Everything but Arms
EVI Economic Vulnerability Index
FTA Free Trade Agreement
GNI gross national income
GSP Generalized System of Preferences
HAI Human Asset Index
IIA International Investment Agreement
IMS Information Management System
IPR intellectual property rights
ISDS investor–State dispute settlement
LDC least developed country
MFN most favoured nation
MOC Ministry of Commerce
MSME micro, small and medium enterprise
NTM non-tariff measures
PM preference margins
PSRO product-specific rules of origin
QUAD Canada, EU, Japan and the United States
RCEP Regional Comprehensive Economic Partnership
ROO rules of origin
RTA Regional Trade Agreements
SPS sanitary and phytosanitary
TIP Trade Intelligence Portal
TBT Technical Barriers to Trade
TPP Trans-Pacific Partnership
WTO World Trade Organization

ixix
Summary of findings
Myanmar is relatively a newcomer in the international trade scene after the lifting of sanctions in 2013. Yet, together with Cambodia, it is one of the few LDCs that has been able to dramatically increase exports exploiting the trading opportunities arising from trade preferences, especially those provided by the European Union under the Everything but Arms scheme (EBA).
At first glance, the export composition and destination of Myanmar is more diversified than the other ASEAN LDCs such as Cambodia and the Lao People’s Democratic Republic. However, once netted out of the gas exports to China and Thailand and some agricultural crops, the reliance on trade preferences for major manufactured export is glaring. Out of $3.3 billion of QUAD imports from Myanmar1 accounting for about 27 per cent of Myanmar total exports, around $2.5 billion (76 per cent of QUAD imports from Myanmar) benefited from trade preferences in 2017. Most importantly these exports utilizing trade preferences, mainly garments, have a social impact on Myanmar labour force since the garment industry is labour intensive. Given that 11.8 per cent of QUAD imports from Myanmar are MFN free, only 12.6 per cent of exports were hit by a tariff, either because they are not covered by preference schemes (6.5 per cent) or not utilized (6.1 per cent).
More specifically, Myanmar has been able to draw net gains from the trading opportunities offered by the reform of European Union rules of origin (RoO) that took place in 2011. This is evident from the trade statistics showing that after Myanmar’s reinstatement in 2013, not only has it been able to increase its utilization of the European Union preferences but has substantially increased its total exports to the European Union.
However, this favourable trading environment will not last due to a series of overlapping and concomitant trade initiatives and developments in the international trade scenario.
The continued eligibility of Myanmar under the EBA due to non-trade-related conditionalities2 is currently an issue conspicuously present in press headlines.3
1 Value based on QUAD import data.2 According to article 19 of the 2012 regulation, EBAs can be withdrawn for a number of reasons. The actual grounds for withdrawal mainly
concerns articles 19.1 (a) of the above-mentioned European Union regulation “of serious and systematic violation of principles laid down in the conventions listed in Part A of annex VIII’ (UN and ILO Conventions on core human rights and, respectively, labour rights)”.
3 See for instance https://www.phnompenhpost.com/national-politics/final-day-eu-get-eba-withdrawal-views.4 On Myanmar and Cambodia, Cecilia Malmström, Innsbruck, Austria, 5 October 2018.
In any case, the preferential margin in the European Union market will be progressively eroded by the entry into force of the European Union–Viet Nam FTA entered into force in August 2020. As the CP-TPP has already entered into force, additional erosion of preferential margins that Myanmar is currently benefiting from will take place, especially for those CP-TPP members that are granting duty-free quota-free (DFQF) to LDCs such as Australia, Japan and New Zealand.
In terms of market access, trade preferences granted under GSP – a building block of the export performance of Myanmar – are of a unilateral nature. In fact, LDC GSP preferences depend on the LDC status of Myanmar and the conditionalities that preference-giving countries attach to unilateral preferences.
As mentioned above, the beneficiary status of Myanmar under EBA has been put under scrutiny4 and the country is expected to graduate from LDC status by 2024. At the last triennial review of the LDC list in 2018 by the Committee for Development Policy (CDP), Myanmar fulfilled the graduation eligibility criteria for the first time, complying with all the three requirements of GNI per capita, Human Asset Index (HAI) and Economic Vulnerability Index (EVI). If found eligible at the next review in 2021, Myanmar will graduate from LDC status within a maximum period of three years, that is, at the latest by 2024.
Upon graduation from LDC status, trade preferences will be phased out after a transitional time period, or immediately, depending on the provisions of the preference-giving country. Thus, under any circumstances it is time for Myanmar to realize that alternative routes have to be designed and actively undertaken to maintain and improve the present export performance.
This scenario demands a reflection on how to best strategize a trade policy that softens the loss of unilateral preferences following graduation from GSP LDC status.
Negotiations of the Regional Economic Comprehensive Partnership Agreement (RCEP) are progressing; however,

x
it is still to be proved if any additional market access will be provided in a timely and meaningful manner to Myanmar exports.
Given the export basket of Myanmar of manufactured exports, mainly garments and shoes to QUAD countries, it is unlikely that RCEP could absorb or become a substitute for such exports. To be perfectly clear, RCEP partners are net competitors of Myanmar rather than possible importers of garments and shoes originating in the country. The remaining exports of crops to RCEP countries, mainly beans to India and rice to China, could potentially benefit from RCEP on the condition that the existing trade preferences already available under DFQF are locked in terms of predictable market access and improved sanitary and phytosanitary (SPS) in RCEP.
What is certain is that the European Union–Japan FTA has entered into force and the European Union–Viet Nam FTA entered into force in August 2020 much earlier than any substantial improvement of regional market access, like RCEP. In addition, the resumption of the negotiations of the European Union–Thailand FTA may be expected under a newly elected Thai Government. Dynamism in joining the CP-TPP has also been recently aired by Thailand.
Furthermore, it is important to realize that graduation not only concerns Myanmar but also the neighbouring ASEAN countries. In fact, there are different forms of graduation. One of the most traditional is graduation from LDC status. However, as discussed in this study, other forms of graduation, such as graduation from GSP status, of other ASEAN partners are of concern to Myanmar since they have a direct effect, especially in the case of market access to the European Union.
In spite of the on-going aid for trade technical assistance provided to Myanmar, there is a persistent need for capacity building activity generating a genuine ownership and appreciation on the part of Myanmar Government circles and the private sector of the functioning of the international trading system as contained in WTO and/or regional trade agreements. Such system is based on a framework of rights and obligations encompassing challenges and opportunities that need to be understood, appreciated and acted upon. Many of the issues that are and will be affecting the export performance of Myanmar have been on the agenda for years but attracted little attention in terms of planning and
5 In comparison, Cambodia attempted a defence against reimposition of duties by hiring a legal counsellor to submit rebuttal arguments to the European Union and to participate in the procedure. Following the decision by the EU Commission to impose duties Cambodia is presently challenging such a measure at the general court.
6 As discussed in section 3.3 in the case of Japan.
mounting an adequate trade policy response. Two glaring examples are the re-imposition of duties on rice following a European Union investigation under EBA and the lack of preparation and initiatives for the entry into force of the European Union–Viet Nam FTA. In both cases, it appears that little action has been undertaken to prepare a defence against the re-imposition of duty on exports of Myanmar rice to the European Union5 and coordinate such a defence with Cambodia during the safeguard procedure. There are no signs of concern for the erosion of trade preferences deriving from the entry into force of the EU-Vietnam FTA.
The on-going and overlapping trade initiatives present in the Asian region, mainly the RCEP and CP-TPP, are offering both prospects and challenges for Myanmar. One of the challenges is to better understand in concrete terms and at sector level what these challenges and opportunities are and to assess:
(a) The value added to be part or accede to these mega regionals;
(b) The concessions that Myanmar is expected to make under the respective initiatives.
Given the overlapping and concurrent trade preferences and arrangements of which Myanmar is beneficiary, the analysis carried out in this study is complex due to the different layers of preferential market access already existing, some deriving from the LDC status of Myanmar, such as EBA or DFQF, others deriving from the FTAs that the country, as part of ASEAN, has entered into with Australia, New Zealand, China, India and Japan. Further information is provided in the tables contained in the annex.
As discussed in this study, the effective market access and utilization rates of the ASEAN FTAs with dialogue partners (Australia, New Zealand, China, India and Japan) are difficult to assess given the rather opaque status of implementation and the scarce availability of trade data on their effective utilization, with the notable exception of the ASEAN FTA with Japan.6 Further information is contained in the tables in annexes.
Given that Myanmar is benefiting from DFQF schemes granted by a number of RCEP and CP-TPP partners, a preliminary assessment has been carried out in section 3 of this study to evaluate what value added in terms of preferential margin and better rules of origin both RCEP and CP-TPP are offering in comparison with the existing market access conditions that Myanmar
xi
is already entitled to under the current preferential arrangements, either as a member of ASEAN and/or as an LDC.
In addition to such market access dimensions in terms of tariffs and rules of origin, both RCEP and CP-TPP encompass a number of additional trade disciplines of a WTO-plus7 and WTO-extra8 nature that need to be assessed. Such topics deserve separate studies on their own to be carried out under a forthcoming ASEAN LDC regional initiative to coordinate ASEAN LDCs position and provide the necessary research and capacity-building activities.
Given this scenario, Myanmar needs to quickly assess and mature the option of reformulating its overall trade policy as a matter of utmost priority. In particular, the following options should be explored:
(a) Relations with the European Union beyond EBA including the possibility of entering into an FTA with it;
(b) Assess the value added of RCEP in addition to the existing trading arrangements that Myanmar already enjoys with RCEP countries;
(c) A deep analysis of the cost and opportunities of joining the CP-TPP.
Some of these options would represent a substantial negotiating challenge for Myanmar since FTAs with the European Union and CP-TPP encompass many more disciplines than simple trade in goods aspects. This holds especially true for the CP-TPP, which includes disciplines on trade environment, IPRs, and investor/State disciplines that, while debated already in the literature, must be related and tailored to the Myanmar case.
This study examines the facts and figures that are underscoring this new vision of Myanmar’s trade policy. It provides some initial findings on the following issues:
(a) An analytical review of the trade performance of Myanmar, including a detailed comparative examination of utilization rates of the various trade preferences;
(b) An assessment of RCEP tariff concessions and rules of origin comparing them with the existing preferential tariff arrangements available to Myanmar under the GSP schemes and ASEAN FTAs with dialogue partners;
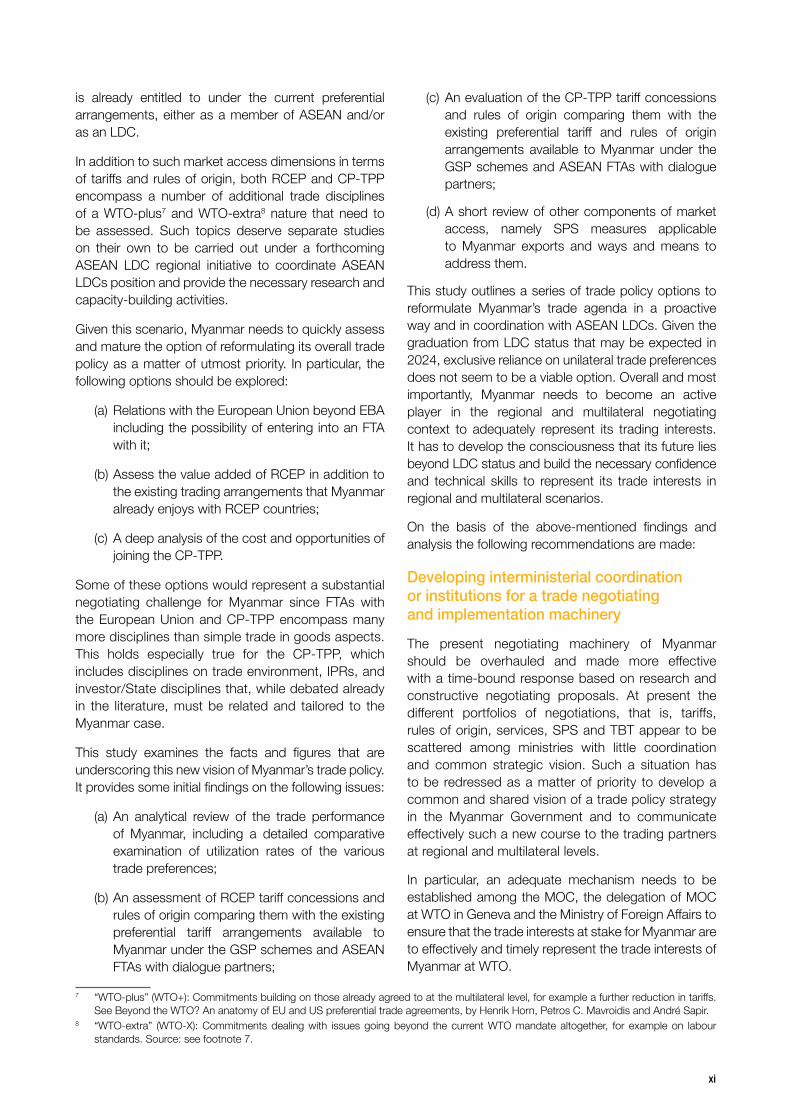
7 “WTO-plus” (WTO+): Commitments building on those already agreed to at the multilateral level, for example a further reduction in tariffs. See Beyond the WTO? An anatomy of EU and US preferential trade agreements, by Henrik Horn, Petros C. Mavroidis and André Sapir.
8 “WTO-extra” (WTO-X): Commitments dealing with issues going beyond the current WTO mandate altogether, for example on labour standards. Source: see footnote 7.
(c) An evaluation of the CP-TPP tariff concessions and rules of origin comparing them with the existing preferential tariff and rules of origin arrangements available to Myanmar under the GSP schemes and ASEAN FTAs with dialogue partners;
(d) A short review of other components of market access, namely SPS measures applicable to Myanmar exports and ways and means to address them.
This study outlines a series of trade policy options to reformulate Myanmar’s trade agenda in a proactive way and in coordination with ASEAN LDCs. Given the graduation from LDC status that may be expected in 2024, exclusive reliance on unilateral trade preferences does not seem to be a viable option. Overall and most importantly, Myanmar needs to become an active player in the regional and multilateral negotiating context to adequately represent its trading interests. It has to develop the consciousness that its future lies beyond LDC status and build the necessary confidence and technical skills to represent its trade interests in regional and multilateral scenarios.
On the basis of the above-mentioned findings and analysis the following recommendations are made:
Developing interministerial coordination or institutions for a trade negotiating and implementation machinery
The present negotiating machinery of Myanmar should be overhauled and made more effective with a time-bound response based on research and constructive negotiating proposals. At present the different portfolios of negotiations, that is, tariffs, rules of origin, services, SPS and TBT appear to be scattered among ministries with little coordination and common strategic vision. Such a situation has to be redressed as a matter of priority to develop a common and shared vision of a trade policy strategy in the Myanmar Government and to communicate effectively such a new course to the trading partners at regional and multilateral levels.
In particular, an adequate mechanism needs to be established among the MOC, the delegation of MOC at WTO in Geneva and the Ministry of Foreign Affairs to ensure that the trade interests at stake for Myanmar are to effectively and timely represent the trade interests of Myanmar at WTO.

xii
Trade relations with ASEAN
Overall, Myanmar should openly discuss and revisit with ASEAN partners its negotiating position to be able to negotiate as an ASEAN LDC in external trade relations and coordinate such a stance with other ASEAN LDCs. It should be made clear with ASEAN partners that a new course of action in ASEAN external trade relation should be undertaken with the following priorities:
(a) The implementation of the AEC agenda should be fast-tracked with specific provisions to take into due account the ASEAN LDC position within ASEAN and the deterioration of market access due to different external trade agenda of ASEAN countries with dialogue partners and the European Union.
(b) Myanmar together with other ASEAN LDCs should initiate a positive agenda aimed at negotiating current and future FTAs as an ASEAN LDC group. It should be made clear that while maintaining the integrity of ASEAN, the ASEAN LDCs should negotiate as distinct subgroup of ASEAN. This means, for instance, that FTA partners adopt differentiated ASEAN offers, one for ASEAN and a second one for ASEAN LDCs to take into account their special and different situation. It is simply not proper that ASEAN LDCs are treated in the same league as higher-income ASEAN countries. The RCEP negotiations were an ideal candidate to be a testing ground to advance this negotiating position.
(c) To this effect, MOC should take the lead in conducting internal and external consultations as soon as possible with other ASEAN LDCs at the earliest opportunity.
Trade relations with the European Union
Myanmar and other ASEAN LDCs should take the initiative to enter into a trade policy dialogue with the European Union to define a new trade relation that goes beyond EBA.
ASEAN LDCs are expected to graduate from LDC status in the near future9 and the current market access under EBA that has been a crucial factor in their export performance is going to be progressively eroded by the ASEAN FTAs.
9 See footnote 49.
The combined effects of these two looming events require timely and concrete actions such as:
(a) Prepare a short roadmap for a new partnership between ASEAN LDCs and the European Union;
(b) Convene a meeting at high level among the ASEAN LDCs to agree on a roadmap for trade relations with the EU;
(c) the ASEAN LDCs should request a meeting with the newly appointed EU Trade Commissioner to discuss such a new partnership.
In addition, Myanmar will have to undertake actions at technical level to prepare the ground for extended cumulation with Viet Nam and explore possible ways to cumulate with Japan.
Such actions should be undertaken as soon as possible to relay a message to garment manufacturers that the Government is actively pursuing a viable trade strategy.
Trade relations with Japan
Trade relations with Japan are governed by the GSP for LDCs and the ASEAN dialogue FTA with Japan. Trade figures suggest that the Japan GSP for LDCs is mostly used by Myanmar.
In the context of the GSP preferences, Myanmar with other ASEAN LDCs should prepare a document clearly outlining the improvements that Japan may make on the product-specific rules of origin (PSRO) and on cumulation during the periodical review held each decade now due in 2021. This document should be submitted to the WTO Committee on Rules of Origin (CRO) as discussed during the CRO meeting of 15-16 May 2019. Such an action should be followed by an official visit of the ASEAN LDCs to the Ministry of Industry and Trade and Ministry of Finance in Tokyo to secure follow up and commitment in adopting a reform of rules of origin under the Japanese GSP.
In a parallel fashion, Myanmar and ASEAN LDCs should begin to study the possibility of having a series of bilateral FTAs with Japan that provide better market access than the present Japanese GSP, the ASEAN FTAs and RCEP. A study should be conducted in this regard to compare the different concessions that Japan has made towards other partners to secure and argue for better preferential margins when negotiating as ASEAN LDCs.

xiii
Trade relations with India
The analysis of the trade flows carried out in table 1 clearly shows that India remains an important market for Myanmar even for a single agricultural product, that is, beans, with $317 million exports to India in 2017. In this area there is an urgent issue that needs to be addressed as the utilization rates of the DFQF granted by India to Myanmar show a close-to-zero utilization as discussed in section 3.1.3. This current status of affairs as well as the decision by the Government of India to impose import quotas and to negotiate the price of beans and pulses should be reviewed in the light of India’s commitment in WTO to verify their consistency. In particular, the issue of utilization rates needs to be clarified at the earliest opportunity during the next CRO meetings.
Myanmar and other ASEAN LDCs should make sure that the RCEP provisions on safeguards and import quotas contain WTO-plus elements that permit an enhanced dialogue with India.
With the above-mentioned findings and analysis, the following recommendations are made:
(a) Myanmar with other ASEAN LDCs should raise specific concerns over the close-to-zero utilization rates of the DFQF measures applied by India on bean imports and other related agricultural products in the next session of the WTO SPS committee.
(b) Myanmar should check the WTO consistency of India import quotas and internal price mechanisms and enter into a bilateral dialogue to address and stabilize the trade relation with India on beans and pulses as well as other agricultural products.
(c) Myanmar and other LDCs should coordinate negotiating positions to develop a common negotiating stance towards India. A document detailing where improvements could be made to the current rules of origin provided by India should be prepared by ASEAN LDCs and presented at the next CRO meeting. Subsequently, Myanmar and other ASEAN LDCs should launch initiatives to follow up on this matter to obtain better market access and rules of origin.
10 For instance the European Union-Viet Nam SPS provisions contain a number of possible suggestions on how to develop some WTO-plus disciplines.
Trade relations with China
The analysis of the trade flows presented in table 1 clearly shows that China could be a potential market for exports of rice, agricultural products and processed foodstuffs. On the other hand, non-tariff barriers pose one of the main obstacles to enter the Chinese market. That is, obstacles faced by Myanmar are not only confined to tariffs but also factors such as sanitary and phytosanitary (SPS) requirements. In the context of WTO, the SPS committee has been established to provide a forum for discussion and exchange of information. According to the SPS Information Management System (IMS) database, WTO members have raised 31 specific trade concerns on the SPS measures applied by China.
Myanmar and other ASEAN LDCs should make sure that the RCEP provisions on SPS contain WTO-plus elements that permit an enhanced dialogue with China and, where possible, equivalence and mutual recognition agreements.10
With the above-mentioned findings and analysis, the following recommendations are made:
(a) Myanmar together with other ASEAN LDCs should raise specific concerns over the SPS measures applied by China on rice imports and other related agricultural products in the next session of the WTO SPS committee.
(b) Myanmar should develop a negotiating strategy with other ASEAN LDCs to ensure that the RCEP provision on SPS contains WTO-plus elements that could facilitate market access to China.
Negotiating and implementing RCEP
The RCEP negotiating text has not been made available during the course of this study. Only limited information could be retrieved from other sources. On the basis of the preliminary information and a preliminary examination of tariff offers, RCEP does not seem to provide substantial improvements with respect to the market access that Myanmar is already being granted as part of the LDCs, or ASEAN and ASEAN FTA networks with dialogue partners. The tables in the annex provide a number of detailed observations.
xivxiv
The crippling factor of RCEP is the architecture of the tariff offer, since the RCEP partners have made a single offer for all ASEAN countries or towards all RCEP partners. This means that Myanmar is treated in terms of market access the same way as Singapore or Malaysia, while there is a clear divide in terms of export capacity and level of development between these countries and Myanmar. This element alone casts serious doubts over the value added of RCEP in terms of market access granted to Myanmar with respect to previous agreements and LDC arrangements from which Myanmar is already benefiting.
Added to this, a RCEP negotiating text on rules of origin made available during the drafting of this study is 111 pages long and the Excel texts of product-specific rules of origin is over 6,000 lines. These figures alone provide a glimpse of the complexities of the negotiations. Once again there is no provision, at first reading, for special and preferential treatment in the area of rules of origin for LDCs. At the time of this writing the final text is not yet public and subject to legal scrubbing. As soon as the legal text is made available an unbiased assessment should be made to identify to what extent RCEP provide additional market access to Myanmar.
Unless substantial progress is made in the last rounds of negotiations, the initial reading of the drafts of RCEP provides little scope for increased market access for Myanmar. The only advantage of the agreement would be to “lock-in” into a contractual agreement unilateral trade preferences.11 Even this assumption would have to be further assessed.
The fact that Myanmar may graduate from LDC status in a foreseeable future should not mean to forfeit in advance its negotiating position as an LDC during the negotiations of Regional Trade Agreements (RTAs) like RCEP.
On the basis of the above-mentioned findings and analysis the following recommendations are made:
(a) As a matter of priority, Myanmar together with other ASEAN LDCs should insist in making a common position during the implementation phase with RCEP partners arguing for special and differential treatment as LDCs.
(b) In taking informed positions during the RCEP negotiations, an overall and product-specific
11 These unilateral trade preferences are those granted under DFQF and related rules of origin by Australia, China, India, Japan, New Zealand and the Republic of Korea. However, it needs to be assessed whether the tariff offers and rules of origin in RCEP are equivalent or better that those granted under the current DFQF by these preference-giving countries.
12 Viet Nam is member of (a) CP-TPP, (b) RECEP, (c) and is part of the network European Union-ASEAN FTAs. In addition, Viet Nam has entered a series of bilateral FTAs such as the Viet Nam-Japan FTA.
assessment has to be made using the methodology adopted in table 9 to measure what additional market is granted under current RCEP, and implementation objectives should be set accordingly. For instance, it seems that the common ASEAN negotiation position on rules of origin for garments is more stringent that those of other RCEP partners.
(c) An overall assessment should be made of the value of RCEP with respect to trade in goods, services and other trade-related aspects. As the text has not been made public, it is not possible to provide even an initial assessment.
Negotiating CP-TPP accession
The CP-TPP agreement is a modern FTA encompassing a series of WTO-plus and WTO-extra disciplines both in terms of coverage and in depth. The preliminary analysis of the CP-TPP with respect to market access and rules of origin is similar to RCEP in the sense that the CP-TPP may not bring Myanmar additional market access to what has been already been granted under different arrangements thanks to its current LDC status or as member of the ASEAN FTAs with dialogue partners. The complex rules of origin of the CP-TPP, especially in the garment sector, do not reflect the present capacity of Myanmar’s garment industry.
However, reading a complex agreement such as the CP-TPP uniquely through the lenses of tariffs and RoOs offers a very limited perspective of the trading opportunities and challenges that the agreement may bring to Myanmar. First of all, as in the case of the RCEP, the trade preferences granted under an FTA are not unilateral and are more permanent and stable in nature.
The CP-TPP is based on a series of rule-based, market-oriented systems that offer predictability for investors but also challenges for countries like Myanmar. The situation is further exacerbated by the fact that some of the main competitors of Myanmar, such as Viet Nam, are on a double or triple track12 scenario since some of these competitors (a) participate in RCEP, (b) are members of the CP-TPP, (c) have entered FTAs with the European Union. It follows that such multiple track routes adopted by other ASEAN countries attracts investors to such locations, since this provides them with multiple access to markets, in contrast to other locations, such as ASEAN LDCs, that are only engaged in RCEP.

xvxv
Overall, the main challenge for Myanmar is to put more resources into assessing the values of the various options and conducting a series of consultations to assess the terms and conditions for acceding to the CP-TPP.
On the basis of the above-mentioned findings and analysis the following recommendations are made:
(a) A deeper and comprehensive assessment of the CP-TPP should be conducted and consultations should be initiated with other ASEAN LDCs for a possible joint initiative to accede to the CP-TPP as an ASEAN LDC group;
(b) Informal consultations should be initiated either directly or indirectly to identify the possible flexibilities and carve out what may be discussed upon accession, especially on ISDS provision and other aspects.
Preparing for the next World Trade Organization Ministerial Conference
It is highly recommended that Myanmar and ASEAN LDCs make full use of the opportunities offered by the multilateral trading system to flag their issues and undertake parallel initiatives to those undertaken at regional level. Every opportunity to show that Myanmar and ASEAN LDCs are engaged in the multilateral track should be exploited to show to partners that Myanmar is an active player in international trade.
More precisely it is recommended the following actions should be undertaken:
(a) Establish a consultation mechanism among the ASEAN LDC delegations at WTO and in capitals to coordinate negotiating positions and initiatives on the issues to be discussed in forthcoming WTO negotiations, namely e-commerce, investment facilitation, MSME and other themes;
(b) Prepare intensively for the next CRO meetings and initiate consultations for the possible launching of a plurilateral initiative to simplify rules of origin;
(c) Coordinate with other ASEAN LDCs to raise joint concerns over SPS measures adopted by China on rice and other products of export interest at the next WTO SPS committee and follow up initiatives.
Research and capacity-building
It is of paramount importance that Myanmar invests resources in further developing and studying the challenges and trading opportunities that are highlighted in this section and build the necessary capacity in the different ministries and private sector. In spite of numerous Aid for Trade initiatives present in the country there are very few resources dedicated to establishing a trained pool of trade negotiators and researchers. Such research and capacity building should assist the Government in taking informed decisions on trade policy at large and in carrying out related trade negotiations.


1
Identifying a Positive Agenda Among Challenges and Opportunities
1. A NEW TRADE POLICY AND A POSITIVE AGENDA FOR MYANMAR
1.1 Overview of Myanmar trade performance and export pattern
Myanmar carried out the Diagnostic Integration Study (DTIS) with the assistance of the World Bank in 2016. One of main objective of the DTIS is to provide guidance and recommendations to LDCs on how best mainstream trade into their development plans.
In this context it is important to highlight one of the main recommendation of the Diagnostic Trade Integration Study to place this study on market access and trade policy into the proper context:
Diversifying away from the current over-dependence on natural resources towards other sectors with high potential, such as light manufacturing, services and sustainable agri-business. Only through such a diversification can the economy provide the employment and sources of rural income to share the benefits of increased trade.
The analysis of the trade flows a few years later reveal that albeit some progress has been recorded there are not yet significant changes in the export composition and destination.
Figure 1-1: Myanmar export destination 2010 (left) and 2017 (right), excluding HS chapter 27
Thailand6,36%
China37,39%
EU2714,91%
Japan8,94%
India7,00%
Singapore6,57%
Korea2,96%
USA2,74%
Malaysia1,63%
Vietnam1,28%
Rest of World10,22%
Thailand5,14%
Rest of World11,34%
India20,43%
Hon Kong34,37%
China10,16%
Singapore5,89%
Japan4,59%
Malaysia3,47%
EU271,93%Korea
2,68%

2
Towards a New Trade Policy on Market Access for Myanmar:
Figure 1.113 shows the change in export shares on a seven-year time horizon and summarizes important implications. Two salient features can be observed. First, there was a drastic decrease in the export share of Hong Kong, China between 2010 and 2017 which corresponds to the drastic decline in exports of precious stones (HS 71) reported in figure 1.3. Indeed, a significant amount of precious stones that used to be exported to Hong Kong, China in the past have conspicuously shrunk over the years.14
Second, there is a considerable jump of export share both to the European Union and to China. In the case of the European Union this is due to the reinstatement of EBA in 2013 and in the case of China following the signing of the bilateral agreement of 2008 for the supply of gas to to the country for the next 30 years.
From 2010 to 2017 ASEAN markets have increased from 4.4 per cent to 8.6 per cent but this is still not making a significant difference in overall destination basket, while China has significantly increased its market share from a meagre 10 per cent to above 37 per cent, showing a shift from ASEAN (mainly Thailand) to China, albeit that exports of HS 27 to Thailand still occupies a higher share than China.
The shift of exports from ASEAN to China is almost exclusively due to liquefied gas as shown in figure 2 and is mainly due to a series of foreign investment projects led by the Republic of Korea and supply contracts entered by the Government of Myanmar with China.15
Apart from this trend, it is most important to point out that immediately after the lifting of sanctions there has been a consistent increase of volume of exports to QUAD countries, and as outlined below the composition of these exports is largely garments showing a recent diversification trend of export composition.
13 In most export figures presented in this section, export values of HS chapter 27 reported under figure 1.2 have been excluded from the analysis. As explained under section 1.2, despite its high values, this trade flow appears not directly linked to any industrial activity and is solely reliant on specific markets.
14 This issue has to be further investigated to find an adequate explanation. 15 See https://www.mmtimes.com/news/myanmars-gas-production-dilemma.html: “most of the gas produced is immediately exported to
Myanmar’s neighbours at an agreed price. For example, gas produced at the offshore Shwe and Zawtika fields is exported to China and Thailand under 30-year contracts. This is because most of Myanmar’s gas contracts date back to the late 1990s, when the country was under United States sanctions. At the time, cheap gas produced onshore was sufficient for domestic consumption, so the country resorted to selling the additional gas produced under long-term contracts for income.
Exports to Japan, the European Union and United States of America increased their shares from 4.02 per cent to 19.08 per cent. That is, the share to the European Union rose from 1.93 per cent to almost 15 per cent, and the export share to Japan rose from 4.59 per cent to 8.94 per cent. In comparison to Cambodia’s goods export, the United States market does not occupy a strategic position in Myanmar export destinations with only 2.74 per cent.
As can be seen comparing figures A.2 and A.3 in annex B to this study, exports to ASEAN members consist mostly of natural gas to Thailand, as further documented in the next subsection. Between 2010 and 2017, exports to ASEAN regional partners have fluctuated between a minimum of $3.3 billion in 2012 and a maximum of $6.5 billion in 2013. Excluding HS chapter 27, the data on exports to ASEAN members show a progressive increase over the years but with values that are significantly lower -- a minimum export value of $799 million; in 2010 and a maximum value of $1.7 billion in years 2013 and 2017, with a slightly higher export value in the former than the latter.
Figures A.1–A.3 (annex B) also confirm the significant expansion of Myanmar total exports to China even after excluding HS chapter 27. We observe a progressive rise from $476 million in 2010 to $3.7 billion in 2017. Such an export increase is to be attributed to agricultural products including rice, seeds and sugar. Ores and precious stones also contributed to the increase of exports to China. In contrast, exports to India, albeit of a considerable size, have been constant for the last decade with the exception of a peak observed in 2012.

3
Identifying a Positive Agenda Among Challenges and Opportunities
Liquefied natural gas (HS 27111) is the first product in Myanmar’s export basket16 and probably one of the most concentrated in terms of export destinations. Indeed, as shown in figure 1.2, only two major markets are served. Initially, Myanmar exports of this product were exclusively directed to Thailand (export shares of 100 per cent until 2012) but they are being
16 The top 19 products are reported in table 1.
progressively replaced by China, with increasing export shares from 0 per cent in 2013, to more than 22 per cent in 2014, and eventually reaching 44 per cent in 2017. The product composition of the exports in 2010 and 2017, excluding HS chapter 27, is summarized in figure 1.3.
1.2 Overview of exports of selected sectors
Figure 1-2: Export shares of natural gas (HS 27) to China, Thailand and rest of the world
0
500
1000
1500
2000
2500
3000
3500
4000
0%
25%
50%
75%
100%
2010 2011 2012 2013 2014 2015 2016 2017
USD
Milli
on
China Thailand ROWChina Share Thailand Share ROW Share

4
Towards a New Trade Policy on Market Access for Myanmar:
Figure 1-3: Export share by HS chapters, 2010 (left) and 2017 (right), excluding HS chapter27
Figure 1.3 highlights the changes in product composition at the HS two-digit level, with exclusion of HS chapter 27, between 2010 and 2017. On the one hand, there are products that have increased across the seven-year period. For example, the share of garments of chapter 62 (not knitted or crocheted (not KOC)) has increased from 7.74 per cent to 22.10 per cent, and there is an increase of 5.8 per cent for garments under chapter 61 (KOC), which did not occupy a substantial share in the exports of Myanmar in 2010. Other products show a similar trend. Exports of shoes have increased from 1.12 per cent to 2.68 per cent and oil seeds from 1.50 per cent to 2.85 per cent. Cereal exports, mainly dominated by rice products, have increased from 3.62 per cent to 12.83 per cent. Lastly, copper exports also increased from 1.11 per cent to 4.51 per cent. On the other hand, products such as precious stones and wood have experienced
17 HS 170199 and HS 170191 are product varieties of cane or beet sugar.18 HS 6110 are product varieties of jerseys, pullovers, cardigans and waistcoats, while HS 6102 are women’s or girls’ overcoats, car-coats,
capes, and the like. 19 HS 720620 is ferro-nickel, in granular/powder form, while HS 720827 is flat-rolled products of iron/non-aluminum.
a drastic decline over the seven-year period, from almost 40 per cent to less than 4 per cent and from 12.83 per cent to 2.15 per cent, respectively. Vegetables follow the same trend of decline, from 18.85 per cent down to 8.72 per cent, rubber from 4.12 per cent to 2.13 per cent, and fish from 6.87 per cent to 5.67 per cent.
Most importantly, as shown in figure 1.3, multiple newcomers appeared in the export basket, even though with modest trade flows:
• Sugar products with 7.55 per cent: top export products include HS 170199 and HS 170191;17
• Garments (KoC) with 5.8 per cent: top export products include HS 6110 and 6102;18
• Iron and steel with 3.29 per cent: top export products include HS 720260 and HS 720827.19
Vegetables18,85%
Wood12,83%
Vegetables8,72%
Wood2,15%
Garments(not KoC)
7,74%
Garments(not KoC)22,10%
Fisch6,87%
Fisch5,67%
Rubber4,12%
Rubber2,13%
Other2,71%
Cereals3,62%
Oil Seeds1,50%
Footwear1,12% Copper
1,11%
Precious Stones39,52%
Other9,18%
Aircraft2,18%
Fruits/Nuts2,28%
Ships2,49%
Footwear2,68%
Oil Seeds2,85%
Iron & Steel3,29%
PreciousStones3,60%
Copper4,51%
Garments(KoC)
5,80%
Sugar7,55%
Cereals12,83%

5
Identifying a Positive Agenda Among Challenges and Opportunities
1.3 The actual positioning of Myanmar in the international trade scene and potential leading role of an ASEAN least developed country agenda
This analysis of Myanmar trade flows shows that besides the buoyant export performance of the last years, exports remain heavily concentrated in terms of products and destinations. This is a sign of fragility and exposes the country to trade shocks. Changes of market access due to the moving trade environment may induce factories to shift their location.
Myanmar is dependent on a handful of country–product pairs and destinations such as:
(a) European Union market for garments exports;
(b) India for beans;
(c) China for natural gas, rice and sugar.
As detailed in table 1 further below once the export volume and overall impact on the country economy of natural gas and China is considered ,it is important to emphasize that the exports of garments, shoes and beans are closely interconnected to employment, rural development and manufacturing capacity. Yet, as identified in this study, market access and exports of these three products are subject to externalities linked to trade policy choices and actions that need to be undertaken by Myanmar to stabilize market access. Most importantly, the European Union is presently engaged in a series of negotiations or trade initiatives that are set to profoundly modify market access as discussed in this study; and the trade policy of India is rather unstable ,as recently shown by the withdrawal from RCEP in 2019, and the overall negotiating stance of India in WTO . In addition, the overall dynamism of some ASEAN countries, such as Viet Nam, to enter FTA initiatives may affect Myanmar as a location for foreign direct investment (FDI).
Deterioration or erosion of the preferential market access to the European Union could provoke a series of business decisions by manufacturers currently located in Myanmar. In addition, albeit showing some dynamism, the regional markets, notably ASEAN and China, are not a substitute for market access to
20 See CP-TPP 11 appendix 1 to annex 4-A, textiles and apparel product-specific rules of origin.21 In 2017, utilization rates of European Union trade preferences averaged of Cambodia, the Lao People’s Democratic Republic and Myanmar
amounted respectively to to 95.6 per cent, 94.7 per cent and 94.0 per cent. 22 See http://trade.ec.europa.eu/doclib/press/index.cfm?id=1981 for further details.
the European Union and Japan in the short term for garments and shoes.
ASEAN and China are not only competing on the same products exported by Myanmar to the European Union and Japan, but the regional market access provided by ASEAN FTAs dialogue partners is not equivalent to the one of the European Union in terms of tariff and rules of origin. An early analysis of RCEP texts, carried out in section 3, indicates that RCEP may not be a substitute or could not improve drastically the existing market access that Myanmar might benefit from the existing ASEAN FTAs in combination with DFQF initiatives.
The CP-TPP has now entered into force and is expected to provide increased market access to the most formidable competitor of Myanmar, this being Viet Nam. Albeit constrained by stringent rules of origin demanding a yarn forward triple transformation, Viet Nam is set to progressively gain increased market access to Canada for garments as well as exploiting the provisions made in CP-TPP for products in short supply.20
It is important to realize that the actual trading scenario rapidly taking shape around Myanmar is also valid for the other ASEAN LDCs that have also substantially benefited from unilateral trade preferences. In fact, both Cambodia and the Lao People’s Democratic Republic, albeit to a different extent than Myanmar , are heavily dependent on garment exports and other products showing high utilization rates of EBAs and other unilateral trade preferences.21 The buoyant performances of these two other ASEAN LDCs are equally subject to erosion of trade preferences described above for Myanmar. In the case of Myanmar, as well as Cambodia, the EBA trade preferences are also subject to high degree of uncertainty due to non-trade related conditionalities.22 Yet for Myanmar there has not been any formal step to initiate the suspension of EBA as in the case of Cambodia.
What is most important to underscore is that not only the trade scenario is similar for the ASEAN LDCs but also the trade policy response from the respective Governments. Cambodia, the Lao People’s Democratic Republic and Myanmar, the ASEAN LDCs, have been so far equally unable to mature an adequate trade policy strategy and roadmap to respond to and counteract a trade scenario that is progressively marginalizing their economies and reducing the market

6
Towards a New Trade Policy on Market Access for Myanmar:
access opportunities that have been a key element to their recent economic growth.
In order to quickly react to the current situation, there is an urgent need to develop an individual and collective coordinated policy response by ASEAN LDCs to be brought forward in the different negotiating forums. Recently,23 the Geneva-based delegates of the ASEAN LDCs have taken part in a first meeting to initiate such a progress with a respective message to their capitals outlining the scope and merit of an ASEAN LDC coordinated strategy. Such an initiative stemmed from the experience gained by Cambodia during the negotiations of the WTO Nairobi Decision where Cambodia reached out for support from other ASEAN LDCs to advance its request to redress the imbalances
23 A first meeting was held in December 2018 between the Ambassador of Cambodia to WTO and the counsellors of Myanmar and the Lao People’s Democratic Republic.
arising from the exclusion from ASEAN cumulation of Malaysia and the future implications arising from the European Union–ASEAN FTAs. These first signs of collaboration of Geneva-based Delegates of ASEAN LDCs have been affected by the COVID -19 crisis.
It is recommended that as a matter of priority Myanmar reaches out to other ASEAN LDCs to establish a consultative and coordinated group among capitals and Geneva-based delegations at WTO to build up a coordinated positive agenda as suggested in this chapter. Through this mechanism, the ASEAN LDCs should be able to quickly develop a more assertive and autonomous positive agenda in the different negotiating scenario in WTO and at regional level as further outlined in section 5.

7
Identifying a Positive Agenda Among Challenges and Opportunities
2.1 The erosion and/or loss of trade preferences
Tariff preferences have played an important role in determining the growth of Myanmar’s exports during the last decade and even more pronouncedly in the recent years. Myanmar exports enjoy duty-free market access under a variety of duty-free quota-free (DFQF) programmes that developed, and some developing countries have put in place for LDCs.
Figure 2.1 and figure 2.2 show the preponderant importance of trade preferences in Myanmar current market access especially for manufactured products.The amount of trade volume that received European
24 Although Chile and India provide DFQF to LDCs, there is a relatively low level of utilization of trade preferences to ASEAN LDCs especially in the case of Myanmar, hence, they are not presented here.
25 See Rules of Origin in ASEAN: A Way Forward, Stefano Inama and Edmund Sim, Cambridge University Press, 2015.
Union preferences amounts to almost $1.5 billion in 2017 and $861 million in the Japanese market. Although of a different size, Myanmar is also enjoying trade preferences in Australia, Canada, Norway, the Republic of Korea, and the United States, as presented in figure 2.1 below.24
In addition, Myanmar is benefiting from duty-free access within ASEAN and from the trade preferences under the FTAs concluded by ASEAN with ASEAN dialogue partners. There is a series of findings25 indicating that these regional preferences have not been fully utilized due to inherent complexities that are far from being addressed even under the ASEAN Economic Council (AEC) initiative and ASEAN Trade in Goods Agreement (ATIGA).
2. MYANMAR AND THE EMERGING TRADE CHALLENGES – THE EROSION AND LOSS OF PREFERENTIAL MARKET
ACCESS AND RULES OF ORIGIN AND THE QUEST FOR ALTERNATIVES
Figure 2-1: Utilization of preferential scheme
13%
18%
69%
CAN-2017
26%
45%
3%
26%
USA-2017
12% 4%
7%
77%
JPN-2017
8%6%
86%
EUN-2017
73%
7%
20%
AUS-2016
15%
49%8%
28%
KOR-2016
24%
76%
NOR-2015 Imports MFNFree
Imports DutiableNot Covered
Imports CoveredNot Utilized
Receiving Pref.Treatment

8
Towards a New Trade Policy on Market Access for Myanmar:
The duty-free access provided by preferential trading arrangements dramatically improves Myanmar’s competitive position, especially for products where MFN duties are high. In the European Union, for example, the average MFN (that is, non-preferential) import duty on garments is 12 per cent, while the MFN duties on shoes is 10 per cent.26 Under the European Union GSP for developing countries the preferential margin is only of 3.5 per cent for the majority of products and 20 per cent cut of MFN rate for garments i.e. making the preferential rates of duty 9.6 per cent instead of 12 per cent.
These differences of applicable import duties in preference-giving countries could be large when compared to profit margins and increase significantly in some cases doubling the profitability of export-oriented production in Myanmar, as compared with export production of the same goods in a country that does not enjoy duty-free privileges. This, in turn, provides an important incentive to invest and expand exports in those sectors in Myanmar provided that such margins are stable.
The duty-free access that Myanmar enjoys under various trade preference arrangements has been one of the key elements explaining the rapid growth and changing destinations of Myanmar’s manufactured exports. This aspect has to be examined in light of the changing trade scenario as the key determinant of export performance in the period ahead.
26 Ranging between 3.5 and 17 depending on the tariff line considered.
It should be noted that in 2018, at the last triennial review of the LDCs list, the Committee for Development Policy (CDP) concluded that Myanmar was pre-eligible for graduation. With a GNI per capita of $1,255 (> $1,230), a Human Asset Index (HAI) of 68.5 (> 66) and an Economic Vulnerability Index (EVI) of 31.7 (< 32), the country met the three graduation thresholds. To be recommended for graduation, Myanmar has to be found eligible at two consecutive triennial reviews in fulfilling at least two of the three criteria. Therefore, if Myanmar maintains its position (or still meet two out of the three graduation thresholds) at the next review, the country will be recommended in 2021. The effective date of graduation would therefore lie between 2021 and 2024 given the possible grace period of three years.
Independently but linked to the issue of graduation from the LDC status is the preference erosion that Myanmar and other ASEAN LDCs are suffering from the parallel trade initiatives undertaken by their ASEAN neighbours and in the region overall.
As discussed in the sections that follow, the real challenge for Myanmar and other ASEAN LDCs is the dynamism of the trade scenario in the Asian region, where a number of neighbouring countries are engaged in triple track negotiation in different trade agreements such as RCEP, CP-TPP and European Union–ASEAN FTAs.
Figure 2-2: Preferential imports granted by QUAD to Myanmar, 2017 (millions of United States dollars)
12
145
134
101
0
41
172
17
95
81
10
65
1 484
861
98
0% 20% 40% 60% 80% 100%
CAN
EUN
JPN
USA
Imports MFN Free Imports Dutiable Not CoveredImports Covered Not Utilized Receiving Pref. Treatment

9
Identifying a Positive Agenda Among Challenges and Opportunities
Table 1 has been assembled to identify to what extent the markets of China and India could be a substitute for the preferential market access to QUAD countries that may deteriorate in the near future .The table shows the top 19 most-exported products at the HS six-digit level of Myanmar to the world in descending order by export value. These most-exported products from Myanmar are matched with the import trade values of the same products of China and India, the two major markets that could replace QUAD countries as recipients of Myanmar’s major exports.
The table clearly shows that China and India are not substitute export markets for garments to the European Union and Japan. Just a handful of Myanmar’s top garment exports27 to the European Union and Japan totals almost $590 million28 while China and India only import $247 million from the world.
27 This includes namely men’s jackets, suits and shirts and women’s blouse and shirts.28 Values are calculated from Myanmar’s export to the European Union and Japan for the following products: HS 620339, HS620319,
HS620690 and HS620520.29 The Lao People’s Democratic Republic, another ASEAN LDC, is the top competitor of brown rice exports of Myanmar to China. The total
export of both ASEAN LDCs account for almost the total world import of China for husked brown rice.
Conversely, both India and China appear to be possible markets for rice, sugar and other agricultural exports provided that SPS measures are met in these countries and that there are no other NTMs limiting market access.
Currently, Myanmar is one of the first principal suppliers for dried beans and the second principal supplier of husked brown rice29 to China. In the case of India, Myanmar also occupies the place of first principal supplier of husked brown rice.
Hence, the trade policy actions of Myanmar should be, in the short run, directed to stabilizing access to the European Union and Japan on the existing exports and gaining increased market access in China and India, especially by eliminating the NTMs that may hamper or restrict market entry.

10
Towards a New Trade Policy on Market Access for Myanmar:
Tabl
e 1:
Ne
w m
arke
t pro
spec
ts fo
r Mya
nmar
mos
t exp
orte
d pr
oduc
ts –
Chi
na a
nd In
dia
as p
ossi
ble
reci
pien
ts o
f Mya
nmar
sup
ply
capa
city
, 201
7
HS c
ode
Prod
uct d
escr
iptio
n
MM
R ex
ports
($ th
ousa
nds)
and
sha
res
( per
cen
t)Ch
ines
e Im
port
($ th
ousa
nds)
from
Indi
an Im
ports
($ th
ousa
nds)
from
To w
orld
To 1
st d
est.
To 2
nd d
est.
Wor
ld1s
t sup
plie
r2n
d su
pplie
rM
MR
Wor
ld1s
t sup
plie
r2n
d su
pplie
rM
MR
Valu
e%
Cum
ISO3
Valu
eIS
O3Va
lue
ISO3
Valu
eIS
O3Va
lue
ISO3
Valu
eIS
O3Va
lue
12
34
56
78
910
1112
1314
1516
1718
1920
21
2711
11Na
tura
l gas
, liq
uefie
d2
986
970
21.6
21.6
THA
1 96
7 26
4.5
CHN
1 01
9 70
5.7
14 7
49 6
37AU
S6
204
004
QAT
3 35
1 26
71
019
706
7 20
7 57
2QA
T3
779
684
NGA
901
534.
50
1006
20Hu
sked
(bro
wn)
rice
813
366.
65.
927
.5CH
N52
7 60
2.9
BGD
75 5
99.6
35 4
29.4
LAO
28 4
49.0
MM
R5
992.
45
992.
411
9.4
CAN
62.5
USA
52.0
0
7133
1Be
ans
drie
d, s
helle
d, w
/o s
kinn
ed s
plit
747
274.
95.
432
.9IN
D31
7 20
5.6
CHN
170
702.
626
416
.1M
MR
11 2
21.7
AUS
8 31
8.2
11 2
21.7
366
508.
5M
MR
269
907.
9TZ
A23
987
.526
9 90
7.9
7403
11Ca
thod
es &
sec
tions
of c
atho
des,
of r
efine
d co
pper
, un
wro
ught
489
894.
83.
636
.5CH
N23
3 14
9.8
THA
136
792.
919
134
529
.3CH
L6
888
211.
8IN
D2
143
615.
826
1 36
1.2
177
657.
5JP
N11
7 11
1.4
COG
41 1
16.5
0
1701
99Ca
ne/b
eet s
ugar
420
323.
93.
039
.5CH
N41
9 38
9.0
IND
655.
124
5 68
9.9
KOR
101
254.
7TH
A93
747
.10.
15
205.
2EU
272
009.
9US
A1
266.
70
7103
10Pr
ecio
us s
tone
s (e
xcl.
diam
onds
) & s
emi-p
reci
ous
ston
es35
9 98
1.5
2.6
42.1
CHN
343
522.
5HK
G16
349
.497
277
.2M
MR
31 4
30.7
RUS
11 2
87.2
31 4
30.7
838
229.
2HK
G47
1 67
3.7
ARE
116
974.
40
7202
60Fe
rro-n
icke
l (gr
anul
ar/p
owde
r)34
5 04
2.2
2.5
44.6
CHN
320
009.
1IN
D10
836
.92
650
664.
8ID
N1
376
030.
1NC
L39
1 39
8.5
322
355.
835
5 07
2.1
IDN
103
847.
3DO
M40
374
.613
242
.2
1701
91Ca
ne/b
eet s
ugar
338
090.
12.
547
.1CH
N33
7 74
3.0
THA
347.
148
.1US
A47
.7OA
S0.
10
27.6
CHN
27.4
SGP
0.3
0
2711
21Na
tura
l gas
, in
gase
ous
stat
e28
6 24
4.3
2.1
49.2
CHN
286
244.
3.
.8
523
380.
4TK
M6
526
055.
6M
MR
1 17
2 11
3.0
1 17
2 11
3.0
..
..
.0
1005
10M
aize
(cor
n), s
eed
286
020.
32.
151
.2CH
N27
1 73
1.3
VNM
11 3
67.0
2 18
9.1
EU27
1 78
7.9
ARG
226.
80
191.
7NP
L14
9.5
UNS
35.9
0
2710
19Pe
trole
um o
ils &
oils
277
725.
42.
053
.3CH
N27
7 44
0.6
IND
271.
610
315
826
.6SG
P3
320
177.
0KO
R2
998
085.
40
3 11
4 82
8.8
ARE
803
373.
6KO
R59
9 29
7.0
0
6203
39M
/B's
jack
ets
& bl
azer
s (e
xcl.
KcC)
, tm
(e
xcl.6
203.
31-6
203.
33)
243
306.
51.
856
.9EU
2715
6 67
2.4
JPN
56 5
37.6
13 4
05.5
EU27
10 3
03.6
TUR
902.
286
.32
927.
3EU
2786
8.9
NPL
718.
73.
2
1006
40Br
oken
rice
201
370.
41.
559
.9EU
2781
487
.8CH
N41
303
.032
6 09
1.0
THA
162
648.
2VN
M12
5 90
7.7
35.0
22.5
UNS
22.5
..
0
6203
19M
/B's
sui
ts (e
xcl.
KoC)
, tm
(exc
l. of
w/f
a /s
)20
0 51
7.2
1.5
61.4
EU27
97 1
23.0
JPN
57 7
60.9
1 20
4.2
EU27
1 09
9.5
TUR
60.2
016
9.8
EU27
84.2
SGP
25.5
0
3026
9Fi
sh, n
.e.s
. in
03.0
2, fr
esh/
chille
d (e
xcl.
fille
ts/o
ther
fis
h m
eat o
f 03.
04/li
vers
& ro
es)
183
838.
11.
362
.7TH
A12
4 95
6.0
CHN
37 6
16.1
32 5
42.9
OAS
18 7
87.8
IDN
5 59
1.8
010
994
.4BG
D9
826.
2M
MR
644.
164
4.1
6206
90W
/G's
blo
use,
shi
rt or
blo
use
shirt
(exc
l. Ko
C),
of tm
oth
er th
an s
ilk/s
ilk w
aste
/w/f
a/s/
cotto
n/18
1 73
4.2
1.3
64.0
EU27
99 8
36.3
JPN
39 7
77.9
2 62
2.9
EU27
593.
5ID
N40
6.9
084
4.4
EU27
318.
9CH
N20
3.9
0
6205
20M
/B's
shi
rts (e
xcl.
KoC)
, of c
otto
n16
4 17
5.0
1.2
65.2
EU27
78 3
85.8
KOR
56 4
72.8
190
218.
4VN
M47
218
.2EU
2736
187
.51
247.
936
510
.1EU
2714
328
.4BG
D9
809.
313
242
.2
1207
40Se
sam
um s
eeds
, w/o
bro
ken
164
157.
31.
266
.4CH
N11
9 86
7.7
KOR
15 1
54.5
733
924.
8ET
H23
5 99
7.5
SUD
182
318.
30
43 5
11.1
SUD
26 0
54.0
NIG
10 8
55.9
0
4001
21Na
tura
l rub
ber (
excl
. lat
ex),
in s
mok
ed s
heet
s16
1 66
2.7
1.2
67.6
CHN
128
678.
8M
YS20
289
.568
4 48
4.6
THA
503
675.
9M
MR
99 0
71.5
99 0
71.5
108
733.
3TH
A45
296
.1ID
N25
778
.832
3.9
* O
ther
than
cot
ton
or m
an-m
ade
fibre
s; *
* ot
her
than
woo
l or
fine
anim
al h
air
or c
otto
n or
syn
thet
ic fi
bres
; TM
: tex
tile
mat
eria
ls; K
oC: k
nitt
ed o
r cr
oche
ted;
OTC
: oth
er th
an o
f cot
ton.
Not
e: E
xclu
ding
HS
890
520
and
HS
880
420.

11
Identifying a Positive Agenda Among Challenges and Opportunities
Under this scenario it is vital for Myanmar to identify trading partners for its current supply capacity of main exports: garments and agricultural products such as cereals, rice, seeds and vegetables.
It clearly emerges from table 1 that both China and India markets are not a substitute for the European Union and Japan markets as far as exports of Myanmar garments are concerned, since the import figures in both China and India are minimal for garments and sugar. The table also clearly shows China may be a prospective market for rice as further discussed in the sections below.
2.2 The quest for alternatives: Which partner for an FTA?
As shown in the following sections, there are a number of alternatives and possibilities that Myanmar and ASEAN LDC may pursue in the quest for possible trade partners. In any case Myanmar has to:
30 The tables provide a tentative comparison of the disciplines included in the various agreements that needs to be further studied and validated. As such, they do not pretend to be exhaustive or updated.
(a) First assess the value added that each initiative may bring to the current market access;
(b) Identify the conditions for acceding to such agreement as in the case of the CP-TPP or the offers and concessions that Myanmar is making during negotiations, as in the case of RCEP;
(c) Assess what the costs and benefits are of entering into FTAs that are containing WTO-plus commitment or new issues such as the CP-TPP.
This is a complex exercise that may only be initiated under the current study given its limitation. It is therefore highly recommended that Myanmar conduct further analysis at sectorial level and expand the skeleton comparison tables below (tables 2-4).30
According to findings of this preliminary analysis the following sections will examine the major challenges in the most important export markets of Myanmar in conjunction with the evolving trade scenario.

12
Towards a New Trade Policy on Market Access for Myanmar:
Tabl
e 2:
Mar
ket a
cces
s an
d ru
les
of o
rigin
pro
visi
ons
– Co
mpa
rison
acr
oss
FTAs
AEC
ASEA
N –
Chin
aAS
EAN
– Ja
pan
ASEA
N –
Indi
aCP
-TPP
Eu
rope
an U
nion
– V
iet N
am
RCEP
Mar
ket a
cces
s
Acco
rdin
g to
ATI
GA,
DFQF
trea
tmen
t to
Mya
nmar
exp
orts
to
ASEA
N co
untri
es.
Mar
ket a
cces
s in
term
s of
tarif
f pha
se o
ut sh
ould
ha
ve b
een
com
plet
ed b
y 20
15.
How
ever
, su
ch
com
mitm
ent
is s
ubje
ct
to
reci
proc
ity
clau
ses
and
excl
usio
ns.
Mar
ket
acce
ss in
ter
ms
of t
ariff
ph
ase
out
wou
ld b
e co
mpl
eted
by
20
26.
Ther
e ar
e at
le
ast
five
tarif
f sc
hedu
le t
ypes
whe
re
tarif
f lin
es
indi
cate
d w
ith
“A”
shal
l be
elim
inat
ed a
s fro
m t
he
date
of
entry
int
o fo
rce
of t
he
agre
emen
t.31
Tarif
fs o
n ov
er 4
,000
pro
duct
lin
es h
ave
been
el
imin
ated
by
2016
. Pr
oduc
t ta
riff
elim
inat
ion
is
subj
ect
to t
wo
track
s: n
orm
al t
rack
and
sen
sitiv
e tra
ck.
For
prod
ucts
und
er t
he n
orm
al t
rack
, th
eir
resp
ectiv
e ap
plie
d M
FN
tarif
f ra
tes
grad
ually
re
duce
d or
elim
inat
ed in
acc
orda
nce
with
spe
cifie
d sc
hedu
les
and
rate
s ov
er p
erio
ds b
etw
een
2006
to
2011
or
2006
to 2
016,
dep
endi
ng o
n th
e sp
ecifi
c co
untry
. Pro
duct
und
er th
e Se
nsiti
ve tr
ack
have
thei
r re
spec
tive
appl
ied
MFN
tar
iff r
ates
pro
gres
sive
ly re
duce
d/el
imin
ated
w
ithin
tim
efra
mes
to
be
m
utua
lly a
gree
d be
twee
n th
e Pa
rties
.
The
tarif
f cu
t fo
r th
e in
itial
six
coun
tries
to
rat
ify t
he C
P-TP
P to
ok p
lace
on
30
Dece
mbe
r 20
18.
The
seco
nd t
ariff
cut
w
ill be
on
1 Ja
nuar
y 20
19, e
xcep
t Jap
an,
whi
ch
is
sche
dule
d on
1
April
20
19.
Viet
Nam
has
tw
o ta
riff
cuts
in t
erm
s of
Ca
nadi
an im
ports
but
onl
y on
e fo
r all
othe
r co
untri
es.
Tarif
f el
imin
atio
n in
form
atio
n fo
r th
e re
mai
ning
CP-
TPP
coun
tries
(i.e
. Br
unei
Dar
ussa
lam
, Ch
ile,
Mal
aysi
a, a
nd
Peru
) w
ill be
mad
e av
aila
ble
once
tho
se
coun
tries
ratif
y th
e Ag
reem
ent.32
Mar
ket
acce
ss in
ter
ms
of t
ariff
pha
se
out
have
sev
en t
ypes
of
tarif
f sc
hedu
le,
whi
ch h
as d
iffer
ent t
ime
perio
d sp
anni
ng
from
imm
edia
te re
mov
al o
f tar
iff u
p to
16
equa
l an
nual
sta
ges
of r
emov
ing
tarif
f, be
ginn
ing
from
the
dat
e of
ent
ry o
f th
e ag
reem
ent.33
RCEP
mar
ket a
cces
s of
fer i
s su
mm
ariz
ed in
tabl
e 9.
Rule
s of
Orig
in
Prod
uct-
spec
ific
rule
s of
orig
in in
ATI
GA a
re
not a
dmin
iste
red
in a
tra
nspa
rent
man
ner
and
ther
e is
no
agen
da
in A
EC to
revi
ew th
em.
Prod
uct-
spec
ific
rule
s of
orig
in a
re p
rese
nted
in
ann
ex A
of t
his
chap
ter.
The
mai
n te
xt o
f rul
es o
f orig
in
has
11 p
ages
34 p
rodu
ct s
peci
fic
rule
s of
Orig
in c
onta
ins
63
page
s.35
The
mai
n ru
les
of o
rigin
text
hav
e 26
pag
es a
nd th
e PS
RO c
onta
ins
27 p
ages
.36
CP-T
PP r
ules
of
orig
in a
re o
f a
mod
ern
type
pr
oduc
t-sp
ecifi
c ga
rmen
ts
PSRO
s ar
e re
quiri
ng
tripl
e tra
nsfo
rmat
ion
on
garm
ents
: 1) n
on o
rigin
atin
g co
tton
fibre
s in
to y
arn,
2)Ya
rn i
nto
fabr
ic 3
) fa
bric
int
o ga
rmen
ts
The
Euro
pean
Un
ion–
Viet
Na
m
FTA
rule
s of
orig
in a
re p
rodu
ct s
peci
fic a
nd
cont
aine
d in
ann
ex II
of P
roto
col 1
of t
he
agre
emen
t.37
The
rule
s of
or
igin
fo
r ga
rmen
ts
of
chap
ters
61
an
d 62
re
quire
do
uble
tra
nsfo
rmat
ion
and
rule
s of
orig
in f
or
bicy
cles
requ
ire a
valu
e of
non
-orig
inat
ing
mat
eria
l no
t ex
ceed
ing
45
per
cent
. AS
EAN
cum
ulat
ions
are
onl
y fo
r oc
topu
s an
d sq
uid.
Ext
ende
d cu
mul
atio
n ex
ists
w
ith th
e Re
publ
ic o
f Kor
ea fo
r fab
rics.
The
mai
n te
xt is
111
pag
es lo
ng
and
the
text
of
PSRO
s is
eve
n lo
nger
.
31
See
htt
ps:/
/ww
w.a
sean
.org
/sto
rage
/imag
es/a
rchi
ve/a
gree
men
ts/A
JCE
P/A
nnex
1.pd
f for
furt
her
deta
ils.
32
See
htt
ps:/
/inte
rnat
iona
l.gc.
ca/t
rade
-com
mer
ce/t
rade
-agr
eem
ents
-acc
ords
-com
mer
ciau
x/ag
r-ac
c/C
P-T
PP
-ptp
gp/t
ariff
-elim
inat
ion-
droi
ts_d
e_do
uane
.asp
x?la
ng=
eng
for
furt
her
deta
ils.
33
See
htt
p://
trad
e.ec
.eur
opa.
eu/d
oclib
/doc
s/20
18/s
epte
mbe
r/tr
adoc
_157
340.
pdf f
or fu
rthe
r de
tails
.34
S
ee c
hapt
er 3
of A
SE
AN
-Jap
an F
TA C
ompr
ehen
sive
agr
eem
ent a
t htt
p://
ajce
p.as
ean.
org/
wp-
cont
ent/
uplo
ads/
2014
/05/
Agr
eem
ent.p
df fo
r fu
rthe
r de
tails
.35
S
ee h
ttp:
//aj
cep.
asea
n.or
g/w
p-co
nten
t/up
load
s/20
14/0
5/A
nnex
2.pd
f for
furt
her
deta
ils.
36
See
htt
p://
ww
w.th
aila
ndnt
r.com
/en/
good
s/ro
o fo
r fu
rthe
r de
tails
.37
S
ee h
ttp:
//tr
ade.
ec.e
urop
a.eu
/doc
lib/d
ocs/
2018
/sep
tem
ber/
trad
oc_1
5738
1.pd
f for
furt
her
deta
ils.

13
Identifying a Positive Agenda Among Challenges and Opportunities
Tabl
e 3:
SPS
, TBT
and
ser
vice
s pr
ovis
ions
– c
ompa
rison
acr
oss
FTAs
AEC
ASEA
N–Ch
ina
ASEA
N–Ja
pan
ASEA
N–In
dia
CP-T
PP
Euro
pean
Uni
on–V
iet N
am
RCEP
SPS
and
TBT
No W
TO-p
lus
in A
TIGA
ap
art a
mec
hani
sm to
se
ttle
NTM
.
A pr
otoc
ol h
as b
een
sign
ed u
nder
ACF
TA
with
no
evid
ent
WTO
-plu
s si
gnifi
cant
pr
ovis
ions
.
No e
xplic
it W
TO-p
lus
prov
isio
n on
SPS
.No
pro
visio
n on
SPS
in th
e te
xt.
Ther
e ar
e sp
ecifi
c pr
ovis
ions
and
mec
hani
sms.
Ther
e ar
e sp
ecifi
c pr
ovis
ions
and
mec
hani
sms.
As te
xt o
f RCE
P is
no
t ava
ilabl
e it
is n
ot
poss
ible
to m
ake
an
asse
ssm
ent.
Serv
ices
Serv
ices
are
incl
uded
in
AFA
S bu
t the
ef
fect
ive
degr
ee o
f im
plem
enta
tion
is
uncl
ear.
Serv
ices
are
incl
uded
in
ACFT
A bu
t the
deg
ree
of e
ffect
ive tr
ade
liber
aliza
tion
is u
ncle
ar.
No s
ched
ule
for t
rade
lib
eral
izatio
n on
trad
e in
se
rvic
es.
ASEA
N-In
dia
FTA
on tr
ade
in
serv
ices
and
inve
stm
ent 2
012
(ratifi
ed b
y M
MR)
.
WTO
-plu
s ne
gat
ive
list
app
roac
h w
ith
stan
dstil
l and
rat
chet
mec
hani
sms
to c
aptu
re f
utur
e lib
eral
izatio
n.
Serv
ices
are
incl
uded
in c
hapt
er 8
: lib
eral
izatio
n of
inve
stm
ent,
trade
in
ser
vices
and
ele
ctro
nic
com
mer
ce.
As te
xt o
f RCE
P is
no
t ava
ilabl
e it
is n
ot
poss
ible
to m
ake
an
asse
ssm
ent.
Tabl
e 4:
Inv
estm
ents
, ISD
S, la
bour
and
env
ironm
ent c
laus
es –
com
paris
on a
cros
s FT
As
AEC
ASEA
N-Ch
ina
ASEA
N-Ja
pan
ASEA
N -In
dia
CP-T
PP
Euro
pean
Uni
on–V
iet N
amRC
EP
Inve
stm
ent a
nd IS
DS
Inve
stm
ent i
s in
clud
ed
but n
o IS
DS.
Inve
stm
ent i
s in
clud
ed
but n
o IS
DS.
Not p
rese
nt in
the
FTA
text
.AS
EAN-
Indi
a FT
A on
trad
e in
se
rvic
es a
nd in
vest
men
t 201
2 (ra
tified
by
MM
R).
CP-T
PP m
embe
rs b
enefi
t fro
m a
com
preh
ensi
ve s
et
of in
vest
men
t pro
tect
ion
prov
isio
ns, i
nclu
ding
aga
inst
ex
prop
riatio
n an
d de
nial
of j
ustic
e an
d a
mec
hani
sm
for t
he re
solu
tion
of in
vest
men
t dis
pute
s.
Ther
e is
a c
ompr
ehen
sive
inve
stm
ent
prot
ectio
n ag
reem
ent
with
4
chap
ters
and
13
appe
ndix
es.
Amon
g th
ese
chap
ters
, a
clea
r in
vest
men
t pr
otec
tion
right
s ar
e sp
ecifi
ed o
n ch
apte
r 2
whi
le
deta
ils o
n di
sput
e se
ttlem
ent m
echa
nism
s ar
e de
taile
d in
cha
pter
15
ent
itled
“Di
sput
e se
ttlem
ent.”
NAI
Labo
ur c
laus
es
Not p
rese
ntNo
t pre
sent
Not p
rese
nt in
the
FTA
text
.No
t pre
sent
The
CP-T
PP i
nclu
de a
cha
pter
req
uirin
g th
at t
he
basi
c w
orke
rs’ r
ight
s38 r
eflec
ted
in la
w a
nd p
ract
ice,
i.e
. the
elim
inat
ion
of c
hild
labo
ur, f
orce
d la
bour
and
di
scrim
inat
ion,
and
resp
ect f
or fr
eedo
m o
f ass
ocia
tion
and
the
right
to b
arga
in c
olle
ctive
ly.
The
Euro
pean
Uni
on a
nd V
iet
Nam
hav
e ag
reed
to
impl
emen
t th
e co
re la
bour
sta
ndar
ds a
nd C
onve
ntio
ns o
f the
Inte
rnat
iona
l Lab
our
Orga
niza
tion
(ILO)
. Vie
t Nam
has
so
far o
nly
ratifi
ed fi
ve o
f the
eig
ht
core
ILO
conv
entio
ns;
whe
reas
it h
as n
ot r
atifi
ed IL
O Co
nven
tion
No 8
7 on
Fre
edom
of
Asso
ciat
ion
and
Prot
ectio
n of
the
Rig
ht t
o Or
gani
ze, N
o 98
on
the
Righ
t to
Orga
nize
and
Col
lect
ive
Barg
aini
ng,
or N
o 10
5 on
the
Abol
ition
of F
orce
d La
bour
.39
NAI
Not p
rese
ntNo
t pre
sent
Not p
rese
nt in
the
FTA
text
.No
t pre
sent
The
CP-T
PP A
gree
men
t inc
lude
s pro
visio
ns to
enh
ance
en
viron
men
tal p
rote
ctio
n in
the
CP-T
PP re
gion
and
to
addr
ess
glob
al e
nviro
nmen
tal c
halle
nges
.
The
Euro
pean
Un
ion-
Viet
Na
m
incl
udes
en
viron
men
tal
clau
ses
spec
ifica
lly fo
cusi
ng o
n re
new
able
ene
rgy.40
NA
I
38
As
cont
aine
d in
the
Inte
rnat
iona
l Lab
our
Org
aniz
atio
n 19
98 D
ecla
ratio
n on
Fun
dam
enta
l Prin
cipl
es a
nd R
ight
s at
Wor
k.39
S
ee h
ttp:
//w
ww
.eur
opar
l.eur
opa.
eu/s
ides
/get
Doc
.do?
pubR
ef=
-%2f
%2f
EP
%2f
%2f
TEXT
%2b
TA%
2bP
7-TA
-201
4-04
58%
2b0%
2bD
OC
%2b
XML%
2bV
0%2f
%2f
EN
&la
ngua
ge=
EN
for
furt
her
deta
ils.
40
See
htt
p://
trad
e.ec
.eur
opa.
eu/d
oclib
/doc
s/20
18/s
epte
mbe
r/tr
adoc
_157
353.
pdf f
or fu
rthe
r de
tails
.
NA
I: N
o av
aila
ble
info
rmat
ion.

14
Towards a New Trade Policy on Market Access for Myanmar:
2.3 Building new trade initiative with the European Union in view of the European Union-ASEAN FTAs
2.3.1 The European Union reform of rules of origin: what did it mean for Myanmar?
The European Union reform on the rules of origin (RoO) which entered into force in 201141 contained drastic changes to the European Union rules of origin in favour of both LDCs and developing countries, as follows:
• Introduced a differentiation in favour of LDCs that are benefiting from more lenient rules of origin than developing countries in certain sectors;
• Allowed a single transformation process in textiles and clothing – a request that the LDCs had been advocating for more than a decade;
• Raised the threshold of the use of non-originating materials from 40 per cent to 70 per cent for LDCs in many sectors;
• Eased the cumulation rules.
The new rules allowed duty-free entry of a garment that was sewn from two or more pieces using fabric produced anywhere. This meant that, for the first time,
41 See European Commission regulation No 1063/2010 of 18 November 2010 amending Regulation (EEC) No. 2454/93 laying down provisions for the implementation of Council Regulation (EEC) No 2913/92 establishing the Community Customs Code See Inama, Per aspera ad astra, the reform of the European Union GSP rules of origin, Journal of World Trade, 2011.
garments produced in Myanmar from fabric manufactured in China could secure duty-free access to the European Union. This change resulted in an immediate reaction in terms of trade values and utilization rates of European Union trade preferences by LDCs, including Myanmar. As shown in figure 2.3, the surge in exports from LDCs to the European Union market between 2010 and 2011 was particularly strong for products of HS chapter 62 with a rise in European Union imports from $3.1 billion to $4.5 billion and a utilization rates jumping from 46 per cent to 88 per cent in one year. In the case of Myanmar, after the reinstatement of its GSP, the impact was immediate – garments exports of chapters 61 and 62 to the European Union under EBA more than doubled in 2014 as compared to 2012, with a continuous increase until 2017 as shown in table 5 and figure 2.4.
In relative terms, the rise in Myanmar exports of knitted or crocheted garments (HS chapter 61) to the European Union has been more important (+318 per cent) as they started from a lower value than in the case of HS chapter 62. However, as can be seen in figure 2.4, trade values in both chapters 61 and 62 exhibit an exponential trend and utilization rates raised from zero in 2012 (not eligible for GSP) to 48 per cent in 2013 to reach, respectively, 89 per cent and 96 per cent in 2014.

15
Identifying a Positive Agenda Among Challenges and Opportunities
Figure 2-3: European Union imports of garments of HS 61 and HS 62 from LDCs
Figure 2-4: European Union imports of HS 61 and HS 62 from Myanmar
Aside from the primary export of Myanmar – garments, which is discussed below – there is an increase of exports in other sectors. This is mainly due to the reinstatement of EBA in the country and partly because of the European Union reform in 2011.
As shown in table 5, export products under the fisheries sector such as fish, crustaceous and molluscs (under HS chapters 3 and 16), have increased following the reinstatement of the EBA in 2013 until 2017 with an average growth of 10 per cent per annum. Rice exports have a steady increase from 2011 to 2017 with a dramatic
42 See /http://ec.europa.eu/environment/forests/pdf/Country_overview_Myanmar_25_10_2018.pdf for further details
jump one year after the reinstatement of the EBA and a year-on-year decline of 20 per cent during 2015 and 2016. Precious stones under HS chapter 71 follow the same pattern of exhibiting an overall increasing trend, particularly after the reinstatement of the EBA in 2013. Values surge from $378 thousand in 2011 to $87 million in 2017 (see table 5). Lastly, wood imports from Myanmar have an overall increase from 2011 to 2017 with year-on-year declines in 2013 and 2017. The decline in 2017 could be due to a temporary ban on teakwood and overall illegal trading activities in this sector.42
0
2 000
4 000
6 000
8 000
10 000
12 000
14 000
16 000
18 000
20 000
0%
10%
20%
30%
40%
50%
60%
70%
80%
90%
100%
2010 2011 2012 2013 2014 2015 2016 2017
Utilization Rate HS 61 (left axis) Utilization Rate HS 62 (left axis)
Total Imports HS 61 (right axis) Total Imports HS 62 (right axis)
Utiliz
ation
Rate
s
Tota
l Impo
rts(U
SD M
illion
s)0
100
200
300
400
500
600
700
800
900
1000
0%
10%
20%
30%
40%
50%
60%
70%
80%
90%
100%
Utilization Rate HS 61 (left axis) Utilization Rate HS 62 (left axis)
Total Imports HS 61 (right axis) Total Imports HS 62 (right axis)
Utiliz
ation
Rate
s
Tota
l Impo
rts(U
SD M
illion
s)2010 2011 2012 2013 2014 2015 2016 2017

16
Towards a New Trade Policy on Market Access for Myanmar:
Table 5: European Union imports from Myanmar under EBA impact by sector (millions of United States dollars)
Sector Suspension of EBA Reinstatement of EBA
2011 2012 2013 2014 2015 2016 2017
Garment 198. 3 154.0 195.6 344.9 526.9 909.1 1 666.5
Fisheries 19.7 17.8 26.3 34.0 35.7 39.6 40.7
Rice 6.5 9.4 16.3 65.4 84.1 67.2 133.5
Precious stones 0.4 5.8 37.5 51.8 54.0 59.3 87.1
Wood 0.1 5.7 22.8 21.2 25.1 37.6 35.1
Note: Sectors define as follows: garments: HS 61 and 62, fisheries: HS 03 and HS 16, rice: HS 10, pearl and precious stones: HS 71 and wood: HS 44.
The imports of the European Union for garments from Myanmar exhibit an increase from 2012 until 2017 with a sharp increase between 2016 and 2017 (see table 5). However, this increase may not be sustained in the coming years as Myanmar is facing the deterioration of preferential market access to the European Union due to the impending European Union–Viet Nam FTA.
As depicted in figure 2.5, the 10 most-exported products of the European Union from Myanmar are garments with utilization rates ranging from 98.39 per cent to 89.18 per cent. These tariff lines could be subjected to erosion of trade preferences as
43 See table 7 for tariff lines under A.44 See http://trade.ec.europa.eu/doclib/docs/2018/september/tradoc_157341.pdf for further details.
the European Union–Viet Nam FTA entered into force on August 2020.
For example, as shown in table 7, there will be a progressive erosion of the preferential margin for HS 620520 with a reduction of six equal instalments from a base rate of 12 per cent. Other tariff lines such as HS 6202 and HS 6201, most-imported products of the European Union from Myanmar at HS four-digit level (see table 6), will experience a similar and in some cases immediate43 erosion of preferential margins with reduction varying between six to eight equal instalments.44 Further analysis of the implications of the European Union’s FTA with other members of ASEAN is carried out in subsection 2.3.2.
Figure 2-5: Tariff lines most imported to the European Union from Myanmar at six-digit level, and utilization rates (2017)
96,80% 96,76% 87,57% 95,97% 95,18%100,00%
0,00%
89,18%
98,39% 95,04%
0%
20%
40%
60%
80%
100%
40
60
80
100
120
140
160
180
200
620293 620193 611030 620213 620520 100640 710391 611020 621210 610910
Utiliz
ation
Rate
(%)
Milli
on U
SD
Total Value of Imports (million USD) UR (%)

17
Identifying a Positive Agenda Among Challenges and Opportunities
Table 6: European Union-27 most imported product of HS 61 and HS 62 at four-digit level (United States dollars) from Myanmar (2018): a country comparison45
Tariff line Myanmar Cambodia Bangladesh Viet Nam
6202 65 377.58 7 354.01 14 006.98 15 182.80
6201 40 148.52 6 678.40 18 695.86 7 938.54
6110 16 229.08 57 853.92 279 045.80 8 333.50
6102 12 557.95 2 114.55 1 860.95 2 853.70
6204 11 065.04 63 038.27 107 328.40 31 946.14
6210 8 221.64 9 760.14 2 916.57 6 894.83
6104 6 688.40 19 267.01 59 041.61 7 699.28
Table 7: European Union – Viet Nam FTA RoO on Myanmar’s most-exported goods to the European Union in 2017
Rank Subheading DescriptionExports to European
Union-27 ($)
Baserate
Tariff category
Tariff description RoO (HS 2–4 digit level)
1 620339 Men’s or boys’ jackets and blazers of other textile materials
156 672 438 12 B5 Customs duties on originating goods provided for in the items in staging category “B5” in a Party’s Schedule shall be removed in six equal annual stages beginning on the date of entry into force of this Agreement, and such goods shall thereafter be free of any customs duty
Weaving accompanied by making-up (including cutting); or making-up preceded by printing accompanied by at least two preparatory or finishing operations (such as scouring, bleaching, mercerising, heat setting, raising, calendering, shrink resistance processing, permanent finishing, decatizing, impregnating, mending and burling), provided that the value of the unprinted fabric used does not exceed 47.5 per cent of the ex-works price of the product.
2 620690 Women’s or girls’ blouses, shirts and shirt-blouses of other textile materials
99 836 266 12 A Customs duties on originating goods provided for in the items in staging category “A” in a Party’s Schedule shall be eliminated entirely and such goods shall be free of any customs duty from the date of entry into force of this Agreement
Weaving accompanied by making-up (including cutting); or manufacture from unembroidered fabric, provided that the value of the unembroidered fabric used does not exceed 40 per cent of the ex-works price of the product
3 620319 Men’s or boys’ suits of other textile materials
97 122 994 12 A Customs duties on originating goods provided for in the items in staging category “A” in a Party’s Schedule shall be eliminated entirely and such goods shall be free of any customs duty from the date of entry into force of this Agreement
Weaving accompanied by making-up (including cutting); or making-up preceded by printing accompanied by at least two preparatory or finishing operations (such as scouring, bleaching, mercerizing, heat setting, raising, calendering, shrink resistance processing, permanent finishing, decatizing, impregnating, mending and burling), provided that the value of the unprinted fabric used does not exceed 47.5 per cent of the ex-works price of the product.
4 100640 Broken rice 81 487 837 €65/1 000 kg B5, comment: 50 per cent cut at EIF, and linear removal after 5 year
Customs duties on originating goods provided for in the items in staging category “B5” in a Party’s Schedule shall be removed in six equal annual stages beginning on the date of entry into force of this Agreement, and such goods shall thereafter be free of any customs duty
Manufacture in which all the materials of chapter 10 used are wholly obtained
5 620520 Men’s or boys’ shirts of cotton
78 385 810 12 B5 Customs duties on originating goods provided for in the items in staging category “B5” in a Party’s Schedule shall be removed in six equal annual stages beginning on the date of entry into force of this Agreement, and such goods shall thereafter be free of any customs duty
Weaving accompanied by making-up (including cutting); or making-up preceded by printing accompanied by at least two preparatory or finishing operations (such as scouring, bleaching, mercerizing, heat setting, raising, calendering, shrink resistance processing, permanent finishing, decatizing, impregnating, mending and burling), provided that the value of the unprinted fabric used does not exceed 47.5 per cent of the ex-works price of the product
45 UN Comtrade data, European Union-28 imports from Myanmar, Cambodia, Bangladesh and Viet Nam 2018.

18
Towards a New Trade Policy on Market Access for Myanmar:
RankSub-
headingDescription
Exports to EU27 (USD)
BaseTariff
categoryTariff description RoO (HS 2–4 digit level)
1 620339 Men’s or boys’ jackets and blazers of other textile materials
156’672’438 12 B5 customs duties on originating goods provided for in the items in staging category “B5” in a Party’s Schedule shall be removed in six equal annual stages beginning on the date of entry into force of this Agreement, and such goods shall thereafter be free of any customs duty;
Weaving accompanied by making- up (including cutting); or making-up preceded by printing accompanied by at least two preparatory or finishing operations (such as scouring, bleaching, mercerising, heat setting, raising, calendering, shrink resistance processing, permanent finishing, decatising, impregnating, mending and burling), provided that the value of the unprinted fabric used does not exceed 47.5% of the ex-works price of the product.3,5
2 620690 Women’s or girls’ blouses, shirts and shirt-blouses of other textile materials
99’836’266 12 A customs duties on originating goods provided for in the items in staging category “A” in a Party’s Schedule shall be eliminated entirely and such goods shall be free of any customs duty from the date of entry into force of this Agreement;
Weaving accompanied by making- up (including cutting); or manufacture from unembroidered fabric, provided that the value of the unembroidered fabric used does not exceed 40 % of the ex-works price of the product.5
3 620319 Men’s or boys’ suits of other textile materials
97’122’994 12 A customs duties on originating goods provided for in the items in staging category “A” in a Party’s Schedule shall be eliminated entirely and such goods shall be free of any customs duty from the date of entry into force of this Agreement;
Weaving accompanied by making- up (including cutting); or making-up preceded by printing accompanied by at least two preparatory or finishing operations (such as scouring, bleaching, mercerising, heat setting, raising, calendering, shrink resistance processing, permanent finishing, decatising, impregnating, mending and burling), provided that the value of the unprinted fabric used does not exceed 47.5% of the ex-works price of the product.3,5
4 100640 Broken rice 81 487 837 65 EUR/ 1000 kg B5, comment: 50% cut at EIF, and linear removal after 5 year
customs duties on originating goods provided for in the items in staging category “B5” in a Party’s Schedule shall be removed in six equal annual stages beginning on the date of entry into force of this Agreement, and such goods shall thereafter be free of any customs duty;
Manufacture in which all the materials of Chapter 10 used are wholly obtained.
5 620520 Men’s or boys’ shirts of cotton
78’385’810 12 B5 customs duties on originating goods provided for in the items in staging category “B5” in a Party’s Schedule shall be removed in six equal annual stages beginning on the date of entry into force of this Agreement, and such goods shall thereafter be free of any customs duty;
Weaving accompanied by making- up (including cutting); or making-up preceded by printing accompanied by at least two preparatory or finishing operations (such as scouring, bleaching, mercerising, heat setting, raising, calendering, shrink resistance processing, permanent finishing, decatising, impregnating, mending and burling), provided that the value of the unprinted fabric used does not exceed 47.5% of the ex-works price of the product.3,5
2.3.2 The European Union’s free trade agreements with ASEAN members: Implications for Myanmar
In addition to the erosion of preferential margin outlined in the preceding section, non-LDC members of ASEAN, namely Singapore, Thailand, Viet Nam, Indonesia, the Philippines and Malaysia, have started the negotiating process46 or have finalized FTAs with the European Union. The European Union – Viet Nam FTA will enter into force on August 2020 and European Union – Singapore FTA47 entered into force in November 201948. When these FTAs are ratified, these ASEAN countries, mostly Viet Nam, will become direct competitors with Myanmar for investors seeking duty-free access
46 The European Union–Malaysia negotiations are currently on hold; European Union–Thailand are continuing; Viet Nam and Singapore have entered into force. Negotiations with the Philippines are underway.
47 See http://www.europarl.europa.eu/legislative-train/theme-a-balanced-and-progressive-trade-policy-to-harness-globalisation/file-eu-singapore-fta.
48 See http://www.europarl.europa.eu/legislative-train/theme-a-balanced-and-progressive-trade-policy-to-harness-globalisation/file-eu-vietnam-fta.
to the European market. In addition, two facts must be taken into account:
(a) Once the FTAs with the European Union are ratified, the ASEAN countries will no longer be eligible under the GSP scheme after a transition period of two years and consequently their inputs may no longer be used by Myanmar under ASEAN cumulation.
(b) Once the FTAs with the European Union are concluded, these ASEAN countries will be progressively able to cumulate among themselves while Myanmar and other ASEAN LDCs will not be able to cumulate with them. This is almost the reverse of the present situation. Ultimately, ASEAN cumulation under

19
Identifying a Positive Agenda Among Challenges and Opportunities
EBA will be progressively reduced to ASEAN LDCs cumulation with little to no value in terms of availability of intermediate inputs to manufacture finished products for exports to the European Union.
The cumulation provisions inserted in the European Union FTAs with ASEAN countries are a telling example of what the prospects are for cumulation within ASEAN as far as exports to the European Union are concerned. Paragraph 2 of article 3 of protocol 1 to the European Union–Singapore FTA, is rather clear in this regard:
• Materials originating in an ASEAN country which is applying with the Union a preferential agreement in accordance with Article XXIV of the GATT 1994, shall be considered as materials originating in a Party when incorporated in a product obtained in that Party provided that they have undergone working or processing in that Party which goes beyond the operations referred to in Article 6 (Insufficient Working or Processing).
Similarly, the provisions in the European Union–Viet Nam FTA, paragraph 2 of article 3 of protocol 1, state:
• Materials listed in annex III to this protocol (Materials Referred to in Paragraph 2 of Article 3) originating in an ASEAN country which applies with the Union a preferential trade agreement in accordance with Article XXIV of GATT 1994, shall be considered as materials originating in Viet Nam when further processed or incorporated into one of the products listed in annex IV to this protocol (Products Referred to in Paragraph 2 of Article 3).
As shown in figures A.8 and A.9 (annex), which depict a comparison of the utilization rates for selected chapters of ASEAN countries, ASEAN LDCs including Myanmar are performing much better that the remaining ASEAN countries even if the latter have a much greater industrial base. Such higher utilization rates are mainly due to the combination of:
(a) Higher preferential margin under EBA than under the European Union GSP scheme;
(b) More lenient PSRO applicable to LDCs under the European Union reform of rules of origin and EBA;
(c) ASEAN cumulation and the changes to cumulation introduced in 2011.
As discussed, all three factors mentioned above are going to be eroded as follows:
(a) The higher preferential margin will be progressively eroded once ASEAN countries have finalized their FTAs with the European Union since the agreed tariff schedule phased out will start to apply;
(b) Concerning the PSRO, it appears that PSRO, at least in the clothing sector, may not be significantly eroded at the time of entry into force of the European Union–Viet Nam FTA since double transformation (weaving and CMT: Cut Make and Trim) will remain as the applicable requirement. However, cumulation with the Republic of Korean fabrics provided under the European Union–Viet Nam FTA may provide a source of concern and competition for Myanmar producers since, thanks to that possibility, Viet Nam could source originating fabrics from the Republic of Korea;
(c) The cumulation advantage of ASEAN LDCs with respect to other ASEAN partners having entered an FTA with the European Union will progressively turn into a disadvantage since ASEAN countries having signed an FTA with the European Union will be able to cumulate among themselves while the ASEAN LDC will be left with the only option of cumulating among themselves leading to further marginalization.
The impact that this will have on Myanmar depends largely on a combination of market and rules of origin as well as on other factors laying outside such mere market access issues as contained in other chapters of this study. As shown in table 18 in annex both the European Union–Singapore, European Union – Viet Nam, but also the European Union–Republic of Korea FTA do not show significantly better PSRO for chapters 61 and 62. Garments still require a double transformation as under the current GSP rules.
In the case of the European Union–Singapore FTA, the European Union rules of origin allow their FTA partners to cumulate inputs produced in other free trade partners. Myanmar’s trade strategy for the next period, 2019–2022, needs to take into account the progressive loss of ASEAN cumulation, and increased competition from Viet Nam.
The entry into force of FTAs between the European Union, Viet Nam, Singapore and ongoing negotiations with the Philippines and eventually Thailand may affect

20
Towards a New Trade Policy on Market Access for Myanmar:
the competitive position of Myanmar garment producers as shown in table 7 above.
Such changes in the market access to the European Union market has to be read in conjunction with the fact that main competitors of Myanmar, especially Viet Nam, are currently engaged in FTA on multiple fronts, the European Union–Viet Nam FTA, the CP-TPP, RCEP and a series of bilateral agreements. It is obvious that the combined effect of progressive duty-free market access to these markets thanks to a network of FTAs will be a magnet for producers and investor to relocate in Viet Nam despite the more stringent rules of origin that Viet Nam may face under CP-TPP.
Recommendations
In view of the above analysis, Myanmar and other ASEAN LDCs should take the initiative to enter into a trade policy dialogue with the European Union to define a new trade relation that is going beyond EBA.
ASEAN LDCs are expected to graduate from LDC status in the near future49 and the current market access under EBA that has been a crucial factor in their export performance is going to be progressively eroded by the ASEAN FTAs.
The combined effects of these two looming events require timely and concrete actions such as:
49 Meeting two graduation thresholds, the Lao People’s Democratic Republic also fulfilled the graduation pre-eligibility criteria at the last triennial review of the LDC list in 2018. In contrast, Cambodia only met the HAI graduation threshold, as can be seen below:
50 Extended cumulation is a system, conditional upon the granting by the European Union Commission of a request lodged by a beneficiary country, whereby certain materials, originating in a country with which the European Union has an FTA in accordance with article XXIV of the General Agreement on Tariffs and Trade (GATT) in force, are considered to be materials.
(a) Myanmar should prepare a short roadmap for a new partnership between ASEAN LDCs and the European Union and discuss it with other ASEAN counterparts at the nearest opportunity.
(b) Convene a meeting at high level among the ASEAN LDCs to agree on a joint roadmap on market access especially with EU, Japan in the context of RCEP and CP-TPP.
(c) The ASEAN LDCs should request for a meeting with the newly appointed EU Trade commissioner to discuss such new partnership.
In addition, Myanmar will have to undertake actions at technical level to prepare the ground for extended cumulation with Viet Nam and explore possible ways to cumulate with Japan.
The request for extended cumulation50 to the EU commission requires that Myanmar engage in early discussion with Vietnamese counterparts to seek their support for extended cumulation. Early contacts should be made with Japan to secure a similar approach.
Such action should be undertaken as soon as possible to relay a message to garments manufacturers that the Government is actively pursuing a viable trade strategy.
GNI per capita ($) Human Asset Index (HAI) Economic Vulnerability Index (EVI)
Value Graduation threshold Value Graduation threshold Value Graduation threshold
Cambodia 1 075 1 230 or above 68.9 66.0 or above 34.8 32 or below
Lao People’s Democratic Republic
1 996 72.8 33.7
Myanmar 1 255 68.5 31.7

21
Identifying a Positive Agenda Among Challenges and Opportunities
3. RCEP AND CP-TPP – CHALLENGES AND OPPORTUNITIES
Figure 3-1: RCEP, ASEAN, CP-TPP and DFQF preferences: Overlapping memberships
As shown in figure 3.1 above, CP-TPP and RCEP negotiations partially overlap existing trade preferences under DFQF and ASEAN FTA with dialogue partners. More specifically, among CP-TPP member countries, only Mexico and Peru do not have any preferential arrangement with Myanmar at present. Exports to Australia, Canada, Chile, Japan and New Zealand benefit from DFQF market access while the remaining members are part of the ASEAN network of FTAs with dialogue partners. In the case of RCEP, all members already have an existing agreement or trade arrangement with Myanmar under ASEAN or DFQF. This overlapping scenario makes the assessment of the value provided by RCEP and CP-TPP difficult. In fact, the benefits of joining RCEP or CP-TPP or both will have to be assessed against the preferential margin, utilization
rates, and applicable rules of origin under existing preferential arrangements. In strict terms, the benefits of concluding RCEP and/or joining CP-TPP may be quantified in terms of preferential margins and rules of origin stringency that may be currently gained or lost, depending on the respective outcome of these arrangements. In reality and with a broader perspective, this section is aimed at identifying precisely what are the main products exported by Myanmar to RCEP and CP-TPP partners comparing them with the market access opportunities in terms of tariff concessions and rules of origin under the respective arrangements as well as with other non-tariff measures such as SPS that are playing an important element of market access. Table 8 below provides an overview of overlapping trade preferences to Myanmar with RCEP and CP-TPP partners.
China;India;
Republic of Korea
Cambodia;Indonesia;
Lao People’s Democratic
Republic;Myanmar
Philippines
Brunei Darussalam;
Malaysia;SingaporeViet Nam
CanadaChile
MexicoPeru
AustraliaJapan
New Zealand
RCEP ASEAN
CP-TPP
Note: Countries in green are those providing DFQF market access to LDCs.

22
Towards a New Trade Policy on Market Access for Myanmar:
Table 8: Overlapping trade preferences available to Myanmar with RCEP and CP-TPP partners: comparative table on market access (MA) and rules of origin (RoO)
Myanmar partners MA scheme Product coverage RoO
ASEAN ATIGA All products DFQF RVC 40 per cent and PSROs
Australia DFQF All products Last manufacturing process performed in LDC; minimum 50 per cent of total factory cost; minimum 75 per cent when cumulation is used
FTA 99 per cent of all products51 40 per cent regional value content; product-specific rules of origin: requirements vary between criteria wholly obtained, RVC, CTSH with or without exceptions, specific working or processing requirements or alternative rules
Canada DFQF All products except some dairies 80 per cent of non-originating when cumulation is used
Chile MFN Include MFN Averages (6 per cent)52 Not applicable
DFQF All products except wheat, wheat flour, and sugar products53
Minimum regional value content of 50 per cent
China DFQF 97 per cent of all products54 Minimum 40 per cent of originating materials
ASEAN China FTA 90 per cent of all products55 Minimum regional value content of 40 per cent using direct method and maximum value of non-originating material of 60 per cent using indirect method; product-specific rules of origin containing 22 pages56
India DFQF 95.5 per cent of all products57 Minimum 30 per cent of originating materials; product-specific rules
ASEAN India FTA 90 per cent of all products58 Minimum regional value content of 35 per cent; product-specific rules of origin
Japan DFQF All products Maximum value of non-originating materials of 40 per cent; product-specific rules
FTA All products except for machine parts and petroleum oil products
Minimum regional value content of 40 per cent and product-specific rules of origin containing 161 pages59
Mexico MFN Include MFN averages (6.9 per cent) from WTO
Not applicable
Peru MFN Include MFN averages (2.4 per cent) Not applicable
51 See https://aanzfta.asean.org/asean-australia-new-zealand-free-trade-arrangement/ for further details.52 See http://stat.wto.org/tariffprofile/wsdbtariffpfview.aspx?Country=cl&Language=E for further details.53 See https://www.un.org/ldcportal/chile-to-grant-dfqf-to-ldcs/ for further details.54 See https://www.un.org/ldcportal/preferential-market-access-chinas-dfqf-scheme-for-ldc-products/ for further details.55 See http://www.asean-cn.org/index.php?m=content&c=index&a=show&catid=267&id=84 for further details.56 See https://fta.miti.gov.my/miti-fta/resources/auto%20download%20images/558b8bd2cc77f.pdf for further details.57 See http://commerce.gov.in/writereaddata/UploadedFile/MOC_636434269763910839_international_tpp_DFTP.pdf for further details.58 See https://www.mofa.go.jp/policy/economy/fta/asean/part3-2.pdf for further details.59 See https://www.mofa.go.jp/mofaj/gaiko/fta/j_asean/pdfs/ajcep_k2.pdf for further details.
RoW17,26%
EU9,57%
USA1,76%
RCEP/CPTPP71,40%
CPTPP only12,29%
RCEP only 0,51%
CPTPP & RCEP58,60%
Figure 3.2 shows that in 2017 RCEP and CP-TPP markets represented 71.4 per cent of Myanmar total exports, with 58.6 per cent directed to countries that
are part of both agreements. It is notable to see that the United States only occupies 1.76 per cent of the export shares of Myanmar.
Figure 3-2: Myanmar export shares to RCEP/TPP markets and to the rest of the world, 2016

23
Identifying a Positive Agenda Among Challenges and Opportunities
3.1 Measuring cost and opportunities of RCEP
3.1.1 Getting increased market access for Myanmar exports to RCEP partners
As detailed in figure 3.3, the exports of Myanmar to RCEP markets represented about 80.99 per cent of total exports in 2017, including natural gas. Table 9 presents at tariff-line level the top export products of Myanmar to RCEP partners in 2017, these being
60 Note that re-exported products such as aircraft and ships are not included in the analysis.
agricultural products, precious stones and metals and natural gas.60 It is no surprise that China occupies the top export destination of Myanmar both in terms of trade value ($11 billion), which is 39.1 per cent of the total export share, and in terms of the number of top products being exported by Myanmar (11 out of 16). ASEAN is the next largest export destination with 27.83 per cent, then Japan with 6.54 per cent, India with 5.13 per cent and the Republic of Korea with 2.16 per cent. For the remaining RCEP partners, Australia and New Zealand, there is only 0.22 per cent export share for both countries combined.
Despite that Australia already provides DFQF market access to Myanmar, as shown in figure 2.1, the average utilization of the scheme by Myanmar exporters is rather limited. In 2016, only 20 per cent of Australian imports from Myanmar benefited from DFQF treatment, corresponding to an average utilization rate of 49 per cent, with important variations between products. It is important to note that despite the increasing amount of trade between 2015 and 2017, the utilization rate has been decreasing over the years, from 78 per cent in 2015, 49 per cent in 2016 and 32 per cent in 2017, while the preference margin remains stable at around 5 per cent.
Pockets of low utilization rates combined with preference margins (PM) above 2 percentage points have been identified and reported in table 19 (annex). Similarly, as shown in figure 2.1, in 2016 28 per cent of Myanmar exports to the Republic of Korea received preferential treatment, corresponding to a utilization rate of 8.5 per cent (see table 20). Pockets of low utilization of the Republic of Korean DFQF scheme where the preference margin is above 2 percentage points are reported in table 20.
According to data notified to WTO, in 2015, Myanmar has not been able to use the DFQF scheme offered by India, with a utilization rate of around 1 per cent. Therefore, a functioning trade agreement could generate important opportunities for Myanmar.
The RCEP negotiating text has not been made available during the course of this study. Only limited information has been available through other sources. On the basis of the preliminary information and an examination of tariff offers, RCEP does not seem to provide substantial improvements with respect to the market access that Myanmar is already being granted as part of the LDC, or ASEAN and ASEAN FTA network with dialogue partners. Such available information is summarized in table 9.
The crippling factor of RCEP is the architecture of the tariff offer, since the RCEP partners have made a single offer for all the ASEAN countries or towards all RCEP partners. This means that Myanmar is treated in terms of market access the same as Singapore or Malaysia, while there is a clear divide in terms of export capacity and level of development between these countries and
Figure 3-3: Myanmar export shares to RCEP markets and to the rest of the world, 2017
CAN0,44%
EU10,91%
USA2,01%
RoW5,80%
RCEP80,99%
AUS, NZL0,22%
KOR2,16%
CHN39,10%
ASEAN27,83%
IND5,13%
JPN6,54%

24
Towards a New Trade Policy on Market Access for Myanmar:
Myanmar. This element alone casts serious doubts over the value added of RCEP in terms of market access granted to Myanmar with respect to previous agreements and LDC arrangements that Myanmar is already benefiting from.
Added to this, the RCEP draft main text on rules of origin is 111 pages long and the Excel file text of product-specific rules of origin (PSRO) is over 6,000 lines. These figures alone provide a glimpse of the complexities of the negotiations. Once again, there is no provision for LDCs special and preferential treatment in the area of rules of origin for LDCs.
Unless substantial progress is made in the last round of negotiations, the current reading of the RCEP provides little scope for increased market access for Myanmar. The only advantage of RCEP would be to “lock-in” in contractual agreement some unilateral trade preferences.61 Even this assumption would have to be further assessed.
The fact that Myanmar may graduate from LDC status in the foreseeable future should not imply to forfeit in advance its negotiating position as an LDC during the current round of negotiations in RCEP.
61 Like the DFQF and rules of origin granted by India and Japan; but it would have to be assessed whether the tariff offers and rules of origin in RCEP are equivalent or better that those granted under the current DFQF by these preference-giving countries.
Recommendations
On the basis of the above-mentioned findings and analysis, the following recommendations are made:
(a) As a matter of priority Myanmar together with other ASEAN LDCs should insist that other RCEP partners make a differentiated offer on tariffs and rules of origin for ASEAN LDCs in RCEP.
(b) An overall and product-specific assessment has to be made using the methodology adopted in table 9 to measure what additional market is granted under current RCEP and negotiating objectives should be set accordingly.
(c) An overall assessment has to be made of the value of RCEP with respect to trade in goods, services and other trade related aspects. As soon as the text is available, an assessment should be carried out to assess the real value of market access provided by RCEP to Myanmar.

25
Identifying a Positive Agenda Among Challenges and Opportunities
Tabl
e 9:
M
arke
t acc
ess
and
rule
s of
orig
in tr
eatm
ent o
f mos
t-ex
port
ed p
rodu
cts
from
Mya
nmar
to R
CEP
part
ners
in 2
017
(sor
ted
in d
esce
ndin
g va
lues
, cu
mul
ativ
e ex
port
sha
re <
75 p
er c
ent)
Prod
uct
Expo
rtsPr
inci
pal M
MR
expo
rt de
stin
atio
ns w
ithin
RCE
P m
embe
rs
HS c
ode
Desc
riptio
nVa
lue
($
thou
sand
s)
1st d
estin
atio
n2n
d de
stin
atio
n3r
d de
stin
atio
n
PSRO
ISO3
co
deSh
are
(%)
MFN
(%
)
Appl
ied
redu
ctio
n in
RE
CP (E
IF)
ISO3
co
deSh
are
(%)
MFN
(%
)
Appl
ied
redu
ctio
n in
RE
CP (E
IF)
ISO3
co
deSh
are
(%)
MFN
(%
)
Appl
ied
redu
ctio
n in
RE
CP (E
IF)
12
34
56
78
910
1112
1314
1516
TO
TALS
FOR
ALL
PRO
DUCT
S11
049
279
CHN
48.1
.TH
A24
.0.
JPN
8.2
.
2711
11Na
tura
l gas
, liq
uefie
d2
986
970
THA
65.9
0.00
N/A
CHN
34.1
0.00
N/A
..
..
CTH
0713
31Dr
ied
bean
s, s
helle
d62
8 11
8IN
D50
.530
.00
0.00
CHN
27.2
1.50
0.00
IDN
4.5
2.50
N/Av
.CC
*; W
O (IN
, KR)
; RVC
40 o
r CTH
(NZ)
1006
20Hu
sked
(bro
wn)
rice
537
757
CHN
98.1
33.0
0N/
OSG
P1.
50.
00N/
AM
YS0.
240
.00
N/O
WO*
; CC(
AU, N
Z)
7403
11Co
pper
cat
hode
s an
d se
ctio
ns o
f cat
hode
s un
wro
ught
485
224
CHN
48.0
2.00
0.00
THA
28.2
1.00
0.00
IDN
9.5
5.00
N/Av
.RV
C40
or C
TH
1701
99Ca
ne o
r bee
t sug
ar, i
n so
lid fo
rm, n
es42
0 32
3CH
N99
.832
.50
N/O
IND
0.2
100.
0N/
OID
N0.
1.
N/A
WO*
; Opt
ions
(ASE
AN):
WO,
RVC
40 o
r CC;
CTS
H (A
U, J
P);
CC e
x 12
(KR)
, RVC
40 o
r CTS
H or
refin
ing
(NZ)
7103
10Pr
ec o
r se
mi-p
rec
ston
es (
o/t
diam
onds
) un
wkd
or s
impl
y sa
wn
or ro
ugh
shpd
343
632
CHN
100.
03.
000.
00TH
A0.
00.
00N/
AKO
R0.
01.
00N/
Av.
RVC4
0 or
CC*
1701
91Ca
ne
or
beet
su
gar,
cont
aini
ng
adde
d fla
vour
ing
or c
olou
ring
338
090
CHN
99.9
32.5
0N/
OTH
A0.
194
.00
N/O
SGP
0.0
0.00
N/A
WO*
; Opt
ions
(ASE
AN):
WO,
RVC
40 o
r CC;
CTS
H (A
U, J
P);
CC e
x 12
(KR)
, RVC
40 o
r CTS
H or
refin
ing
(NZ)
7202
60Fe
rro-n
icke
l33
4 29
6CH
N95
.72.
000.
00IN
D3.
22.
500.
00SG
P1.
00.
00N/
ARV
C40
or C
TH*
2711
21Na
tura
l gas
in g
aseo
us s
tate
286
244
CHN
100.
00.
00N/
A.
..
..
..
.CT
H
1005
10M
aize
see
d28
5 76
9CH
N95
.110
.50
N/O
VNM
4.0
0.00
N/A
MYS
0.4
0.00
N/A
WO*
2710
19Pe
trole
um
oils
&
oils
ob
tain
ed
from
bi
tum
inou
s m
iner
als
(oth
er t
han
crud
e) &
pr
epar
atio
ns n
ot e
lsew
here
spe
cifie
d27
7 72
5CH
N99
.96.
460.
00IN
D0.
18.
06N/
OSG
P0.
00.
00N/
A
RVC4
0 or
CTH
or n
o ta
riff c
lass
ifica
tion
chan
ge is
requ
ired
prov
ided
that
the
good
is a
resu
lt of
a c
hem
ical
reac
tion,
at
mos
pher
ic d
istil
latio
n or
vac
uum
dis
tilla
tion*
; RVC
40 o
r CT
H (A
SEAN
, JP)
; CTH
(CN,
IN);
8905
20Fl
oatin
g or
subm
ersi
ble
drilli
ng o
r pro
duct
ion
plat
form
s26
4 09
7SG
P10
0.0
0.00
N/A
..
..
..
..
RVC4
0 or
CTH
8802
40Ae
ropl
anes
and
oth
er a
ircra
ft, o
f an
unla
den
wei
ght >
15,0
00 k
g21
2 06
2SG
P66
.00.
00N/
AIN
D21
.22.
500.
00VN
M12
.70.
00N/
ARV
C40
or C
TH
4001
21Sm
oked
she
ets
of n
atur
al ru
bber
161
570
CHN
79.6
20.0
0N/
OM
YS12
.60.
00N/
ATH
A3.
60.
00N/
ARV
C40
or C
TSH*
or W
O (A
SEAN
, CN,
IN)
1207
40Se
sam
um s
eeds
158
069
CHN
75.8
5.00
0.00
KOR
9.6
..
JPN
9.2
0.00
N/A
WO*
2709
00Pe
trole
um
oils
an
d oi
ls
obta
ined
fro
m
bitu
min
ous
min
eral
s, c
rude
112
018
THA
61.2
0.00
N/A
MYS
20.2
2.50
0.00
SGP
18.6
0.00
N/A
CTH
* P
SR
O n
ot a
gree
d; N
/A: n
ot a
pplic
able
; N/A
v.: n
ot a
vaila
ble;
N/O
: no
offe
r.
26
Towards a New Trade Policy on Market Access for Myanmar:
3.1.2 Structuring the tariff offers of Myanmar under RCEP
In order to structure a tariff offer accounting for defensive interests, there is a need to assess first the import competition from RCEP partners. Table 10 shows the most imported products from RCEP partners in 2017 and the main suppliers of Myanmar for these particular products. China occupies the first principal supplier of Myanmar accounting for 37.1 per cent of all its imports while the second and third principal suppliers are ASEAN members, namely Singapore with 17.9 per cent import share, and Thailand with 12.9 per cent.
According to the WTO secretariat62, “the applied MFN tariff in Myanmar consists of 15 bands ranging from 0 per cent to 40 per cent; this is unchanged since 1996. The large number of bands renders the tariff relatively complex.”
The average bound tariff rate was 87.2 per cent in 2013 and the applied tariff 5.5 per cent. Almost 95 per cent of the applied MFN tariff ranges from duty free to 15 per cent, while the most common tariff rate is 1 per cent, as reflected in table 10 below. Nearly half of all tariff lines have nuisance rates (greater than zero, but below or equal to 2 per cent). The purpose of these nuisance tariff was not clear to the WTO secretariat.
62 See WTO Trade Policy Review Mechanism, 2014.
As shown in table 10, the RCEP tariff offers of Myanmar may not pose a particular threat in terms of protection of sensitive products since most of the imported products from RCEP countries are facing a nuisance import tariff that could be eliminated without any particular implication in terms of revenue foregone of protection for domestic industries. On the remaining tariff lines, it may be envisaged to offer a progressive reduction of the 15 per cent tariffs for woven fabrics (HS 551449 and HS 551319) since there is no domestic production and fabrics are an input to the garments industry.
Different considerations may be made for the duties imposed on cars (HS 870323) with a simple average MFN rate of 27.5 per cent where customs revenues may be significant. The duties imposed on cellular phones (HS 851712) with simple average MFN rate of 10 per cent also needs to be considered.
On the other hand, Myanmar may wish to maintain protection for certain products of the agricultural and agroprocessing industry as advocated by the private sector. These products are “other food preparations” (HS 210690) with a 13.92 per cent simple average of MFN rate. Myanmar may also consider the same for cane or beet sugar (HS 170199) or palm oil (HS 151190) where it may offer a progressive, albeit different, tariff reduction depending on domesticproduction.

27
Identifying a Positive Agenda Among Challenges and Opportunities
Tabl
e 10
: M
yanm
ar m
ost-
impo
rted
pro
duct
s fr
om R
CEP
mem
ber c
ount
ries,
201
7 (s
orte
d in
des
cend
ing
valu
es, c
umul
ativ
e im
port
sha
re <
48 p
er c
ent)
HS
code
Prod
uct d
escr
iptio
n
MFN
app
lied
tarif
fs
Appl
ied
redu
ctio
nsIm
ports
valu
e ($
thou
sand
s
Shar
e in
MM
R im
ports
(%
)
Cum
ulat
ive
shar
e in
MM
R im
ports
(%)
Prin
cipal
supp
liers
1st
2nd
3rd
No. N
LNo
. NA
V NL
Sim
ple
Av. %
MIN
%M
AX %
ISO3
cod
eSh
are
(%)
ISO3
cod
eSh
are
(%)
ISO3
cod
eSh
are
(%)
12
34
56
78
910
1112
1314
1516
1718
TOTA
LS F
OR A
LL P
RODU
CTS
..
..
..
16 1
97 7
5410
0.00
100.
0016
CHN
37.1
SGP
17.9
THA
12.9
2710
19
Petro
leum
oils
& o
ils o
btai
ned
from
bitu
min
ous
min
eral
s (o
ther
th
an c
rude
) & p
repa
ratio
ns n
ot e
lsew
here
spe
cifie
d/in
cld.
, co
ntai
ning
by
wei
ght 7
0 pe
r cen
t/mor
e of
pet
role
um o
ils/o
f oils
ob
tain
ed fr
om b
itum
en
180
1.44
0.50
1.50
1.5%
for 1
1 Y/
0 2
038
470
12.5
812
.58
10SG
P74
.2M
YS17
.1TH
A5.
4
2710
12Li
ght O
ils a
nd P
repa
ratio
ns15
01.
501.
501.
501.
5% fo
r 11
Y/0
1 30
3 44
08.
0520
.63
6SG
P85
.5M
YS12
.7TH
A1.
4
8704
10Du
mp
truck
s de
sign
ed fo
r off-
high
way
use
120
3.00
3.00
3.00
N/O
or 3
% fo
r 13
Y/0
71
1 87
24.
3925
.03
10CH
N51
.1JP
N39
.0KO
R5.
8
1701
99Ca
ne o
r bee
t sug
ar, i
n so
lid fo
rm, n
es7
00.
500.
500.
500.
5% fo
r 11
Y/0
544
312
3.36
28.3
98
IND
51.4
THA
44.7
VNM
2.6
1516
20Ve
geta
ble
fats
and
oils
and
thei
r fra
ctio
ns, h
ydro
gena
ted,
etc
240
5.00
5.00
5.00
N/O
506
176
3.12
31.5
18
IDN
81.8
MYS
16.4
THA
0.9
5514
49Pr
inte
d w
oven
fabr
ics,
<85
per
cen
t syn
thet
ic fi
bres
+ c
otto
n,
nes,
>17
0 g/
m2
10
15.0
015
.00
15.0
0N/
O45
7 43
12.
8234
.34
11CH
N88
.6KO
R6.
6JP
N1.
9
8711
20M
otor
cycl
es w
ith re
cipr
ocat
ing
pist
on e
ngin
e di
spla
cing
>50
to
250
cc11
05.
005.
005.
00N/
O40
0 62
22.
4736
.81
7CH
N44
.6TH
A36
.2VN
M16
.7
3004
90Ot
her m
edic
amen
ts o
f mixe
d or
unm
ixed
prod
ucts
, for
reta
il sa
le,
nes
290
1.50
1.50
1.50
1.5%
for 1
1 Y/
0 25
9 45
31.
6038
.41
12IN
D50
.5TH
A11
.9ID
N9.
8
8517
62M
achi
nes
for t
he re
cept
ion,
con
vers
ion
& tra
nsm
issi
on/
rege
nera
tion
of v
oice
, im
ages
/oth
er d
ata,
incl
. sw
itchi
ng &
rout
ing
appa
ratu
s16
03.
031.
0015
.00
N/O
224
229
1.38
39.8
012
CHN
93.0
JPN
3.1
THA
1.4
8702
10Di
esel
pow
ered
bus
es w
ith a
sea
ting
capa
city
of >
nine
per
sons
100
3.00
3.00
3.00
N/O
191
207
1.18
40.9
86
JPN
39.8
THA
35.7
CHN
15.9
7228
30Ba
rs a
nd ro
ds o
f allo
y st
eel o
ther
than
sta
inle
ss, h
ot-r
olle
d/dr
awn/
extru
ded,
nes
20
1.00
1.00
1.00
0%19
0 80
81.
1842
.15
3CH
N74
.6IN
D25
.4VN
M0.
0
2106
90Ot
her f
ood
prep
arat
ions
, nes
260
13.9
21.
0015
.00
N/O
184
138
1.14
43.2
913
THA
34.9
MYS
22.2
SGP
20.0
8703
23Au
tom
obile
s w
ith re
cipr
ocat
ing
pist
on e
ngin
e di
spla
cing
150
0 to
300
0 cc
220
27.5
01.
0040
.00
N/O
154
504
0.95
44.2
47
JPN
89.4
THA
5.8
KOR
2.6
1511
90Pa
lm o
il (e
xcl.
crud
e) a
nd li
quid
frac
tions
50
1.00
1.00
1.00
0 or
1%
for
11 Y
/0
145
893
0.90
45.1
52
IDN
87.7
MYS
12.3
.
5513
19W
oven
fabr
ics,
<85
per
cen
t syn
thet
ic s
tapl
e fib
res
+ c
otto
n, n
es,
= <
170
g/m
21
015
.00
15.0
015
.00
N/O
105
732
0.65
45.8
09
CHN
87.0
KOR
4.9
JPN
3.7
8429
59Se
lf-pr
opel
led
exca
vatin
g m
achi
nery
, nes
10
1.00
1.00
1.00
0%10
3 14
90.
6446
.44
11KO
R40
.3CH
N36
.8JP
N14
.9
8517
12Te
leph
ones
for c
ellu
lar n
etw
orks
/for o
ther
wire
less
net
wor
ks,
othe
r tha
n Li
ne te
leph
one
sets
with
cor
dles
s ha
ndse
ts1
010
.00
10.0
010
.00
N/O
98 0
970.
6147
.04
7VN
M88
.1CH
N8.
1TH
A3.
7
7210
70Fl
at ro
lled
prod
ucts
of i
ron/
non-
allo
y st
eel,
pain
ted,
var
nish
ed o
r co
ated
with
pla
stic
s, =
>60
0 m
m w
ide
20
1.00
1.00
1.00
1% fo
r 11
Y/0
98 0
150.
6147
.65
7CH
N98
.8KO
R0.
4IN
D0.
3
N/O
: no
offe
r; Y
/0: y
ears
and
0 p
er c
ent o
nwar
ds.

28
Towards a New Trade Policy on Market Access for Myanmar:
3.1.3 Getting better market access to IndiaThe analysis of the trade flows carried out in table 1 clearly shows that India remains an important market for Myanmar even for a single agricultural product, that is, beans, with $317 million exports to the country in 2017. Table 11 exhibits all products with utilization rates of less than 70 per cent and preferential margin (PM) of greater than 2 percentage points (pp). It is crucial to highlight that there is an urgent issue that needs to be addressed. That is, the utilization rates of the DFQF granted by India to Myanmar is close to zero. This is not isolated to Myanmar – LDCs face similar problems of low utilization rate as depicted in table 12 – but it is especially problematic for
Myanmar. In particular, the issue of utilization rates needs to be clarified at the earliest opportunity at the next Committee on rules of origin.
Moreover, the decision by the Government of India to impose import quotas and to negotiate the price of beans and pulses rather than leave to the open market i.e. willing buyer and willing seller, should be reviewed in the light of India’s commitment at WTO.
Myanmar and other ASEAN LDCs should engage India at WTO seeking an enhanced dialogue to clarify the issue of utilization rates as well as the use of import quotas for beans or use the ASEAN –INDIA FTA as alternative channel.
# HS Product GSP cov. GSP rec. MFN rec Oth. UR (%) PM
1 07133100 Beans of the species Vigna mungo (L.) Hepper or Vigna radiata (L.) Wilczek 490 148 2 581 487 517 50 0.5 10
2 07136000 Pigeon peas (Cajanus cajan) 234 904 2 110 232 794 0 0.9 10
3 07133990 Dried beans, shelled, nes – other 48 884 213 48 671 0 0.4 10
4 07139090 Vegetables, leguminous; n.e.c. in heading no. 0713, shelled, whether or not skinned or split, 13 872 0 13 872 0 0.0 10
5 08028020 Other nuts, fresh or dried, whether or not shelled or peeled.– Areca nuts - Split 12’651 0 12 651 0 0.0 100
6 07139010 Dried beans, shelled, nes – Split 13 612 1 834 11 778 0 13.5 10
7 07133300 Kidney beans, including white pea beans 9 191 0 9 191 0 0.0 10
8 09103020 Turmeric (curcuma) – Dried 7 683 0 7 683 0 0.0 4.5
9 07132000 Chickpeas (garbanzos) 6 880 154 6 725 0 2.2 10
10 07133500 Cow peas (Vigna unguiculata) 2 371 0 2 370 0 0.0 10
11 08028010 Other nuts, fresh or dried, whether or not shelled or peeled.- Areca nuts – Whole 2 049 0 2 049 0 0.0 100
12 08028090 Other nuts, fresh or dried, whether or not shelled or peeled.– Areca nuts – Other 1 220 0 1 220 0 0.0 100
13 44034910 Tropical wood in the rough, nes - Teak wood in rough 2 765 0 1 207 1 558 0.0 5
14 05010010 Human hair, unworked, whether or not washed or scoured 1 204 0 1 204 0 0.0 30
15 44083910Specified tropical wood (excl. Dark Red Meranti, Light Red Meranti and Meranti Bakau) veneer sheets and for plywood, = < 6m – Sheets for plywoods
23 836 0 774 23 062 0.0 10
16 44089090 Veneer sheets and sheets for plywood and other wood, = < 6 mm thick, nes – Other 19 322 101 637 18 584 0.5 10
17 26171000 Antimony ores and concentrates 564 0 564 0 0.0 2.5
18 09101190 Spices; ginger, neither crushed nor ground – Other 329 0 329 0 0.0 4.5
19 96031000Brooms and brushes, consisting of twigs or other vegetable materials bound together, with or without handles
431 0 275 156 0.0 10
20 67030010 Human hair, dressed thinned, bleached or otherwise worked 265 0 265 0 0.0 10
Table 11: Indian imports from Myanmar in 2015 at the tariff line level (UR < 70 per cent, PM > 2pp, MFN received > 200 thousands, in thousands of United States dollars)

29
Identifying a Positive Agenda Among Challenges and Opportunities
Table 12: Indian imports from LDCs in 2015 (UR < 70 per cent, PM > 2pp, MFN received > 80 million, in thousands of United States dollars)
# Partner HS Product GSP cov. GSP rec. MFN rec Oth. UR PM
1 Myanmar 071331 Beans of the species Vigna mungo (L.) Hepper or Vigna radiata (L.) Wilczek 490 148 2 581 487 517 50 0.5 10
2 United 710812 Other unwrought forms of gold (including gold plated with platinum) 477 680 0 477 680 0 0.0 10
3 Myanmar 071360 Pigeon peas 234 904 2 110 232 794 0 0.9 10
4 Burkina Faso 710812 Other unwrought forms of gold (including gold plated with platinum) 216 748 0 216 748 0 0.0 10
5 Mozambique 270119 Coal other than anthracite and bituminous 207 026 0 207 026 0 0.0 2.5
6 Guinea 710812 Other unwrought forms of gold (including gold plated with platinum) 204 238 0 204 238 0 0.0 10
7 Senegal 280920 Phosphoric acid and polyphosphoric acids 195 300 0 195 300 0 0.0 5
8 Mali 710812 Other unwrought forms of gold (including gold plated with platinum) 167 042 0 167 042 0 0.0 10
9 Equatorial 271111 Liquefied natural gas 137 949 0 137 949 0 0.0 5
10 United 071360 Pigeon peas 98 613 0 98 613 0 0.0 10
11 Angola 710231 Non-industrial diamonds, unworked or simply sawn, cleaved or bruted 98 336 0 98 336 0 0.0 10
3.2 Joining the CP-TPP
The CP-TPP agreement is a modern FTA encompassing a series of WTO-plus disciplines both in terms of coverage and in depth. The preliminary analysis of the CP-TPP with respect to market access and rules of origin is similar to the RCEP in the sense that the CP-TPP may not bring to Myanmar additional market access to what has already been granted under different arrangements thanks to its current LDC status or as member of the ASEAN FTAs with dialogue partners. Figure 3.4 shows that CP-TPP makes up for 14.46 per cent of the export share of Myanmar in 2017. Among the CP-TPP partners, the exports to ASEAN countries who are CP-TPP members have the largest share of 7.26 per cent followed by Japan with 6.54 per cent. Canada only has 0.44 per cent while both Australia and New Zealand combined have 0.22 per cent.
The complexity of the rules of origin of the CP-TPP, especially in the garment sector, does not reflect the present capacity of that industry in Myanmar and are much more stringent than the rules of origin under the Everything but Arms (EBA) . However, reading a complex agreement such as the CP-TPP through the lenses of market access of tariff and rules of origin offers a very limited perspective of the trading opportunities and challenges that the CP-TPP agreements may have for Myanmar. First of all, as in the case of the RCEP, the trade preferences granted under an FTA are not unilateral and are of a more permanent and stable nature.
63 See footnote 12.
The CP-TPP is based on a series of rule-based, market-oriented systems that offer predictability for investors but also challenges for countries like Myanmar. The situation is further exacerbated by the fact that some of the main competitors of Myanmar, such as Viet Nam, are on a double or triple track63 scenario, since they participate in RCEP, are members of the CP-TPP and have entered an FTA with the European Union.
Table 13 reports the main exports from Myanmar to CP-TPP partners in descending order of export value. As can be easily noted from the table, the main partners are Canada, Japan and ASEAN countries where Myanmar is benefiting from existing preferences granted under the GSP of Canada and Japan, as well as the ASEAN–Japan FTA and ATIGA with ASEAN countries. The only partner where Myanmar may gain, at a cursory glance, preferential market access is Mexico for limited export values of garments. For products such as shoes, Mexico ranks as the fourth or fifth main export destination for Myanmar. Added to the CP-TPP RoO is that garment production requires triple transformation.
With respect to investment (chapter 9), the CP-TPP parties agreed to suspend the application of the provisions related to an “investment authorization”, including the submission of ISDS claims (that is, limiting the submission of claims to the breach of the treaty obligation) and the selection of arbitrators (in part).

30
Towards a New Trade Policy on Market Access for Myanmar:
Regarding other aspects of CP-TPP chapter 9, it is noteworthy that the investment chapter includes several reform-oriented elements. For example, it refines definitions of investor and investment, clarifies the meaning of key standards to preserve regulatory space (for example, clarifying that a government’s failure to respect an investor’s legitimate expectations does not automatically amount to a breach of the minimum standard of the treatment (article 9.6), clarifying what does and what does not constitute an indirect expropriation (article 9.8 and annex 9-B)), contains a clause recognizing that parties should not relax health, safety and environmental standards, and reaffirms CSR-related obligations.
Of particular relevance are issues related to ISDS. Certain CP-TPP contracting parties used side letters to bilaterally opt out of ISDS or otherwise modify the ISDS arrangements applicable between them. For example, bilateral side letters provide that there is no ISDS available between Australia and New Zealand, and New Zealand and Peru. In the bilateral relationships between New Zealand and three other parties (Brunei Darussalam, Malaysia and Viet Nam) ISDS will remain. However, consent to arbitration by the respondent State needs to be given on a case-by-case basis. Moreover, the CP-TPP ISDS provisions allow disputing parties to submit written comments to the tribunal concerning any aspect of the proposed decision or award (CP-TPP article 9.23) and establish joint bodies with a mandate to issue binding interpretations of treaty provisions (CP-TPP article 9.25(3)).
At the same time, many CP-TPP parties remain bound by ISDS provisions found in earlier treaties signed between them in different constellations. Examples include the ASEAN Investment Comprehensive Investment Agreement (2009) (of which Myanmar is
64 See page 74 in UNCTAD’s Investment Policy Framework for Sustainable Development, 2015 version.65 See page 19, table 1 in UNCTAD’s Reform Package for the International Investment Regime.66 Ibid., page 48, table 5.
a party), the Energy Charter Treaty (1994), and other TIPs and BITs signed between the CP-TPP parties.
Some CP-TPP parties opted to terminate and replace some pre-existing IIAs. For example, Australia’s BITs with Mexico, Peru and Viet Nam will be terminated and replaced by the CP-TPP investment chapter, under the terms set out in the relevant side letters. In that respect, the CP-TPP offers an opportunity to replace old-generation treaties with a treaty containing more modern clauses.
When considering accession to the CP-TPP investment chapter, Myanmar should make a careful assessment about the pros and cons in light of the acceding country’s investment for sustainable development plan. First and foremost, this includes defining the role of IIAs in a country’s development strategy.64 In addition to assessing the arguments put forward in favour and against IIAs65 and the arguments brought forward in favour or against to ISDS,66 this would also include an assessment of the individual investment-related obligations contained in the CP-TPP.
Among others, consideration would have to be given to the extent to which more modern CP-TPP clauses could help modernize (that is, replace) old-generation clauses in pre-existing IIAs (for example, Myanmar–Japan, 2007). Importantly, careful decision-making would also require a realistic assessment of the extent to which acceding LDCs will be able to avail themselves of side letters, to shape their individual commitments in line with their special development needs.
Overall, the main challenge facing Myanmar is to put more resources on assessing the values of the various options and conducting a series of consultations to assess the terms and conditions for acceding to the CP-TPP.

31
Identifying a Positive Agenda Among Challenges and Opportunities
Figure 3-4: Myanmar export shares to CP-TPP markets and to the rest of the world, 2017
Recommendations
On the basis of the above-mentioned findings and analysis, the following recommendations are made:
(a) Conduct a deeper and comprehensive assessment of the CP-TPP and initiate consultations with other ASEAN LDCs for
a possible joint initiative to accede to the CP-TPP as an ASEAN LDC group;
(b) Initiate informal consultations either directly or indirectly to identify the possible flexibilities and carve out that may be discussed upon accession, especially on ISDS provision and other aspects.
AUS, NZL0,22%
CAN0,44%
EU 10,91%
USA2,01%
RoW13,1%
ASEAN7,26%
CHN39,10%
ASEAN excl.CPTPP 20,42%
JPN6,54%
CPTPP14,46%
AUS, NZL0,22%

32
Towards a New Trade Policy on Market Access for Myanmar:
Prod
uct
Expo
rtsPr
inci
pal M
MR
expo
rt de
stin
atio
ns w
ithin
CP-
TPP
mem
bers
HS c
ode
Desc
riptio
nVa
lue
($
thou
sand
s)
1st d
estin
atio
n2n
d de
stin
atio
n3r
d de
stin
atio
n
PSRO
ISO3
co
deSh
are
(%)
MFN
(%
)Pr
efIS
O3
code
Shar
e (%
)M
FN
(%)
Pref
ISO3
co
deSh
are
(%)
MFN
(%
)Pr
ef
12
34
56
78
910
1112
1314
1516
TO
TALS
FOR
ALL
PRO
DUCT
S2
010
819
JPN
44.9
..
SGP
33.9
..
MYS
9.3
..
8905
20Fl
oatin
g or
subm
ersi
ble
drilli
ng o
r pro
duct
ion
plat
form
s26
4 09
7SG
P10
0.0
0.00
N/A
..
..
..
..
CTC
or M
in. R
VC o
f (a)
30
per c
ent u
nder
bui
ld-u
p, (b
) 40
per
cen
t und
er b
uild
dow
n or
50
per c
ent u
nder
fo
cuse
d va
lue
8802
40Ae
ropl
anes
and
oth
er a
ircra
ft, o
f an
unla
den
wei
ght e
xcee
ding
15,
000
kg16
7 05
6SG
P83
.80.
00N/
AVN
M16
.20.
00N/
A.
..
.CT
H
0713
31Dr
ied
bean
s, s
helle
d87
011
VNM
25.1
7.50
0.00
or 3
.3%
R/
YM
YS24
.30.
00N/
ASG
P23
.30.
00N/
ACT
C
7403
11Co
pper
cat
hode
s an
d se
ctio
ns o
f cat
hode
s un
wro
ught
69 0
16M
YS51
.30.
00N/
AVN
M42
.70.
00N/
ASG
P6.
00.
00N/
ACT
H
6203
19M
en's
or b
oys'
sui
ts o
f oth
er te
xtile
s, n
es63
537
JPN
90.9
9.55
0.00
CAN
7.3
17.0
00.
00AU
S0.
65.
005%
for 3
Y/0
CTC
with
exc
eptio
ns
6203
39M
en's
or b
oys'
jack
ets
and
blaz
ers
of o
ther
te
xtile
s, n
es61
180
JPN
92.4
10.3
30.
00CA
N4.
017
.00
0.00
MYS
2.8
0.00
N/A
CTC
with
exc
eptio
ns
6403
99Fo
otw
ear
with
ru
bber
...
sole
s,
leat
her
uppe
rs, n
ot c
over
ing
the
ankl
e48
097
JPN
97.7
22.3
8M
FN o
r 2.2
%
R/Y
AUS
0.8
5.00
1.3%
R/Y
CAN
0.8
9.67
0.00
or 4
.5%
fo
r 11
Y/0
CTC
or M
in. R
VC o
f (a)
45
per c
ent u
nder
bui
ld-u
p, (b
) 55
per
cen
t und
er b
uild
dow
n or
50
per c
ent u
nder
fo
cuse
d va
lue
6205
90M
en's
or b
oys'
shi
rts o
f oth
er te
xtile
s, n
es44
651
JPN
93.8
8.20
0.00
CAN
3.4
18.0
00.
00M
YS1.
60.
00N/
ACT
C w
ith e
xcep
tions
8421
23Oi
l or
petro
l-filte
rs f
or in
tern
al c
ombu
stio
n en
gine
s44
215
SGP
99.9
0.00
N/A
VNM
0.1
5.00
0.00
..
.CT
SH
2709
00Pe
trole
um
oils
an
d oi
ls
obta
ined
fro
m
bitu
min
ous
min
eral
s, c
rude
43 4
95M
YS52
.12.
500.
00SG
P47
.90.
00N/
A.
..
.CT
H
6206
90W
omen
's o
r gi
rls'
blou
ses,
shi
rts, e
tc, o
f ot
her t
extil
es, n
es43
450
JPN
91.5
8.83
0.00
CAN
3.6
17.0
00.
00M
EX1.
522
.50
2.9%
R/Y
CTC
with
exc
eptio
ns
6203
33M
en's
or
boys
' ja
cket
s an
d bl
azer
s of
sy
nthe
tic fi
bres
33 5
73JP
N99
.110
.95
0.00
CAN
0.6
18.0
00.
00M
EX0.
122
.50
2.9%
or 3
%
R/Y
CTC
with
exc
eptio
ns
6201
93M
en's
or b
oys'
ano
raks
, win
d-ch
eate
rs, e
tc,
of m
an-m
ade
fibre
s33
463
JPN
87.8
10.9
50.
00 o
r 1.2
%
R/Y
CAN
9.9
17.0
00.
00SG
P2.
10.
00N/
ACT
C w
ith e
xcep
tions
0306
17Ot
her S
hrim
ps a
nd P
raw
ns29
425
JPN
67.5
1.00
0.00
MYS
11.1
0.00
N/A
VNM
11.0
9.00
0.00
CTC
4001
21Sm
oked
she
ets
of n
atur
al ru
bber
26 5
63M
YS76
.40.
00N/
AJP
N19
.00.
00N/
AAU
S2.
30.
00N/
ACT
H or
No
CTH
with
min
RVC
of 4
0 pe
r cen
t und
er b
uild
do
wn
6203
43M
en's
or
bo
ys'
trous
ers,
br
eech
es
of
synt
hetic
fibr
es24
988
JPN
99.3
9.55
0.00
CAN
0.3
18.0
04.
5% R
/YM
YS0.
10.
00N/
ACT
C w
ith e
xcep
tions
N/A
: not
app
licab
le; R
/Y: r
educ
tion
per
year
; Y/0
: yea
rs a
nd 0
per
cen
t onw
ards
.
Tabl
e 13
: M
arke
t acc
ess
and
rule
s of
orig
in tr
eatm
ent o
f mos
t-ex
port
ed p
rodu
cts
from
Mya
nmar
to C
P-TP
P pa
rtne
rs in
201
7 (s
orte
d in
des
cend
ing
valu
es,
cum
ulat
ive
expo
rt s
hare
< 5
5 pe
r cen
t)

33
Identifying a Positive Agenda Among Challenges and Opportunities
3.3 Myanmar trade relations with Japan: From GSP to ASEAN FTA and beyond
Trade relations with Japan are governed by the GSP for LDCs and the ASEAN Dialogue FTA with Japan.
Trade figures in table 14, with HS two-digit level sorted in descending order, suggest that the Japan GSP for LDCs is mostly used by Myanmar with a striking difference of 91.4 per cent utilization rate for GSP for total products, while there is a low level of ASEAN utilization rate of only 5.15 per cent.
Table 14: Japanese imports from Myanmar and utilization rates under ASEAN and GSP, 2017 (sorted in descending order of MFN dutiable imports > $2 million)
HS chapter Imports from partner ($ thousands) UR (%)
Description Total valueMFN
dutiableCovered
GSPCovered ASEAN
NOT rec. pref.
Rec. GSP pref.
Rec. ASEAN Pref.
GSP ASEAN
1 2 3 4 5 6 7 8 9 10 11
TOTALS FOR ALL PRODUCTS 1 117 689 983 533 942 407 955 128 72 892 861 407 49 236 91.4 5.15
62 Art of apparel & clothing access, not knitted/crocheted 574 935 572 010 572 010 572 010 11 824 555 841 4 346 97.2 0.76
61 Art of apparel & clothing access, knitted or crocheted 154 827 154 827 154 827 151 551 14 447 131 357 9 023 84.8 5.95
64 Footwear, gaiters and the like; parts of such articles 124 303 124 303 87 320 119 783 12 235 79 165 32 903 90.7 27.47
03 Fish & crustaceans, molluscs & other aquatic invertebrates 62 036 62 036 59 616 57 095 8 476 53 046 514 89.0 0.90
07 Edible vegetables and certain roots and tubers 32 500 11 477 11 477 2 757 3 846 7 628 3 66.5 0.11
12Oil seeds & oleaginous fruits; miscell. grains, seeds & fruits; industr. or medicinal plants
29 568 2 586 2 586 584 545 2 041 0 78.9 0.00
42 Articles of leather; saddlery/harness; travel goods etc 26 779 26 779 26 495 26 495 6 951 18 659 1 169 70.4 4.41
71 Natural/cultured pearls, precious/semiprecious stones, prec. metals; 16 360 884 884 884 884 0 0 0.00 0.00
90Optical, photogr., cinematogr., measuring, checking, precision, medical/surgical instruments
8 668 280 280 280 274 0 6 0.00 2.14
44 Wood and articles of wood; wood charcoal 6 907 1 725 1 725 1 725 1 076 617 32 35.8 1.86
94 Furniture; bedding, cushions etc; lamps & lighting fittings nes 6 041 99 99 99 0 76 23 76.8 23.2
39 Plastics and articles thereof 5 820 5 820 5 820 5 820 613 4 455 752 76.6 12.9
16 Preparations of meat, fish or crustaceans, molluscs etc 4 252 4 252 4 252 3 974 535 3 717 0 87.4 0.00
47 Pulp of wood/of other fibrous cellulosic mat.; waste and scrap 2 618 0 0 0 0 0 0 . 0.00
Note: Non-dutiable trade under chapters 01, 05, 23, 25, 34, 40, 45, 48, 49, 68, 70, 73, 76, 84, 85, 87, 91, 97 not reported. Values below $2 million reported in annex table 25; Rec: received.

34
Towards a New Trade Policy on Market Access for Myanmar:
Furthermore, table 14 shows that garments and shoe products dominate the Japanese imports from Myanmar with a high level of GSP utilization rate, followed by fishery products.
In the context of the GSP preferences, Myanmar with other ASEAN LDCs should prepare a document on the basis of the submission already made by the WTO LDC Group67 clearly outlining the improvements that Japan may make on the product-specific rules of origin and on cumulation. This document should be submitted at the next CRO meetings. Such action should be followed by an official visit of the ASEAN LDCs to the Ministry of industry and Trade and Ministry of Finance in Tokyo as soon as possible to secure follow up and commitment in adopting a reform of rules of origin under the Japanese GSP.
In parallel, Myanmar and ASEAN LDCs should begin to study the possibility of participating in a series of bilateral FTAs with Japan that provide better market access than the present Japanese GSP, the ASEAN FTAs and RCEP. A study should be conducted in this regard to compare the different concessions that Japan has made towards other partners to secure and argue for better preferential margins when negotiating as ASEAN LDCs.
Recommendations
On the basis of the above-mentioned findings and analysis, the following recommendations are made:
67 See WTO document G/RO/W/184 of 7 may 2019
(a) As a matter of priority, Myanmar and other ASEAN LDCs with the assistance development partners should take advantage of the set agenda of the LDC core group on rules of origin in order to table a document:
(i) To highlight the changes to be made in the product-specific rules of origin of the GSP of Japan;
(ii) To request to expand the scope of Japan cumulation provision for ASEAN to include Myanmar;
(iii) To take the opportunity of the CRO to open a dialogue on better rules of origin for ASEAN LDCs under the different trade arrangements currently being negotiated, such as RCEP or in the near future a revision of the rules of origin under the ASEAN Japan FTA or better a bilateral Japan–ASEAN LDCs FTA;
(b) Myanmar should carry out a comparative study on the different FTAs entered by Japan to secure and argue for better trade preferences and to determine the content of possible close trade relations with Japan.

35
Identifying a Positive Agenda Among Challenges and Opportunities
4. ADDRESSING SPS ISSUES WITH CHINA AND OTHER PARTNERS
ASEAN countries entered into a free trade area with China in 2005. According to ASEAN sources, ACFTA has not reached the expected target either in trade or investment. There is a gap of benefits that were expected from AFCTA that has been experienced by China and ASEAN member States. Thus, in the trade sector, ASEAN needs to strengthen efforts to create a balanced trade. In the investment sector, ASEAN has to demand an increase of China’s investment to ASEAN, specifically to finance the construction of infrastructure related to trade facilitation and improvement of logistics, especially in ASEAN LDCs .
In August 2019, the ACFTA upgrading protocol came into force 68 simplifying rules of origin and rules for trade in services, investment and technical cooperation.
According to the objective of ACFTA, tariffs should not be the prominent obstacle to trade with China. However, other NTMs, especially SPS, are a considerable obstacle to increase exports to China.
Market access in terms of tariff reductions is an element that is not sufficient to ensure market entry into a partner. As examined in the sections above, the trade policy options to replace Japan and the European Union as main markets for garments and shoes will be limited in the near future. Conversely, the analysis
68 See https://asean.org/wp-content/uploads/2012/10/Protocol-to-Amend-the-Framework-Agreement-ACFTA-Complete.pdf
has shown that there are trading opportunities for rice and other agricultural products that may be affected not only by tariffs but also by non-tariff measures, in particular SPS.
Indeed, other elements may hamper Myanmar exporters to benefit from market access opportunities. Non-tariff measures are widely imposed by Myanmar’s trading partners, as highlighted in annex table 26. Some measures are imposed on a multilateral basis, while others are imposed to specific countries (reported under bilateral NTMs). China is the country imposing the maximum number of measures, with 5,714 NTMs, including 29 bilateral ones.
At the product level, rice and sugar exports to China are particularly exposed to NTMs as shown in annex table 27. Exports of brown rice (HS 100620) represent 10 per cent of Myanmar’s total exports to China and are facing a total of 114 NTMs, including 10 bilateral ones. Sugar of HS subheadings 170191 and 170199, together representing 14 per cent of Myanmar’s exports to China, are affected by 59 multilateral NTMs. While most of the existing measures are technical barriers to trade (TBT), according to consultations with local stakeholders, we can reasonably expect SPS measures to be the most problematic for Myanmar exporters of agricultural and food products.

36
Towards a New Trade Policy on Market Access for Myanmar:
Table 15: Total SPS measures imposed by Myanmar’s partners by products (sorted in descending values of Myanmar’s exports > $5 million, MMR export share > 5 per cent, Total SPS > 3)
Country HS6 DescriptionBilateral
SPSMultilateral SPS
Total SPS
MMR exports ($ thousands), 2017
Share in total trade (%)
CHN 100620 Husked (brown) rice 7 47 54 527.6 10
CHN 170199 Cane or beet sugar, in solid form, nes 0 18 18 419.4 8
CHN 170191 Cane or beet sugar, containing added flavouring or colouring 0 18 18 337.7 6
IND 071331 Dried beans, shelled 0 11 11 317.2 45
CHN 100510 Maize (corn), seed 0 32 32 271.7 5
IND 071390Vegetables, leguminous; n.e.c. in heading no. 0713, shelled, whether or not skinned or split, dried
0 11 11 107.4 15
EUN 100640 Broken rice 0 29 29 81.5 5
IDN 071331 Dried beans, shelled 2 12 14 28.5 24
LKA 100620 Husked (brown) rice 0 8 8 28.3 54
VNM 071331 Dried beans, shelled 0 34 34 21.8 17
MYS 071331 Dried beans, shelled 2 9 11 21.2 11
ARE 071331 Dried beans, shelled 0 17 17 16.9 24
SEN 100640 Broken rice 1 3 4 15.0 100
IDN 100640 Broken rice 2 12 14 12.9 11
LKA 071331 Dried beans, shelled 0 8 8 11.9 23
VNM 100510 Maize (corn), seed 0 15 15 11.4 9
PHL 071331 Dried beans, shelled 0 19 19 10.5 54
LKA 100640 Broken rice 0 8 8 10.3 20
RUS 100620 Husked (brown) rice 0 16 16 6.1 33
Table 15 reports only the sectors affected by at least four SPS measures, with export shares above 5 per cent and trade values above $5 million. These are important export sectors for which a reduction of SPS measures could potentially have a significant impact in terms of profitability of exporters. Rice exports are affected by SPS measures not only in China but in the European Union, Senegal, Indonesia, Sri Lanka and the Russian Federation. Sugar of HS subheadings 170191 and 170199 faces a total of 18 multilateral SPS measures in China. Except for rice exports to China, Senegal, and Indonesia, as well as bean exports to Malaysia and Indonesia, most measures are imposed at the multilateral level, making the issues with trade policy instruments such as trade agreements more difficult to solve.
Table 28 in annex C therefore reports products where bilateral SPS measures are imposed on Myanmar’s export sectors. New product–country pairs result from the analysis. First, various types of rice exports (not only brown rice) are facing bilateral SPS measures in export markets, mostly China but also Japan and Indonesia. In addition, maize of HS 100510, facing 32 multilateral SPS measures in the Chinese market, is also imposed 10 SPS measures in Thailand, including 7 bilateral ones, and two bilateral SPS measures in Malaysia. Other products such as dry beans and
vegetables (HS 0713) and wood (HS 440729) are particularly affected in Indonesia, Malaysia and the United States.
Sanitary and phytosanitary measures may also have an impact in sectors where we do not observe high trade values. It is likely to be the case if the SPS measure has a deterrent effect on Myanmar exporters that are not able to penetrate the foreign market. In an attempt to identify these cases, table 29 in annex C shows the sector–country pairs where exports from Myanmar to the world is above $13 million while exports to the specific country imposing at least two bilateral measures is below $1 million, but exhibit positive values (above $5,000).
Results show that several products are only marginally exported to specific partners imposing bilateral SPS measures while the total exports are significant. Facing three bilateral SPS in Japanese market, husked (brown) exports amounted in 2017 to only $753,000 while Myanmar total exports reached $980 million. In the same way, with a total of 11 SPS measures in the Thai markets, including 4 bilateral SPS measures, exports of cane or beet sugar of HS 170191 amounted to $347,000 while Myanmar total exports were of $338 million. The $670,000 exports of maize (corn) seed of HS 100510 to Thailand are
Source: UNCTAD (2017) TRAINS NTMs: The Global Database on Non-Tariff Measures, measures in force in 2016; trade values 2017. Products with more than 25 measures highlighted in green.

37
Identifying a Positive Agenda Among Challenges and Opportunities
hit by 10 SPS measures, including 7 bilateral SPS measures while total exports of those products from Myanmar reached $286 million.
Finally, the United States imposes 20 SPS measures including 9 bilateral ones on exports of nuts of HS 080290. This could explain the relatively low export values of $10,000 versus $36 million exported in total to all destinations.
Recommendations
The analysis of the trade flows carried out in table 1 clearly shows that China cannot replace the European Union and United States as market destination for garments and bicycles. China could be a potential market for rice exports and exports of agricultural products and processed foodstuffs. However, the main obstacles to enter the Chinese market are not only tariffs but also SPS requirements. In the context of WTO, the SPS Committee has been established to provide a forum for discussion and exchange of information. According to the SPS IMS database,
WTO members have raised 31 specific trade concerns on the SPS measures applied by China.
Myanmar and other ASEAN LDCs should make sure that the RCEP provisions on SPS contains WTO-plus elements that permits an enhanced dialogue with China and where possible equivalence and mutual recognition agreements.
On the basis of the above-mentioned findings and analysis, the following recommendations are made:
(a) Myanmar, together with other ASEAN LDCs, should raise specific concern over the SPS measures applied by China on rice imports and other related agricultural products in the next session of the WTO SPS committee.
(b) Myanmar should develop a negotiating strategy with other ASEAN LDCs to ensure that the RCEP provision on SPS measures contains WTO-plus elements that could facilitate market access to China.

38
Towards a New Trade Policy on Market Access for Myanmar:
5. A POSITIVE NEGOTIATING AGENDA FOR MYANMAR AT MULTILATERAL AND REGIONAL LEVEL
Myanmar has been privileged to be eligible for preferential access to many important markets. The trading regime that results from preferences, however, is going to be substantially reduced in the coming years. There have been a series of warning signs that have already conspicuously highlighted the fragility of a trade policy relying almost exclusively on unilateral trade preferences.
Besides the trade-related performance of contracts related to natural gas, changes in Myanmar’s preferential market access have been the single most important factor explaining the growth of Myanmar’s exports and the diversification of its export destinations during the period under review. The changes in the European Union rules of origin have shifted exports to those destinations and brought about significant new investment to expand exports. Rising labour costs in other producing countries, a reasonably friendly investment environment, and other factors have played a supporting role in this shift. Managing the various rules of origin regimes and assisting exporters to identify opportunities created by preferential access has become a key component of Myanmar’s trade policy.
However, the window of opportunity provided by unilateral trade preferences is now shrinking. Unless action is taken, a reversal of the favourable trend described above may take place in the next years to come. As examined in this section, a positive trade agenda should be quickly and effectively put in place by Myanmar based on the initial findings of this study, while on other areas, further research has to be carried out as outlined below:
1. The actual positioning of Myanmar in the international trade scene and potential leading role of an ASEAN LDC agenda.
It is recommended that as a matter of priority Myanmar reaches out to other ASEAN LDCs to establish a consultative and coordinated group among capitals and Geneva-based delegations at WTO to build up a coordinated positive agenda as suggested in this chapter. Through this mechanism the ASEAN LDCs should be able to quickly develop a more assertive and autonomous positive agenda in the different negotiating scenarios in WTO and at regional level as further detailed below:
(a) Establish a consultation mechanism among the ASEAN LDC delegations at WTO and in capitals to coordinate negotiating positions and initiatives on the issues at stake in WTO, namely e-commerce, investment facilitation, MSME and other themes;
(b) Prepare intensively for the next CRO meetings and initiate consultations for the possible launching on a plurilateral initiative to simplify rules of origin;
(c) Coordinate with ASEAN LDCs to raise joint concerns over SPS measures adopted by China on rice and other products of export interest at the next WTO SPS Committee, and follow up the initiatives.
2. Building new trade initiatives with the European Union in view of the European Union–ASEAN FTAs
In view of the above analysis, Myanmar and other ASEAN LDCs should take the initiative to enter into a trade policy dialogue with the European Union to define a new trade relation that goes beyond EBA.
ASEAN LDCs are expected to graduate from LDC status in the near future and the current market access under EBA that has been a crucial factor in their export performance is going to be progressively eroded by the ASEAN FTAs.
The combined effects of these two looming events require timely and concrete actions. Myanmar should prepare a short roadmap for a new partnership between ASEAN LDCs and the European Union and discuss it with other ASEAN counterparts at the nearest opportunity. It should take the initiative to convene a meeting at high level among the ASEAN LDC to agree on a roadmap to initiative discussions with the newly appointed European Union trade commissioner to discuss a new partnership.
In addition, Myanmar will have to undertake actions at the technical level to prepare the ground for extended cumulation with Viet Nam and explore possible ways to cumulate with Japan.

39
Identifying a Positive Agenda Among Challenges and Opportunities
The request for extended cumulation to the European Union requires that Myanmar engage in early discussion with Vietnamese counterparts to seek their support for extended cumulation. In this context, it has to be recalled that it took months to secure an understanding from the Malaysia authorities to issue certificates for origin under the derogation. A similar if not longer time frame may be expected with Viet Nam and early contacts should be made with Japan to secure a similar approach.
Such action should be undertaken as soon as possible to relay a message to bicycle manufacturers that the Government is actively pursuing a viable trade strategy.
3. RCEP and CP-TPP – Challenges and opportunities
RCEP
• As a matter of priority Myanmar with other ASEAN LDCs should insist on special and differential treatment during the implementation phase of RCEP.
• An overall and product-specific assessment should be made using the methodology adopted in table 9 to measure what additional market is granted under current RCEP and negotiating objectives should be set accordingly.
• An overall assessment has to be made of the value of RCEP with respect to trade in goods, services and other trade related aspects. As soon as the RCEP text is made public, a full-fledged assessment should be carried out to identify where and how RCEP is granting to Myanmar better market access that -
CP-TPP
• Conduct a deeper and comprehensive assessment of the CP-TPP and initiate consultations with other ASEAN LDCs for a possible joint initiative to accede to the CP-TPP as an ASEAN LDCs group.
• Initiate informal consultations either directly or indirectly to identify the possible flexibilities and carve out what may be discussed upon accession, especially on ISDS provision and other aspects.
Japan
• As a matter of priority, Myanmar and other ASEAN LDCs with the assistance of development partners should take advantage of the set agenda of the LDC core group on rules of origin in order to table a document:
• To highlight the changes to be made in the PSRO of the GSP of Japan;
• To request to expand the scope of Japan cumulation provision for ASEAN to include Myanmar and other ASEAN LDCs;
• To take the opportunity of the next WTO CRO to open a dialogue on better RoO for ASEAN LDC under the different trade arrangements currently being negotiated like RCEP or in the near future, a bilateral Japan–ASEAN FTA;
• Myanmar should carry out a comparative study on the different FTAs entered by Japan to secure and argue better trade preferences and determining the content of possible close trade relations with Japan.
India
• Myanmar with other ASEAN LDCs should raise specific concerns over the close-to-zero utilization rates of the DFQF measures applied by India on bean imports and other related agricultural products in the next session of the WTO SPS committee.
• Myanmar should check the WTO consistency of India import quotas and internal prices mechanisms and enter into a bilateral dialogue to address and stabilize the trade relation with India on beans and pulses as well as other agricultural products.
• Myanmar and other LDCs should coordinate negotiating position to mature a common negotiating stance towards India. A document detailing where improvements on the current rules of origin provided by India should be prepared by ASEAN LDC and presented at the above-mentioned WTO committee. Subsequently Myanmar and other ASEAN LDC should launch initiatives to follow up on this matter to obtain better market access and rules of origin.
4. Addressing SPS issues with China and other partners
• Myanmar joined with other ASEAN LDCs should raise specific concern over the SPS measures applied by China on rice imports and other related agricultural products in the next session of the WTO SPS committee.
• Myanmar should develop a negotiating strategy with other ASEAN LDCs to ensure that the RCEP provision on SPS contains WTO-plus elements that could facilitate market access to China.

40
Towards a New Trade Policy on Market Access for Myanmar:
5. Research and capacity-building
It is of paramount importance that Myanmar invests resources in further developing and studying the challenges and trading opportunities that are highlighted in this section and build the necessary capacity in the different ministries and private sector. In spite of numerous Aid for Trade initiatives present in the country,
69 See https://unctad.org/en/pages/newsdetails.aspx?OriginalVersionID=1233.
there are very few resources dedicated to establishing a trained pool of trade negotiators and researchers. Such recommendations largely echo those already made almost three years ago during a workshop organized by the Ministry of Commerce and UNCTAD.69 Such research and capacity-building should assist the Government in taking informed decisions on trade policy at large and in carrying out related trade negotiations.

41
Identifying a Positive Agenda Among Challenges and Opportunities
ANNEXES
A. ASEAN – China Free Trade Agreement
Product-specific rules of origin (PSRO)
The 472 PSRO of ACFTA are contained in the attachment B to annex 1 of the 2015 amendment. The requirements comprise 59 exclusive rules/criteria (part A) that range from RVC of not less than 40 per cent, CTC to specific requirements and 413 alternative rules
70 See https://asean.org/wp-content/uploads/2012/10/Protocol-to-Amend-the-Framework-Agreement-ACFTA-Complete.pdf
(part B). Regarding the alternative rules, the exporter can use either the general rule set out in rule 4 of the ASEAN–China FTA RoO or the regulations included in this attachment. Most recently these rules of origin have changed in the amended ACFTA.70 An assessment of these new rules of origin has yet to be made and is not contained in this study.
In contrast to other FTA PSRO, ACFTA alternative rules are sometimes clustered by the rule itself, not the HS Code. For example, for CTC (excerpt):
Serial No. HS chapter Product description Origin criteria
68 3006.10 Sterile surgical catgut, similar sterile suture materials (including sterile absorbable surgical or dental yarns) and sterile tissue adhesives for surgical wound closure; sterile laminaria and sterile laminaria tents; sterile absorb-able surgical or dental haemostatics; sterile surgical or dental adhesion barriers, whether or not absorbable
Change to subheading 3006.10 from any other heading
69 4103.90 Other raw hides and skins (fresh, or salted, dried, limed, pickled or otherwise preserved, but not tanned, parchment – dressed or further prepared), whether or not dehaired or split, other than those excluded by Note 1(b) or 1(c) to this chapter: Other
Change to subheading 4103.90 from any other heading
70 7218.10 Ingots and other primary forms Change to subheading 7218.10 from any other heading
Serial No. HS chapter Product description
309 6117.80 Clothing accessories, of textile materials, knitted or crocheted
310 6117.90 Parts of garments/ of clothing accessories, of textile materials, knitted or crocheted
311 6201.11 Men’s/ boy’ overcoats & similar articles of wool/ fine animal hair, not knitted or crocheted
In the case of process criteria for textile and textile products, specific regulations are categorized by the product categories such as (a) fibres and yarns; (b) fabric/carpets and other textile floor coverings; special yarns, twine cordage and ropes and cables and articles thereof; (c) articles of apparel and clothing accessories and other made-up textile articles. These broader categories often give alternative regulations, for example for (c) (excerpt):
(i) Manufacture through the processes of cutting and assembly of parts into a complete article (for apparel and tents) and incorporating embroidery or embellishment or printing (for made-up articles) from: - raw or unbleached fabric - finished fabric; OR
(ii) Undergo a change in tariff classification (hereinafter referred to as “CTC”) at four-digit level, which is a change in tariff heading, of the Harmonized System

42
Towards a New Trade Policy on Market Access for Myanmar:
B. Figures
Figure A.1: Myanmar export share by destination
0%
5%
10%
15%
20%
25%
30%
35%
40%
45%
2010 2011 2012 2013 2014 2015 2016 2017
Rest of World China
All products
Thailand India EU - 27 Japan
0%
10%
20%
30%
40%
50%
60%
2010 2011 2012 2013 2014 2015 2016 2017
Rest of World China Thailand India EU-27 Japan
Excluding HS chapter 27

43
Identifying a Positive Agenda Among Challenges and Opportunities
Figure A.2: Myanmar export values to selected countries/regions (millions of United States dollars)
0
1'000
2'000
3'000
4'000
5'000
6'000
2010 2011 2012 2013 2014 2015 2016 2017
USD
Milli
on
Rest of World China Thailand India EU - 27 Japan
All products
0
500
1 000
1 500
2 000
2 500
3 000
3 500
4 000
2010 2011 2012 2013 2014 2015 2016 2017
USD
Milli
ons
Rest of World China Thailand India EU - 27 Japan
Excluding HS chapter 27

44
Towards a New Trade Policy on Market Access for Myanmar:
Figure A.3: Exports to ASEAN, China, India and rest of world
0
1 000
2 000
3 000
4 000
5 000
6 000
2010 2011 2012 2013 2014 2015 2016 2017
USD
Milli
on
Rest of World China India ASEAN
Export value in millions of United States dollars – all products
0
500
1 000
1 500
2 000
2 500
3 000
3 500
4 000
2010 2011 2012 2013 2014 2015 2016 2017
USD
Milli
on
Rest of World China India ASEAN
Export value in millions of United States dollars excluding HS chapter 27
Export share ( percentage) including (left) and excluding (right) HS chapter 27
5%
10%
15%
20%
25%
30%
35%
40%
45%
50%
55%
2010 2012 2014 2016
Rest of World China
India ASEAN
5%
10%
15%
20%
25%
30%
35%
40%
45%
50%
55%
2010 2012 2014 2016
Rest of World China
India ASEAN

45
Identifying a Positive Agenda Among Challenges and Opportunities
Figure A.4: HS 61 export shares by destination
Figure A.5: Evolution of Myanmar exports to the European Union-28: chapters 61 and 62 (2010–2017)
0%
10%
20%
30%
40%
50%
60%
70%
80%
90%
100%
2010 2011 2012 2013 2014 2015 2016
Japan EU - 27 Rest of World United States Canada
0
1 000
2 000
3 000
4 000
5 000
6 000
7 000
8 000
9 000
10 000
2010 2011 2012
HS 61 HS 62
2013 2014 2015 2016 2017
USD
Milli
on

46
Towards a New Trade Policy on Market Access for Myanmar:
Figure A.6: Tariff lines most imported to the European Union from Myanmar at the six-digit level, and utilization rates (2013)
Figure A.7: Tariff lines most imported to the European Union from Myanmar at the six-digit level, and utilization rates (2015)
35
Milli
on U
SD
30
25
20
15
10
5
0
120
100
80
60
40
20
0
%
620520 030389 620343 620193 620342 100640 620293 620463 620192 621120
Total value of imports (million USD) UR (%)
30,4 24,4 19,8 18,3 13,4 11,3 10,5 6,5 4,1 2,7
57,7
48,0
20,3
53,3
37,6
84,9
53,2
38,6
62,5
99,9
60
Milli
on U
SD
50
40
30
20
10
0
105
100
95
90
85
80
%
620520 620193 620293 100630 100640 611030 620342 030389 620343 610910
Total value of imports (million USD) UR (%)
53,8 51,6 44,4 38,7 38,3 35,8 30,5 24,9 20,3 17,5
98,5
94,896,1
99,5 100,0
93,9
86,8
99,7 99,998,3

47
Identifying a Positive Agenda Among Challenges and Opportunities
Figure A.8: European Union GSP utilization rates of HS 61 of selected countries
Figure A.9: European Union GSP utilization rates of HS 62 of selected countries
0%
10%
20%
30%
40%
50%
60%
70%
80%
90%
100%
2009 2010 2011 2012 2013 2014 2015 2016 2017
Cambodia Laos Malaysia Myanmar Philippines Thailand Viet Nam
0%
10%
20%
30%
40%
50%
60%
70%
80%
90%
100%
2009 2010 2011 2012 2013 2014 2015 2016 2017
Cambodia Laos Malaysia Myanmar Philippines Thailand Viet Nam

48
Towards a New Trade Policy on Market Access for Myanmar:
C. Tables
Table 16: Myanmar’s most-exported products to European Union-27 in 2017
Rank Chapter Subheading DescriptionExports to European
Union-27($ millions)
1 62 620339 Men’s or boys’ jackets and blazers of other textile materials 156.67
2 62 620690 Women’s or girls’ blouses, shirts and shirt-blouses of other textile materials 99.84
3 62 620319 Men’s or boys’ suits of other textile materials 97.12
4 10 100640 Broken rice 81.49
5 62 620520 Men’s or boys’ shirts of cotton 78.39
6 62 620293 Women’s or girls’ anoraks (including ski-jackets), wind-cheaters, wind-jackets and similar articles of man-made fibres 65.59
7 62 620193 Men’s or boys’ anoraks (including ski-jackets), wind-cheaters, wind-jackets and similar articles of man-made fibres 53.73
8 61 610190 Men’s or boys’ overcoats, car-coats, capes, cloaks, anoraks (including ski-jackets), wind-cheaters, wind-jackets and similar articles of other textile materials
50.87
9 61 611030 Jerseys, pullovers, cardigans, waist-coats and similar articles, knitted or crocheted of man-made fibre 38.82
10 61 610290 Women’s and girls’ overcoats, car-coats, capes, cloaks, anoraks (including ski-jackets), wind-cheaters, wind-jackets and similar articles of other textile materials
37.95
11 62 620213 Women’s or girls’ overcoats, raincoats, car-coats, capes, cloaks and similar articles of man-made fibres 30.54
12 64 640411 Sports footwear; tennis shoes, basketball shoes, gym shoes, training shoes and the like 21.44
13 61 611020 Jerseys, pullovers, cardigans, waist-coats and similar articles, knitted or crocheted of cotton 21.32
14 10 100620 Husked (brown) rice 20.02
15 62 620311 Men’s or boys’ suits of wool or fine animal hair 20.00
16 62 621111 Men’s or boys’ swimwear 19.24
17 62 621020 Garments of the type described in subheadings 6201.11 to 6201.19 18.91
18 62 620590 Men’s or boys’ shirts of other textile materials 18.56
19 62 621210 Brassieres 15.20
20 03 030379 Other fish excluding livers and roes 15.06
21 62 620439 Women’s or girls’ jackets and blazers of other textile materials 14.86
22 62 620342 Men’s or boys’ trousers, bib and brace overalls, breeches and shorts of cotton 14.46
23 64 640419 Footwear with outer soles of rubber or plastics other than sports footwear 13.29
24 64 640219 Other sports footwear with outer soles and uppers of rubber or plastic 12.36
25 64 640399 Other footwear with outer soles of rubber, plastics, leather or composition leather and uppers of leather. 12.12
26 62 620462 Women’s or girls’ trousers, bib and brace overalls, breeches and shorts of cotton 11.62
Table 17: Changes of provision on regional cumulation in the European Union GSP reform in 2011Old regulation New regulation Comments
Article 72a 1. When goods originating in a country which is a member
of a regional group are worked or processed in another country of the same regional group, they shall have the origin of the country of the regional group where the last working or processing was carried out, provided that:
1. The value added there, as defined in paragraph 3, is greater than the highest customs value of the products used originating in any one of the other countries of the regional group, and
2. The working or processing carried out there exceeds that set out in Article 70 and, in the case of textile products, also those operations referred to at annex 16.
Where products manufactured in a beneficiary country of Group I (ASEAN) or Group III ( SAAARC) using materials originating in a country belonging to the other group are to be exported to the European Union, the origin of those products shall be determined as follows:
(a) materials originating in a country of one regional group shall be considered as materials originating in a country of the other regional group when incorporated in a product obtained there, provided that the working or processing carried out in the latter beneficiary country goes beyond the operations described in Article 78(1) and, in the case of textile products, also beyond the operations set out in annex 16.
(b) where the condition laid down in point (a) is not fulfilled, the products shall have as country of origin the country participating in the cumulation which accounts for the highest share of the customs value of the materials used originating in other countries participating in the cumulation.71
In the case of the old regulation under paragraph (a ) the value of materials calculation was carried out automatically while in the case of the new regulation under (a) the test is not carried out unless the imported materials only undergo insufficient working or processing as contained in art 78 (1) and the operations described in annex 16 for textiles and clothing.72
71 The wording of this article has been changed in the Union Customs code but the substance remains the same.72 Working such as: fitting of buttons and/or other types of fastenings, making of button-holes, finishing off the ends of trouser legs and sleeves
or the bottom hemming of skirts and dresses etc., hemming of handkerchiefs, table linen etc., fitting of trimmings and accessories such as pockets, labels, badges, etc. ironing and other preparations of garments for sale ‘ready made’, or any combination of such working.

49
Identifying a Positive Agenda Among Challenges and Opportunities
Table 18: European Union-Singapore, European Union–Republic of Korea and European Union–Viet Nam FTA PSRO HS 61, HS 62
FTA PSRO Cumulation Intermediate rule
European Union – Singapore
Garments HS 61 Knitting and making-up (including cutting) Diagonal cumulation with ASEAN countries
Yes, as in EBA
Garments HS 62 Weaving accompanied by making-up (including cutting) As above As above
European Union – Republic of Korea
Garments HS 61 Spinning of natural and/or man-made staple fibres, or extrusion of man- made filament yarn, accompanied by knitting (knitted to shape products) (5) or Knitting and making up including cutting (assembling, two or more pieces of knitted or crocheted fabric which have been either cut to form or obtained directly to form
Possibility of cumulation with other Countries who entered in a FTA with the European Union
As above
Garments HS 61 Weaving accompanied by making-up (including cutting)
European Union – Viet Nam
Garments HS 61 Knitting and making-up (including cutting) Spinning of natural or man-made staple fibres or extrusion of man-made filament yarn, in each case accompanied by knitting (knitted to shape products); or dyeing of yarn of natural fibres accompanied by knitting (knitted to shape products).
Garments HS 62 Weaving accompanied by making-up (including cutting); or making-up preceded by printing accompanied by at least two preparatory or finishing operations (such as scouring, bleaching, mercerizing, heat setting, raising, calendering, shrink resistance processing, permanent finishing, decatizing, impregnating, mending and burling), provided that the value of the unprinted fabric used does not exceed 47,5 per cent of the ex-works price of the product.
Table 19: Australian imports from Myanmar and utilization rates (thousands of United States dollars) – 2017 (sorted in descending order of MFN received imports (> $300,000), filtered: UR < 70 per cent, PM > 2pp)
HS Product Dutiable Covered imports
Receiving DFQF pref.
MFN received
Other scheme.
UR PM
Total for all products 13 803.51 13 804 4 469 9 334 0 32.4 5
420292 Cases and containers; n.e.c. in heading 4202, with outer surface of sheeting of plastics or of textile materials
1439 1439 4 1435 0 0.2 5
610821 Briefs and panties; women’s or girls’, of cotton, knitted or crocheted 1236 1236 37 1199 0 3.0 5
420299 Cases and containers; n.e.c. in heading 4202, of vulcanized fibre or of paperboard, or wholly or mainly covered with such materials or with paper
922 922 0 922 0 0.0 5
392690 Plastics; other articles n.e.c. in chapter 39 670 670 0 670 0 0.0 5
640399 Footwear; n.e.c. in heading no. 6403, (not covering the ankle), outer soles of rubber, plastics or composition leather, uppers of leather
592 592 4 588 0 0.7 5
610822 Briefs and panties; women’s or girls’, of man-made fibres, knitted or crocheted
574 574 2 572 0 0.4 5
640219 Sports footwear; (other than ski-boots, snowboard boots or cross-country ski footwear), with outer soles and uppers of rubber or plastics
408 408 0 408 0 0.0 5
620520 Shirts; men’s or boys’, of cotton (not knitted or crocheted) 380 380 1 379 0 0.2 5
640411 Sports footwear; tennis shoes, basketball shoes, gym shoes, training shoes and the like, with outer soles of rubber or plastics and uppers of textile materials
324 324 0 324 0 0.0 5

50
Towards a New Trade Policy on Market Access for Myanmar:
Table 20: Republic of Korea imports from Myanmar and Utilization Rates (thousands of United States dollars) – 2017 (sorted in descending order of MFN received imports (> $1 million), filtered: UR < 70 per cent, PM > 2pp)
HS Product Dutiable Covered imports
Receiving DFQF pref.
MFN received
Other scheme.
UR PM
Total for all products 439 820 384 071 32 550 8 676 342 845 8.5 10.8
620193 Men's or boys' anoraks (including ski-jackets), wind-cheaters, wind-jackets and similar articles of man-made fibres
85 097 85 094 477 2 351 82 266 1 13
620293 Women's or girls' anoraks (including ski-jackets), wind-cheaters, wind-jackets and similar articles of man-made fibres
64 882 64 882 306 985 63 591 0 13
670419 False beards, eyebrows and eyelashes, switches and the like; of synthetic textile materials
1 586 1 586 0 967 619 0 8
630720 Life-jackets and life-belts 950 950 0 352 598 0 10
440729 Wood, tropical, n.e.c. in item no. 4407.2, sawn or chipped lengthwise, sliced or peeled, whether or not planed, sanded or end-jointed, of a thickness exceeding 6 mm
372 372 86 286 0 23 5
611030 Jerseys, pullovers, cardigans, waist-coats and similar articles, knitted or crocheted of man-made fibre
8 476 8 476 1 425 257 6 795 17 13
621050 Garments; women's or girls', n.e.c. in item no. 6210.3, of the fabrics of heading no. 5602, 5603, 5903, 5906 or 5907 (not knitted or crocheted)
4 663 4 663 0 164 4 499 0 13
420292 Cases and containers; n.e.c. in heading 4202, with outer surface of sheeting of plastics or of textile materials
2 789 2 789 0 159 2 630 0 8
Table 21: European Union imports from Myanmar with low GSP utilization in 2017 (< 70 per cent, PM > 2, in thousands of United States dollars)
Rank HS Product GSP cov. GSP rec. MFN rec Oth. UR (%) PM
1 71131900 Jewellery of other precious metal 2 779 0 2 779 0 0.00 2.5
2 85011010 Motors of an output not exceeding 37,5 W 2 373 622 1 751 0 26.21 4.7
3 94019080 Parts of seats 1 772 803 969 0 45.32 2.7
4 85258019 TVCs, digital cameras and video camera recorders, other 1 621 0 1 621 0 0.00 4.1
5 63059000 Sacks and bags, of a kind used for the packing of goods of other mats 1 084 0 1 084 0 0.00 6.2
6 95065100 Lawn-tennis rackets, W/N strung 758 352 406 0 46.44 4.7
7 64039931 Other footwear with outer soles of rubber, plastics, leather or composition leather and uppers of leather
670 464 206 0 69.25 8
8 85258099 TVCs, digital cameras and video camera recorders, other 626 0 626 0 0.00 10.5
9 44072915 Other wood sawn or chipped lengthwise, e.j, W/N planed or sanded 567 318 249 0 56.08 2.5
10 61178080 Other made-up clothing accessories, KoC; KoC parts of garments or of clothing accessories
518 291 227 0 56.18 12
11 94039030 Part of furniture of other mats, including cane, osier, bamboo 504 57 447 0 11.31 2.7
12 44083995 Other wood sawn or chipped lengthwise, sliced or peeled, W/N planed, sanded or e.j, of a thickness exceeding 1 mm
465 0 465 0 0.00 4
13 63079098 Other made-up articles, including dress patterns 464 277 187 0 59.70 6.3
14 62044990 Dresses of other textile mats 453 156 297 0 34.44 12
15 85258091 TVCs, digital cameras and video camera recorders, only able to record sound and images taken by the TVC
408 0 408 0 0.00 4.1
16 73269098 Other articles of iron or steel such as ladders, pallets, reels 240 31 209 0 12.92 2.7
17 62034919 Trousers, bib and brace overalls, breeches and shorts of other textile mats 222 127 95 0 57.21 12
18 63053219 Flexible intermediate bulk containers 192 0 192 0 0.00 7.2
19 61022090 Women's and girls' overcoats, anoraks and similar articles of ctn 188 128 60 0 68.09 12
20 61079100 Men's or boys' bathrobes, dressing gowns and similar articles, KoC, of ctn 158 106 52 0 67.09 12
W/N: whether or not; KoC: knitted or crocheted; TVC: television camera; e.j.: end-jointed; ctn: cotton; mats: materials.

51
Identifying a Positive Agenda Among Challenges and Opportunities
Table 22: United States imports from Myanmar with low GSP utilization in 2017 (< 70 per cent, PM > 2, in thousands of United States dollars)
Rank HS Product GSP cov. GSP rec. MFN rec Oth. UR (%) PM
1 39269075 Pneumatic mattresses and other inflatable articles, nesoi, of plastics 3 304 733 2 571 0 22.19 4
2 71131950 Precious metal (pm) (o/than silver) articles of jewellery and parts thereof, W/N plated or clad with pm, nesoi
621 0 621 0 0.00 5
3 42023299 Articles carried in pocket/ handbag with outer surface of sheeting of plastics or of textile mats, other
211 0 211 0 0.00 17
4 95065120 Lawn-tennis rackets, strung 205 0 205 0 0.00 5
5 63079098 Other made-up articles, including dress patterns 118 27 91 0 22.88 7
6 39262090 Articles of apparel and clothing accessories (inc. gmm), Aaca, of plastic, nesoi 90 0 90 0 0.00 5
7 21041000 Soups and broths and preparations therefor 68 42 26 0 61.76 3
8 61178085 Other made-up clothing accessories, KoC; KoC parts of garments or of clothing accessories
59 22 37 0 37.29 14
9 71171990 Imitation jewellery 56 0 56 0 0.00 11
10 39262030 aaca (inc. gmm), Gloves specially designed for use in sports, nesoi, of plastics 47 0 47 0 0.00 3
11 95065140 Lawn-tennis rackets, not strung 47 13 34 0 27.66 3
12 42023293 Articles carried in pocket/ handbag with outer surface of sheeting of plastics or of textile mats, of man-made fibres
42 15 27 0 35.71 17
13 42032160 Ski or snowmobile gmm, nesi, of leather or of composition leather 39 7 32 0 17.95 5
14 96151960 Combs, hair-slides and the like 38 4 34 0 10.53 11
15 73262000 Articles of iron or steel wire 38 0 38 0 0.00 3
16 09021010 Green tea 30 0 30 0 0.00 6
17 71131929 Gold necklaces and neck chains (o/than of rope or mixed links) 28 0 28 0 0.00 5
18 42032180 Gmm specially designed for use in sports, nesi, of leather or of composition leather 27 0 27 0 0.00 4
19 03063320 Crabs 26 0 26 0 0.00 7
20 39249056 Tableware and kitchenware such as ironing boards 16 0 16 0 0.00 3
Mats: materials; gmm: gloves, mittens and mitts; KoC: knitted or crocheted; Aaca: articles of apparel and clothing accessories.

52
Towards a New Trade Policy on Market Access for Myanmar:
Tabl
e 23
: M
yanm
ar e
xpor
ts to
RCE
P m
embe
r cou
ntrie
s an
d pr
inci
pal e
xpor
t des
tinat
ions
with
in th
e re
gion
, 201
7 (s
orte
d in
des
cend
ing
valu
es, c
umul
ativ
e ex
port
sha
re <
75
per c
ent)
Prod
uct
MM
R Ex
ports
Prin
cipa
l MM
R ex
port
dest
inat
ions
with
in R
CEP
mem
bers
HS c
ode
Desc
riptio
nVa
lue
($00
0)Sh
are
in
tota
l exp
(%
)
Cum
. exp
. sh
are
(%)
# de
st
1st d
estin
atio
n2n
d de
stin
atio
n3r
d de
stin
atio
n
ISO3
co
deSh
are
(%)
MFN
(%
)#
NLIS
O3
code
Shar
e (%
)M
FN
(%)
# NL
ISO3
co
deSh
are
(%)
MFN
(%
)#
NL
12
34
56
78
910
1112
1314
1516
1718
TO
TALS
FOR
ALL
PRO
DUCT
S11
049
279
100.
0010
0.00
15CH
N48
.1.
.TH
A24
.0.
.JP
N8.
2.
.
2711
11Na
tura
l gas
, liq
uefie
d2
986
970
27.0
327
.03
2TH
A65
.90.
001
CHN
34.1
0.00
1
..
.
0713
31Dr
ied
bean
s, s
helle
d62
8 11
85.
6832
.72
14IN
D50
.530
.00
1CH
N27
.21.
502
IDN
4.5
2.50
2
1006
20Hu
sked
(bro
wn)
rice
537
757
4.87
37.5
89
CHN
98.1
33.0
04
SGP
1.5
0.00
2M
YS0.
240
.00
2
7403
11Co
pper
cat
hode
s an
d se
ctio
ns o
f cat
hode
s un
wro
ught
485
224
4.39
41.9
86
CHN
48.0
2.00
4TH
A28
.21.
001
IDN
9.5
5.00
1
1701
99Ca
ne o
r bee
t sug
ar, i
n so
lid fo
rm, n
es42
0 32
33.
8045
.78
6CH
N99
.832
.50
6IN
D0.
210
0.00
2ID
N0.
1.
2
7103
10Pr
ec o
r sem
i-pre
c st
ones
(o/t
diam
onds
) unw
kd o
r sim
ply
saw
n or
roug
h sh
pd34
3 63
23.
1148
.89
3CH
N10
0.0
3.00
1TH
A0.
00.
003
KOR
0.0
1.00
1
1701
91Ca
ne o
r bee
t sug
ar, c
onta
inin
g ad
ded
flavo
urin
g or
col
ourin
g33
8 09
03.
0651
.95
3CH
N99
.932
.50
2TH
A0.
194
.00
1SG
P0.
00.
001
7202
60Fe
rro-n
icke
l33
4 29
63.
0354
.98
3CH
N95
.72.
001
IND
3.2
2.50
1SG
P1.
00.
001
2711
21Na
tura
l gas
in g
aseo
us s
tate
286
244
2.59
57.5
71
CHN
100.
00.
001
.
..
.
..
1005
10M
aize
see
d28
5 76
92.
5960
.15
7CH
N95
.110
.50
2VN
M4.
00.
001
MYS
0.4
0.00
1
2710
19Pe
trole
um o
ils &
oils
obt
aine
d fro
m b
itum
inou
s m
iner
als
(oth
er th
an c
rude
) &
prep
arat
ions
not
els
ewhe
re s
peci
fied/
incl
d., c
onta
inin
g by
wei
ght 7
0 pe
r cen
t/m
ore
of p
etro
leum
oils
/of o
ils o
btai
ned
from
bitu
men
277
725
2.51
62.6
73
CHN
99.9
6.46
13IN
D0.
18.
069
SGP
0.0
0.00
16
8905
20Fl
oatin
g or
sub
mer
sibl
e dr
illing
or p
rodu
ctio
n pl
atfo
rms
264
097
2.39
65.0
61
SGP
100.
00.
001
.
..
.
..
8802
40Ae
ropl
anes
and
oth
er a
ircra
ft, o
f an
unla
den
wei
ght e
xcee
ding
15,
000
kg21
2 06
21.
9266
.98
4SG
P66
.00.
002
IND
21.2
2.50
1VN
M12
.70.
002
4001
21Sm
oked
she
ets
of n
atur
al ru
bber
161
570
1.46
68.4
48
CHN
79.6
20.0
01
MYS
12.6
0.00
6TH
A3.
60.
006
1207
40Se
sam
um s
eeds
158
069
1.43
69.8
79
CHN
75.8
5.00
2KO
R9.
6.
1JP
N9.
20.
001
2709
00Pe
trole
um o
ils a
nd o
ils o
btai
ned
from
bitu
min
ous
min
eral
s, c
rude
112
018
1.01
70.8
83
THA
61.2
0.00
3M
YS20
.22.
502
SGP
18.6
0.00
3
KoC
: Kni
tted
or
Cro
chet
ed; M
FN u
nwei
ghte
d av
erag
e; N
L: n
atio
nal t
ariff
line
s.

53
Identifying a Positive Agenda Among Challenges and Opportunities
Tabl
e 24
: M
yanm
ar e
xpor
ts to
CP-
TPP
mem
ber c
ount
ries
and
prin
cipa
l exp
ort d
estin
atio
ns w
ithin
the
regi
on, 2
017
(sor
ted
in d
esce
ndin
g va
lues
, cu
mul
ativ
e ex
port
sha
re <
65
per c
ent)
Prod
uct
MM
R Ex
ports
Prin
cipa
l MM
R ex
port
dest
inat
ions
with
in C
P-TP
P m
embe
rs
HS c
ode
Desc
riptio
nVa
lue
($00
0)Sh
are
in
tota
l exp
(%
)
Cum
. exp
. sh
are
(%)
# de
st
1st d
estin
atio
n2n
d de
stin
atio
n3r
d de
stin
atio
n
ISO3
co
deSh
are
(%)
MFN
(%
)#
NLIS
O3
code
Shar
e (%
)M
FN
(%)
# NL
ISO3
co
deSh
are
(%)
MFN
(%
)#
NL
12
34
56
78
910
1112
1314
1516
1718
TO
TALS
FOR
ALL
PRO
DUCT
S2
010
819
100.
0010
0.00
11JP
N44
.9.
.SG
P33
.9.
.M
YS9.
3
8905
20Fl
oatin
g or
sub
mer
sibl
e dr
illing
or p
rodu
ctio
n pl
atfo
rms
264
097
13.1
313
.13
1SG
P10
0.0
0.00
1.
..
..
.
8802
40Ae
ropl
anes
and
oth
er a
ircra
ft, o
f an
unla
den
wei
ght e
xcee
ding
15,
000
kg16
7 05
6 8.
3121
.44
2SG
P83
.80.
002
VNM
16.2
0.0
2.
..
0713
31Dr
ied
bean
s, s
helle
d87
011
4.
3325
.77
9VN
M25
.17.
502
MYS
24.3
0.0
1SG
P23
.3.
.
7403
11Co
pper
cat
hode
s an
d se
ctio
ns o
f cat
hode
s un
wro
ught
69 0
16
3.43
29.2
03
MYS
51.3
0.00
1VN
M42
.70.
01
SGP
6.0
0.00
2
6203
19M
en's
or b
oys'
sui
ts o
f oth
er te
xtile
s, n
es63
537
3.
1632
.36
10JP
N90
.99.
552
CAN
7.3
17.0
2AU
S0.
60.
001
6203
39M
en's
or b
oys'
jack
ets
and
blaz
ers
of o
ther
text
iles,
nes
61 1
80
3.04
35.4
08
JPN
92.4
10.3
33
CAN
4.0
17.0
2M
YS2.
85.
001
6403
99Fo
otw
ear w
ith ru
bber
sol
es, l
eath
er u
pper
s, n
ot c
over
ing
the
ankl
e48
097
2.
3937
.80
10JP
N97
.722
.38
11AU
S0.
85.
01
CAN
0.8
0.00
1
6205
90M
en's
or b
oys'
shi
rts o
f oth
er te
xtile
s, n
es44
651
2.
2240
.02
6JP
N93
.88.
202
CAN
3.4
18.0
2M
YS1.
69.
673
8421
23Oi
l or p
etro
l-filte
rs fo
r int
erna
l com
bust
ion
engi
nes
44 2
15
2.20
42.2
12
SGP
99.9
0.00
6VN
M0.
15.
06
.0.
001
2709
00Pe
trole
um o
ils a
nd o
ils o
btai
ned
from
bitu
min
ous
min
eral
s, c
rude
43 4
95
2.16
44.3
82
MYS
52.1
2.50
2SG
P47
.90.
003
..
.
6206
90W
omen
's o
r girl
s' b
lous
es, s
hirts
, etc
, of o
ther
text
iles,
nes
43 4
50
2.16
46.5
410
JPN
91.5
8.83
3CA
N3.
617
.01
MEX
1.5
..
6203
33M
en's
or b
oys'
jack
ets
and
blaz
ers
of s
ynth
etic
fibr
es33
573
1.
6748
.21
10JP
N99
.110
.95
2CA
N0.
618
.01
MEX
0.1
22.5
02
6201
93M
en's
or b
oys'
ano
raks
, win
d-ch
eate
rs, e
tc, o
f man
-mad
e fib
res
33 4
63
1.66
49.8
79
JPN
87.8
10.9
52
CAN
9.9
17.0
1SG
P2.
122
.50
2
0306
17Sh
rimps
and
Pra
wns
, Fro
zen
Neso
i 29
425
1.
4651
.34
6JP
N67
.51.
001
MYS
11.1
0.0
1VN
M11
.00.
001
4001
21Sm
oked
she
ets
of n
atur
al ru
bber
26 5
63
1.32
52.6
65
MYS
76.4
0.00
6JP
N19
.00.
01
AUS
2.3
9.00
4
KoC
: Kni
tted
or
Cro
chet
ed; M
FN u
nwei
ghte
d av
erag
e, N
L: n
atio
nal t
ariff
line
s.

54
Towards a New Trade Policy on Market Access for Myanmar:
Tabl
e 25
: Ja
pane
se Im
port
s fr
om M
yanm
ar a
nd u
tiliz
atio
n ra
tes
unde
r ASE
AN a
nd G
SP, 2
017
(sor
ted
in d
esce
ndin
g or
der o
f MFN
dut
iabl
e Im
port
s <
= $
2 m
illio
n)
Prod
uct
Impo
rts fr
om P
artn
er (t
hous
ands
of U
nite
d St
ates
dol
lars
)GS
P ut
ilizat
ion
rate
(%)
ASEA
N ut
iliza-
tion
rate
(%)
HS2
code
HS c
hapt
er d
escr
iptio
nTo
tal v
alue
MFN
dut
iabl
eCo
vere
d GS
PCo
vere
d AS
EAN
NOT
rece
iving
pr
ef.
Rece
iving
GSP
pr
ef.
Rece
iving
AS
EAN
pref
.
12
34
56
78
910
11
TO
TALS
FOR
ALL
PRO
DUCT
S
52Co
tton,
incl
. yar
ns a
nd w
oven
fabr
ics
ther
eof
1 71
41
714
1 71
41
714
1 71
04
00.
230.
00
58Sp
ecia
l wov
en fa
b; tu
fted
tex
fab;
lace
; tap
estri
es e
tc1
689
1 06
01
060
1 06
095
910
10
9.53
0.00
20Pr
epar
atio
ns o
f veg
etab
les,
frui
t, nu
ts o
r oth
er p
arts
of p
lant
s1
488
1 48
81
488
1 32
687
861
00
40.9
90.
00
63Ot
her m
ade
up te
xtile
arti
cles
; set
s; w
orn
clot
hing
etc
1 47
01
470
1 47
01
470
626
791
5353
.81
3.61
95To
ys, g
ames
& s
ports
equ
ipm
ent;
parts
& a
cces
sorie
s th
ereo
f1
388
797
481
797
357
124
316
25.7
839
.65
00Ite
ms
beyo
nd H
S Cl
assi
ficat
ion
1 12
31
123
00
1 12
30
0.
.
04Da
iry p
rodu
cts;
bird
s' e
ggs;
nat
ural
hon
ey; e
dibl
e pr
oduc
ts n
es1
117
1 11
71
117
00
1 11
70
100.
00.
08Ed
ible
frui
t and
nut
s; p
eel o
f citr
us fr
uit o
r mel
ons
1 11
699
299
265
094
547
04.
740.
00
67Pr
epar
ed fe
athe
rs &
dow
n &
artic
les
ther
eof;
artifi
cial
flow
ers;
arti
cles
of h
uman
hai
r1
046
337
337
337
289
480
14.2
40.
00
09Co
ffee,
tea,
mat
e an
d sp
ices
1 00
350
750
716
533
816
90
33.3
30.
00
22Be
vera
ges,
spi
rits
and
vineg
ar98
534
434
40
338
60
1.74
.
69Ce
ram
ic p
rodu
cts
689
689
689
689
681
80
1.16
0.00
96M
isce
llane
ous
man
ufac
ture
d ar
ticle
s64
727
727
727
726
710
03.
610.
00
65He
adge
ar a
nd p
arts
ther
eof
561
561
561
561
2053
83
95.9
00.
53
56W
addi
ng, f
elt &
non
wov
en; s
peci
al y
arns
; tw
ine,
cor
dage
, rop
es a
nd c
able
s et
c38
738
738
738
737
215
03.
880.
00
53Ot
her v
eget
able
text
ile fi
bres
; pap
er y
arn
& w
oven
fabr
ic34
40
00
00
0.
.
83M
isce
llane
ous
artic
les
of b
ase
met
al34
334
334
334
333
85
01.
460.
00
17Su
gars
and
sug
ar c
onfe
ctio
nery
342
342
342
033
84
01.
17.
79Zi
nc a
nd a
rticl
es th
ereo
f34
00
00
00
0.
.
15An
imal
/veg
etab
le (A
/V) f
ats
& oi
ls &
thei
r cle
avag
e pr
oduc
ts; p
repa
red
edib
le fa
ts; A
/V w
axes
337
337
337
337
267
700
20.7
70.
00
19Pr
epar
atio
ns o
f cer
eal,
flour
, sta
rch/
milk
; pas
tryco
oks'
pro
duct
s32
832
832
80
328
00
0.00
.
78Le
ad a
nd a
rticl
es th
ereo
f31
031
031
031
026
80
420.
0013
.55
72Iro
n an
d st
eel
291
00
00
00
..
43Fu
r ski
ns a
nd a
rtific
ial f
ur; m
anuf
actu
res
ther
eof
284
284
284
028
40
00.
00.
30Ph
arm
aceu
tical
pro
duct
s28
20
00
00
0.
.
55M
an-m
ade
stap
le fi
bres
, inc
l. ya
rns
and
wov
en fa
bric
s th
ereo
f28
028
028
028
028
00
00.
000.
00
46M
anuf
actu
res
of s
traw,
esp
arto
/oth
er p
laiti
ng m
at.;
bask
et w
are
& w
icke
rwor
k25
925
925
925
917
929
5111
.20
19.6
9
46M
anuf
actu
res
of s
traw,
esp
arto
/oth
er p
laiti
ng m
at.;
bask
et w
are
& w
icke
rwor
k25
925
925
925
917
929
5111
.20
19.6
9
Not
e: N
on-d
utia
ble
trad
e un
der
chap
ters
01,
05,
23,
25,
34,
40,
45,
48,
49,
68,
70,
73,
76,
84,
85,
87,
91,
97
not r
epor
ted.

55
Identifying a Positive Agenda Among Challenges and Opportunities
Table 26: Non-tariff measures imposed by Myanmar’s partners (sorted in descending values of total NTM, MMR exports > $4 million)
Country Bilateral NTM Multilateral NTM Total NTM MMR exports ($ millions) 2017
China 29 5 685 5 714 5 398.1
United States 778 3 995 4 773 277.3
New Zealand 177 1 847 2 024 4.5
Canada 44 1 577 1 621 60.6
Australia 7 1 611 1 618 25.9
Thailand 52 1 088 1 140 2 678.4
Brazil 16 1 047 1 063 7.9
Japan 31 1 025 1 056 903.0
Philippines 4 738 742 19.2
Argentina 1 691 692 5.8
Chile 8 680 688 7.2
Malaysia 9 665 674 187.8
Indonesia 17 569 586 118.6
Mexico 0 532 532 9.5
Russian Federation 34 479 513 18.6
Singapore 1 507 508 684.6
United Arab Emirates 48 426 474 70.5
Hong Kong, China 15 433 448 81.2
Switzerland 19 378 397 5.4
Saudi Arabia 4 356 360 30.2
Viet Nam 2 319 321 129.1
Nepal 0 279 279 4.6
Turkey 276 0 276 6.5
India 0 266 266 708.1
Bangladesh 1 244 245 128.9
Israel 0 243 243 4.8
Qatar 0 222 222 6.7
Cameroon 1 209 210 11.8
Sri Lanka 0 190 190 52.3
Guinea 2 162 164 26.0
Oman 1 148 149 4.5
Pakistan 7 131 138 67.1
Kuwait 0 121 121 7.4
Senegal 20 99 119 15.1
Afghanistan 0 104 104 17.1
Côte d’Ivoire 0 53 53 59.1
Source: UNCTAD TRAINS NTMs: The Global Database on Non-Tariff Measures, measures in force as of 28 April 2019.

56
Towards a New Trade Policy on Market Access for Myanmar:
Table 27: Non-tariff measures imposed by Myanmar’s partners by product (sorted in descending values of total NTM, MMR exports > $5 million, share in total trade > 5 per cent, total NTM > 3)
ISO3 HS6 DescriptionBi-lateral
NTMMulti-lateral
NTMTotal NTM
MMR exports ($ millions)
Share in total trade (%)
CHN 100620 Cereals; husked (brown) rice 10 104 114 527.6 10
CHN 100510 Maize (corn), seed 1 97 98 271.7 5
CHN 271019Petroleum oils & oils obtained from bituminous minerals (other than crude) & preparations not elsewhere specified
0 88 88 277.4 5
CHN 170191 Cane or beet sugar, containing added flavouring or colouring 0 59 59 337.7 6
CHN 170199 Cane or beet sugar, in solid form, nes 0 59 59 419.4 8
VNM 071331 Dried beans, shelled 0 41 41 21.8 17
EUN 100640 Broken rice 0 36 36 81.5 5
CHN 271111 Natural gas, liquefied 0 31 31 1 019.7 19
ARE 071331 Dried beans, shelled 0 29 29 16.9 24
PHL 071331 Dried beans, shelled 0 26 26 10.5 54
IDN 100640 Broken rice 2 20 22 12.9 11
RUS 100620 Husked (brown) rice 0 22 22 6.1 33
VNM 100510 Maize (corn), seed 0 20 20 11.4 9
LKA 071331 Dried beans, shelled 0 19 19 11.9 23
LKA 100620 Husked (brown) rice 0 19 19 28.3 54
LKA 100640 Broken rice 0 19 19 10.3 20
CHN 271121 Natural gas in gaseous state 0 18 18 286.2 5
IDN 071331 Dried beans, shelled 2 15 17 28.5 24
CHN 720260 Ferro-nickel (granular/powder) 0 17 17 320.0 6
MYS 071331 Dried beans, shelled 2 14 16 21.2 11
IND 071390Vegetables, leguminous; n.e.c. in heading no. 0713, shelled, whether or not skinned or split, dried
0 15 15 107.4 15
IND 071331 Dried beans, shelled 0 15 15 317.2 45
USA 620319 Men’s or boys’ suits of other textiles, nes 0 11 11 29.9 11
EUN 620339 Men’s or boys’ jackets and blazers of other textiles, nes 0 8 8 156.0 10
EUN 620319 Men’s or boys’ suits of other textiles, nes 0 8 8 97.1 6
EUN 620520 Men’s or boys’ shirts of cotton 0 7 7 78.3 5
EUN 620690 Women’s or girls’ blouses, shirts and shirt-blouses of other textile materials 0 7 7 100.0 7
MYS 270900 Petroleum oils and oils obtained from bituminous minerals, crude 0 6 6 22.7 12
CAN 620293Women’s or girls’ anoraks (including ski-jackets), wind-cheaters, wind-jackets and similar articles of man-made fibres
0 6 6 7.1 12
SEN 100640 Broken rice 1 5 6 15.0 100
CAN 620520 Men’s or boys’ shirts of cotton 0 6 6 5.1 8
SGP 880240 Aeroplanes and other aircraft, of an unladen weight > 15,000 kg 0 5 5 140.1 20
HKG 900130Lenses, contact; unmounted, of any material, excluding elements of glass not optically worked
0 4 4 14.6 18
CMR 100620 Husked (brown) rice 0 4 4 11.8 100
Source: UNCTAD (2017) TRAINS NTMs: The Global Database on Non-Tariff Measures, measures in force in 2016; trade values above $100 million highlighted in red. Trade values 2017.

57
Identifying a Positive Agenda Among Challenges and Opportunities
Table 28: Bilateral SPS measures imposed by Myanmar’s partners by products (sorted in descending values of Myanmar’s exports, MMR exports > 500,000; bilateral SPS > 1)
Country HS 6 Product descriptionBi-lateral
NTMMulti-lateral
NTMTotal NTM
MMR exports ($ millions)
Share in total trade (%)
CHN 100620 Husked (brown) rice 7 47 54 527.6 9.8
CHN 100640 Broken rice 7 64 71 41.3 0.8
CHN 100630 Semi-milled or wholly milled rice 7 47 54 3.3 0.1
THA 100510 Maize (corn), seed 7 3 10 0.7 0.0
JPN 100620 Husked (brown) rice 3 6 9 0.8 0.1
IDN 071331 Dried beans, shelled 2 12 14 28.5 24.0
MYS 071331 Dried beans, shelled 2 9 11 21.2 11.3
JPN 120740 Sesamum seeds, w/o broken 2 5 7 14.5 1.6
IDN 100640 Broken rice 2 12 14 12.9 10.9
USA 071331 Dried beans, shelled 2 15 17 7.9 2.8
USA 440729Wood, tropical, n.e.c. in item no. 4407.2, sawn or chipped lengthwise, sliced or peeled, whether or not planed, sanded or end-jointed, of a thickness exceeding 6mm
2 8 10 1.9 0.7
IDN 071339Vegetables, leguminous; n.e.c. in item no. 0713.3, shelled, whether or not skinned or split, dried
2 12 14 1.5 1.3
MYS 100590 Cereals; maize (corn), other than seed 2 0 2 1.4 0.8
JPN 100640 Broken rice 2 6 8 1.2 0.1
MYS 100510 Maize (corn), seed 2 0 2 1.2 0.6
USA 071390Vegetables, leguminous; n.e.c. in heading no. 0713, shelled, whether or not skinned or split, dried
2 14 16 1.2 0.4
MYS 071333Vegetables, leguminous; kidney beans, including white pea beans (Phaseolus vulgaris), shelled, whether or not skinned or split, dried
2 9 11 0.8 0.4
MYS 071390Vegetables, leguminous; n.e.c. in heading no. 0713, shelled, whether or not skinned or split, dried
2 9 11 0.7 0.4
MYS 091030 Spices; turmeric (curcuma) 2 9 11 0.6 0.3
MYS 071320Vegetables, leguminous; chickpeas (garbanzos), shelled, whether or not skinned or split, dried
2 9 11 0.5 0.3
Source: UNCTAD (2017) TRAINS NTMs: The Global Database on Non-Tariff Measures, measures in force in 2016; Trade shares above 5 per cent highlighted in red (already depicted in the table 27). Trade values 2017.

58
Towards a New Trade Policy on Market Access for Myanmar:
Table 29: Identification of possible detterent bilateral SPS measures imposed by Myanmar’s partners (sorted in descending values of Myanmar’s exports to the world > $13 million, $5,000 < MMR exports to partner < 1 million, bilateral SPS >= 2)
Partner HS 6 HS descriptionBilateral
SPSMultilateral
SPSTotal SPS
MMR exports (thousands of United States dollars)
To Partner To all countries
JPN 100620 Husked (brown) rice 3 6 9 753 980 892
TUR 071331 Dried beans, shelled 2 0 2 41.4 782 660
THA 170191 Cane or beet sugar, containing added flavouring or colouring 4 7 11 347.1 338 090
MYS 100640 Broken rice 2 9 11 191.3 301 850
HKG 100510 Maize (corn), seed 2 1 3 198.9 286 046
THA 100510 7 3 10 670.9 286 046
MYS 120740 Sesamum seeds 2 6 8 441.0 185 400
MYS 071390Vegetables, leguminous; n.e.c. in heading no. 0713, shelled, whether or not skinned or split, dried
2 9 11 718.9 118 076
TUR 440729Wood, tropical, n.e.c. in item no. 4407.2, sawn or chipped lengthwise, sliced or peeled, whether or not planed, sanded or end-jointed, of a thickness exceeding 6 mm
2 0 2 37.5 89 517
JPN 080290 Nuts, edible; n.e.c. in heading no. 0801 and 0802, fresh or dried, whether or not shelled or peeled
2 5 7 12.5 35 658
USA 080290 9 11 20 10.4 35 658
MYS 071320 Vegetables, leguminous; chickpeas (garbanzos), shelled, whether or not skinned or split, dried
2 9 11 548.5 34 787
USA 071320 2 15 17 161.9 34 787
TUR 071320 2 0 2 100.8 34 787
JPN 100630 Semi-milled or wholly milled rice 2 6 8 325.3 24 449
IDN 100630 2 12 14 12.5 24 449
TUR 440799 Wood; sawn or chipped lengthwise, sliced or peeled, of a thickness exceeding 6mm, whether or not planed, sanded or finger-jointed, n.e.c. in heading no. 4407
2 0 2 43.9 19 540
USA 440799 2 8 10 138.2 19 540
MYS 091030 Spices; turmeric (curcuma) 2 9 11 632.9 15 090
JPN 091030 2 5 7 29.0 15 090
USA 071333 Vegetables, leguminous; kidney beans, including white pea beans (Phaseolus vulgaris), shelled, whether or not skinned or split, dried
2 15 17 136.1 13 967
MYS 071333 2 9 11 781.7 13 967
Source: UNCTAD (2017) TRAINS NTMs: The Global Database on Non-Tariff Measures, measures in force in 2016; trade values 2017. Products with three or more bilateral SPS highlighted in green.


U N I T E D N AT I O N S C O N F E R E N C E O N T R A D E A N D D E V E L O P M E N T
IDENTIFYING A POSITIVE AGENDA AMONG CHALLENGES AND OPPORTUNITIES
TOWARDS A NEW TRADE POLICY ON MARKET ACCESS FOR MYANMAR
UNCTA
DUNITED NATIONS
TOWARDS A NEW
TRADE POLICY ON MARKET ACCESS FOR M
YANMAR IDENTIFYING A POSITIVE AGENDA AM
ONG CHALLENGES AND OPPORTUNITIES
Layout and Printing at United Nations, Geneva – 2017386 (E) – March 2021 – 430 – UNCTAD/ALDC/2019/4