towards a framework for identifying digital improvement
TRANSCRIPT
Linköping University | Department of Management and Engineering
Master Thesis, 30 hp | Operations Management
Spring 2018 |ISRN: LIU-IEI-TEK-A--18/03043--SE
Towards a Framework for Identifying
Digital Improvement Opportunities
- Utilizing Information Flow and its Stakeholder Value
Andreas Rosell
Ludvig Salomonsson
Supervisor: Mathias Henningsson
Examiner: Veronica Lindström
Linköping University
SE-581 83 Linköping, Sweden
+46 013 28 10 00, www.liu.se

I
PREFACE
Before you lies the master thesis of Andreas Rosell & Ludvig Salomonsson, the last scientific report to
fulfill our Master of Science degree in Industrial Engineering and Management at Linköping University.
This report was performed at the request of Propia AB and with the collaboration of Paper Province and
several case companies, during a period of 20 weeks, starting in January 2018. The research was
challenging but rewarding, since we had the opportunity to contribute knowledge to the research area and
practical advice to the organizations involved in the study. However, the study would be difficult to
complete without the assistance of certain individuals.
To begin with, we would like to extend our sincere gratitude towards Mathias Henningsson, our university
supervisor, who brought guidance through valuable discussions during the study.
We would also like to express our gratefulness to the employees of Propia AB, whose involvement made
the study possible. We are especially thankful for the assistance given by Johan Hall, our company
supervisor, for his advice, time and knowledge. Furthermore, the involvement of the case companies,
Nykvist Skogs AB and Bäckebrons Sågverk AB, as well as Paper Province, Cybercom Sweden AB and the
external innovation partner, has provided useful and practical knowledge. Therefore, we extend our
appreciation and thankfulness towards the employees of these organizations.
Last but not least, we would like to take a moment to express our great appreciation towards ourselves and
each other, for an outstanding performance and collaboration throughout the whole study.
Just as all good things must come to an end, it is with a tear in our eyes that we write the last sentences of
this report, which constitutes the final countdown of our five-year academic journey. As we are leaving
together, to meet new adventures and challenges, we reminisce the good times and experience while
studying, but still it is farewell.
Will things ever be the same again…?
Linköping, 30th May 2018
Andreas Rosell Ludvig Salomonsson
II
ABSTRACT
Keywords: Digitization, digitalization, digital transformation, systematic change, information
management, process management, improvement work, information flows, digital improvement
opportunities.
Humanity is at the starting point of a new industrial revolution, affecting our daily life, work and way of
thinking. New technologies and breakthroughs drives the fourth industrial revolution, transforming the
structure of the world economy, society and its people. The key component of these changes is the rapid
technological development, which relies on the high degree of digitalization.
The work with digitalization is a highly discussed topic, but no general or standardized method for digital
improvement efforts has been established. In order to face the challenges associated with the technological
development, which forces organizations to invest time and resources to create their own methods for
working with digital improvements.
This study focus on the common characteristics or elements found in previous digital improvement efforts,
in an attempt to summarize and identify the success-factors. These elements were further analyzed and
evaluated against established theory, to assess the element’s trustworthiness and generalizability, resulting
in a conceptual framework. The conceptual framework was tested and evaluated in a case study concerning
two case companies to achieve practical applicability, leading to the final framework.
This final framework, focusing on information flows connected to an organization processes, was found
capable of identifying, analyzing and prioritizing digital improvement opportunities, by utilizing external
and internal factors. Thus, answering the research questions:
RQ 1: How would a framework capable of identifying digital improvement opportunities, based
on common characteristics found in literature, be presented?
RQ 2: How can digital improvement opportunities be prioritized and evaluated, to create value
for an organization, whilst being practicable?
RQ 3: Which information is necessary to retrieve, to successfully implement digital
improvements?

III
TABLE OF CONTENTS
1 INTRODUCTION ............................................................................................................................................. 1
1.1 THEORETICAL BACKGROUND................................................................................................................................ 2
1.2 COMPANY BACKGROUNDS .................................................................................................................................. 4
1.3 PROBLEM DESCRIPTION ...................................................................................................................................... 5
1.4 PURPOSE AND RESEARCH QUESTIONS ................................................................................................................... 5
1.5 DELIMITATIONS ................................................................................................................................................ 6
1.6 DEFINITIONS .................................................................................................................................................... 6
2 METHODOLOGY AND METHODS ................................................................................................................... 7
2.1 QUALITATIVE RESEARCH METHOD ........................................................................................................................ 8
2.2 EXPLORATORY RESEARCH DESIGN ......................................................................................................................... 9
2.3 DATA COLLECTION TECHNIQUES ......................................................................................................................... 10
2.4 ANALYSIS AND RESEARCH PROCEDURE ................................................................................................................ 15
2.5 EXPECTED GENERALIZABILITY ............................................................................................................................. 19
2.6 RELIABILITY AND VALIDITY ................................................................................................................................. 19
2.7 OBJECTIVITY ................................................................................................................................................... 20
3 FRAME OF REFERENCE ................................................................................................................................. 23
3.1 ORGANIZATION AND PROCESSES ........................................................................................................................ 24
3.2 IMPROVEMENT WORK ..................................................................................................................................... 28
3.3 INFORMATION AND INFORMATION MANAGEMENT ................................................................................................ 31
3.4 INDUSTRIE 4.0 AND CYBER-PHYSICAL PRODUCTION SYSTEMS .................................................................................. 36
3.5 LITERATURE SYNTHESIS ..................................................................................................................................... 38
4 FINDINGS AND ANALYSIS: LITERATURE SYNTHESIS ...................................................................................... 49
4.1 FINDINGS FROM THE LITERATURE SYNTHESIS ANALYSIS ........................................................................................... 50
4.2 FINDINGS FROM THE ANALYSIS WITH RESPECT TO ESTABLISHED THEORY .................................................................... 52
5 FINDINGS AND ANALYSIS: CASE STUDY ....................................................................................................... 55
5.1 INTRODUCTION ............................................................................................................................................... 56
5.2 OBSERVATION AND INTERVIEWS ......................................................................................................................... 56
5.3 WORKSHOP ................................................................................................................................................... 58
5.4 ANALYSIS AND FRAMEWORK DEVELOPMENT ........................................................................................................ 59
6 FINAL FRAMEWORK .................................................................................................................................... 63
6.1 PREREQUISITES ............................................................................................................................................... 63
6.2 PHASE 1: DEFINE ............................................................................................................................................ 64
6.3 PHASE 2: CURRENT STATE ................................................................................................................................ 64
6.4 PHASE 3: FUTURE STATE .................................................................................................................................. 64
6.5 PHASE 4: ANALYSIS ......................................................................................................................................... 65
6.6 PHASE 5: IMPLEMENT ...................................................................................................................................... 66
6.7 PHASE 6: FOLLOW UP AND REPEAT ..................................................................................................................... 66
7 CONCLUSION ............................................................................................................................................... 67

IV
7.1 ANSWERING THE RESEARCH QUESTIONS .............................................................................................................. 68
8 DISCUSSION ................................................................................................................................................. 71
8.1 ETHICS .......................................................................................................................................................... 72
8.2 LIMITATIONS .................................................................................................................................................. 72
8.3 RESEARCH CONTRIBUTION ................................................................................................................................ 72
8.4 FUTURE WORK ............................................................................................................................................... 73
9 REFERENCES ................................................................................................................................................ 75
APPENDIX A: SEARCH TERMS .................................................................................................................... 79
APPENDIX B: MODIFIED PROCESS-ORIENTED INFORMATION MAP ................................................... 80
V
TABLE OF FIGURES
Figure 1 Illustration of the underlying factors leading up to the master thesis (Authors’ image) ................................ 1
Figure 2 The four main areas of digital transformation as described by (Bloching, et al., 2015) .................................. 3
Figure 3 The three research questions, their domain and the research methods used to answer them (Authors'
image) ............................................................................................................................................................................ 6
Figure 4 Research questions and the general methods used to answer them (Authors’ illustration) .......................... 7
Figure 5 Deduction, induction, abduction and the relationship between theory and reality (Patel & Davidson, 2011)
....................................................................................................................................................................................... 9
Figure 6 The literature synthesis process (Backman, 2016) ........................................................................................ 10
Figure 7 Thematic analysis process (Miller, 2016) ....................................................................................................... 15
Figure 8 The framework creation process (Authors’ image) ....................................................................................... 18
Figure 9 Representation of the three main areas of the report (Authors' image) ...................................................... 19
Figure 10 Representation of the study's three main areas, as to visualize the theoretical position of the study
(Authors’ image) .......................................................................................................................................................... 23
Figure 11 The relationship between a company’s mission, process objectives and vision (Bergman & Klefsjö, 2001)
..................................................................................................................................................................................... 25
Figure 12 The core process exists horizontally though the whole organization (Bergman & Klefsjö, 2001) .............. 26
Figure 13 Illustration of an organizations different process categories based on the processes purpose (Bergman &
Klefsjö, 2001) ............................................................................................................................................................... 27
Figure 14 An example of a swim lane flowchart (Authors’ image) .............................................................................. 28
Figure 15 The five steps included in the improvement tool DMAIC (Magnusson, et al., 2003) .................................. 29
Figure 16 The main steps in GAP analysis (GTS Learning, 2014) ................................................................................. 30
Figure 17 The four layers of the enterprise architecture (Behrouz & Fathollah, 2016) ............................................. 33
Figure 18 Transforming data (Loshin, 2013) ................................................................................................................ 33
Figure 19 Hierarchy of manufacturing automation systems (Shanks, et al., 2003) ..................................................... 34
Figure 20 Process-oriented information map, depicting the three layers and content (Myndigheten för
sammhällsskydd och beredskap & Riksarkivet, 2012) ................................................................................................. 35
Figure 21 The Industrial Revolutions (Authors’ image) ............................................................................................... 37
Figure 22 Eight steps of transforming an organization (Kotter, 2007) ........................................................................ 39
Figure 23 Relation between digital transformation strategy and other corporate strategies (Matt, et al., 2015) ..... 40
Figure 24 Digital transformation framework, connection between the four dimensions (Matt, et al., 2015) ........... 40
Figure 25 The building blocks of digital transformation (Westerman, et al., 2011) .................................................... 45
Figure 26 Illustration of the relation between the literature synthesis and established theory, which answers RQ 1
(Authors' image) .......................................................................................................................................................... 49
Figure 27 Illustration of the conceptual framework's main phases. (Authors' image)................................................ 53
Figure 28 The development of the framework (Authors' image) ................................................................................ 55
Figure 29 The final framework (Authors' image) ......................................................................................................... 63
Figure 30 The path towards the final framework (Authors’ image) ............................................................................ 67
Figure 31 An illustration of the framework’s "filtering process" (Authors’ image) ..................................................... 69
Figure 32 The gap between organization’s technological adapation and technological development (Brinker, 2016)
..................................................................................................................................................................................... 73
Figure 33 Illustration of the modified process-oriented information map. Current state (above) and future state
(below). (Authors’ image) ............................................................................................................................................ 80
1
1 INTRODUCTION
The following chapter introduces the theoretical background, where relevant areas and ongoing
developments are described to position the study and identify the research gap. The research gap, stated in
the Problem Description, further progresses into the Purpose and Research Questions of the study.
As development leaps forward at an all increasing pace, and technologic components becomes smaller and
more powerful, experts claim that the world stand in the brink of a new technological revolution that will
fundamentally change the way we live, work and relate to each other. At this stage, industries face new
challenges associated to new technological innovations, customer awareness and global environmental
challenges. As a result of these circumstances, organizations have transformed their business and operations
leading to a new Industrial Revolution. Europe, driven by the manufacturing giant Germany has developed
a new concept of manufacturing, called Industrie 4.0. The concept generally focuses on connectivity, where
products, business functions and machines are connected and collaborating together, often autonomously.
(Schwab, 2016)
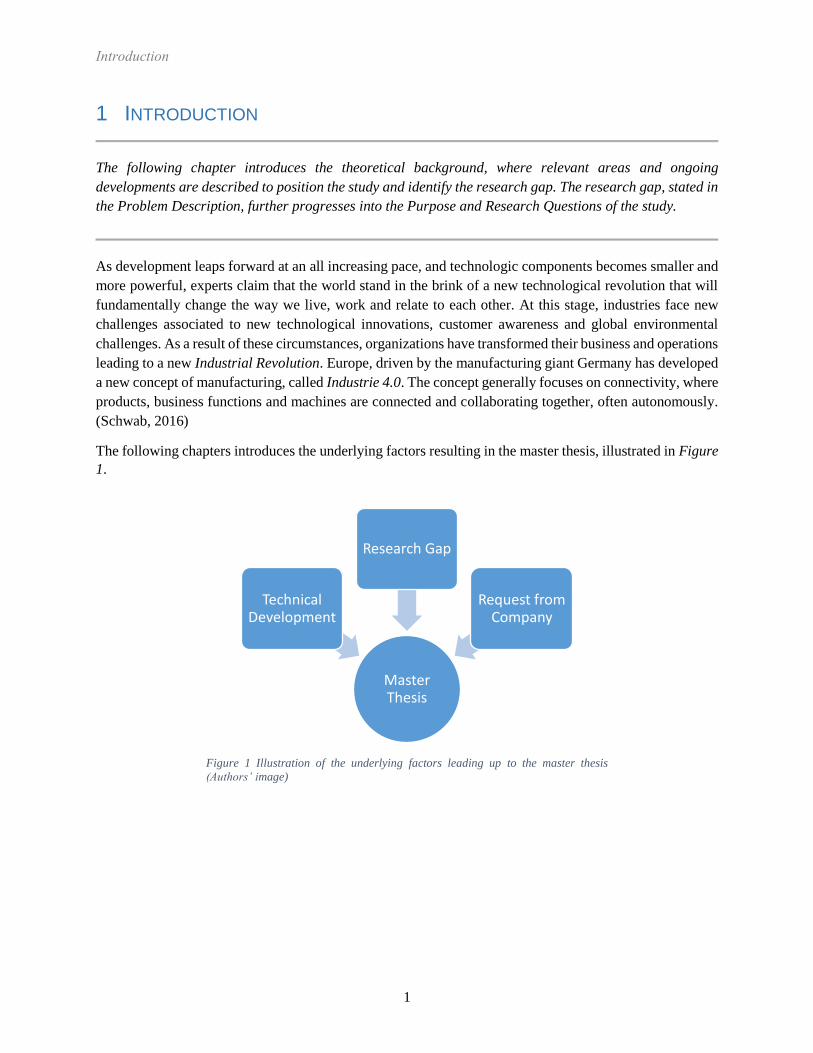
The following chapters introduces the underlying factors resulting in the master thesis, illustrated in Figure
1.
Figure 1 Illustration of the underlying factors leading up to the master thesis
(Authors’ image)
Master Thesis
Technical Development
Research Gap
Request from Company
2
1.1 Theoretical Background
The strategic importance of computer-aided functions became obvious during the 1990s. Administration,
resource planning and operations planning etc., handling an immense amount of information, became easier
to manage and interpret with the assistance of computer software, such as Enterprise Resource Planning
(ERP) systems. Nowadays, these systems play a role as an integrated part of the day-to-day operations, in
almost every organization. However, with the current trend and developments in the area of digitalization,
the level of technological advancements demands more knowledge from the people around it. A majority
of the companies are therefore investing in IT-departments tasked with developing, maintaining and
supporting these competence heavy processes. Thus, the focus has shifted from a purely support
perspective, where digital solutions aided a company, to a development focus, where digital solutions
further develops a company. (Cöster & Westelius, 2016)
When focusing on the manufacturing sector, one often mentions “Cyber-Physical Production System”
(CPPS), which is defined as a system built up by connected and collaborating autonomous entities,
throughout all levels of production, from individual components of machines to logistic networks. Such a
system would be able to handle an immense number of individual operations and make real time decisions
to reach optimal and/or robust results for any given situation. Other advantages such as increased safety,
self-maintenance, predictability and full transparency are also some of the expected benefits of CPPS.
(Monostori, 2014)
As a result of the ongoing trend towards digitalization, companies can transform their businesses to create
new business opportunities. Enabling new connected product functionalities that are integrated in the
operational processes, co-creating value with customers through new service offerings. These products or
services change the industry structure and the competition environment, leading to new competitive
opportunities. As an example, traditional truck manufacturing companies has gone from selling only trucks
to their customer to sell rental contracts, maintenance or fleet management services. This imposes
companies to integrate their products, services and operations using digital platforms and components.
(Porter & Heppelmann, 2014)
The potential benefits of digitalization are high, by implementing digital solutions in information-intensive
processes, cost can be cut up to 90 percent and turnaround times improved drastically. Further on, process
performance, cost drivers and risk analysis can be improved by collecting data automatically using software
solutions, instead of performing tasks manually. This allows managers to react directly and base decisions
on real-time repots. (Parviainen, et al., 2017)
Traceability and safety can increase by augmenting products with digital solutions. As an example, remote
monitoring, using radio frequency identification (RFID) transmitters attached on products, packages, pallets
or containers. This allows companies to track their items through the production flow, value- or supply
chain. In this way, information such as performance, condition and destination can be analysed in real time,
which lead to instantaneous responses and control. From a health and security perspective, especially within
the food- and pharmaceutical industry, traceability is a necessary aspect, to avoid and prevent
contaminations to enter the processes. (Schwab, 2016)
1.1.1 Digital Technology Areas
A higher degree of digitalization is often achieved by combining established technologies with new,
innovative thinking. In recent years, the development of new technologies has mainly taken place in four
core areas of development: Digital Data, Automation, Digital Customer Access and Connectivity. The

3
picture provided by Bloching, et al. (2015) illustrate these core areas of development, their enablers and
resulting propositions. The enablers are the technologies that are believed to bring these resulting
propositions, digitally transforming a company and its functions, as shown in Figure 2. (Bloching, et al.,
2015)
1.1.2 Sweden and Digitalization
Sweden has played an important role and been successful in the areas of IT and digitalization. This is
confirmed by the World Economic Forums’ index ranking Sweden as number three after Finland and
Singapore. Some of the reasons for this success is the high technical maturity among Swedish companies
and their will and ability to adapt new digital solutions. Other factors which is of importance when speaking
about digitalization is the high level of education, cooperation between industries and collaboration with
the academy and public sector. The majority of Swedish manufacturing companies are small or medium
sized and the digitalization take place within the technical areas that are new for them. Therefore, companies
face the challenge to gain access to knowledge and skills in the field of digitalization. (Bossen &
Ingemansson, 2016)
The Swedish government has ordered Vinnova, which is a government agency that administers state
subsidy for research and development to carry out efforts to promote a digitized Swedish manufacturing
industry, with the aim of strengthening Swedish innovation and competitiveness. Vinnova has conducted a
study called “Digitalisering av svensk industri”. The main purpose of the study is to highlight for the
technology areas that are of major importance for the digitization of the Swedish manufacturing industry.
Figure 2 The four main areas of digital transformation as described by (Bloching, et al., 2015)

4
A successful digitalization is essential and will lead to increased customer value of their products, service
and business. (Bossen & Ingemansson, 2016)
Digitalization of the manufacturing industry will give the opportunity for new innovative products,
processes, services, work methods and business models. A study commissioned by the European
Commission and performed by the German industry association BDI, shows that about 600 billion euro can
be lost if, the European countries fails with a successful digitalization. This could also inhibit Europe from
reaching the goal of increasing the manufacturing industry’s share of GDP to 20 percent by 2020. (Bossen
& Ingemansson, 2016)
1.2 Company Backgrounds
Propia AB
Propia AB is a Swedish consultancy firm that are specialists in the areas of process management, change
management and business development. The head office is located in Norrköping, and a minor office in
Stockholm. Propia's customers are represented throughout the whole country, mainly in the middle parts of
Sweden. Today, there are around sixteen employees, as well as some subcontractors, four students that are
writing their master thesis in the field of digitalization. The company was founded in 1995. (Propia AB,
2018)
Propia AB states, “We are inspired by change and driven by creating long-term sustainable solutions with
our customers. With our expertise, our working techniques and our methods, we have ensured strategic
development, efficiency and customer satisfaction since 1995.” (Propia AB, 2018)
Propia AB have collaborations with several universities around Sweden, the reason is to create a foundation
for future development, and cooperation between business and academia. Propia has a history of applying
students after finishing master thesis at the company, several of the models/framework that are used
originates from students’ master thesis. (Propia AB, 2018)
Cybercom Sweden AB
Cybercom is used as an external innovation partner for the study, which stands for the technical expertise
and in the end deliver the technical solution.
Cybercom is an IT consulting company that helps companies and organizations to take advantage of the
connected world’s capabilities, leading to a higher degree of competiveness. Cybercom’s expertise covers
the entire system of communication services. The majority of their customers are located in Scandinavia.
Cybercom was founded 1995 in Stockholm and has today around 1300 employees in five counties.
(Cybercom, 2018)
Nykvist Skogs AB
The first case company used in the study, called Nykvist Skogs, is a small forest company which offer
sustainable forest management, such as timber extraction, planting and replanting, and timber trade direct
to sawing mills. Nykvist Skogs is a small company with around 7 employees, and a couple of sub-
contractors. The company was founded in 1979 and is mostly active in Värmland, Sweden. (Nykvist Skogs
AB, 2018)
Bäckebrons Sågverk AB
The second company used in the study, Bäckebrons Sågverk is a small and flexible sawing mill. The
company mainly handles timber with top diameter 10 cm to 22 cm. Therefore, their product can be easily
customized, with small series and series of special dimensions. The residues from manufacturing are used
to produce pellets. Bäckebrons sates that they stand for high quality, personalized service and delivery on
5
time. The company is located in Värmland, 50 km northwest of Karlstad, with around 24 employees.
(Bäckebrons Sågverk AB, 2018)
1.3 Problem Description
As the world transitions into an era, which utilizes more advanced technology for operations, organizations
are struggling to keep up with the technological development. Previous studies have shown the benefits of
incorporating advanced technology in processes and activities, and on the other hand, the dangers of
neglecting development. Several case studies have been performed at companies in different industries
regarding implementation of digital solutions and the management of the digital information flow that stems
from it, but a general path or method has not yet been defined. Furthermore, the methods used in previous
work is often specifically designed for a unique company. (Bossen & Ingemansson, 2016) (Markovitch &
Willmott, 2014) (Monostori, 2014)
Therefore, the underlying problem is the absence of a framework able to, in a standardized way, identify
digital improvement opportunities, utilizing valuable information flows. This framework should be
independent of the organization and sector, leading to a high degree of generalizability. A digital
information flow is further defined, in this report, as data gathered or created at one location and transferred
to another location and/or stakeholder (Business Dictionary, 2018). The value of the digital information
flow should be determined by a specific company’s interest, values and/or objectives.
1.4 Purpose and Research Questions
This report will create a framework able to identify and evaluate digital improvement opportunities for
companies and organization, in the context of digitalization, by utilizing perspectives on data and the digital
information flows that can be created. The framework will be based on common characteristics regarding
digitalization efforts found in literature and further developed with two case companies in the forest sector.
This report will therefore explore previous digitalization efforts, with the aim of finding common
characteristics and patterns, which acts as the theoretical foundation of the framework. The framework’s
main function is to find digital improvement opportunities, in the context of a company’s internal or external
information flows. The technical solution, involving the software and/or hardware, is provided by a third
party. The third party is therefore in need of a certain amount of information regarding the digital
improvement opportunity, as to enable a successful implementation of a digital solution.
Therefore, to construct a framework, the study aims to answer the following research questions:
RQ 1: How would a framework capable of identifying digital improvement opportunities, based
on common characteristics found in literature, be presented?
RQ 2: How can digital improvement opportunities be prioritized and evaluated, to create value
for an organization, whilst being practicable?
RQ 3: Which information is necessary to retrieve, to successfully implement digital
improvements?
Figure 3 provides a brief illustration describing the research questions and the corresponding research
methods used. A detailed description is provided in chapter 2.4 Analysis and Research Procedure.

6
1.5 Delimitations
The study will only concern the testing phase of the framework, no actual implementation, since
the timespan between implementation and result is often long.
The technical solution or hardware and software ultimately needed for a company is outside of this
thesis’ scope.
The case studies will be performed at two small sized companies, in the forest sector, located in
Sweden.
1.6 Definitions
Below follows the definition of important and frequently used terms, as to prevent misinterpretation. Other
terms are defined continuously throughout the report, where it is discussed.
Digitization: “The action or process of digitizing; the conversion of analogue data (esp. in later use images,
video, and text) into digital form.” (Parviainen, et al., 2017)
Digital transformation: “The changes associated with the application of digital technology in all aspects of
human society” (Parviainen, et al., 2017)
Digitalization: “Integration of digital technologies into everyday life by the digitization of everything that
can be digitized” (Business Dictionary, 2018)
Information flow: “Path data takes from its original setting to its end users” (Business Dictionary, 2018)
Figure 3 The three research questions, their domain and the research methods used to
answer them (Authors' image)
Theoretical Domain
Empirical Domain
RQ1 Literature Synthesis
RQ2 Case Studies
RQ3Case Studies (Interviews)

7
2 METHODOLOGY AND METHODS
The following chapter provides an explanation and motivation for the research methodology and methods
used in the project, as well as the report structure and framework creation process, in order to answer the
three research questions stated in 1.4 Purpose and Research Question.
The study had an exploratory purpose, based on the intention to find common characteristics distinguishing
a successful digitalization effort. The project had a qualitative research method, initialized by a literature
review to explore previous digitalization efforts and the management of information in organizations. This
phase served two purposes, to create an improved understanding around the subject, and as the foundation
for the preliminary framework, depicting the implementation prerequisites. Further on, a literature synthesis
was performed in an attempt to identify, gather and aggregate the common characteristics of digital
improvement efforts. The literature synthesis focused on articles regarding the subject. The findings from
the literature synthesis, constructing the conceptual framework, was crosschecked with findings from the
case study, developing the conceptual model framework in the process. Therefore, as defined by Patel &
Davidson (2011), the logic of the report utilized abductive reasoning.
Below, in Figure 4, follows an illustration of the research questions and their theoretical or empirical
connection. However, some elements of the research questions are connected to both domains.
Figure 4 Research questions and the general methods used to answer them (Authors’ illustration)
Foundation in literature
Empirical evaluation
RQ 1Empirical foundation
Empirical evaluation
RQ 2Empirical foundation
Supported by interviews
RQ 3
8
2.1 Qualitative Research Method
“Quantitative research is empirical research where the data are in the form of numbers. Qualitative
research is empirical research where the data are not in the form of numbers.” Punch (cited in Blaxter, et
al., 2006, p. 64)
The quantitative approach is characterized by its data, which is a quantity, and the means of measuring this
data. Quantitative methods often involve measurements performed with physical tools to examine physical
variables, but can also investigate psychological traits and characteristics, commonly believed to belong to
the qualitative methods. The distinction lies in the outcome, where quantitative methods aggregates the data
to reach a generalizable conclusion from the population, whereas qualitative methods focus on in-depth
understanding and causality of one or a few conundrums. (Leedy & Ormrod, 2009)
A quantitative study is often based on a clearly defined hypothesis, the variables of the study are isolated,
and the data is collected through standardized methods. The collected data are filtered through different
statistical analyses tools and a conclusion is made based upon the results from the analysis, this either
verifies or disproves the hypothesis. Therefore, a quantitative method seeks to predict behaviors, and to test
existing theory. (Leedy & Ormrod, 2009)
On the contrary, a qualitative study starts with general research questions, rather than a clearly defined
hypothesis. The collected data is often verbal, and the population is relatively small. Furthermore, the
analysis phase searches for common patterns or themes in the collected data. The conclusions drawn from
the data should describe and portray the events leading up to the studied phenomenon. Therefore, the
qualitative method’s purpose is to describe, explain, explore or interpret a phenomenon, coupled with
building theory. (Leedy & Ormrod, 2009)
According to Leedy & Omrod (2009) qualitative studies are often built up by verbal or written data, and
the analysis phase attempts to draw conclusions regarding patterns or themes in the collected data.
Furthermore, the qualitative approach’s purpose is to describe, explain, explore or interpret a phenomenon,
coupled with building theory. Therefore, a qualitative research method was chosen.
2.1.1 Research Approach
The logical line of reasoning when conducting research relies, in general, on three different perspectives
regarding how the relationship between theory and reality are viewed upon, deductive, inductive and
abductive reasoning, showed in Figure 5.

9
Deductive reasoning, described by Blomkvist and Hallin (2015, p. 48), begins with existing theories to
create premises, statements and arguments about a phenomenon which are believed to be true. The premises
are later studied and tested, and either verified or falsified. (Blomkvist & Hallin, 2015) The logical line of
reasoning in the deductive approach relies on the conviction that if all premises are true, the conclusion
must be true (Leedy & Ormrod, 2009).
Inductive reasoning, in contrast, is the empirical observations of events to draw conclusions about entire
classes of objects or events. Thus, inductive reasoning is circumstantial, relying on the studied material and
its context. (Leedy & Ormrod, 2009)
The third option, abductive reasoning resembles an aggregation of inductive and deductive reasoning and
can be illustrated as three consecutive activities, 1) Formulate a preliminary theory from empirical findings
2) Test the preliminary theory on new cases 3) Adjust and develop the preliminary theory. (Patel &
Davidson, 2011)
Research Approach
To create a framework, with sufficient theoretical foundation and practical applicability, an abductive
approach was chosen. The relatively unexplored area of digitalization frameworks and digitalization efforts
based on information flows indicated that a purely theoretical approach (deductive) could compromise the
practical applicability of the study’s result. Whereas the broad scope of the subject in combination with an
inductive approach could harm the theoretical foundation and generalizability of the framework. Thus, the
iterative abductive approach was believed to provide theoretical foundation and practical applicability for
the resulting framework.
2.2 Exploratory Research Design
According to Blomkvist and Hallin (2015), a scientific work and its research design can vary between four
different types, Exploratory, Descriptive, Explanatory and Predictive.
Figure 5 Deduction, induction, abduction and the relationship between theory and reality (Patel & Davidson, 2011)
Reality
Theory Theory
1
Theory Theory
2
Draw
conclusions
from theory for
Formulate a
theory from
individual cases
Formulate a
preliminary
theory from
individual cases
Test the theory
on new cases
Develop and
refine
preliminary
theory
Abduction Induction Deduction

10
Exploratory research design is defined as the act of researching a phenomenon, hitherto relatively
or completely unexplored. The intention is to identify previously unknown dimensions or to
investigate underlying themes or patterns of a problem.
Descriptive research design tries to increase the knowledge of a phenomenon, which is previously
documented but with limited knowledge.
Explanatory research design seeks to study the causal links between something, why a certain
action has a certain consequence.
Predictive research design wants to predict the consequences of an action, which certain action
leads to which certain consequence. (Blomkvist & Hallin, 2015)
The nature of the study was built around an exploratory research design, which sought to explore the
patterns and common characteristics of the phenomenon “successful digitalization efforts”.
2.3 Data Collection Techniques
The collection of primary data involved the data from observations and interviews during the case study.
The interviews were semi-structured and “face to face” regarding the perception of digitalization efforts
within the company, known information flows and the estimated value of this information, both inside and
outside the company’s operational domain.
The observations were performed on the value creating processes in the companies. As to create knowledge
regarding the current state and to map the existing data and information flows in the system.
The collection of secondary data involved the documents studied during the literature review and literature
synthesis, performed before the case studies. The results from the literature synthesis were later used to
create the preliminary framework.
2.3.1 Literature Synthesis
The work procedure for secondary data collection will follow the structure of Backmans (2016, p. 75)
framework describing the steps involved in a literature synthesis, showed in Figure 6.
Figure 6 The literature synthesis process (Backman, 2016)
Question
Problem
Searching
Evaluation and Selection
Analysis
Interpretation
Report

11
According to Backman (2016, p. 75), a literature synthesis has two main strategies, either Combinatorial
or Comparative approach. The combinatorial approach intents to describe, summarize and integrate the
current research. Whereas the Comparative approach seeks to explain differences and/or similarities
between multiple cases.
Based on the research questions and problem, a literature synthesis following Backman’s (2016) framework
consists of these steps. Searching for literature, a strategy should be constructed regarding terms, which
database(s) to use, searching tools and search syntax. Evaluation and selection are based on a predefined
protocol, which filter the findings and evaluates their inherent quality. Analysis methods tends to depend
on the problem of the study; however, problems can occur when different methods yield the same result.
Interpretation attempts to explain why the investigated objects differ from each other or share certain
characteristics. Report and summarize the findings of the literature synthesis. (Backman, 2016)
Lastly, an important element of a literature synthesis, and any research, is source criticism. Generally, three
source criticism criteria, defined by Eriksson & Wiedersheim-Paul (2014), are relevant when performing a
literature review or literature synthesis. These are authenticity-, tendency- and dependency criticism,
essentially used to prevent unreliable results from entering or influencing the study. Authenticity criticism
evaluates the truthfulness of the read literature, to prevent fabricated results from influencing the study.
Tendency criticism evaluates the objectivity of the read literature’s result, to prevent biased results from
entering the study. Lastly, dependency criticism, which evaluates whether the research is independent or
dependent on other sources. (Eriksson & Wiedersheim-Paul, 2014)
Literature review and synthesis procedure
The literature review initialized the report by indicating the prerequisites for successful digital improvement
efforts. Here, articles and reports regarding previous efforts at different companies was studied. The first
phase, called the “Preliminary literature review” had multiple functions, to provide knowledge of the
subject by defining certain terms included in the study, forming the basis for keywords around the subject,
in addition to creating the preliminary framework. The preliminary framework underwent further testing
in an iterative way, by continuous comparison against new literature findings in the literature synthesis.
Following the literature synthesis framework
Approach: The approach used in the literature synthesis was comparative, where the similarities or
differences in multiple cases was studied to find common patterns. These common patterns later acted as
the foundation for the preliminary framework.
Searching: The literature was derived from Linköping University library database, which connects several
databases. The search terms are presented in APPENDIX A.
Evaluation and selection: Following criteria evaluated the found material.
Time relevancy: The material was prioritized by time, where up-to-date research was seen as more
precise. This criterion was used due to the quick development in the technology sector.
Authenticity evaluation of sources: To prevent fabricated results from entering the study, peer-
reviewed articles was prioritized. However, some articles created by known consulting companies
in collaboration with research institutes, and governmental authorities was allowed in the study.
These sources were used carefully.

12
Tendency evaluation of sources: The research methods of the literature and the authors’ objectivity
was evaluated. Here, a close investigation of the material retrieved from consulting companies was
performed to prevent marketing and self-promoting strategies from entering the study. The majority
of the results was analyzed by triangulation, where multiple independent sources pointing in the
same direction was seen as more reliable.
Dependency evaluation of sources: To evaluate the dependency of sources, literature from different
authors, using different perspectives and research methods was prioritized. The credibility of the
conclusions was believed to increase, if these independent sources reached the same conclusions.
Analysis: This phase and onwards had a thematic approach, further explained 2.4 Analysis and Research
Procedure. In brief, the analysis can be summarized into three main steps, described below as:
1. Read the material to get an overview
2. Place into different categories based on content and other aspects
3. Thorough study to assist the interpretation phase
Interpretation: The findings from the analysis phase provided the foundations for the interpretation. Here,
findings were documented and triangulated to evaluate if the differences or similarities were dependent on
certain parameters or circumstantial. With this aggregated view, the explanation for successful digital
improvement efforts was believed to be the result of the “correct methods”.
Report: The resulting conclusions, previously called “correct methods”, created the preliminary framework.
2.3.2 Case Studies
“A case study is a history of a past or current phenomenon, drawn from multiple sources of evidence. It
can include data from direct observation and systematic interviewing as well as from public and private
archives. In fact, any fact relevant to the stream of events describing the phenomenon is a potential datum
in a case study, since context is important” Leonard-Barton (cited in Voss et al., 2002, p.197)
Case studies, as a research method, is according to Voss et al. (2002, p. 198) used for four different research
purposes. These purposes Exploration, Theory building, Theory testing and Theory extension/refinement
are further defined in Table 1.
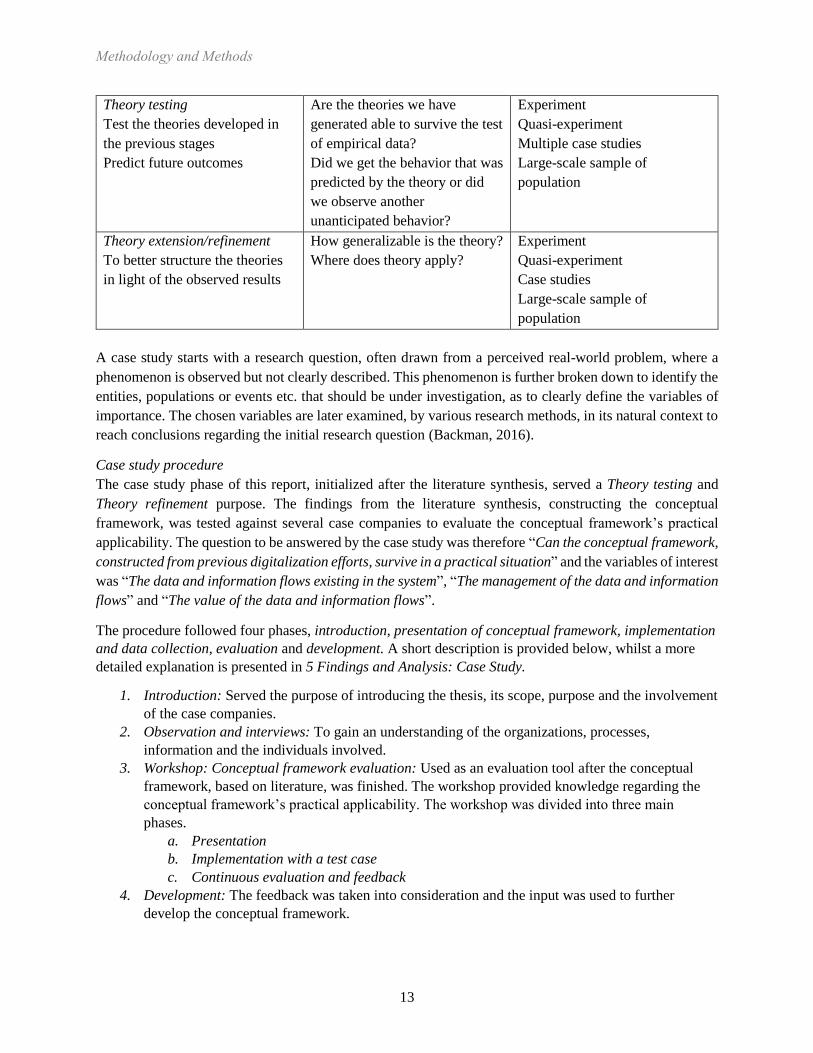
Table 1 The research purposes of case studies (Voss, et al., 2002)
Purpose Research question Research structure
Exploration
Uncover areas for research and
theory development
Is there something interesting
enough to justify research?
In-depth case studies
Unfocused, longitudinal field
study
Theory building
Identify/describe key variables
Identify linkages between
variables
Identify “why” these
relationships exist
What are the key variables?
What are the patterns or
linkages between variables?
Why should these relationships
exist?
Few focused case studies
In-depth field studies
Multi-site case studies
Best-in-class case studies
13
Theory testing
Test the theories developed in
the previous stages
Predict future outcomes
Are the theories we have
generated able to survive the test
of empirical data?
Did we get the behavior that was
predicted by the theory or did
we observe another
unanticipated behavior?
Experiment
Quasi-experiment
Multiple case studies
Large-scale sample of
population
Theory extension/refinement
To better structure the theories
in light of the observed results
How generalizable is the theory?
Where does theory apply?
Experiment
Quasi-experiment
Case studies
Large-scale sample of
population
A case study starts with a research question, often drawn from a perceived real-world problem, where a
phenomenon is observed but not clearly described. This phenomenon is further broken down to identify the
entities, populations or events etc. that should be under investigation, as to clearly define the variables of
importance. The chosen variables are later examined, by various research methods, in its natural context to
reach conclusions regarding the initial research question (Backman, 2016).
Case study procedure
The case study phase of this report, initialized after the literature synthesis, served a Theory testing and
Theory refinement purpose. The findings from the literature synthesis, constructing the conceptual
framework, was tested against several case companies to evaluate the conceptual framework’s practical
applicability. The question to be answered by the case study was therefore “Can the conceptual framework,
constructed from previous digitalization efforts, survive in a practical situation” and the variables of interest
was “The data and information flows existing in the system”, “The management of the data and information
flows” and “The value of the data and information flows”.
The procedure followed four phases, introduction, presentation of conceptual framework, implementation
and data collection, evaluation and development. A short description is provided below, whilst a more
detailed explanation is presented in 5 Findings and Analysis: Case Study.
1. Introduction: Served the purpose of introducing the thesis, its scope, purpose and the involvement
of the case companies.
2. Observation and interviews: To gain an understanding of the organizations, processes,
information and the individuals involved.
3. Workshop: Conceptual framework evaluation: Used as an evaluation tool after the conceptual
framework, based on literature, was finished. The workshop provided knowledge regarding the
conceptual framework’s practical applicability. The workshop was divided into three main
phases.
a. Presentation
b. Implementation with a test case
c. Continuous evaluation and feedback
4. Development: The feedback was taken into consideration and the input was used to further
develop the conceptual framework.
14
2.3.3 Interviews
All interviews are based on a set of questions asked to a respondent. The interview can be performed face-
to-face, direct contact or by a dialogue contact like e-mail, mail, telephone and SMS etc. How the questions
are asked can vary and there are mainly three types of structures when designing an interview:
Structured interviews
Semi-structured interviews
Unstructured interviews (Björklund & Paulsson, 2014)
In a structured interview, all questions are decided before the interview take place, and there are usually no
additional follow-up questions. The equivalent, an unstructured interview is more open and customizable
and can be similar to a conversation where the questions can arise during or after the interview. Semi-
structured interview is mixture of the previously mentioned, the main topic is determined in advance and
the questions can be formulated during the interview along with the respondent’s answer and reactions.
(Björklund & Paulsson, 2014)
Interviews can be performed with one, several persons or in a whole group, the same applies for the
interviewer. The number of questions and the time duration for the interview differs depending on the
purpose. Favorably is to record the interview or take notes to prevent the loss of any important information.
By using interviews as a data-collecting method gives an opportunity for a deeper understanding due to
questions that can be modified depending on the previous answer. During a personal interview signals such
as facial expressions and body language can be detected which in some cases gives more information than
the answer itself. A disadvantage with the method is that it is resource demanding in terms of time
consuming. (Björklund & Paulsson, 2014)
It is important to consider the design of the questions depending on the type of interview. Closed-ended
questions can be answered by either “yes” or “no”, while open-ended questions require a deeper explanatory
answer. (Björklund & Paulsson, 2014)
Interview procedure
This study utilized semi-structured and unstructured interviews to collect primary data. Two interviewers
were present at each session, documenting the interview and cross checking the result, to minimize the
chance of misinterpretation and memory bias. The majority of interviews were held at the case companies
to gain an understanding of the organizations involved and the existing information flows. The interviews
were divided into three parts, each performed on different dates due to time limitations, explained below.
1. Introduction phase: The thesis, its scope, theoretical background and definitions were introduced.
This phase was used to bring a fundamental understanding of the concept, as to prevent
misunderstandings regarding the topic. This part was primarily semi-structured, where the
necessary information and questions where already in place, but follow-up questions relied on the
respondent’s answer.
2. Data collection phase: The preliminary framework was tested on the case companies to assess its
practical applicability. The interviews involved in this phase focused on the organization, its
processes and the information flows between a certain process and the department(s), which utilizes
the information. This phase was semi-structure, where the preliminary framework acted as a guide
for the questions, depicting the required data.

15
3. Conclusion and evaluation phase: The conclusions drawn from the conceptual framework was, in
collaboration with the case companies, evaluated. The conclusion and evaluation phase were
unstructured, assuming the form of a workshop session.
However, some unstructured interviews focused on the framework, where system experts in different areas
and third parties could apply an opinion to the practical applicability of the framework. These sessions were
held sporadically during the whole period of the thesis.
2.3.4 Observations
The method, observation, allows behavior and events to be studied in a wider context. Therefore,
information can be collected without being affected by an individual’s memory image, as to prevent
memory bias. However, it can be difficult to determine whether events during an observation are
representative or if they happen by chance at the time. (Patel & Davidson, 2011)
The observer can be involved in the investigated movement, so called “participant observation”, or by
observing the event from the outside, objectively. Observations can be carried out secretly, without
notifying the participants, or alternatively by informing about the observation. (Björklund & Paulsson,
2014)
Observations procedure
The observations during the study focused on the case study companies’ current way of working, to map
the processes involved in the study. This led to deeper understanding and knowledge of how the companies
operates. Each observation session was accompanied by both authors and at least one system expert. An
interview with the system experts followed the observations to ensure reliable results.
During the company visits, an information- and process map were made for each company, describing the
selected processes. The information- and process map was constructed by a combination of interviews and
observations, where the observations provided the authors with an understanding of the process flow. The
resulting map was later crosschecked with representatives from each company, to ensure accuracy.
2.4 Analysis and Research Procedure
The study, which sought to find patterns regarding successful digital improvement efforts, utilized a
thematic analysis approaches during, and across, different stages further described under research
procedure. The thematic analysis is defined as the act of identifying patterns, or themes, within a qualitative
data set. The whole process of thematic analysis can be summarized into six steps, illustrated in Figure 7.
(Miller, 2016)
Figure 7 Thematic analysis process (Miller, 2016)
1. Thorough investigation
2. Coding or grouping data
3. Categorization of themes
4. Reexamining data
5. Defining themes6. Document and
report

16
1. The initial step, which involves a thorough investigation of the collected data, creates the necessary
foundation for further analysis.
2. After the thorough investigation, the continued work involves the coding, or grouping, of data by
accentuating themes and patterns relative to the research questions.
3. The found themes are grouped together in categories, where each category contains a set of data
with the same themes or patterns. This step visualizes the general themes or patterns related to the
research.
4. Reexamining the data in each category, ensuring that each data point fits in its current category.
5. When the general themes are separated and categorized, the defining of themes acts as the logical
line of reasoning and should explain the connections between the found themes or patterns.
6. Lastly, the document that summarizes the findings and conclusions. (Miller, 2016)
Research procedure
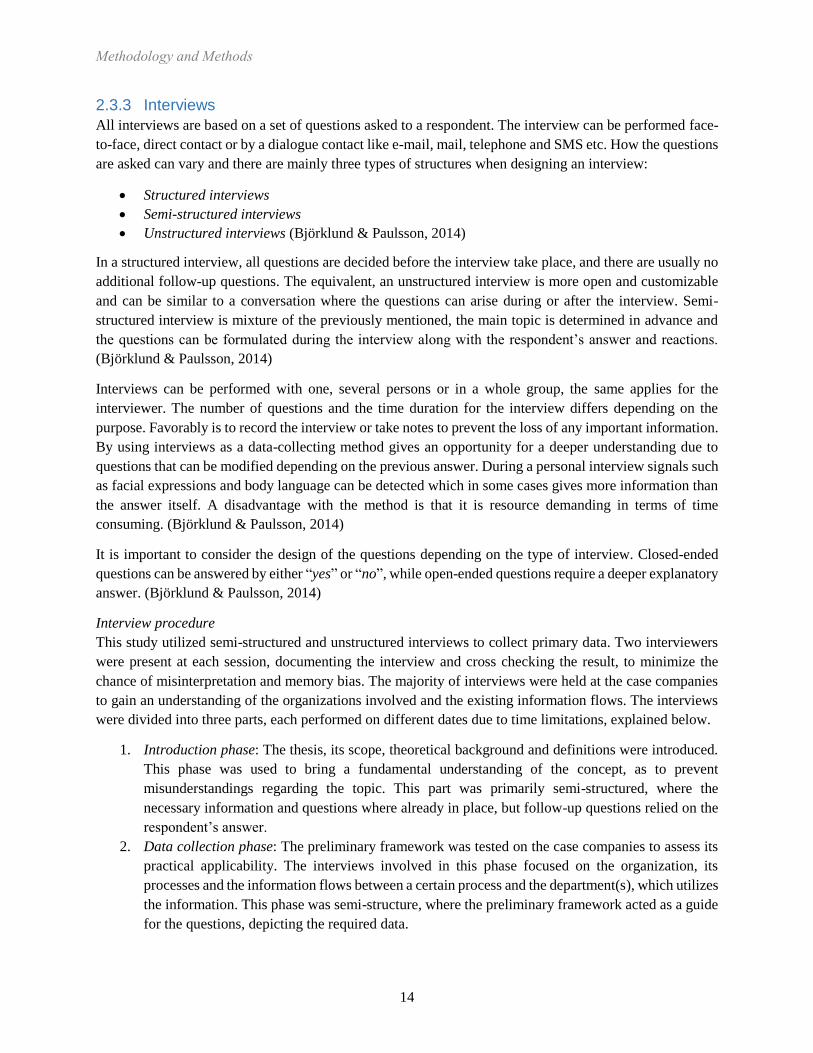
The Framework creation process, illustrated in Figure 8 , is divided into several steps and two domains,
theoretical and empirical. The theoretical domain sought to bring the theoretical foundation, whereas the
empirical domain evaluated the practical applicability of the preliminary framework, resulting in the final
framework. Below follows a short description of each step, the analysis performed in and between steps, as
well as the connections between steps.
1. The study was initialized by a purpose and a research question based on the requirements stated by
Propia AB, found in chapter 1.4 Purpose and Research Question.
2. The preliminary literature review gathered the background information and created the initial
knowledge necessary to perform the study. Here, key concepts related to the research question and
purpose was found and defined, as to enable further and deeper research. This step underwent a
brief analysis, since the understanding around the topic was limited. Thus, the results were treated
with caution.
3. The preliminary literature review resulted, after the brief analysis, in a preliminary framework. This
preliminary framework was constructed from the newly found patterns to act as the foundation for
further research. The preliminary framework is not included in the report, since it was changed
drastically by the literature synthesis. The preliminary framework’s purpose was to serve as a
starting point for research.
4. The literature synthesis, procedure described in 2.3.1 Literature Synthesis, further developed the
preliminary framework. This step underwent a deeper analysis to provide a credible conceptual
framework through several iterations. After each literature synthesis session, the found patterns
were documented and slowly adjusting the preliminary framework. This step sought to answer
Research Question 1 by continuously developing the framework until a sufficient amount of
evidence had been found. This analysis phase of the literature synthesis was divided into two parts.
The first part focused on the common characteristics or elements, which the articles and studies
had in common. Whilst the second part attempted to align the findings with established and proven
theoretical methods and tools.
5. After the literature synthesis, when the findings had been analyzed, the preliminary framework
entered the conceptual framework phase. This phase was believed to be the answer to Research
Question 1. Thus, the study entered the Empirical domain, where the focus shifted to its practical
applicability.

17
6. The case study, performed at two Swedish companies in the forest sector, was used to test the
preliminary framework. This step includes the interviews and observations, described in 2.3.3
Interviews and 2.3.4 Observations, utilized to answer Research Question 2. The case study focused
on bringing value for the case companies, by utilizing the conceptual framework as a tool. By
evaluating the conceptual framework in collaboration with the case companies, the strengths and
weaknesses were identified to assess the practical applicability. This phase was performed in
several iterations.
7. Research question 3 was answered by interviews with the external innovation partner, Cybercom,
and additional supplementary partners in the same sector. When the conceptual framework had
undergone evaluation against the theoretical and empirical findings, it was estimated to be
practically probable.
8. The study’s conclusion resulted in the final framework, now containing theoretical and empirical
evidence, as well as the input from the external innovation partners, considered as system experts.
The box denoted “Collection of secondary data” illustrates where documents and articles were gathered, to
ensure the theoretical foundation of the preliminary framework. Whereas the “Collection of primary data”
involves the empirical data used to develop the framework in a real-world environment, as to increase the
practical applicability of the framework.
18
Figure 8 The framework creation process (Authors’ image)
1. Purpose / Research
Question
2. Preliminary Literature
Review
3. Preliminary
Framework
4. Literature Synthesis
6. Case Study
8. Conclusion and Final
Framework
Collection of
secondary data
Collection of
primary data
RQ1 Theoretical domain
Empirical domain
7. External Innovation
Companies
5. Conceptual
Framework
RQ3
Y
N
RQ2
Y
N
19
2.5 Expected Generalizability
Important to the study, and consequently the framework, is the practical generalizability. Whereas the
framework is developed with assistance of companies in the forest sector, the resulting framework should
show practical applicability without concern to sector, industry or company. Therefore, this chapter was
created in an attempt to discuss its generalizability.
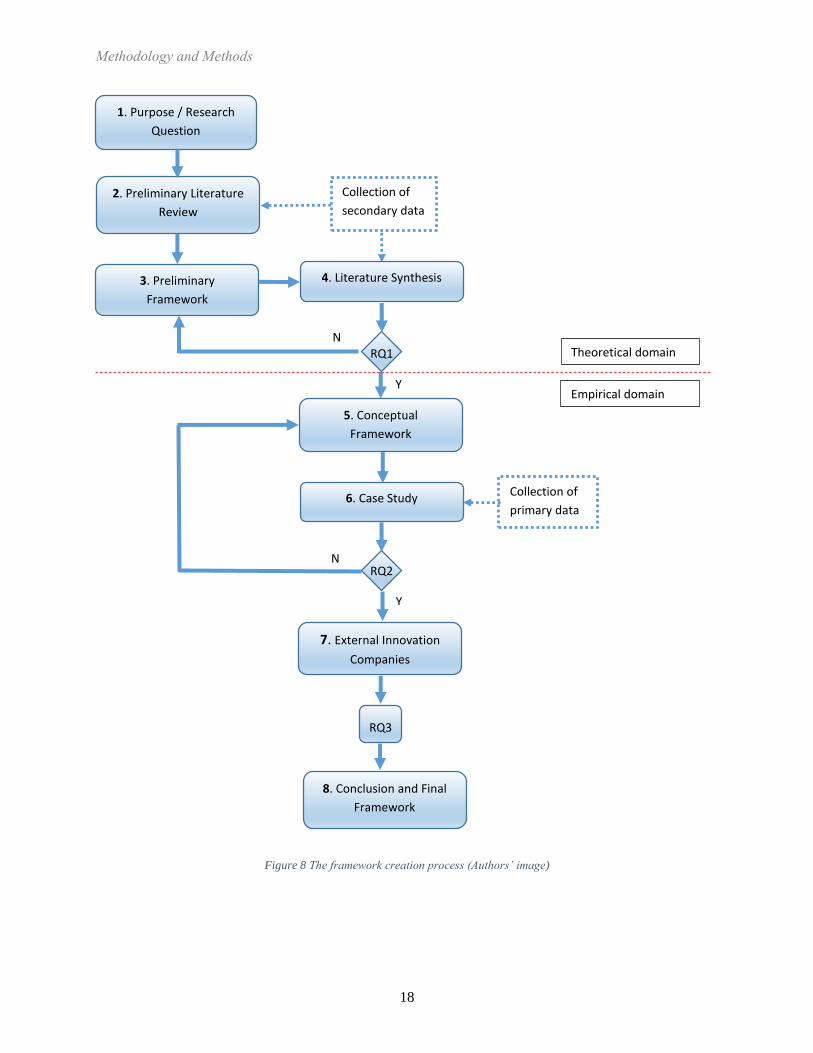
The three main areas building up the report and framework are; Organization- and Process Management,
Improvement Work and Information Management, illustrated in Figure 9. The logical line of reasoning then
follows: Every organization, independent of size, sector or location, handles a set of processes. These
processes either gather, consume, refine or create information and data. The processes and/or the
management of the information and data can be improved, with focus on digital improvement opportunities.
This reasoning concludes that the three areas can involve any organization. Therefore, the study and the
framework should contain a high degree of generalizability.
2.6 Reliability and Validity
“Reliability: The degree of operational reliability of the measuring instruments, i.e. the extent to which you
get the same values if you repeat the investigation.” (Björklund & Paulsson, 2014, p.66)
“Validity: the extent to which you truly measure what you intend to measure, i.e. the absence of
methodological or systematic errors.” (Björklund & Paulsson, 2014, p.66)
Proper documentation of the methods and findings, and standardized ways of working was believed to
increase the reliability of the research. Whilst data triangulation, where multiple independent sources were
used to explain the same phenomenon and a clearly understood purpose during interviews, increased the
validity of the research. (Björklund & Paulsson, 2014)
Below follows the reasoning regarding the reliability and validity, for each data collection stage, in Figure
8. As to visualize how the authors sought to increase the repeatability and minimize methodological errors.
However, there are certain amounts of stages in the study where the authors’ interpretation could influence
the result. Supposedly, the authors’ own interpretation is believed to decrease the reliability and validity of
Figure 9 Representation of the three main areas of the report (Authors' image)
Organization-
and Process Management
Improvement Work
Information Management

20
the study; hence, this chapter attempts to show self-awareness of where the authors’ interpretation could
harm the study.
Preliminary literature review: The preliminary literature review served the purpose of enhancing the
knowledge regarding the study’s research area. Therefore, a brief analysis coupled with the interpretation
of the authors was deemed appropriate. The authors’ interpretation had the same weight as the brief analysis
since a clear definition for certain keywords were not yet established. It could be argued that a deeper
analysis and less interpretation would yield different results, but due to limited topic knowledge, a brief
analysis (heuristic approach) was accepted.
Literature synthesis: The search terms were documented as well as the analysis and findings, showed in
chapter 4 Findings and Analysis: Literature Synthesis. The method and procedure are described earlier in
Figure 6 The literature synthesis process ; this standardized way was used to minimize procedural errors.
This stage involved less interpretation and deeper analysis; however, total neutrality is hard to accomplish.
Data triangulation was used, as part of the thematic analysis, to increase the validity of the research and
found elements. Actions harming the reliability and validity, in the literature synthesis stage, are believed
to be the parallel lines drawn between the literature findings and established tools, tools later incorporated
in the framework. The analysis leading to this, where similarities and reasoning is shown, is described in
4.2 Findings from the Analysis with Respect to Established Theory.
Case study, Interviews: Since interviews and answers from respondents can be influenced by several
factors, a choice was made to minimize the amount of questions that could be altered depending on
emotional or other circumstances. The interviews rather focused on facts, and subjects under investigation
were mapped and embodied collectively, with the respondent, to minimize misunderstandings. However,
some parts of the interviews, such as the introduction phase where the aim was to increase the respondents
understanding around the subject, depended on the respondent’s initial understanding. Although a
standardized introduction session was created, the scenario where the respondent already had a deeper
understanding than the introduction phase provided, would result in an uneven knowledge distribution
amongst the respondents. Nevertheless, this was not believed to harm the study’s results, but could
ultimately harm the reliability, if the respondents whom had deeper knowledge, provided result altering
opinions. Therefore, it should be mentioned, that a study where the practical applicability regarding a
framework is evaluated by individuals, is highly dependent on the individuals’ own knowledge.
Case study, Observations: The observations were used to provide the authors with an understanding of the
organization. The process flow layout did not influence the study and is therefore not included in the
reliability and validity chapter. However, both authors were present at each observation session, and the
results were crosschecked with a system expert to ensure accuracy.
2.7 Objectivity
“Objectivity: The extent to which values affect the study.” (Björklund & Paulsson, 2014, p.66)
By avoiding personal opinions and values from influencing a study, whether it is subjective selection of
material or results gained from an external party, one can increase the objectivity of a study. However, total
objectivity is hard to obtain, but measures such as clear motivations for choices, full presentation of methods
and method criticism allows the reader to reflect upon the results and objectivity of the report. (Björklund
& Paulsson, 2014)

21
In this report, the authors attempt to explain the research process and choices made. However, as previously
mentioned, a certain degree of interpretation is inevitable. Therefore, the stages subject to, or at risk of,
being influenced by subjective values are exposed in the previous chapter.


23
3 FRAME OF REFERENCE
The following chapter describes the relevant theories and methods, which the conceptual framework
consists of. Concepts related to the study are defined to provide a basic understanding of the study’s scope,
whilst appropriate methods and tools are explained to support the conceptual framework.
The chapter Frame of Reference consists of three main areas, Organization and Processes, Improvements
and Information Management, as illustrated in Figure 10. These three areas were considered central for the
purpose of the study, which intends to answer the research questions, and constitutes the theoretical
foundation for the report.
With the research questions in mind, the logical line of reasoning follows, by investigating an organization’s
processes, through the perspective of information management and with theory regarding improvement
work, enabling an organization to identify digital improvement opportunities. These digital improvement
opportunities, ought to develop an organization, leading to a higher degree of digitalization, which is
associated with the concept of Industrie 4.0.
Figure 10 Representation of the study's three main areas, as to visualize the
theoretical position of the study (Authors’ image)
Organization- and Processes
Management
Improvement
Work
Information Management
24
3.1 Organization and Processes
Any set of entities, handling organized activities and striving for a common goal can be considered as an
organization (Child, 2015). These organized activities, either the whole set or parts of the set, if connected
and repeated in time, are processes (Bergman & Klefsjö, 2001).
3.1.1 Vision, Objectives and Strategies in an Organization
One of the most important responsibilities for top management in an organization is to create a common
vision for its future. Furthermore, the vision needs to be broken down into long-term objectives and
complemented with strategies to achieve the objectives. (Bergman & Klefsjö, 2001)
In every organization, it is important to clarify the role that the organization plays/want to play in society
or on the market, i.e. to answer the question “why do we exist?”. The company’s mission statement needs
to answer the question. A company’s mission statement is a brief description of the organization’s
fundamental purpose. It should also describe what the company offers its customers and how they want to
be recognized. By clarifying the organization role, it is possible to find the most important customer
segments. (Bergman & Klefsjö, 2001)
The fundamental concept for companies that strives to achieve improvements in any form requires a stated
vision that clarifies the organizations future purpose. The vision should answer the question: “What do we
want to be” or ‘“where do we want to be, now and in the future”. The vision should contain a picture of
where the organization strives to be in the future, and preferably also when to reach it. The vision statement
is the inspiration and guidance for strategic and operational planning. On the other hand, a vision does not
state how to reach the future state, but rather in which direction to focus. (Bergman & Klefsjö, 2001)
When formulating a vision, organizations should keep in mind that it should be innovative and make the
employees think innovative and wide. Bergman & Klefsjö, (2001) states guidelines for creating a solid
vision, it should include and answer the following areas:
Visualizable
Desirable
Clear
Flexible
Communicable
Stable
According to Bergman & Klefsjö (2001), in order to reach the stated vision, an organization requires long-
and short-term objectives. These objectives need to be aligned with the company’s vision. An objective
should be clearly defined and within a limited timeframe, to be able to evaluate the outcome of. The
foundations of an effective objective can be categories after five main building blocks. This goes under the
acronym called “SMART-objectives” which includes:
Specific: The objective should be clearly defined and specified
Measurable: In order to evaluate the result, the objective should be measurable
Attainable: To be able to reach the objective, everyone involved in reaching the objective needs to
accept it
Relevant: To reach the objective, a sufficient amount of time and resources must be available,
making it reasonable/realistic
25
Time-bound: In order to reach the objective, a time limit is essential as to not allow the work go on
forever (Bergman & Klefsjö, 2001)
Forslund (2013) states several reasons why organizations need to have established objectives. First, without
clarifying objectives, planning and prioritizing work tasks becomes more problematic. Objectives leads to
delimitations and knowledge of where to distribute resources on, to be resource efficient. Further on,
objectives can quantity the company’s effectiveness by measuring the degree of achievement, set by the
objective. The overall motivation and engagement in the organization can also be affected positively.
(Forslund, 2013)
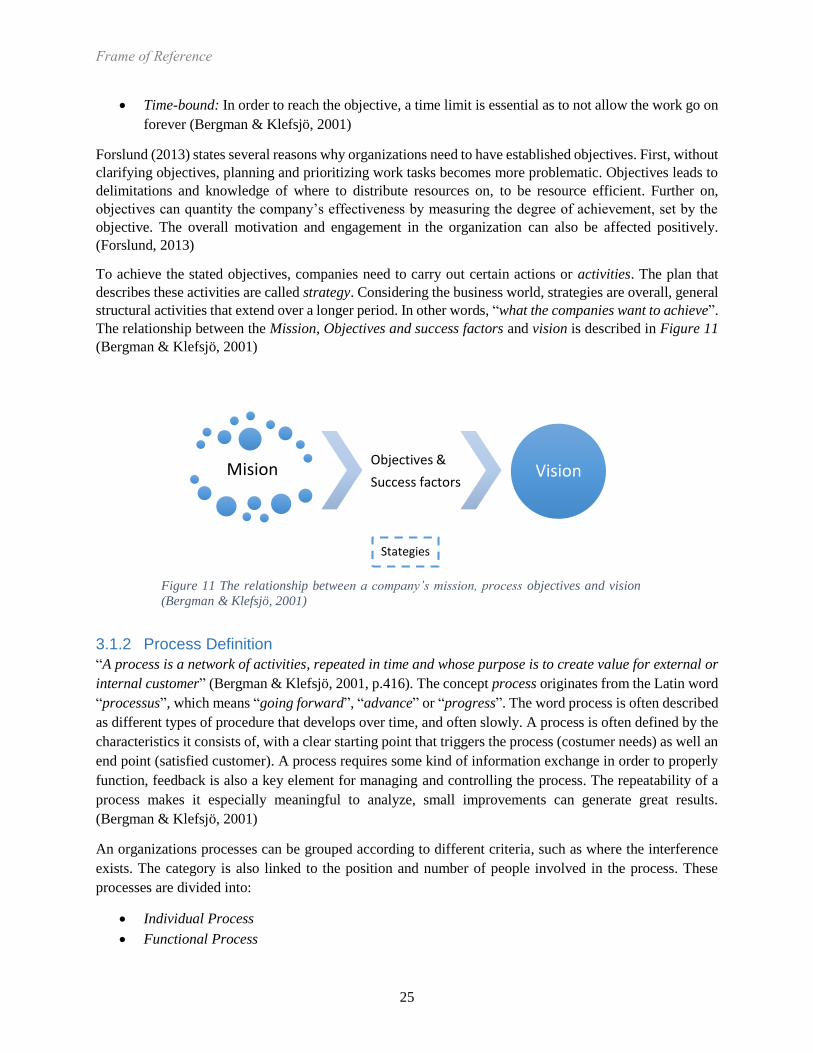
To achieve the stated objectives, companies need to carry out certain actions or activities. The plan that
describes these activities are called strategy. Considering the business world, strategies are overall, general
structural activities that extend over a longer period. In other words, “what the companies want to achieve”.
The relationship between the Mission, Objectives and success factors and vision is described in Figure 11
(Bergman & Klefsjö, 2001)
3.1.2 Process Definition
“A process is a network of activities, repeated in time and whose purpose is to create value for external or
internal customer” (Bergman & Klefsjö, 2001, p.416). The concept process originates from the Latin word
“processus”, which means “going forward”, “advance” or “progress”. The word process is often described
as different types of procedure that develops over time, and often slowly. A process is often defined by the
characteristics it consists of, with a clear starting point that triggers the process (costumer needs) as well an
end point (satisfied customer). A process requires some kind of information exchange in order to properly
function, feedback is also a key element for managing and controlling the process. The repeatability of a
process makes it especially meaningful to analyze, small improvements can generate great results.
(Bergman & Klefsjö, 2001)
An organizations processes can be grouped according to different criteria, such as where the interference
exists. The category is also linked to the position and number of people involved in the process. These
processes are divided into:
Individual Process
Functional Process
Figure 11 The relationship between a company’s mission, process objectives and vision
(Bergman & Klefsjö, 2001)
MisionObjectives &
Success factors
Stategies
Vision

26
Core Process
Individual processes are only connected to one person. Functional processes are linked to a particular
department, function or item. The core process intersects an organization across multiple functions or
departments, which generate value for the company in terms of revenue, illustrated in Figure 12. (Bergman
& Klefsjö, 2001)
An organization can be described as a network of processes, the functional processes utilizes from the core
processes, every process can be broken down to sub processes. Another way of distinguishing processes is
to structure them according to their main task, they can be categorized after:
Core Process
Support Process
Management Process
The core process main purpose is to meet the needs of the external customers by transforming/producing
the product or service, which the company offers. An example of a core process is the research and
development process, with purpose is to create value for the future costumers. The support process role is
to provide the necessary resources to the core process, support processes therefore have internal customers.
Examples of support processes are human resources, maintenance processes and administrative processes.
The last but at least as important is the management process, which is responsible for deciding the
organizations objectives, strategies and improvement work. Management processes has internal customers,
examples of these processes are strategies planning, target palling and audit department. Common to all
processes is that all strive to satisfy their customers, with as little resources as possible, these are illustrated
in Figure 13. In order to be effective, the processes require some kind of resource like, information, energy,
workforce or time. Accurate planning and the right amount of resources is essential for the process to meet
the customer demand. It is also important to identify the suppliers, so the processes know what is required
from them. (Bergman & Klefsjö, 2001)
Figure 12 The core process exists horizontally though the whole organization (Bergman & Klefsjö, 2001)
A D B C
Core Process Supplier Customer
Organization
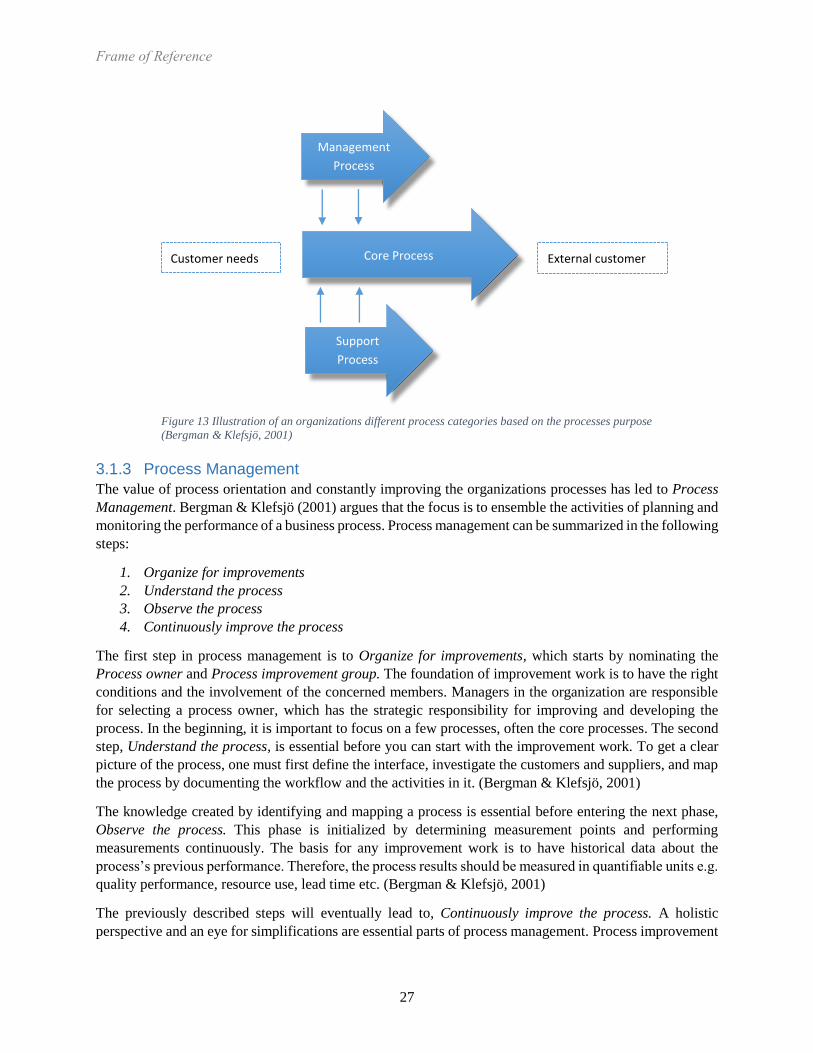
27
3.1.3 Process Management
The value of process orientation and constantly improving the organizations processes has led to Process
Management. Bergman & Klefsjö (2001) argues that the focus is to ensemble the activities of planning and
monitoring the performance of a business process. Process management can be summarized in the following
steps:
1. Organize for improvements
2. Understand the process
3. Observe the process
4. Continuously improve the process
The first step in process management is to Organize for improvements, which starts by nominating the
Process owner and Process improvement group. The foundation of improvement work is to have the right
conditions and the involvement of the concerned members. Managers in the organization are responsible
for selecting a process owner, which has the strategic responsibility for improving and developing the
process. In the beginning, it is important to focus on a few processes, often the core processes. The second
step, Understand the process, is essential before you can start with the improvement work. To get a clear
picture of the process, one must first define the interface, investigate the customers and suppliers, and map
the process by documenting the workflow and the activities in it. (Bergman & Klefsjö, 2001)
The knowledge created by identifying and mapping a process is essential before entering the next phase,
Observe the process. This phase is initialized by determining measurement points and performing
measurements continuously. The basis for any improvement work is to have historical data about the
process’s previous performance. Therefore, the process results should be measured in quantifiable units e.g.
quality performance, resource use, lead time etc. (Bergman & Klefsjö, 2001)
The previously described steps will eventually lead to, Continuously improve the process. A holistic
perspective and an eye for simplifications are essential parts of process management. Process improvement
Core Process
Management
Process
Support
Process
Customer needs External customer
Figure 13 Illustration of an organizations different process categories based on the processes purpose
(Bergman & Klefsjö, 2001)

28
can either be performed in an existing process, through minor adjustments or through radical changes,
which often result in a new process, also called process innovation. (Bergman & Klefsjö, 2001)
3.1.4 Swim Lane Chart
A swim lane flowchart, is a visual tool used in process flow diagram, the main purpose to in a visualize
way get an overview over a specific process and its activities included. By mapping the process through a
swim lane chart, enables an easier identification and appropriate measurement point for the process, it also
clarifies the responsibilities for each sub-process. The method is preferably when a business process
includes more than one department, and to identify delays, mistakes or gaps in communications. (Sörqvist,
2004)
The method can also be used for analyzing an administrative process and clarifies the possible connections
between the different departments that a process concerns. The mapping procedure starts with identifying
the different departments involved in the process, therefore it is possible to divide them into respective
swim lane, preferably vertically. The activities that concern the current department can be placed in either
a row or column. Each activity is further sorted after time, and in the order of occurrence in the flow, as
shown in Figure 14. (Sörqvist, 2004)
Figure 14 An example of a swim lane flowchart (Authors’ image)
3.2 Improvement Work
The term “improvement” is, according to Langley et al. (2009), the result of successful change measured
by one or several parameters, such as time, money, quality etc. Where the change moved the measured
parameter from one stage, to a stage considered better. Furthermore, the authors Langley et al. (2009) states:
“All improvement requires change, but not all change will result in improvement.” (Langley et al. 2009, p.
9)
3.2.1 Six Sigma & DMAIC
Sex Sigma is a methodology for improvement projects, which mainly focuses on cutting cost by reducing
defects product and variation in the manufacturing- and business processes. The method originates from
the electronic enterprise Motorola Inc. and was first introduced in the 1980s. Today, Six Sigma is used

29
primarily by producing companies, for instance in the manufacturing and automotive industry, with the aim
of becoming more cost effective. The framework that Six Sigma is bases on is called DMAIC, and stand
for Define, Measure, Analyze, Improve and Control. The core components of the framework are especially
suited for improvement work in frequently repeated processes. In recent years, a developed method of
DMAIC has also been used in the service sector, the tools is illustrated in Figure 15. (Bergman & Klefsjö,
2001)
The first phase Define consists of defining the scope of the project and processes involved, calculate a
budget which shows if it becomes profitable. The project investment involves resources such as time, funds
and human resources. In order to plan the project, it is crucial to identify the affected processes and to have
an overall overview of the project. The second phase Measure refers of collecting the necessary data
included in the project, the data creates a baseline or starting point for the further analyzing phase. A starting
value is important in order to measure the difference between the current state and the future result, after
the improvement work has been implemented. The Analyze phase involves analyzing data and investigate
the relationship between different factors, to determine root causes of variation and poor performance
(defects). The potential root causes can be identified by root cause analysis tools such as fishbone diagram
or “5 Whys”. Performance objective, sources of variation and value/non-value-added process steps are
identified in analyze phase. The main purpose of the Improve phase is to identify, test and implement the
proposed solution to the problem. In order to eliminate the root causes and prevent process problems an
optimal solution is required, thus, the implementation of the solutions is not vital, it is more important to
identify the potential solutions. Important to keep in mind, usually the simplest and easiest solution is often
the best. The last phase Control includes sustaining the accomplishments from previous steps. To ensure
continued and sustainable achievement, it is crucial to monitor and document the improvements. Useful
tools are control charts, which controls and evaluates the stability of the improvements over time. Control
charts can detect when the process becomes unstable and enables managers to react in time. (Magnusson,
et al., 2003)
3.2.2 Benchmarking
The main purpose of benchmarking is to identify the opportunities for improvement work in an
organization. By accurate comparison between one’s organizations processes and other, identical or similar
processes. Benchmarking can also be performed against other organizations or divisions, usually divided
into internal or external benchmarking. (Bergman & Klefsjö, 2001)
Figure 15 The five steps included in the improvement tool DMAIC (Magnusson, et al., 2003)
DMAIC
Define
Measure
AnalyzeImprove
Control
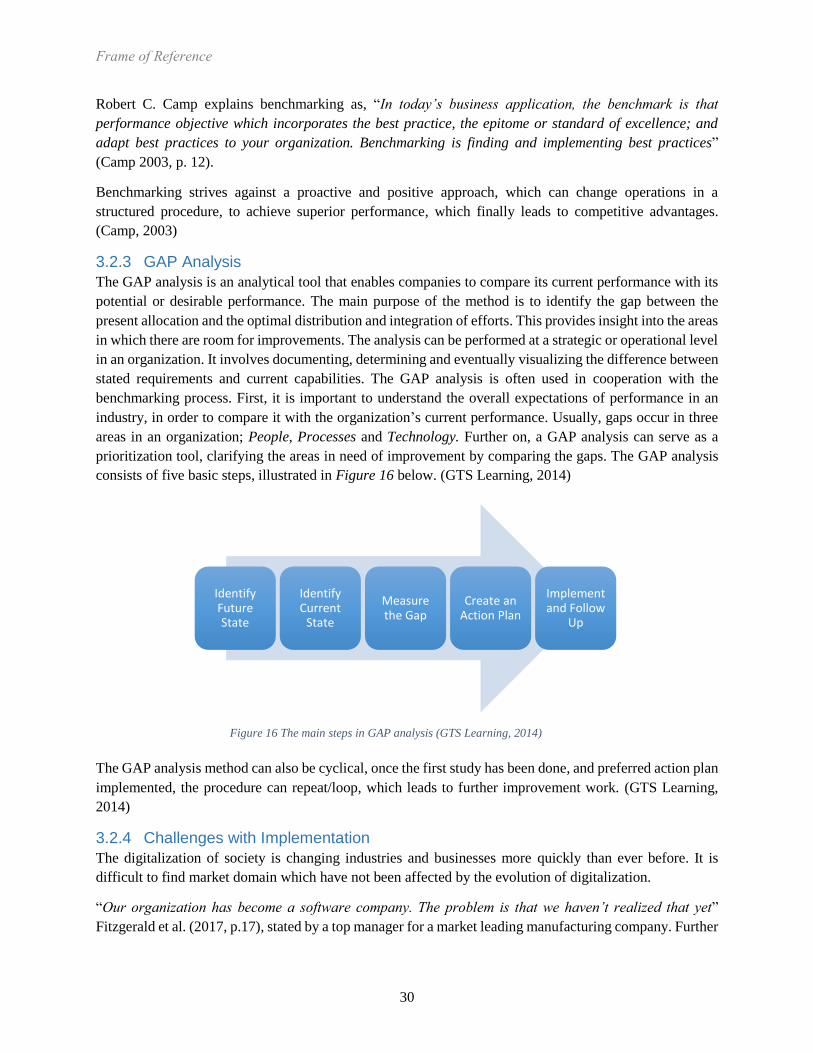
30
Robert C. Camp explains benchmarking as, “In today’s business application, the benchmark is that
performance objective which incorporates the best practice, the epitome or standard of excellence; and
adapt best practices to your organization. Benchmarking is finding and implementing best practices”
(Camp 2003, p. 12).
Benchmarking strives against a proactive and positive approach, which can change operations in a
structured procedure, to achieve superior performance, which finally leads to competitive advantages.
(Camp, 2003)
3.2.3 GAP Analysis
The GAP analysis is an analytical tool that enables companies to compare its current performance with its
potential or desirable performance. The main purpose of the method is to identify the gap between the
present allocation and the optimal distribution and integration of efforts. This provides insight into the areas
in which there are room for improvements. The analysis can be performed at a strategic or operational level
in an organization. It involves documenting, determining and eventually visualizing the difference between
stated requirements and current capabilities. The GAP analysis is often used in cooperation with the
benchmarking process. First, it is important to understand the overall expectations of performance in an
industry, in order to compare it with the organization’s current performance. Usually, gaps occur in three
areas in an organization; People, Processes and Technology. Further on, a GAP analysis can serve as a
prioritization tool, clarifying the areas in need of improvement by comparing the gaps. The GAP analysis
consists of five basic steps, illustrated in Figure 16 below. (GTS Learning, 2014)
The GAP analysis method can also be cyclical, once the first study has been done, and preferred action plan
implemented, the procedure can repeat/loop, which leads to further improvement work. (GTS Learning,
2014)
3.2.4 Challenges with Implementation
The digitalization of society is changing industries and businesses more quickly than ever before. It is
difficult to find market domain which have not been affected by the evolution of digitalization.
“Our organization has become a software company. The problem is that we haven’t realized that yet”
Fitzgerald et al. (2017, p.17), stated by a top manager for a market leading manufacturing company. Further
Figure 16 The main steps in GAP analysis (GTS Learning, 2014)
Identify Future State
Identify Current
State
Measure the Gap
Create an Action Plan
Implement and Follow
Up

31
on, he argues that traditional hardware products are now replaced by software solutions. This creates
challenges in the design and development phase, especially “designing for reuse”. (Fitzgerald, et al., 2017)
According to Kotter and Schlesinger (2013), changes in an organization often manage to fail due to some
circumstances. It is always difficult and uncertain to implement a new system, order or working method
etc. The main challenge is often based on people’s resistance to accept change; therefore, reducing the
resistance for change is a crucial initial step. This is a widely known and researched subject, and any
organization can face these challenges. Kotter and Schlesinger (2013, p.3) identified the four main barriers
of change, followed below:
The ability not to lose something of value
A misunderstanding of the chance and its implications
Thinking that the change does not make sense for the company
An overall low acceptance for change
3.3 Information and Information Management
The authors, Laudon & Laudon (2010) defines data as “Streams of raw facts representing events occurring
in organizations or the physical environment before they have been organized and arranged into a form
that people can understand and use.” (Laudon & Laudon, 2010, p. 629). Stating that data, in its purest form,
does not contribute to the understanding of a phenomenon, behavior or event. However, by analyzing,
sorting and comparing data, the transition to information has begun. Information is therefore defined, by
the same authors, as “Data that have been shaped into a form that is meaningful and useful to human
beings.” (Laudon & Laudon, 2010, p. 632).
Pearlson & Saunders (2009) further describes the concept of knowledge as “Information that is synthesized
and contextualized to provide value. It is information with the most value. (Pearlson & Saunders, 2009,
p.14). Stating that to create value, information must be handled correctly, in the right time, by the
appropriate entity, leading to information systems.
An information system is a set of collaborating entities that gather, process, store and allocates information
to assist decision making in organizations. Thus, three main activities performed by an information system
can be identified, Input, Processing and Output. Where Input gathers data from a specific source,
Processing converts the data into useable and relevant information, and Output allocates the information to
the areas of concern in the organization. This information can assume any form or shape that is of use for
a specific company, depending on the design and function of the information system. (Laudon & Laudon,
2010)
An information system can therefore be seen as “The combination of technology (the “what”), people (the
“who”), and process (the “how”) that an organization uses to produce and manage information. (Pearlson
& Saunders, 2009, p.15)
3.3.1 Information Quality
“The meaning of information quality lies in how the information is perceived and used by its customer.
Although absolute attributes are important, it is the perception of those attributes, now and in the future,
that defines information quality” (Miller, 1996, p.79)
32
Miller (1996) argues, that the quality of information is defined by its customer, whether the information
meets the customer’s requirements. Furthermore, the author states that certain attributes or dimensions are
relevant when considering information quality. However, depending on the customer’s needs, the
prioritization of these dimensions tends to differ. The ten dimensions of information quality follows:
Accuracy: How well the information reflects the reality; however, depending on the purpose,
various levels of accuracy is needed. If the information accuracy exceeds the customer’s processing
capability, it may strain the system and ultimately lead to confusion.
Timeliness: To what degree the information is still current. This dimension depends on the systems
capability of replacing old information, as well as the rate of change in the system’s environment.
Completeness: The level of information completeness depends on the level of detail. However, as
with accuracy, a higher level of detail requires more processing.
Coherence: Whether or not the information is consistent, logically. Incoherent information can be
a combination of Accuracy and Timeliness errors.
Format: How the information is presented, this dimension depends on the customer’s requirements.
Hence, the information context and usage is of relevance.
Accessibility: Put in relation to Timeliness, the Accessibility of information depends on whether it
is obtainable and still relevant when needed.
Compatibility: The degree to which the information is compatible with other information,
information systems or users.
Security: The level of security depends on the information being handled. This dimension involves
the physical aspects, in the event of an accident or disaster, and the cyber-security aspect, such
information system breaches.
Validity: The resultant of a combination of dimensions, here, the customers need is put into
perspective. Meaning that information which lacks certain dimensions can still be valuable and
valid to a customer, if these dimensions are of no importance to the customer. (Miller, 1996)
Although multiple interpretations regarding the dimensions exist, all resembles the dimension
presented by Miller (1996).
3.3.2 Enterprise Architecture
Graves (2009), defines an Enterprise as, “… an organization or cross-functional entity supporting a defined
business scope or mission. It includes interdependent resources – people, organizations and technology-
who must coordinate their functions and share information in support of a common mission or set of related
missions.” (Graves, 2009, p.9)
Furthermore, the term Architecture is explained as, “…the structure of components, their interrelationships,
and the principles and guidelines governing their evolution and design.” (Graves, 2009, p.10)
Today, Enterprise Architecture (EA) has become a key competence for a majority of large organizations
worldwide. The founder of the concept EA, John Zachman first introduced the method in 1987. The main
purpose was to illustrate the relationship between different enterprise layers, in the context of business
processes and information usage, to reduce the complexity while developing Information Systems (IS). EA
enables companies to control and manage enterprise analysis, design, planning and implementation, using
a holistic perspective, in order to successfully reach the mission and execute the strategy. Furthermore, EA
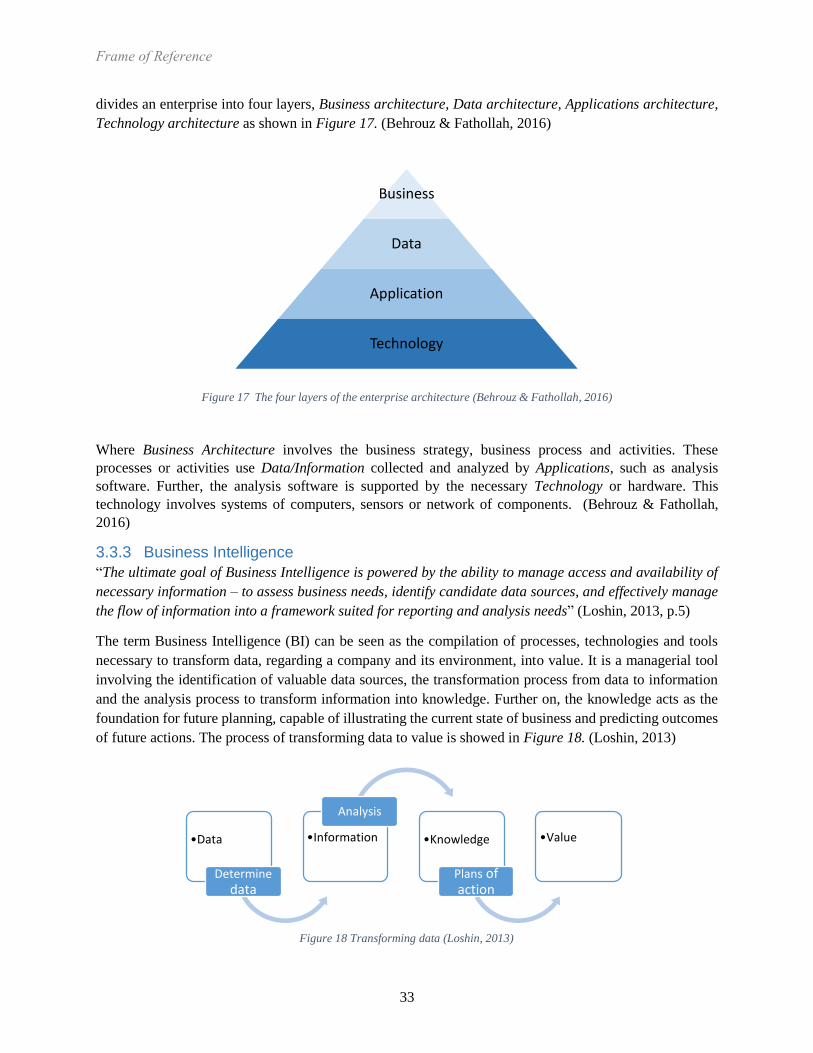
33
divides an enterprise into four layers, Business architecture, Data architecture, Applications architecture,
Technology architecture as shown in Figure 17. (Behrouz & Fathollah, 2016)
Where Business Architecture involves the business strategy, business process and activities. These
processes or activities use Data/Information collected and analyzed by Applications, such as analysis
software. Further, the analysis software is supported by the necessary Technology or hardware. This
technology involves systems of computers, sensors or network of components. (Behrouz & Fathollah,
2016)
3.3.3 Business Intelligence
“The ultimate goal of Business Intelligence is powered by the ability to manage access and availability of
necessary information – to assess business needs, identify candidate data sources, and effectively manage
the flow of information into a framework suited for reporting and analysis needs” (Loshin, 2013, p.5)
The term Business Intelligence (BI) can be seen as the compilation of processes, technologies and tools
necessary to transform data, regarding a company and its environment, into value. It is a managerial tool
involving the identification of valuable data sources, the transformation process from data to information
and the analysis process to transform information into knowledge. Further on, the knowledge acts as the
foundation for future planning, capable of illustrating the current state of business and predicting outcomes
of future actions. The process of transforming data to value is showed in Figure 18. (Loshin, 2013)
Figure 17 The four layers of the enterprise architecture (Behrouz & Fathollah, 2016)
Figure 18 Transforming data (Loshin, 2013)
Business
Data
Application
Technology
•Data
Determinedata
•Information
Analysis
•Knowledge
Plans of action
•Value
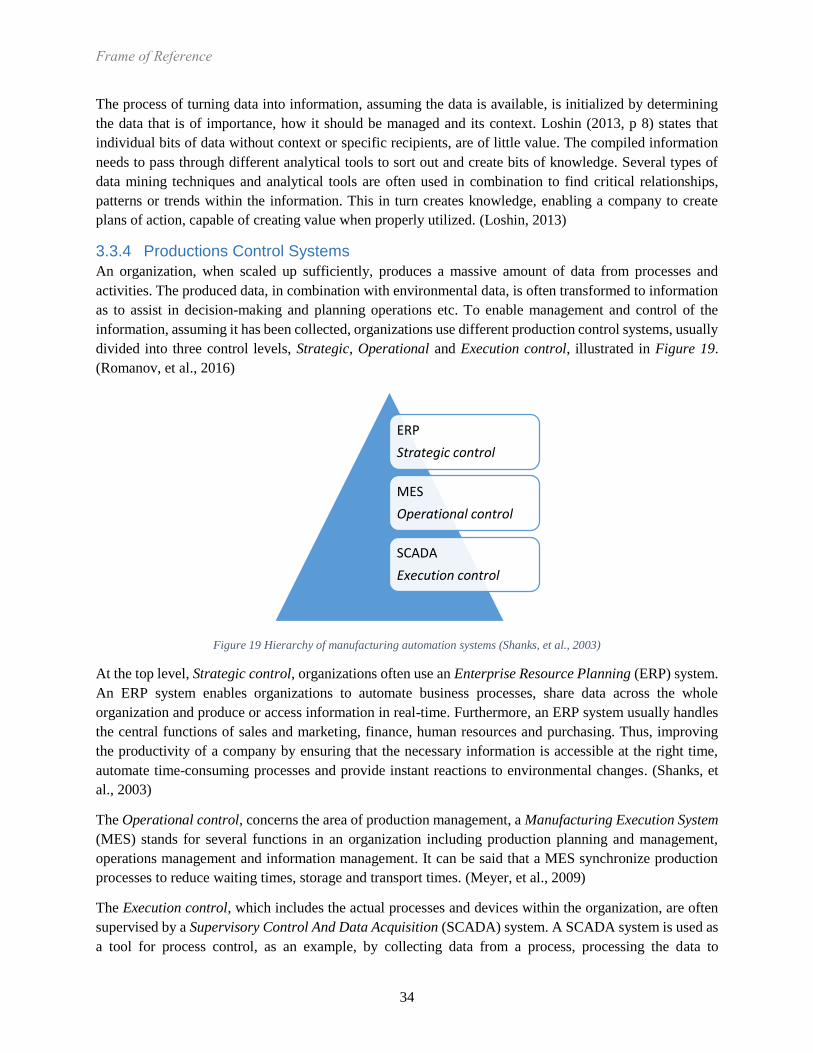
34
The process of turning data into information, assuming the data is available, is initialized by determining
the data that is of importance, how it should be managed and its context. Loshin (2013, p 8) states that
individual bits of data without context or specific recipients, are of little value. The compiled information
needs to pass through different analytical tools to sort out and create bits of knowledge. Several types of
data mining techniques and analytical tools are often used in combination to find critical relationships,
patterns or trends within the information. This in turn creates knowledge, enabling a company to create
plans of action, capable of creating value when properly utilized. (Loshin, 2013)
3.3.4 Productions Control Systems
An organization, when scaled up sufficiently, produces a massive amount of data from processes and
activities. The produced data, in combination with environmental data, is often transformed to information
as to assist in decision-making and planning operations etc. To enable management and control of the
information, assuming it has been collected, organizations use different production control systems, usually
divided into three control levels, Strategic, Operational and Execution control, illustrated in Figure 19.
(Romanov, et al., 2016)
Figure 19 Hierarchy of manufacturing automation systems (Shanks, et al., 2003)
At the top level, Strategic control, organizations often use an Enterprise Resource Planning (ERP) system.
An ERP system enables organizations to automate business processes, share data across the whole
organization and produce or access information in real-time. Furthermore, an ERP system usually handles
the central functions of sales and marketing, finance, human resources and purchasing. Thus, improving
the productivity of a company by ensuring that the necessary information is accessible at the right time,
automate time-consuming processes and provide instant reactions to environmental changes. (Shanks, et
al., 2003)
The Operational control, concerns the area of production management, a Manufacturing Execution System
(MES) stands for several functions in an organization including production planning and management,
operations management and information management. It can be said that a MES synchronize production
processes to reduce waiting times, storage and transport times. (Meyer, et al., 2009)
The Execution control, which includes the actual processes and devices within the organization, are often
supervised by a Supervisory Control And Data Acquisition (SCADA) system. A SCADA system is used as
a tool for process control, as an example, by collecting data from a process, processing the data to
ERP
Strategic control
MES
Operational control
SCADA
Execution control
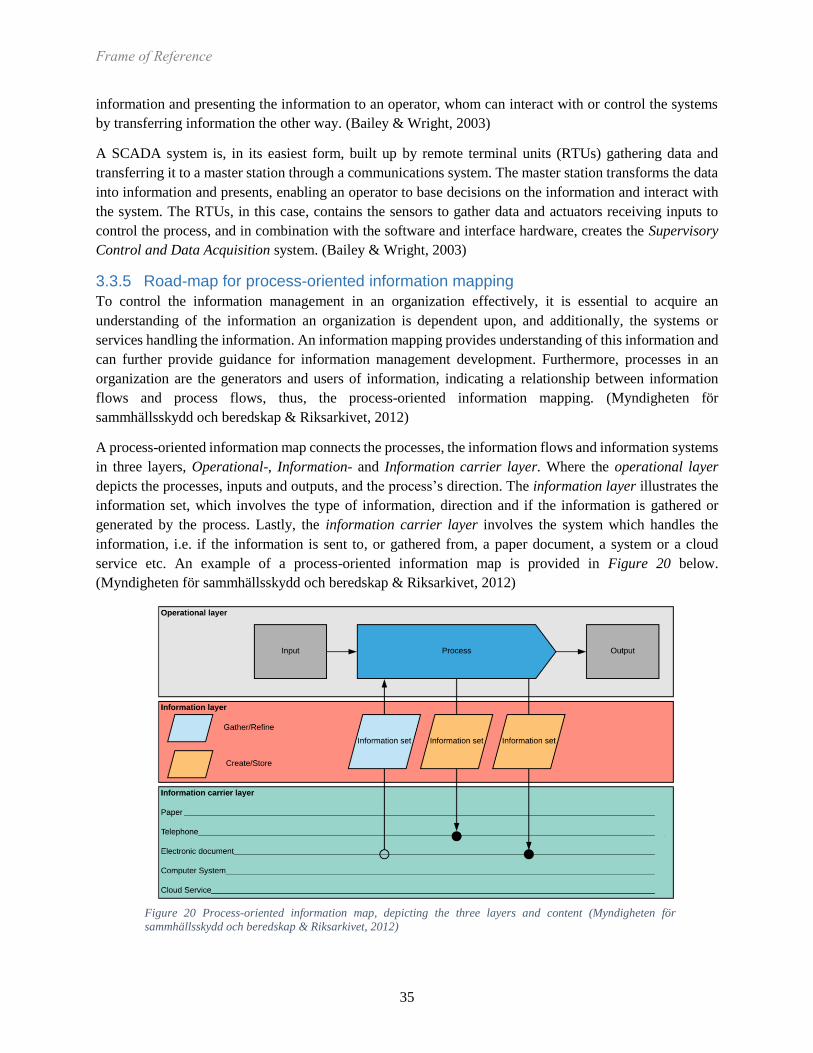
35
information and presenting the information to an operator, whom can interact with or control the systems
by transferring information the other way. (Bailey & Wright, 2003)
A SCADA system is, in its easiest form, built up by remote terminal units (RTUs) gathering data and
transferring it to a master station through a communications system. The master station transforms the data
into information and presents, enabling an operator to base decisions on the information and interact with
the system. The RTUs, in this case, contains the sensors to gather data and actuators receiving inputs to
control the process, and in combination with the software and interface hardware, creates the Supervisory
Control and Data Acquisition system. (Bailey & Wright, 2003)
3.3.5 Road-map for process-oriented information mapping
To control the information management in an organization effectively, it is essential to acquire an
understanding of the information an organization is dependent upon, and additionally, the systems or
services handling the information. An information mapping provides understanding of this information and
can further provide guidance for information management development. Furthermore, processes in an
organization are the generators and users of information, indicating a relationship between information
flows and process flows, thus, the process-oriented information mapping. (Myndigheten för
sammhällsskydd och beredskap & Riksarkivet, 2012)
A process-oriented information map connects the processes, the information flows and information systems
in three layers, Operational-, Information- and Information carrier layer. Where the operational layer
depicts the processes, inputs and outputs, and the process’s direction. The information layer illustrates the
information set, which involves the type of information, direction and if the information is gathered or
generated by the process. Lastly, the information carrier layer involves the system which handles the
information, i.e. if the information is sent to, or gathered from, a paper document, a system or a cloud
service etc. An example of a process-oriented information map is provided in Figure 20 below.
(Myndigheten för sammhällsskydd och beredskap & Riksarkivet, 2012)
Figure 20 Process-oriented information map, depicting the three layers and content (Myndigheten för
sammhällsskydd och beredskap & Riksarkivet, 2012)
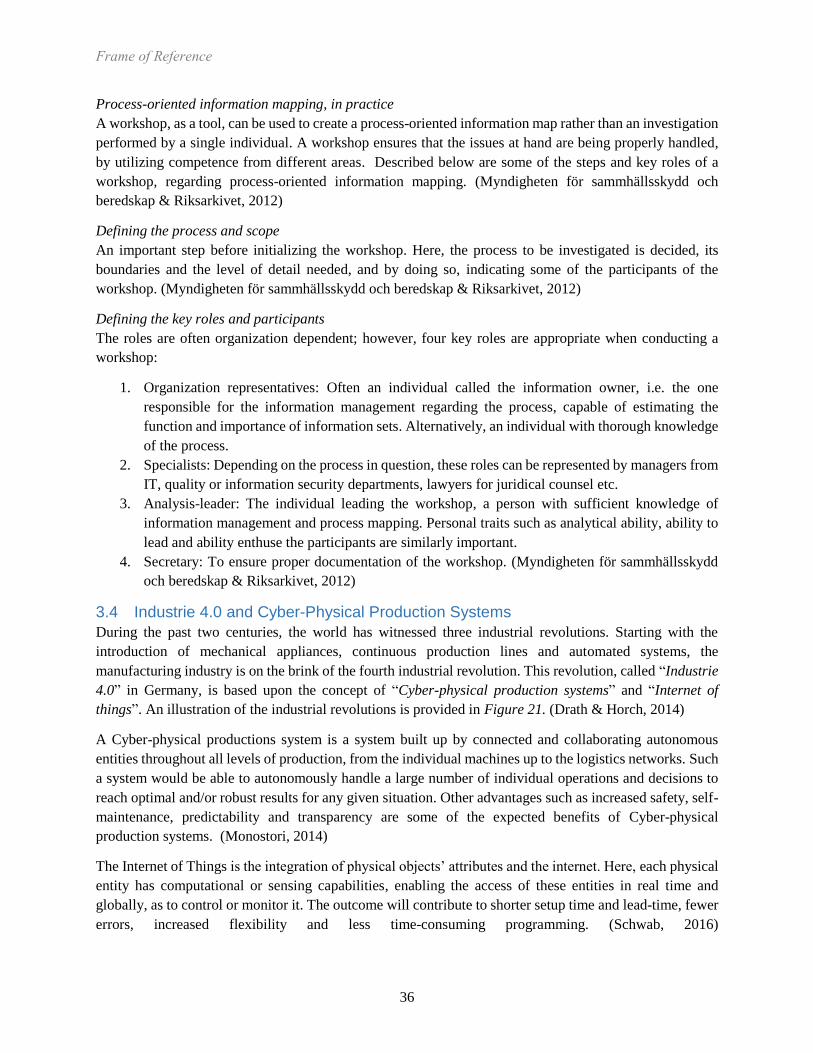
36
Process-oriented information mapping, in practice
A workshop, as a tool, can be used to create a process-oriented information map rather than an investigation
performed by a single individual. A workshop ensures that the issues at hand are being properly handled,
by utilizing competence from different areas. Described below are some of the steps and key roles of a
workshop, regarding process-oriented information mapping. (Myndigheten för sammhällsskydd och
beredskap & Riksarkivet, 2012)
Defining the process and scope
An important step before initializing the workshop. Here, the process to be investigated is decided, its
boundaries and the level of detail needed, and by doing so, indicating some of the participants of the
workshop. (Myndigheten för sammhällsskydd och beredskap & Riksarkivet, 2012)
Defining the key roles and participants
The roles are often organization dependent; however, four key roles are appropriate when conducting a
workshop:
1. Organization representatives: Often an individual called the information owner, i.e. the one
responsible for the information management regarding the process, capable of estimating the
function and importance of information sets. Alternatively, an individual with thorough knowledge
of the process.
2. Specialists: Depending on the process in question, these roles can be represented by managers from
IT, quality or information security departments, lawyers for juridical counsel etc.
3. Analysis-leader: The individual leading the workshop, a person with sufficient knowledge of
information management and process mapping. Personal traits such as analytical ability, ability to
lead and ability enthuse the participants are similarly important.
4. Secretary: To ensure proper documentation of the workshop. (Myndigheten för sammhällsskydd
och beredskap & Riksarkivet, 2012)
3.4 Industrie 4.0 and Cyber-Physical Production Systems
During the past two centuries, the world has witnessed three industrial revolutions. Starting with the
introduction of mechanical appliances, continuous production lines and automated systems, the
manufacturing industry is on the brink of the fourth industrial revolution. This revolution, called “Industrie
4.0” in Germany, is based upon the concept of “Cyber-physical production systems” and “Internet of
things”. An illustration of the industrial revolutions is provided in Figure 21. (Drath & Horch, 2014)
A Cyber-physical productions system is a system built up by connected and collaborating autonomous
entities throughout all levels of production, from the individual machines up to the logistics networks. Such
a system would be able to autonomously handle a large number of individual operations and decisions to
reach optimal and/or robust results for any given situation. Other advantages such as increased safety, self-
maintenance, predictability and transparency are some of the expected benefits of Cyber-physical
production systems. (Monostori, 2014)
The Internet of Things is the integration of physical objects’ attributes and the internet. Here, each physical
entity has computational or sensing capabilities, enabling the access of these entities in real time and
globally, as to control or monitor it. The outcome will contribute to shorter setup time and lead-time, fewer
errors, increased flexibility and less time-consuming programming. (Schwab, 2016)

37
3.4.1 Drivers
Professor Klaus Schwab, founder and executive chairman of the World Economic Forum, has complied the
most important drivers for the fourth industrial revolution. As mentioned earlier the new technologies and
scientific innovations underpins the development of the revolution. Klaus states that all new developments
and technologies have one key thing in common: they are driven by the power of digitalization and
information technology. The main technological drivers can be categorized after three megatrends:
Physical
Digital
Biological
All three drivers are deeply connected with each other, directly affecting the outcome. Physical
technological are easier to identify due to their tangible nature; autonomous vehicles, 3D printers, advance
robotic and innovative materials. The main connection between the physical and digital technologies is the
so-called Internet of Things (IoT). IoT can be describe as a relationship between products, services,
locations, systems, platforms and peoples etc. through sensors and other technical devices connecting
objects in the physical world to virtual platforms. The continuous technological development has led to
cheaper, smaller and smarter sensors which can be found in products, infrastructures, energy systems and
manufacturing processes etc. All these products such as smartphones, computers, tablets and sensors can
be connected to a system/cloud. The number of devices connected are increasing for every year; researchers
believe that the next five will result in more than a trillion connected devices. (Schwab, 2016)
The digital revolution contributes to new approaches, revolutionizing the way entities collaborate and
interact with each other. Remote monitoring applications has increased significant recently due to the
development of the IoT. Pallets, package or container can be equipped with a sensor, transmitter, GPS or
radio frequency identification (RFID) tags. This allows companies to track the products through the supply
chain and gather valuable information such as conditions, performance and customer usages. (Schwab,
2016)
“On-demand economy” based on technology-allowed platforms is also an example of the digital
development. These platforms can easily be reached from any device connected, such as smartphones,
tablets or a computer, creating new ways of consuming goods and services. Uber Technologies Inc., which
is a global taxi enterprise, has been a pioneer in the sharing economy and developed their business model
Cyber Physical
System
1st 2nd 3rd 4th
Mechanization,
water power,
stream power
Mass production,
assembly line,
electricity
Computer and
automation
Industrial Revolutions
Figure 21 The Industrial Revolutions (Authors’ image)

38
based on these technology platforms. These platform businesses are rapidly introduced on new markets and
services worldwide. (Schwab, 2016)
Finally, the last technological driver is the innovations and breakthroughs in the biological area. With
computer aid, scientists can simulate and verify the outcome of substances instead of physical tests
involving medical trials. Thus, shortening the lead-time and eliminating obstacles related to the
development of medical substances. (Schwab, 2016)
3.4.2 The Impact of Industrie 4.0
The authors Rüßmann, et al. (2015) found, when analyzing the prospect of the German manufacturing
industry, four main areas that might benefit from future technological advancements. These areas,
Productivity, Revenue growth, Employment and Investment, and the potential impact was quantified, where:
Productivity: Productivity as the ratio between output and input will during the next five to ten
years increase in the range of 15 to 25 percent, excluding the material costs. When accounting for
the material costs, gains between 5 to 8 percent are expected for most of the German industries.
Revenue growth: By utilizing new technologies and enhanced equipment, the German industries
are believed to become more flexible, able to satisfy the increasing demand of customizable
products. The effect of these actions will increase the revenue by approximately €30 billion a year,
which corresponds to 1 percent of Germany’s GDP.
Employment: The technology and automation will affect laborers working with monotonous tasks.
However, the overall employment will increase with approximately 6 percent. This is a
consequence of the increased need for, mechanical engineers, software developers and other high
technology competencies.
Investment: To successfully adapt the industries to the new circumstances and remain competitive
in the future, investments are required in the range of €250 billion for the manufacturing sector,
over a period of ten years. (Rüßmann, et al., 2015)
3.5 Literature Synthesis
This chapter provides a summary of a sample of literature used in the literature synthesis to develop the
conceptual framework. The common elements are further described and analyzed in chapter 4 Findings and
Analysis: Literature Synthesis.
3.5.1 Leading Change – Why Transformation Effort Fail
“Guiding change may be the ultimate test of a leader – no business survives over the long term if they can’t
reinvent itself.” (Kotter, 2007, p. 4)
John P. Kotter states that changes in an organization are often met with resistance from the people it effects.
Further on, John P. Kotter has investigated more than 100 companies over the past decade, including large
and small corporations such as Ford, General Motors, Landmark Communications and British Airways etc.
These companies have faced many different challenges over the years, which requires a high sense of
adaptability in order to meet new changes. John P. Kotter states, in nearly all cases; “the basic goal has
been the same: to make fundamental changes in how a business is conducted in order to help cope with a
new, more challenging market environment.” (Kotter, 2007, p.4). Through the studies, the author has
compiled eight main steps of significant importance, when companies are undergoing any type of change
or transformation. These steps are visualized in Figure 22, important to keep in mind is the order of the
procedure. (Kotter, 2007)
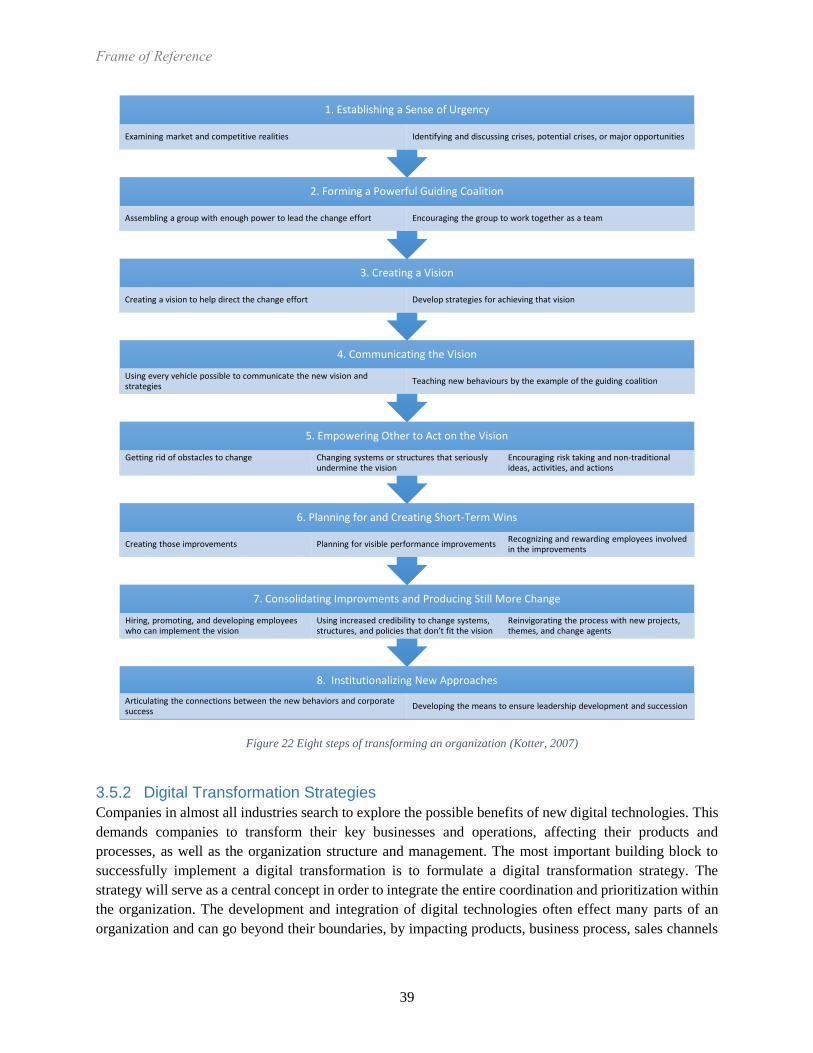
39
3.5.2 Digital Transformation Strategies
Companies in almost all industries search to explore the possible benefits of new digital technologies. This
demands companies to transform their key businesses and operations, affecting their products and
processes, as well as the organization structure and management. The most important building block to
successfully implement a digital transformation is to formulate a digital transformation strategy. The
strategy will serve as a central concept in order to integrate the entire coordination and prioritization within
the organization. The development and integration of digital technologies often effect many parts of an
organization and can go beyond their boundaries, by impacting products, business process, sales channels
Figure 22 Eight steps of transforming an organization (Kotter, 2007)
8. Institutionalizing New Approaches
Articulating the connections between the new behaviors and corporate success
Developing the means to ensure leadership development and succession
7. Consolidating Improvments and Producing Still More Change
Hiring, promoting, and developing employees who can implement the vision
Using increased credibility to change systems, structures, and policies that don’t fit the vision
Reinvigorating the process with new projects, themes, and change agents
6. Planning for and Creating Short-Term Wins
Creating those improvements Planning for visible performance improvementsRecognizing and rewarding employees involved in the improvements
5. Empowering Other to Act on the Vision
Getting rid of obstacles to change Changing systems or structures that seriously undermine the vision
Encouraging risk taking and non-traditional ideas, activities, and actions
4. Communicating the Vision
Using every vehicle possible to communicate the new vision and strategies
Teaching new behaviours by the example of the guiding coalition
3. Creating a Vision
Creating a vision to help direct the change effort Develop strategies for achieving that vision
2. Forming a Powerful Guiding Coalition
Assembling a group with enough power to lead the change effort Encouraging the group to work together as a team
1. Establishing a Sense of Urgency
Examining market and competitive realities Identifying and discussing crises, potential crises, or major opportunities
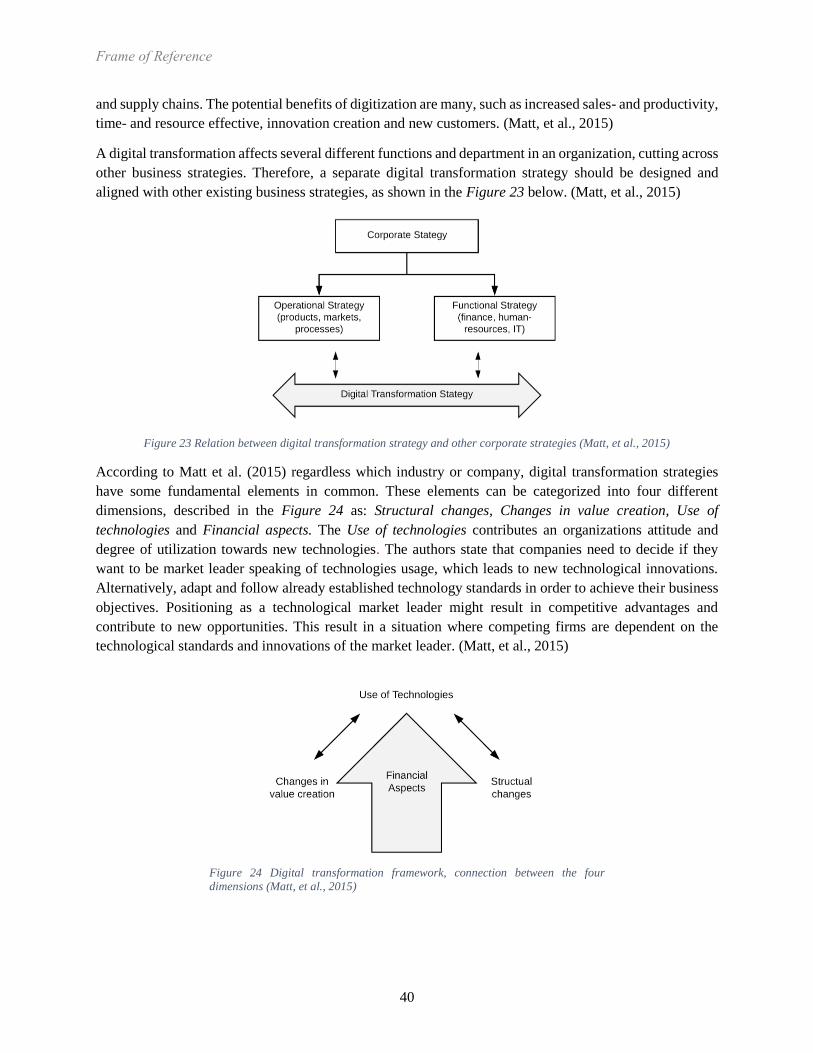
40
and supply chains. The potential benefits of digitization are many, such as increased sales- and productivity,
time- and resource effective, innovation creation and new customers. (Matt, et al., 2015)
A digital transformation affects several different functions and department in an organization, cutting across
other business strategies. Therefore, a separate digital transformation strategy should be designed and
aligned with other existing business strategies, as shown in the Figure 23 below. (Matt, et al., 2015)
Figure 23 Relation between digital transformation strategy and other corporate strategies (Matt, et al., 2015)
According to Matt et al. (2015) regardless which industry or company, digital transformation strategies
have some fundamental elements in common. These elements can be categorized into four different
dimensions, described in the Figure 24 as: Structural changes, Changes in value creation, Use of
technologies and Financial aspects. The Use of technologies contributes an organizations attitude and
degree of utilization towards new technologies. The authors state that companies need to decide if they
want to be market leader speaking of technologies usage, which leads to new technological innovations.
Alternatively, adapt and follow already established technology standards in order to achieve their business
objectives. Positioning as a technological market leader might result in competitive advantages and
contribute to new opportunities. This result in a situation where competing firms are dependent on the
technological standards and innovations of the market leader. (Matt, et al., 2015)
Figure 24 Digital transformation framework, connection between the four
dimensions (Matt, et al., 2015)
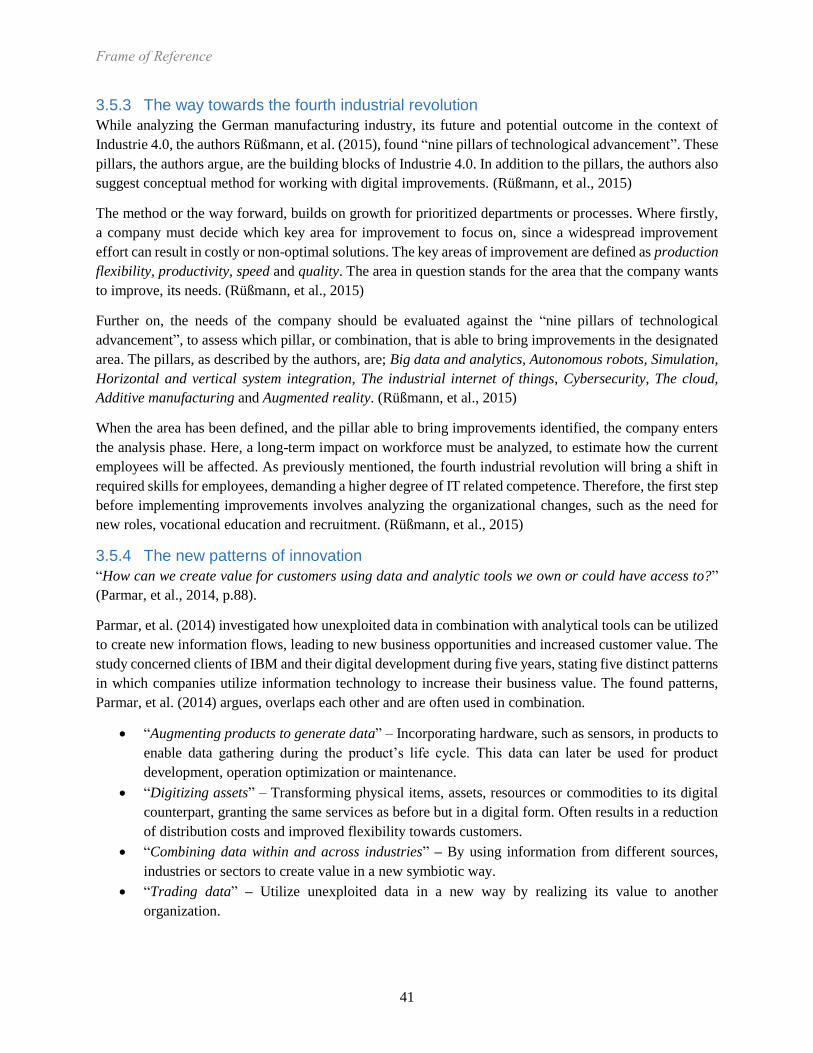
41
3.5.3 The way towards the fourth industrial revolution
While analyzing the German manufacturing industry, its future and potential outcome in the context of
Industrie 4.0, the authors Rüßmann, et al. (2015), found “nine pillars of technological advancement”. These
pillars, the authors argue, are the building blocks of Industrie 4.0. In addition to the pillars, the authors also
suggest conceptual method for working with digital improvements. (Rüßmann, et al., 2015)
The method or the way forward, builds on growth for prioritized departments or processes. Where firstly,
a company must decide which key area for improvement to focus on, since a widespread improvement
effort can result in costly or non-optimal solutions. The key areas of improvement are defined as production
flexibility, productivity, speed and quality. The area in question stands for the area that the company wants
to improve, its needs. (Rüßmann, et al., 2015)
Further on, the needs of the company should be evaluated against the “nine pillars of technological
advancement”, to assess which pillar, or combination, that is able to bring improvements in the designated
area. The pillars, as described by the authors, are; Big data and analytics, Autonomous robots, Simulation,
Horizontal and vertical system integration, The industrial internet of things, Cybersecurity, The cloud,
Additive manufacturing and Augmented reality. (Rüßmann, et al., 2015)
When the area has been defined, and the pillar able to bring improvements identified, the company enters
the analysis phase. Here, a long-term impact on workforce must be analyzed, to estimate how the current
employees will be affected. As previously mentioned, the fourth industrial revolution will bring a shift in
required skills for employees, demanding a higher degree of IT related competence. Therefore, the first step
before implementing improvements involves analyzing the organizational changes, such as the need for
new roles, vocational education and recruitment. (Rüßmann, et al., 2015)
3.5.4 The new patterns of innovation
“How can we create value for customers using data and analytic tools we own or could have access to?”
(Parmar, et al., 2014, p.88).
Parmar, et al. (2014) investigated how unexploited data in combination with analytical tools can be utilized
to create new information flows, leading to new business opportunities and increased customer value. The
study concerned clients of IBM and their digital development during five years, stating five distinct patterns
in which companies utilize information technology to increase their business value. The found patterns,
Parmar, et al. (2014) argues, overlaps each other and are often used in combination.
“Augmenting products to generate data” – Incorporating hardware, such as sensors, in products to
enable data gathering during the product’s life cycle. This data can later be used for product
development, operation optimization or maintenance.
“Digitizing assets” – Transforming physical items, assets, resources or commodities to its digital
counterpart, granting the same services as before but in a digital form. Often results in a reduction
of distribution costs and improved flexibility towards customers.
“Combining data within and across industries” – By using information from different sources,
industries or sectors to create value in a new symbiotic way.
“Trading data” – Utilize unexploited data in a new way by realizing its value to another
organization.

42
“Codifying a distinctive service capability”- Create software and platforms initially intended for
internal usage and sell it to external parties. This is enabled with the help of cloud computing,
allowing easy distribution of software. (Parmar, et al., 2014)
The method
When working with clients to uncover new business opportunities, the authors follow a process divided
into six steps, described below:
Step 1. Knowledge
The initial step is to create knowledge around the five patterns, often with concrete examples, to visualize
how previous attempts resulted in increased business value for a company. This fundamental step creates a
deeper understanding of the subject, as well as allowing the client to engage in out-of-the box thinking.
(Parmar, et al., 2014)
Step 2. Investigation
To evaluate the current situation in the company, regarding their data and potential opportunities, five
questions needs to be answered. These questions are designed to position the company, assess the resources
at hand and the current needs of the client, regarding data and information. The questions, as described by
Parmar, et al. (2014, p.94) are shown below:
“What data do we have?”
“What data can we access that we are not capturing? “
“What data could we create form our products or operations?”
“What helpful data could we get from others?”
“What data do others have that we could use in a joint initiative?” (Parmar, et al., 2014)
Step 3. Cycle the patterns
When the current situation has been mapped, the answers gathered from the previous step are cycled
through the five patterns in a new set of questions. This step explores the possible solution areas and
opportunities existing in the company. The patterns and related questions, as depicted by Parmar, et al.
(2014, p94) are shown below:
Augmenting products
“Which of the data relate to our products and their use?”
“Which do we now keep, and which could we start keeping?”
“What insights could be developed from the data?”
“How could those insights provide new value to us, our customers, our suppliers, our competitors,
or players in another industry?”
Digitizing assets
“Which of our assets are either wholly or essentially digital?”
“How can we use their digital nature to improve or augment their value?”
“Do we have physical assets that could be turned into digital assets?”
Combining data
“How might our data be combined with data held by others to create value?”
43
“Could we act as the catalyst for value creation by integrating data held by other players?”
“Who would benefit from this integration and what business model would make it attractive to us
and our collaborators?”
Trading data
“How could our data be structure and analyzed to yield higher-value information?”
“Is there value in this data to us internally, to our current customers, to potential new customers,
or to another industry?”
Codifying a capability
“Do we possess a distinctive capability that others would value?”
“Is there a way to standardize this capability so that it could be broadly useful?”
“Can we deliver this capability as a digital service?”
“Who in our industry or other industries would find this attractive?”
“How could the gathering, management, and analysis of our data help us develop a capability that
we would codify?” (Parmar, et al., 2014)
Step 4. Summarize and prioritize
The answers and ideas from the second set of questions are summarized to create an aggregated overview
of the findings. Here, a prioritization between the various ideas is necessary since the analysis process is
resource consuming. The prioritization should lead to a few rational choices. (Parmar, et al., 2014)
Step 5. Analysis
Subgroups are created and tasked with a deeper analysis of the chosen ideas. Here, a scenario is developed
to analyze how an idea could play out. The objectives in this step are to evaluate how an idea can create
business value for the company and identification of the key assumptions or conditions that needs to be in
place, for the realization of the scenario. This extensive analysis, executed by the subgroup, is performed
over a few weeks to ensure that all parameters important for the scenario is identified. (Parmar, et al., 2014)
Step 6. Conclusion
The resulting conclusions from the subgroup(s) are presented, and if deemed relevant, the ideas are
implemented into the company. (Parmar, et al., 2014)
Success factors
In addition to these steps, the authors also identified four success factors, or prerequisites, present in the
companies who successfully utilized data to increase business value. These factors were accompanied by
the initial prerequisites, such as cross-functional teams, sufficient resources and support from the top
management. (Parmar, et al., 2014)
Strong technology presence: The project should involve individuals with the right skills as well
as sufficient authority. Preferably, an individual with overall IT responsibility.
Inputs from external parties: External perspectives and skills are often beneficial for innovation
projects. This allows a faster way to obtain the necessary capabilities.
Motivated leadership: A strong leader is necessary to overcome obstacles such as cultural or
behavioral barriers.
44
Emotional commitment: The involved individuals’ emotional commitment was observed to be
a success factor, creating a mutual mission. Thus, motivating the individuals. (Parmar, et al.,
2014)
3.5.5 Tackling the digitalization challenge: How to benefit from digitalization in practice
Parviainen, et al. (2017) found a research gap in the area of digitalization and digital transformations.
Although literature describes technological innovations and solutions, their implementation or realization
methods were not clearly defined. Thus, the authors sought to create a framework capable of describing
how a company can tackle a digital transformation. The framework is built up by case studies regarding
digitalization to find a pattern, distinguishing a successful digitalization effort. Four main steps were
identified, positioning the company, analyzing the current state, creation of a roadmap and implementing
the roadmap, these are further described below. (Parviainen, et al., 2017)
Step 1. Positioning the company
Consists of four sub-steps, digitalization impacts, digitalization drivers, digitalization scenarios and
digitalization goals:
Digitalization impacts: Analyzing current or upcoming technological trends and their relevance for
the company creates the foundation for positioning the company. This phase identifies the existing
trends and evaluates how far the company, and the whole industry, is in adopting these trends.
Digitalization drivers: Investigating the results from the previous phase to isolate the digitalization
drivers. These drivers are later prioritized.
Digitalization scenarios: Different scenarios regarding the company’s future are developed, based
on the drivers, which were deemed most important. Here, the potential costs, benefits and risks
involved with implementing or not implementing scenarios are analyzed.
Digitalization goals: By analyzing the different scenarios and their feasibility, digitalization goals
are created. These goals should be properly defined and quantified, to enable evaluation of future
improvements. (Parviainen, et al., 2017)
Step 2. Analyzing the current state
Assessing the current situation for the company, with respect to the defined goals. Several methods and
tools are applicable in this step, but the result should again be quantifiable, as to enable the next step in the
process. (Parviainen, et al., 2017)
Step 3. Creation of a roadmap
This step, divided into four sub-steps, creates the detailed action plan for reaching the defined goals. The
sub-steps are:
Identifying the gap: The initial step is to identify the gap between the current state and the
designated goal(s). This enables the company to see its current position with respect to the desired
position, which leads to the identification of shortcomings or improvement opportunities/areas.
Planning the actions: The identified improvement opportunities indicates the actions necessary to
close the gap. Here, actions such as investing in new IT tools to optimize processes, or redefining
processes through digital opportunities, are developed.
Analyzing feasibility and prioritization: After the actions, leading towards the goal(s), are
identified, a feasibility study should be performed. The study can involve cost-benefit analysis,

45
impact analysis on existing practices, risk analysis etc. Parameters such as education of staff,
maintenance and the company’s ability to change can be included. The feasibility study should
result in a prioritization between the actions, if more exists, with respect to stakeholders, resources
or other parameters relevant to the company.
Creating the roadmap: After the prioritization, the arrangement of actions into a roadmap is
enabled. Describing in which order the actions should be executed, the importance and impact for
each action, and the individuals’ responsibilities and roles for each action. (Parviainen, et al., 2017)
Step 4. Implementing the roadmap
The final step, which involves the actual implementation of the solution, as well as the validation. It is often
useful, the authors mention, to firstly implement a proof-of-concept to evaluate how the change affects the
organization on a smaller scale. The validation phase should investigate whether the actions resulted in the
desired outcome, and corrective measures should be considered if not. Furthermore, the researchers mention
a few obstacles for a successful digital transformation such as lack of a digitalization strategy, different
competing priorities and inability to perform change. (Parviainen, et al., 2017)
3.5.6 Digital transformation: A roadmap for billion-dollar organizations
When examining the behavior of digitalization efforts in 50 companies, with $1 billion or more in sales,
the authors Westerman, et al. (2011) could identify three main areas, customer experience, operational
processes and business model, where digitalization efforts were focused. These three main areas are further
divided into three elements respectively, to create nine elements, leading to the digital transformation of a
company, as showed in Figure 25. The authors further state the importance of knowledge regarding
digitalization and a company’s digital capabilities, which is an essential enabler for all areas of digital
transformations. (Westerman, et al., 2011)
Figure 25 The building blocks of digital transformation (Westerman, et al., 2011)
Unified data and processes Business & IT integrationDigital Capabilities
Analytics capability Solution delivery
Transforming customer experience
•Customer understanding
•Top line growth
•Customer touch points
Transforming operational process
•Process digitization
•Worker enablement
•Performance management
Transforming business model
•Digitally-modified business
•New digital business
•Digital globalization

46
1. Transforming customer experience
a. Customer understanding: Organizations are utilizing and analyzing available data in new ways
to gain more knowledge about the customers, knowledge that can lead to action plans regarding
marketing for specific market segments etc. Other companies are using social media as a tool
for evaluating customer satisfaction, customer behavior and self-promotion.
b. Top line growth: The streamlining of sales processes creates an environment where the
customers are more satisfied therefore more likely to purchase and return. This can be achieved
by digitizing sales operations, substituting personal contact with virtual contact and storing
purchase data to show frequently bought items.
c. Customer touch points: Organizations explore new ways of reaching out and communicating
with their customers for faster and more transparent service. Recent changes involve self-
service via digital tools, transforming information and media from paper to electronic sources,
social media address problems in a quick and transparent way, and smart phone applications.
2. Transforming operational processes
a. Process digitization: Automation of processes and repetitive tasks enables a company to free
resources, focus resources on strategic tasks and increase the overall productivity. The
automation of processes can also create valuable data streams, enhancing process control by
allowing real time measurements and adjustments of activities.
b. Worker enablement: Connecting functions digitally separates the work process from a physical
location, collects and archives data and enables an easy way to share information. Employees
can communicate with individuals over vast distances and sent information can be stored,
shared or adjusted instantly to inform important parties.
c. Performance management: Internal data streams gathered from digitally transformed processes
aids decision making by providing accurate real time information, whilst external data grants
guidance for executives and managers when dealing with strategic decisions. However, an
appropriate analysis method must be applied to ensure the integrity of the gathered data.
3. Transforming business models
a. Digitally modified businesses: Digitally transforming or modifying sales channels, such as
online shops, in combination with the existing physical sales channels, enables a company to
serve more customers with less effort. In addition, the digital sales channels can utilize
customer information for marketing purposes, presenting the right information to the right
customers.
b. New digital businesses: Expanding a company’s product offerings where traditional
products are complemented with optional digital products can benefit the customer. Optional
or supplemental digital products, such as GPS trackers for sportswear, leads to new business
opportunities. Other actors focus on transforming the customer’s end-to-end experience, by
offering an integrated platform on which the relevant information is gathered. Thus, facilitating
the customer experience and co-creating value.
c. Digital globalization: A company can, with the use of digital technology and integrated
information systems, collaborate with distant internal or external facilities globally. Different
departments can be strategically located instead of scattered around manufacturing plants, still
accessing and providing the same information as if in close proximity. As an example, sharing
local information regarding market fluctuations enables a manufacturer to shift production to
facilities closer to the demand. (Westerman, et al., 2011)
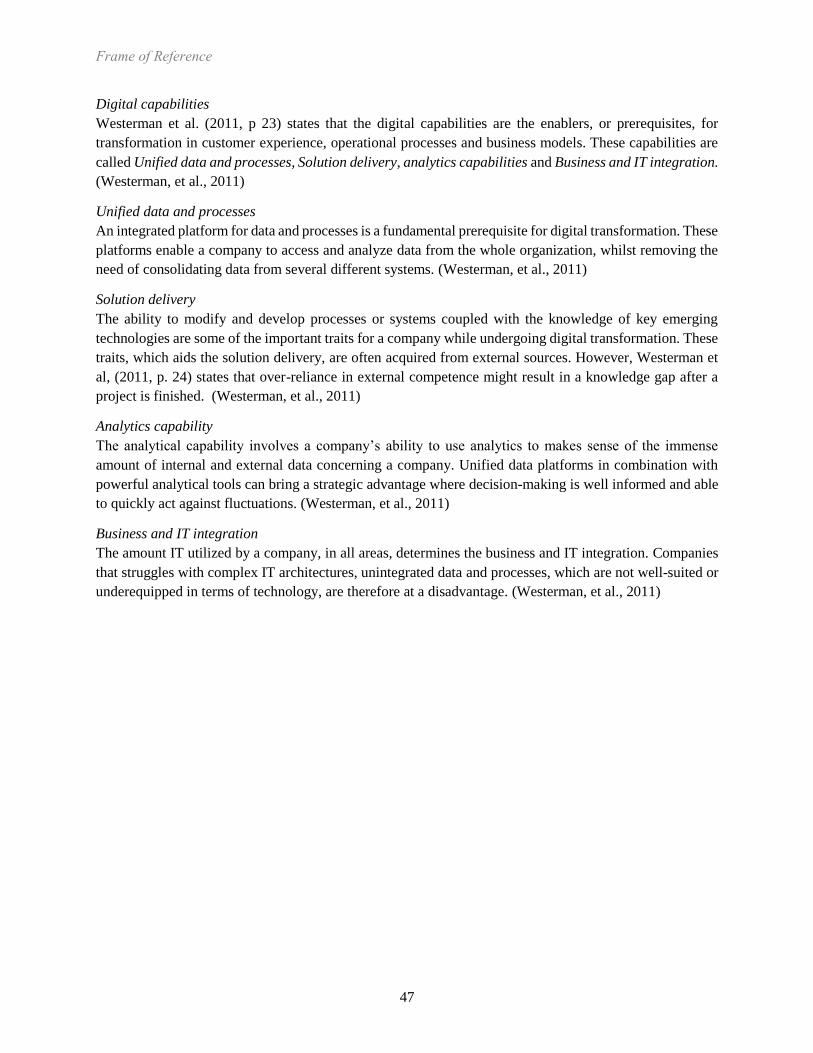
47
Digital capabilities
Westerman et al. (2011, p 23) states that the digital capabilities are the enablers, or prerequisites, for
transformation in customer experience, operational processes and business models. These capabilities are
called Unified data and processes, Solution delivery, analytics capabilities and Business and IT integration.
(Westerman, et al., 2011)
Unified data and processes
An integrated platform for data and processes is a fundamental prerequisite for digital transformation. These
platforms enable a company to access and analyze data from the whole organization, whilst removing the
need of consolidating data from several different systems. (Westerman, et al., 2011)
Solution delivery
The ability to modify and develop processes or systems coupled with the knowledge of key emerging
technologies are some of the important traits for a company while undergoing digital transformation. These
traits, which aids the solution delivery, are often acquired from external sources. However, Westerman et
al, (2011, p. 24) states that over-reliance in external competence might result in a knowledge gap after a
project is finished. (Westerman, et al., 2011)
Analytics capability
The analytical capability involves a company’s ability to use analytics to makes sense of the immense
amount of internal and external data concerning a company. Unified data platforms in combination with
powerful analytical tools can bring a strategic advantage where decision-making is well informed and able
to quickly act against fluctuations. (Westerman, et al., 2011)
Business and IT integration
The amount IT utilized by a company, in all areas, determines the business and IT integration. Companies
that struggles with complex IT architectures, unintegrated data and processes, which are not well-suited or
underequipped in terms of technology, are therefore at a disadvantage. (Westerman, et al., 2011)

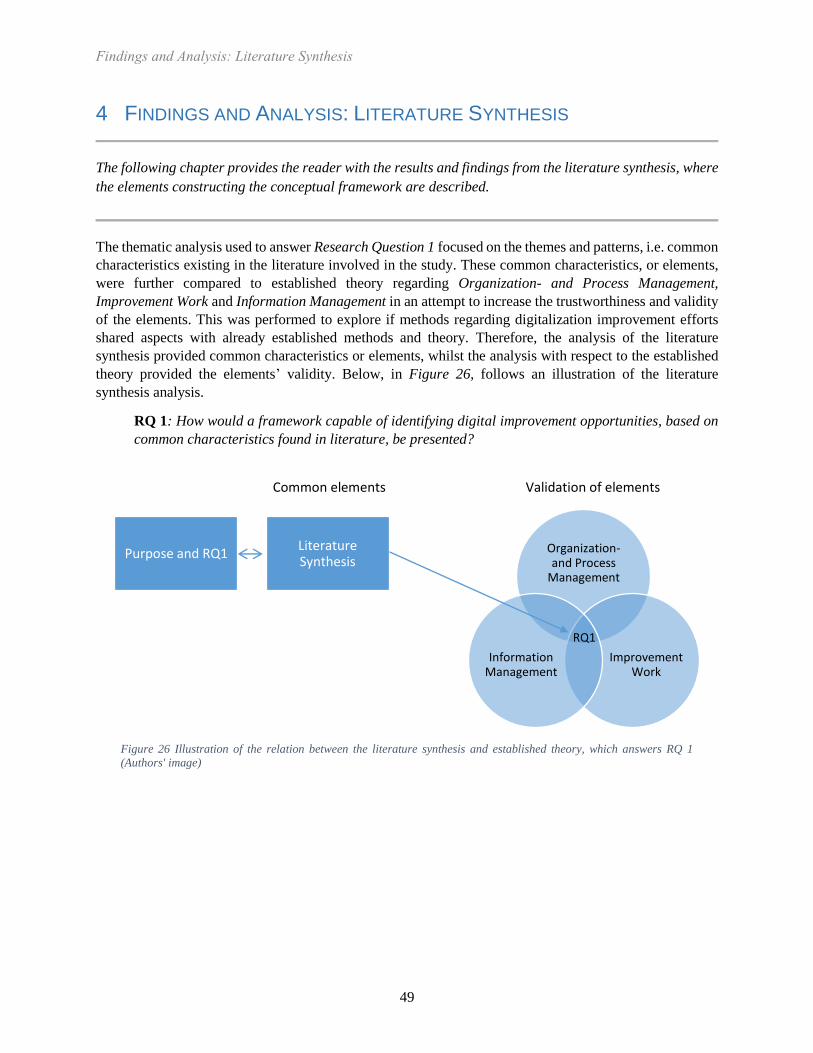
49
4 FINDINGS AND ANALYSIS: LITERATURE SYNTHESIS
The following chapter provides the reader with the results and findings from the literature synthesis, where
the elements constructing the conceptual framework are described.
The thematic analysis used to answer Research Question 1 focused on the themes and patterns, i.e. common
characteristics existing in the literature involved in the study. These common characteristics, or elements,
were further compared to established theory regarding Organization- and Process Management,
Improvement Work and Information Management in an attempt to increase the trustworthiness and validity
of the elements. This was performed to explore if methods regarding digitalization improvement efforts
shared aspects with already established methods and theory. Therefore, the analysis of the literature
synthesis provided common characteristics or elements, whilst the analysis with respect to the established
theory provided the elements’ validity. Below, in Figure 26, follows an illustration of the literature
synthesis analysis.
RQ 1: How would a framework capable of identifying digital improvement opportunities, based on
common characteristics found in literature, be presented?
Figure 26 Illustration of the relation between the literature synthesis and established theory, which answers RQ 1
(Authors' image)
Common elements Validation of elements
Organization-and Process
Management
Improvement Work
Information Management
RQ1
Purpose and RQ1Literature Synthesis

50
4.1 Findings from the Literature Synthesis Analysis
Below follows a brief presentation of the common elements, or elements of importance, found in the
literature regarding the area of digitalization. However, interviews with two IT-consulting companies aided
in developing the conceptual framework, the expertise of these parties were used in both the conceptual
framework and the final framework. These elements, shown below, are composed of the common
characteristics deemed relevant for identifying digital improvement opportunities.
4.1.1 Prerequisites When Working with Digitalization
Create an understanding regarding the subject
The initial step ensuring that all parties has the same understanding regarding digitalization, digitalization
efforts and the solutions currently in existence. Thus, creating a sense of urgency and relevance for the
client in the context of improvement efforts. (Parmar, et al., 2014) (Westerman, et al., 2011) (Kotter, 2007)
(Bossen & Ingemansson, 2016) (Kagermann, et al., 2013) (Cybercom Sweden AB, 2018) (Supplementary
IT Consultant, 2018)
Position the company and identify drivers
Positioning the company with respect to other companies in the same sector, as well as identifying the
technological drivers for the sector. This step shares connection with the previous step, since the
environment of the client’s company, the position and the solutions currently in existence will affect the
future path. (Parviainen, et al., 2017) (Westerman, et al., 2011) (Matt, et al., 2015) (Myndigheten för
sammhällsskydd och beredskap & Riksarkivet, 2012)
Management’s capability of leading change
Since improvements cannot exist without change, the capability of leading change and adapting to new
concepts and innovations is of significance. This prerequisite is fundamental for the whole improvement
efforts. Workshops could be utilized as a tool to increase the capability of leading change. (Kotter, 2007)
(Parmar, et al., 2014) (Parviainen, et al., 2017) (Bergman & Klefsjö, 2001)
Create and communicate common objectives, strategies and a vision
To ensure that individuals involved are working towards the same objective and with the same action plan.
Creates solidarity and increases commitment for the individuals affected by the change, to minimize
conservative resistance. These objectives are on an organization wide basis. (Matt, et al., 2015) (Kotter,
2007) (Kagermann, et al., 2013) (Heberle, et al., 2017)
Involve external parties if necessary skills are missing
The technological skills or resources needed for a project can be found externally. (Parmar, et al., 2014)
(Parviainen, et al., 2017) (Cybercom Sweden AB, 2018) (Supplementary IT Consultant, 2018)
4.1.2 Methods when Working with Digitalization
Define key areas, based on needs, drivers and position
The key areas where improvements efforts are to be focused involves concepts such as production
flexibility, productivity, speed and quality. This area should be based on the client’s needs, the position with
respect to competitors and the market drivers. Furthermore, this step acts as an initial delimiter, as to narrow
down the focus of the project. Concrete and quantifiable objective(s) are created to act as target values.
(Rüßmann, et al., 2015) (Parviainen, et al., 2017) (Westerman, et al., 2011) (De Carolis, et al., 2017)

51
Identify the processes involved and create “as is” model
Identifying the key area and the process or processes influencing the area further narrows down the number
of possible objects under investigation. The process in question and the relevant data should be mapped in
an “as is” model to depict the current state. This current state serves as a reference point for future
improvements, generates a common understanding of the process for all parties, and visualizes the system
and its complexities. (Rüßmann, et al., 2015) (Parmar, et al., 2014) (Parviainen, et al., 2017) (Myndigheten
för sammhällsskydd och beredskap & Riksarkivet, 2012) (De Carolis, et al., 2017) (Heberle, et al., 2017)
Create “to be”, evaluate to as is and against the elements of digital transformation
Create a desired state, which shares connections with the overall objectives of the improvement effort,
based on the “as is” model. This step can incorporate the elements/patterns/pillars of digital transformation
to explore different solution opportunities. The “to be” state must correspond to the concrete and
quantifiable objectives/ target values previously stated. A GAP analysis assists in positioning the currents
state to the preferred state, as to illustrate the distance. (Rüßmann, et al., 2015) (Parmar, et al., 2014)
(Parviainen, et al., 2017) (De Carolis, et al., 2017)
Create and prioritize ideas based on feasibility and rationality
The desired state and the solution opportunities will enable the creation of improvement ideas. These ideas
should enable the desired state and are also briefly prioritized by feasibility and rationality, i.e. are the ideas
possible to implement and are they rational. Parameters of importance are time, resources and capabilities.
(Parmar, et al., 2014) (De Carolis, et al., 2017) (Supplementary IT Consultant, 2018)
Analyze ideas for impact and identify important parameters
Here, an assessment of the organizational impact of the ideas, such as employee relocation, vocational
training and recruitment needs to be performed. The parameters of importance, i.e. the parameters that can
influence the implementation of the ideas needs to be identified. Such parameters can involve ongoing
market trends, which the ideas must be validated against. (Parmar, et al., 2014) (Parviainen, et al., 2017)
(Supplementary IT Consultant, 2018)
Planning actions for implementation
If the ideas are deemed possible to implement, the work of creating a road map for implementation can be
created. This road map contains the necessary specifics regarding hardware, software and infrastructure as
well as a description of the whole improvement project and its steps. (Parmar, et al., 2014) (Parviainen, et
al., 2017)
Implement the ideas deemed most important and follow up
The ideas, deemed possible from the previous steps, are implemented as described by the road map. This
phase is self-explanatory. However, a follow up phase should be performed after implementation, to ensure
that the improvement resulted in a desirable outcome. Here, the “as is” and “to be” state acts as reference
points. (Parmar, et al., 2014) (Parviainen, et al., 2017) (Cybercom Sweden AB, 2018) (Supplementary IT
Consultant, 2018)
4.1.3 Challenges Associated with Digitalization
Competing priorities, Inability to perform change
Any kind of implementation requires knowledge and understanding of the challenges that a change can
result in. A common mistake is that companies often have too many focus areas and objectives, which result
52
in competing priorities. This leads to confusion regarding which objectives and areas to focus on, and
ultimately harms the ability to perform change. (Kotter, 2007) (Parviainen, et al., 2017)
Growing demand for customized and complex products, increase level of flexibility and sustainability
In order to survive, stay competitive or gain market shares, companies need to be adaptable and innovative,
especially in technological areas. Common for all industries is the increasing demand for customized and
advanced products and services. This imposes on companies the ability to act flexible and involve a
sustainable thinking throughout all processes. (Leitao, et al., 2016) (Ribeiro & Björkman, 2017) (Bossen &
Ingemansson, 2016)
Security
This involves the individuals able to access the information, but also the event of a security breach. The
security of a digital system must be maintained constantly to ensure stability and prevent information leaks.
However, the degree of security in a digital system depends on the information being handled. (Parviainen,
et al., 2017) (Bossen & Ingemansson, 2016) (Ribeiro & Björkman, 2017) (Leitao, et al., 2016)
4.2 Findings from the Analysis with Respect to Established Theory
By analyzing the elements with respect to theory regarding Organization- and Process Management,
Improvement Work and Information Management, the following developments were made to the conceptual
framework.
Developments in accordance to the frame of reference
When comparing the elements to existing theory regarding Process Management, and the improvement tool
DMAIC, certain similarities could be identified. These similarities further developed the conceptual
framework by relating the elements to existing and established frameworks, methods and theories. This led
to an aggregation of the elements that resulted in a model, easier to illustrate and manage as to display the
phases, elements and tools. However, the conceptual framework is not identical to the improvement tool
DMAIC, but similarities exists. Furthermore, tools and methods from Information Management such as
Enterprise Architecture, Process-oriented information mapping with the addition of a swim lane chart to
identify the departments or individuals handling the information, where incorporated in the conceptual
framework. The conceptual framework, Figure 27, and the tools or methods utilized in each phase are
presented below.

53
Figure 27 Illustration of the conceptual framework's main phases. (Authors' image)
The following paragraphs provides an explanation of the main categories, their elements and a suggestion
of the tools utilized in each phase.
Challenges
The challenges associated with digital improvement work follows the conceptual framework throughout
the whole project. These elements are dependent on the company and its data, where every case is regarded
as unique. As an example, the organizational culture may impact the results of the project.
Prerequisites
Create an understanding regarding the subject
Position the company and identify drivers
Ensure the management’s capability of leading change
Create and communicate common objectives, strategies and a vision
Assess the necessary degree of security regarding the data handled by the company
o Methods and tools: SWOT-Analysis and Benchmarking
Define
Define key areas based on market position, market drivers and company needs
Define the project scope, time span, available resources and roles
Define the process(es) involved
Define concrete and quantifiable objectives for the project
54
o Methods and tools: Benchmarking, Gantt-chart, SMART-Objectives, Workshops and
Brainstorming
Current State
Map the current state of the process, involving the process(es), information flow(s), information
set(s), information carrier(s) and information- user(s) and owner(s)
o Methods and tools: Modified process-oriented information mapping
Future State
Identify potentially valuable collected/uncollected and used/unused data
Create a desired “to be” state
Evaluate to “as is” / Current state
Incorporate the elements/pillars/patterns of digital transformation to aid the idea creation process
Create ideas, believed to enable “to be” state
Evaluate ideas based on the preset limits, feasibility, ethicality, legislations, rationality etc.
o Methods and tools: Modified process-oriented information mapping, GAP analysis,
Simulations, Workshops and Brainstorming
Analysis
Analyze organizational impact of ideas
Analyze how the ideas can help improve the competitive advantage
Analyze with respect to the required data, software and hardware
Analyze scenarios where the ideas are successful or unsuccessful
Identify parameters which can influence the ideas and scenarios
o Methods and tools: Evaluation matrix and Enterprise Architecture Framework
Implement
Create a road map for implementation for the remaining idea(s). The road map is a project
planning report where the whole implementation phase is documented. (This phase can involve
one or several ideas, depending on the individual ideas’ scope and resource consumption)
Perform the implementation according to the project plan.
Follow up
Follow up to investigate if the result met the objectives, i.e. ensure stakeholder satisfaction
Ensure that no problem shifting occurred
Ensure sustainability (usage of the implemented improvement)
These phases, elements and tools were further evaluated in the case study, presented in the subsequent
chapter 5 Findings and Analysis: Case Study.
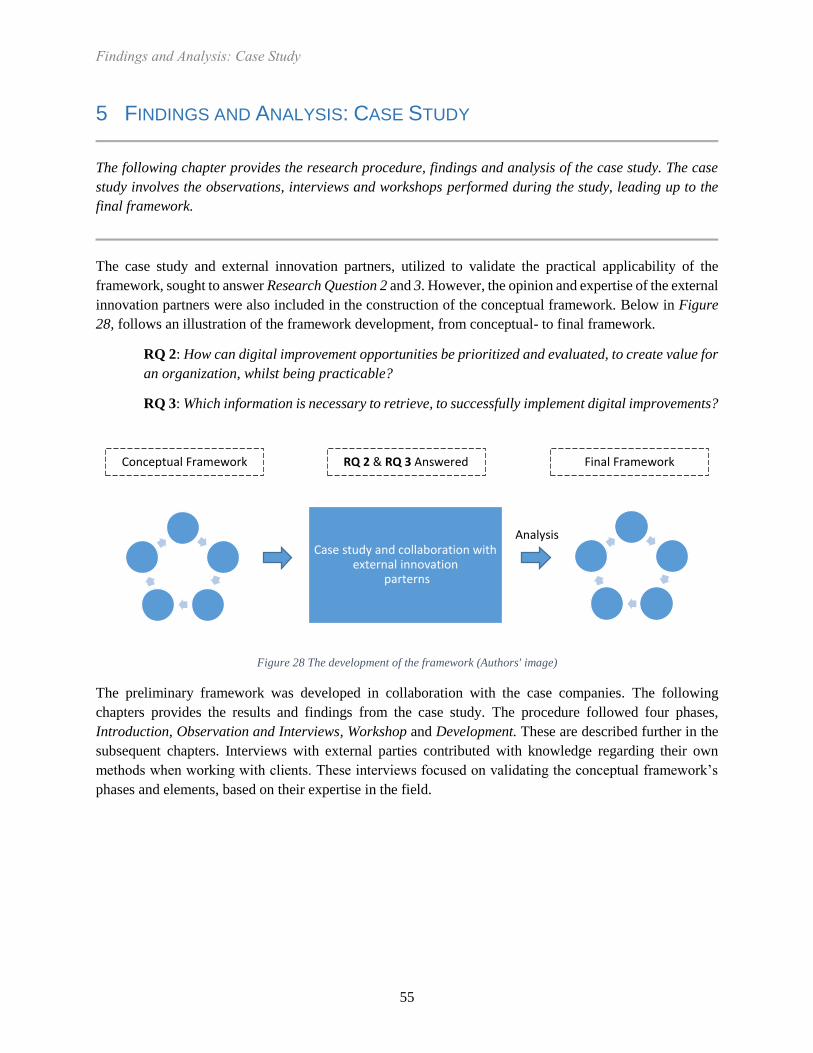
55
5 FINDINGS AND ANALYSIS: CASE STUDY
The following chapter provides the research procedure, findings and analysis of the case study. The case
study involves the observations, interviews and workshops performed during the study, leading up to the
final framework.
The case study and external innovation partners, utilized to validate the practical applicability of the
framework, sought to answer Research Question 2 and 3. However, the opinion and expertise of the external
innovation partners were also included in the construction of the conceptual framework. Below in Figure
28, follows an illustration of the framework development, from conceptual- to final framework.
RQ 2: How can digital improvement opportunities be prioritized and evaluated, to create value for
an organization, whilst being practicable?
RQ 3: Which information is necessary to retrieve, to successfully implement digital improvements?
The preliminary framework was developed in collaboration with the case companies. The following
chapters provides the results and findings from the case study. The procedure followed four phases,
Introduction, Observation and Interviews, Workshop and Development. These are described further in the
subsequent chapters. Interviews with external parties contributed with knowledge regarding their own
methods when working with clients. These interviews focused on validating the conceptual framework’s
phases and elements, based on their expertise in the field.
Figure 28 The development of the framework (Authors' image)
Analysis Case study and collaboration with
external innovationparterns
Conceptual Framework Final Framework RQ 2 & RQ 3 Answered

56
5.1 Introduction
The introduction phase started with a simple presentation of the thesis, the authors and the involvement of
the case companies. The participants were the CEOs of the case companies. The case companies’ roles
were defined as development partners and test subjects for the conceptual framework. To evaluate whether
certain elements were valuable or not. Educational seminars were also held to increase the understanding
regarding digital technologies, the technologies used by the company and technologies used in the same
sector. The seminars served the purpose of establishing a shared view of digital improvement efforts as
well as illustrating the impact of these efforts in other organizations.
Findings from the introduction
This phase primarily focused on the thesis, the CEOs current understanding and the involvement or role of
the case companies. The findings, affecting the conceptual framework, were:
The importance of knowing the sector or industry culture
The importance of knowing the organizational structure and culture
The importance of committed and motivated leadership
These findings provided the empirical foundation for the elements of the Prerequisites phase, since the
behavioral barriers were seen as a factor, which can influence the outcome. Furthermore, the respondents
were committed to the task and had a positive attitude towards change, understanding of the barriers of
change and the importance of being able to change.
5.2 Observation and Interviews
In addition to the introduction and educational seminars, the CEOs also contributed with a description of
the organization, its values, the core process flow and a fraction of the information flowing around the core
process. The information flows of the core process were later used as the primarily investigation area for
finding digital improvement opportunities.
5.2.1 Findings from the observation and interviews at the case companies
The process map was created by observations and interviews, where the core process from, input to output,
was observed, to visualize and concretize the flow of products. The observations were supported by
interviews to ensure a shared view from both the authors and the system experts. This resulted in a
preliminary information map, where the current information, created, sent or received, by each sub process
were described.
5.2.2 Findings from the interviews with external innovation partner Cybercom
The interview with Cybercom focused on their current way of working with clients, to receive input to the
framework’s structure, method and tools. The findings, and how these findings affected the framework, is
presented below.
Working process with clients, in short
The process is initialized with a workshop, where representatives, from Cybercom and the client, are
present. The objectives of the workshop are to increase the client’s knowledge regarding existing
technological advancements, as to broaden the client’s perspective in the context of digitalization, as well
as reaching a common understanding of the client’s perceived improvement area(s). Further, a minimum
viable product containing the core functions is created, to illustrate a possible solution. The whole process
57
builds on close collaboration with the client, in an iterative way, to ensure that the client’s needs and
requirements are fulfilled.
Impacts on the framework
Cybercom, as an innovation partner with experience in the field, brought the following notes to the
framework:
The importance of the client’s knowledge regarding digitalization. This knowledge can increase
during workshops with examples of technological advancements implemented by other companies.
The importance of starting small, i.e. minimum viable product, as to spend resources efficiently.
The importance of a close collaboration with the clients. Since the client’s technological expertise
might be limited (the reason for contacting an external innovation partner) and the innovation
partner has limited knowledge regarding the client’s organization, a close collaboration ensures
that the right parameters, requirements and improvement areas are included.
5.2.3 Findings from the interviews with supplementary innovation partner
The first interview with the supplementary innovation partner focused on evaluating the conceptual
framework’s elements, to investigate if the elements are appropriate on broader scope. No deep analysis
was performed but rather a brief discussion comparing the conceptual framework to their own methods.
The second interview focused on the information needed to fulfill the client’s requirements. Hence, the
interviews resulted in the specification that the supplementary innovation partner utilizes to deliver the final
product. However, the work is performed over a period of several weeks, or longer, depending on the
project’s scope and the knowledge of all involved parties. Situations arise where the client already knows
its needs, these projects are finalized earlier. Furthermore, important elements regarding the developing
process of products involved close collaboration during the development phase, and efficient resource usage
by prioritizing high yield efforts.
Evaluation of the conceptual framework
It is important to create a shared understanding regarding the subject
If the necessary skills or knowledge are missing, it is favorable to have a close collaboration with
the client
Complex ideas are often difficult to imagine, therefore, when first attempting an improvement, the
ideas are evaluated on a basic level. Often, a minimum viable product is created to show core
functionalities before an actual implementation of the finished product.
The impact on the organization is important to assess, especially if the improvement concerns data
that is regulated by laws. This can bring a new dimension of security to the organization.
Impacts on the framework
What or which kind of data that is necessary to gather, analyze and present.
Where the data source exists, i.e. on a server, in a machine or a physical location.
When the data is created, if it is created, otherwise a creation or gathering method must first be in
place. In addition, when the data should be available or for how long the data is relevant for the
involved parties.
To whom the data is important, i.e. who will receive the analyzed data and on which form.
58
Why the data is important, sets the prerequisites for the work such as security, analysis method and
presentation form.
Working closely with the client to ensure customer satisfaction
Creating a minimum viable product to display core functionality
5.3 Workshop
To further evaluate the conceptual framework, now consisting of the theoretical findings and a part of the
empirical findings, a workshop was held with the case companies. Discussions with the parties involved
were held during the workshop to promote an open dialogue, with the purpose of reaching a conclusion
through collaboration. The workshop was divided into three main phases further described below.
Presentation
The conceptual framework, illustrated in Figure 27, was presented to the case companies along with the
theoretical foundation, which the conceptual framework relies on. Further on, a description of the phases
was held to provide the participants with an overview of the conceptual framework. This was followed by
a detailed description of the elements in each phase and related tools used in each phase. Lastly, the
procedure when working with the conceptual framework were explained, in order to evaluate the practical
applicability.
Implementation with a test case
To investigate whether the conceptual framework’s phases are relevant and applicable, a test case was
constructed. The purpose of the test case was to create a discussion regarding the conceptual framework
and its practical applicability, I.E how it is used in a real-world scenario. Furthermore, the test case was
constructed with respect to the actual information flows in the organization, as to depict the reality as close
as possible. However, a real implementation requires more time and resources, to reach a successful
conclusion. Below follows a description of the test case procedure.
Initially, the Prerequisites phase was constructed by the authors, based on the previous steps in the case
study. Here, the understanding regarding the subject was constructed earlier and a common improvement
area, for both companies, were identified during the observation and interview steps. The Prerequisites
phase would usually be performed over a longer period; however, an adequate scenario was picked for the
test case due to time limitations. The evaluation of the phases and their feasibility was more relevant than
the resulting solutions.
The Define phase managed to delimit the improvement area based on the companies’ needs, market drivers
and market position. The project scope, time span etc. assumed arbitrary but realistic values for the test
scenario, as to enable creativity under realistic circumstances. The processes involved were identified and
a single quantifiable objective were constructed.
Based on the information gathered in the previous steps, the creation of a Current State was performed in
collaboration with the participants. The method used was a modified process-oriented information map
containing the processes, information- flows, sets, carriers, owners and users. An example of the map is
provided in APPENDIX B.
The Future State, where a desirable state should be specified, had the Current State as its starting point.
The process began with a discussion regarding the collected or uncollected data, which are either used or
unused, and could provide value for internal or external customers. The modified process-oriented
information map, created in Current State, therefore assisted in visualizing:
59
Gaps in the information flow
Unnecessary information flows
Inadequate information flows
Time delays
Missing information flows etc.
By visualizing the current information- and process flow and allowing an open discussion with the
stakeholders and system experts, a Future State could be developed. This Future State were evaluated
against the Current State, where the gap provided the missing, inadequate or unnecessary information flows
etc. Further on, ideas were created capable of reaching the Future State, based on the gap visualized in the
process-oriented information map. These ideas underwent a brief evaluation based on feasibility, the preset
limits of the project, ethicality, legislations, rationality etc.
The ideas, now proven at least feasible, had to be analyzed further, in the Analysis phase, to assess the
organizational impact and the potential direct or indirect benefits. However, the current capabilities
regarding software, hardware and technological competence hade to be considered in order to evaluate the
ideas’ compatibility. This highlighted the necessary components required to realize the ideas. Later on,
scenarios where the ideas were successful or not were created based on the organizational impact, to enable
the identification of important parameters. As an example, the employees affected by the change, must be
able to adapt to the change.
The Implement and Follow up phases were discussed, not performed, since the workshop only involved a
test case. Therefore, no actual implementation of any ideas was executed, thus, no follow up was necessary.
Feedback and findings from the workshop
Evaluation of the framework was conducted through the whole workshop and feedback was received
continuously. The discussed subjects are presented below:
The importance of collaboration and communication between involved parties
Clearly declaring the purpose of the improvement work for the involved individuals.
The responsibility of the top management, to motivate and lead the organization towards its
desirable state.
The modified process-oriented information map was seen as a good tool to visualize the
information flows, its users and the process flow, giving a holistic and comprehensible perspective.
Behavioral and cultural barriers were believed to have a major impact on the improvement work
and its result. Where, as an example, an improvement incorporated but not accepted or utilized by
the individuals involved brings no value.
By visualizing the information flows with the modified process-oriented information map, the
departments, and thus, the individuals directly affected by the change are identified. Therefore,
aiding in analyzing the organizational impact and indicating where resources and effort should be
focused.
The analysis phase, where ideas or digital improvement opportunities are evaluated, can benefit
from an evaluation matrix, to further evaluate and possibly prioritize ideas. However, the evaluation
matrix’s criteria should be organization specific.
5.4 Analysis and Framework Development
The interviews with the external and supplementary innovation partners focused on the validity of the
phases and elements, to assess whether the approach was rational from a system expert’s perspective.
60
Therefore, the input from these individuals was seen as trustworthy, based on their expertise and experience
when working with digital improvements.
The case study utilized to validate the framework’s practical applicability underwent a brief analysis, since
the conceptual framework could be applied in a real-world environment. However, some factors could
impact the results from the case study, negatively affecting the conceptual framework’s practical
applicability, these factors are described below.
The respondents had an open mind and a positive approach against technological development,
which resulted in a case study that met minimal resistance. In contrast, if the respondents were
conservative or unmotivated to change, the conceptual framework could have been developed
differently.
The case study was limited to the Swedish forest sector, which could affect the generalizability of
the study, and ultimately the conceptual framework. However, the conceptual framework relies on
the three theoretical main areas of the study, and the generalizability is discussed in 2.5 Expected
Generalizability.
The case study was limited to two case companies. This can be considered as negative for the
evaluation of the conceptual framework where a larger number of companies involved could lead
to a different conceptual framework. However, the time and resources available limited the study
to two case companies.
One representative from each company acted as respondents, this could harm the conceptual
framework where more representatives from each department could mitigate possible biases or lack
of expertise. However, the CEOs from each company had a good understanding and holistic
perspective of their organization, in combination with the authority to make decisions. This direct
contact reduced the range of communication and enabled the conceptual framework to be
constructed from a CEOs’ perspective.
Impact on the conceptual framework
More weight on the modified process-oriented information map, where the level of detail should
be on an understandable level. An unnecessary complex and detailed map can result in confusion,
which reduces the visualization of potential improvement areas. Several smaller maps were
considered superior to one larger and complex map.
The behavioral and cultural barriers, based on the respondents’ previous experience, were
considered to have a major impact when implementing digital improvements. Therefore, more
focus should be directed to the organizational analysis.
When working with the conceptual framework, it is of importance to involve the right stakeholders.
These stakeholders can be employees, internal- and external customers. The process-oriented
information map might identify stakeholders affected by changes in the information flow. This
enables organizations to focus resources effectively.
The conceptual framework is capable of filtering different digital improvement opportunities, based
on an organization’s objectives, strategies and vision, and going through the framework, down to
the analysis phase where these opportunities are evaluated and prioritized. Therefore, a consistent
line between the phases must exist.
61
The conceptual framework is capable of identifying the information necessary for realizing the
digital improvement opportunities. Which puts emphasis on the Current- and Future State, where
the information flows need to be explicitly described.

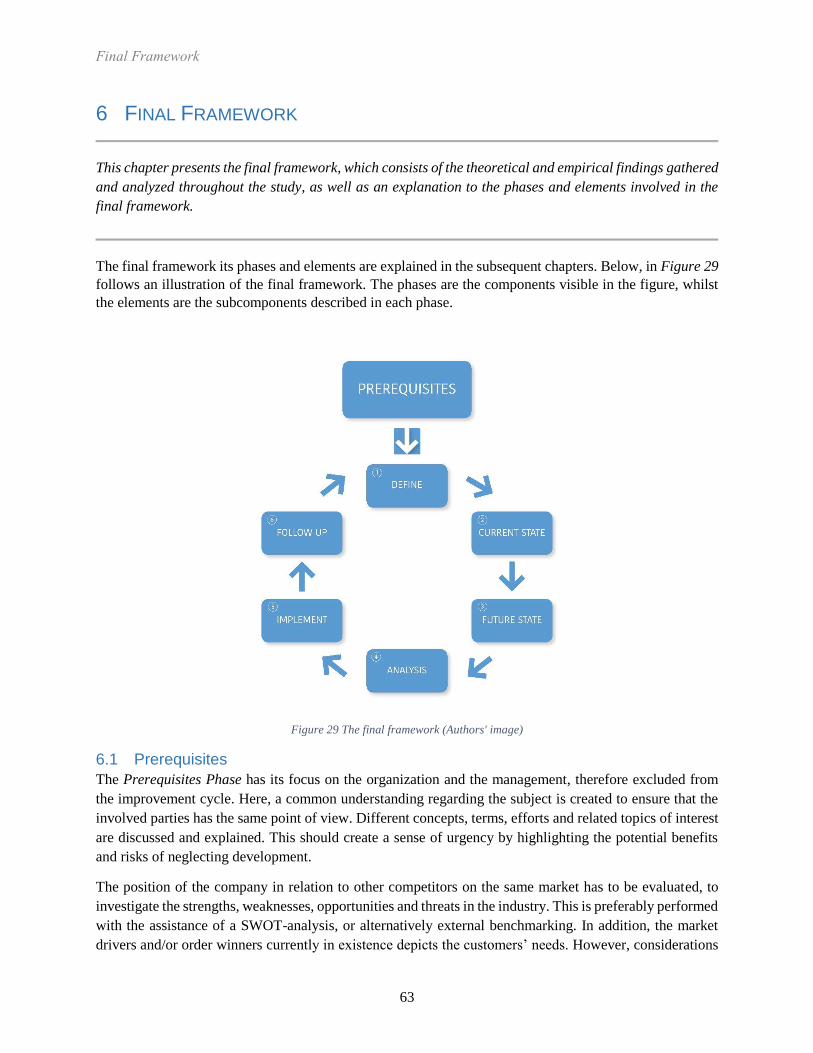
63
6 FINAL FRAMEWORK
This chapter presents the final framework, which consists of the theoretical and empirical findings gathered
and analyzed throughout the study, as well as an explanation to the phases and elements involved in the
final framework.
The final framework its phases and elements are explained in the subsequent chapters. Below, in Figure 29
follows an illustration of the final framework. The phases are the components visible in the figure, whilst
the elements are the subcomponents described in each phase.
Figure 29 The final framework (Authors' image)
6.1 Prerequisites
The Prerequisites Phase has its focus on the organization and the management, therefore excluded from
the improvement cycle. Here, a common understanding regarding the subject is created to ensure that the
involved parties has the same point of view. Different concepts, terms, efforts and related topics of interest
are discussed and explained. This should create a sense of urgency by highlighting the potential benefits
and risks of neglecting development.
The position of the company in relation to other competitors on the same market has to be evaluated, to
investigate the strengths, weaknesses, opportunities and threats in the industry. This is preferably performed
with the assistance of a SWOT-analysis, or alternatively external benchmarking. In addition, the market
drivers and/or order winners currently in existence depicts the customers’ needs. However, considerations

64
regarding market driver fluctuations and customer demand variations are of importance. Miltenburg’s
Framework can be utilized in this phase.
The management’s capability of leading change is crucial for the whole development/improvement process.
The understanding of how individual behavior and organization culture affects, or is affected, by change is
vital for improvement work. This is coupled with the ability to create and communicate shared and
organization wide objectives, strategies and a vision of the organization future position. To ensure that the
organization strives in the same direction by creating commitment and a sense of solidarity. Education,
such as workshops, for management positions can increase the capability of leading change.
The necessary degree of confidentiality or transparency must be established when handling an
organization’s data. An assessment of the laws regulating the data as well as data that, for other purposes,
should be confidential or accessible, will impact the degree of security.
6.2 Phase 1: Define
The process continues by combining the company needs with the previously identified market- position
and drivers. This will assist in defining the key area for further investigation, such as production flexibility,
productivity, quality etc. as to delimit the focus area of the digital improvement work.
Workshops/brainstorming and benchmarking could be utilized as tools for identifying the key area.
Further on, the project scope, available resources, responsibilities and processes involved are defined, to
effectively and successfully manage the project. The roles of the project are based on the key area and
processes, where an individual with decision-making authority should govern the project in collaboration
with system experts. By establishing concrete and quantifiable objectives for the defined project, involving
the key area and processes, a measurable target to reach is created. The project could follow basic project
management principles, utilizing SMART-Objectives and Gantt-chart etc. as tools.
6.3 Phase 2: Current State
When the appropriate process has been defined, the procedure continues by mapping the current state. This
was performed, in this study, with a modified process-oriented information map. The map visualizes the
information- flows, sets, carriers, owners and users, to give a holistic and comprehensible perspective. Here,
it is appropriate to use several small and understandable maps, in contrast to one large and complex map.
An example of a modified process-oriented information map can be found in APPENDIX B.
6.4 Phase 3: Future State
With the Current State mapped, the next step in the procedure is to create a desirable condition, called
Future State. By visualizing the information flows with respect to the process, it is easier for involved
stakeholders to assess the current situation and find improvement areas. Here, the information- flows, sets,
carriers, owners and users are evaluated in an attempt to find unnecessary, inadequate and missing
information flows, as well as gaps and time delays in the information flows. Different strategies can be
utilized to find these potential improvement areas, but one aspect of importance is the quality of
information. The dimensions of information quality must be taken into consideration, as an example, too
accurate or redundant information will not necessarily improve the process, i.e. the information quality
must match the purpose. The work with creating a Future State is preferably performed within a workshop
using the modified process-oriented information map, involving the stakeholders. These stakeholders are
identified by the information flows, i.e. the information owners and users.
65
By visualizing the Future State and comparing it to the Current State, the differences are illustrated and
concretized. These differences depict the Current State’s deficiencies, as to clearly show the information
flow that needs to be investigated further. As an example, a GAP analysis can be used as a tool for
comparing the differences between the states.
When the improvement area is identified, the procedure continues with the idea creation process. This
process attempts to close the gap between the Current State and the Future State. The elements, pillars or
patterns of digital transformation can be used as inspiration for the idea creation process. These ideas, now
believed to enable the Future State should be evaluated based on the previously stated limits of the project
involving areas such as feasibility, ethicality, legislation, rationality and environmental aspects. To enable
out of the box thinking a brief evaluation is preferred in contrast to a resource consuming investigation of
all the possible ideas. A deeper analysis will be performed in the subsequent phase. Again, a workshop or
brainstorming session or simulations can be used to create or evaluate ideas. This is the first filtering phase
for the ideas.
6.5 Phase 4: Analysis
The Analysis phase serves to examine the ideas through different perspectives. The organizational impact
such as changes in working conditions or employee repositioning etc. should be evaluated to assess the
necessary counteractions. Vocational education depending on skills and competence within the
organization and other actions can be included in this step. However, the human behavioral is an important
factor, and the resistance to change can alter the outcome of any project. Therefore, a thorough investigation
of the individuals affected by the change, identified by the modified process-oriented information map,
must be performed. An analysis of the required data, software and hardware necessary to realize the idea
will evaluate its compatibility with other components of the organization. These evaluations can be
performed with tools such as Root Cause Analysis, Enterprise Architecture Framework and Failure Mode
and Effects Analysis, to assess the risk regarding the changes.
Further on, the ideas’ ability to improve the organization’s competitive advantage, with respect to external
factors such as customer values etc. should be analyzed to prevent the scenario of implementing an
improvement which improves a process but harms other areas. Here, customer or market analysis and other
tools to evaluate external factors can be utilized, this analysis shares connection to the Prerequisites phase,
but is performed on a more detailed and idea specific level.
The next step in the Analysis phase is to create scenarios where the ideas are successful or unsuccessful and
attempt to identify the parameters or factors that can influence the outcome. Here, the changes or alterations
necessary are put into a broader context to predict the outcome. Such a scenario can be the event of
individuals’ resistance to change to a new software, where the parameters of importance are the competence
level, and the actions to prevent failure is to educate and increase the understanding of the new software.
Other factors can be political agendas, laws and regulations, and drastic changes to the market. By
identifying these factors or parameters, countermeasures, if possible, can be created to ensure the ideas’
survival after implementation. Tools to work with these scenarios are workshops or brainstorming.
The ideas remaining are now ensured to be able to improve the organization, unable to harm other areas
and the parameters, which can influence the outcome, are identified. The last step will attempt to prioritize
or rank the ideas based on parameters set by the organization. As an example, these parameters can include
risk of failure, cost, time to complete etc. and can be investigated by an evaluation matrix. Furthermore, the
66
Current State, Future State and Analysis phase, collects and indicates the information necessary to realize
the definitive idea. The information regarding which data, receiver, owner, transmitter, origin place and
point in time and relevancy can be gathered throughout the framework.
6.6 Phase 5: Implement
The idea(s) deemed most appropriate for implementation are now identified and filtered through the whole
procedure. The following phase will take the ideas and create a new project for implementation. This project
can follow standard project procedures. However, it is necessary to evaluate if the required skills and
knowledge for implementation exists in the organization, or if the implementation phase should involve
external partners. A decision whether to implement the idea(s), now considered a digital improvement
opportunity, as a pilot project or on full scale is also considered in the Implement phase. Project management
tools can assist in the implementation of the ideas.
6.7 Phase 6: Follow up and repeat
The Follow up phase investigate if the project succeeded in reaching the target objectives. This phase should
evaluate the stakeholder satisfaction, outcome and sustainability, to ensure that no problem shifting
occurred. Following up and controlling the improved areas can unveil valuable learnings for future
improvement work.

67
7 CONCLUSION
The following chapter concludes the study by answering the research questions as well as providing a
motivation of the prioritization process, answering Research question 2 and 3.
This chapter concludes the study by describing how the purpose and research questions were answered,
leading to the final framework. In the subsequent chapter 7.1 Answering the Research Questions, follows
motivation and reasoning regarding how the study answers the research questions.
This chapter provides the reader with the conclusion of the study. The subsequent chapter 7.1 Answering
the Research Questions, attempts to illustrate how the purpose of the study and the research questions were
answered with the qualitative methods of a literature synthesis and a case study. Where, the literature
synthesis resulted in a conceptual framework and the case study attempted to evaluate the practical
applicability, leading to a final framework. The final framework is therefore theoretically based and
evaluated in collaboration with the companies involved in the case study, illustrating applicability. The path
towards the final framework is illustrated in Figure 30
Figure 30 The path towards the final framework (Authors’ image)
Purpose of the Study Final Framework Qualitative Study
Literature Synthesis,Case study and Collaboration
with External Innovation Partners
Research Questions

68
7.1 Answering the Research Questions
To sufficiently answer the stated research questions, theory regarding Organization- and Process
Management, Improvement Work and Information Management were combined with a literature synthesis
concerning digital improvement efforts, and a case study involving two Swedish companies in the forest
sector. This resulted in the following conclusion regarding the research questions:
RQ 1: How would a framework capable of identifying digital improvement opportunities, based
on common characteristics found in literature, be presented?
RQ 2: How can digital improvement opportunities be prioritized and evaluated, to create value
for an organization, whilst being practicable?
RQ 3: Which information is necessary to retrieve, to successfully implement digital
improvements?
The framework capable of identifying digital improvement opportunities, which answers Research question
1 is presented in the previous chapter 6 Final Framework. The elements of the framework are composed of
the common characteristics found in the literature synthesis and further evaluated by established theory and
methods. The literature synthesis, triangulating common characteristics, is believed to increase the internal
validity of the elements involved in the framework. Whilst the evaluation and comparison to the established
theory and methods is believed to increase the external validity or generalizability.
To answer Research question 2, a demonstration of the framework’s capability to narrow down focus areas
and prioritize ideas based on the organization’s criteria, market factors or needs is presented below. A
motivation for the answer to Research Question 3 is also provided in the end of this chapter.
The Prerequisites phase investigates external factors such as the organization’s position on the market, the
market drivers, and thus, the customer values and needs, to initiate the improvement process. Further on,
the Define phase continues by combining the position and market drivers with the needs of the organization
to identify the key area. This key area, which could involve production flexibility, productivity and quality,
should share correlation with the market drivers, organization position and the needs of the organization.
As to ensure the key area’s positive impact on the organization’s competitiveness. By defining the key area,
the processes capable of directly influencing the key area can be identified, which further narrows down
the focus area by involving internal factors.
The Future State, which now handles ideas capable of realizing the desired state, filters the ideas based on
the preset limits of the project. Here, a brief evaluation attempts to sort out the ideas that are strictly
unfeasible or irrational. In short, the ideas are allowed to be ambitious but not illegal, as to encourage out
of the box thinking.
Further on when entering the Analysis phase, a deeper evaluation and analysis is performed on the ideas.
Here, the organizational impact is analyzed, changes such as reallocation of staff or equipment, vocational
training, restructuring of the organization and departments etc. are accounted for to assess the resulting
alterations to the organization. The existing or missing technological capabilities of the organization are
also evaluated in the Analysis phase. These technological capabilities can involve hardware, software and
data necessary for realizing the Future State. The final evaluation, which can be performed by an evaluation
matrix, now incorporates the outcome of the ideas and attempts to prioritize by the organization’s own
parameters of importance.
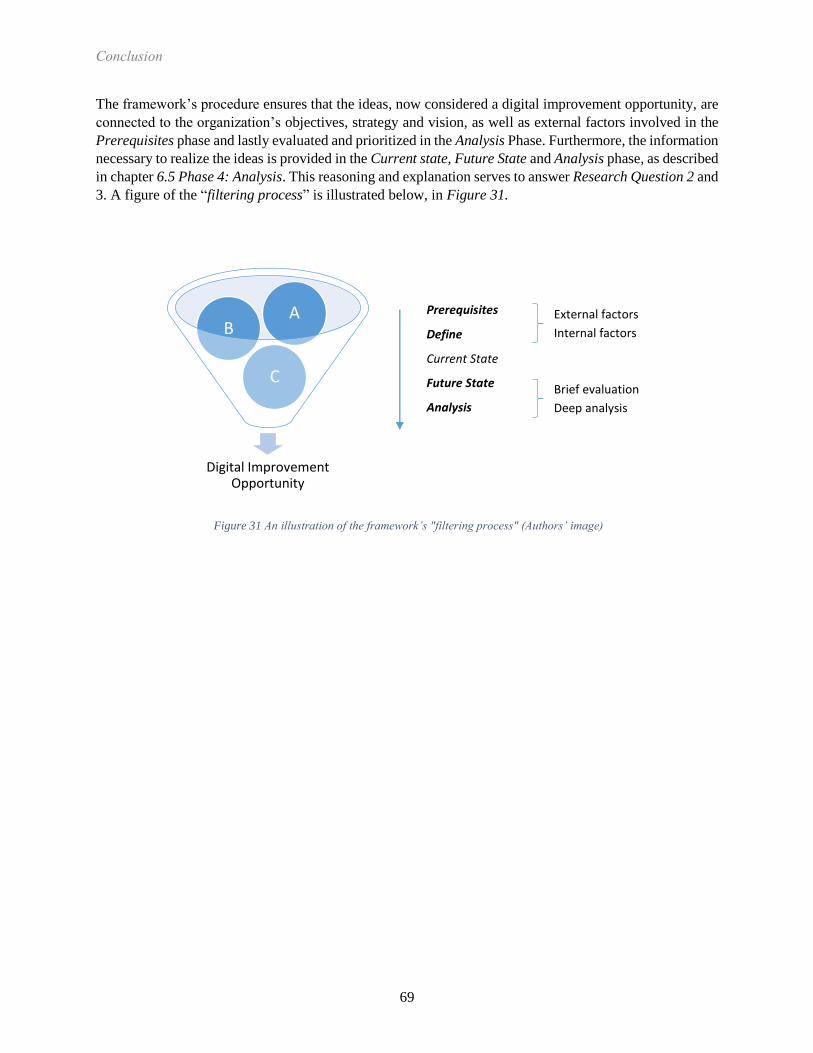
69
The framework’s procedure ensures that the ideas, now considered a digital improvement opportunity, are
connected to the organization’s objectives, strategy and vision, as well as external factors involved in the
Prerequisites phase and lastly evaluated and prioritized in the Analysis Phase. Furthermore, the information
necessary to realize the ideas is provided in the Current state, Future State and Analysis phase, as described
in chapter 6.5 Phase 4: Analysis. This reasoning and explanation serves to answer Research Question 2 and
3. A figure of the “filtering process” is illustrated below, in Figure 31.
Figure 31 An illustration of the framework’s "filtering process" (Authors’ image)
Prerequisites
Define
Current State
Future State
Analysis
Digital Improvement Opportunity
C
BA External factors
Internal factors
Brief evaluation
Deep analysis


71
8 DISCUSSION
This chapter contains a discussion and the opinion of the authors regarding the study, its ethical aspects,
limitations and research contribution, as well as the future work.
This study was a collaboration involving Linköping University, the consulting firm Propia AB, the business
cluster Paper Province, the case companies Nykvist Skogs AB and Bäckebrons Sågverk AB and the IT
consultant company Cybercom Sweden AB. The involvement of several parties and stakeholders provides
robustness to the study by including competence and experience from different areas. Furthermore, the
individuals involved were positive and committed to contribute time and resources to the study, which
resulted in a study with good initial conditions. The framework creation process was time and resource
consuming, due to the size and relatively undefined research area. In addition, the number of stakeholders
and their geographical dispersion resulted in the situation where time and resources were limited. Therefore,
investing more time and resources in the framework would benefit the development by enabling more input
from other parties. However, the framework’s theoretical foundation is believed to be solid and is an
appropriate starting point for further empirical testing and development.
During the case study with the involved companies, a certain barrier to change were mentioned more often
compared to others. The most concerning barrier was the individual’s resistance to change when using new
technologies or working methods. These concerns were based on years of experience as managers and
CEOs, managing different departments and individuals. Therefore, the organizational impact regarding
changes in working methods, reallocation of staff, reorganization etc. must be analyzed thoroughly and in
detail. Otherwise, the risk of implementing an improvement, which is not accepted nor understood by the
employees, might harm the outcome of the improvement.
72
8.1 Ethics
Since the study involved interviews and personal contact where information was exchanged between
several parties, the basic principles of informed consent, anonymity and confidentiality were applied. The
involved individuals were all supplied with the information of their involvement beforehand, as to ensure
their awareness. Furthermore, their anonymity was honored, whilst confidentiality of the information
provided was respected to the degree agreed upon. Therefore, the report will not provide any transcript or
documentation of the interviews, workshops or other sensitive information, only summaries of the events
or arbitrary illustrations.
The framework, on the other hand, might lead to other ethical complications. Since the framework can
handle information of different degrees of sensitivity, the ethical aspects must be ensured by its user.
Moreover, improved information management can lead to increased traceability, which might impose
problems for individuals where their integrity is exposed. As an example, by tracing a faulty product back
to its origin, the individuals handling the faulty product are exposed. Thus, depending on the level of detail,
the integrity of the individuals is compromised. The same arguments can be applied to confidential
information, where the user of the framework might be an individual who is not eligible to access certain
information.
8.2 Limitations
All studies have its limitations regarding time and resources. This study was performed over a period of
approximately 20 weeks with the participation of two authors, two representatives from two case
companies, one supervisor from the Linköping University, one supervisor from Propia AB, one supervisor
from Paper Province and two external IT consultants.
It is understood that additional time would benefit the study, since it would enable a deeper investigation
of the elements constructing the framework. A larger set of case companies, preferably from different
industries or even countries would also contribute to the generalizability and robustness of the study and its
framework. The same applies to the amount of system experts involved, where additional expertise and
experience would benefit the framework.
8.3 Research Contribution
The concept Industrie 4.0 is nowadays an often-discussed topic; however, the path towards Industrie 4.0 is
not as clearly defined as the concept itself. The idea relies on a highly digital and connected organization,
which is capable of handling vast amounts of data and information. Previous studies regarding digitalization
efforts are mainly performed at a single company and the methods described were often company specific
or untested on other companies or sectors. Therefore, a research gap exists concerning a general framework
for identifying digital improvement opportunities.
In addition, organizations surrounded by technology are having a hard time to adapt to the technological
advancements (Brinker, 2016). This is due to the exponential development pace of technology, illustrated
by Moore’s Law (Salem Press Encyclopedia of Science, 2017). When comparing the adaptability of
organizations with respect to technology, a wide and growing gap is visible. To close this gap, a digital
transformation or digital improvement is necessary, as shown in Figure 32.

73
According to McKinsey & Company (2015, p.7) “the value lies in end-to-end optimization of the “digital
thread,” (i.e., making better use of information not captured/made available/used today) and in eliminating
inefficiencies caused by information losses at the interfaces of functions, sites, and companies”. With this
perspective, the master thesis attempts to close the perceived research gap, which also affects an
organization’s ability to adapt to new technologies.
8.4 Future Work
The following actions could be of interest for future work:
Further analysis of the elements involved in the framework
Further development and evaluation of the framework by implementation at an organization during
a longer period to assess its applicability from start to finish
Development of the tools and methods incorporated in the framework
Test the framework’s generalizability by implementation at a vast amount of different organizations
and industries
Technological development
Organization’s adaption
“Digital Transformation”
Time
Figure 32 The gap between organization’s technological adapation and technological
development (Brinker, 2016)


75
9 REFERENCES Backman, J., 2016. Rapporter och Uppsatser. 3rd ed. Lund: Studentlitteratur AB.
Bailey, D. & Wright, E., 2003. Practical SCADA for industry. Amsterdam: Elsevier.
Behrouz, F. & Fathollah, M., 2016. A systematic approach to enterprise architecture using axiomatic
design. s.l., Elsevier B.V, pp. 158-165.
Bergman, B. & Klefsjö, B., 2001. Kvalitet från behov till användning. Lund: Studentlitteratur.
Björklund, M. & Paulsson, U., 2014. Academic Papers and Theses: To write and presenad and to act as
an opponent. 1th ed. Lund: Studentlitteratur AB.
Blaxter, L., Hughes, C. & Tight, M., 2006. How to Research. third ed. Berkshire: Open University Press.
Bloching, B. et al., 2015. The Digital Transformation of Industry, München: Roland Berger Strategy
Consultants GMBH.
Blomkvist, P. & Hallin, A., 2015. Method for engineering students: Degree projects using the 4-phase
model. First ed. Lund: Studentlitteratur AB.
Bossen, H. & Ingemansson, J., 2016. Digitalisering av Svensk Industri – Kartlaggning av svenska styrkor
och utmaningar, s.l.: Roland Berger AB.
Brinker, S., 2016. Martec’s Law: the greatest management challenge of the 21st century, s.l.:
Chiefmartec.
Business Dictionary, 2018. Digitalization definition. [Online]
Available at: http://www.businessdictionary.com/definition/digitalization.html
[Accessed 8 February 2018].
Business Dictionary, 2018. Information FLow. [Online]
Available at: http://www.businessdictionary.com/definition/information-flow.html
[Accessed 10 April 2018].
Bäckebrons Sågverk AB, 2018. Starting page. [Online]
Available at: http://www.bäckebronssågverk.se
[Accessed 18 April 2018].
Camp, R. C., 2003. Best Practice Benchmarking: the Path to Excellence. The Global Benchmaking
Network , April, Volume 1, p. 12.
Child, J., 2015. Organization: Contemporary principles and practice. 2nd ed. Chichester: John Wiley and
Sons Ltd.
Cybercom Sweden AB, 2018. Manager [Interview] (11 April 2018).
Cybercom, 2018. Om koncernen. [Online]
Available at: https://www.cybercom.com/sv/Om-Cybercom/Om-koncernen/
[Accessed 18 April 2018].
76
Cöster, M. & Westelius, A., 2016. Digitalisering. First ed. Stockholm: Liber AB.
De Carolis, A., Macchi, M., Negri, E. & Terzi, S., 2017. Guiding Manufacturing Companies Towards
Digitalization: A methodology for supporting manufacturing companies in defining their digitalization
roadmap. Madeira, IEEE.
Drath, R. & Horch, A., 2014. Industrie 4.0: Hit or Hype?. IEEE Industrial Electronics Magazine, 8(2), pp.
56-58.
Eriksson, L. T. & Wiedersheim-Paul, F., 2014. Att utreda forska och rapportera. Stockholm: Liber.
Fitzgerald, B., Stol, K.-J., Minör, S. & Cosmo, H., 2017. Scaling a software business. Cham: Springer
Open.
Forslund, M., 2013. Organisering och ledning. 2 ed. Malmö: Liber AB.
Graves, T., 2009. Enterprise architecture - A pocket guide Tom Graves. Ely: IT Governance Pub..
GTS Learning, 2014. Process Improvement with Gap Analysis Study Guide. Student Edition ed. s.l.:GTS
Learning.
Heberle, A., Löwe, W., Gustafsson, A. & Vorrei, Ö., 2017. Digitalization Canvas – Towards Identifying
Digitalization Use Cases and Projects. Journal of Universal Computer Science , 23(11), pp. 1070-1097.
Kagermann, H., Wahlster, W. & Helbig, J., 2013. Recommendations for implementing the strategic
initiative INDUSTRIE 4.0, s.l.: Acatec - National Academy of Science and Engineering.
Kotter, J. P., 2007. Leading Change - Why Transformation Efforts Fail. Harvard Business Review , pp. 4-
11.
Kotter, J. P. & Schlesinger, L. A., 2013. Choosing Strategies for Change, s.l.: Harvard Business Review.
Langley, G. J. et al., 2009. The Improvement Guide. 2nd ed. San Fransisco: Jossey Bass.
Laudon, K. C. & Laudon, J. P., 2010. Management Information Systems: Managing the digital firm.
Eleventh ed. New Jersey: Pearson Education, Inc..
Leedy, P. D. & Ormrod, J. E., 2009. Practical Research Planning and Design. Ninth ed. New Jersey:
Pearson Education, Inc..
Leitao, P., Ribeiro, L. & Strasser, T., 2016. Smart Agents in Industrial Cyber–Physical Systems.
Proceedings of the IEEE, Volume 104, pp. 1086-1101.
Loshin, D., 2013. Business Intelligence: The savvy manager's guide. second ed. s.l.:Morgan Kaufmann.
Magnusson, K. et al., 2003. Six Sigma - The Pragmatic Approach. Lund: Studentlitteratur AB.
Markovitch, S. & Willmott, P., 2014. Accelerating the digization of business processes. [Online]
Available at: https://www.mckinsey.com/business-functions/digital-mckinsey/our-insights/accelerating-
the-digitization-of-business-processes
[Accessed 26 January 2018].
77
Matt, C., Hess, T. & Benlina, A., 2015. Digital Transformation Stategies, Wiesbaden: Springer
Fachmedien.
McKinsey & Company, 2015. Industry 4.0 How to navigate digitization of the manufacturing sector, s.l.:
McKinsey Digital.
Meyer, H., Franz, F. & Klaus, T., 2009. Manufacturing Execution Systems: Optimal Design, Planning,
and Deployment. New York: The McGraw-hill Companies, Inc..
Miller, H., 1996. The multiple dimensions of information quality. Information Systems Managment ,
13(2), pp. 79-83.
Miller, S. P., 2016. Thematic Analysis. s.l.:s.n.
Monostori, L., 2014. Cyber-physical Production Systems: Roots, Expectations and R&D Challenges.
Procedia CIRP, Volume 17, pp. 9-13.
Myndigheten för sammhällsskydd och beredskap & Riksarkivet, 2012. Vägledning för processorienterad
informationskartläggning, Karlstad: DanagårdLiTHO.
Nykvist Skogs AB, 2018. Vår Historia. [Online]
Available at: http://www.nykvist-skogs.se/index.php
[Accessed 18 April 2018].
Parmar, R., Mackenzie, I., Cohn, D. & Gann, D., 2014. The new Patterns of Innovation: How to use data
to drive growth. Harvard Business Review, 92(1), pp. 86-95.
Parviainen, P., Kääriäinen, J., Tihinen, M. & Teppola, S., 2017. Tackling the digitalization challenge:
how to benefit from digitalization in practice. International Journal of Information Systems and Project
Management, 5(1), pp. 63-77.
Patel, R. & Davidson, B., 2011. Forskningsmetodikens grunder. 4 ed. Lund: Studentlitteratur.
Pearlson, K. E. & Saunders, C. S., 2009. Strategic Management of Information Systems. fourth ed.
Hoboken: John WIley & Sons, Inc..
Porter, M. E. & Heppelmann, J. E., 2014. How Smart, Connected Products Are Transforming
Competition. Harvard Buisniess Review, pp. 11-64.
Propia AB, 2018. Lär känna oss. [Online]
Available at: http://www.propia.se/Om-oss.html
[Accessed 5 April 2018].
Punch, K. F., 2013. Introduction to social research: quantitative and qualitative approaches. Los
Angeles, CA: Sage.
Ribeiro, L. & Björkman, M., 2017. Transitioning from Standard Automation Solutions to Cyber-Physical
Production Systems: An Assessment of Critical Conceptual and Technical Challenges. IEEE SYSTEMS
JOURNAL, Volume 1, pp. 1-13.

78
Romanov, A., Romanov, M., Kharchenko, A. & Kholopov, V., 2016. Unified Architecture of Execution
Level Hardware and Software for Discrete Machinery Manufacturing Control Systems. Kuala Lumpur,
2016 IEEE Student Conference on Research and Development (SCOReD) .
Rüßmann, M. et al., 2015. Industry 4.0: The future of productivity and growth in manufacturing
industries, s.l.: The Boston Consulting Group.
Salem Press Encyclopedia of Science, 2017. Moore's Law. [Online]
Available at: https://eds-a-ebscohost-com.e.bibl.liu.se/eds/detail/detail?vid=2&sid=6ab959ba-bcb1-41bf-
92a9-
caf61c44576f%40sessionmgr4009&bdata=JkF1dGhUeXBlPWlwLHVpZCZsYW5nPXN2JnNpdGU9ZW
RzLWxpdmUmc2NvcGU9c2l0ZQ%3d%3d#AN=125600130&db=ers
[Accessed 23 05 2018].
Schwab, K., 2016. The Fourth Industrial Revolution. New York: Crown Business.
Shanks, G., Seddon, P. B. & Willcocks, L. P., 2003. Second-Wave Enterprise Resource Management
Systems: Implementing for Effectiveness. New York: Cambridge University Press.
Supplementary IT Consultant, 2018. IT developer and consultant [Interview] (7 April 2018).
Sörqvist, L., 2004. Standiga forbattringar: en bok om resultatorienterat forbattringsarbete,
verksamhetsutveckling och Sex Sigma. 1 ed. Lund: Studentlitteratur AB.
Westerman, G. et al., 2011. Digital Transformation: A Roadmap for Billion-Dollar Organizations, s.l.:
Capgemini Consulting and MIT Center for Digital Business.
Voss, C., Tsikriktsis, N. & Frohlich, M., 2002. Case research in operations management. International
Journal of Operations & Production Management, 22(2), pp. 195-219.
79
APPENDIX A: Search terms
Search terms:
1. Frameworks for digital improvement implementations
2. Prerequisites for digital improvement efforts
3. Challenges of digital improvement implementations
4. Benefits of digital improvement efforts
5. Definitions and theoretical background
Keywords:
• Digitalization frameworks
• Digital transformation
• Digitalization efforts
• Digitalization methods
• Towards digitalization
• Digitization
• Digital solutions
• Digital information flows
• Management of information flows
Databases:
• Linköping University library
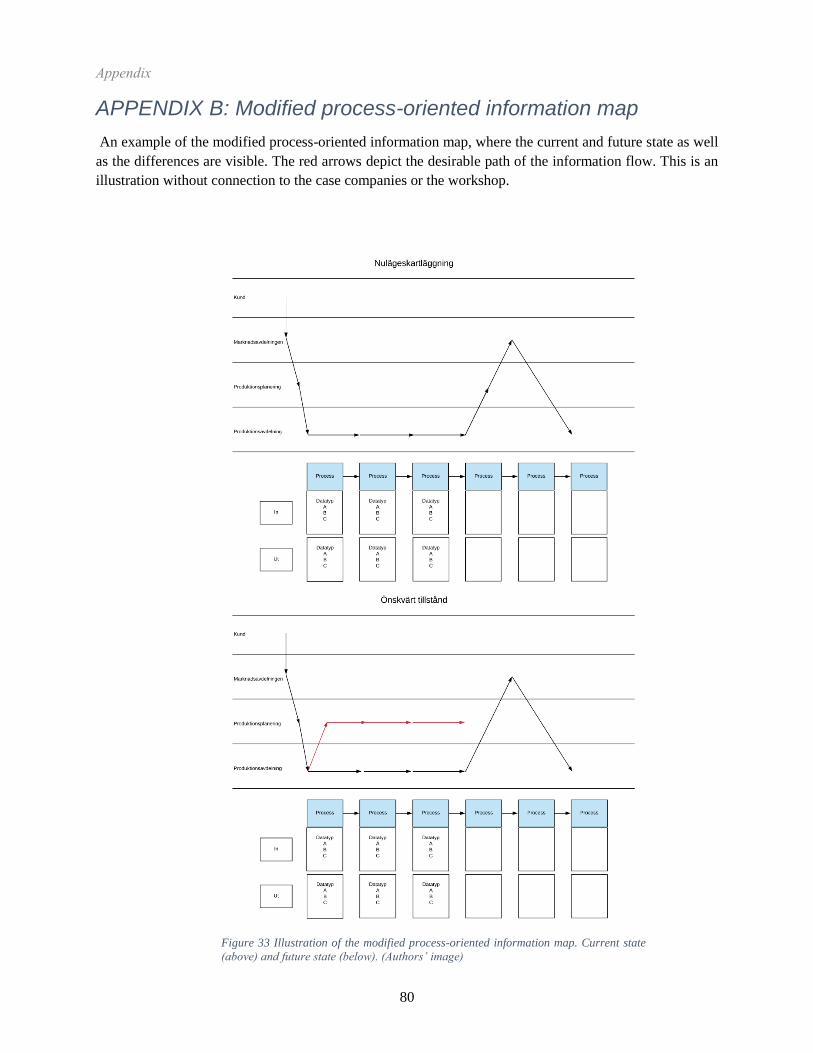
80
APPENDIX B: Modified process-oriented information map
An example of the modified process-oriented information map, where the current and future state as well
as the differences are visible. The red arrows depict the desirable path of the information flow. This is an
illustration without connection to the case companies or the workshop.
Figure 33 Illustration of the modified process-oriented information map. Current state
(above) and future state (below). (Authors’ image)