tourism’s contribution to the australian economy · tourism’s contribution to the australian...
TRANSCRIPT
Tourism’s ConTribuTion To The AusTrAliAn eConomy
1997–98 to 2011–12
Tourism’s ConTribuTion To The AusTrAliAn eConomy

ii
Authors: Jai Kookana and Tien Duc Pham
ISBN 978-1-922106-91-9 (PDF)
978-1-922106-92-6 (Word)
Tourism Research Australia
Department of Resources, Energy and Tourism
GPO Box 1564
Canberra ACT 2601
ABN 46 252 861 927
Email: [email protected]
Web: www.ret.gov.au/tra
Publication date: July 2013
This work is licensed under a Creative Commons Attribution 3.0 Australia licence. To the extent that
copyright subsists in third party quotes and diagrams it remains with the original owner and
permission may be required to reuse the material.
This work should be attributed as Tourism’s Contribution to the Australian Economy, 1997–98 to 2011–12, Tourism Research
Australia, Canberra.
Enquiries regarding the licence and any use of work by Tourism Research Australia are welcome at

iii
iv
Contents
Executive summary ............................................................................................ v
Introduction ....................................................................................................... 1
What has changed from the previous report? ............................................................ 1
What is the direct economic contribution of tourism? ................................................. 1
What is the indirect economic contribution of tourism? ............................................... 1
What is the total economic contribution of tourism? ................................................... 2
Tourism’s contribution to GDP and GVA ............................................................. 4
Direct contributions ............................................................................................... 4
Indirect contributions ............................................................................................. 4
Total contributions ................................................................................................ 5
Tourism’s contribution to GVA by industry ......................................................... 6
Indirect GVA in ‗All other industries‘ ........................................................................ 8
Growth in total tourism GVA, by industry ................................................................. 9
Industry share of total tourism GVA ....................................................................... 10
Tourism’s contribution to employment ............................................................. 13
Tourism employment by industry .......................................................................... 15
Indirect employment in ‗All other industries‘ ........................................................... 19
Tourism multipliers .......................................................................................... 19
Tourism multipliers over time ............................................................................... 20
Conclusion ........................................................................................................ 21
References ....................................................................................................... 22
Appendix A: Methodology for calculating indirect contribution ................................. 23
Appendix B: Input-output multipliers and tourism multipliers .................................. 25

v
Tables
Table 1: Relationship between GVA and GDP ............................................................ 4
Table 2: Tourism GVA by industry, 2011–12 ............................................................. 8
Table 3: Industry share in total tourism GVA ......................................................... 11
Table 4: Summary, tourism‘s direct and indirect contribution
to the Australian economy .................................................................................... 14
Table 5: Direct and indirect employment by tourism industries, 2011–12 ................... 16
Table 6: Total (direct and indirect) employment in tourism ...................................... 18
Table 7: Tourism industry multipliers (2011–12) based on
2008–09 input-output tables ................................................................................ 27
Figures
Figure ES1: Key economic indicators, 2011–12 ........................................................ vi
Figure ES2: Output multiplier: Tourism versus other important industries ................... vii
Figure 1: Direct and indirect share of tourism GVA and GDP ....................................... 5
Figure 2: Annual growth in total tourism GDP and Australian GDP ............................... 6
Figure 3: Tourism indirect GVA in All other industries, 2011–12 .................................. 9
Figure 4: Average annual growth in GVA, tourism and all industries,
1997–98 to 2011–12 ........................................................................................... 10
Figure 5: Direct and indirect share of tourism employment ....................................... 13
Figure 6: Direct and indirect employment growth in the tourism industry,
1997–98 to 2011–12 ........................................................................................... 17
Figure 7: Tourism employment in All other industries, 2011–12 ................................ 19
Figure 8: Relationship between tourism product share and tourism output multiplier ... 20
Figure 9: Flow-on effect of tourism consumption ..................................................... 25
Figure 10: Presentation of results .......................................................................... 26

v
Executive summary
This report presents a complete picture of the Australian tourism industry‘s contribution
to the economy. TRA‘s estimates of tourism‘s indirect and total economic contribution
presented in this report complement the latest estimates of tourism‘s direct contribution
from the Australian Bureau of Statistics‘ (ABS) Tourism Satellite Account (TSA)
(ABS Cat. No. 5249.0). Results are presented for the period 1997–98 to 2011–12.
This report reflects revisions in the time series estimates published by the ABS and
revisions in the domestic and international consumption time series published by TRA
(see TRA 2013 for more information). Consequently, the estimates published in this
report are not comparable to the previously published estimates.
While Australia‘s tourism industry suffered a severe downturn during the global financial
crisis (GFC) of 2008–09, the industry showed its resilience by recovering quickly during
the post-GFC period (2009–10 to 2011–12), when tourism Gross Domestic Product
(GDP) increased by 3.9 per cent annually over this period (Figure ES1). In the long term,
total tourism GDP rose at an average annual rate of 4.6 per cent between 1997–98 and
2011–12. Tourism‘s contribution to Australian GDP was $87.3 billion, or 5.9 per cent
share of the Australian economy.
vi
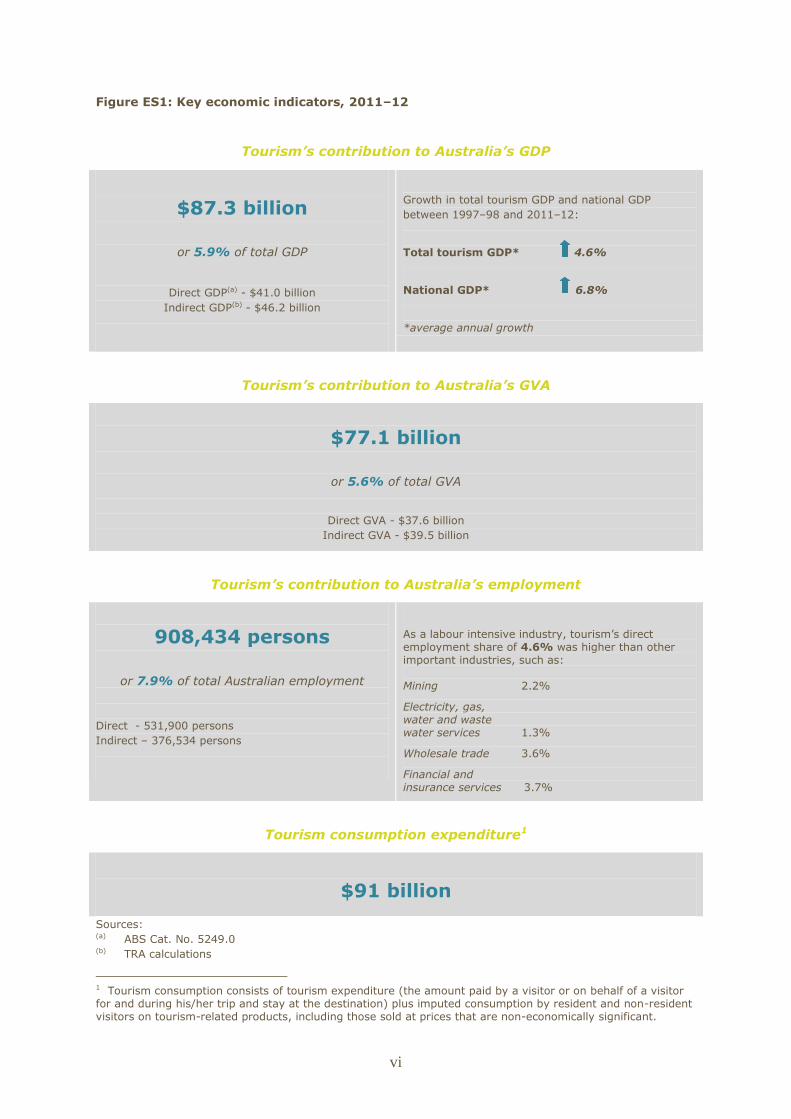
Figure ES1: Key economic indicators, 2011–12
Tourism’s contribution to Australia’s GDP
$87.3 billion
or 5.9% of total GDP
Direct GDP(a) - $41.0 billion
Indirect GDP(b) - $46.2 billion
Growth in total tourism GDP and national GDP
between 1997–98 and 2011–12:
Total tourism GDP* 4.6%
National GDP* 6.8%
*average annual growth
Tourism’s contribution to Australia’s GVA
$77.1 billion
or 5.6% of total GVA
Direct GVA - $37.6 billion
Indirect GVA - $39.5 billion
Tourism’s contribution to Australia’s employment
908,434 persons
or 7.9% of total Australian employment
Direct - 531,900 persons
Indirect – 376,534 persons
As a labour intensive industry, tourism‘s direct employment share of 4.6% was higher than other important industries, such as: Mining 2.2%
Electricity, gas, water and waste water services 1.3%
Wholesale trade 3.6%
Financial and insurance services 3.7%
Tourism consumption expenditure1
$91 billion
Sources: (a) ABS Cat. No. 5249.0 (b) TRA calculations
1 Tourism consumption consists of tourism expenditure (the amount paid by a visitor or on behalf of a visitor for and during his/her trip and stay at the destination) plus imputed consumption by resident and non-resident visitors on tourism-related products, including those sold at prices that are non-economically significant.

vii
Tourism‘s results from another important economic measure, output multipliers, further
highlight the positive outlook for the industry. Tourism‘s total output multiplier was
valued at 1.92 (Figure ES2).
This means that for every dollar that tourism earns directly in the Australian economy, it
generates an additional 90 cents to other parts of the economy. At 1.9, tourism‘s total
multiplier is larger than other important industries such as Mining (1.6), Retail trade
(1.7) and Education and training (1.4).
Figure ES2: Output multiplier(a): Tourism versus other important industries
1.91.7
1.61.5 1.5 1.4
0.0
0.2
0.4
0.6
0.8
1.0
1.2
1.4
1.6
1.8
2.0
Tourism Retail trade Mining Healthcareand socialassistance
Finance andinsuranceservices
Educationand training
Ou
tpu
t m
ult
iplie
r
Sources: (a) TRA calculations using ABS 2008–09 input-output tables (ABS Cat. No. 5209.0)
2 Tourism multiplier value measures the increase in the production of intermediate inputs in the economy (indirect contribution) resulting from a unit increase in consumption of tourism goods and services by the visitors. A high value of this multiplier indicates that a higher indirect value is created in the economy.
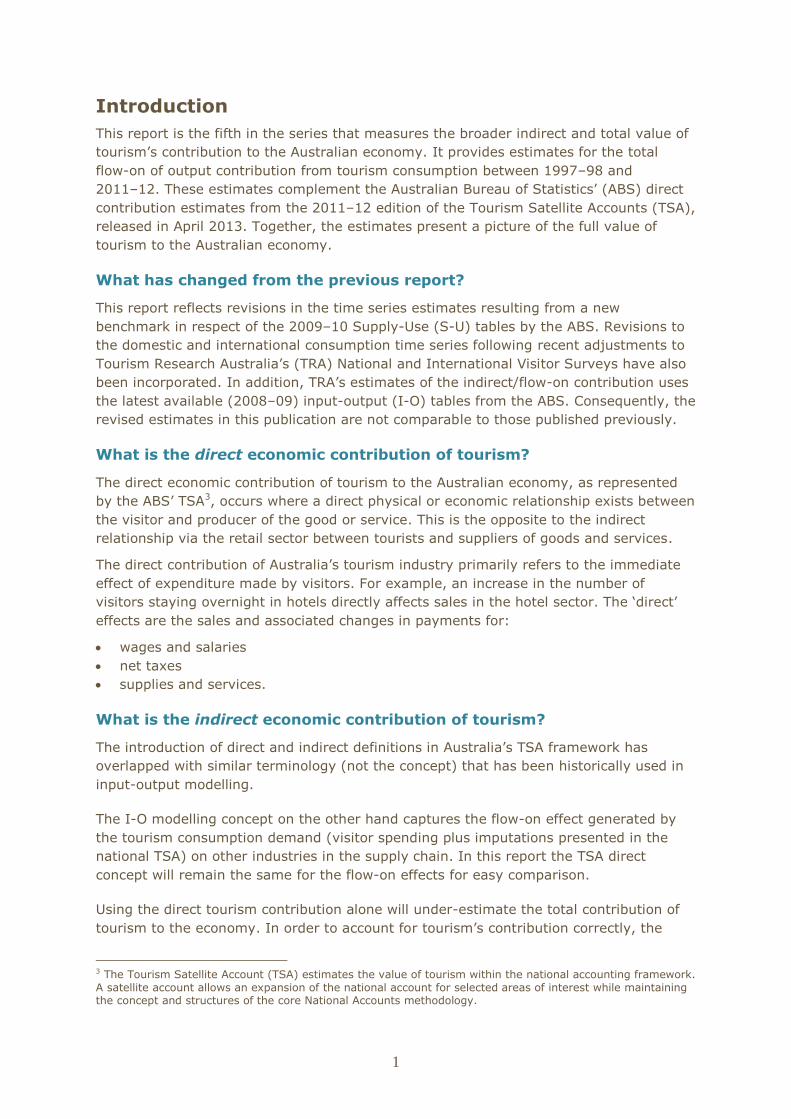
1
Introduction
This report is the fifth in the series that measures the broader indirect and total value of
tourism‘s contribution to the Australian economy. It provides estimates for the total
flow-on of output contribution from tourism consumption between 1997–98 and
2011–12. These estimates complement the Australian Bureau of Statistics‘ (ABS) direct
contribution estimates from the 2011–12 edition of the Tourism Satellite Accounts (TSA),
released in April 2013. Together, the estimates present a picture of the full value of
tourism to the Australian economy.
What has changed from the previous report?
This report reflects revisions in the time series estimates resulting from a new
benchmark in respect of the 2009–10 Supply-Use (S-U) tables by the ABS. Revisions to
the domestic and international consumption time series following recent adjustments to
Tourism Research Australia‘s (TRA) National and International Visitor Surveys have also
been incorporated. In addition, TRA‘s estimates of the indirect/flow-on contribution uses
the latest available (2008–09) input-output (I-O) tables from the ABS. Consequently, the
revised estimates in this publication are not comparable to those published previously.
What is the direct economic contribution of tourism?
The direct economic contribution of tourism to the Australian economy, as represented
by the ABS‘ TSA3, occurs where a direct physical or economic relationship exists between
the visitor and producer of the good or service. This is the opposite to the indirect
relationship via the retail sector between tourists and suppliers of goods and services.
The direct contribution of Australia‘s tourism industry primarily refers to the immediate
effect of expenditure made by visitors. For example, an increase in the number of
visitors staying overnight in hotels directly affects sales in the hotel sector. The ‗direct‘
effects are the sales and associated changes in payments for:
wages and salaries
net taxes
supplies and services.
What is the indirect economic contribution of tourism?
The introduction of direct and indirect definitions in Australia‘s TSA framework has
overlapped with similar terminology (not the concept) that has been historically used in
input-output modelling.
The I-O modelling concept on the other hand captures the flow-on effect generated by
the tourism consumption demand (visitor spending plus imputations presented in the
national TSA) on other industries in the supply chain. In this report the TSA direct
concept will remain the same for the flow-on effects for easy comparison.
Using the direct tourism contribution alone will under-estimate the total contribution of
tourism to the economy. In order to account for tourism‘s contribution correctly, the
3 The Tourism Satellite Account (TSA) estimates the value of tourism within the national accounting framework.
A satellite account allows an expansion of the national account for selected areas of interest while maintaining the concept and structures of the core National Accounts methodology.

2
consumptions of TSA direct and TSA indirect tourism output are combined to calculate
the flow-on effects using the I-O multipliers. The flow-on—or ‗indirect‘ effects—are the
changes in supply that result from spending of the tourism industry‘s receipts on goods
and services from other industries. For example:
A visitor purchases a meal from a hotel:
→ the hotel purchases vegetables and meat from a food supplier
→ the food supplier purchases these from a farming company
→ the farming company ‗purchases‘ labour and transport to deliver the produce to
market.
TRA estimates the economic impact of these indirect effects in order to complement the
direct effects that are reported in the national TSA, and to provide a more complete
picture of the economic contribution of tourism. (Refer to Appendices A and B for detail
on the I-O methodology used in deriving the indirect contribution of tourism on output
and employment.)
What is the total economic contribution of tourism?
The total contribution of tourism to Australia‘s economy is simply the combination of
direct contributions (as published in the ABS‘ TSA) and indirect contributions (TRA
estimates). In this report, the total contribution is presented over a fifteen year period;
1997–98 to 2011–12.
TRA‘s estimates of indirect Gross Value Added (GVA), Gross Domestic Product (GDP) and
employment have added significant value to the ABS‘ TSA. By providing a more
complete picture of the role tourism plays in the economy, policy makers have the
means to effectively gauge the value of tourism, and to use this to inform their decision
making.
Interestingly, Australia and New Zealand are the only countries that produce a full set of
indirect estimates for tourism GVA, GDP and employment. New Zealand‘s (NZ) TSA
(2012) reported that in the year ended March 2012:
Tourism‘s total contribution4 was 8.6 per cent to NZ GDP; NZ$6.2 billion (or 3.3 per
cent) directly and NZ$9.7 billion (or 5.2 per cent) indirectly.
Tourism employed a full-time equivalent of 186,900 employees (or 9.6 per cent of
total employment in New Zealand). Of the total employment, around 119,800 were
employed directly and 67,100 indirectly.
However, international governing bodies are recognising the importance of a TSA. The
United Nations World Tourism Organization (UNWTO) (2010) reported that, ―A total of
60 countries have been identified by early 2010 as having already produced or are
currently developing a TSA exercise‖.
4 Statistics New Zealand (2012), when emphasising the importance of estimating the full impact of tourism, states that, ―Direct value added does not measure the full impact of tourism on the New Zealand economy because it is limited to those businesses that have a direct relationship with tourists. Additional value added comes from tourism through the production of the intermediate inputs used in the production of goods and services sold to tourists, although there is no direct relationship between the producer of the intermediate inputs and the tourist. This additional value added is known as indirect value added‖.

3
Estimates in this report are provided in nominal terms unless stated otherwise, with
results presented in combination with the direct contribution reported in ABS‘ TSA
(2011–12). The analysis provides total contribution estimates for tourism GDP, GVA (by
industry) and employment.
4
Tourism’s contribution to GDP, GVA
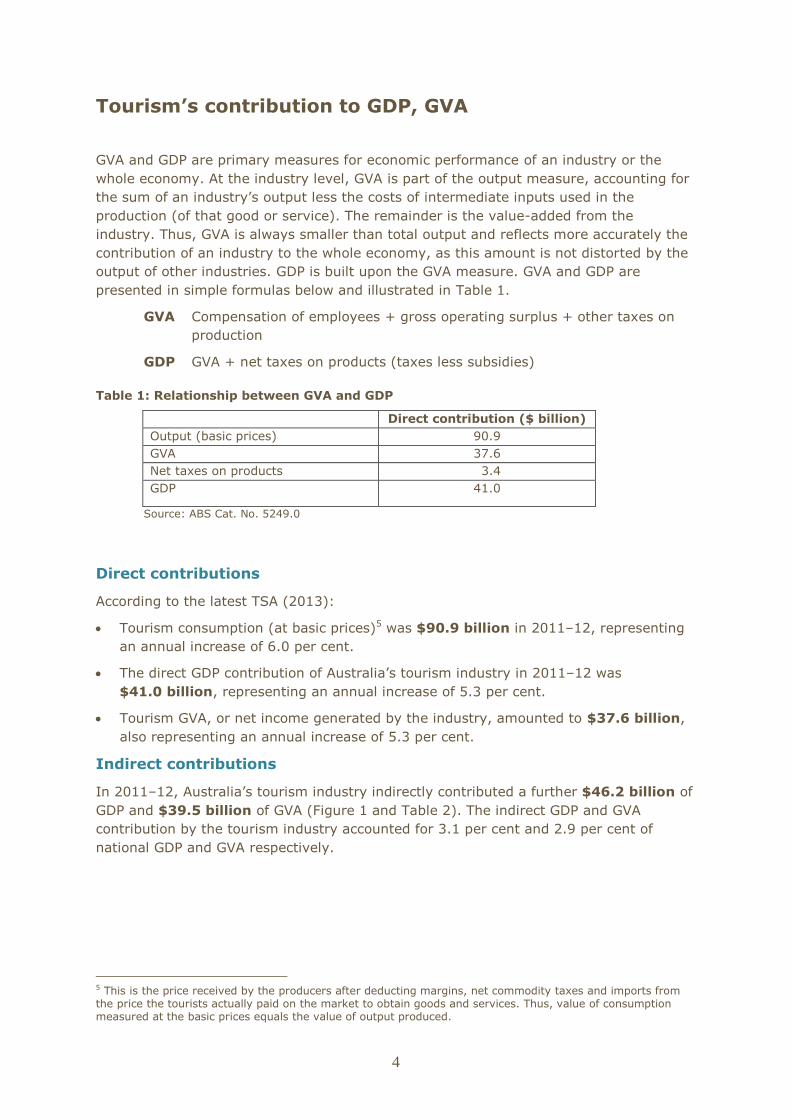
GVA and GDP are primary measures for economic performance of an industry or the
whole economy. At the industry level, GVA is part of the output measure, accounting for
the sum of an industry‘s output less the costs of intermediate inputs used in the
production (of that good or service). The remainder is the value-added from the
industry. Thus, GVA is always smaller than total output and reflects more accurately the
contribution of an industry to the whole economy, as this amount is not distorted by the
output of other industries. GDP is built upon the GVA measure. GVA and GDP are
presented in simple formulas below and illustrated in Table 1.
GVA Compensation of employees + gross operating surplus + other taxes on
production
GDP GVA + net taxes on products (taxes less subsidies)
Table 1: Relationship between GVA and GDP
Direct contribution ($ billion)
Output (basic prices) 90.9
GVA 37.6
Net taxes on products 3.4
GDP 41.0
Source: ABS Cat. No. 5249.0
Direct contributions
According to the latest TSA (2013):
Tourism consumption (at basic prices)5 was $90.9 billion in 2011–12, representing
an annual increase of 6.0 per cent.
The direct GDP contribution of Australia‘s tourism industry in 2011–12 was
$41.0 billion, representing an annual increase of 5.3 per cent.
Tourism GVA, or net income generated by the industry, amounted to $37.6 billion,
also representing an annual increase of 5.3 per cent.
Indirect contributions
In 2011–12, Australia‘s tourism industry indirectly contributed a further $46.2 billion of
GDP and $39.5 billion of GVA (Figure 1 and Table 2). The indirect GDP and GVA
contribution by the tourism industry accounted for 3.1 per cent and 2.9 per cent of
national GDP and GVA respectively.
5 This is the price received by the producers after deducting margins, net commodity taxes and imports from the price the tourists actually paid on the market to obtain goods and services. Thus, value of consumption measured at the basic prices equals the value of output produced.

5
Total contributions
Combining tourism‘s direct and indirect components, a total of $87.3 billion was
contributed to national GDP in 2011–12, up $5.5 billion (or 6.8 per cent) year-on-year.
Figure 1: Direct (a) and indirect (b) share of tourism GVA and GDP
44
45
46
47
48
49
50
51
52
53
54
GVA GDP
Per cent
Direct Indirect
Sources: (a) ABS Cat. No. 5249.0, (b) TRA‘s estimates
Collectively, tourism‘s direct and indirect contributions amounted to around 5.6 per cent
of total GVA. Tourism‘s direct measure contributed around 2.7 per cent, while another
2.9 per cent is estimated to be tourism‘s indirect contribution. When compared to 2000–
2001—when tourism‘s total contribution to Australia‘s GDP peaked at 8.3 per cent—this
represents a decline of 2.7 percentage points. However, the Sydney Olympic Games and
the introduction of the Goods and Services Tax (GST) were influencing factors during this
period.
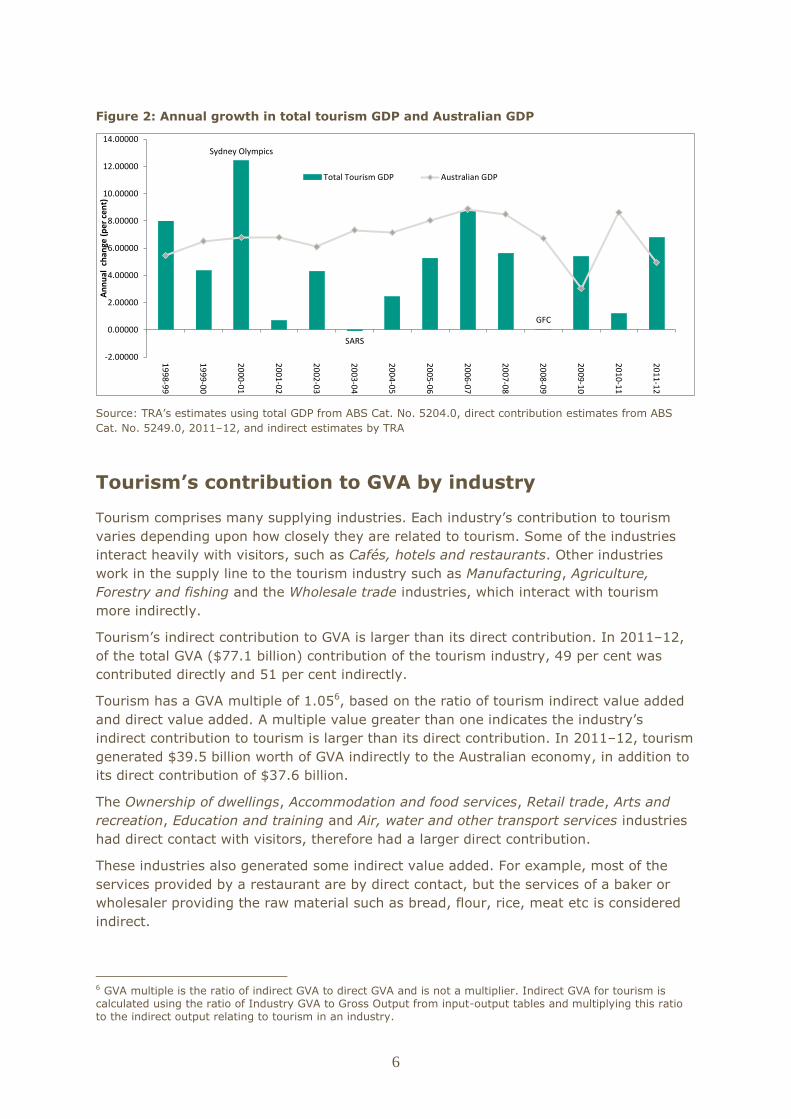
Total tourism GDP has more year-to-year fluctuations than Australian GDP. In 2011–12,
total tourism GDP increased by around 6.8 per cent on the previous year and reflected a
solid recovery after the severe downturn associated with the global financial crisis in
2008–09. Over the longer period between 1997–98 and 2011–12, total tourism GDP has
risen at an average annual rate of 4.6 per cent, while Australian GDP has increased at a
stronger rate, averaging 6.8 per cent annually over the same period (refer Figure 2).
6
Figure 2: Annual growth in total tourism GDP and Australian GDP
Sydney Olympics
SARS
GFC
-2.00000
0.00000
2.00000
4.00000
6.00000
8.00000
10.00000
12.00000
14.00000
19
98
-99
19
99
-00
20
00
-01
20
01
-02
20
02
-03
20
03
-04
20
04
-05
20
05
-06
20
06
-07
20
07
-08
20
08
-09
20
09
-10
20
10
-11
20
11
-12
An
nu
al c
han
ge (
pe
r ce
nt)
Total Tourism GDP Australian GDP
Source: TRA‘s estimates using total GDP from ABS Cat. No. 5204.0, direct contribution estimates from ABS
Cat. No. 5249.0, 2011–12, and indirect estimates by TRA
Tourism’s contribution to GVA by industry
Tourism comprises many supplying industries. Each industry‘s contribution to tourism
varies depending upon how closely they are related to tourism. Some of the industries
interact heavily with visitors, such as Cafés, hotels and restaurants. Other industries
work in the supply line to the tourism industry such as Manufacturing, Agriculture,
Forestry and fishing and the Wholesale trade industries, which interact with tourism
more indirectly.
Tourism‘s indirect contribution to GVA is larger than its direct contribution. In 2011–12,
of the total GVA ($77.1 billion) contribution of the tourism industry, 49 per cent was
contributed directly and 51 per cent indirectly.
Tourism has a GVA multiple of 1.056, based on the ratio of tourism indirect value added
and direct value added. A multiple value greater than one indicates the industry‘s
indirect contribution to tourism is larger than its direct contribution. In 2011–12, tourism
generated $39.5 billion worth of GVA indirectly to the Australian economy, in addition to
its direct contribution of $37.6 billion.
The Ownership of dwellings, Accommodation and food services, Retail trade, Arts and
recreation, Education and training and Air, water and other transport services industries
had direct contact with visitors, therefore had a larger direct contribution.
These industries also generated some indirect value added. For example, most of the
services provided by a restaurant are by direct contact, but the services of a baker or
wholesaler providing the raw material such as bread, flour, rice, meat etc is considered
indirect.
6 GVA multiple is the ratio of indirect GVA to direct GVA and is not a multiplier. Indirect GVA for tourism is calculated using the ratio of Industry GVA to Gross Output from input-output tables and multiplying this ratio to the indirect output relating to tourism in an industry.
7
The following four industries7 collectively contributed more than three quarters of total
direct GVA in 2011–12 (Table 3):
Accommodation and food services – $12.9 billion, or 34 per cent of total GVA
Air, water and other transport services – $6.1 billion, or 16.2 per cent of total GVA
Retail trade – $5.2 billion, or 13.7 per cent of total GVA
Education and training – $2.4 billion, or 6.4 per cent of total GVA.
A large part of the total flow-on effect of visitor consumption was felt in other industries
represented by ‗All other industries’, where more than 90 per cent of total GVA
contribution was indirect.
7 Excluding ownership of dwellings industry

8
Table 2: Tourism GVA by industry, 2011–12
Industry Direct value
added(a)
Indirect
value
added(b)
Indirect value
added multiple
(M)
Total value added=
direct value added*
(1+M)
$ million Ratio $ million
Accommodation and food
services
12,923 503 0.0 13,426
Rail transport 509 164 0.3 673
Road transport and motor
vehicle hire and lease
1,759 3,104 1.8 4,864
Air, water and other
transport
6,079 2,455 0.4 8,534
Travel agency and tour
operator services
1,815 2,782 1.5 4,597
Arts and recreation services 1,566 183 0.1 1,749
Retail trade 5,161 1,266 0.2 6,427
Education and training 2,410 272 0.1 2,682
Ownership of dwellings 3,218 0 0.0 3,218
All other industries 2,181 28,757 13.2 30,938
Total tourism industry 37,621 39,486 1.05 77,107
Sources: (a) ABS Cat. No. 5249.0, and (b) TRA‘s estimates
Indirect GVA in ‘All other industries’
All other industries are a grouping of industries that by nature or activity are not
considered tourism-related, but are nonetheless affected by rises and falls in tourism.
For example, increasing visitor numbers to cafés and restaurants increases demand for
flour from grain processing industries; this in turn increases grain production by the
agricultural industry.
Disaggregation of the $28.8 billion of indirect tourism GVA in All other industries in
2011–12 is presented in Figure 3. More than half (52 per cent) of total tourism GVA in
this category occurred in three industries:
Manufacturing - $5.8 billion
Professional, scientific and technical services - $4.7 billion
Finance and insurance services - $4.5 billion.
Additionally, one-third of total tourism GVA was contributed by:
Agriculture, forestry and fishing - $2.6 billion
Information and telecommunication services - $2.5 billion
Wholesale trade - $2.3 billion
Mining - $2.0 billion.

9
Figure 3: Tourism indirect GVA in All other industries, 2011–12
0 1,000 2,000 3,000 4,000 5,000 6,000 7,000
Manufacturing
Professional, scientific and technical services
Finance and insurance
Agriculture, forestry and fishing
Information and telecommunication services
Wholesale trade
Mining
Construction
Electricity, gas, water and waste water
Other services
Public administration and safety
Health care and social assistance
Indirect GVA ($ million)
Source: TRA‘s estimates
Growth in total tourism GVA, by industry
Total tourism industry GVA grew at an average annual rate of 4.2 per cent between
1997–98 and 2011–12, compared to 6.9 per cent average annual growth in the whole
economy (Figure 4). In Australia, two industries (Mining and Professional, scientific and
technical services) grew at double digit rates (12.9 and 10.0 per cent, respectively)
between 1997–98 and 2011–12. Together, these industries constituted 17.4 per cent of
total GVA in Australia.
Among tourism industries, only the Education and training industry achieved an average
annual GVA growth of 8.8 per cent. However, this industry represented only a minor
share (3.5 per cent) of total tourism GVA in 2011–12.
A little more than one-third (36 per cent) of tourism‘s total GVA was shared among two
main industries in 2011–12:
Accommodation and food services - 17.4 per cent
Transport, postal and warehousing - 18.2 per cent.
These industries achieved average annual tourism GVA growth of 5.6 per cent and
4.6 per cent, respectively. These rates were much lower than the growth rates achieved
by these industries at total GVA levels. Growth in total GVA for Accommodation and food
services and Transport, postal and warehousing was 6.3 per cent each, indicating that
the non-tourism component showed much stronger growth than the tourism component
of each industry.

10
Figure 4: Average annual growth in GVA, tourism and all industries, 1997–98 to 2011–12
-2.00
0.00
2.00
4.00
6.00
8.00
10.00
12.00
14.00
Agricu
lture, fo
restry and
fishin
g
Min
ing
Man
ufactu
ring
Electricity, gas, water an
d w
aste services
Co
nstru
ction
Wh
olesale
trade
Re
tail trade
Acco
mm
od
ation
and
foo
d services
Transp
ort, p
ostal an
d w
areh
ou
sing
Info
rmatio
n m
edia an
d te
lecom
mu
nicatio
ns
Finan
cial and
insu
rance service
s
Re
ntal, h
iring an
d re
al estate services
Pro
fessio
nal, scien
tific and
techn
ical services
Ad
min
istrative and
sup
po
rt services
Pu
blic ad
min
istration
and
safety
Edu
cation
and
trainin
g
Health
care an
d so
cial assistance
Arts an
d recreatio
n se
rvices
Oth
er services
Ow
nersh
ip o
f dw
ellings
Total G
ross V
alue
Ad
de
d
Ave
rage
an
nu
al g
row
th r
ate
(p
er
cen
t)
Industry Gross Value Added (tourism and non tourism)
Industry Gross Value Added (total tourism)
Sources: Derived by TRA using total GVA and direct contribution estimates from ABS Cat. No. 5249.0,
2011–12, and indirect estimates by TRA
Industry share of total tourism GVA
Over the period 1997–98 to 2011–12, industry share in total tourism GVA varied. This
depended on changes in visitor types and numbers, and the price and quantity of
tourism products and services demanded (Table 4). For example:
The share of the Accommodation and food services industry has increased 2.9
percentage points (from 14.5 per cent in 1997–98 to 17.4 per cent in 2011–12);
largely due to an increase in visitor numbers.
o Between 2000–01 and 2011–12, inbound visitor nights increased 5.1 per cent
annually (Tourism Forecasting Committee 2013, Issue 1).
The Education and training industry increased its share of tourism GVA from 1.9 per
cent in 1997–98 to 3.5 per cent in 2011–12, due to an increase in short-term student
visitors to Australia in recent years.
o Short-term visitor arrivals for education8 to Australia rose at an average annual
rate of 7.2 per cent between 1997–98 and 2011–12.
The share of total tourism GVA in all other industries remained more or less unchanged
during this period.
8 Compiled from Overseas Arrivals and Departures publication (ABS Cat. No 3401.0) March 2013 database

11
Table 3: Industry share in total tourism GVA (%)
Tourism industries 1997/
98
1998/
99
1999/
00
2000/
01
2001/
02
2002/
03
2003/
04
2004/
05
2005/
06
2006/
07
2007/
08
2008/
09
2009/
10
2010/
11
2011/
12
Agriculture, forestry and fishing 4.0 4.1 4.1 4.1 4.1 4.0 4.0 3.8 3.7 3.8 3.6 3.5 3.4 3.3 3.4
Mining 2.8 2.8 2.8 3.1 3.0 2.9 2.7 2.6 2.5 2.9 2.7 2.7 2.5 2.5 2.6
Manufacturing 8.5 8.6 8.5 8.4 8.4 8.3 8.2 8.2 8.1 8.1 7.9 7.7 7.6 7.6 7.5
Electricity, gas, water and
waste services
1.7 1.7 1.7 1.7 1.7 1.7 1.7 1.6 1.6 1.6 1.6 1.6 1.5 1.5 1.5
Construction 2.0 2.0 2.0 2.0 2.0 2.0 1.9 1.9 1.9 1.9 1.9 1.9 1.8 1.8 1.8
Wholesale trade 3.4 3.5 3.4 3.4 3.4 3.3 3.3 3.3 3.2 3.2 3.2 3.1 3.0 3.0 3.1
Retail trade 8.3 8.1 8.4 8.6 8.5 8.4 8.4 8.8 9.0 9.1 8.9 8.7 8.4 8.5 8.3
Accommodation and food
services
14.5 15.1 14.8 14.6 15.1 15.2 15.2 15.4 15.4 15.3 16.2 16.7 16.9 17.2 17.4
Transport, postal and
warehousing
15.1 15.0 15.0 15.3 15.1 15.7 15.5 15.6 16.1 16.1 16.0 15.7 15.9 15.8 15.8
Information media and
telecommunications
4.9 4.8 4.8 4.6 4.5 4.5 4.5 4.3 4.1 4.0 4.0 4.0 4.0 4.0 3.9
Financial and insurance
services
6.3 6.3 6.3 6.3 6.2 6.1 6.1 6.1 6.0 6.0 5.9 5.9 5.9 5.8 5.9
Rental, hiring and real estate
services(c)
6.1 6.1 6.2 6.1 6.2 6.1 6.2 6.5 6.5 6.5 6.7 7.1 7.3 7.4 7.5
Professional, scientific and
technical services
7.0 6.9 6.9 6.9 6.8 6.7 6.7 6.6 6.6 6.5 6.4 6.3 6.2 6.1 6.1
Administrative and support
services
6.7 6.5 6.4 6.1 6.3 6.2 6.2 6.2 6.3 6.2 6.2 6.1 6.0 6.0 6.2
Public administration and
safety
0.8 0.8 0.8 0.8 0.7 0.7 0.7 0.7 0.7 0.7 0.7 0.7 0.7 0.7 0.7
Education and training 1.9 2.0 2.1 2.4 2.8 2.7 3.1 3.2 3.1 3.1 3.2 3.7 3.7 3.7 3.5
Health care and social
assistance
1.6 1.4 1.4 1.2 1.2 1.2 1.2 1.0 0.8 0.8 0.8 0.8 0.9 0.9 0.8
Arts and recreation services 2.3 2.3 2.2 2.3 2.2 2.2 2.4 2.4 2.4 2.3 2.2 2.3 2.3 2.3 2.3
Other services 2.2 2.1 2.1 2.1 2.0 2.0 2.0 1.9 1.8 1.8 1.8 1.8 1.8 1.8 1.7

12
Total tourism GVA (direct(a)
and indirect(b))
100 100 100 100 100 100 100 100 100 100 100 100 100 100 100
Sources: (a) ABS Cat. No. 5249.0, and (b) TRA‘s estimates, (c) Renting, hiring and real estate services also includes Ownership of dwellings

13
Tourism’s contribution to employment
TRA estimates that tourism directly and indirectly employed an estimated 908,434
persons in 2011–12 (or 7.9 per cent of total employment in Australia), comprising:
531,900 persons (or 4.6 per cent of the Australian workforce) employed directly; one
percentage point lower when compared to 2010–11.
376,534 persons (or 3.3 per cent) employed indirectly.
Fifty nine per cent of total tourism employment was provided directly and the rest
(41 per cent) indirectly (Figure 3 and Table 2).
Tourism‘s share of total employment (7.9 per cent) was higher than tourism‘s share of
industry GVA (5.6 per cent), because tourism is more labour intensive than many other
industries9.
In 2011–12, total tourism employment rose around 25,120 (2.8 per cent), with
increased employment of 1,600 (0.3 per cent) in directly tourism-related industries and
23,520 (6.7 per cent) in industries related indirectly to tourism. Total tourism
employment increased at an average annual rate of 2.8 per cent between 1997–98 and
2011–12; faster than the growth in direct tourism employment of 1.8 per cent over the
same period.
Figure 5: Direct and indirect share of tourism employment
0
10
20
30
40
50
60
70
Employment
Pe
r ce
nt
Direct Indirect
Sources: (a) ABS Cat. No. 5249.0, (b) TRA‘s estimates
9 A business is labour intensive if labour accounts for the largest proportion of all inputs to the business
outputs.
14
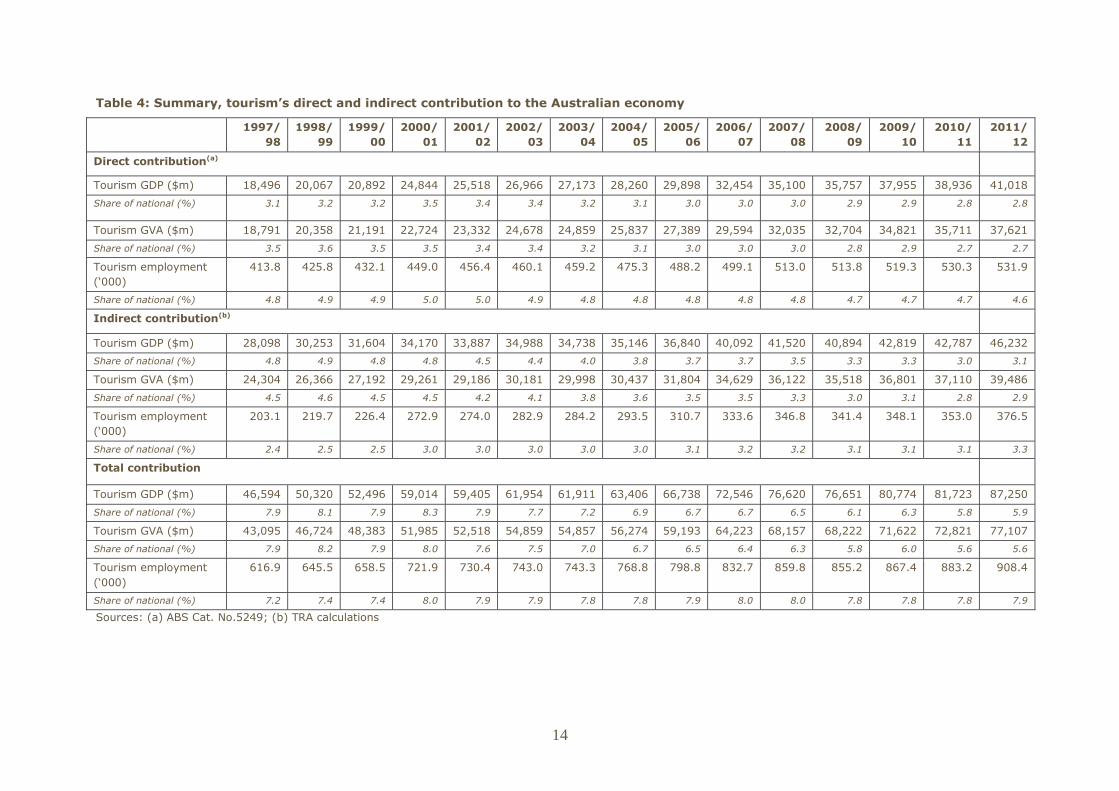
Table 4: Summary, tourism’s direct and indirect contribution to the Australian economy
1997/
98
1998/
99
1999/
00
2000/
01
2001/
02
2002/
03
2003/
04
2004/
05
2005/
06
2006/
07
2007/
08
2008/
09
2009/
10
2010/
11
2011/
12
Direct contribution(a)
Tourism GDP ($m) 18,496 20,067 20,892 24,844 25,518 26,966 27,173 28,260 29,898 32,454 35,100 35,757 37,955 38,936 41,018
Share of national (%) 3.1 3.2 3.2 3.5 3.4 3.4 3.2 3.1 3.0 3.0 3.0 2.9 2.9 2.8 2.8
Tourism GVA ($m) 18,791 20,358 21,191 22,724 23,332 24,678 24,859 25,837 27,389 29,594 32,035 32,704 34,821 35,711 37,621
Share of national (%) 3.5 3.6 3.5 3.5 3.4 3.4 3.2 3.1 3.0 3.0 3.0 2.8 2.9 2.7 2.7
Tourism employment
(‗000)
413.8 425.8 432.1 449.0 456.4 460.1 459.2 475.3 488.2 499.1 513.0 513.8 519.3 530.3 531.9
Share of national (%) 4.8 4.9 4.9 5.0 5.0 4.9 4.8 4.8 4.8 4.8 4.8 4.7 4.7 4.7 4.6
Indirect contribution(b)
Tourism GDP ($m) 28,098 30,253 31,604 34,170 33,887 34,988 34,738 35,146 36,840 40,092 41,520 40,894 42,819 42,787 46,232
Share of national (%) 4.8 4.9 4.8 4.8 4.5 4.4 4.0 3.8 3.7 3.7 3.5 3.3 3.3 3.0 3.1
Tourism GVA ($m) 24,304 26,366 27,192 29,261 29,186 30,181 29,998 30,437 31,804 34,629 36,122 35,518 36,801 37,110 39,486
Share of national (%) 4.5 4.6 4.5 4.5 4.2 4.1 3.8 3.6 3.5 3.5 3.3 3.0 3.1 2.8 2.9
Tourism employment
(‗000)
203.1 219.7 226.4 272.9 274.0 282.9 284.2 293.5 310.7 333.6 346.8 341.4 348.1 353.0 376.5
Share of national (%) 2.4 2.5 2.5 3.0 3.0 3.0 3.0 3.0 3.1 3.2 3.2 3.1 3.1 3.1 3.3
Total contribution
Tourism GDP ($m) 46,594 50,320 52,496 59,014 59,405 61,954 61,911 63,406 66,738 72,546 76,620 76,651 80,774 81,723 87,250
Share of national (%) 7.9 8.1 7.9 8.3 7.9 7.7 7.2 6.9 6.7 6.7 6.5 6.1 6.3 5.8 5.9
Tourism GVA ($m) 43,095 46,724 48,383 51,985 52,518 54,859 54,857 56,274 59,193 64,223 68,157 68,222 71,622 72,821 77,107
Share of national (%) 7.9 8.2 7.9 8.0 7.6 7.5 7.0 6.7 6.5 6.4 6.3 5.8 6.0 5.6 5.6
Tourism employment
(‗000)
616.9 645.5 658.5 721.9 730.4 743.0 743.3 768.8 798.8 832.7 859.8 855.2 867.4 883.2 908.4
Share of national (%) 7.2 7.4 7.4 8.0 7.9 7.9 7.8 7.8 7.9 8.0 8.0 7.8 7.8 7.8 7.9
Sources: (a) ABS Cat. No.5249; (b) TRA calculations
15
Tourism employment by industry
Applying a strict definition for tourism employment is problematic as employees in
tourism-related industries generally provide services to both visitors and non-visitors.
To overcome this, the TSA provides estimates for tourism employment by applying
tourism GVA ratios from the benchmark year to ABS Labour Force Survey estimates for
tourism-related industries. By applying this method, the TSA reports that the tourism
industry directly employed 531,900 persons in 2011–12.
Tourism‘s total contribution to the Australian labour force is estimated at 908,360
persons for 2011–12 (with 376,534 persons indirectly linked to the tourism value chain,
Table 5). While All other industries comprised a majority of indirect total tourism-related
employment (91 per cent, or 246,100 persons), the following industries had a higher
direct component:
Accommodation and food services: 95 per cent (or 242,800 persons) of total tourism
employment in the industry in 2011–12.
Education and training: 90 per cent (or 36,600 persons)
Arts and recreation: 91 per cent (or 35,300 persons)
Retail trade: 79 per cent (or 101,000 persons).
Six industries collectively accounted for 70 per cent of total tourism employment:
Accommodation, cafés and restaurants - 255,600 (28 per cent of total)
Retail trade - 127,400 employees (14.0 per cent of total)
Air and water transport plus road and rail transport - 110,100 (12.1 per cent of total)
Travel agency and tour operator services - 66,000 (7.3 per cent of total)
Education and training - 40,700 (4.5 per cent of total)
Arts and recreation services - 38,900 (4.3 per cent of total).
The remaining 30 per cent (or 269,800) of total tourism employment was generated in
All other industries.

16
Table 5: Direct and indirect employment by tourism industries, 2011–12
Direct
employment(a)
(a)
Indirect
employment(b)
(b)
Tourism indirect
employment
multiple
(b)/(a) = (c)
Total tourism
employment =
direct
employment*(1+
E)
‗000 Ratio ‗000
Accommodation and food
services
242.8 12.8 0.1 255.6
Rail transport 3.3 1.2 0.4 4.5
Road transport and motor
vehicle hiring
19.1 28.9 1.5 48.0
Air, water and other
transport
37.7 19.8 0.5 57.5
Travel agency and tour
operator services
32.4 33.6 1.0 66.0
Arts and recreation
services
35.3 3.6 0.1 38.9
Retail trade 101.0 26.4 0.3 127.4
Education and training 36.6 4.1 0.1 40.7
All other industries 23.7 246.1 10.4 269.8
Total tourism
employment
531.9 376.5 0.7 908.4
Sources: (a) ABS Cat. No. 5249.0, and (b) TRA‘s estimates
Growth in the contribution of main tourism industries to total tourism employment has
been mixed (Figure 5 and Table 6). Total tourism employment added 291,800 persons
(118,300 directly and 173,500 indirectly) to the Australian workforce between 1997–98
and 2011–12, with the following industries also showing growth during this period:
Accommodation and food services added around 56,800 persons (52,000 persons
employed directly and 4,800 indirectly)
Retail trade added 29,200 persons (19,100 persons employed directly and 10,100
persons indirectly)
Travel agency and tour operator services added 21,300 persons (7,800 persons
directly and 13,500 persons indirectly).
During this period, employment in the tourism industry grew at an average annual rate
of 2.8 per cent; higher than the 2.1 per cent for total employment in the economy.

17
Figure 6: Direct(a) and indirect(b) employment growth in the tourism industry, 1997–98 to 2011–12, (‘000)
0
50
100
150
200
Acco
mm
od
ation
and
foo
d services
Rail tran
spo
rt
Ro
ad tran
spo
rtan
d m
oto
r veh
icleh
iring
Air, w
ater and
oth
er transp
ort
Travel agency an
dto
ur o
perato
rservices
Arts an
drecreatio
nservices
Retail trad
e
Edu
cation
and
trainin
g
All o
ther
ind
ustrie
s
Total
Emp
loye
d p
erso
ns
(00
0)
Direct Indirect
Sources: (a) ABS Cat. No. 5249.0, and (b) TRA‘s estimates

18
Table 6: Total (direct (a) and indirect (b)) employment in tourism (‘000 persons)
1997
/98
1998/
99
1999/
00
2000/
01
2001/
02
2002/
03
2003/
04
2004/
05
2005/
06
2006/
07
2007/
08
2008/
09
2009/
10
2010/
11
2011/
12
Accommodation and
food services
198.8 204.1 209.7 221.6 224.8 224.2 220.2 227.2 226.1 231.1 236.9 241.1 253.7 258.9 255.6
Rail transport 3.5 3.4 3.0 3.3 3.0 3.3 3.5 3.4 3.7 3.5 3.5 4.7 4.7 4.8 4.5
Road transport and
motor vehicle hiring
36.4 38.2 38.4 40.4 41.3 41.8 43.3 41.5 42.4 45.1 47.0 47.2 46.3 46.0 48.0
Air, water and other
transport
43.8 45.3 46.7 50.6 48.8 47.2 47.1 48.6 51.8 52.2 53.3 53.3 51.5 53.2 57.5
Travel agency and
tour operator services
44.7 47.0 46.1 46.9 46.8 46.0 46.2 48.9 52.5 55.9 61.7 58.1 62.5 62.8 66.0
Arts and recreation
services
23.2 24.4 24.8 25.6 27.1 28.1 29.0 31.4 34.6 35.8 36.8 37.9 36.9 37.5 38.9
Retail trade 98.2 102.6 104.0 105.8 109.1 116.1 115.7 123.0 128.4 134.5 135.7 130.5 124.2 127.4 127.4
Education and
training
27.1 28.2 28.6 29.2 30.2 31.3 32.7 31.2 32.7 32.4 35.3 36.8 38.9 40.3 40.7
All other industries 140.9 152.2 157.1 198.7 199.3 205.1 205.6 213.6 226.5 242.1 249.5 245.5 248.7 252.5 269.8
Total 616.7 645.5 658.5 722.0 730.5 743.1 743.3 768.7 798.7 832.6 859.7 855.1 867.5 883.5 908.4
Sources: (a) ABS Cat. No. 5249.0, and (b) TRA‘s estimates
19
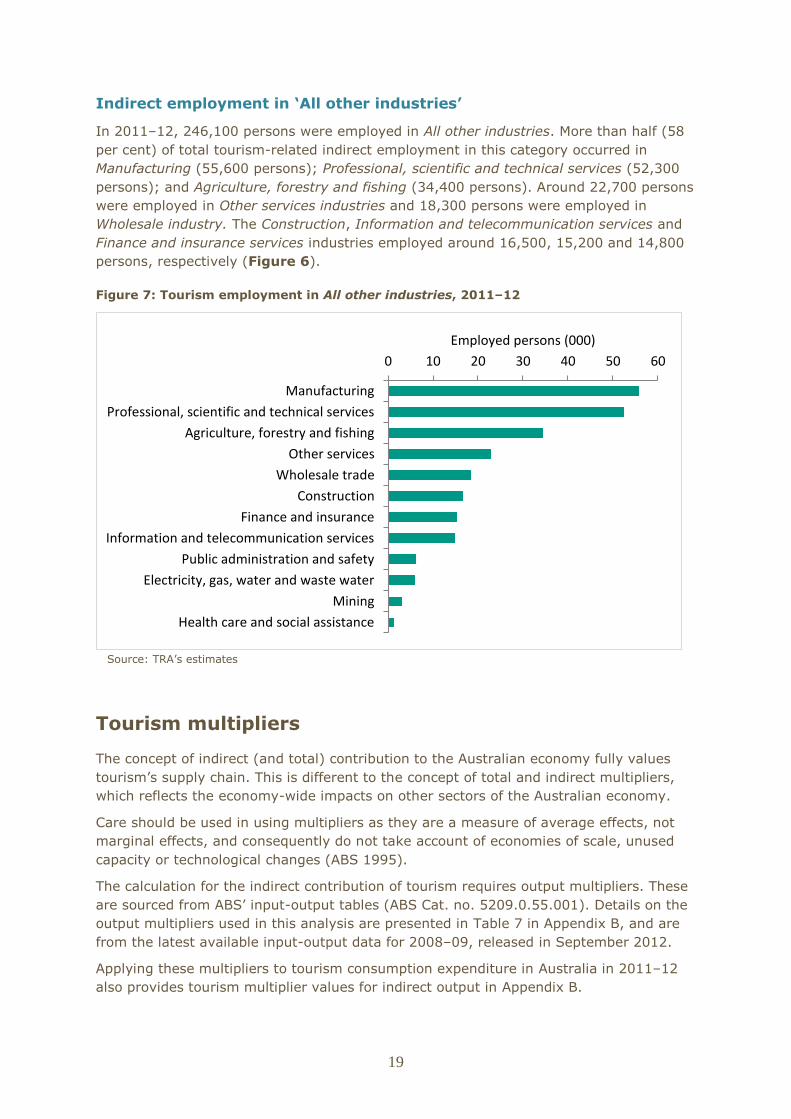
Indirect employment in ‘All other industries’
In 2011–12, 246,100 persons were employed in All other industries. More than half (58
per cent) of total tourism-related indirect employment in this category occurred in
Manufacturing (55,600 persons); Professional, scientific and technical services (52,300
persons); and Agriculture, forestry and fishing (34,400 persons). Around 22,700 persons
were employed in Other services industries and 18,300 persons were employed in
Wholesale industry. The Construction, Information and telecommunication services and
Finance and insurance services industries employed around 16,500, 15,200 and 14,800
persons, respectively (Figure 6).
Figure 7: Tourism employment in All other industries, 2011–12
0 10 20 30 40 50 60
Manufacturing
Professional, scientific and technical services
Agriculture, forestry and fishing
Other services
Wholesale trade
Construction
Finance and insurance
Information and telecommunication services
Public administration and safety
Electricity, gas, water and waste water
Mining
Health care and social assistance
Employed persons (000)
Source: TRA‘s estimates
Tourism multipliers
The concept of indirect (and total) contribution to the Australian economy fully values
tourism‘s supply chain. This is different to the concept of total and indirect multipliers,
which reflects the economy-wide impacts on other sectors of the Australian economy.
Care should be used in using multipliers as they are a measure of average effects, not
marginal effects, and consequently do not take account of economies of scale, unused
capacity or technological changes (ABS 1995).
The calculation for the indirect contribution of tourism requires output multipliers. These
are sourced from ABS‘ input-output tables (ABS Cat. no. 5209.0.55.001). Details on the
output multipliers used in this analysis are presented in Table 7 in Appendix B, and are
from the latest available input-output data for 2008–09, released in September 2012.
Applying these multipliers to tourism consumption expenditure in Australia in 2011–12
also provides tourism multiplier values for indirect output in Appendix B.
20
Using this methodology, tourism‘s output multiplier for 2011–12 is valued at 1.8810,
which means for every dollar tourism earns directly in the Australian economy, it value
adds an additional 88 cents to other parts of the economy. At 1.88, tourism‘s multiplier
is larger than Mining (1.62), Retail trade (1.74) and Education and training (1.44).
When applying both multipliers, a one per cent increase of tourism direct consumption
expenditure of $91 billion ($910 million or one per cent of total) in 2011–12, generated
an output of $814 million (in nominal terms) outside tourism and increased employment
of 2,871 persons outside tourism.
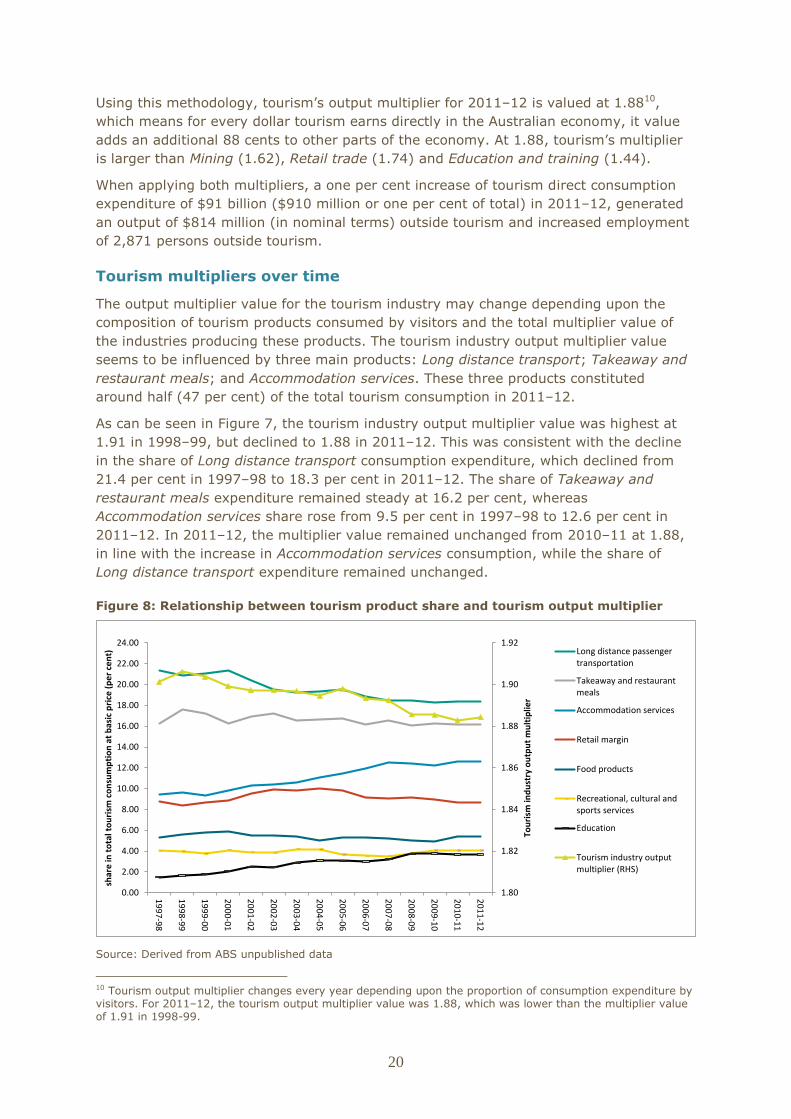
Tourism multipliers over time
The output multiplier value for the tourism industry may change depending upon the
composition of tourism products consumed by visitors and the total multiplier value of
the industries producing these products. The tourism industry output multiplier value
seems to be influenced by three main products: Long distance transport; Takeaway and
restaurant meals; and Accommodation services. These three products constituted
around half (47 per cent) of the total tourism consumption in 2011–12.
As can be seen in Figure 7, the tourism industry output multiplier value was highest at
1.91 in 1998–99, but declined to 1.88 in 2011–12. This was consistent with the decline
in the share of Long distance transport consumption expenditure, which declined from
21.4 per cent in 1997–98 to 18.3 per cent in 2011–12. The share of Takeaway and
restaurant meals expenditure remained steady at 16.2 per cent, whereas
Accommodation services share rose from 9.5 per cent in 1997–98 to 12.6 per cent in
2011–12. In 2011–12, the multiplier value remained unchanged from 2010–11 at 1.88,
in line with the increase in Accommodation services consumption, while the share of
Long distance transport expenditure remained unchanged.
Figure 8: Relationship between tourism product share and tourism output multiplier
1.80
1.82
1.84
1.86
1.88
1.90
1.92
0.00
2.00
4.00
6.00
8.00
10.00
12.00
14.00
16.00
18.00
20.00
22.00
24.001
99
7-9
8
19
98
-99
19
99
-00
20
00
-01
20
01
-02
20
02
-03
20
03
-04
20
04
-05
20
05
-06
20
06
-07
20
07
-08
20
08
-09
20
09
-10
20
10
-11
20
11
-12
Tou
rism
ind
ust
ry o
utp
ut
mu
ltip
lier
shar
e in
to
tal t
ou
rism
co
nsu
mp
tio
n a
t b
asic
pri
ce (
pe
r ce
nt) Long distance passenger
transportation
Takeaway and restaurantmeals
Accommodation services
Retail margin
Food products
Recreational, cultural andsports services
Education
Tourism industry outputmultiplier (RHS)
Source: Derived from ABS unpublished data
10 Tourism output multiplier changes every year depending upon the proportion of consumption expenditure by visitors. For 2011–12, the tourism output multiplier value was 1.88, which was lower than the multiplier value of 1.91 in 1998-99.
21
Conclusion
This report provides estimates of the total contribution of tourism to Australian GDP,
GVA and employment for the period 1997–98 to 2011–12. The results presented reflect
revised indirect tourism contribution estimates published by the ABS, and revisions to
TRA‘s National Visitor Survey and International Visitor Survey data. The report highlights
tourism‘s role in Australia‘s economic growth and its performance as compared to other
industries.
The report confirms that:
Tourism is a critical component of the Australian economy, contributing around
6.0 per cent to national GVA and GDP, and 8.0 per cent to total employment.
Tourism‘s indirect contribution to the economy is higher than some other industries
including the Mining and Retail trade industries. The benefits of the tourism industry
are far reaching, and significant for the economic growth of all sectors within
Australia.
Tourism‘s contribution to the Australian labour force is larger than that of the Mining
industry. This shows that while Mining is important for Australia‘s economic growth,
tourism is crucial—not only for economic growth, but also for Australia‘s social
growth.
Despite its significant contribution to the economy, the tourism industry is at a
disadvantage in terms of investment and innovation when compared with other
industries, in particular Mining. For the tourism industry to achieve its potential, it is
important that increased investment flows to areas such as innovation. This will allow
improved productivity and smooth possible imbalances in the various industries that
comprise ‗tourism‘.
22
References
Access Economics (2011, completed 2010), The 2020 tourism industry stretch goal
(now called the 2020 Tourism Industry Potential), implications and imperatives,
consultancy report for the Department of Resources, Energy and Tourism, Access
Economics, Canberra (unpublished report).
Australian Bureau of Statistics (ABS) 2013, Australian National Accounts, Tourism
Satellite Accounts, 2011–12, Cat. No. 5249.0, ABS, Canberra.
ABS 2013, Overseas Arrivals and Departures, Cat. No. 3401.0, ABS, Canberra.
ABS (1995), Information Paper: Australian National Accounts – Introduction to Input-
Output Multipliers, Cat. No. 5246.0, ABS, Canberra.
Statistics New Zealand (2012), Tourism Satellite Account: 2012, Wellington: Statistics
New Zealand
Tourism Research Australia (2013), Travel by Australians – June 2012 Quarterly Results
of the National Visitor Survey, Tourism Research Australia, Canberra.
Tourism Forecasting Committee, Forecast 2013 Issue 1, Tourism Research Australia,
Canberra.
United Nations Statistical Division, Statistical Office of the European Communities,
Organisation for Economic Co-operation and Development, World Tourism Organization,
Tourism Satellite Account: Recommended Methodological Framework, 2008, Luxemburg,
Madrid, New York, Paris: United Nations.
United Nations World Tourism Organization 2010, TSA Data Around The World –
Worldwide Summary, Statistics and Tourism Satellite Account Programme, June,
UNWTO, Madrid.
23
Appendix A: Methodology for calculating indirect
contribution
The indirect contribution model developed and implemented by TRA uses relationships
derived from the latest available input-output (I-O) table for 2008–09 from the ABS. The
model assumes that from 1997–98 to 2011–12, the industry structure of the Australian
economy remained consistent with 2008–09 input-output tables.
This also means that the model produces estimates based on the supply and demand
relationships generated by the 2008–09 input-output tables. It does not take into
account any year-to-year variation in supply and demand ratios. This assumption holds
in terms of recently revised supply-use tables for the whole time-series based on
Australian and New Zealand Standard Industrial Classification 2006 (ANZSIC 2006).
Direct and indirect effects are measured in terms of three key economic indicators:
tourism GDP, tourism GVA and tourism employment. It is difficult to directly measure
employment in tourism because employees in tourism-related industries generally
provide services to both visitors and non-visitors. The TSA measures direct tourism
employment by applying the tourism GVA ratio in the benchmark year to the ABS Labour
Force Survey estimates for tourism-related industries in subsequent years.
This method assumes that the employment generated by tourism is directly proportional
to the ‗value added‘ generated by tourism in the benchmark year. While this might not
be strictly accurate, the method provides a way of apportioning total industry
employment between servicing demands of visitors and non-visitors.
Tourism industry GVA ratios are used for generating employment estimates for the
subsequent years until a new benchmark is produced using revised estimates in terms of
supply-use tables, service industry surveys and other new information. Employment
estimates presented in this report are based on the 2009–10 benchmark year.
The model
The Australian TSA measures the direct effects of tourism activity. This is the activity of
those businesses which directly supply a product to a visitor (tourist). For example, it
includes a hotel providing accommodation to a visitor, or a retailer selling a souvenir to a
visitor. When a visitor buys a meal in a restaurant, the direct tourism demand is the
price of the meal.
However, it does not include the indirect effects of tourism, which is of considerable
interest. These are the up-stream effects of tourism demand on businesses which
provide goods and services to the tourism industry. The indirect tourism demand
generated from the supply of a meal to a visitor, for example, begins with the production
of intermediate inputs used by the restaurant (e.g. the production of meat and
vegetables used to make the meal, electricity for cooking etc). Producers of these inputs
have no direct relationship with the visitor.
Indirect tourism demand is calculated through input-output analysis. This analysis
provides a breakdown of the supply and demand of commodities in the Australian
economy.
Input-output is based on a fundamental identity which equates supply and demand as
follows:
Let, in a simple production function form, tij = Ati + fi
24
where: t = total outputs of industry sectors
A= inter-industry coefficients
f = final demand for outputs of the industry sectors
Solving the input-output model:
t = At + f
t – At = f
(I-A) t = f
t = (I-A)-1 f
where (I-A)-1, is the Leontief inverse, or input-output inverse/multiplier.
TRA uses the following mathematical relationships to estimate indirect tourism
contribution:
Indirect output = [(I-A) -1 - I] F
Indirect employment = E [(I-A) -1 - I] F
A = a matrix (coefficient) derived from the I-O table. This table contains data on the flow
of goods and services in the economy (e.g. who buys what, and who produces what)
I = Identity matrix (ones in the diagonal and zeros elsewhere)
(I-A) = matrix calculated by subtracting the coefficient matrix (A) from the identity
matrix (I)
(I-A) -1 = An inverse matrix showing by what factor (row) industry sells goods and
services to (column) industry because of change in final demand
F = Tourism consumption at basic prices
E = Employment/output ratios
The model uses input coefficients generated by econometric equations that predict input
purchases based on an economy‘s characteristics. Output from the model includes total
industry output, employment, and value-added for all industries in the Australian
economy. Total industry output is defined as the value of production by industry per
year. Employment represents total wages and salaried employees for both full-time and
part-time workers.
Total value added is defined as:
all income paid to workers by employers
self-employed income
interests
rents
royalties
dividends
profit payments
excise and sales taxes paid by individuals to businesses.
25
Appendix B: Input-output multipliers and tourism
multipliers
Input-output multipliers:
The introduction of direct and indirect definitions in TSA has overlapped with a similar
terminology (not the concept) that has been used historically in the input-output
modelling technique. In the I-O modelling concept, direct contribution is the initial
consumption demanded in the economy. The indirect contribution is the total flow-on
effect on industries providing intermediate inputs to the industry supplying goods and
services to the initial consumption.
In order to account for tourism contribution correctly, the consumptions of TSA Direct
and are combined to calculate the flow-on effects using the I-O multipliers. As
mentioned, this report adopts and reports the TSA Direct tourism contribution as those
in the national TSA, the contribution of the TSA Indirect contribution is then combined
with the flow-on effect of tourism contribution in this report for the reporting purposes.
Charts 8 and 9 summarise our process.
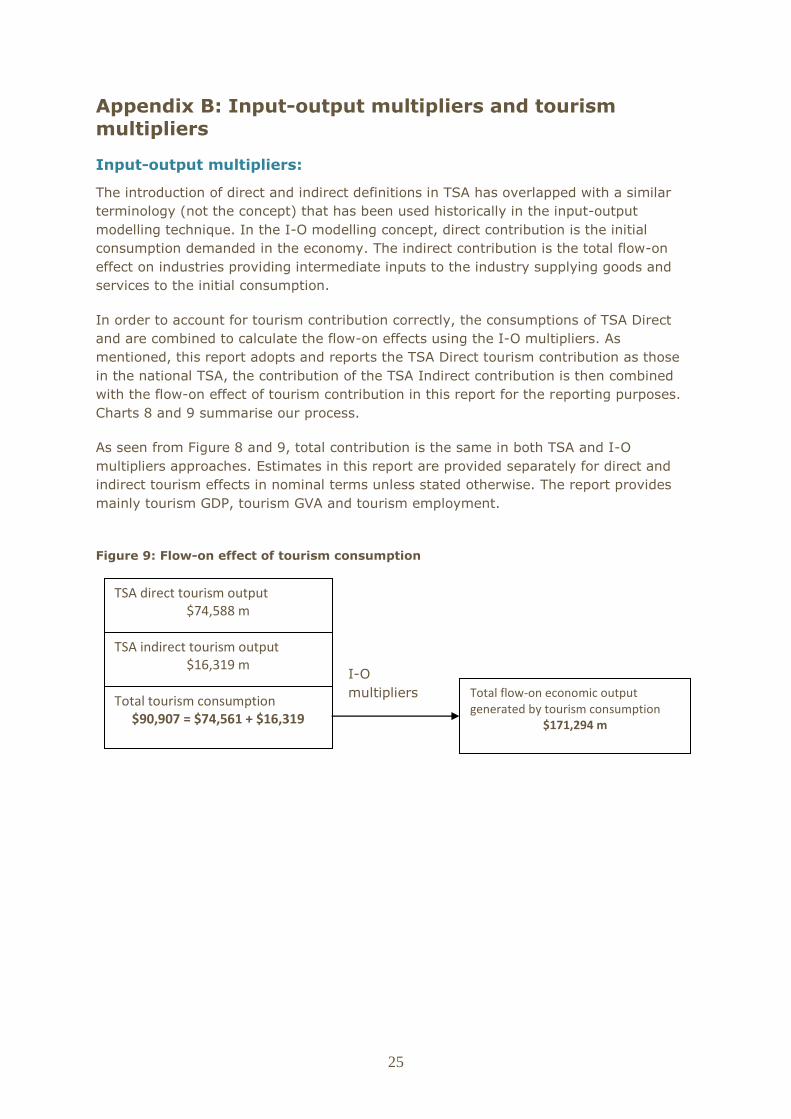
As seen from Figure 8 and 9, total contribution is the same in both TSA and I-O
multipliers approaches. Estimates in this report are provided separately for direct and
indirect tourism effects in nominal terms unless stated otherwise. The report provides
mainly tourism GDP, tourism GVA and tourism employment.
Figure 9: Flow-on effect of tourism consumption
TSA direct tourism output $74,588 m
TSA indirect tourism output $16,319 m
Total tourism consumption $90,907 = $74,561 + $16,319
Total flow-on economic output generated by tourism consumption
$171,294 m
I-O
multipliers
26
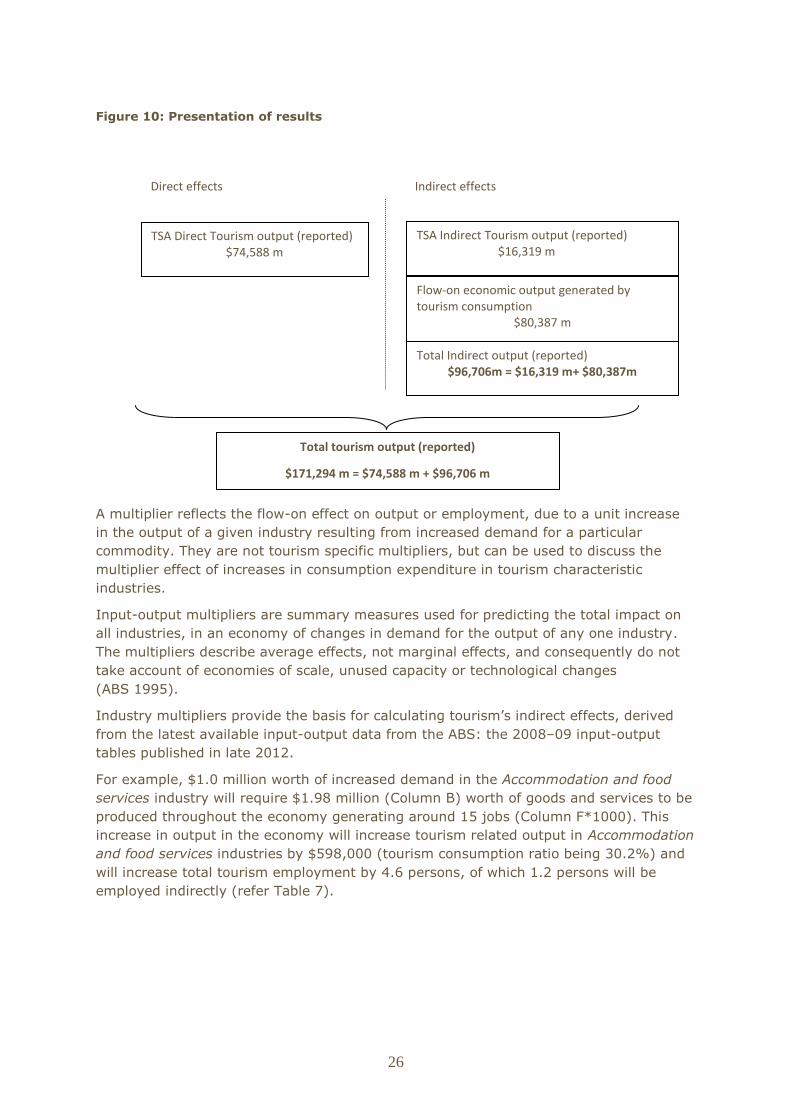
Figure 10: Presentation of results
A multiplier reflects the flow-on effect on output or employment, due to a unit increase
in the output of a given industry resulting from increased demand for a particular
commodity. They are not tourism specific multipliers, but can be used to discuss the
multiplier effect of increases in consumption expenditure in tourism characteristic
industries.
Input-output multipliers are summary measures used for predicting the total impact on
all industries, in an economy of changes in demand for the output of any one industry.
The multipliers describe average effects, not marginal effects, and consequently do not
take account of economies of scale, unused capacity or technological changes
(ABS 1995).
Industry multipliers provide the basis for calculating tourism‘s indirect effects, derived
from the latest available input-output data from the ABS: the 2008–09 input-output
tables published in late 2012.
For example, $1.0 million worth of increased demand in the Accommodation and food
services industry will require $1.98 million (Column B) worth of goods and services to be
produced throughout the economy generating around 15 jobs (Column F*1000). This
increase in output in the economy will increase tourism related output in Accommodation
and food services industries by $598,000 (tourism consumption ratio being 30.2%) and
will increase total tourism employment by 4.6 persons, of which 1.2 persons will be
employed indirectly (refer Table 7).
TSA Direct Tourism output (reported) $74,588 m
TSA Indirect Tourism output (reported) $16,319 m
Flow-on economic output generated by tourism consumption
$80,387 m
Total Indirect output (reported) $96,706m = $16,319 m+ $80,387m
Indirect effects Direct effects
Total tourism output (reported)
$171,294 m = $74,588 m + $96,706 m

27
Table 7: Tourism industry multipliers (2011–12) based on 2008–09 input-output tables
Industries Tourism consumption at
basic price (tourism output)
identified as direct or indirect
in TSA
Total tourism
consumption ($
million) at basic
price (sum of
direct and
indirect)
Output
multipliers*
Tourism
consumption
ratio
Share weighted
consumption
(Col.B*Col.C)
Indirect
output
($ million)
Total
employment
multipliers*
Share weighted
tourism
employment
(Col.C*Col.F*1000)
Indirect
employment
multipliers*
Share weighted
indirect tourism
employment
(Col.C*Col.H*1000)
Columns Direct Indirect A B C D E F G H I
Agriculture,
forestry and
fishing
0.000 648.1 648.1 1.973 0.007 0.014 5417 0.009 0.067 0.004 0.030
Mining 0.000 0.0 0.0 1.619 0.000 0.000 2785 0.003 0.000 0.002 0.000
Meat and dairy 0.000 1337.2 1337.2 2.501 0.015 0.037 2399 0.010 0.140 0.007 0.100
Other food 0.000 1420.7 1420.7 2.340 0.016 0.037 2531 0.009 0.141 0.006 0.090
Beverages and
tobacco
0.000 1581.1 1581.1 2.101 0.017 0.037 1989 0.007 0.117 0.005 0.084
Textiles 0.000 135.4 135.4 1.983 0.001 0.003 212 0.007 0.010 0.004 0.006
Clothing and
footwear
0.000 353.8 353.8 1.608 0.004 0.006 83 0.009 0.034 0.003 0.012
Wood 0.000 3.0 3.0 2.146 0.000 0.000 346 0.009 0.000 0.005 0.000
Printing and
publishing
0.000 100.0 100.0 1.878 0.001 0.002 1394 0.008 0.009 0.004 0.004
Petroleum and
coal
0.000 3650.4 3650.4 1.617 0.040 0.065 2737 0.002 0.084 0.002 0.065
Chemicals 0.000 464.9 464.9 2.081 0.005 0.011 819 0.006 0.030 0.004 0.021
Rubber and
plastic
0.000 89.3 89.3 1.897 0.001 0.002 804 0.006 0.006 0.003 0.003
Non-metallic
mineral
0.000 30.1 30.1 2.009 0.000 0.001 489 0.006 0.002 0.004 0.001
Basic metal 0.000 1.1 1.1 2.128 0.000 0.000 596 0.003 0.000 0.002 0.000
Fabricated
metal
0.000 34.3 34.3 2.124 0.000 0.001 1521 0.006 0.002 0.003 0.001
Transport
equipment
0.000 583.4 583.4 2.013 0.006 0.013 1345 0.007 0.047 0.004 0.024

28
Industries Tourism consumption at
basic price (tourism output)
identified as direct or indirect
in TSA
Total tourism
consumption ($
million) at basic
price (sum of
direct and
indirect)
Output
multipliers*
Tourism
consumption
ratio
Share weighted
consumption
(Col.B*Col.C)
Indirect
output
($ million)
Total
employment
multipliers*
Share weighted
tourism
employment
(Col.C*Col.F*100
0)
Indirect
employment
multipliers*
Share weighted
indirect tourism
employment
(Col.C*Col.H*10
00)
Columns Direct Indirect A B C D E F G H I
Other
machinery and
equipment
0.000 568.1 568.1 1.982 0.006 0.012 779 0.007 0.044 0.003 0.020
Miscellaneous
manufacturing
0.000 350.6 350.6 1.893 0.004 0.007 126 0.011 0.042 0.003 0.013
Electricity 0.000 0.0 0.0 2.050 0.000 0.000 1604 0.004 0.000 0.002 0.000
Gas 0.000 0.0 0.0 2.043 0.000 0.000 79 0.009 0.000 0.004 0.000
Water supply
and waste
collection
0.000 0.0 0.0 1.782 0.000 0.000 581 0.007 0.000 0.003 0.000
Construction 0.000 0.0 0.0 2.335 0.000 0.000 4067 0.008 0.000 0.005 0.000
Wholesale
trade
0.000 2640.8 2640.8 1.887 0.029 0.055 4168 0.007 0.214 0.004 0.107
Retail trade 8899.2 749 9648.2 1.737 0.106 0.184 1634 0.016 1.684 0.003 0.342
Accommodat
ion and food
services
27422.2 63 27485.2 1.979 0.302 0.598 1098 0.015 4.550 0.004 1.182
Road transport 2013.4 716.3 2729.7 1.880 0.030 0.056 2268 0.009 0.285 0.004 0.124
Rail transport 899.5 45.9 945.4 1.865 0.010 0.019 205 0.007 0.076 0.003 0.032
Air, space,
water and
other
transport
16695.8 109.2 16805.6 1.950 0.185 0.361 1054 0.007 1.260 0.004 0.664
Postal and
warehousing
1152.7 80.3 1233.0 1.891 0.014 0.026 4117 0.008 0.106 0.004 0.053
Information
media and
telecommunic
ations
686.9 542.6 1229.5 1.839 0.014 0.025 4334 0.006 0.087 0.004 0.049

29
Industries Tourism consumption at
basic price (tourism output)
identified as direct or indirect
in TSA
Total tourism
consumption ($
million) at basic
price (sum of
direct and
indirect)
Output
multipliers*
Tourism
consumption
ratio
Share weighted
consumption
(Col.B*Col.C)
Indirect
output
($ million)
Total
employment
multipliers*
Share weighted
tourism
employment
(Col.C*Col.F*100
0)
Indirect
employment
multipliers*
Share weighted
indirect tourism
employment
(Col.C*Col.H*10
00)
Columns Direct Indirect A B C D E F G H I
Financial and
insurance
services
85.5 10.7 96.2 1.463 0.001 0.002 5548 0.004 0.004 0.002 0.002
Ownership of
dwelling
4238.3 0.0 4238.3 1.410 0.047 0.066 0 0.001 0.060 0.001 0.060
Rental, hiring
and real estate
services
1234.8 0.0 1234.8 2.156 0.014 0.029 4854 0.008 0.104 0.005 0.066
Professional,
scientific and
technical
services
6.1 0.0 6.1 1.953 0.000 0.000 9090 0.009 0.001 0.004 0.000
Administrative
support
services
3051.3 9.7 3061.0 1.871 0.034 0.063 5657 0.010 0.331 0.004 0.131

30
Industries Tourism consumption at
basic price (tourism output)
identified as direct or indirect
in TSA
Total tourism
consumption ($
million) at basic
price (sum of
direct and
indirect)
Output
multipliers*
Tourism
consumption
ratio
Share
weighted
consumption
(Col.B*Col.C)
Indirect
output
($ million)
Total
employment
multipliers*
Share weighted
tourism
employment
(Col.C*Col.F*1000)
Indirect
employment
multipliers*
Share weighted
indirect tourism
employment
(Col.C*Col.H*1000)
Columns Direct Indirect A B C D E F G H I
Public
administration
and safety
0.000 0.000 0.0 1.791 0.000 0.000 829 0.009 0.000 0.003 0.000
Education and
training
3226.5 0.000 3226.5 1.435 0.035 0.051 369 0.013 0.465 0.002 0.069
Health care
and social
assistance
763.2 0.000 763.2 1.513 0.008 0.013 88 0.014 0.118 0.002 0.019
Arts and
recreation
services
3858.0 0.000 3858.0 1.955 0.042 0.083 460 0.012 0.512 0.004 0.184
Other services 353.8 0.000 353.8 1.727 0.004 0.007 1915 0.013 0.050 0.003 0.012
Total 74588 16319 90907 1.000 1.884** 80387.2 10.682** 3.572**
Source: TRA‘s estimates using 2008–09 input-output tables
*Generated from the input-output tables
** The total tourism multiplier (sum of share weighted output, employment and indirect employment)

31
