tourism impacts in kumarakom, kerala. - harold … impacts...responsible tourism partnership working...
TRANSCRIPT
Responsible Tourism Partnership Working Paper 2.
Tourism Impacts in Kumarakom, Kerala.
Rupesh Kumar, Jenefer Bobbin, Harold Goodwin
Data collection in 2015 was funded by the Kerala Institute of Travel & Tourism Studies. The enumerators were: Bhagathsingh V.S.,
Bindu Sunil, Anitha Kochumon, Sajitha Manoj,Suhail ,Sajith T.K, Sukhadev Sugunan.
Kumarakom is a village on Vembanad Lake 13 km from Kottayam with the Kumarakom Bird Sanctuary and
offering easy access to the backwaters. In addition to the houseboats and homestay accommodation there
are nineteen tourism resorts in the midst of rice, vegetables and coconut farming. The population of 25,000
(2011 census) lives on dryland, criss-crossed by canals and streams and is comprised of just over 5,000
households. Whilst more and more people are now engaged with tourism, more than 2000 villagers still
work in agriculture, other significant occupations include lime-shell collection, fishing and construction.
Kumarakom is a destination composed of three panchayat areas: Aimanam, Arpookkara and Kumarakom.
Every household in the tourism area of all three panchayats within Kumarakom was visited, some several
times, in order to attempt a full population survey, or census, of tourism impacts in the destination. Data
was collected from 3,108 households in the tourism area, there was a ~95% response rate.
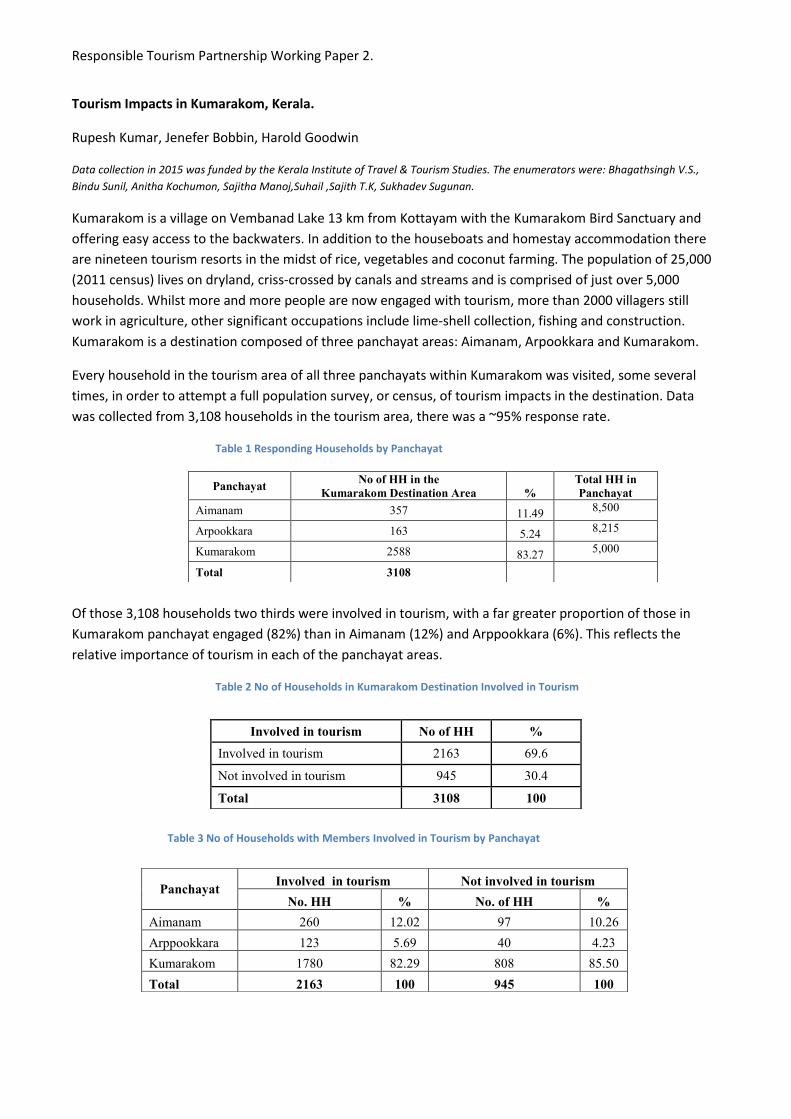
Table 1 Responding Households by Panchayat
Of those 3,108 households two thirds were involved in tourism, with a far greater proportion of those in
Kumarakom panchayat engaged (82%) than in Aimanam (12%) and Arppookkara (6%). This reflects the
relative importance of tourism in each of the panchayat areas.
Table 2 No of Households in Kumarakom Destination Involved in Tourism
Table 3 No of Households with Members Involved in Tourism by Panchayat
Panchayat No of HH in the
Kumarakom Destination Area %
Total HH in
Panchayat
Aimanam 357 11.49 8,500
Arpookkara 163 5.24 8,215
Kumarakom 2588 83.27 5,000
Total 3108
Involved in tourism No of HH %
Involved in tourism 2163 69.6
Not involved in tourism 945 30.4
Total 3108 100
Panchayat Involved in tourism Not involved in tourism
No. HH % No. of HH %
Aimanam 260 12.02 97 10.26
Arppookkara 123 5.69 40 4.23
Kumarakom 1780 82.29 808 85.50
Total 2163 100 945 100
Responsible Tourism Partnership Working Paper 2.
More than 80% of those households with members employed in tourism reside in the Kumarakom
panchayat, the part of Kumarakom most impacted by tourism
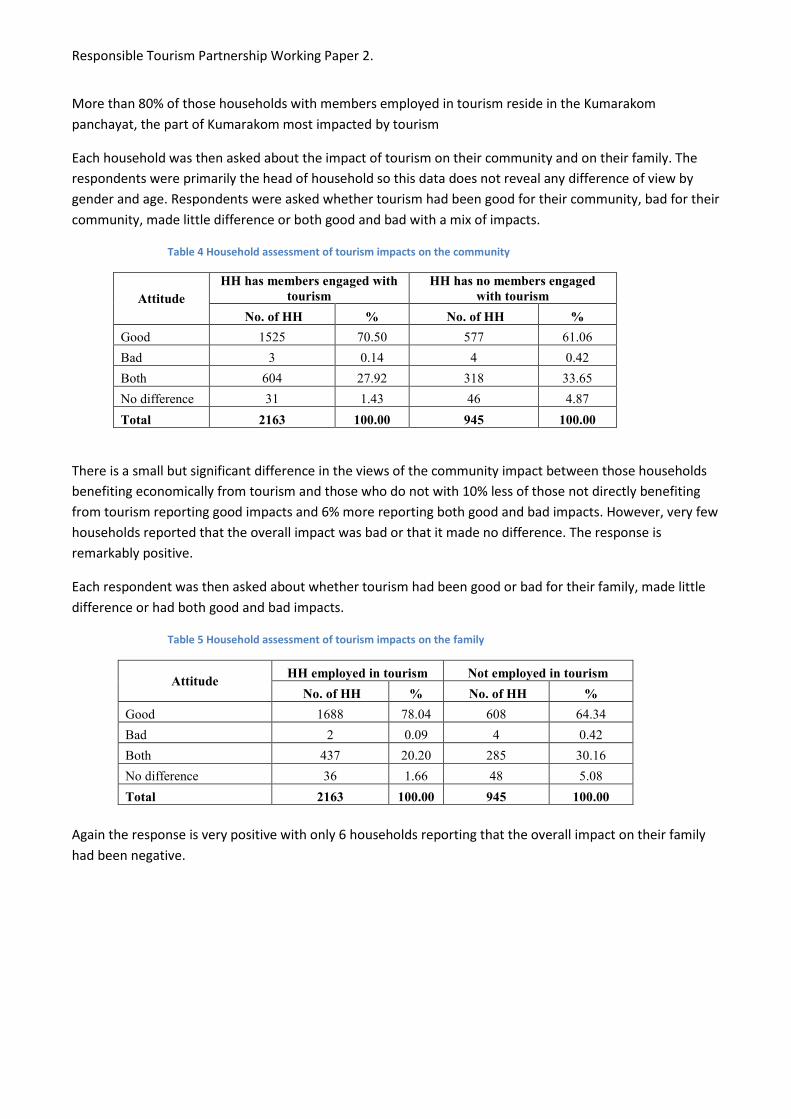
Each household was then asked about the impact of tourism on their community and on their family. The
respondents were primarily the head of household so this data does not reveal any difference of view by
gender and age. Respondents were asked whether tourism had been good for their community, bad for their
community, made little difference or both good and bad with a mix of impacts.
Table 4 Household assessment of tourism impacts on the community
Attitude
HH has members engaged with
tourism
HH has no members engaged
with tourism
No. of HH % No. of HH %
Good 1525 70.50 577 61.06
Bad 3 0.14 4 0.42
Both 604 27.92 318 33.65
No difference 31 1.43 46 4.87
Total 2163 100.00 945 100.00
There is a small but significant difference in the views of the community impact between those households
benefiting economically from tourism and those who do not with 10% less of those not directly benefiting
from tourism reporting good impacts and 6% more reporting both good and bad impacts. However, very few
households reported that the overall impact was bad or that it made no difference. The response is
remarkably positive.
Each respondent was then asked about whether tourism had been good or bad for their family, made little
difference or had both good and bad impacts.
Table 5 Household assessment of tourism impacts on the family
Attitude HH employed in tourism Not employed in tourism
No. of HH % No. of HH %
Good 1688 78.04 608 64.34
Bad 2 0.09 4 0.42
Both 437 20.20 285 30.16
No difference 36 1.66 48 5.08
Total 2163 100.00 945 100.00
Again the response is very positive with only 6 households reporting that the overall impact on their family
had been negative.
Responsible Tourism Partnership Working Paper 2.
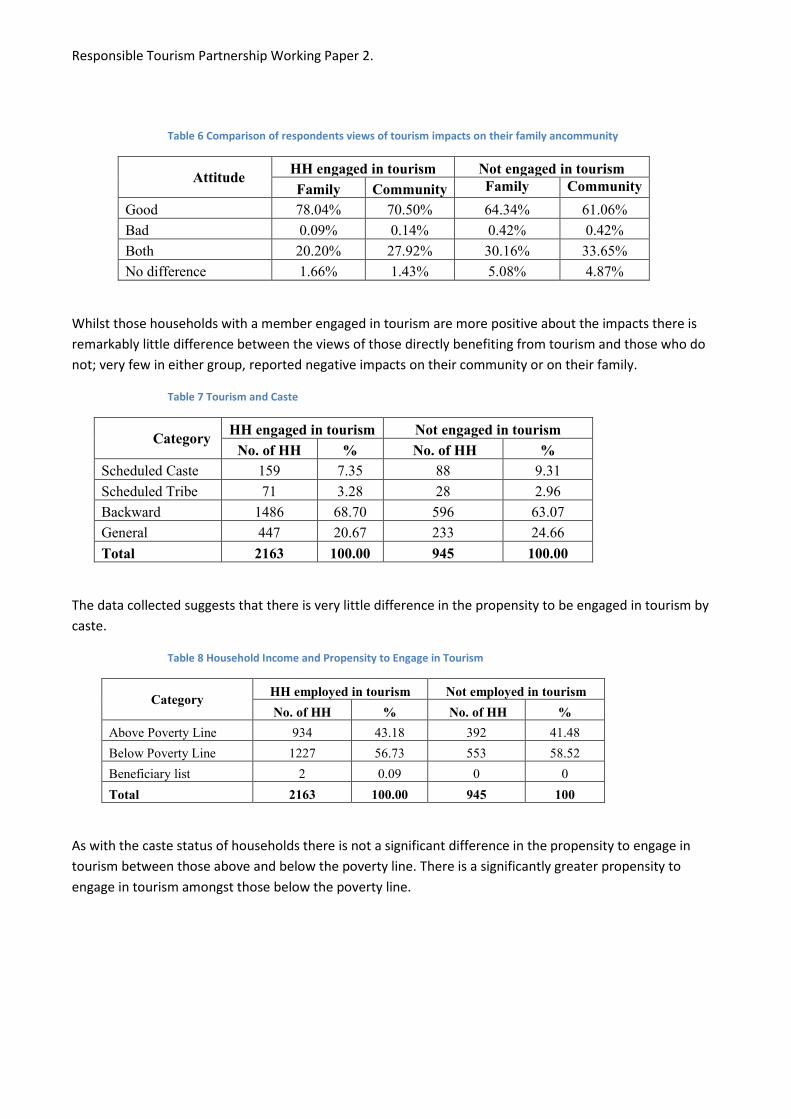
Table 6 Comparison of respondents views of tourism impacts on their family ancommunity
Attitude HH engaged in tourism Not engaged in tourism
Family Community Family Community
Good 78.04% 70.50% 64.34% 61.06%
Bad 0.09% 0.14% 0.42% 0.42%
Both 20.20% 27.92% 30.16% 33.65%
No difference 1.66% 1.43% 5.08% 4.87%
Whilst those households with a member engaged in tourism are more positive about the impacts there is
remarkably little difference between the views of those directly benefiting from tourism and those who do
not; very few in either group, reported negative impacts on their community or on their family.
Table 7 Tourism and Caste
Category HH engaged in tourism Not engaged in tourism
No. of HH % No. of HH %
Scheduled Caste 159 7.35 88 9.31
Scheduled Tribe 71 3.28 28 2.96
Backward 1486 68.70 596 63.07
General 447 20.67 233 24.66
Total 2163 100.00 945 100.00
The data collected suggests that there is very little difference in the propensity to be engaged in tourism by
caste.
Table 8 Household Income and Propensity to Engage in Tourism
Category HH employed in tourism Not employed in tourism
No. of HH % No. of HH %
Above Poverty Line 934 43.18 392 41.48
Below Poverty Line 1227 56.73 553 58.52
Beneficiary list 2 0.09 0 0
Total 2163 100.00 945 100
As with the caste status of households there is not a significant difference in the propensity to engage in
tourism between those above and below the poverty line. There is a significantly greater propensity to
engage in tourism amongst those below the poverty line.
Responsible Tourism Partnership Working Paper 2.
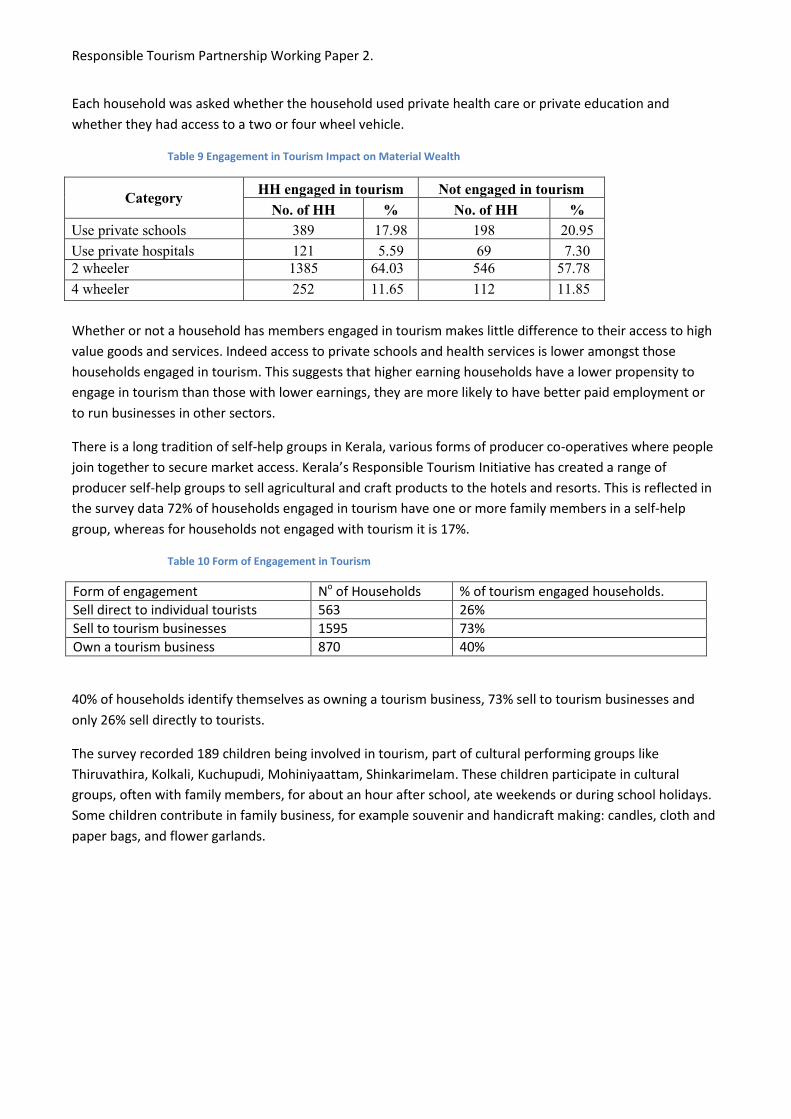
Each household was asked whether the household used private health care or private education and
whether they had access to a two or four wheel vehicle.
Table 9 Engagement in Tourism Impact on Material Wealth
Category HH engaged in tourism Not engaged in tourism
No. of HH % No. of HH %
Use private schools 389 17.98 198 20.95
Use private hospitals 121 5.59 69 7.30
2 wheeler 1385 64.03 546 57.78
4 wheeler 252 11.65 112 11.85
Whether or not a household has members engaged in tourism makes little difference to their access to high
value goods and services. Indeed access to private schools and health services is lower amongst those
households engaged in tourism. This suggests that higher earning households have a lower propensity to
engage in tourism than those with lower earnings, they are more likely to have better paid employment or
to run businesses in other sectors.
There is a long tradition of self-help groups in Kerala, various forms of producer co-operatives where people
join together to secure market access. Kerala’s Responsible Tourism Initiative has created a range of
producer self-help groups to sell agricultural and craft products to the hotels and resorts. This is reflected in
the survey data 72% of households engaged in tourism have one or more family members in a self-help
group, whereas for households not engaged with tourism it is 17%.
Table 10 Form of Engagement in Tourism
Form of engagement No of Households % of tourism engaged households.
Sell direct to individual tourists 563 26%
Sell to tourism businesses 1595 73%
Own a tourism business 870 40%
40% of households identify themselves as owning a tourism business, 73% sell to tourism businesses and
only 26% sell directly to tourists.
The survey recorded 189 children being involved in tourism, part of cultural performing groups like
Thiruvathira, Kolkali, Kuchupudi, Mohiniyaattam, Shinkarimelam. These children participate in cultural
groups, often with family members, for about an hour after school, ate weekends or during school holidays.
Some children contribute in family business, for example souvenir and handicraft making: candles, cloth and
paper bags, and flower garlands.
Responsible Tourism Partnership Working Paper 2.
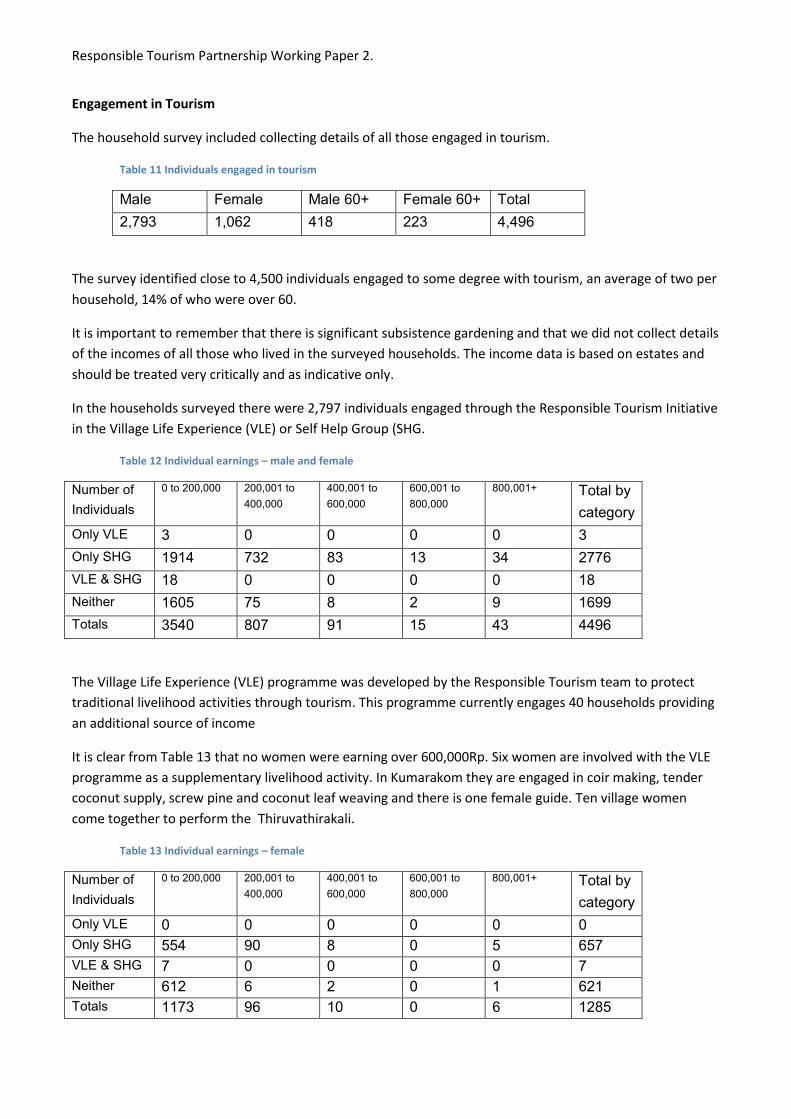
Engagement in Tourism
The household survey included collecting details of all those engaged in tourism.
Table 11 Individuals engaged in tourism
Male Female Male 60+ Female 60+ Total
2,793 1,062 418 223 4,496
The survey identified close to 4,500 individuals engaged to some degree with tourism, an average of two per
household, 14% of who were over 60.
It is important to remember that there is significant subsistence gardening and that we did not collect details
of the incomes of all those who lived in the surveyed households. The income data is based on estates and
should be treated very critically and as indicative only.
In the households surveyed there were 2,797 individuals engaged through the Responsible Tourism Initiative
in the Village Life Experience (VLE) or Self Help Group (SHG.
Table 12 Individual earnings – male and female
Number of
Individuals
0 to 200,000 200,001 to
400,000
400,001 to
600,000 600,001 to
800,000
800,001+ Total by
category
Only VLE 3 0 0 0 0 3
Only SHG 1914 732 83 13 34 2776
VLE & SHG 18 0 0 0 0 18
Neither 1605 75 8 2 9 1699
Totals 3540 807 91 15 43 4496
The Village Life Experience (VLE) programme was developed by the Responsible Tourism team to protect
traditional livelihood activities through tourism. This programme currently engages 40 households providing
an additional source of income
It is clear from Table 13 that no women were earning over 600,000Rp. Six women are involved with the VLE
programme as a supplementary livelihood activity. In Kumarakom they are engaged in coir making, tender
coconut supply, screw pine and coconut leaf weaving and there is one female guide. Ten village women
come together to perform the Thiruvathirakali.
Table 13 Individual earnings – female
Number of
Individuals
0 to 200,000 200,001 to
400,000
400,001 to
600,000 600,001 to
800,000
800,001+ Total by
category
Only VLE 0 0 0 0 0 0
Only SHG 554 90 8 0 5 657
VLE & SHG 7 0 0 0 0 7
Neither 612 6 2 0 1 621
Totals 1173 96 10 0 6 1285
Responsible Tourism Partnership Working Paper 2.
Table 14 Individual earnings – over 60
Number of
Individuals
0 to 200,000 200,001 to
400,000
400,001 to
600,000 600,001 to
800,000
800,001+ Total by
category
Only VLE 3 0 0 0 0 3
Only SHG 300 65 8 0 2 375
VLE & SHG 7 0 0 0 0 7
Neither 235 16 3 0 2 256
Totals 545 81 11 0 4 641
The average term of engagement in tourism was 11 years ranging from 2 moths to 60 years.
Table 15 Reported form of engagement in tourism
Male <60 Female <60 Male 60+ Female 60+ Total
Government 28 32 0 8 68
Self Help Group 701 134 74 11 920
Partnership 0 2 0 0 2
Private Sector 337 150 13 7 507
Self employed 1727 744 331 197 2999
Total 2793 1062 418 223 4496
There is a wide range of different types of tourism related activity reflecting the diversity of way in which a rural agricultural community can engage with tourism. The two women in a partnership run a restaurant.
Figure 1 Categories of work reported – whole survey

Responsible Tourism Partnership Working Paper 2.
Figure 2 Categories of work reported - government
Figure 3 Categories of work reported Self Help Group
The vast majority of those actively engaged in the Self Help Groups are farmers (36%), fishermen (14%) and
Koolis and porters 1 (33%). Others – for examples teachers and nurses – are involved in a Self Help Group
alongside other livelihood activity.
1 This is self-ascribed and refers to a labourer or in the tourism sector a porter.
Responsible Tourism Partnership Working Paper 2.
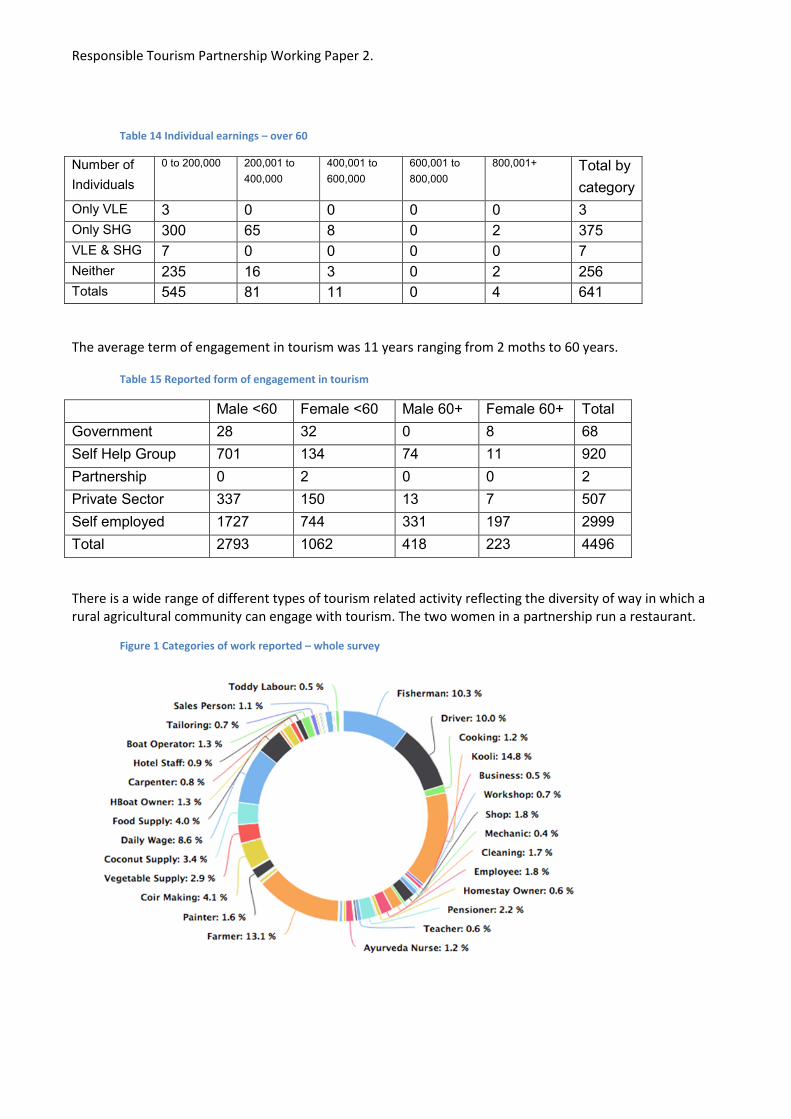
Figure 4 Categories of work reported – private sector
There is a large uncategorized group (45%) who reported that they work for a daily wage – this may well
include casually employed workers but it also includes all those who did not report a specific function.
Figure 5 Categories of work reported – Self Employed
There is a remarkable diversity of forms of engagement in those identifying themselves as self-employed
Responsible Tourism Partnership Working Paper 2.
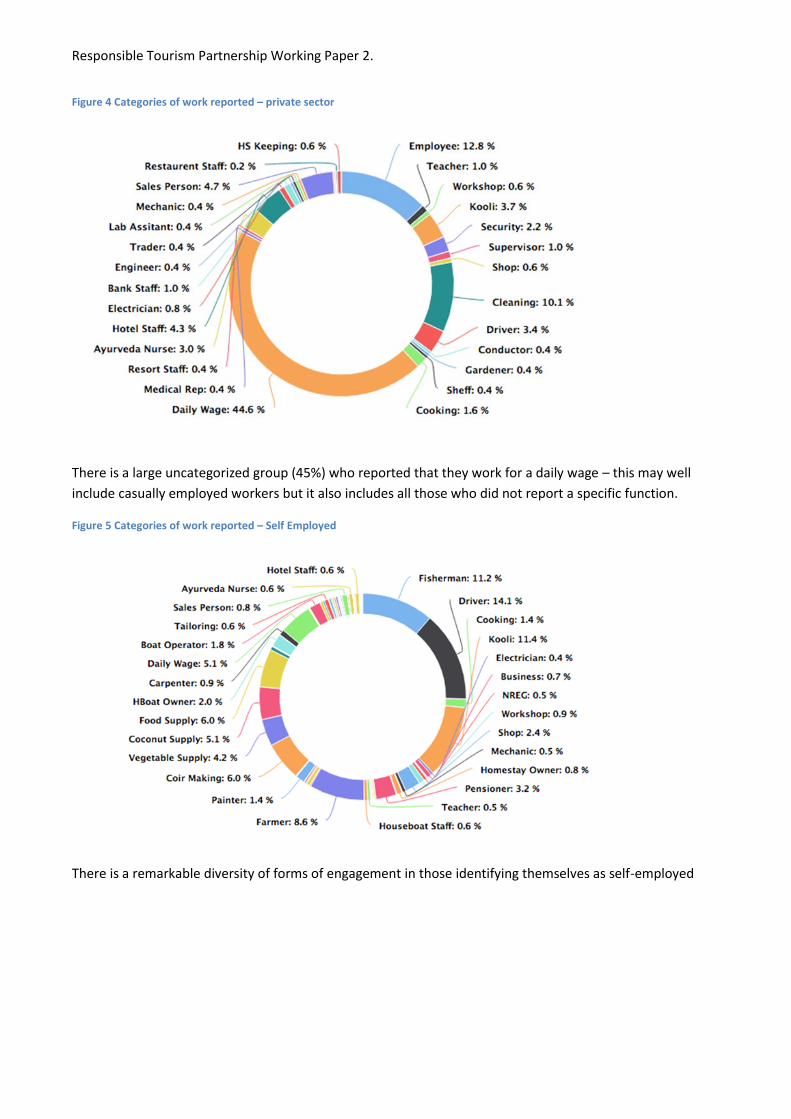
Figure 6 Categories of work reported – Village Life Experience
Figure 7 Categories of work reported – Self Help Group
There are a large number of people engaged with the self-help groups who have additional livelihoods.
Positive and Negative Impacts of Tourism
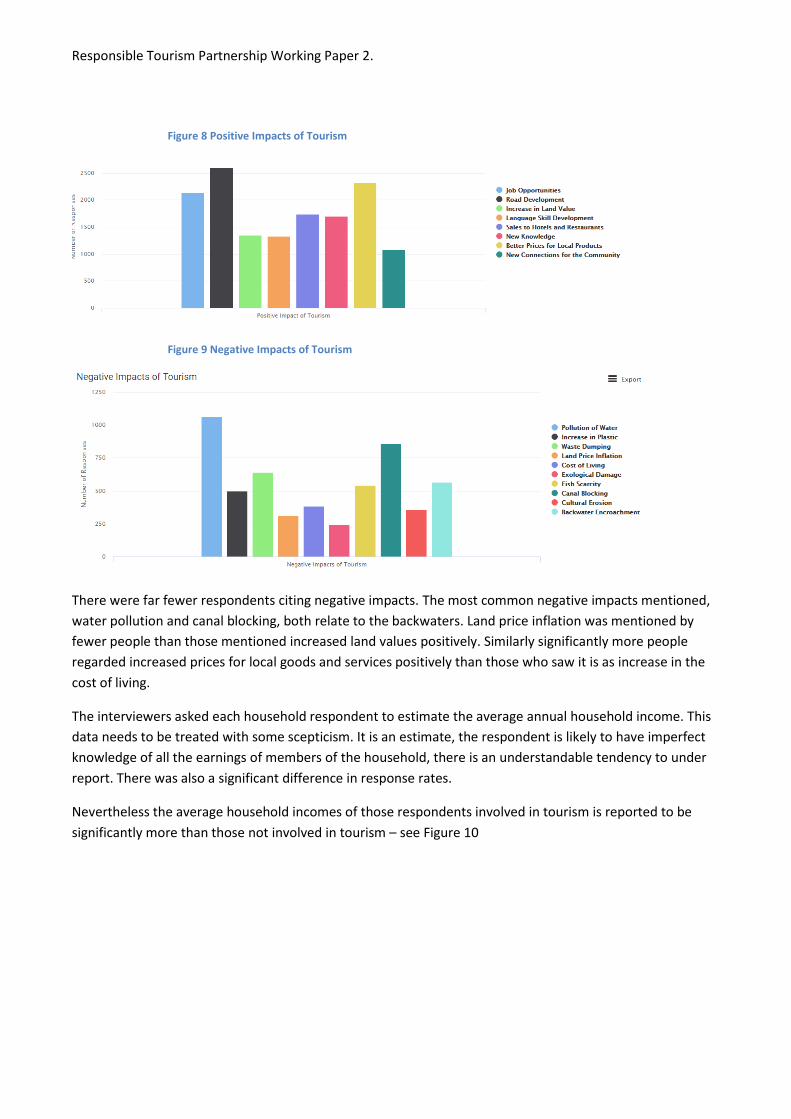
Respondents were then asked about the positive and negative impacts of tourism, they were asked an open question but the interviewers were given 9 positive impact descriptors and 10 negative descriptors to use to code the replies. There was no limit on the number of responses which a respondent could provide.
As can be seen in Figure 8 the most often cited positive impacts were road development, providing improved
links for the villagers to the main roads and town; better prices for locally produced products and increased
job opportunities. The increase in land value is a positive for sellers and a negative for buyers.
Responsible Tourism Partnership Working Paper 2.
Figure 8 Positive Impacts of Tourism
Figure 9 Negative Impacts of Tourism
There were far fewer respondents citing negative impacts. The most common negative impacts mentioned,
water pollution and canal blocking, both relate to the backwaters. Land price inflation was mentioned by
fewer people than those mentioned increased land values positively. Similarly significantly more people
regarded increased prices for local goods and services positively than those who saw it is as increase in the
cost of living.
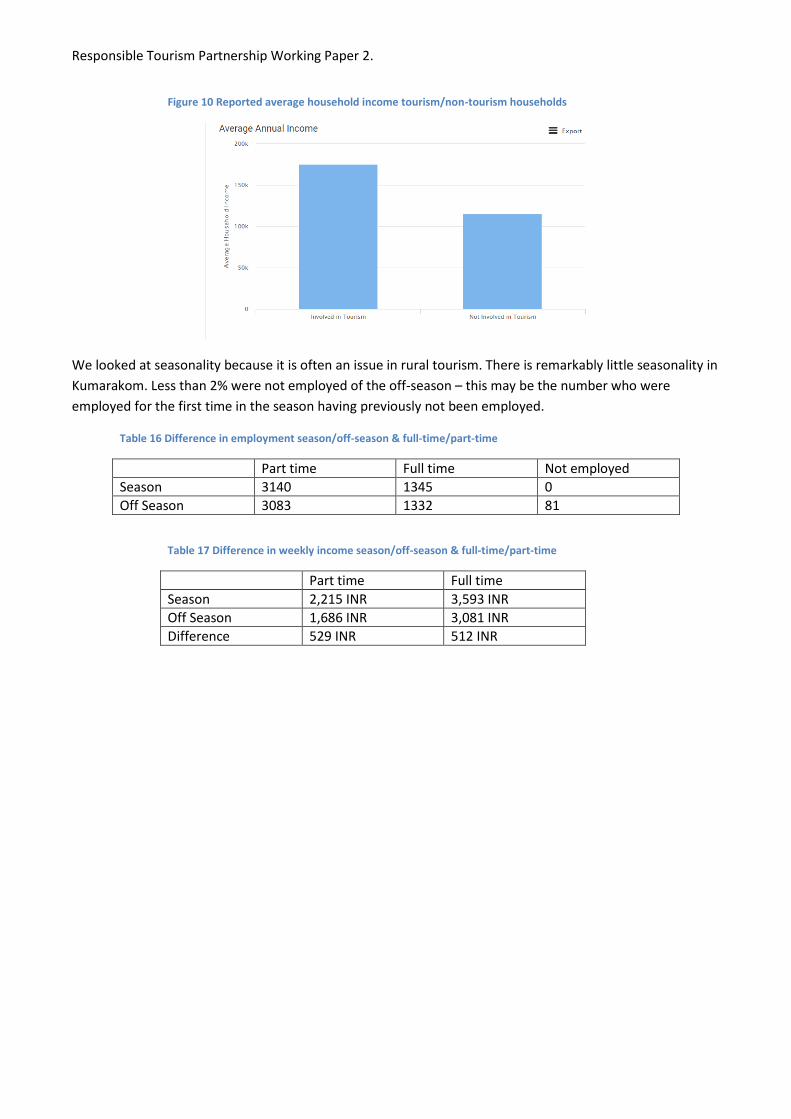
The interviewers asked each household respondent to estimate the average annual household income. This
data needs to be treated with some scepticism. It is an estimate, the respondent is likely to have imperfect
knowledge of all the earnings of members of the household, there is an understandable tendency to under
report. There was also a significant difference in response rates.
Nevertheless the average household incomes of those respondents involved in tourism is reported to be
significantly more than those not involved in tourism – see Figure 10
Responsible Tourism Partnership Working Paper 2.
Figure 10 Reported average household income tourism/non-tourism households
We looked at seasonality because it is often an issue in rural tourism. There is remarkably little seasonality in
Kumarakom. Less than 2% were not employed of the off-season – this may be the number who were
employed for the first time in the season having previously not been employed.
Table 16 Difference in employment season/off-season & full-time/part-time
Part time Full time Not employed
Season 3140 1345 0
Off Season 3083 1332 81
Table 17 Difference in weekly income season/off-season & full-time/part-time
Part time Full time
Season 2,215 INR 3,593 INR
Off Season 1,686 INR 3,081 INR
Difference 529 INR 512 INR
Responsible Tourism Partnership Working Paper 2.
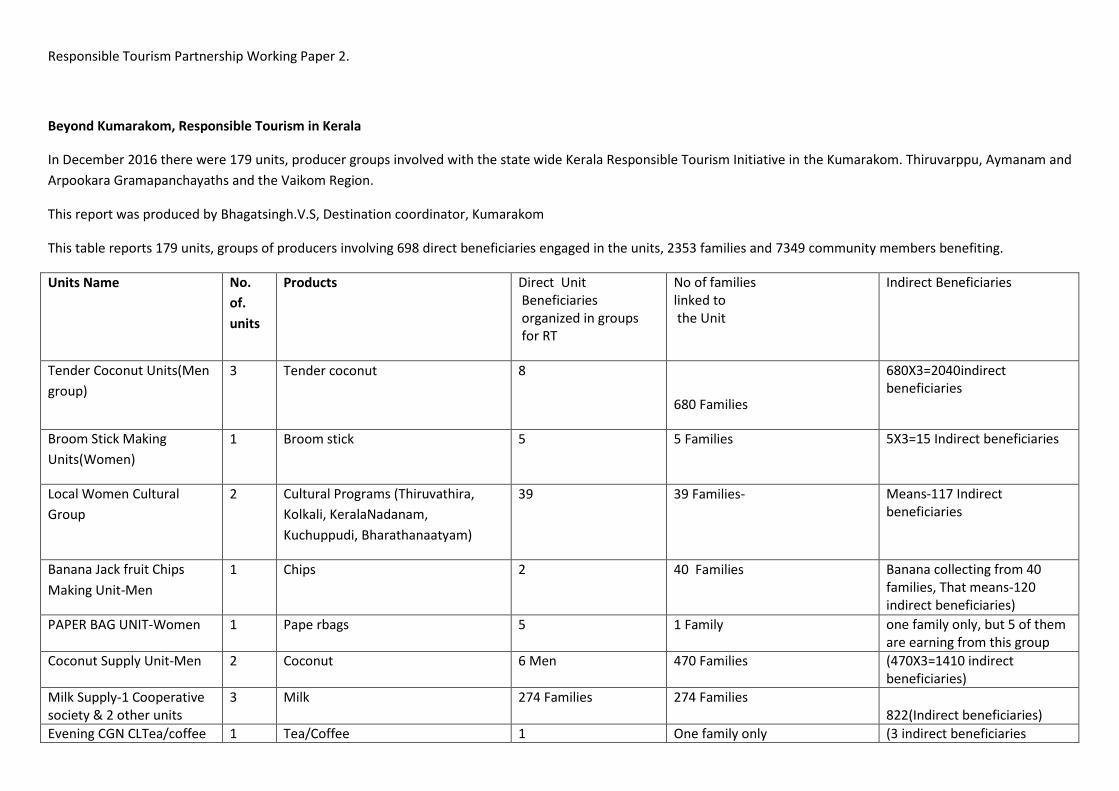
Beyond Kumarakom, Responsible Tourism in Kerala
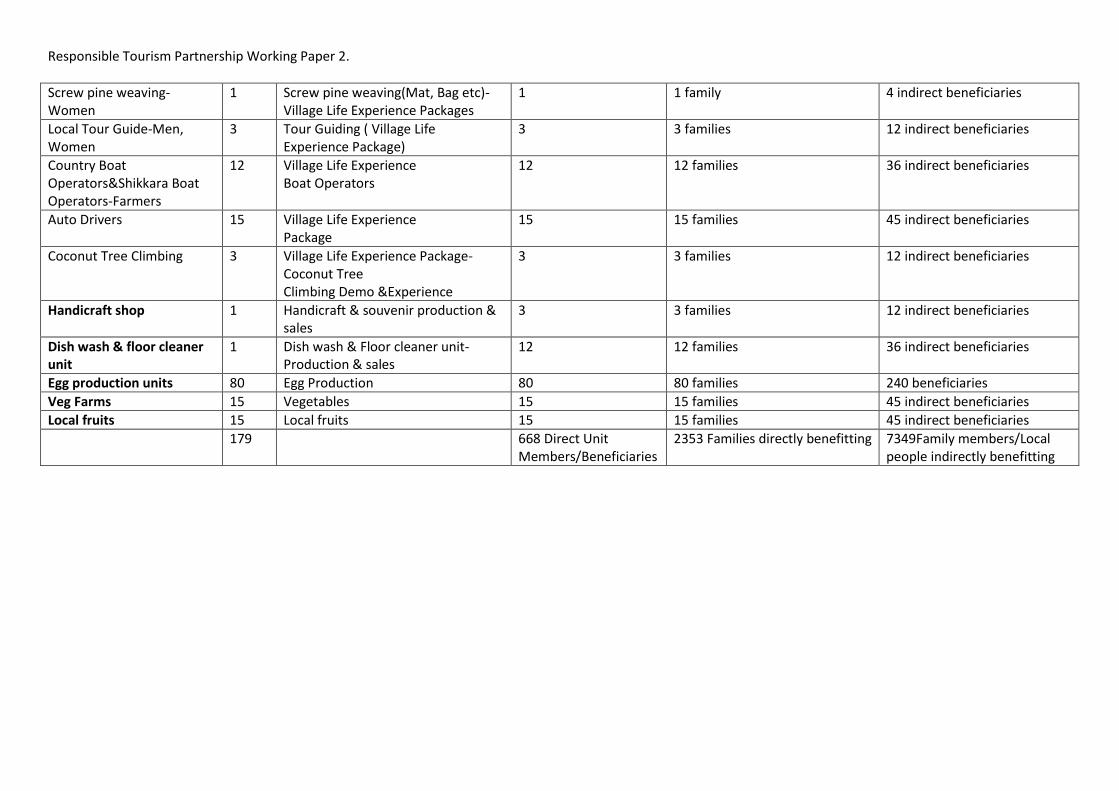
In December 2016 there were 179 units, producer groups involved with the state wide Kerala Responsible Tourism Initiative in the Kumarakom. Thiruvarppu, Aymanam and
Arpookara Gramapanchayaths and the Vaikom Region.
This report was produced by Bhagatsingh.V.S, Destination coordinator, Kumarakom
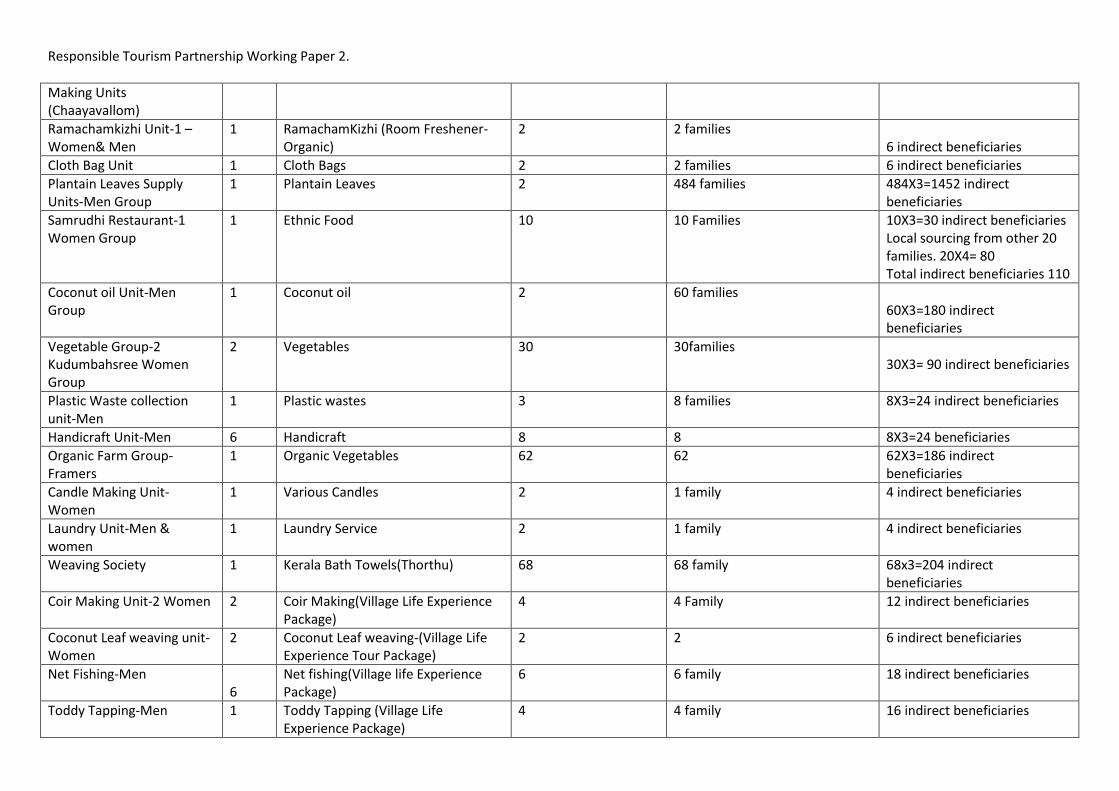
This table reports 179 units, groups of producers involving 698 direct beneficiaries engaged in the units, 2353 families and 7349 community members benefiting.
Units Name No.
of.
units
Products Direct Unit Beneficiaries organized in groups for RT
No of families linked to the Unit
Indirect Beneficiaries
Tender Coconut Units(Men
group)
3 Tender coconut 8
680 Families
680X3=2040indirect beneficiaries
Broom Stick Making
Units(Women)
1 Broom stick 5 5 Families 5X3=15 Indirect beneficiaries
Local Women Cultural
Group
2 Cultural Programs (Thiruvathira,
Kolkali, KeralaNadanam,
Kuchuppudi, Bharathanaatyam)
39 39 Families- Means-117 Indirect beneficiaries
Banana Jack fruit Chips
Making Unit-Men
1 Chips 2 40 Families Banana collecting from 40 families, That means-120 indirect beneficiaries)
PAPER BAG UNIT-Women 1 Pape rbags 5 1 Family one family only, but 5 of them are earning from this group
Coconut Supply Unit-Men 2 Coconut 6 Men 470 Families (470X3=1410 indirect beneficiaries)
Milk Supply-1 Cooperative society & 2 other units
3 Milk 274 Families 274 Families 822(Indirect beneficiaries)
Evening CGN CLTea/coffee 1 Tea/Coffee 1 One family only (3 indirect beneficiaries
Responsible Tourism Partnership Working Paper 2.
Making Units (Chaayavallom)
Ramachamkizhi Unit-1 –Women& Men
1 RamachamKizhi (Room Freshener-Organic)
2 2 families 6 indirect beneficiaries
Cloth Bag Unit 1 Cloth Bags 2 2 families 6 indirect beneficiaries
Plantain Leaves Supply Units-Men Group
1 Plantain Leaves 2 484 families 484X3=1452 indirect beneficiaries
Samrudhi Restaurant-1 Women Group
1 Ethnic Food 10 10 Families
10X3=30 indirect beneficiaries Local sourcing from other 20 families. 20X4= 80 Total indirect beneficiaries 110
Coconut oil Unit-Men Group
1 Coconut oil 2 60 families 60X3=180 indirect beneficiaries
Vegetable Group-2 Kudumbahsree Women Group
2 Vegetables 30 30families 30X3= 90 indirect beneficiaries
Plastic Waste collection unit-Men
1 Plastic wastes 3 8 families 8X3=24 indirect beneficiaries
Handicraft Unit-Men 6 Handicraft 8 8 8X3=24 beneficiaries
Organic Farm Group-Framers
1 Organic Vegetables 62 62 62X3=186 indirect beneficiaries
Candle Making Unit-Women
1 Various Candles 2 1 family 4 indirect beneficiaries
Laundry Unit-Men & women
1 Laundry Service 2 1 family 4 indirect beneficiaries
Weaving Society 1 Kerala Bath Towels(Thorthu) 68 68 family 68x3=204 indirect beneficiaries
Coir Making Unit-2 Women 2 Coir Making(Village Life Experience Package)
4 4 Family 12 indirect beneficiaries
Coconut Leaf weaving unit-Women
2 Coconut Leaf weaving-(Village Life Experience Tour Package)
2 2 6 indirect beneficiaries
Net Fishing-Men 6
Net fishing(Village life Experience Package)
6 6 family 18 indirect beneficiaries
Toddy Tapping-Men 1 Toddy Tapping (Village Life Experience Package)
4 4 family 16 indirect beneficiaries
Responsible Tourism Partnership Working Paper 2.
Screw pine weaving-Women
1 Screw pine weaving(Mat, Bag etc)-Village Life Experience Packages
1 1 family 4 indirect beneficiaries
Local Tour Guide-Men, Women
3 Tour Guiding ( Village Life Experience Package)
3 3 families 12 indirect beneficiaries
Country Boat Operators&Shikkara Boat Operators-Farmers
12 Village Life Experience Boat Operators
12 12 families 36 indirect beneficiaries
Auto Drivers 15 Village Life Experience Package
15 15 families 45 indirect beneficiaries
Coconut Tree Climbing 3 Village Life Experience Package-Coconut Tree Climbing Demo &Experience
3 3 families 12 indirect beneficiaries
Handicraft shop 1 Handicraft & souvenir production & sales
3 3 families 12 indirect beneficiaries
Dish wash & floor cleaner unit
1 Dish wash & Floor cleaner unit- Production & sales
12 12 families 36 indirect beneficiaries
Egg production units 80 Egg Production 80 80 families 240 beneficiaries
Veg Farms 15 Vegetables 15 15 families 45 indirect beneficiaries
Local fruits 15 Local fruits 15 15 families 45 indirect beneficiaries
179 668 Direct Unit Members/Beneficiaries
2353 Families directly benefitting 7349Family members/Local people indirectly benefitting