total phosphorus loading calculations and … ventures llc total phosphorus loading calculations and...
TRANSCRIPT

crossroads ventures l l c
Total Phosphorus Loading Calculations and Comparisons
Between WinSLAMM and Other Stormwater Quality Methods
Prepared by:
August 24, 2004

Page 1 of 36
Table 1, “Comparison of WinSLAMM Data and Literature Estimate,” shows the results and sources of total phosphorous concentrations, or loading, for pre-development conditions. The units of measurement are expressed as either a concentration or an area load.
Table 1. Comparison of WinSLAMM Data and Literature Estimate for Phosphorus Loading Location Concentration
mg/l Load
lbs/acres Source
Big Indian (WinSLAMM) 0.23 0.23 DEIS Appendix 10A Wildacres (WinSLAMM) 0.254 0.41 DEIS Appendix 10A NURP 0.121 Haith 1993
Virginia Hardwood 0.15 Schueler 1987 NYCDEP 1997
Forest 1 0.010 USEPA Wisconsin Forest 0.08-0.15 Panaska and Lilve 1995 Forest 2 0.1-3.3 WTM Carco 2003* Forest 3 0.18 Olem 1990
* New source that was not reviewed during preparation of the DEIS Location Concentration
mg/l Load
lbs/acres Source
Giggle Hollow 0.02004 NYCDEP 2002 see pp 5 of 39 All of the above data is for the pre-development conditions. This data showed that WinSLAMM was predicting high values, which was considered acceptable since the post-development concentration was also being predicted by WinSLAMM.
A set of calculations were completed in April 2002 to determine the overall accuracy of the WinSLAMM predictions as it related to treatment removals (see Appendix A, attached). The calculations were based on a coefficient method, or direct calculation (land area x annual loading).

TP CALCULATIONS
Page 2 of 36
Total Phosphorus Calculations for Selected Methods The data from WinSLAMM analysis has been compared to other methods of runoff quality estimating including the 2000-2002 sample data collected by NYC DEP from predevelopment monitoring site Giggle Hollow. There are three variations of the assumed loading rates for each of the estimates:
1. The impervious surface runoff concentration can be either 0.15 mg/l or 0.26 mg/l. 2. The golf course and landscape areas would have the same level of fertilizer applications. 3. The NYCDEP 1997 equation (modified simple equation) using a loading rate of 0.99 lbs/acre found in the Gleams Model.
Given the high demands placed on golf turf due to the number of rounds of play, it is necessary to fertilize and use comprehensive cultural practices to cause the turf to thrive. In landscape areas, the same inputs of fertilizers and other cultural practices are not necessary. Using the same loading rate is a prudent means of conservatively assessing runoff quality. Therefore, in the direct calculation method for Big Indian and Wildacres, show in Tables 2 and 3, the higher estimation of 0.99 lbs/acre was used.

TP CALCULATIONS
Page 3 of 36
Several conversions were used throughout the calculations and are as follows: Conversions 1 µg/l = 0.001 g/m3 1 lb = 0.4535 kg 1 acre = 4047 m2 1 inch = 0.0254 meters 0.9 = R, multiplier for annual rainfall 0.98 = R for impervious surfaces 0.64 = R for forest for Wild Acres^ 0.60 = R for forest for Big Indian^ ^ from p. 242 of the NYC DEP 2001 Watershed Protection Program
Summary – http://www.ci.nyc.ny.us/html/dep/html/fadplan.html Other Values Annual Rainfall = 50.4 inches NYC DEP 1997
Impervious TP Concentration = 0.26 mg/l for older urban areas NURP, Schueler 1987, NYC DEP 1997 = 0.15 mg/l for parking lot areas NYC DEP 1997, Schueler 1987
Golf Turf TP Concentration = 0.227 kg/acre/yr NYC DEP 1997 = 0.449 kg/acre/yr DEIS
Landscaping TP Concentration = 0.26 mg/l NYC DEP 1997 Predevelopment Base Flow = 0.15 mg/l NYC DEP 1997 Event Monitoring TP Concentration = 0.02005 mg/l NYC DEP 2002 An annual rainfall of 50.4 inches per year was used in all of the calculations. This value was used based on regional rainfall collection values, shown in the NYC DEP 1997 Guidance for Phosphorus Offset Pilot Program, Bureau of Water Supply Quality and Protection report. The general equation used to determine the annual loadings based on various TP concentrations is: (TP concentration) * (area) * (annual rainfall*0.9) = Annual TP concentration for site A revised set of estimates for total phosphorus loading from the Big Indian and Wildacres Resort are presented on the following pages.

TP CALCULATIONS
Page 4 of 36
Simple Method as described in the NYS DEC Stormwater Design Manual Post Development Pre-treatment L = 0.226(R)(C)(A)
Where:
W
L = Annual load (lbs) R = Annual Runoff (inches) C = Pollutant Concentration (mg/l) A = Area (acres)
0.226 = Unit Conversion factor here R = (P)(Pj)(Rv):
P = Annual Rainfall (inches) Pj = Fraction of rainfall producing Runoff = 0.9
Rv = Runoff Coefficient where Rv = 0.05 + 0.9(Ia) Where Ia = Impervious fraction

TP CALCULATIONS
Page 5 of 36
The method labeled “Direct Calculation/Giggle Hollow” is a direct calculation which utilizes an existing conditions (forest) concentration for runoff of 20.05 μg/l of phosphorus. The 2000-2001 non-precipitation runoff value was reported in NYC DEP (2002) as 15.47 μg/l (8/2000-12/31/2001). To create a year-round average that included precipitation events, two methods were utilized. The first estimate was formed by calculating averages for the precipitation events in 2002 when the fully automated samplers were operating, and calculating an overall average for events and adding the non-event mean from 2000-2001 NYC DEP TP baseflow monitoring. Below is the Giggle Hollow 2002 NYC DEP sample data that was utilized to estimate stormwater total phosphorus concentration. The first estimate resulted in an average TP concentration of 20.05 μg/l.
Giggle Hollow 2002 NYC DEP Sample Data
Event Start Date Time Event Stop Date Time Event Σ TP µg/lNumber of
Samples Equation Event
Average TPMarch 26, 2002 9:50 March 27, 2002 9:44 281 25 (281)/(25) = 11.24July 23, 2002 11:45 July 23, 2002 17:07 371 9 (371)/(9) = 41.22September 15, 2002 8:15 September 26, 2002 5:05 606 22 (606)/(22) = 27.55September 22, 2002 4:15 September 24, 2002 10:20 583 25 (583)/(25) = 23.32September 26, 2002 19:45 September 28, 2002 9:10 843 38 (843)/(38) = 22.18October 15, 2002 10:50 October 17, 2002 9:50 512 23 (512)/(23) = 22.26 Total Event Averages 147.77 Total Event Averages/Number of Events = Average TP Concentration in µg/l 147.77/6 = 24.63 2000/2001 NYC DEP TP baseflow in µg/l = 15.47 (Average TP + NYC DEP TP)/2 = Average TP Concentration in µg/l (24.63+15.47)/2 = 20.05
A second estimate of average TP loading was prepared by using the entire 2002 data set alone. This average value was 21.6 μg/l based on the 161 measurements made in 2002. The 20.05 μg/l was used in the calculation since the non-event estimate from 8/2000-12/2001 was based on a larger data set than the 2002 data.
TP CALCULATIONS PRE DEVELOPMENT BIG INDIAN
Page 6 of 36
Total Phosphorus Load (kg/year)
Land Use Type
Calculation Method
Forest Impervious Landscape Golf Course
Composite golf course and
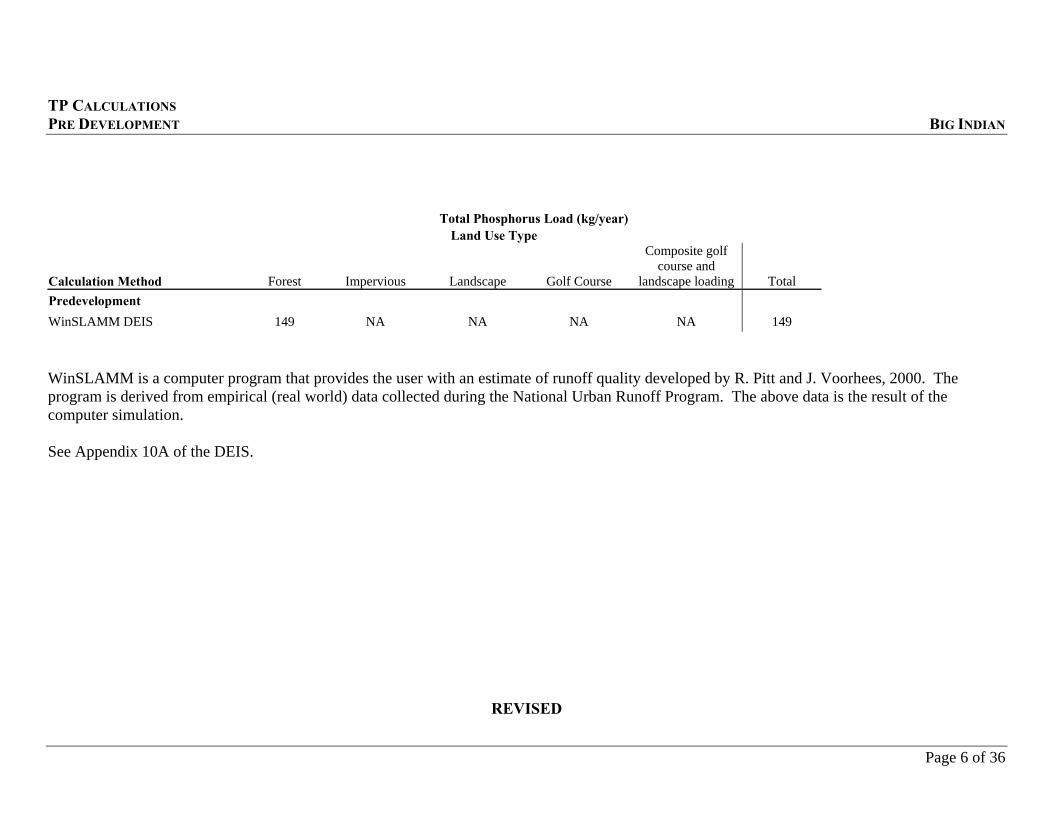
landscape loading Total Predevelopment WinSLAMM DEIS 149 NA NA NA NA 149 WinSLAMM is a computer program that provides the user with an estimate of runoff quality developed by R. Pitt and J. Voorhees, 2000. The program is derived from empirical (real world) data collected during the National Urban Runoff Program. The above data is the result of the computer simulation. See Appendix 10A of the DEIS.
REVISED

TP CALCULATIONS PRE DEVELOPMENT BIG INDIAN
Page 7 of 36
Total Phosphorus Load (kg/year)
Land Use Type
Calculation Method
Forest Impervious Landscape Golf Course
Composite golf course and
landscape loading Total Predevelopment Direct Calculation/Giggle Hollowa 76.79 NA NA NA NA 76.79 Below is the equation used to determine the predevelopment TP concentration. (0.00002005 kg/m3)(1242 acres * 4047 m2)(1.27 m * 0.60) = 76.79 kg/yr a Forest runoff = 0.02005 mg/l based on NYC DEP 2002 data report
REVISED

TP CALCULATIONS PRE DEVELOPMENT BIG INDIAN
Page 8 of 36
Total Phosphorus Load (kg/year)
Land Use Type
Calculation Method
Forest Impervious Landscape Golf Course
Composite golf course and
landscape loading Total Predevelopment Direct Calculation EPAb 57.45 NA NA NA NA 57.45 Below is the equation used to determine the predevelopment TP concentration. (TP concentration) * (area) * (annual rainfall*0.9) = Annual TP concentration for site
(0.00001 kg/m3)(1242 acres * 4047 m2)(1.27 m * 0.9) = 57.45 kg/yr b Forest runoff = 0.010 mg/l (USEPA)
TP CALCULATIONS PRE DEVELOPMENT BIG INDIAN
Page 9 of 36
Total Phosphorus Load (kg/year)
Land Use Type
Calculation Method
Forest Impervious Landscape Golf Course
Composite golf course and
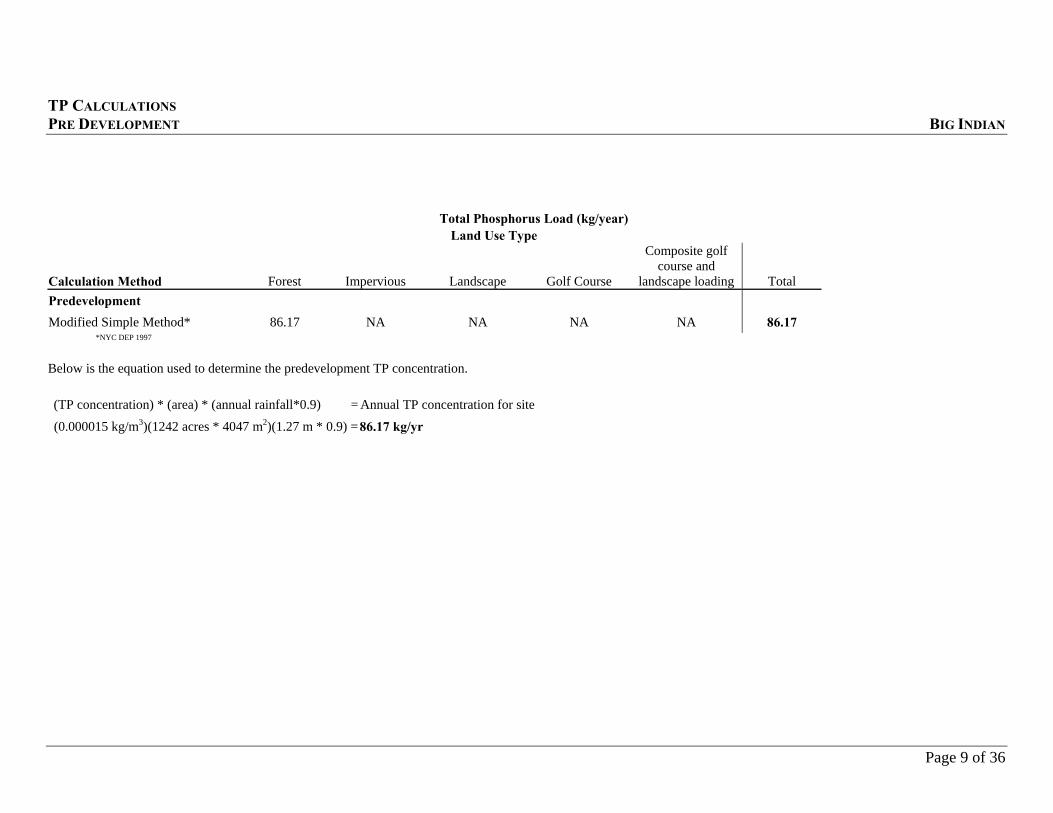
landscape loading Total Predevelopment Modified Simple Method* 86.17 NA NA NA NA 86.17 *NYC DEP 1997
Below is the equation used to determine the predevelopment TP concentration. (TP concentration) * (area) * (annual rainfall*0.9) = Annual TP concentration for site
(0.000015 kg/m3)(1242 acres * 4047 m2)(1.27 m * 0.9) = 86.17 kg/yr

TP CALCULATIONS POST DEVELOPMENT PRE TREATMENT BIG INDIAN
Page 10 of 36
Total Phosphorus Load (kg/year)
Land Use Type
Calculation Method
Forest Impervious Landscape Golf Course
Composite golf course and
landscape loading Total Post Development (Pre-treatment) WinSLAMM DEIS NA NA NA NA NA 252.30 WinSLAMM is a computer program that provides the user with an estimate of runoff quality developed by R. Pitt and J. Voorhees, 2000. The program is derived from empirical (real world) data collected during the National Urban Runoff Program. The above data is the result of the computer simulation. See Appendix 10A of the DEIS.

TP CALCULATIONS POST DEVELOPMENT PRE TREATMENT BIG INDIAN
Page 11 of 36
Total Phosphorus Load (kg/year)
Land Use Type
Calculation Method
Forest Impervious Landscape Golf Course
Composite golf course and
landscape loading Total Post Development (Pre-treatment) Direct Calculation/Giggle Hollowa 56.33 68.62 NA NA 125.09 250.04 Below is the equation used to determine the post development pretreatment TP concentration. Impervious concentration (0.00026 kg/m3)(52.4 acres * 4047 m2)(1.27 m * 0.98) = 68.62 kg/yrGolf course and landscape concentration
(0.449 kg/ac/yr)(278.6 acres) = 125.09 kg/yr
Forest concentration (0.00002005 kg/m3)(911 acres * 4047 m2)(1.27 m * 0.60) = 56.33 kg/yr Total Loading 250.04 kg/yr a Forest runoff = 0.02005 mg/l based on NYC DEP 2002 data report and Appendix 18 of the DEIS water quality data.
REVISED
TP CALCULATIONS POST DEVELOPMENT PRE TREATMENT BIG INDIAN
Page 12 of 36
Total Phosphorus Load (kg/year)
Land Use Type
Calculation Method
Forest Impervious Landscape Golf Course
Composite golf course and
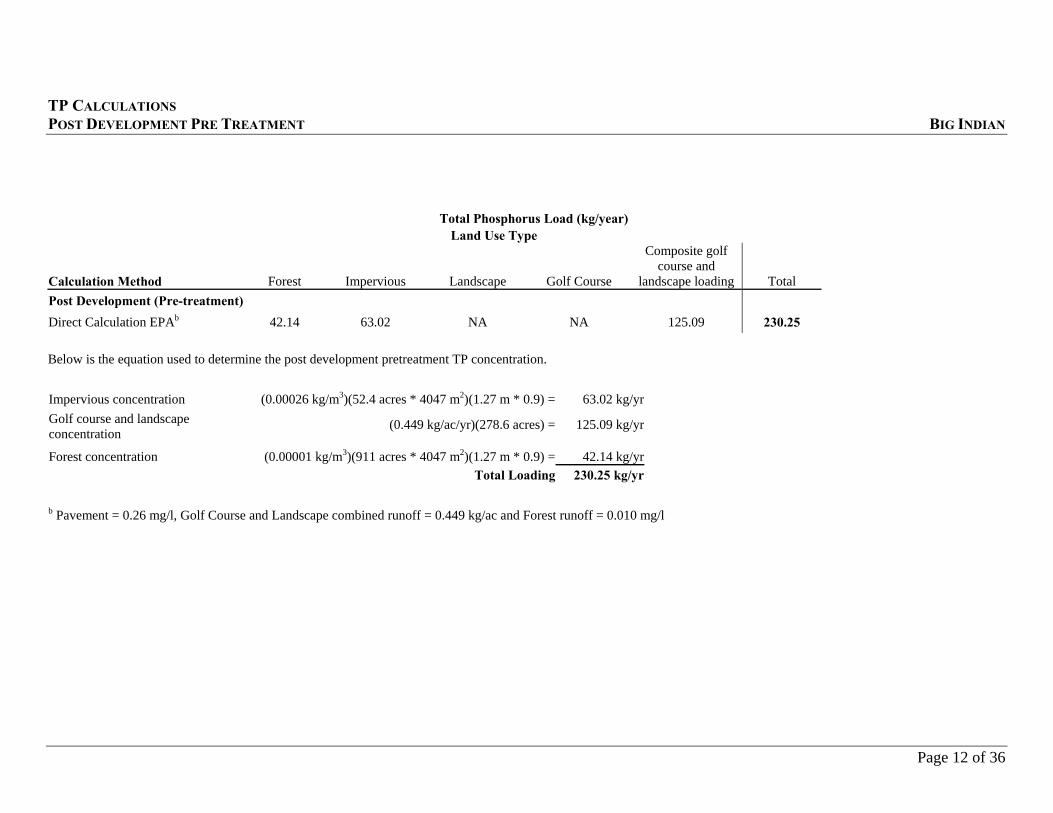
landscape loading Total Post Development (Pre-treatment) Direct Calculation EPAb 42.14 63.02 NA NA 125.09 230.25 Below is the equation used to determine the post development pretreatment TP concentration. Impervious concentration (0.00026 kg/m3)(52.4 acres * 4047 m2)(1.27 m * 0.9) = 63.02 kg/yr Golf course and landscape concentration
(0.449 kg/ac/yr)(278.6 acres) = 125.09 kg/yr
Forest concentration (0.00001 kg/m3)(911 acres * 4047 m2)(1.27 m * 0.9) = 42.14 kg/yr Total Loading 230.25 kg/yr b Pavement = 0.26 mg/l, Golf Course and Landscape combined runoff = 0.449 kg/ac and Forest runoff = 0.010 mg/l
TP CALCULATIONS POST DEVELOPMENT PRE TREATMENT BIG INDIAN
Page 13 of 36
Total Phosphorus Load (kg/year)
Land Use Type
Calculation Method
Forest Impervious Landscape Golf Course
Composite golf course and
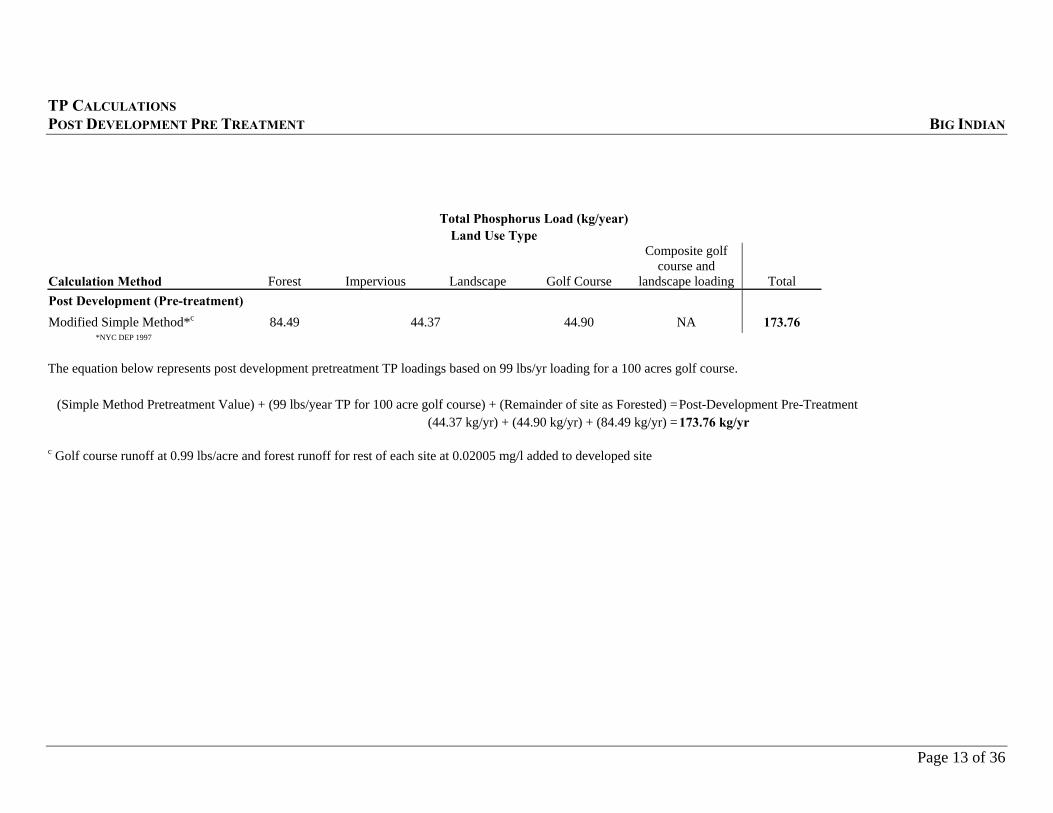
landscape loading Total Post Development (Pre-treatment) Modified Simple Method*c 84.49 44.37 44.90 NA 173.76 *NYC DEP 1997 The equation below represents post development pretreatment TP loadings based on 99 lbs/yr loading for a 100 acres golf course.
(Simple Method Pretreatment Value) + (99 lbs/year TP for 100 acre golf course) + (Remainder of site as Forested) =Post-Development Pre-Treatment (44.37 kg/yr) + (44.90 kg/yr) + (84.49 kg/yr) = 173.76 kg/yr
c Golf course runoff at 0.99 lbs/acre and forest runoff for rest of each site at 0.02005 mg/l added to developed site

TP CALCULATIONS POST DEVELOPMENT POST TREATMENT BIG INDIAN
Page 14 of 36
Total Phosphorus Load (kg/year)
Land Use Type
Calculation Method
Forest Impervious Landscape Golf Course
Composite golf course and
landscape loading Total
Wastewater Treatment Facility
Effluent
Total Post-treatment
Discharges Post Development (Post-treatment) WinSLAMM DEIS NA NA NA NA NA 197 60 257 WinSLAMM is a computer program that provides the user with an estimate of runoff quality developed by R. Pitt and J. Voorhees, 2000. The program is derived from empirical (real world) data collected during the National Urban Runoff Program. The above data is the result of the computer simulation. See Appendix 10A of the DEIS.

TP CALCULATIONS POST DEVELOPMENT POST TREATMENT BIG INDIAN
Page 15 of 36
Total Phosphorus Load (kg/year)
Land Use Type
Calculation Method
Forest Impervious Landscape Golf Course
Composite golf course and
landscape loading Total
Wastewater Treatment Facility
Effluent
Total Post-treatment
Discharges
Post Development (Post-treatment) Direct Calculation/Giggle Hollowa 56.33 41.17 NA NA 75.05 172.55 60 232.55 Treatment results in 40% removal of TP. Below is the equation used to determine the post development post-treatment TP concentration.
Impervious concentration [(0.00026 kg/m3)(52.4 acres * 4047 m2)(1.27 m * 0.98)][1-0.40] = 41.17 kg/yrGolf course and landscape concentration
[(0.449 kg/ac/yr)(278.6 acres)][1-0.40] = 75.05 kg/yr
Forest concentration (0.00002005 kg/m3)(911 acres * 4047 m2)(1.27 m * 0.60) = 56.33 kg/yr Total Post Development Post Treatment Loading 172.55 kg/yr a Forest runoff = 0.02005 mg/l based on NYC DEP 2002 data report and Appendix 18 of the DEIS water quality data.
REVISED

TP CALCULATIONS POST DEVELOPMENT POST TREATMENT BIG INDIAN
Page 16 of 36
Total Phosphorus Load (kg/year)
Land Use Type
Calculation Method
Forest Impervious Landscape Golf Course
Composite golf course and
landscape loading Total
Wastewater Treatment Facility
Effluent
Total Post-treatment
Discharges
Post Development (Post-treatment) Direct Calculation EPAb 42.14 31.43 NA NA 62.54 136.11 60 196.11 Treatment results in 50% removal of TP. Below is the equation used to determine the post development post treatment TP concentration. Impervious concentration [(0.00026 kg/m3)(52.4 acres * 4047 m2)(1.27 m * 0.9)]/2 = 31.43 kg/yrGolf course and landscape concentration
[(0.449 kg/ac/yr)(278.6 acres)]/2 = 62.54 kg/yr
Forest concentration (0.00001 kg/m3)(911 acres * 4047 m2)(1.27 m * 0.9) = 42.14 kg/yr Total Post Development Post Treatment Loading 136.11 kg/yr b Pavement = 0.26 mg/l, Golf Course and Landscape combined runoff = 0.449 kg/ac and Forest runoff = 0.010 mg/l

TP CALCULATIONS POST DEVELOPMENT POST TREATMENT BIG INDIAN
Page 17 of 36
Total Phosphorus Load (kg/year)
Land Use Type
Calculation Method
Forest Impervious Landscape Golf Course
Composite golf course and
landscape loading Total
Wastewater Treatment Facility
Effluent
Total Post-treatment
Discharges Post Development (Post-treatment) Modified Simple Method*c 84.49 22.18 22.45 NA 128.12 60 189.12 *NYC DEP 1997
(Simple Method Post-treatment Value) + [(Post-Development Post-treatment 99 lbs/year TP for 100 acre golf course)] + (Remainder of site as Forested) =Post-Development Post-Treatment
(22.18 kg/yr) + (22.45 kg/yr) + (84.49 kg/yr) = 128.12 kg/yr c Golf course runoff at 0.99 lbs/acre and forest runoff for rest of each site at 0.02005 mg/l added to developed site

TP CALCULATIONS PRE DEVELOPMENT WILDACRES
Page 18 of 36
Total Phosphorus Load (kg/year)
Land Use Type
Calculation Method
Forest Impervious Landscape Golf Course
Composite golf course and
landscape loading Total Predevelopment WinSLAMM DEIS 124 NA NA NA NA 124 WinSLAMM is a computer program that provides the user with an estimate of runoff quality developed by R. Pitt and J. Voorhees, 2000. The program is derived from empirical (real world) data collected during the National Urban Runoff Program. The above data is the result of the computer simulation. See Appendix 10A of the DEIS.

TP CALCULATIONS PRE DEVELOPMENT WILDACRES
Page 19 of 36
Total Phosphorus Load (kg/year)
Land Use Type
Calculation Method
Forest Impervious Landscape Golf Course
Composite golf course and
landscape loading Total Predevelopment Direct Calculation/Giggle Hollowa 47.35 NA NA NA NA 47.35 Below is the equation used to determine the predevelopment TP concentration. (0.00002005 kg/m3)(718 acres * 4047 m2)(1.27 m * 0.64) = 47.35 kg/yr a Forest runoff = 0.02005 mg/l based on NYC DEP 2002 data report
REVISED

TP CALCULATIONS PRE DEVELOPMENT WILDACRES
Page 20 of 36
Total Phosphorus Load (kg/year)
Land Use Type
Calculation Method
Forest Impervious Landscape Golf Course
Composite golf course and
landscape loading Total Predevelopment Direct Calculation EPAb 33.21 NA NA NA NA 33.21 Below is the equation used to determine the predevelopment TP concentration. (TP concentration) * (area) * (annual rainfall*0.9) = Annual TP concentration for site
(0.00001 kg/m3)(718 acres * 4047 m2)(1.27 m * 0.9) = 33.21 kg/yr b Forest runoff = 0.010 mg/l (USEPA)

TP CALCULATIONS PRE DEVELOPMENT WILDACRES
Page 21 of 36
Total Phosphorus Load (kg/year)
Land Use Type
Calculation Method
Forest Impervious Landscape Golf Course
Composite golf course and
landscape loading Total Predevelopment Modified Simple Method* 49.81 NA NA NA NA 49.81 *NYC DEP 1997 Below is the equation used to determine the predevelopment TP concentration. (TP concentration) * (area) * (annual rainfall*0.9) = Annual TP concentration for site
(0.000015 kg/m3)(718 acres * 4047 m2)(1.27 m * 0.9) = 49.81 kg/yr

TP CALCULATIONS POST DEVELOPMENT PRE TREATMENT WILDACRES
Page 22 of 36
Total Phosphorus Load (kg/year)
Land Use Type
Calculation Method
Forest Impervious Landscape Golf Course
Composite golf course and
landscape loading Total Post Development (Pre-treatment) WinSLAMM DEIS NA NA NA NA NA 217.6 WinSLAMM is a computer program that provides the user with an estimate of runoff quality developed by R. Pitt and J. Voorhees, 2000. The program is derived from empirical (real world) data collected during the National Urban Runoff Program. The above data is the result of the computer simulation. See Appendix 10A of the DEIS.
TP CALCULATIONS POST DEVELOPMENT PRE TREATMENT WILDACRES
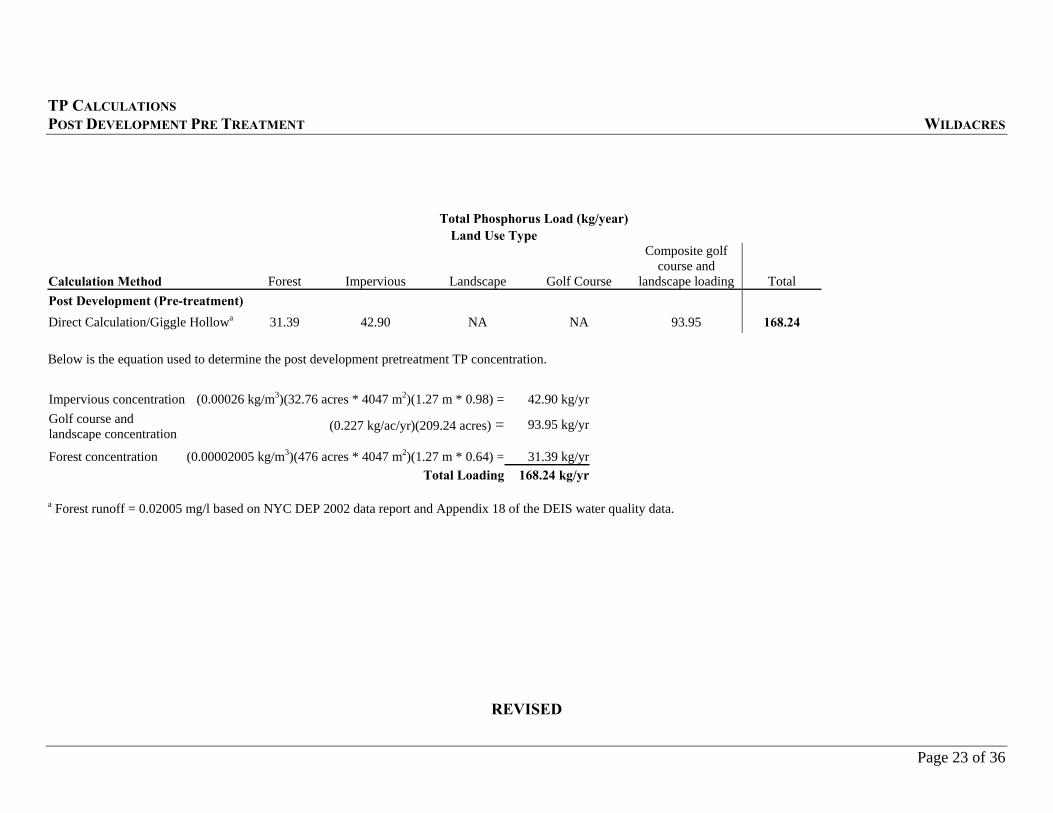
Page 23 of 36
Total Phosphorus Load (kg/year)
Land Use Type
Calculation Method
Forest Impervious Landscape Golf Course
Composite golf course and
landscape loading Total Post Development (Pre-treatment) Direct Calculation/Giggle Hollowa 31.39 42.90 NA NA 93.95 168.24 Below is the equation used to determine the post development pretreatment TP concentration. Impervious concentration (0.00026 kg/m3)(32.76 acres * 4047 m2)(1.27 m * 0.98) = 42.90 kg/yrGolf course and landscape concentration (0.227 kg/ac/yr)(209.24 acres) = 93.95 kg/yr
Forest concentration (0.00002005 kg/m3)(476 acres * 4047 m2)(1.27 m * 0.64) = 31.39 kg/yr Total Loading 168.24 kg/yr a Forest runoff = 0.02005 mg/l based on NYC DEP 2002 data report and Appendix 18 of the DEIS water quality data.
REVISED

TP CALCULATIONS POST DEVELOPMENT PRE TREATMENT WILDACRES
Page 24 of 36
Total Phosphorus Load (kg/year)
Land Use Type
Calculation Method
Forest Impervious Landscape Golf Course
Composite golf course and
landscape loading Total Post Development (Pre-treatment) Direct Calculation EPAb 22.01 39.40 NA NA 93.94 155.35 Below is the equation used to determine the post development pretreatment TP concentration. Impervious concentration (0.00026 kg/m3)(32.76 acres * 4047 m2)(1.27 m * 0.9) = 39.40 kg/yrGolf course and landscape concentration
(0.449 kg/ac/yr)(209.24 acres) = 93.94 kg/yr
Forest concentration (0.00001 kg/m3)(476 acres * 4047 m2)(1.27 m * 0.9) = 22.01 kg/yr Total Loading 155.35 kg/yr b Pavement = 0.26 mg/l, Golf Course and Landscape combined runoff = 0.449 kg/ac and Forest runoff = 0.010 mg/l

TP CALCULATIONS POST DEVELOPMENT PRE TREATMENT WILDACRES
Page 25 of 36
Total Phosphorus Load (kg/year)
Land Use Type
Calculation Method
Forest Impervious Landscape Golf Course
Composite golf course and
landscape loading Total Post Development (Pre-treatment) Modified Simple Method*c 44.14 28.94 44.9 NA 117.98 *NYC DEP 1997 The equation below represents post development pretreatment TP loadings based on 99 lbs/yr loading for a 100 acres golf course.
(Simple Method Pretreatment Value) + (99 lbs/year TP for 100 acre golf course) + (Remainder of site as Forested) =Post-Development Pre-Treatment (28.94 kg/yr) + (44.90 kg/yr) + (44.14 kg/yr) = 117.98 kg/yr
c Golf course runoff at 0.99 lbs/acre and forest runoff for rest of each site at 0.02005 mg/l added to developed site

TP CALCULATIONS POST DEVELOPMENT POST TREATMENT WILDACRES
Page 26 of 36
Total Phosphorus Load (kg/year)
Land Use Type
Calculation Method
Forest Impervious Landscape Golf Course
Composite golf course and
landscape loading Total
Wastewater Treatment Facility
Effluent
Total Post-treatment
Discharges Post Development (Post-treatment) WinSLAMM DEIS NA NA NA NA NA 146 78 224 WinSLAMM is a computer program that provides the user with an estimate of runoff quality developed by R. Pitt and J. Voorhees, 2000. The program is derived from empirical (real world) data collected during the National Urban Runoff Program. The above data is the result of the computer simulation. See Appendix 10A of the DEIS.

TP CALCULATIONS POST DEVELOPMENT POST TREATMENT WILDACRES
Page 27 of 36
Total Phosphorus Load (kg/year)
Land Use Type
Calculation Method
Forest Impervious Landscape Golf Course
Composite golf course and
landscape loading Total
Wastewater Treatment Facility
Effluent
Total Post-treatment
Discharges
Post Development (Post-treatment) Direct Calculation/Giggle Hollowa 31.39 25.74 NA NA 56.37 113.50 78 191.50 Treatment results in 40% removal of TP. Below is the equation used to determine the post development post-treatment TP concentration. Impervious concentration [(0.00026 kg/m3)(32.76 acres * 4047 m2)(1.27 m * 0.98)][1-0.40] = 25.74 kg/yr Golf course and landscape concentration [(0.449 kg/ac/yr)(209.24 acres)][1-0.40] = 56.37 kg/yr
Forest concentration (0.00002005 kg/m3)(476 acres * 4047 m2)(1.27 m * 0.64) = 31.39 kg/yr Total Post Development Post Treatment Loading 113.50 kg/yr a Forest runoff = 0.02005 mg/l based on NYC DEP 2002 data report and Appendix 18 of the DEIS water quality data.
REVISED

TP CALCULATIONS POST DEVELOPMENT POST TREATMENT WILDACRES
Page 28 of 36
Total Phosphorus Load (kg/year)
Land Use Type
Calculation Method
Forest Impervious Landscape Golf Course
Composite golf course and
landscape loading Total
Wastewater Treatment Facility
Effluent
Total Post-treatment
Discharges
Post Development (Post-treatment) Direct Calculation EPAb 22.01 19.65 NA NA 46.97 88.63 78 166.63 Treatment results in 50% removal of TP. Below is the equation used to determine the post development post treatment TP concentration.
Impervious concentration [(0.00026 kg/m3)(32.76 acres * 4047 m2)(1.27 m * 0.9)]/2
= 19.65 kg/yrGolf course and landscape concentration
[(0.449 kg/ac/yr)(209.24 acres)]/2 = 46.97 kg/yr
Forest concentration (0.00001 kg/m3)(476 acres * 4047 m2)(1.27 m * 0.9) = 22.01 kg/yr Total Post Development Post Treatment Loading 88.63 kg/yr b Pavement = 0.26 mg/l, Golf Course and Landscape combined runoff = 0.449 kg/ac and Forest runoff = 0.010 mg/l

TP CALCULATIONS POST DEVELOPMENT POST TREATMENT WILDACRES
Page 29 of 36
Total Phosphorus Load (kg/year)
Land Use Type
Calculation Method
Forest Impervious Landscape Golf Course
Composite golf course and
landscape loading Total
Wastewater Treatment Facility
Effluent
Total Post-treatment
Discharges Post Development (Post-treatment) Modified Simple Method*c 44.14 14.51 22.45 NA 81.10 78 159.10 *NYC DEP 1997
(Simple Method Post-treatment Value) + [(Post-Development Post-treatment 99 lbs/year TP for 100 acre golf course)] + (Remainder of site as Forested) =Post-Development Post-Treatment
(14.51 kg/yr) + (22.45 kg/yr) + (44.14 kg/yr) = 81.10 kg/yr c Golf course runoff at 0.99 lbs/acre and forest runoff for rest of each site at 0.02005 mg/l added to developed site

TP LOADING CALCULATION COMPARISONS
Page 30 of 36
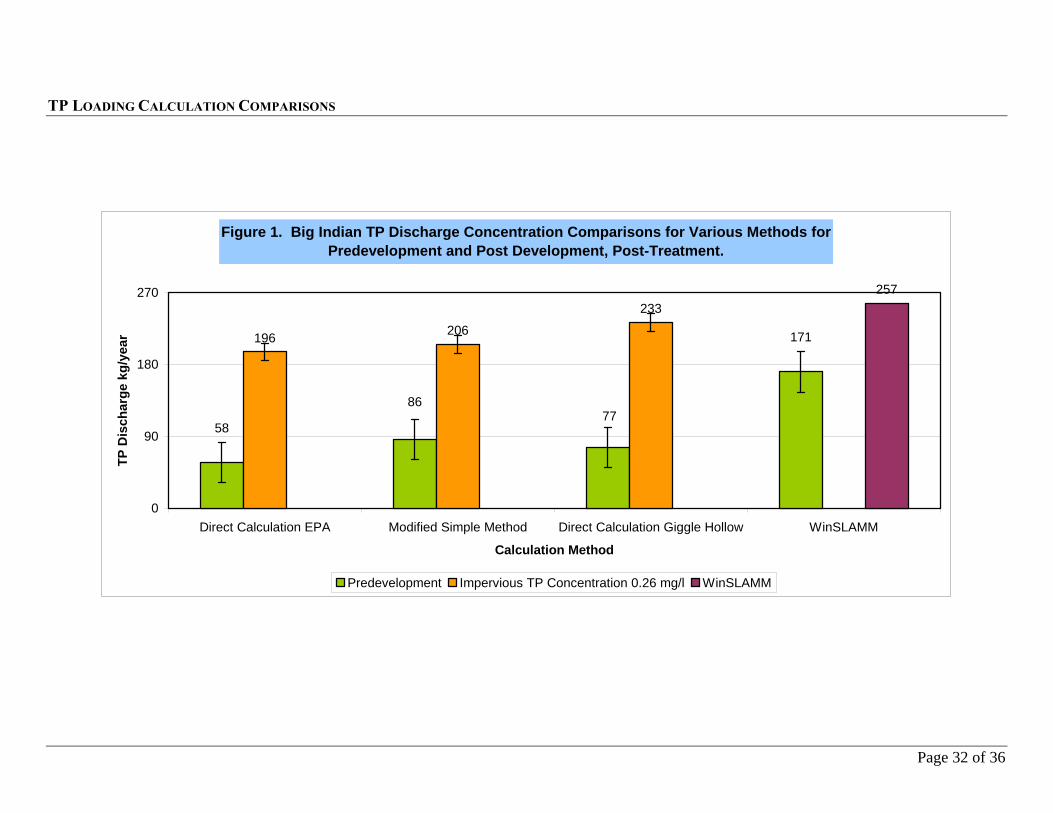
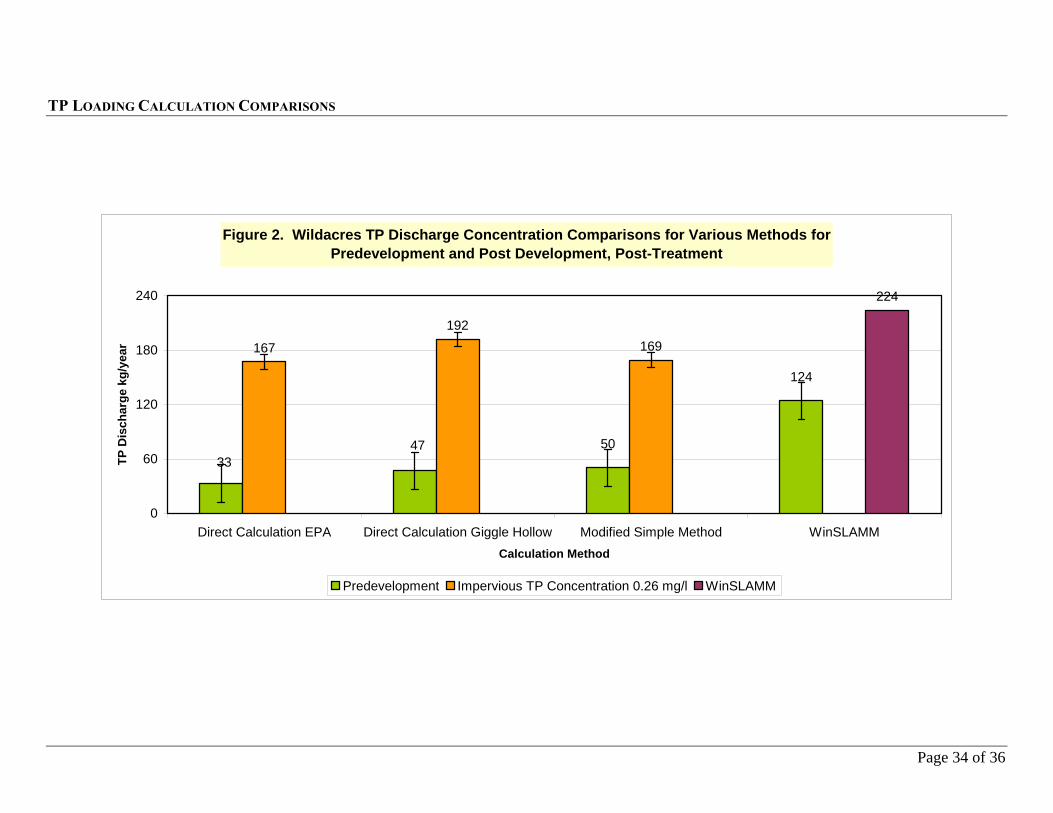
Tables 2 and 3 show a comparison of the selected methods (WinSLAMM, Direct Calculation EPA, Direct Calculation NYC DEP and Modified Simple Method) using impervious concentrations of 0.26 mg/l and 0.15 mg/l. For each method there is a relatively small variation in results between the two impervious concentrations as shown in Figures 1 and 2. Figures 1 and 2 show the variation in the annual loading as calculated by the various selected methods based on the results in Tables 2 and 3. These figures are for total point and non-point source loading. The first observation based on the data is that values derived from the direct calculation, the NYC DEP 1997 Modified Simple Method, and the NYC DEP 2000 result in similar loadings. Use of the Simple Method results in the lowest loading estimate due to the small amount of impervious surfaces associated with the project. The originators of the Simple Method recommend that values for subcatchments with less than 5% impervious be considered cautiously. The highest value results from the WinSLAMM computer model.

TP LOADING CALCULATION COMPARISONS
Page 31 of 36
Table 2. BIG INDIAN Total Phosphorus Load (kg/year) See corresponding Figure 1. Land Use Type
Calculation Method
Forest Impervious Landscape Golf Course
Composite golf course and
landscape loading Total
Post Development Pre-treatment Using an impervious concentration of 0.15 mg/l Direct Calculation/Giggle Hollow 56 40 NA NA 125 221 Direct Calculation EPA 42 36 NA NA 125 203 Modified Simple Method 85 44 45 NA 174 Using an impervious concentration of 0.26 mg/l Direct Calculation/Giggle Hollow 56 69 NA NA 125 250 Direct Calculation EPA 42 63 NA NA 125 230 Modified Simple Method 85 77 45 NA 207
Post Development Post-treatment
Wastewater Treatment Facility
Effluent
Total Post-treatment
Discharges
Using an impervious concentration of 0.15 mg/l Direct Calculation/Giggle Hollow 56 24 NA NA 75 155 60 215 Direct Calculation EPA 42 18 NA NA 63 123 60 183 Modified Simple Method 85 22 22 NA 129 60 189 Using an impervious concentration of 0.26 mg/l Direct Calculation/Giggle Hollow 56 41 NA NA 75 173 60 233 Direct Calculation EPA 42 31 NA NA 63 136 60 196 Modified Simple Method 85 39 22 NA 146 60 206
TP LOADING CALCULATION COMPARISONS
Page 32 of 36
Figure 1. Big Indian TP Discharge Concentration Comparisons for Various Methods for Predevelopment and Post Development, Post-Treatment.
196 206
233257
171
7786
58
0
90
180
270
Direct Calculation EPA Modified Simple Method Direct Calculation Giggle Hollow WinSLAMM
Calculation Method
TP D
isch
arge
kg/
year
Predevelopment Impervious TP Concentration 0.26 mg/l WinSLAMM

TP LOADING CALCULATION COMPARISONS
Page 33 of 36
Table 3. WILDACRES Total Phosphorus Load (kg/year) See corresponding Figure 2. Land Use Type
Calculation Method
Forest Impervious Landscape Golf Course
Composite golf course and
landscape loading Total
Post Development Pre-treatment Using an impervious concentration of 0.15 mg/l Direct Calculation/Giggle Hollow 31 25 NA NA 94 150 Direct Calculation EPA 22 23 NA NA 94 139 Modified Simple Method 44 29 45 NA 118 Using an impervious concentration of 0.26 mg/l Direct Calculation/Giggle Hollow 31 43 NA NA 94 168 Direct Calculation EPA 22 39 NA NA 94 155 Modified Simple Method 44 50 45 NA 139
Post Development Post-treatment
Wastewater Treatment Facility
Effluent
Total Post-treatment
Discharges
Using an impervious concentration of 0.15 mg/l Direct Calculation/Giggle Hollow 31 15 NA NA 56 102 78 180 Direct Calculation EPA 22 11 NA NA 47 80 78 158 Modified Simple Method 44 15 22 NA 81 78 159 Using an impervious concentration of 0.26 mg/l Direct Calculation/Giggle Hollow 31 26 NA NA 56 114 78 192 Direct Calculation EPA 22 20 NA NA 47 89 78 167 Modified Simple Method 44 25 22 NA 91 78 169
TP LOADING CALCULATION COMPARISONS
Page 34 of 36
Figure 2. Wildacres TP Discharge Concentration Comparisons for Various Methods for Predevelopment and Post Development, Post-Treatment
167
192169
224
124
504733
0
60
120
180
240
Direct Calculation EPA Direct Calculation Giggle Hollow Modified Simple Method WinSLAMMCalculation Method
TP D
isch
arge
kg/
year
Predevelopment Impervious TP Concentration 0.26 mg/l WinSLAMM

Page 35 of 36
REFERENCES Carco D. November 2003. The Watershed Treatment Model-Version 3.1. Center for Watershed Protection 8391 Main Street Ellicott City, MD
21043. Haith, D. 1993. Runoff Quality from Development Sites Dept. of Agriculture and Biological Engineering, Cornell University, Riley Robb Hall,
Ithaca, NY 14853. Kane, K. Proposed Phase II Phosphorus TMDL Calculation for Pepacton Reservoir.
NYC DEP, Division of Drinking Water Quality Control. Bureau of Water Supply Quality and Protection. March 1999. Kane, K. Proposed Phase II Phosphorus TMDL Calculation for Ashokan Reservoir.
NYC DEP, Division of Drinking Water Quality Control. Bureau of Water Supply Quality and Protection. March 1999. NYCDEP March 1997. Guidance for Phosphorus Offset Pilot Program Bureau of Water Supply quality and Protection Engineering and Operation
Division Project Management Group. NYC’s 2001 Watershed Protection Program Summary, Assessment and Long-term Plan. http://www.ci.nyc.ny.us/html/dep/html/fadplan.html. NYCDEP April 2002. Monitoring of Tributaries Draining Belleayre Mountain Crossroad Ventures Development location – 2001 Annual Report. NYCDEP 2003. Water Quality Monitoring Data. Appendix 18 DEIS. Olem, H. and G. Flock, eds. 1990. Lake and Reservoir Restoration Guidance Manual. 2nd Edition. EPA 440/4-90-006. Prepared by North
American Lake Management Society for U.S. EPA, Washington DC. Panuska J. and RA Lillie Phosphorus Loading from Wisconsin Watersheds Recommended Phosphorus Export Coefficients for Agricultural and
Forested Watersheds Research Management Findings Number 38, April 1995, Bureau of Research Wisconsin DNR. Pitt, R. and J. Voorheese 2000. The Source Loading and Management Model (SLAMM). Department of Civil and Environmental Engineering. The
University of Alabama at Birmingham. Birmingham AL 35266.

Page 36 of 36
Schueler, T. 1987. Controlling Urban Runoff-A Practical Manual for Planning and Design Urban BMP Washington Metropolitan Water Resources Planning Board, July 1987.
3006TP Comparison Report for hearings.doc