team meeting #5, great lakes protection fund grant a phosphorus soil test metric to reduce dissolved...
TRANSCRIPT
Team Meeting #5, Great Lakes Protection Fund GrantA Phosphorus Soil Test Metric
To Reduce Dissolved Phosphorus Loading to Lake ErieHeidelberg University
July 23 and 24, 2013
Targeting for DRP load reductions: roles of fields in agronomic range
and stratification
David BakerProject Director
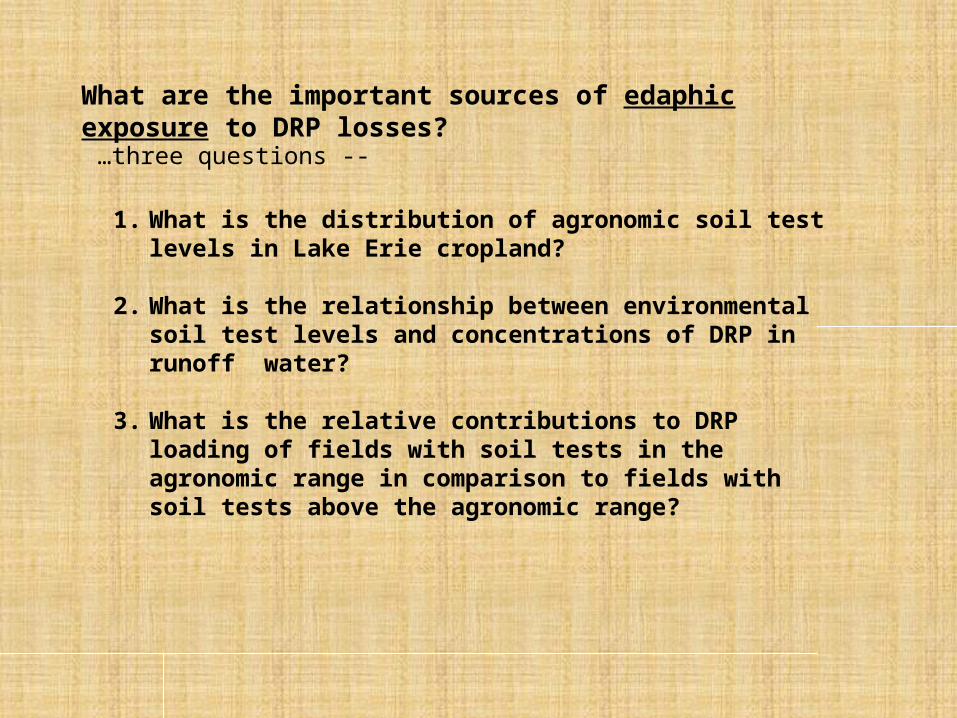
1. What is the distribution of agronomic soil test levels in Lake Erie cropland?
2. What is the relationship between environmental soil test levels and concentrations of DRP in runoff water?
3. What is the relative contributions to DRP loading of fields with soil tests in the agronomic range in comparison to fields with soil tests above the agronomic range?
What are the important sources of edaphic exposure to DRP losses?
…three questions --
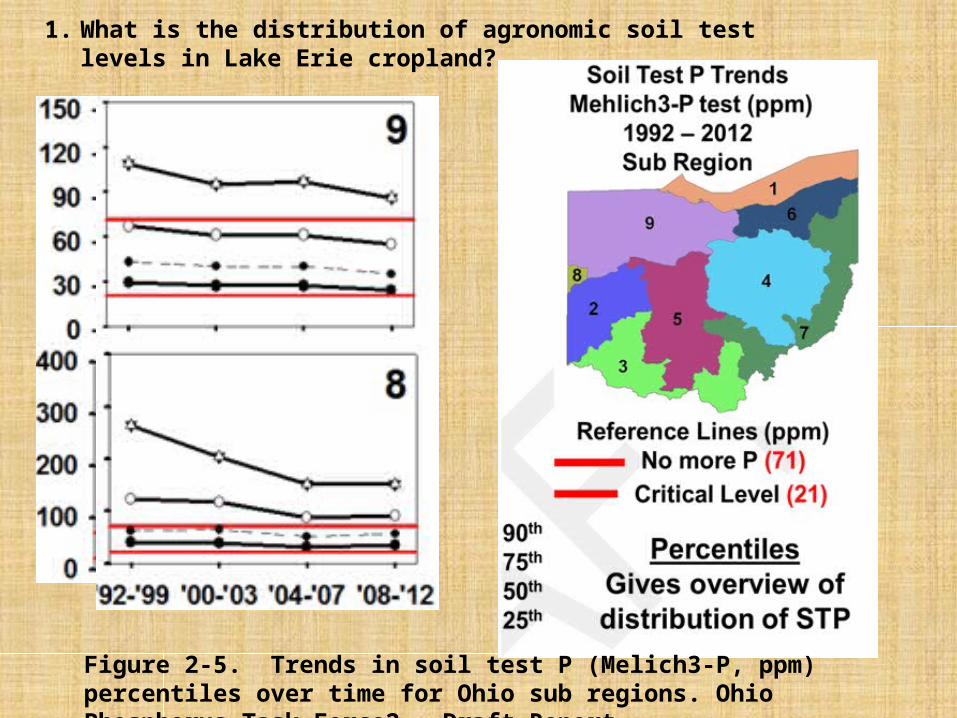
Figure 2 5. Trends in soil test P (Melich3-P, ppm) percentiles over time for Ohio ‑sub regions. Ohio Phosphorus Task Force2, Draft Report
1. What is the distribution of agronomic soil test levels in Lake Erie cropland?
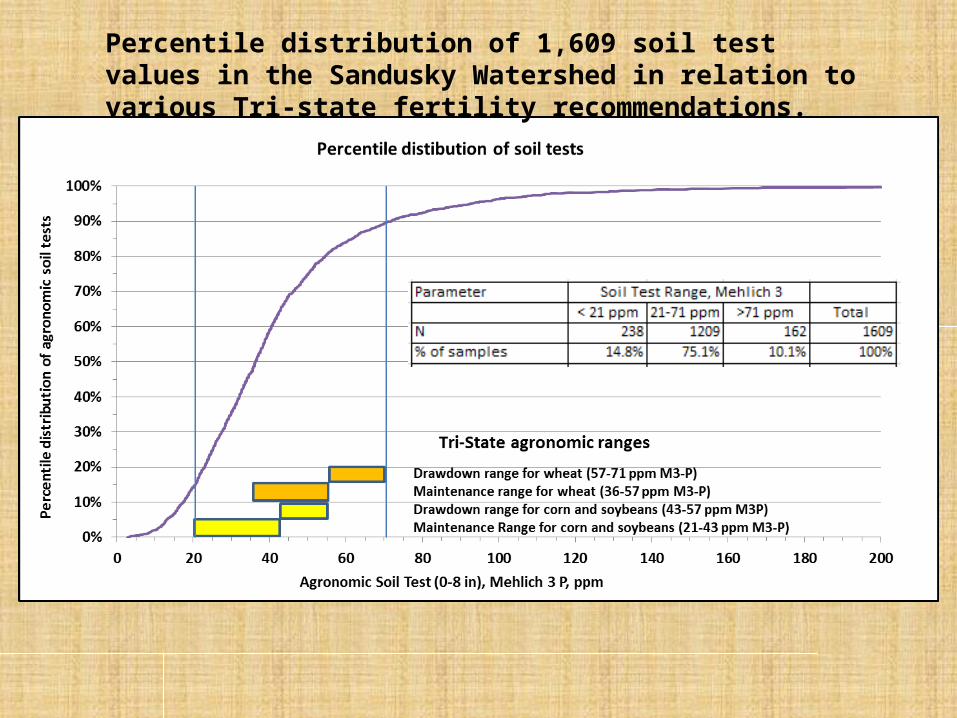
Percentile distribution of 1,609 soil test values in the Sandusky Watershed in relation to various Tri-state fertility recommendations.
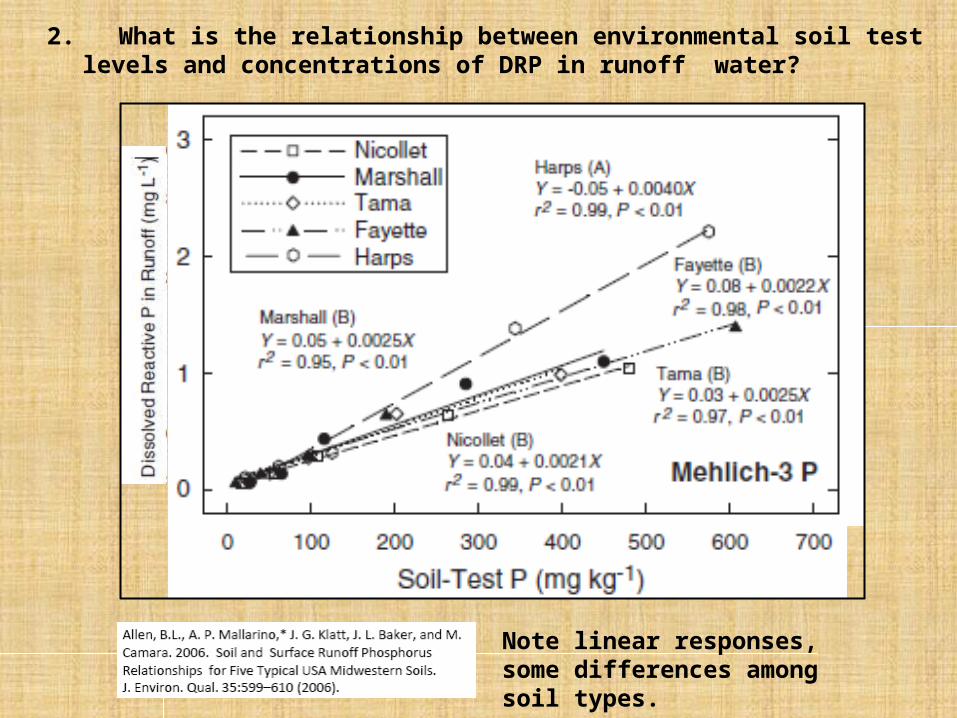
2. What is the relationship between environmental soil test levels and concentrations of DRP in runoff water?
Note linear responses, some differences among soil types.
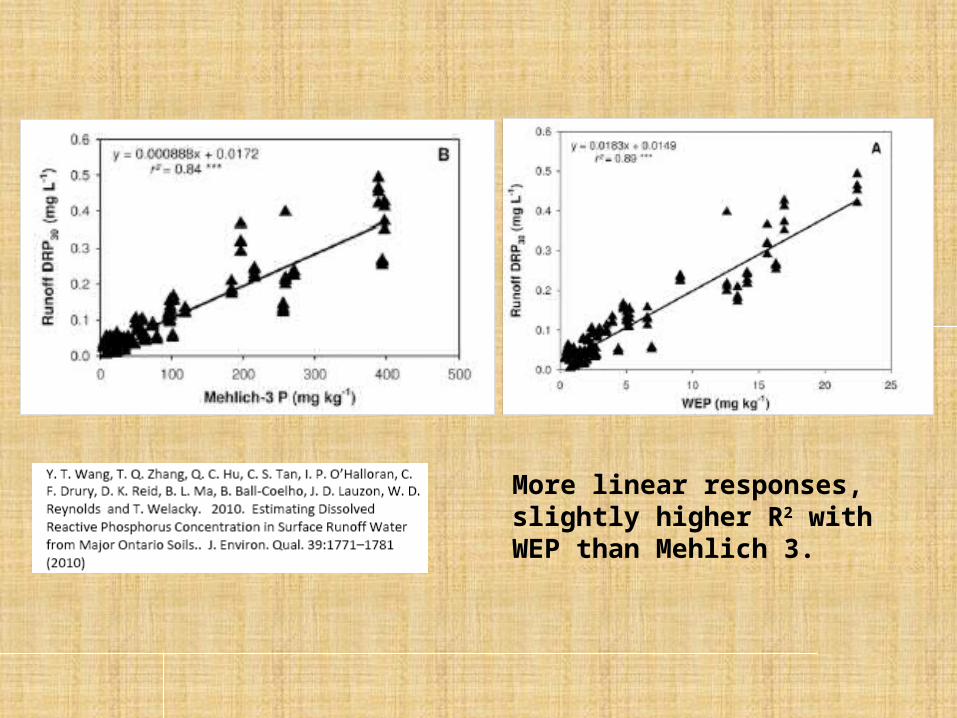
More linear responses, slightly higher R2 with WEP than Mehlich 3.
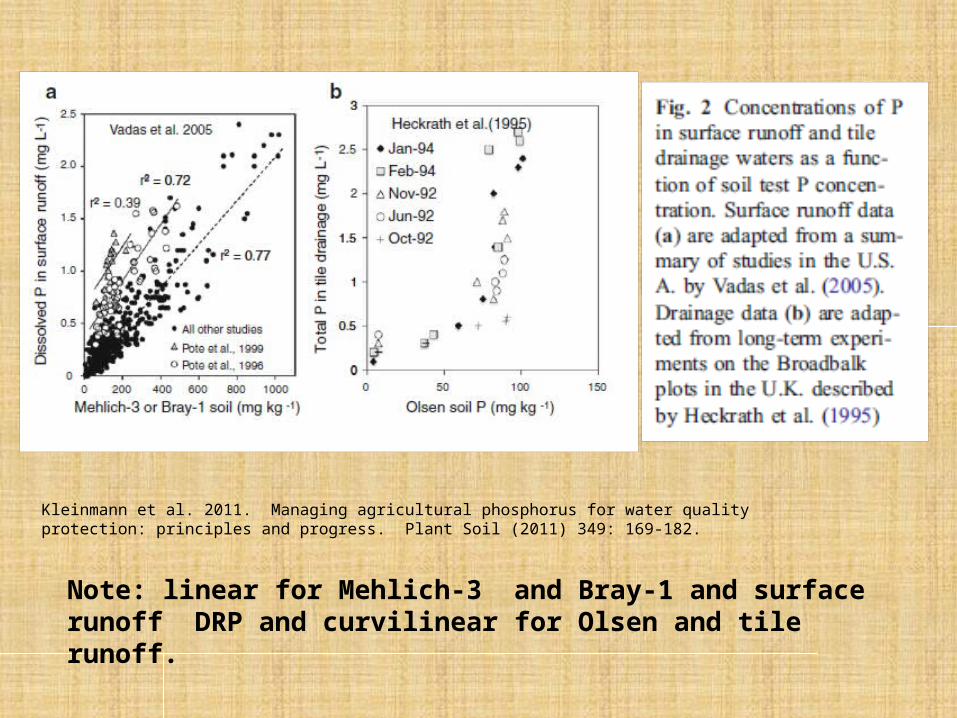
Kleinmann et al. 2011. Managing agricultural phosphorus for water quality protection: principles and progress. Plant Soil (2011) 349: 169-182.
Note: linear for Mehlich-3 and Bray-1 and surface runoff DRP and curvilinear for Olsen and tile runoff.
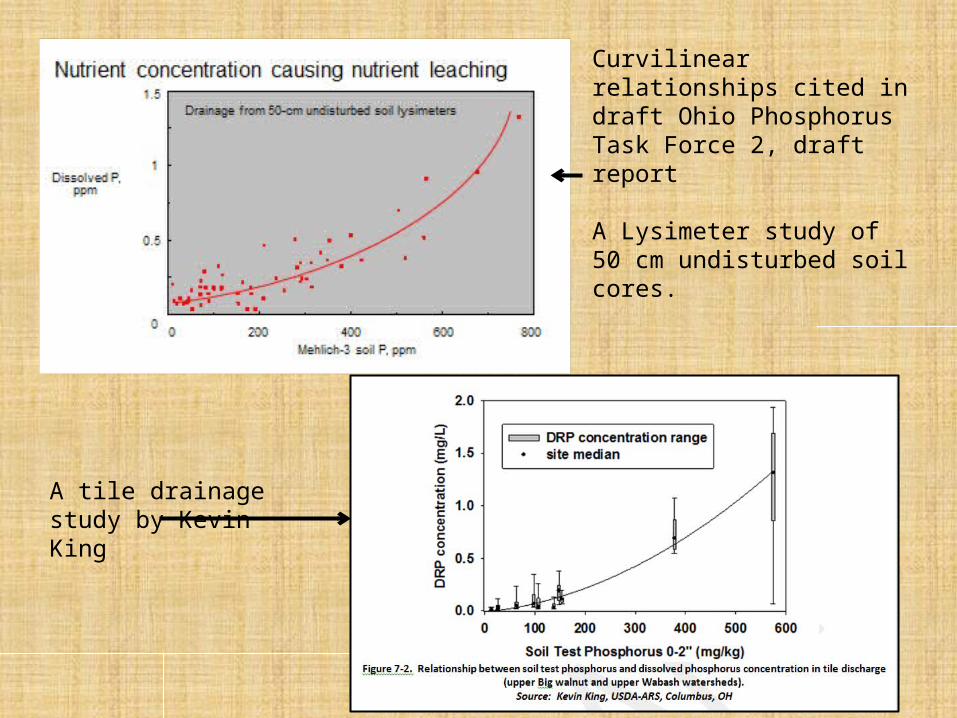
Curvilinear relationships cited in draft Ohio Phosphorus Task Force 2, draft report
A Lysimeter study of 50 cm undisturbed soil cores.
A tile drainage study by Kevin King
Summary:
Surface runoff studies often show linear relationships between DRP concentrations in surface runoff water and soil test values using standard agronomic soil test procedures, such as Mehlich 3.
Other studies show curvilinear relationships, especially for lysimeter studies or tile drainage studies where soil test levels extend to very high values.
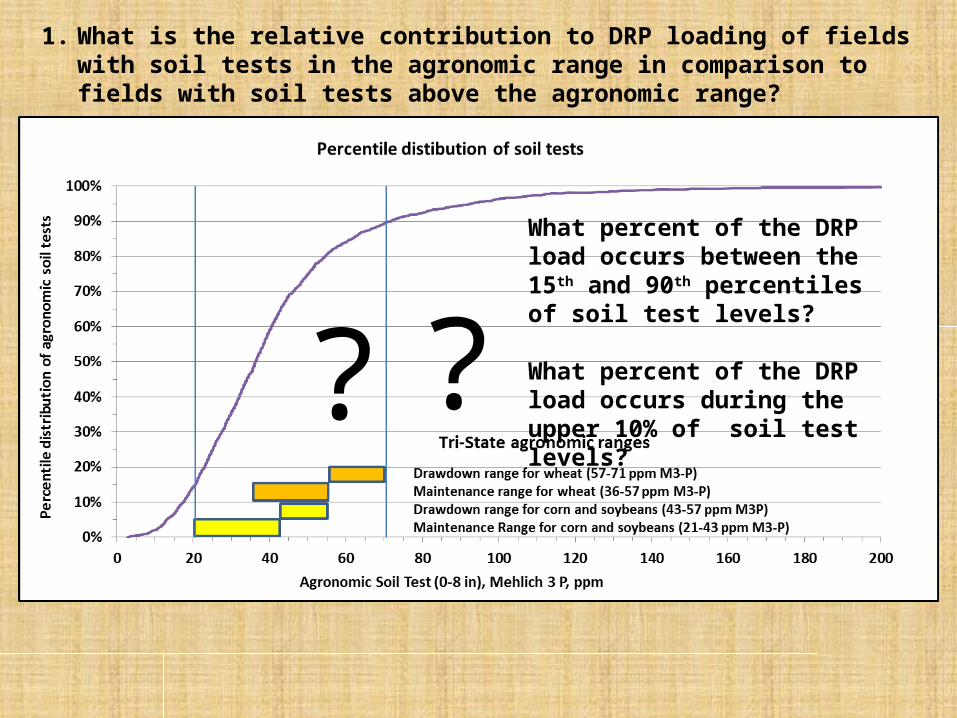
1. What is the relative contribution to DRP loading of fields with soil tests in the agronomic range in comparison to fields with soil tests above the agronomic range?
? ?What percent of the DRP load occurs between the 15th and 90th percentiles of soil test levels?
What percent of the DRP load occurs during the upper 10% of soil test levels?
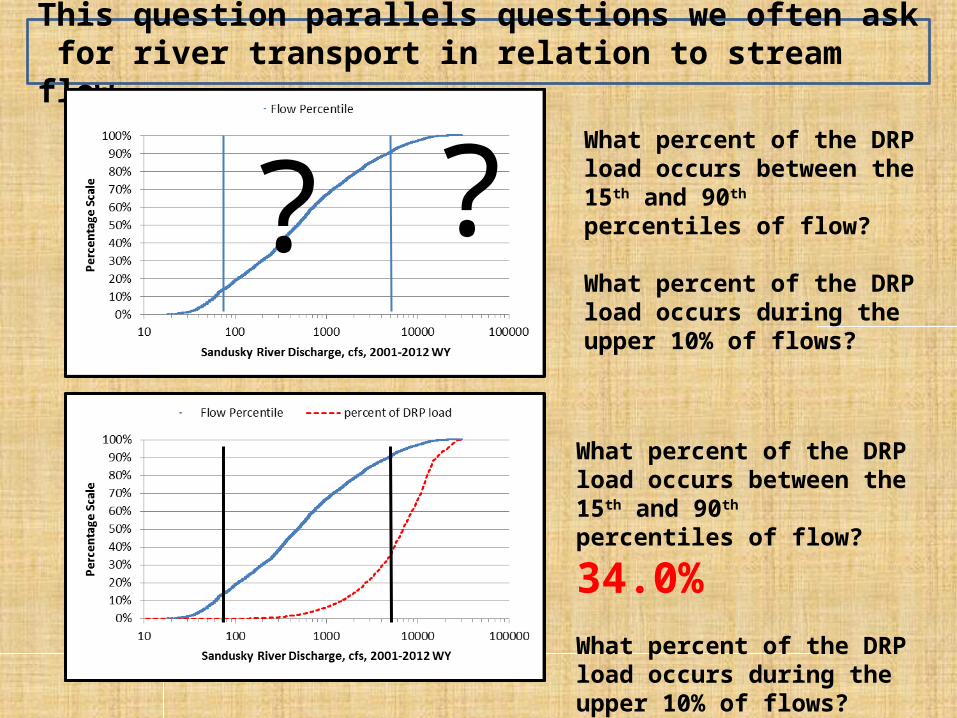
What percent of the DRP load occurs between the 15th and 90th
percentiles of flow? 34.0%What percent of the DRP load occurs during the upper 10% of
flows? 65.9%
This question parallels questions we often ask for river transport in relation to stream flow.
What percent of the DRP load occurs between the 15th and 90th percentiles of flow?
What percent of the DRP load occurs during the upper 10% of flows?
??
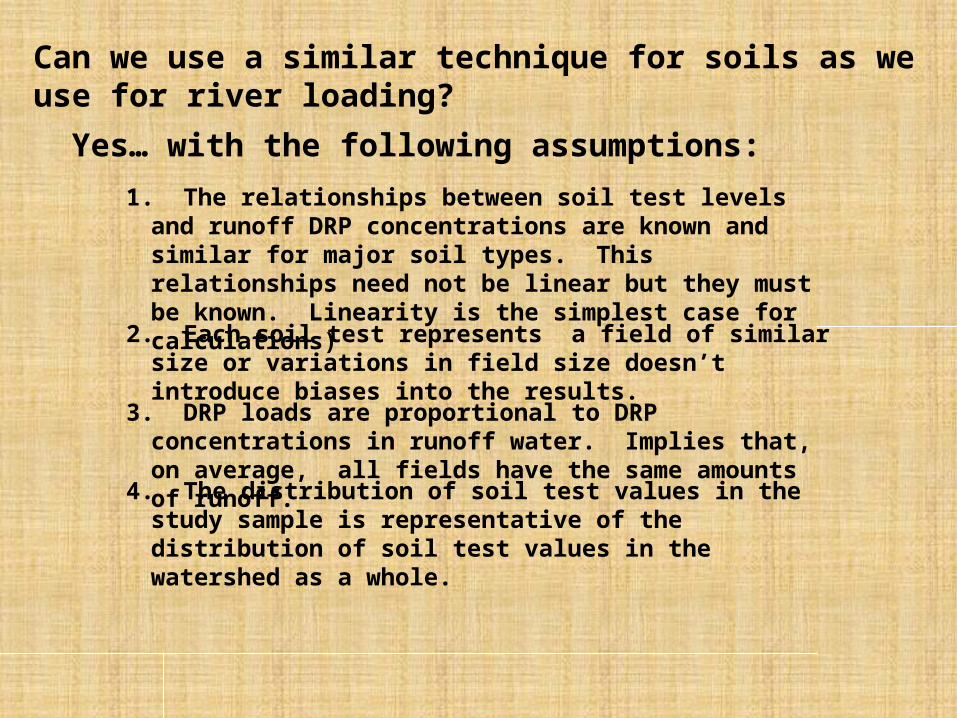
Can we use a similar technique for soils as we use for river loading?
Yes… with the following assumptions:
1. The relationships between soil test levels and runoff DRP concentrations are known and similar for major soil types. This relationships need not be linear but they must be known. Linearity is the simplest case for calculations)
2. Each soil test represents a field of similar size or variations in field size doesn’t introduce biases into the results.
3. DRP loads are proportional to DRP concentrations in runoff water. Implies that, on average, all fields have the same amounts of runoff.
4. The distribution of soil test values in the study sample is representative of the distribution of soil test values in the watershed as a whole.
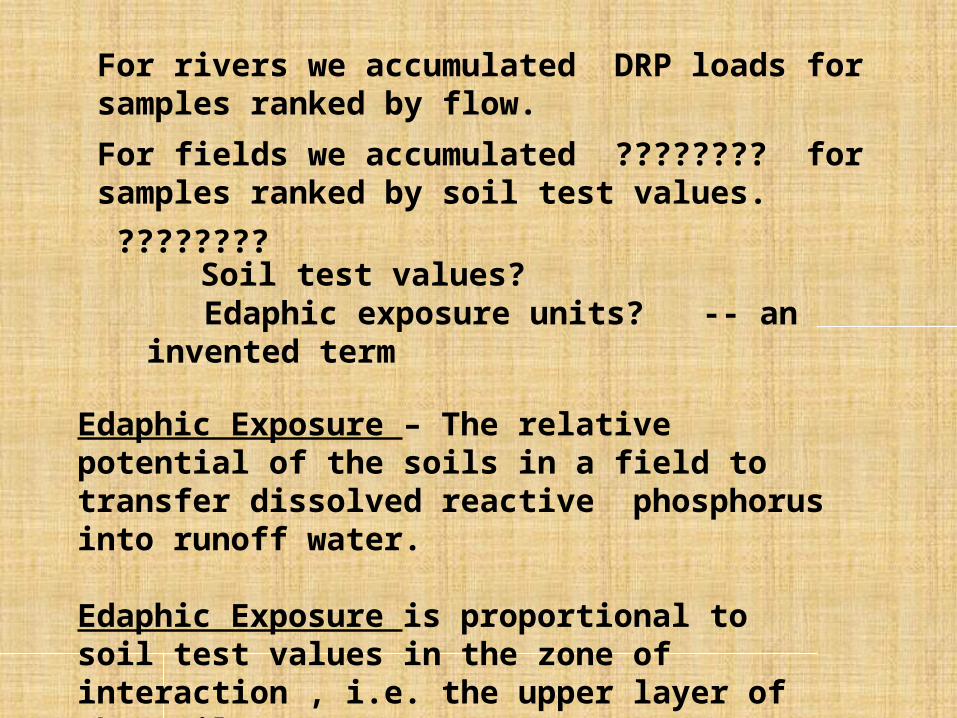
For rivers we accumulated DRP loads for samples ranked by flow.
For fields we accumulated ???????? for samples ranked by soil test values.
???????? Soil test values? Edaphic exposure units? -- an invented term
Edaphic Exposure – The relative potential of the soils in a field to transfer dissolved reactive phosphorus into runoff water.
Edaphic Exposure is proportional to soil test values in the zone of interaction , i.e. the upper layer of the soil.
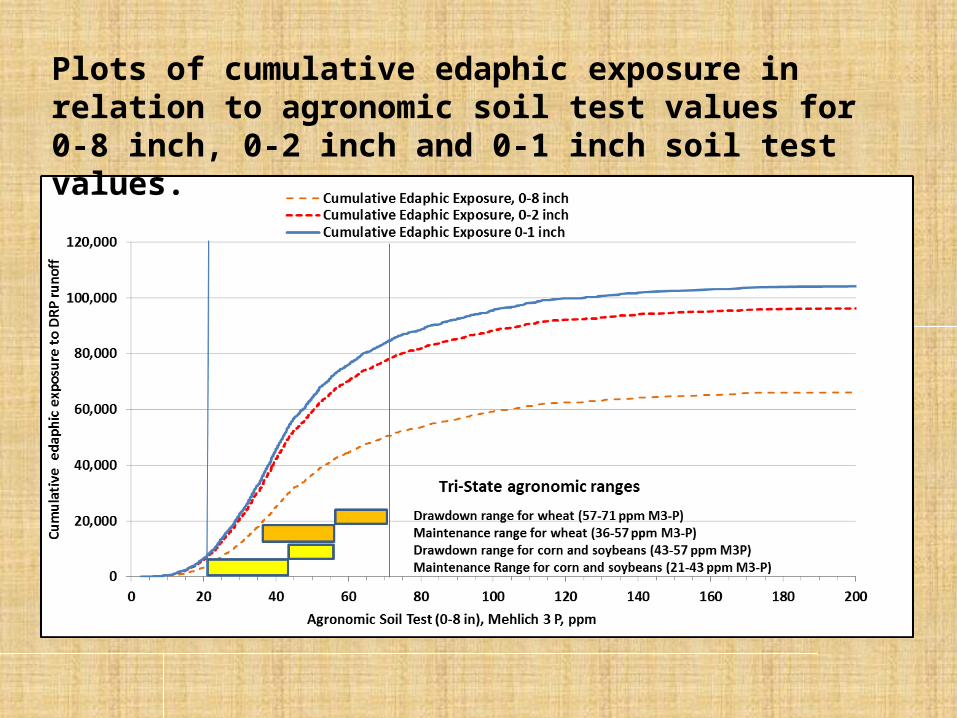
Plots of cumulative edaphic exposure in relation to agronomic soil test values for 0-8 inch, 0-2 inch and 0-1 inch soil test values.
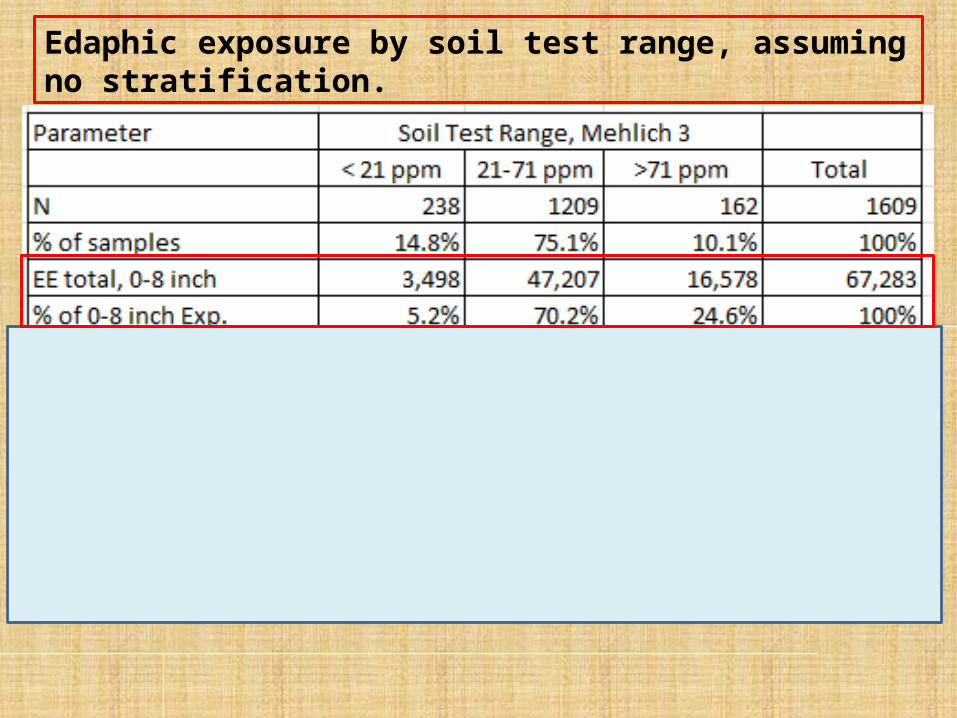
Edaphic exposure by soil test range, assuming no stratification.
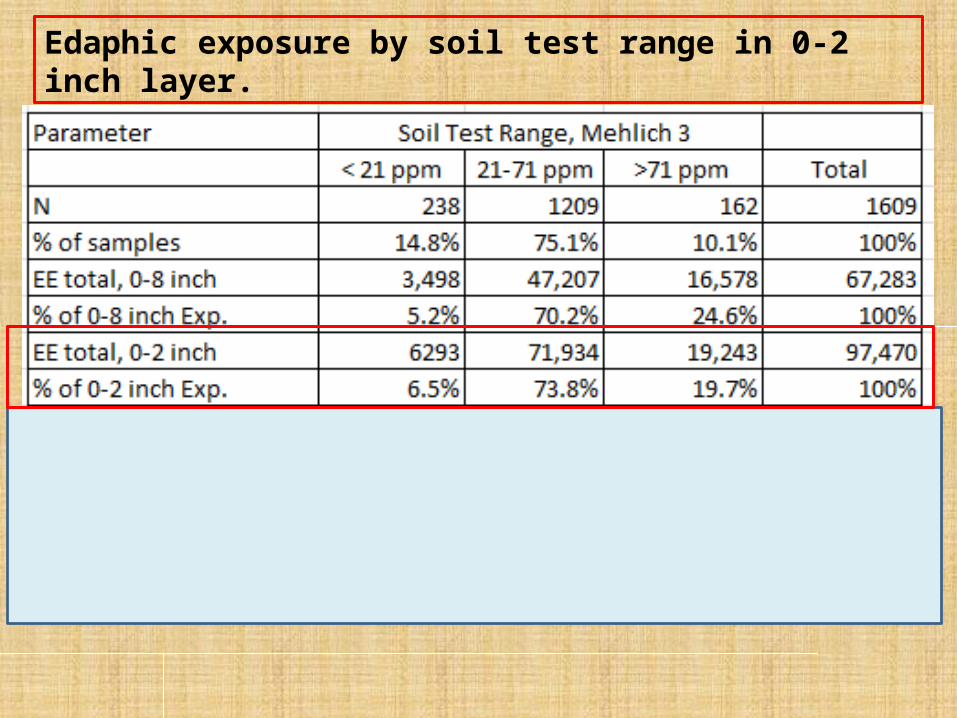
Edaphic exposure by soil test range in 0-2 inch layer.
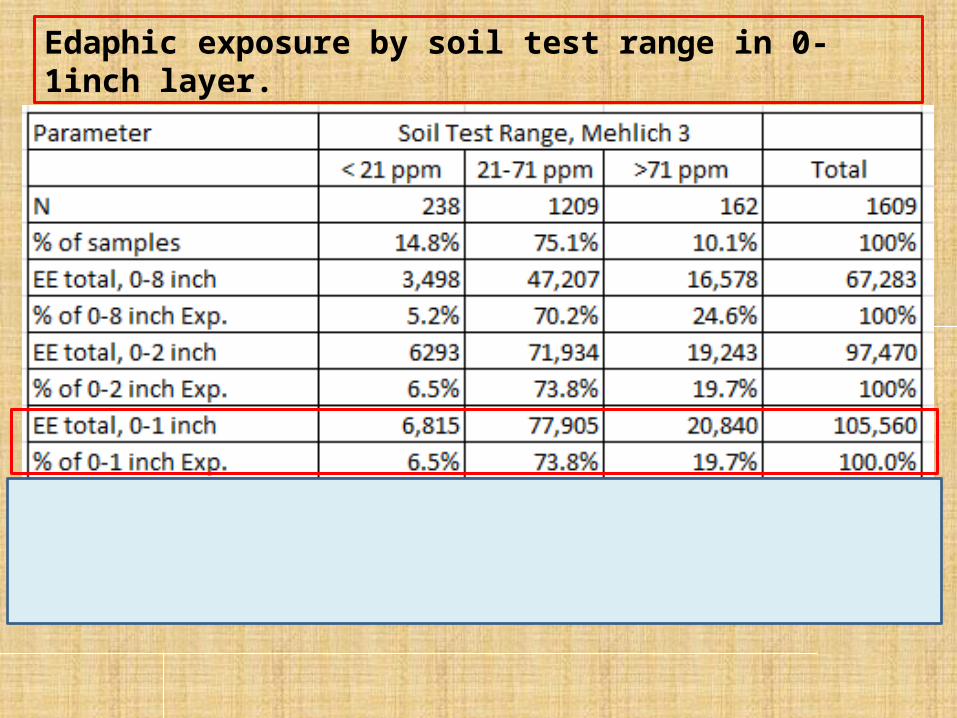
Edaphic exposure by soil test range in 0-1inch layer.
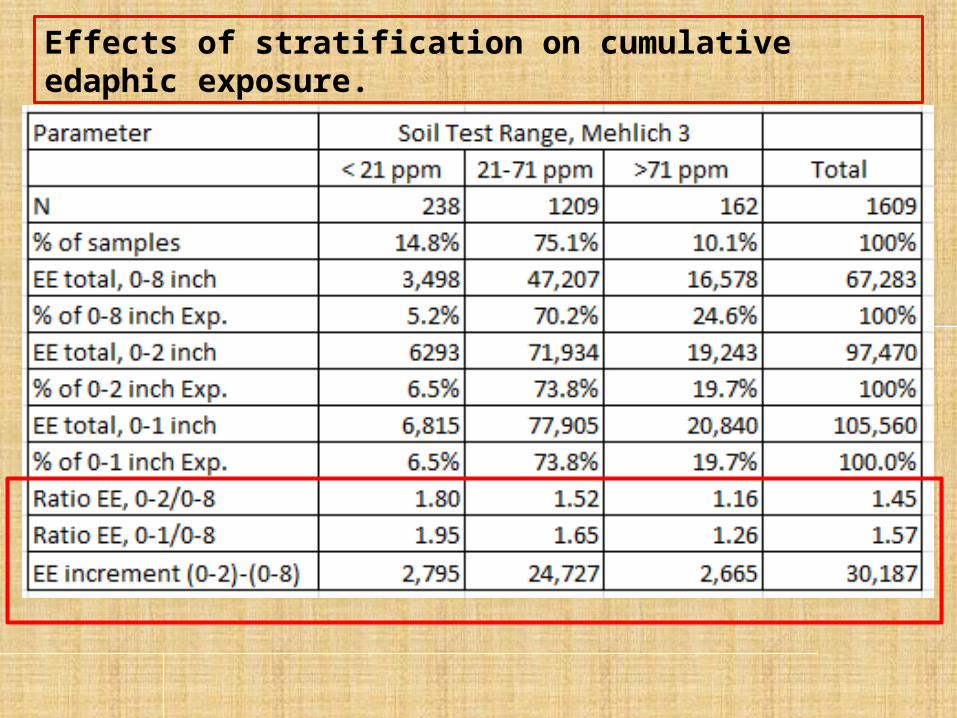
Effects of stratification on cumulative edaphic exposure.
Sample calculations of percentile distributions and cumulative edaphic exposures for soil test data.
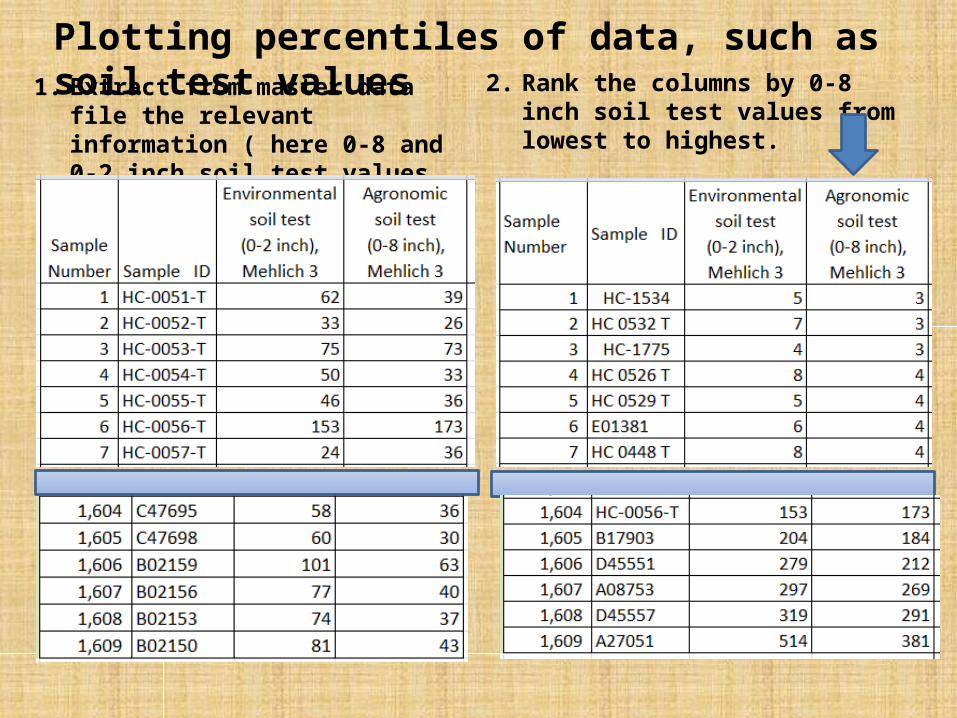
1. Extract from master data file the relevant information ( here 0-8 and 0-2 inch soil test values for 1,609 samples.
Plotting percentiles of data, such as soil test values2. Rank the columns by 0-8 inch soil test
values from lowest to highest.
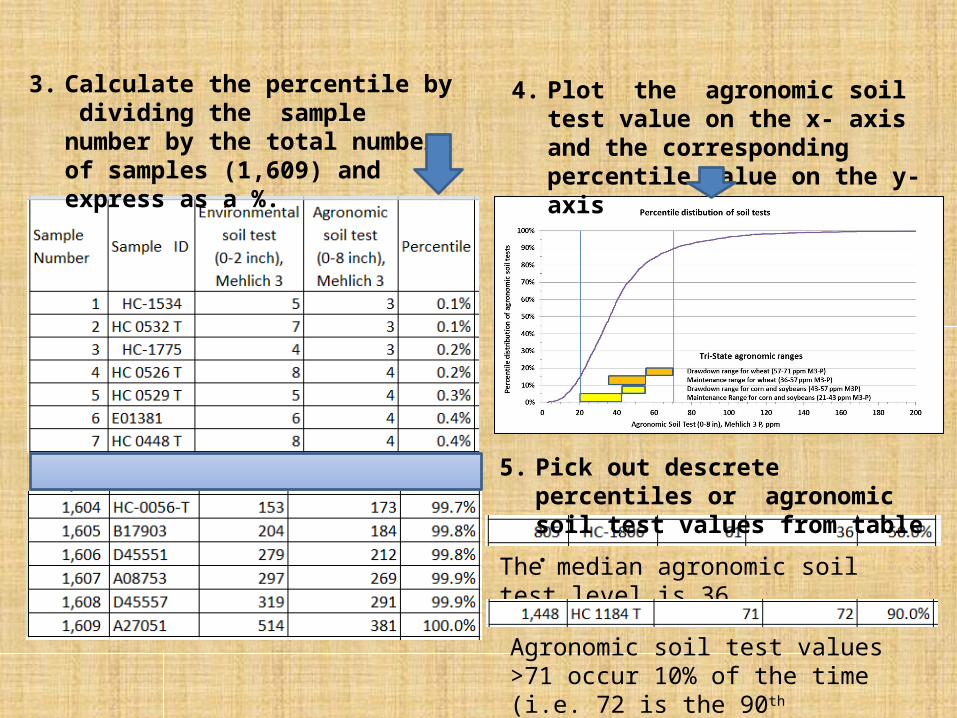
3. Calculate the percentile by dividing the sample number by the total number of samples (1,609) and express as a %.
4. Plot the agronomic soil test value on the x- axis and the corresponding percentile value on the y-axis
5. Pick out descrete percentiles or agronomic soil test values from table .
The median agronomic soil test level is 36.
Agronomic soil test values >71 occur 10% of the time (i.e. 72 is the 90th percentile).
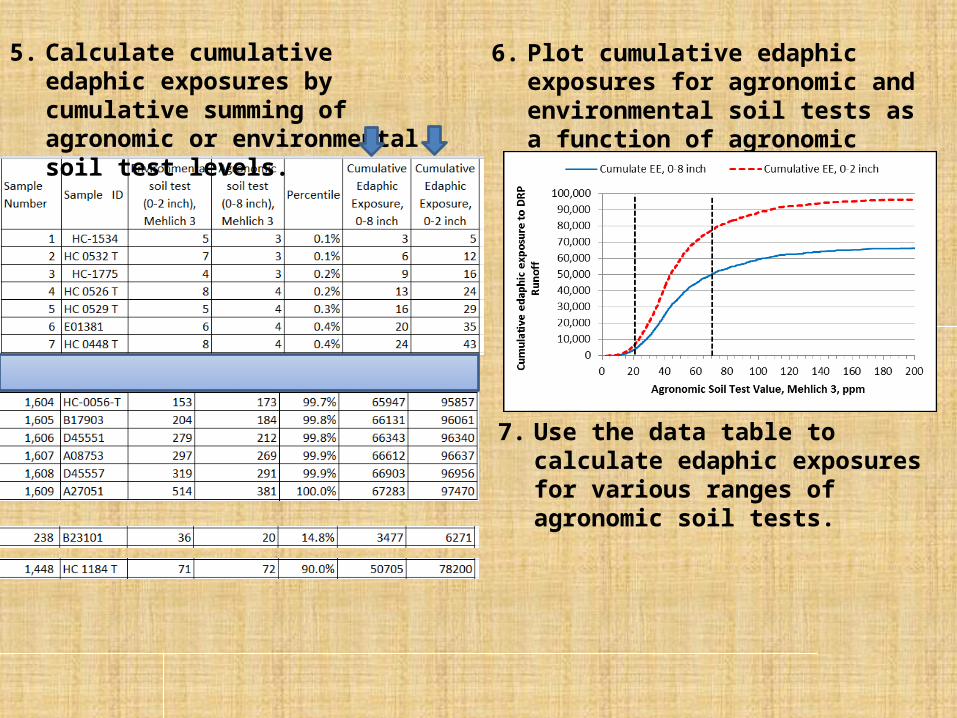
5. Calculate cumulative edaphic exposures by cumulative summing of agronomic or environmental soil test levels.
6. Plot cumulative edaphic exposures for agronomic and environmental soil tests as a function of agronomic soil test values.
7. Use the data table to calculate edaphic exposures for various ranges of agronomic soil tests.
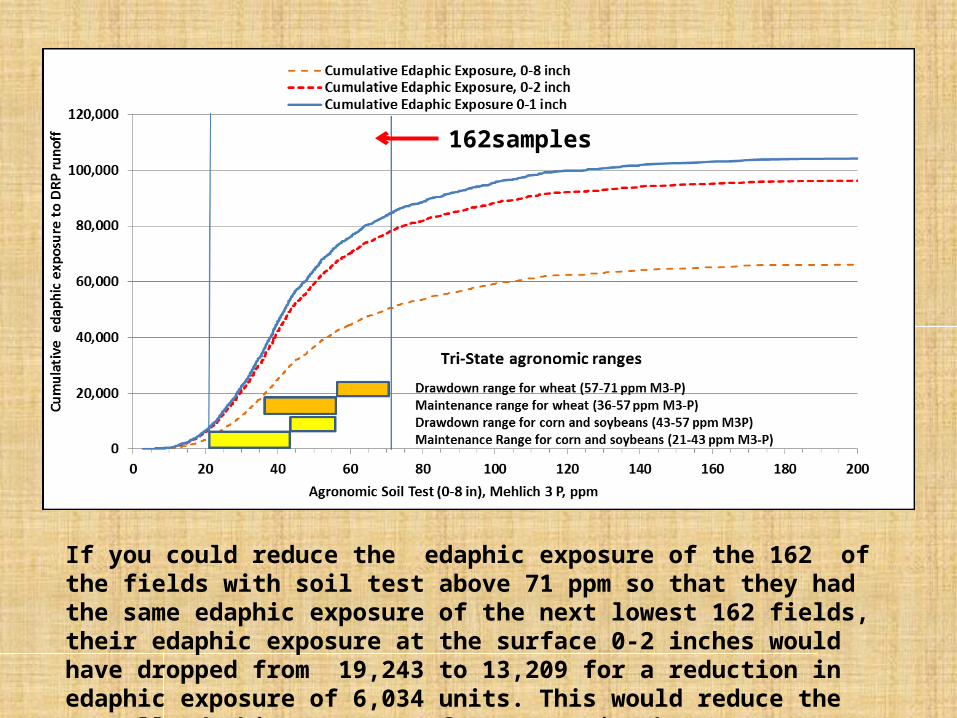
If you could reduce the edaphic exposure of the 162 of the fields with soil test above 71 ppm so that they had the same edaphic exposure of the next lowest 162 fields, their edaphic exposure at the surface 0-2 inches would have dropped from 19,243 to 13,209 for a reduction in edaphic exposure of 6,034 units. This would reduce the overall edaphic exposure of 97,470 units by ~6%.
162samples
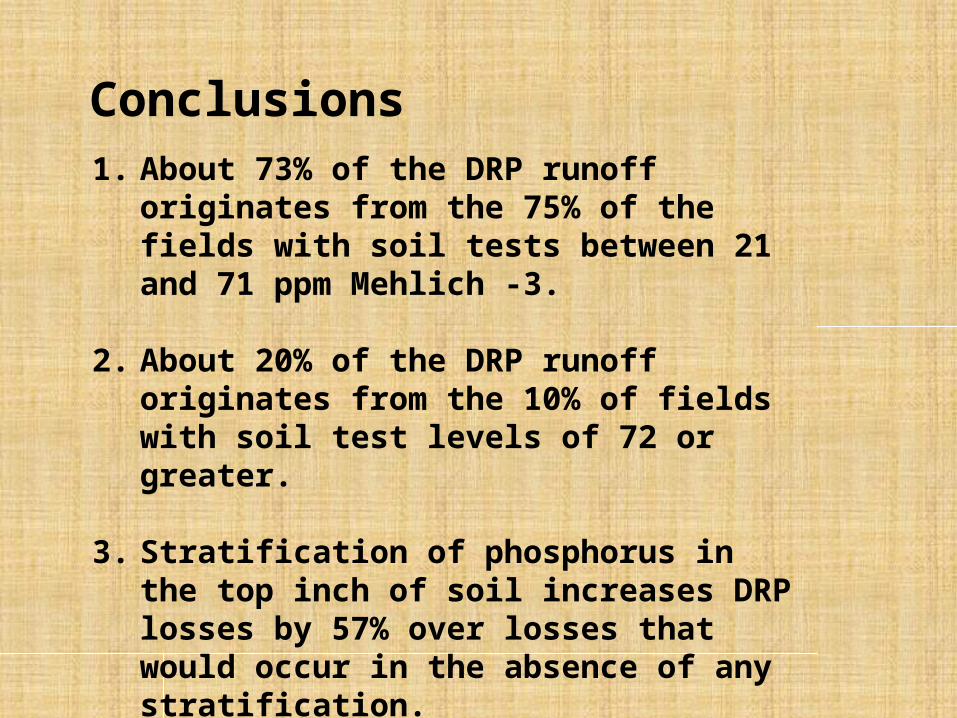
Conclusions1. About 73% of the DRP runoff originates from the
75% of the fields with soil tests between 21 and 71 ppm Mehlich -3.
2. About 20% of the DRP runoff originates from the 10% of fields with soil test levels of 72 or greater.
3. Stratification of phosphorus in the top inch of soil increases DRP losses by 57% over losses that would occur in the absence of any stratification.