an approach for determination of phosphorus objectives and ... · an approach for determination of...
TRANSCRIPT
An Approach For Determination of Phosphorus Objectives and Target
Loads for Lake Erie
Prepared for: Environment Canada Draft May 2013

Page | 2
Cover Photo Credits:
1. A Lake Erie algae bloom in September 2009. This photo was taken on the southeast shore of Pelee Island, Ontario. Photograph by Tom Archer.
2. Harmful algal bloom in western Lake Erie resulting from record-breaking nutrient loads in 2011. Along the southern coast, mats of the benthic cyanobacterium, Lyngbya wollei (dark green), washed ashore in August and were then covered with layers of toxic Microcystis sp. (bright green) rendering large stretches of coastline unusable. Photograph by Todd Crail.
3. Blue-green algae accumulation along the southwestern shoreline of Lake Erie. Photograph by David Hartson.
4. Water from Lake Erie during a cyanobacteria bloom. Photograph by Tom Bridgeman 5. A satellite image of Lake Erie on Sept. 3, 2011, overlaid on a map of the lake and its
tributaries. This image shows the bloom about six weeks after its initiation in the lake's western basin. On this date, it covers the entire western basin and is beginning to expand into the central basin. Map by Michigan Sea Grant.
6. This photo of the record-setting 2011 Lake Erie algae bloom was taken in August of that year along the southeast shore of Pelee Island, Ontario. Photograph by Tom Archer.
1 2 3
4
6
5
AN APPROACH FOR DETERMINATION OF PHOSPHORUS
OBJECTIVES AND TARGET LOADS FOR LAKE ERIE
DRAFT Prepared for:
Environment Canada
Under Contract to: Environment Canada
May 28, 2013
Prepared by: LimnoTech Ann Arbor
Page | iv
Acknowledgements We would like to thank Sandra George, Environment Canada, for recognizing the need for this effort and for serving as the Project Officer for the project that produced this discussion paper. We would also like to thank the expert advisory panel members, who provide valuable comments and feedback during the development of this paper. They are:
Victor J. Bierman, Jr. – LimnoTech William Booty – Environment Canada – NWRI Stephen Chapra – Tufts University David Dolan – University of Wisconsin – Green Bay Russell Kreis – USEPA-ORD at Grosse Ile, MI Luis Leon – Environment Canada – NWRI Jeffrey Reutter – Ohio State University Donald Scavia – University of Michigan Ralph Smith – University of Waterloo The following LimnoTech staff contributed to the writing of this discussion paper: Joseph V. DePinto, Edward Verhamme, Renn Lambert, and Daniel Rucinski.
An Approach for Determination of Phosphorus Objectives and Target Loads for Lake Erie May 28, 2013
Page | v
Table of Contents
Acknowledgements ...................................................................................................... iv
1 Introduction .................................................................................................................... 1 1.1 Background and Objectives .................................................................................... 1 1.2 Approach and Scope ............................................................................................... 3
2 Monitoring and Research .............................................................................................. 4 2.1 Federal .................................................................................................................... 4
2.1.1 US EPA / GLNPO ................................................................................ 4 2.1.2 Environment Canada ............................................................................. 5 2.1.3 NOAA ................................................................................................... 5
2.2 State ........................................................................................................................ 6 2.2.1 State of Ohio ......................................................................................... 6 2.2.2 State of Michigan .................................................................................. 6
2.3 Academic Research Programs ................................................................................ 7 2.3.1 National Center for Water Quality Research at Heidelberg University 7 2.3.2 Lake Erie Center at the University of Toledo ....................................... 7 2.3.3 The Ohio State University Ohio Sea Grant and Stone Laboratory ....... 8
2.4 Special Research Studies ........................................................................................ 8 2.4.1 Lake Erie Phosphorus Synthesis Team ................................................. 8 2.4.2 ECOFORE ............................................................................................ 9 2.4.3 Water Sustainability and Climate ......................................................... 9 2.4.4 International Field Year in Lake Erie ................................................... 9 2.4.5 Coordinated Science and Monitoring Initiative .................................. 10
2.5 Other Recent Research and Data Activities .......................................................... 10 2.5.1 Loads ................................................................................................... 10 2.5.2 Remote Sensing of Algal Blooms ....................................................... 11 2.5.3 Benthic Algal Blooms ......................................................................... 13 2.5.4 Hypoxia ............................................................................................... 13
3 Models and Management ............................................................................................ 14 3.1 Historical Modeling .............................................................................................. 14
3.1.1 Bierman ............................................................................................... 14 3.1.2 DiToro and Connolly .......................................................................... 14 3.1.3 Others Historical Models .................................................................... 15 3.1.4 1999 IAGLR Modeling Summit ......................................................... 15
3.2 Present Modeling Efforts ...................................................................................... 15 3.2.1 Chapra and Dolan Model .................................................................... 16
An Approach for Determination of Phosphorus Objectives and Target Loads for Lake Erie May 28, 2013
Page | vi
3.2.2 Stumpf, et. al. Model .......................................................................... 17 3.2.3 Rucinski, et. al. Hypoxia Model ......................................................... 17 3.2.4 Leon et al. Model ................................................................................ 18 3.2.5 LimnoTech WLEEM .......................................................................... 19 3.2.6 Zhang et al. Model .............................................................................. 20 3.2.7 Auer Great Lakes Cladophora Model ................................................. 21 3.2.8 Higgins Cladophora Growth Model ................................................... 22
3.3 Management Groups ............................................................................................. 23 3.3.1 Lake Erie Lake Wide Management Plan (LaMP) .............................. 23 3.3.2 International Joint Commission .......................................................... 23 3.3.3 Ohio Lake Erie Phosphorus Task Force II.......................................... 23 3.3.4 Western Lake Erie Basin Partnership ................................................. 23 3.3.5 Lake Erie Millennium Network .......................................................... 24
4 TAcLE Summary ......................................................................................................... 25 4.1 Attached Algae in Lake Erie ................................................................................. 25 4.2 Reducing Phosphorus Loads to Lake Erie: Best Management Practices ............. 25 4.3 Modeling the Causal Linkages among Dissolved Oxygen (DO), Chlorophyll a,
Harmful Algal Blooms (HABs) and Nutrient Loading in Lake Erie .................... 26 4.4 Interactive Effects of Nutrient Inputs and Climate Change on the Lake Erie Fish
Community ........................................................................................................... 26 4.5 Response Curves: Predictors for Cyanobacteria Blooms in Western Lake Erie .. 27 4.6 Response curves expressing the relationship between TP/SRP loads and Central
Basin hypoxia and chlorophyll concentrations ..................................................... 27 4.7 Status, causes and controls of cyanobacteria blooms in Lake Erie ...................... 28 4.8 Current loads: Lake Erie Phosphorus Load Estimation: 2008 – 2011 .................. 29 4.9 External loading sources within the watershed ..................................................... 29 4.10 Evaluate the implications of internal loads (magnitude, relative importance of
internal load) ......................................................................................................... 29
5 Proposed Framework .................................................................................................. 30 5.1 Proposed Approach ............................................................................................... 30
5.1.1 Application of Multiple Models to Develop Load – Response Relationships .......................................................................................... 30
5.1.2 Application of Multiple Models ......................................................... 31 5.1.3 Process for Applying Ensemble Modeling ......................................... 34 5.1.4 Strategy for integrating model-specific load-response relationships for
making management decisions .............................................................. 35
6 References ..................................................................................................................... 38
7 Appendix A: List of All References ........................................................................... 42
An Approach for Determination of Phosphorus Objectives and Target Loads for Lake Erie May 28, 2013
Page | vii
List of Figures
Figure 2-1 Results of Lake Erie DO monitoring, data are available back to 1991 (from epa.gov). ................................................................................................................................................. 4
Figure 2-2 An example of NOAA’s weekly HAB bulletin (from www.glerl.noaa.gov). .............. 5 Figure 2-3 Phosphorus loads from the Detroit River to Lake Erie (figure from GLEC and LTI,
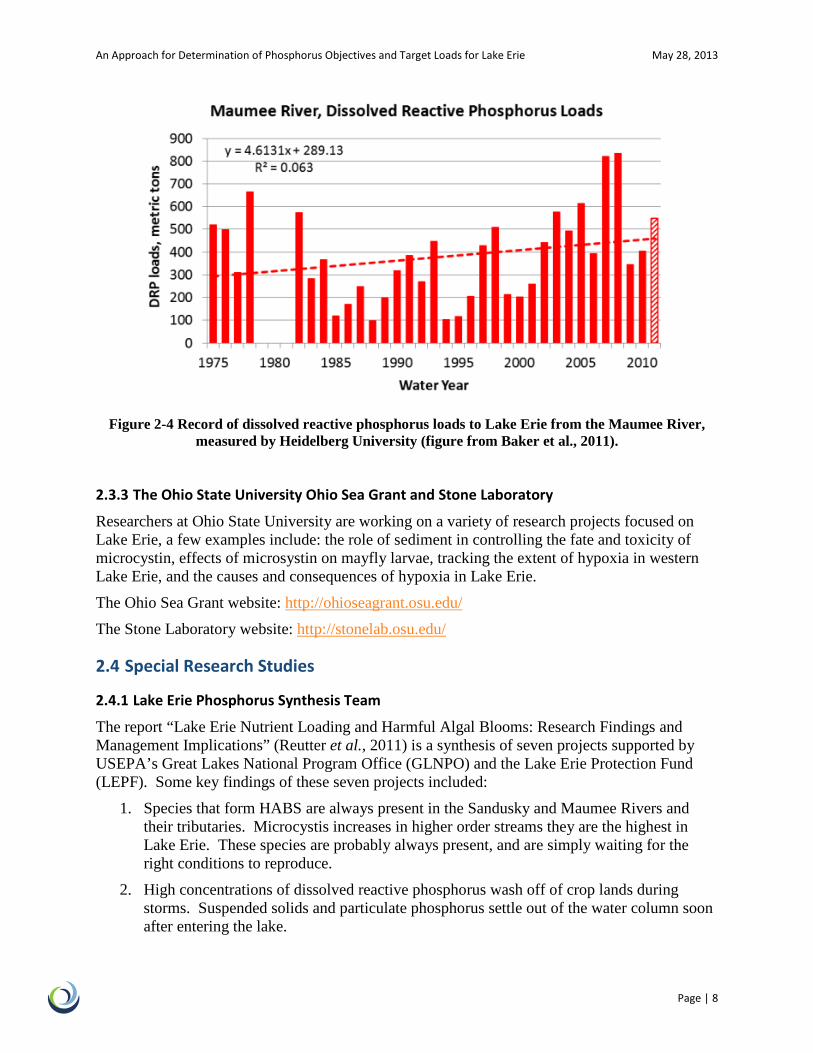
2006). ....................................................................................................................................... 7 Figure 2-4 Record of dissolved reactive phosphorus loads to Lake Erie from the Maumee River,
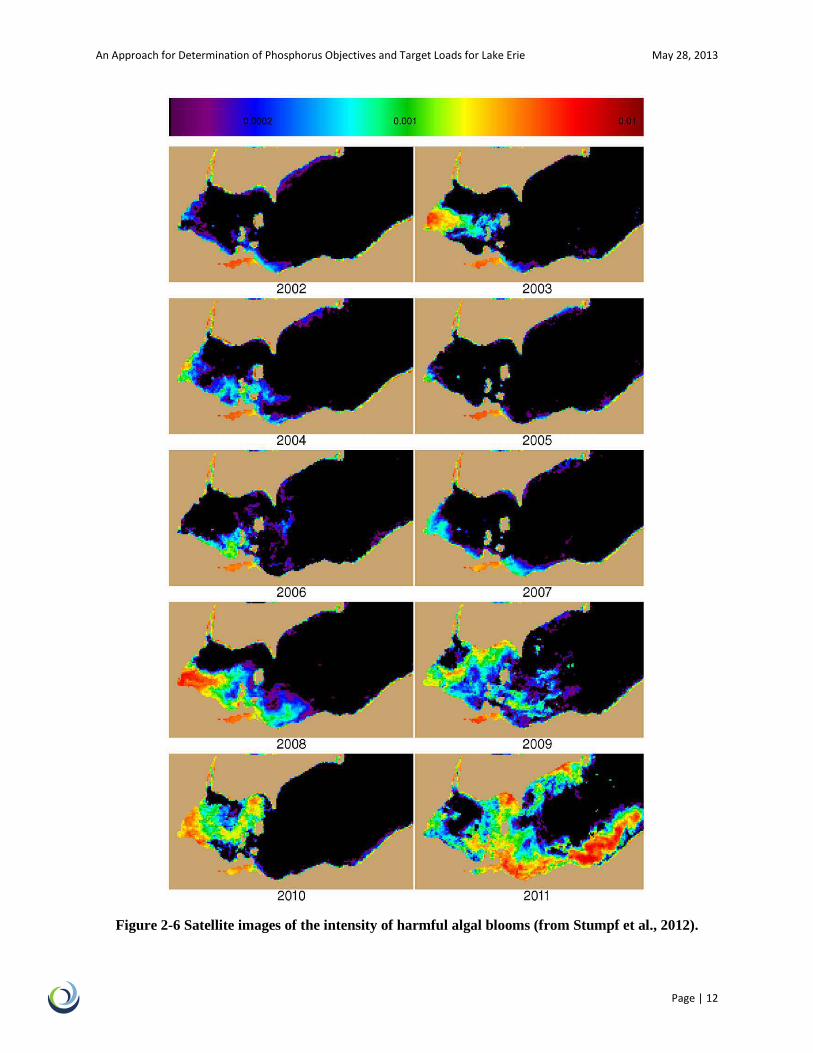
measured by Heidelberg University (figure from Baker et al., 2011). .................................... 8 Figure 2-5 Historic phosphorus loads to Lake Erie (figure from OEPA, 2010). ......................... 11 Figure 2-6 Satellite images of the intensity of harmful algal blooms (from Stumpf et al., 2012).
............................................................................................................................................... 12 Figure 3-1 Model and data comparison of TP concentration for the three basins of Lake Erie
(adapted from Chapra and Dolan (2012)). ............................................................................ 16 Figure 3-2 Maumee River TP load (March to June) versus cyanobacteria index (CI) from 2002
to 2011. .................................................................................................................................. 17 Figure 3-3 Conceptual diagram of state variables and kinetic interactions of the Lake Erie DO
Model (Rucinski (2010). ....................................................................................................... 18 Figure 3-4 Time series output of predicted concentrations of Chl-a, TP, TDP, SRP for the top 5
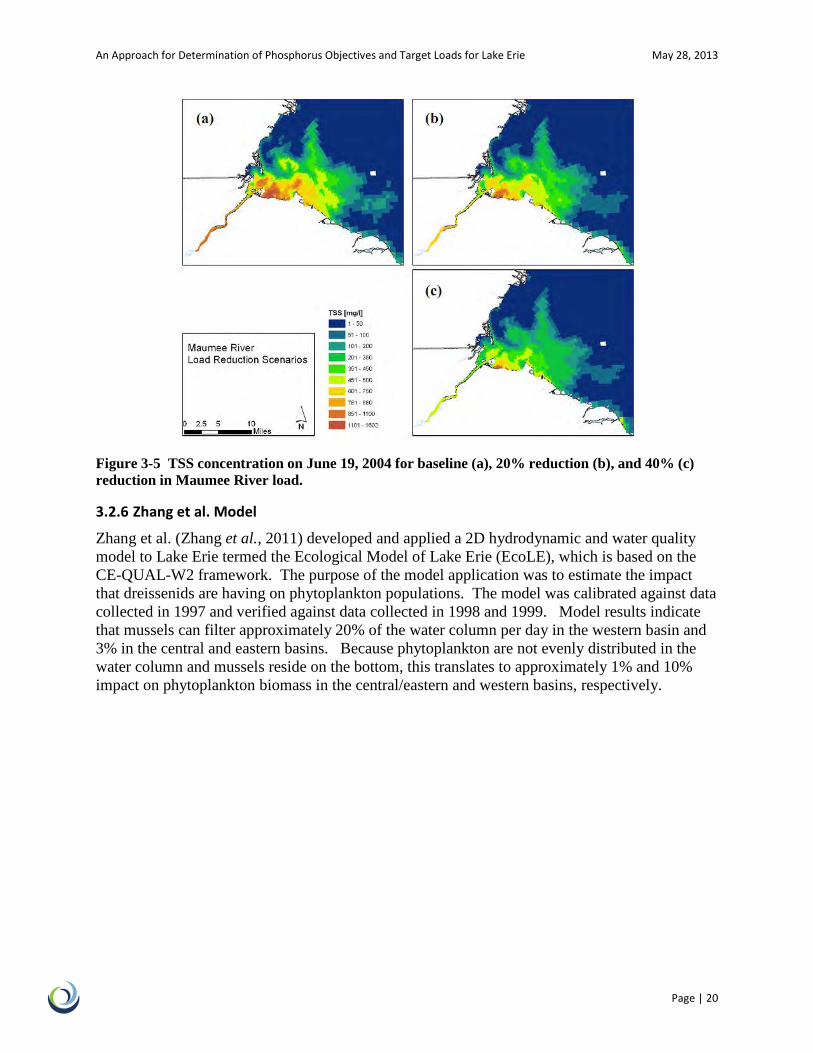
m together with observations for station 938 (east basin) in 2002. ....................................... 19 Figure 3-5 TSS concentration on June 19, 2004 for baseline (a), 20% reduction (b), and 40% (c)
reduction in Maumee River load. .......................................................................................... 20 Figure 3-6 Model verification of 1998 for non-diatom edible algae, diatoms, copepods,
cladocerans, total dissolved phosphorus (TP-F), and ammonia (NH4). ............................... 21 Figure 3-7. Excerpt from Tomlinson et al. (2010) showing relationship between Cladophora
biomass and ambient SRP concentration .............................................................................. 22 Figure 3-8 Relationship between available light (PAR) and maximum Cladophora biomass
(from Higgins et al. 2005) ..................................................................................................... 22 Figure 4-1. Response of hypoxic area and days, depletion rate, and bottom layer DO as a
function to total annual TP loads and March-June Maumee River TP loads. ....................... 28
An Approach for Determination of Phosphorus Objectives and Target Loads for Lake Erie May 28, 2013
Page | 1
1 Introduction
The purpose of this discussion paper is to review recent work on Lake Erie pertaining to the development of nutrient – eutrophication relationships and to recommend an approach to establish updated phosphorus objectives and target loads for Lake Erie relative to the interim values indicated in the 2012 Great Lakes Water Quality Agreement Protocol. It was prepared by LimnoTech under a contract from Environment Canada; Sandra George was the Project Officer. An Expert Advisory Group (EAG) was formed by LimnoTech to help with this document. Input to and review of this document was provided by that EAG, consisting of Victor J. Bierman, Jr., William Booty, Steven Chapra, David Dolan, Russell Kreis, Luis Leon, Jeffrey Reutter, Don Scavia, and Ralph Smith.
1.1 Background and Objectives In the late 1970s a series of contemporary Great Lakes eutrophication models were applied to establish and confirm the target phosphorus loads for each of the Great Lakes and large embayments/basins. Those target loads were codified in Annex 3 of the 1978 Amendment to the Great Lakes Water Quality Agreement. The models applied for that analysis ranged from quite simple empirical relationships to kinetically complex, process-oriented models, including in order of increasing complexity: Vollenweider’s empirical total phosphorus (TP) model (all lakes), Chapra’s semi-empirical model (all lakes), Thomann’s Lake 1 process model (Lake Ontario and Lake Huron), Ditoro’s process model (Lake Erie), and Bierman’s process model (Saginaw Bay). The results of these model applications have been documented in the IJC Task Group III report (Vallentyne and Thomas, 1978) and in Bierman (1980). The post-audit of several of these models in the mid-1980s confirmed that they had established a good relationship between total phosphorus loading to a lake/basin/embayment and its system-wide averaged TP and chlorophyll a concentration.
In 2006 as part of the Parties’ review of the Great Lakes Water Quality Agreement, a sub-committee of Great Lakes modelers (co-chaired by Joe DePinto, LimnoTech, and David Lam, Environment Canada) was charged to conduct an examination of the data and models that were used to support the phosphorus target loads specified in Annex 3 of the Agreement relative to the current status of the Lakes. The charge to this sub-group was to address three questions:
• Question 1- Have we achieved the target Phosphorus (P) loads in all of the Great Lakes?
• Question 2- Have we achieved the water quality objectives in all of the Great Lakes?
• Question 3- Can we define the quantitative relationships between P loads and lake conditions with existing models? Are the models still valid on a whole lake basis or have ecosystem changes to the P- chlorophyll relationship occurred such that new or updated models need to be run?
An Approach for Determination of Phosphorus Objectives and Target Loads for Lake Erie May 28, 2013
Page | 2
The findings of this sub-group were basically that those models were aimed at whole lake eutrophication symptoms as they were manifested at the time, but were now not sufficiently spatially resolved to capture the nearshore eutrophication being observed throughout the lakes and did not represent the process formulations to capture the impacts of ecosystem structure and function changes (e.g., Dreissenid impacts) relative to phosphorus processing and eutrophication responses in the lakes ((DePinto et al., 2006) There was a general recommendation for a concerted research, monitoring, and model enhancement effort:
• to quantify the relative contributions of various environmental factors (total phosphorus loads, changes in the availability of phosphorus loads, hydrometeorological impacts on temperature conditions and hypolimnion structure and volume, Dreissena-induced alterations of nutrient-phytoplankton-light conditions and oxygen demand functions) to the nearshore re-eutrophication of the Great Lakes; and
• to develop a revised quantitative relationship between these stressors and the recently observed eutrophication indicators such as cyanobacteria blooms and nuisance benthic algal (e.g., Cladophora, Lyngbya) growth.
The recent publication of the 2012 Protocol amending the Great Lakes Water Quality Agreement (United States and Canada, 2012) includes an Annex 4 on nutrients, in particular on phosphorus control to achieve ecosystem objectives related to eutrophication symptoms. At this point the Annex has set “interim” phosphorus concentration objectives and loading targets that are identical to the Annex 3 values established in the 1978 Amendment. However, it requires that the “Parties, in cooperation and consultation with State and Provincial Governments, Tribal Governments, First Nations, Métis, Municipal Governments, watershed management agencies, other local public agencies, and the Public, shall:
1. for the open Waters of the Great Lakes: (a) Review the interim Substance Objectives for phosphorus concentrations for each Great Lake to assess adequacy for the purpose of meeting Lake Ecosystem Objectives, and revise as necessary; (b) Review and update the phosphorus loading targets for each Great Lake; and (c) Determine appropriate phosphorus loading allocations, apportioned by country, necessary to achieve Substance Objectives for phosphorus concentrations for each Great Lake;
2. for the nearshore Waters of the Great Lakes: (a) Develop Substance Objectives for phosphorus concentrations for nearshore waters, including embayments and tributary discharge for each Great Lake; and (b) Establish load reduction targets for priority watersheds that have a significant localized impact on the Waters of the Great Lakes.
The Annex also calls for research and other programs aimed at setting and achieving the revised nutrient objectives. It also calls for the Parties to take into account the bioavailability of various forms of phosphorus, related productivity, seasonality, fisheries productivity requirements, climate change, invasive species, and other factors, such as downstream impacts, as necessary, when establishing the updated phosphorus concentration objectives and loading targets. Finally, it calls for the Lake Erie objectives and loading target revisions to be completed within three years of the 2012 Agreement entry into force.
An Approach for Determination of Phosphorus Objectives and Target Loads for Lake Erie May 28, 2013
Page | 3
To assist the parties in developing and applying an approach for accomplishing these mandates, this discussion paper has been developed to evaluate the interim phosphorus objectives and load targets for Lake Erie and to propose an approach for updating those targets in light of the new research and monitoring and modeling in the lake. The plan that is developed for Lake Erie can serve as a template for the other Great Lakes in meeting the 2012 Great Lakes Water Quality Agreement Protocol Annex 4 mandates.
1.2 Approach and Scope The general approach for this paper development was to review the recent research, monitoring, modeling, and management efforts, and a recent IJC Lake Erie management assessment (TAcLE) report in order to make an assessment of ongoing and recently completed projects that might contribute to the updating of phosphorus objectives and target load development for the system. Hence, this discussion paper contains a review of recent Lake Erie monitoring and research efforts (Section 2), a review of models developed and applied to Lake Erie (Section 3), both historically and more recently, and a review of the management related programs focused on Lake Erie (Section 3 and TAcLE summary in Section 4). This review would then lead to advancement of a recommendation for an analysis project to provide an informed set of updated objectives and targets for the lake (Section 5).
The recommendation in Section 5 of this report offers an approach to bring the best practical science available in the short term to an analysis and assessment project for helping the Parties in updating the 2012 Annex 4 objectives and target loads for Lake Erie. In general, the process used during the 1978 GLWQA, including aspects regarding empirical data, mathematical modeling, conveyance of scientific results, and negotiation of objectives by the parties, serves as a reasonable blueprint for this effort, with appropriate modifications to address today’s situation and concerns. There are two overriding principles that will be followed in developing this recommendation. First, an application of multiple models will be used for the analysis similar to what was done in the 1970s to establish and confirm the original targets in the Agreement. Second, the philosophy in applying those models will be to begin with the biological response indicators of eutrophication in Lake Erie and use the models to compute a load-response relationship between external phosphorus loads and those indicators. That way whatever threshold is set for those eutrophication indicators can be related to an external loading target. The establishment of in-lake phosphorus concentration objectives will merely be an interim output of that load-response relationship. The final section of this paper presents the specifics of this general approach and recommendation.

An Approach for Determination of Phosphorus Objectives and Target Loads for Lake Erie May 28, 2013
Page | 4
2 Monitoring and Research
This section presents an overview of research and monitoring programs on Lake Erie. This review is not all inclusive. It comprises some key programs on Lake Erie which are implemented by federal governments, state governments, academics, and other special research groups. Other research priorities on Lake Erie are also highlighted.
2.1 Federal This section summarizes research projects and monitoring programs of federal agencies in the United States and Canada.
2.1.1 US EPA / GLNPO
The United States Environmental Protection Agency (US EPA) and their Great Lakes National Program Office (GLNPO) have a number of monitoring programs to assess the heath of the Great Lakes. Several parameters are routinely measured, some include: nutrient concentrations, water clarity, water temperature, dissolved oxygen levels, and biological data (e.g. plankton and benthic organisms).
Dissolved oxygen monitoring is carried out at several stations in Lake Erie. Lowest Oxygen levels are observed in late August to mid-September (Figure 2-1).
Website: http://www.epa.gov/grtlakes/monitoring/d_o/index.html
Figure 2-1 Results of Lake Erie DO monitoring, data are available back to 1991 (from epa.gov).
GLNPLO also monitors the phosphorus concentrations in Lake Erie. In the 1980s they observed a decrease in phosphorus concentrations in the lake due to controls put on point and non-point
An Approach for Determination of Phosphorus Objectives and Target Loads for Lake Erie May 28, 2013
Page | 5
sources, but since the 1990s they have seen a steady increase in the phosphorus concentrations in the lake.
Website: http://www.epa.gov/grtlakes/glindicators/water/phosphorusb.html
2.1.2 Environment Canada
Like the US EPA Environment Canada also has a monitoring program, call the “Great Lakes Surveillance Program” to evaluate Canada’s compliance with water quality standards, to observe trends in the Great Lakes water quality, and to evaluate emerging issues. Several parameters are monitored in Lake Erie, a few that are relevant to this discussion include: water temperature, water clarity, pH, nutrients, Chlorophyll a and other biological parameters. Approximately 55 stations are monitored on Lake Erie.
Website: http://www.ec.gc.ca/scitech/default.asp?lang=en&n=3F61CB56-1
2.1.3 NOAA
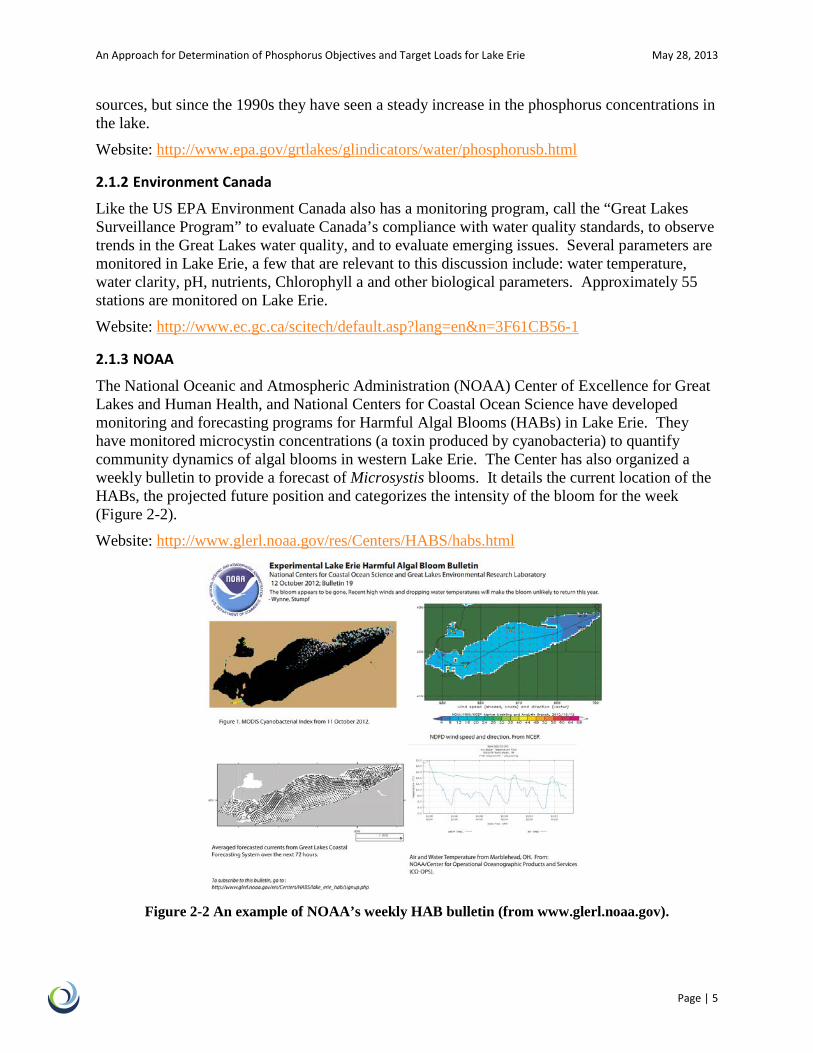
The National Oceanic and Atmospheric Administration (NOAA) Center of Excellence for Great Lakes and Human Health, and National Centers for Coastal Ocean Science have developed monitoring and forecasting programs for Harmful Algal Blooms (HABs) in Lake Erie. They have monitored microcystin concentrations (a toxin produced by cyanobacteria) to quantify community dynamics of algal blooms in western Lake Erie. The Center has also organized a weekly bulletin to provide a forecast of Microsystis blooms. It details the current location of the HABs, the projected future position and categorizes the intensity of the bloom for the week (Figure 2-2).
Website: http://www.glerl.noaa.gov/res/Centers/HABS/habs.html
Figure 2-2 An example of NOAA’s weekly HAB bulletin (from www.glerl.noaa.gov).
An Approach for Determination of Phosphorus Objectives and Target Loads for Lake Erie May 28, 2013
Page | 6
NOAA’s National Centers for Coastal Ocean Science has also developed a seasonal HAB forecasting system for western Lake Erie (Stumpf et al. 2012). This forecast is based on bloom intensity measured by European Space Agency satellites and phosphorus loading and discharge data from Heidelberg University and the United States Geological Survey.
2.2 State This section summarizes research projects, monitoring programs of state agencies in the United States.
2.2.1 State of Ohio
The Ohio Environmental Protection Agency (OEPA) and other state agencies participate in the number of activities related to monitoring and the management of Lake Erie.
The OEPA formed the Ohio Lake Erie Phosphorus Task Force to evaluate ways to reduce harmful algal blooms in Lake Erie. The first phase, which concluded in 2010, complied data which quantified sources and loads of phosphorus to Lake Erie and produced some recommendations for reducing phosphorus loads to Lake Erie (OEPA., 2010). Phase II of the effort is currently wrapping up. This phase will build on the efforts of Phase I and continue to work with stake holders to build consensus on how to reduce HABs in Lake Erie. This phase is expected to produce their final report in the spring of 2013. They have produced loading reduction recommendations. These include a 37% reduction in TP and a 41% reduction in SRP loads. They emphasis that is assuming an adaptive management approach and further reduction will likely be required (OEPA, 2013).
Additionally, in 2011 OEPA launched their “Comprehensive Nearshore Monitoring Program”. This was funded by the Great Lakes Restoration Initiative (GLRI). This project will conduct monitoring over 3 year period to evaluate environmental conditions of nearshore areas.
Website: http://www.epa.ohio.gov/dsw/lakeerie/index.aspx
2.2.2 State of Michigan
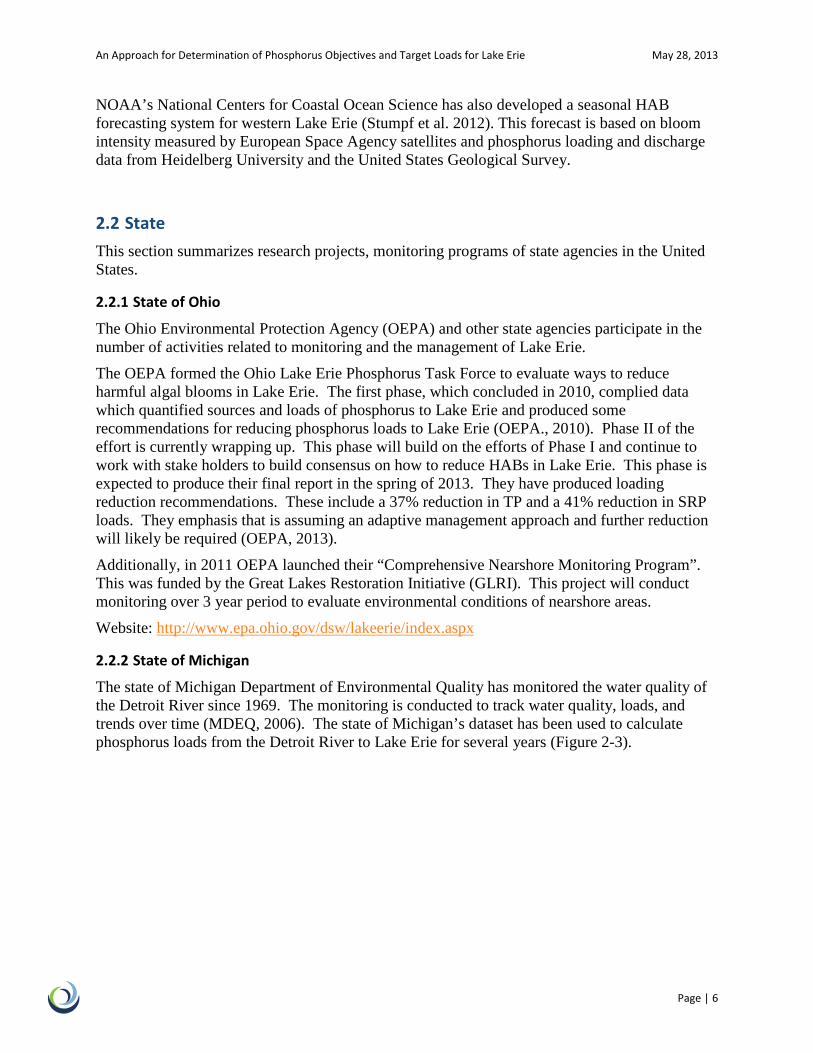
The state of Michigan Department of Environmental Quality has monitored the water quality of the Detroit River since 1969. The monitoring is conducted to track water quality, loads, and trends over time (MDEQ, 2006). The state of Michigan’s dataset has been used to calculate phosphorus loads from the Detroit River to Lake Erie for several years (Figure 2-3).
An Approach for Determination of Phosphorus Objectives and Target Loads for Lake Erie May 28, 2013
Page | 7
Figure 2-3 Phosphorus loads from the Detroit River to Lake Erie (figure from GLEC and LTI, 2006).
2.3 Academic Research Programs
2.3.1 National Center for Water Quality Research at Heidelberg University
Researchers at Heidelberg University have been involved in a variety of phosphorus loading research projects for the last 40 plus years, recent projects include: quantifying phosphorus runoff from crop lands, development of best management practices for crop lands, and quantifying the bioavailability phosphorus entering the Great Lakes (Baker, 2011;Heidelberg, 2012).
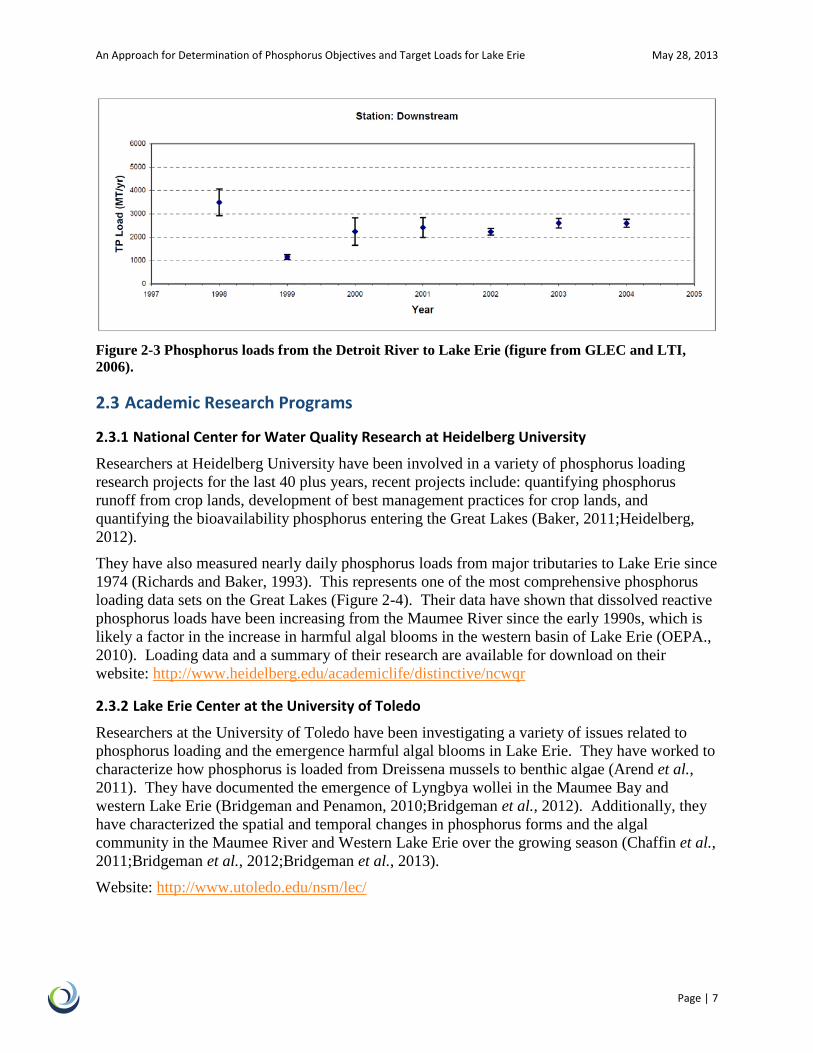
They have also measured nearly daily phosphorus loads from major tributaries to Lake Erie since 1974 (Richards and Baker, 1993). This represents one of the most comprehensive phosphorus loading data sets on the Great Lakes (Figure 2-4). Their data have shown that dissolved reactive phosphorus loads have been increasing from the Maumee River since the early 1990s, which is likely a factor in the increase in harmful algal blooms in the western basin of Lake Erie (OEPA., 2010). Loading data and a summary of their research are available for download on their website: http://www.heidelberg.edu/academiclife/distinctive/ncwqr
2.3.2 Lake Erie Center at the University of Toledo
Researchers at the University of Toledo have been investigating a variety of issues related to phosphorus loading and the emergence harmful algal blooms in Lake Erie. They have worked to characterize how phosphorus is loaded from Dreissena mussels to benthic algae (Arend et al., 2011). They have documented the emergence of Lyngbya wollei in the Maumee Bay and western Lake Erie (Bridgeman and Penamon, 2010;Bridgeman et al., 2012). Additionally, they have characterized the spatial and temporal changes in phosphorus forms and the algal community in the Maumee River and Western Lake Erie over the growing season (Chaffin et al., 2011;Bridgeman et al., 2012;Bridgeman et al., 2013).
Website: http://www.utoledo.edu/nsm/lec/
An Approach for Determination of Phosphorus Objectives and Target Loads for Lake Erie May 28, 2013
Page | 8
Figure 2-4 Record of dissolved reactive phosphorus loads to Lake Erie from the Maumee River,
measured by Heidelberg University (figure from Baker et al., 2011).
2.3.3 The Ohio State University Ohio Sea Grant and Stone Laboratory
Researchers at Ohio State University are working on a variety of research projects focused on Lake Erie, a few examples include: the role of sediment in controlling the fate and toxicity of microcystin, effects of microsystin on mayfly larvae, tracking the extent of hypoxia in western Lake Erie, and the causes and consequences of hypoxia in Lake Erie.
The Ohio Sea Grant website: http://ohioseagrant.osu.edu/
The Stone Laboratory website: http://stonelab.osu.edu/
2.4 Special Research Studies
2.4.1 Lake Erie Phosphorus Synthesis Team
The report “Lake Erie Nutrient Loading and Harmful Algal Blooms: Research Findings and Management Implications” (Reutter et al., 2011) is a synthesis of seven projects supported by USEPA’s Great Lakes National Program Office (GLNPO) and the Lake Erie Protection Fund (LEPF). Some key findings of these seven projects included:
1. Species that form HABS are always present in the Sandusky and Maumee Rivers and their tributaries. Microcystis increases in higher order streams they are the highest in Lake Erie. These species are probably always present, and are simply waiting for the right conditions to reproduce.
2. High concentrations of dissolved reactive phosphorus wash off of crop lands during storms. Suspended solids and particulate phosphorus settle out of the water column soon after entering the lake.
An Approach for Determination of Phosphorus Objectives and Target Loads for Lake Erie May 28, 2013
Page | 9
3. During non-storms nutrient levels in the Maumee River are low.
4. The overall loading of bioavailable phosphorus to Lake Erie is at is at its highest levels in 35 years because of increases in dissolved phosphorus loads.
5. Storms deliver most of the phosphorus to the Western Basin, but most of these happen when it is too cold for Microcystis blooms to form (usually in the spring). Waters with high phosphorus concentrations remain in the Western Basin long enough for Microcystis blooms to form months later.
6. Phosphorus contributes to the growth of HABs and additionally the growth of macrophytes and other forms of phytoplankton. These primary producers are then transported to the central basin, and are deposited on the bottom of the lake. This can contribute to hypolimnetic hypoxia in the central basin.
7. At times both nitrogen and phosphorus can be limiting to algal growth, so when possible reductions in nitrogen loads in addition to phosphorus loads should to be encouraged.
There were many more findings in this report including: soil P and P run off relationships, a comparison of P concentrations in the three basins, and the implications of invasive species in the management of algal blooms. A large body of research was summarized and synthesized. Several peer reviewed research papers have since been a product of this work.
2.4.2 ECOFORE
The goal of the Ecological Forecasting: Hypoxia Assessment in Lake Erie (ECOFORE) project was to understand and forecast the conditions that lead to hypoxia in Lake Erie. This work addressed the effects of phosphorus loading, dreissenids and climate change on Lake Erie. Based on this research a set of management policy options and technical guidance for Lake Erie management agencies was produced.
Website: http://sitemaker.umich.edu/ecoforelake.erie/home
2.4.3 Water Sustainability and Climate
The Climate Impacts on Great Lakes Water Quality project is focused on finding the effects of climate change on the ecology and water quality of the Great Lakes. They are working to put together a more holistic view of the system by documenting how larger and more frequent storms due to climate change can lead to larger HABs, and how these more frequent algal blooms can have ripple effects on the ecological health of Lake Erie and the socio-economic state of communities surrounding the lake. They have found that larger algal blooms are caused in part by agricultural and meteorological trends which have been experienced in the Lake Erie watershed.
Website: http://www.miseagrant.umich.edu/nsf/
2.4.4 International Field Year in Lake Erie
The International Field Year on Lake Erie in 2005 was a collaboration of the NOAA Great Lakes Environmental Research Laboratory (GLERL) and U.S. and Canadian researchers. It was the largest field program ever conducted on Lake Erie. The program focused on characterizing harmful algal blooms and hypoxia in Lake Erie. There were many publications as a result of this research. They characterized the effects of hypoxia on fish, zooplankton, and phytoplankton.
An Approach for Determination of Phosphorus Objectives and Target Loads for Lake Erie May 28, 2013
Page | 10
Website: http://www.glerl.noaa.gov/ifyle/
2.4.5 Coordinated Science and Monitoring Initiative
The United States and Canada jointly fulfill a Coordinated Science and Monitoring Initiative (CSMI). It is designed to address the science and monitoring priorities of the Great Lakes. The CSMI rotates through the Great Lakes (all lakes every 5 years) and the next year for Lake Erie is 2014. Priorities for the initiative are set by the Lakewide Management Committee. The initiative has found that sediment movement and dredging activities may be a source of Microcystis seed colonies. They have also found that high amounts of dissolved nutrients run off of crop lands, and that management efforts should focus on these loads (Horvatin and Adams, 2012).
Website: http://www.epa.gov/ord/scievents/lakesci11/activities.htm#csmi
2.5 Other Recent Research and Data Activities
2.5.1 Loads
Monitoring of Lake Erie loads varies by tributary. Most of the major US tributaries to Lake Erie are monitored almost daily by Heidelberg University. There are several Canadian tributaries which are monitored on a monthly basis (IJC, 2013). The majority of the tributary loads come from the Cuyahoga, Maumee, and Sandusky Rivers (excluding the Detroit River). There are several point sources which also contribute significant amounts of phosphorus (e.g. Detroit, Cleveland, Wyandotte, Toledo and Akron). The largest tributary load to Lake Erie is the Maumee River and the largest point source load is the Detroit Wastewater Treatment Plant (Personal Communication, Dr. David Dolan).
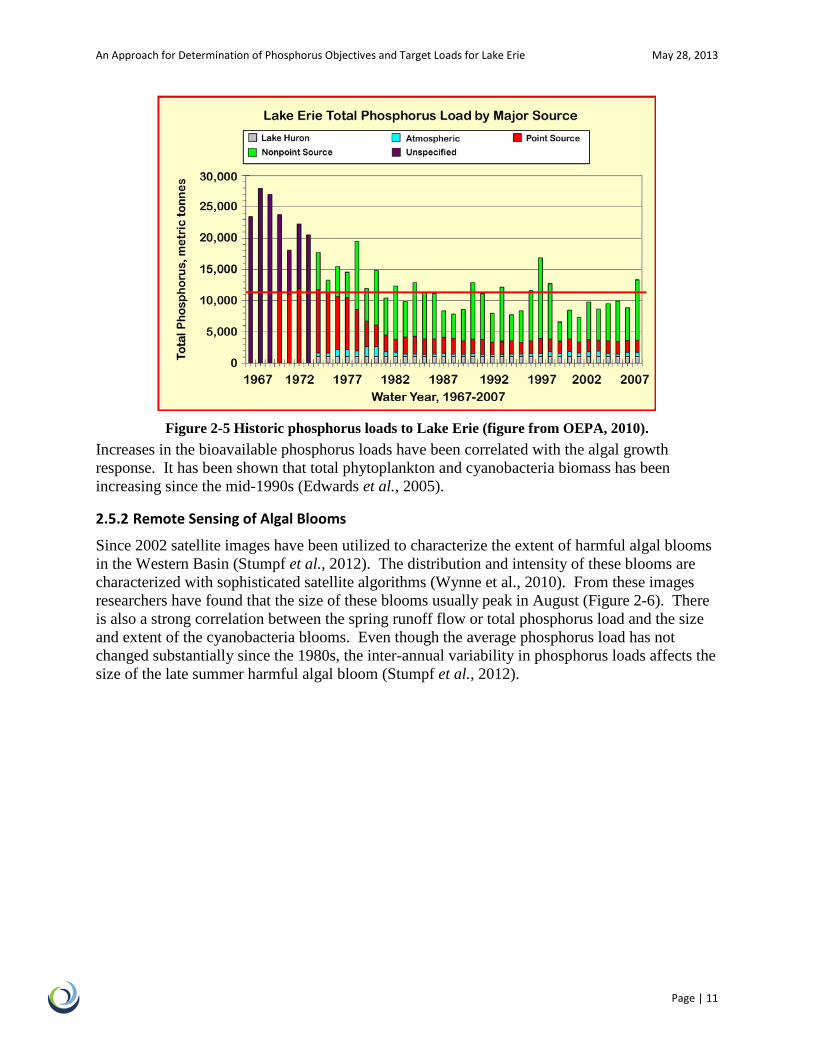
The overall loading of bioavailable phosphorus to Lake Erie is at its highest levels in 35 years because of increases in dissolved phosphorus loads (Reutter et al., 2011). The majority of these loads seem to be coming from changes in farm practices (Daloglu et al., 2012). DRP loads have been increasing since the mid-1990s, but on average the overall phosphorus load has not varied greatly since the 1980s when phosphorus controls were fully implemented under the Great Lakes Water Quality Agreement (Figure 2-5; (OEPA., 2010;Baker, 2011).
An Approach for Determination of Phosphorus Objectives and Target Loads for Lake Erie May 28, 2013
Page | 11
Figure 2-5 Historic phosphorus loads to Lake Erie (figure from OEPA, 2010).
Increases in the bioavailable phosphorus loads have been correlated with the algal growth response. It has been shown that total phytoplankton and cyanobacteria biomass has been increasing since the mid-1990s (Edwards et al., 2005).
2.5.2 Remote Sensing of Algal Blooms
Since 2002 satellite images have been utilized to characterize the extent of harmful algal blooms in the Western Basin (Stumpf et al., 2012). The distribution and intensity of these blooms are characterized with sophisticated satellite algorithms (Wynne et al., 2010). From these images researchers have found that the size of these blooms usually peak in August (Figure 2-6). There is also a strong correlation between the spring runoff flow or total phosphorus load and the size and extent of the cyanobacteria blooms. Even though the average phosphorus load has not changed substantially since the 1980s, the inter-annual variability in phosphorus loads affects the size of the late summer harmful algal bloom (Stumpf et al., 2012).
An Approach for Determination of Phosphorus Objectives and Target Loads for Lake Erie May 28, 2013
Page | 12
Figure 2-6 Satellite images of the intensity of harmful algal blooms (from Stumpf et al., 2012).
An Approach for Determination of Phosphorus Objectives and Target Loads for Lake Erie May 28, 2013
Page | 13
2.5.3 Benthic Algal Blooms
Benthic algae has proven to be an emerging challenge in Lake Erie, with the first documented growth of the filamentous cyanobacteria Lyngbya wollei in Maumee Bay in 2006 and the continued nuisance growth of these algae (Bridgeman and Penamon, 2010) (Bridgeman et al., 2012). Additionally, an increase in Cladophora glomerata biomass has been documented in the Eastern Basin of Lake Erie (Depew et al., 2011;Higgins et al., 2005b) One contributing factor could be the invasion of Dreissenids (zebra and quagga mussels), which filter out particulate phosphorus and excrete it as a more bioavailable dissolved phosphorus form (Stewart, 2008). This filtering has also increased water clarity which has led to more favorable conditions for benthic algal growth.
2.5.4 Hypoxia
Hypoxia has been a persistent problem in Central Basin of Lake Erie for decades. The extent of the hypoxic zone was high in the 1980s, decreased and reached a low point in the 1990s, and has been increasing since the 1990s (Zhou et al., 2013;Edwards et al., 2005). This is probably correlated with an increase in bioavailable phosphorus loads to Lake Erie (Reutter et al., 2011). In recent years the hypoxic region has been shown to reach shallow depths (11-14 m), and even into portions of the Western Basin (Krieger and Bur, 2009). The wide spread nature of these hypoxic zones has degraded benthic invertebrate communities (Krieger and Bur, 2009). Hypoxia has also been shown to reduce the habitat quality of many fish species in Lake Erie (Arend et al., 2011). In addition it has been shown that not just harmful algal blooms are contributing to this problem. The growth of green algae, macrophytes, and diatoms also contributes to the development of hypoxic conditions (Reutter et al., 2011). Recent research has shown that winter diatoms are quite productive during the winter months in Lake Erie, and as these diatoms deposit in the central basin they could also contribute to the hypoxia problem (Saxton et al., 2012).
An Approach for Determination of Phosphorus Objectives and Target Loads for Lake Erie May 28, 2013
Page | 14
3 Models and Management
This section provides an overview of historical and current modeling efforts on Lake Erie and a review of management groups specifically focused on Lake Erie water quality issues.
3.1 Historical Modeling Models have been used on Lake Erie for over three decades that use mathematical equations to help understand the cause and effect relationship between ecosystem stressors and endpoints. This section provides a high level review of past modeling efforts. These past modeling efforts set the stage for many of the present day modeling efforts that are discussed in the next section.
3.1.1 Bierman
The purpose of the Bierman (1980) paper is to compare and contrast the five mathematical models that were used to establish total phosphorus loading targets in the 1978 Great Lakes Water Quality Agreement for each of the Great Lakes. Three of these models (Vollenweider, Chapra, and DiToro/Connoly) were applied to Lake Erie, while the other two were applied to Saginaw Bay (Bierman) and Lake Ontario (Thomann). The Lake Erie models are described in more detail below. The models used range from simple, empirical correlations between total phosphorus loads and response parameters, to very complex mechanistic models that dynamically simulate the major physical, chemical, and biological responses occurring in the lakes. Only the relationships between total phosphorus loads and in-lake responses in the open waters of the Great Lakes were examined in the paper. Although nearshore problems were identified (such as Cladophora), the paper cited that more research is needed before effective control strategies can be developed. The most important indicator for Lake Erie health was dissolved oxygen concentration in the hypolimnion of the Central Basin. Reducing the total volume and areal extend of hypoxia was the primary driver of the P targets that were established for Lake Erie.
3.1.2 DiToro and Connolly
The DiToro and Connolly model was developed to analyze the interaction between nutrient loads, the response of phytoplankton, and the dissolved oxygen depletion that occurs in the central basin as a consequence. This model was used to determine the target P loads for Lake Erie. As summarized by Bierman (1980) the DiToro and Connolly model developed a dynamic mass balance model for Lake Erie with updated algorithms for phytoplankton to include diatoms and non-diatoms, direct calculation of dissolved oxygen concentration, and sediment nutrient release under anaerobic conditions. This model was chosen by the Task Group because it predicted the total volume and areal extend of hypoxia in Lake Erie based on P loads.
An Approach for Determination of Phosphorus Objectives and Target Loads for Lake Erie May 28, 2013
Page | 15
3.1.3 Others Historical Models
Two other simple models were also applied to Lake Erie by Vollenweider (1977) and Chapra (1977). Versions of these models were applied to every Great Lake. The Vollenweider model was based on empirical correlations between total phosphorus load and in-lake concentrations (from Lake Erie) of total phosphorus and chlorophyll-a. The loading plot model, as it was termed, is based on the steady-state solution of a simple mixed reactor mass balance model. The Chapra model applied was a simple time-variable mass balance model of total phosphorus concentration as the primary state variable. In this simple framework, total phosphorus can be lost from the water column only through net apparent settling. The net apparent settling velocity corresponds to the net flux of total phosphorus from the water column to the sediments. Chapra then used basin-specific empirical relationships to relate TP to hypolimnetic DO and chlorophyll a.
3.1.4 1999 IAGLR Modeling Summit
At the Annual Great Lakes Research Conference in 1999 hosted by the International Association for Great Lakes Research a special session was held that highlighted the present state of modeling in Lake Erie. Links to papers are available here http://www.ijc.org/php/publications/html/modsum/
• Resolution of Issues of Scope and Detail in the Development of the Lake Erie Ecological Model. Joseph F. Koonce and Ana B. Locci
• Ecological Modeling of Lake Erie Trophic Dynamics – 1999. David A. Culver, Department of Evolution, Ecology, and Organismal Biology, The Ohio State University, Columbus, OH 43210.
• Trophic transfer in Lake Erie: A whole food web modeling perspective. Sprules, W.G.1, Johannsson, O.E., Millard, E.S., Munawar, M., Stewart, D.S., Tyler, J., Dermott, R., Whipple, S.J., Legner, M., Morris, T.J., Ghan, D., and Jech, J.M.
• Conceptualizaation of an Aquatic Ecosystem Model for Integrated Management of Lake Erie Joseph V. Depinto, Victor J. Bierman, Jr., Timothy J. Feist, Jagjit Kaur
• A History of Eutrophication Modeling in Lake Erie. James J. Fitzpatrick, Dominic M. Di Toro
• Modeling the Effects of Nutrient Concentrations on Ecosystem Stability: Framework for a Great Lakes Model. Robert T. Heath, Rochelle Sturtevant, and Per Enflo
3.2 Present Modeling Efforts This section presents a high level review of the models that have been developed or refined within the last several years with specific applications to Lake Erie. All of the models have the ability to relate phosphorus concentration or load to either algal biomass or dissolved oxygen concentration. A summary table of the current models is presented in Table 3-1, with a brief overview of each model following in this section.
An Approach for Determination of Phosphorus Objectives and Target Loads for Lake Erie May 28, 2013
Page | 16
Table 3-1. Summary of recent Lake Erie models.
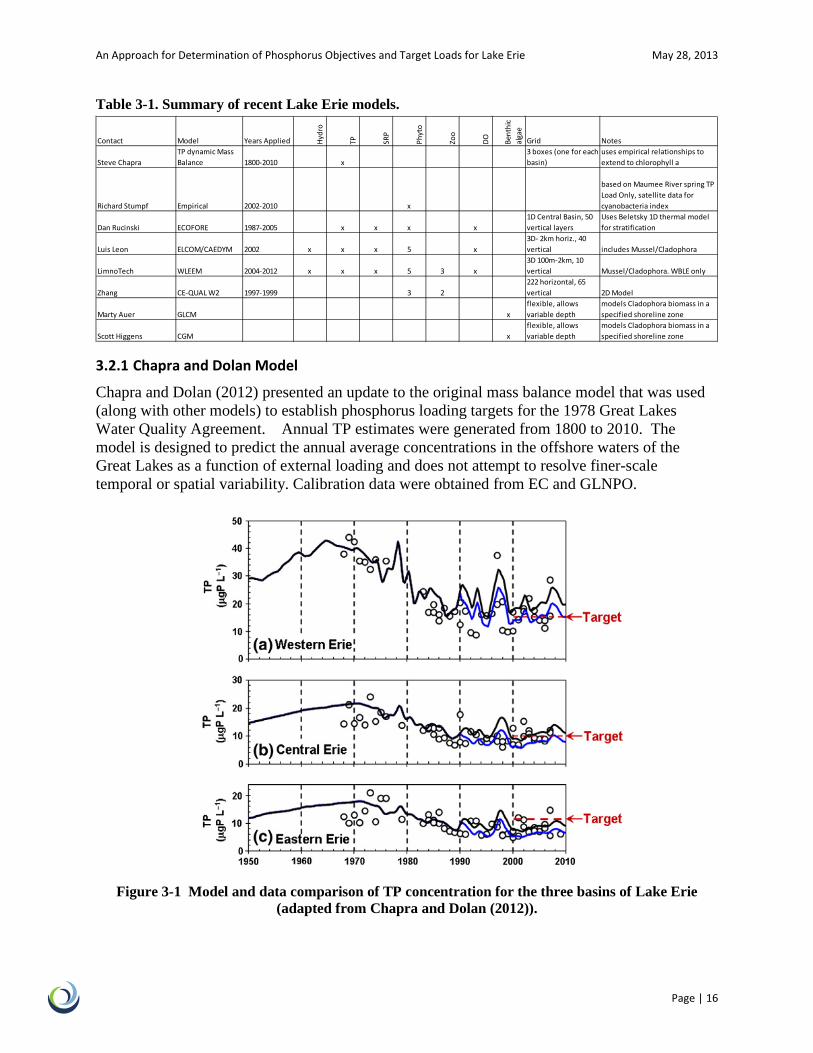
3.2.1 Chapra and Dolan Model
Chapra and Dolan (2012) presented an update to the original mass balance model that was used (along with other models) to establish phosphorus loading targets for the 1978 Great Lakes Water Quality Agreement. Annual TP estimates were generated from 1800 to 2010. The model is designed to predict the annual average concentrations in the offshore waters of the Great Lakes as a function of external loading and does not attempt to resolve finer-scale temporal or spatial variability. Calibration data were obtained from EC and GLNPO.
Figure 3-1 Model and data comparison of TP concentration for the three basins of Lake Erie (adapted from Chapra and Dolan (2012)).
Contact Model Years Applied Hydr
o
TP SRP
Phyt
o
Zoo
DO Bent
hic
alga
e
Grid Notes
Steve ChapraTP dynamic Mass Balance 1800-2010 x
3 boxes (one for each basin)
uses empirical relationships to extend to chlorophyll a
Richard Stumpf Empirical 2002-2010 x
based on Maumee River spring TP Load Only, satellite data for cyanobacteria index
Dan Rucinski ECOFORE 1987-2005 x x x x1D Central Basin, 50 vertical layers
Uses Beletsky 1D thermal model for stratification
Luis Leon ELCOM/CAEDYM 2002 x x x 5 x3D- 2km horiz., 40 vertical includes Mussel/Cladophora
LimnoTech WLEEM 2004-2012 x x x 5 3 x3D 100m-2km, 10 vertical Mussel/Cladophora. WBLE only
Zhang CE-QUAL W2 1997-1999 3 2222 horizontal, 65 vertical 2D Model
Marty Auer GLCM xflexible, allows variable depth
models Cladophora biomass in a specified shoreline zone
Scott Higgens CGM xflexible, allows variable depth
models Cladophora biomass in a specified shoreline zone
An Approach for Determination of Phosphorus Objectives and Target Loads for Lake Erie May 28, 2013
Page | 17
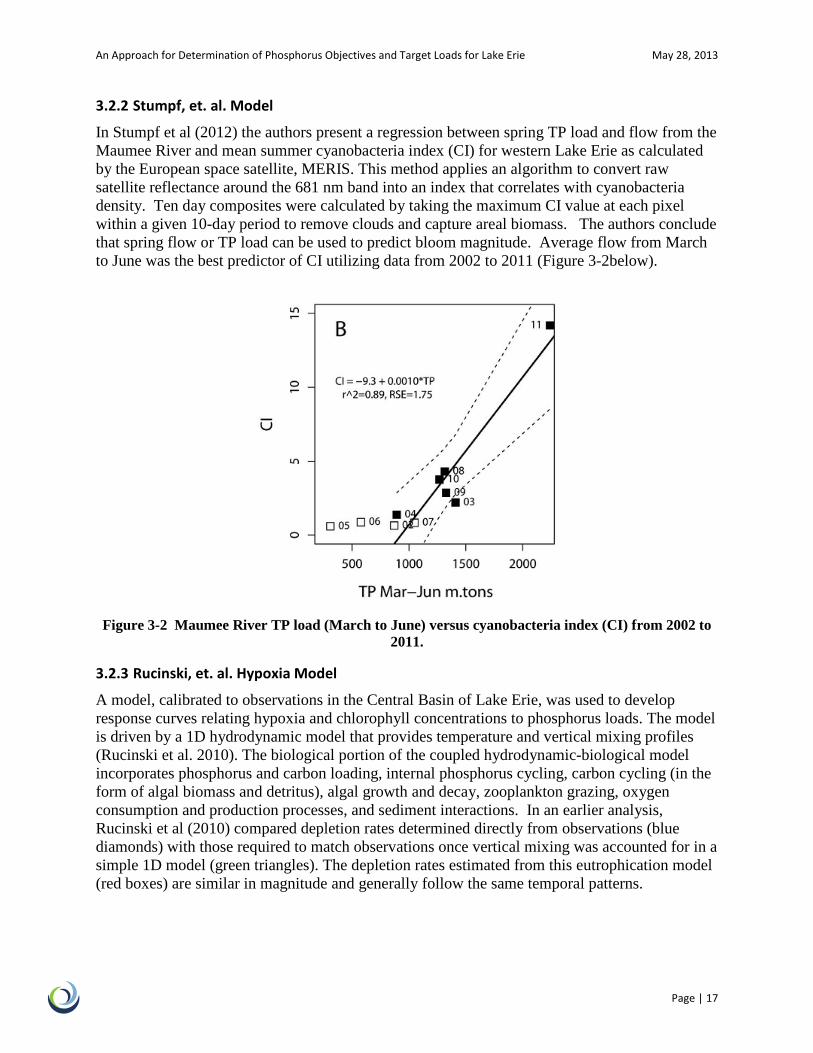
3.2.2 Stumpf, et. al. Model
In Stumpf et al (2012) the authors present a regression between spring TP load and flow from the Maumee River and mean summer cyanobacteria index (CI) for western Lake Erie as calculated by the European space satellite, MERIS. This method applies an algorithm to convert raw satellite reflectance around the 681 nm band into an index that correlates with cyanobacteria density. Ten day composites were calculated by taking the maximum CI value at each pixel within a given 10-day period to remove clouds and capture areal biomass. The authors conclude that spring flow or TP load can be used to predict bloom magnitude. Average flow from March to June was the best predictor of CI utilizing data from 2002 to 2011 (Figure 3-2below).
Figure 3-2 Maumee River TP load (March to June) versus cyanobacteria index (CI) from 2002 to 2011.
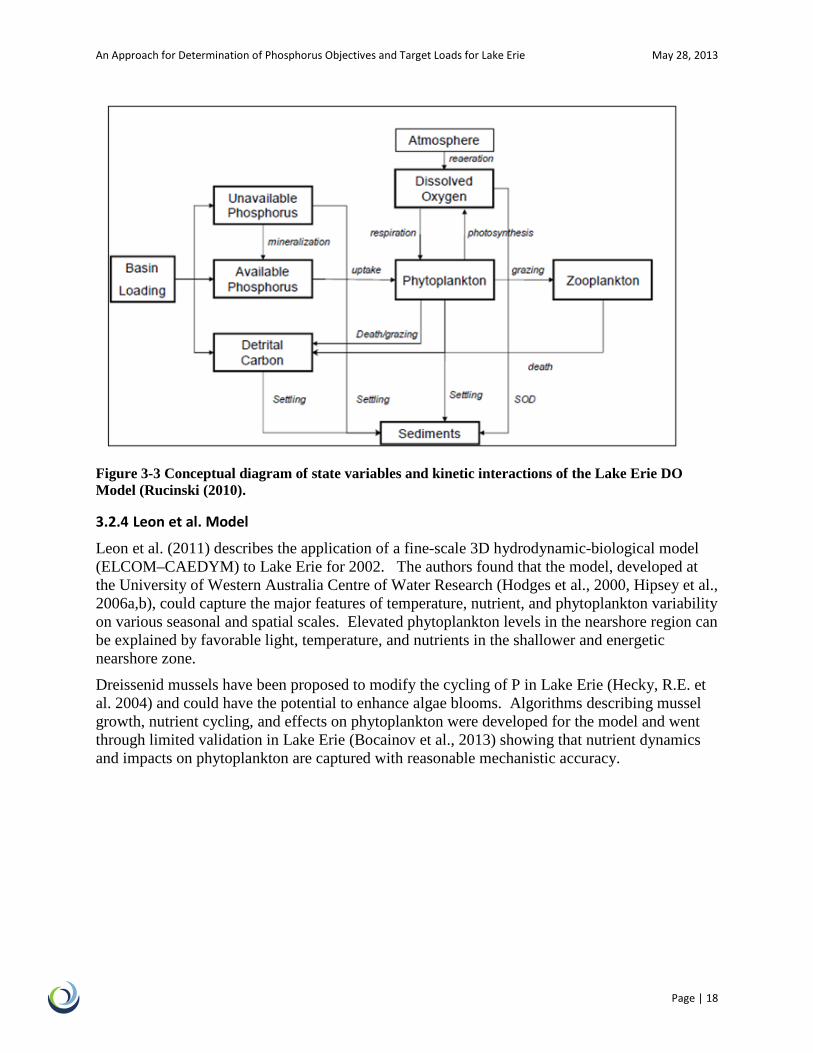
3.2.3 Rucinski, et. al. Hypoxia Model
A model, calibrated to observations in the Central Basin of Lake Erie, was used to develop response curves relating hypoxia and chlorophyll concentrations to phosphorus loads. The model is driven by a 1D hydrodynamic model that provides temperature and vertical mixing profiles (Rucinski et al. 2010). The biological portion of the coupled hydrodynamic-biological model incorporates phosphorus and carbon loading, internal phosphorus cycling, carbon cycling (in the form of algal biomass and detritus), algal growth and decay, zooplankton grazing, oxygen consumption and production processes, and sediment interactions. In an earlier analysis, Rucinski et al (2010) compared depletion rates determined directly from observations (blue diamonds) with those required to match observations once vertical mixing was accounted for in a simple 1D model (green triangles). The depletion rates estimated from this eutrophication model (red boxes) are similar in magnitude and generally follow the same temporal patterns.
An Approach for Determination of Phosphorus Objectives and Target Loads for Lake Erie May 28, 2013
Page | 18
Figure 3-3 Conceptual diagram of state variables and kinetic interactions of the Lake Erie DO Model (Rucinski (2010).
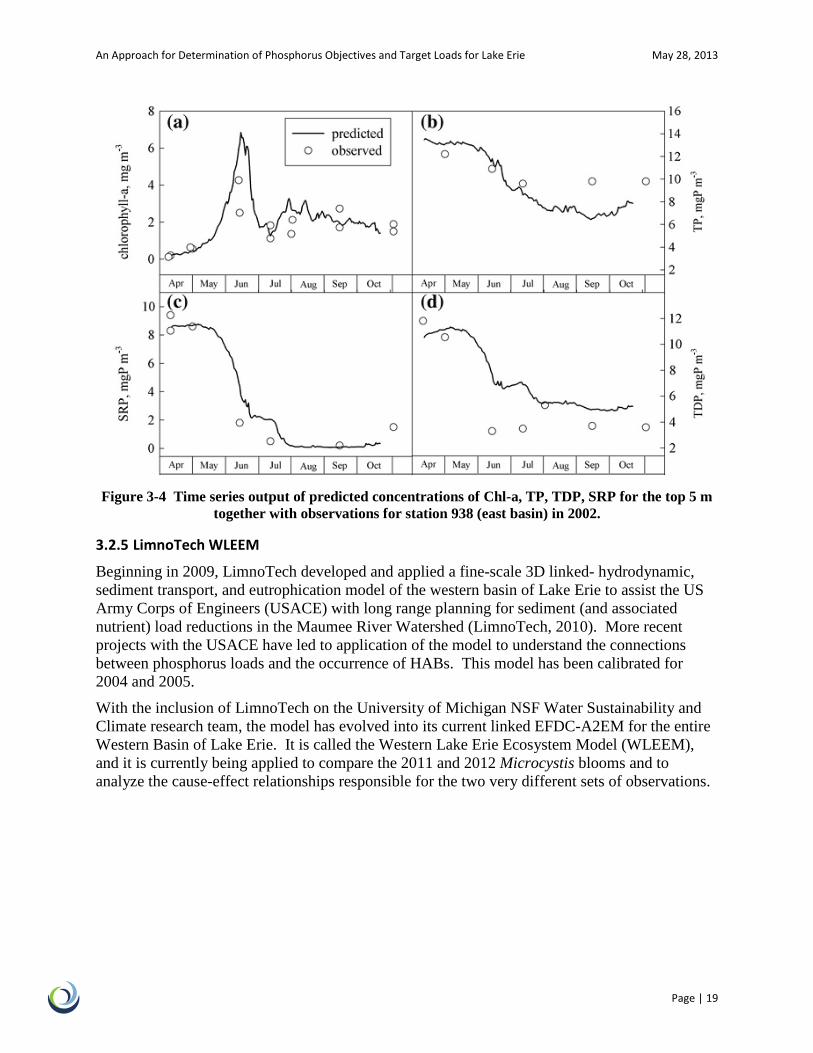
3.2.4 Leon et al. Model
Leon et al. (2011) describes the application of a fine-scale 3D hydrodynamic-biological model (ELCOM–CAEDYM) to Lake Erie for 2002. The authors found that the model, developed at the University of Western Australia Centre of Water Research (Hodges et al., 2000, Hipsey et al., 2006a,b), could capture the major features of temperature, nutrient, and phytoplankton variability on various seasonal and spatial scales. Elevated phytoplankton levels in the nearshore region can be explained by favorable light, temperature, and nutrients in the shallower and energetic nearshore zone.
Dreissenid mussels have been proposed to modify the cycling of P in Lake Erie (Hecky, R.E. et al. 2004) and could have the potential to enhance algae blooms. Algorithms describing mussel growth, nutrient cycling, and effects on phytoplankton were developed for the model and went through limited validation in Lake Erie (Bocainov et al., 2013) showing that nutrient dynamics and impacts on phytoplankton are captured with reasonable mechanistic accuracy.
An Approach for Determination of Phosphorus Objectives and Target Loads for Lake Erie May 28, 2013
Page | 19
Figure 3-4 Time series output of predicted concentrations of Chl-a, TP, TDP, SRP for the top 5 m together with observations for station 938 (east basin) in 2002.
3.2.5 LimnoTech WLEEM
Beginning in 2009, LimnoTech developed and applied a fine-scale 3D linked- hydrodynamic, sediment transport, and eutrophication model of the western basin of Lake Erie to assist the US Army Corps of Engineers (USACE) with long range planning for sediment (and associated nutrient) load reductions in the Maumee River Watershed (LimnoTech, 2010). More recent projects with the USACE have led to application of the model to understand the connections between phosphorus loads and the occurrence of HABs. This model has been calibrated for 2004 and 2005.
With the inclusion of LimnoTech on the University of Michigan NSF Water Sustainability and Climate research team, the model has evolved into its current linked EFDC-A2EM for the entire Western Basin of Lake Erie. It is called the Western Lake Erie Ecosystem Model (WLEEM), and it is currently being applied to compare the 2011 and 2012 Microcystis blooms and to analyze the cause-effect relationships responsible for the two very different sets of observations.
An Approach for Determination of Phosphorus Objectives and Target Loads for Lake Erie May 28, 2013
Page | 20
Figure 3-5 TSS concentration on June 19, 2004 for baseline (a), 20% reduction (b), and 40% (c) reduction in Maumee River load.
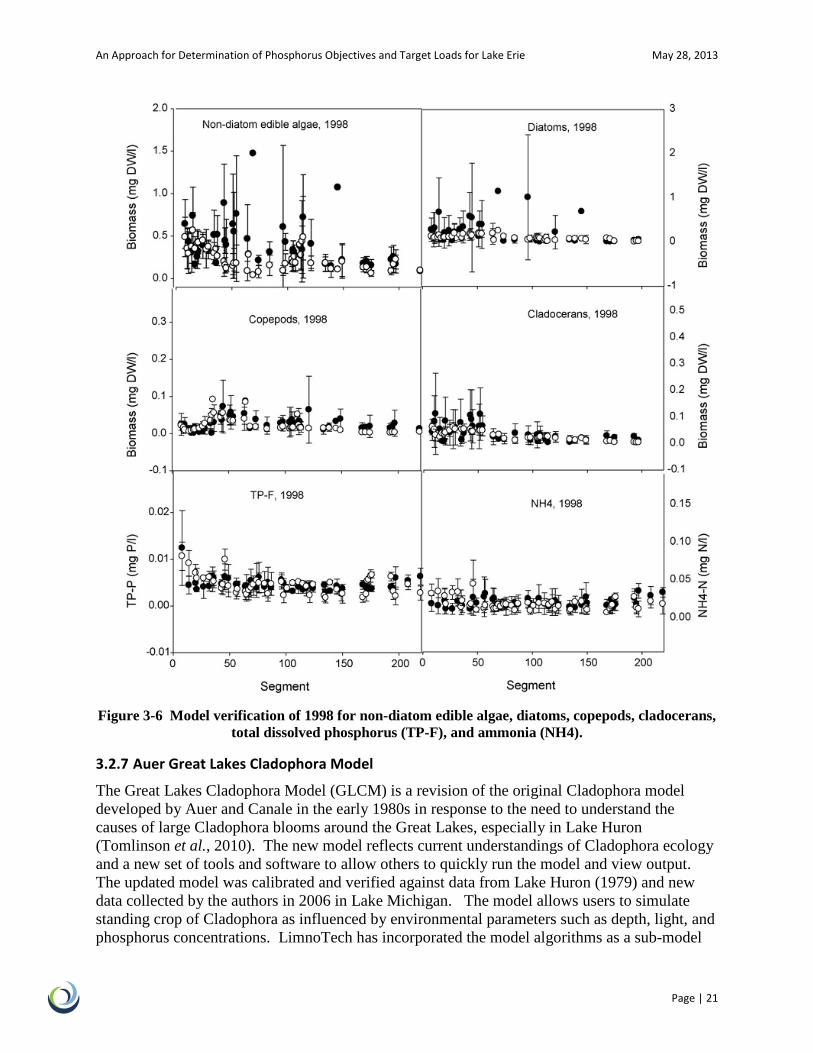
3.2.6 Zhang et al. Model
Zhang et al. (Zhang et al., 2011) developed and applied a 2D hydrodynamic and water quality model to Lake Erie termed the Ecological Model of Lake Erie (EcoLE), which is based on the CE-QUAL-W2 framework. The purpose of the model application was to estimate the impact that dreissenids are having on phytoplankton populations. The model was calibrated against data collected in 1997 and verified against data collected in 1998 and 1999. Model results indicate that mussels can filter approximately 20% of the water column per day in the western basin and 3% in the central and eastern basins. Because phytoplankton are not evenly distributed in the water column and mussels reside on the bottom, this translates to approximately 1% and 10% impact on phytoplankton biomass in the central/eastern and western basins, respectively.
An Approach for Determination of Phosphorus Objectives and Target Loads for Lake Erie May 28, 2013
Page | 21
Figure 3-6 Model verification of 1998 for non-diatom edible algae, diatoms, copepods, cladocerans,
total dissolved phosphorus (TP-F), and ammonia (NH4).
3.2.7 Auer Great Lakes Cladophora Model
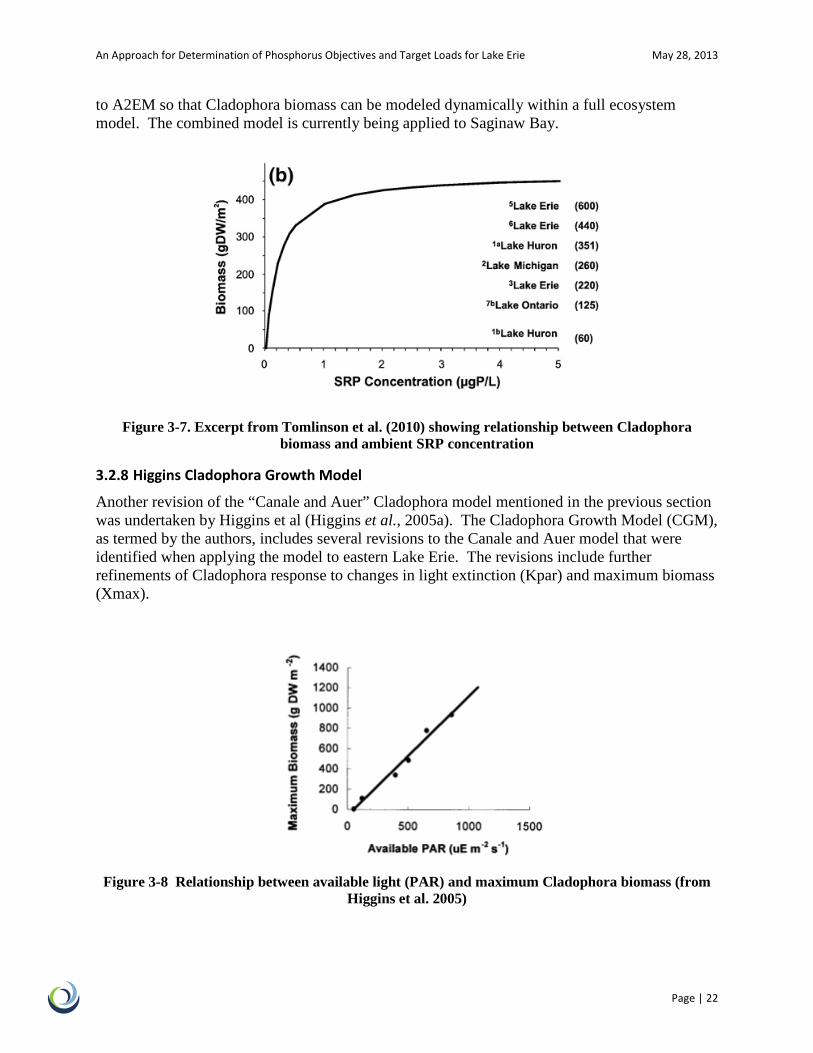
The Great Lakes Cladophora Model (GLCM) is a revision of the original Cladophora model developed by Auer and Canale in the early 1980s in response to the need to understand the causes of large Cladophora blooms around the Great Lakes, especially in Lake Huron (Tomlinson et al., 2010). The new model reflects current understandings of Cladophora ecology and a new set of tools and software to allow others to quickly run the model and view output. The updated model was calibrated and verified against data from Lake Huron (1979) and new data collected by the authors in 2006 in Lake Michigan. The model allows users to simulate standing crop of Cladophora as influenced by environmental parameters such as depth, light, and phosphorus concentrations. LimnoTech has incorporated the model algorithms as a sub-model
An Approach for Determination of Phosphorus Objectives and Target Loads for Lake Erie May 28, 2013
Page | 22
to A2EM so that Cladophora biomass can be modeled dynamically within a full ecosystem model. The combined model is currently being applied to Saginaw Bay.
Figure 3-7. Excerpt from Tomlinson et al. (2010) showing relationship between Cladophora biomass and ambient SRP concentration
3.2.8 Higgins Cladophora Growth Model
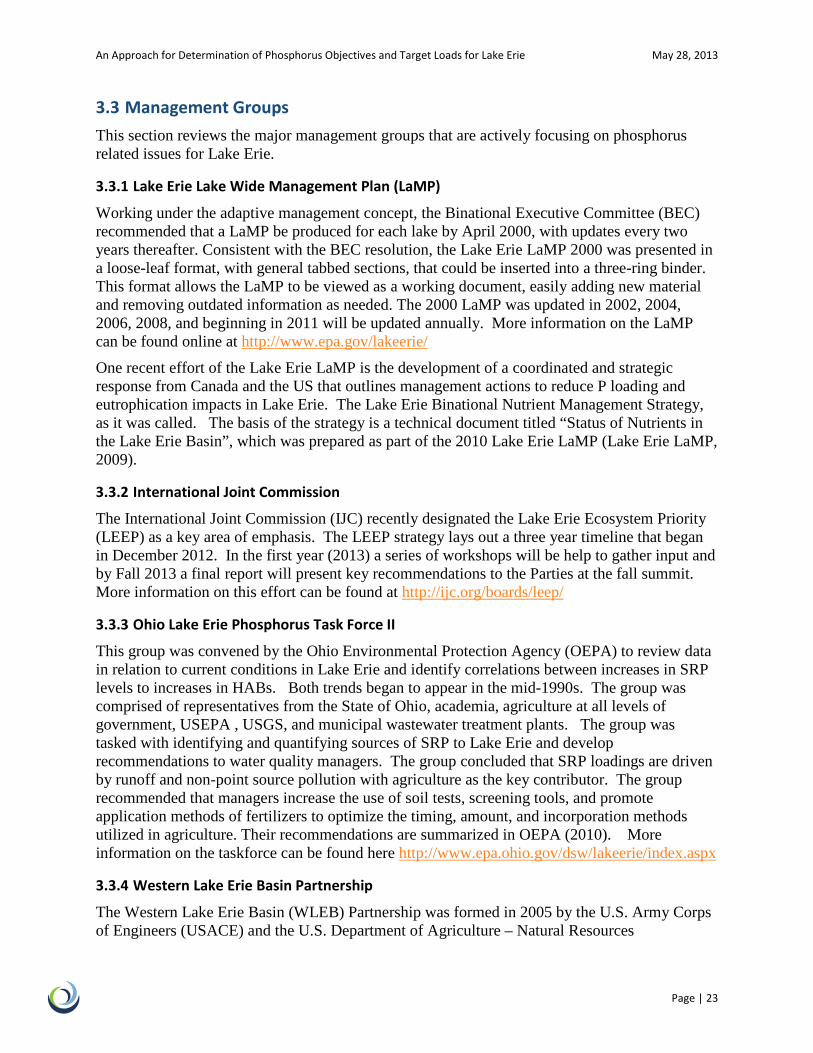
Another revision of the “Canale and Auer” Cladophora model mentioned in the previous section was undertaken by Higgins et al (Higgins et al., 2005a). The Cladophora Growth Model (CGM), as termed by the authors, includes several revisions to the Canale and Auer model that were identified when applying the model to eastern Lake Erie. The revisions include further refinements of Cladophora response to changes in light extinction (Kpar) and maximum biomass (Xmax).
Figure 3-8 Relationship between available light (PAR) and maximum Cladophora biomass (from Higgins et al. 2005)
An Approach for Determination of Phosphorus Objectives and Target Loads for Lake Erie May 28, 2013
Page | 23
3.3 Management Groups This section reviews the major management groups that are actively focusing on phosphorus related issues for Lake Erie.
3.3.1 Lake Erie Lake Wide Management Plan (LaMP)
Working under the adaptive management concept, the Binational Executive Committee (BEC) recommended that a LaMP be produced for each lake by April 2000, with updates every two years thereafter. Consistent with the BEC resolution, the Lake Erie LaMP 2000 was presented in a loose-leaf format, with general tabbed sections, that could be inserted into a three-ring binder. This format allows the LaMP to be viewed as a working document, easily adding new material and removing outdated information as needed. The 2000 LaMP was updated in 2002, 2004, 2006, 2008, and beginning in 2011 will be updated annually. More information on the LaMP can be found online at http://www.epa.gov/lakeerie/
One recent effort of the Lake Erie LaMP is the development of a coordinated and strategic response from Canada and the US that outlines management actions to reduce P loading and eutrophication impacts in Lake Erie. The Lake Erie Binational Nutrient Management Strategy, as it was called. The basis of the strategy is a technical document titled “Status of Nutrients in the Lake Erie Basin”, which was prepared as part of the 2010 Lake Erie LaMP (Lake Erie LaMP, 2009).
3.3.2 International Joint Commission
The International Joint Commission (IJC) recently designated the Lake Erie Ecosystem Priority (LEEP) as a key area of emphasis. The LEEP strategy lays out a three year timeline that began in December 2012. In the first year (2013) a series of workshops will be help to gather input and by Fall 2013 a final report will present key recommendations to the Parties at the fall summit. More information on this effort can be found at http://ijc.org/boards/leep/
3.3.3 Ohio Lake Erie Phosphorus Task Force II
This group was convened by the Ohio Environmental Protection Agency (OEPA) to review data in relation to current conditions in Lake Erie and identify correlations between increases in SRP levels to increases in HABs. Both trends began to appear in the mid-1990s. The group was comprised of representatives from the State of Ohio, academia, agriculture at all levels of government, USEPA , USGS, and municipal wastewater treatment plants. The group was tasked with identifying and quantifying sources of SRP to Lake Erie and develop recommendations to water quality managers. The group concluded that SRP loadings are driven by runoff and non-point source pollution with agriculture as the key contributor. The group recommended that managers increase the use of soil tests, screening tools, and promote application methods of fertilizers to optimize the timing, amount, and incorporation methods utilized in agriculture. Their recommendations are summarized in OEPA (2010). More information on the taskforce can be found here http://www.epa.ohio.gov/dsw/lakeerie/index.aspx
3.3.4 Western Lake Erie Basin Partnership
The Western Lake Erie Basin (WLEB) Partnership was formed in 2005 by the U.S. Army Corps of Engineers (USACE) and the U.S. Department of Agriculture – Natural Resources
An Approach for Determination of Phosphorus Objectives and Target Loads for Lake Erie May 28, 2013
Page | 24
Conservation Service (NRCS) by extending invites to 14 federal, state, and local partners to enhance collaboration and build consensus to link land use to water quality. The Leadership Committee for the WLEB Partnership is comprised of senior members of their respective organizations. This group oversees the efforts of an Operational Committee and Coordination Teams in four areas: Project Coordination Team, Outreach/Public Education Coordination Team, Resource Coordination Team, and Research & Data Coordination Team. More information on WLEB Partnership can be found online at http://wleb.org
3.3.5 Lake Erie Millennium Network
The Lake Erie Millennium Network was initiated in 1998 by a group of scientists to foster and coordinate research relevant to the Lake Erie ecosystem through a binational, collaborative network. The objectives of the network are to summarize the current status of Lake Erie, document the research and management needs of users and agencies, and develop a framework to ensure coordinated collection and dissemination of data to meet research and management needs. More information can be found on the network at http://www.lemn.org/ .
An Approach for Determination of Phosphorus Objectives and Target Loads for Lake Erie May 28, 2013
Page | 25
4 TAcLE Summary
This section presents a summary of the draft Taking Action for Lake Erie (TAcLE) report, which is close to being released as part of the IJC Lake Erie Ecosystem Priority (LEEP).
4.1 Attached Algae in Lake Erie David Depew, Ralph Smith, Stephanie Guildford, Todd Howell, Scott Higgins and Veronique Hiriart-Baer
The issue of nuisance benthic algal blooms in Lake Erie merits sustained programs of integrated research and monitoring because the symptoms (both anthropocentric such as beach fouling, and ecological such as botulism outbreaks) of impairment to coastal regions in Lake Erie are so pervasive that they cannot feasibly be ignored. It is clear that the synergistic impacts of human activity, invasive species and climate change present an extraordinary challenge in developing management objectives for nuisance blooms of benthic algae in Lake Erie.
At this point, much of the information regarding nuisance benthic algal blooms in the Great Lakes in the past (and in more recent years) has been limited to site-specific assessments, sometimes supplemented with experimentation and simulation modeling. We now know that there are a number of important factors that influence the dynamics of benthic algal blooms in near shore waters of the Great Lakes. Hydrodynamic and circulation of water masses shape the interaction of lake water with land-based runoff and tributary discharges, and strongly influence the nutrient, light, temperature and disturbance regimes in the near-shore. In addition, we now have a stronger sense of the ability of filter feeding organisms such as Dreissenid mussels to act as a benthic – pelagic coupling mechanism, which may attenuate or exacerbate conditions suitable for the growth of benthic algae. What is lacking at present is a comprehensive understanding of how these various factors work together to create the attendant conditions associated with nuisance blooms of Cladophora and Lyngbya. This understanding is crucial for the sound development of management activity.
4.2 Reducing Phosphorus Loads to Lake Erie: Best Management Practices Shawn P. McElmurry, Remegio Confesor Jr., R. Peter Richards
Strong correlations exist between phosphorus (P) loads discharged into Lake Erie and phytoplankton production (Anderson et al., 2002). This review provides an overview of BMPs that are employed to reduce P loads, BMPs that are likely to be considered for implementation within the Lake Erie basin to reduce P discharges in stormwater. The review is divided into two sections, urban and rural BMPs. Individual BMPs are often designed to reduce an array of pollutant loads, most commonly they are designed to reduce peak flow and total suspended solids – particularly in urban environments. This review specifically focuses on BMPs that have been evaluated using scientific methods for P reduction. A secondary focus was to highlight
An Approach for Determination of Phosphorus Objectives and Target Loads for Lake Erie May 28, 2013
Page | 26
BMPs that have been implemented within the Lake Erie watershed, or at least in the Great Lake region.
Review of over 240 primary sources has resulted in the following findings: (1) very few studies have quantified P load reductions by urban or agricultural BMPs within the Lake Erie watershed; (2) it is not possible to determine BMP cost-effectiveness due to costs rarely being reported; (3) BMP effectiveness, both urban and agricultural, vary greatly and are often contradictory; (4) most methods commonly used to quantify BMP performance are ineffective; (5) there is a need to move beyond total P measurements as the only metric used to quantify P, assessing speciation is necessary to advance BMP performance; (6) improved models are required to accurately predict treatment efficiency of BMPs under a variety of conditions and climates; and (7) while some databases exist, a central data repository is critically needed to synthesize data collected and improve understanding of BMP effectiveness.
4.3 Modeling the Causal Linkages among Dissolved Oxygen (DO), Chlorophyll a, Harmful Algal Blooms (HABs) and Nutrient Loading in Lake Erie
Weitao Zhang, George Arhonditsis
This effort evaluated the capacity of existing modeling efforts in Lake Erie to depict the causal relationships between major water quality indicators (e.g., chla, HABs, DO) and nutrient loading. A review was conducted of nearly all the modeling projects documented in the pertinent literature (e.g., CE-QUAL-W2, ELCOM-CAEDYM), and then the performance was evaluated of six models applied over the past thirty years. The six models represent a wide range of temporal (daily, seasonal) resolutions and spatial scales (1-D, 2-D, 3-D). The adequacy of the model parameterizations was assessed to represent the actual ecological processes underlying the dynamics of Lake Erie, and their ability to reproduce the spatial and temporal variability of harmful algal blooms (HABs). The goal was also to assess to what extent the current generation of mechanistic models has the capacity to reproduce patterns of individual phytoplankton groups, e.g., cyanobacteria dynamics, the functional role of Dreissenid mussels in the system, and the relative importance of diagenesis processes on the manifestation of hypoxia. Finally, the study offers scientifically sound guidance for future augmentations of the Lake Erie modeling, and critically discusses the most appropriate (and feasible) models to address questions related to hypoxia and cyanobacteria dominance.
4.4 Interactive Effects of Nutrient Inputs and Climate Change on the Lake Erie Fish Community
Stuart A. Ludsin and Tomas O. Höök
Continued climate change holds great potential to alter Lake Erie’s fish communities through its effects on in-lake physicochemical (habitat) conditions. To date, however, a general appreciation for how Lake Erie’s fisheries are expected to respond to continued climate change is lacking, particularly with respect to processes that influence the delivery of subsidies (i.e., nutrients, sediments) from the watershed. Herein, we discuss four primary ways by which climate change might interact with the delivery of nutrients and sediments from the watershed to influence the fish community of Lake Erie. Specifically, we expect climate-driven water warming and increased precipitation during winter and spring to promote development of bottom hypoxic (“dead”) zones, reduce water clarity, exacerbate harmful algal blooms, and alter invertebrate
An Approach for Determination of Phosphorus Objectives and Target Loads for Lake Erie May 28, 2013
Page | 27
prey assemblages at the base of the food web. Each of these changes is expected to have a negative effect on Lake Erie fishes that are intolerant of eutrophic conditions (e.g., low water clarity and dissolved oxygen levels) when considered independently. However, these mechanisms have not been fully explored in the Lake Erie ecosystem, and understanding of their potential interactive effects with each and additional anthropogenic stressors (e.g., invasive Dreissenid mussels) is lacking. Hence, more research is clearly needed to fully appreciate the potential for climate change to alter the dynamics of the fish communities of Lake Erie.
4.5 Response Curves: Predictors for Cyanobacteria Blooms in Western Lake Erie Richard P. Stumpf and Donald Scavia
Stumpf et al. (Stumpf et al., 2012) examined the role of phosphorus loading on the severity of the summer cyanobacteria bloom in western Lake Erie. Bloom severity was quantified from satellite with a “cyanobacteria index” (CI). CI and area are linearly related, with a CI of 1.0 being approximately equivalent to 300 km2 of bloom > 106 cells ml-1.
Phosphorus data came from Heidelberg University, and discharge from the USGS. They found that loads and discharge from the Maumee River for spring (March through June) explained the variation in CI between years from 2002 to 2011 (see Figure 3-2 above). While the blooms peaked in late summer, loads in July and August had no bearing on the blooms. The result constrains the loading problem to spring, as years with large loads in July or in the previous winter showed no influence of those loading events.
Given the strength of impact of the 2011 data, the group constructed a regression with only 2002-2010 data for comparison. This model accurately predicted the 2011 bloom. All models tested to date under estimate the 2012 bloom. Also, included on the graph are predictions for 1991-2001 when CI estimates were not available, highlighting the two years from that set (1995, 1998) with qualitatively reported blooms.
4.6 Response curves expressing the relationship between TP/SRP loads and Central Basin hypoxia and chlorophyll concentrations
Daniel Rucinski, Donald Scavia, Joseph Depinto
A model, calibrated to observations in the Central Basin of Lake Erie, was used to develop response curves relating hypoxia and chlorophyll concentrations to phosphorus loads. The model is driven by a 1D hydrodynamic model that provides temperature and vertical mixing profiles (Rucinski et al., 2010). The biological portion of the coupled hydrodynamic-biological model incorporates phosphorus and carbon loading, internal phosphorus cycling, carbon cycling (in the form of algal biomass and detritus), algal growth and decay, zooplankton grazing, oxygen consumption and production processes, and sediment interactions.
While the model reproduces the oxygen profiles and concentrations well, this 1D representation of the vertical profile in the central basin is not capable of deriving a key management property – hypoxic area. However, a recent geostatistical analysis (Zhou et al., 2013) provides both quantitative estimates and associated uncertainties of hypoxia area, as well as a relationship between hypoxic area and bottom-water dissolved oxygen concentration. Using this latter relationship, we convert modeled bottom water concentration estimates to area to both compare
An Approach for Determination of Phosphorus Objectives and Target Loads for Lake Erie May 28, 2013
Page | 28
our area estimates with those of Zhou et al (Zhou et al., 2013) and to general hypoxic area response curves.
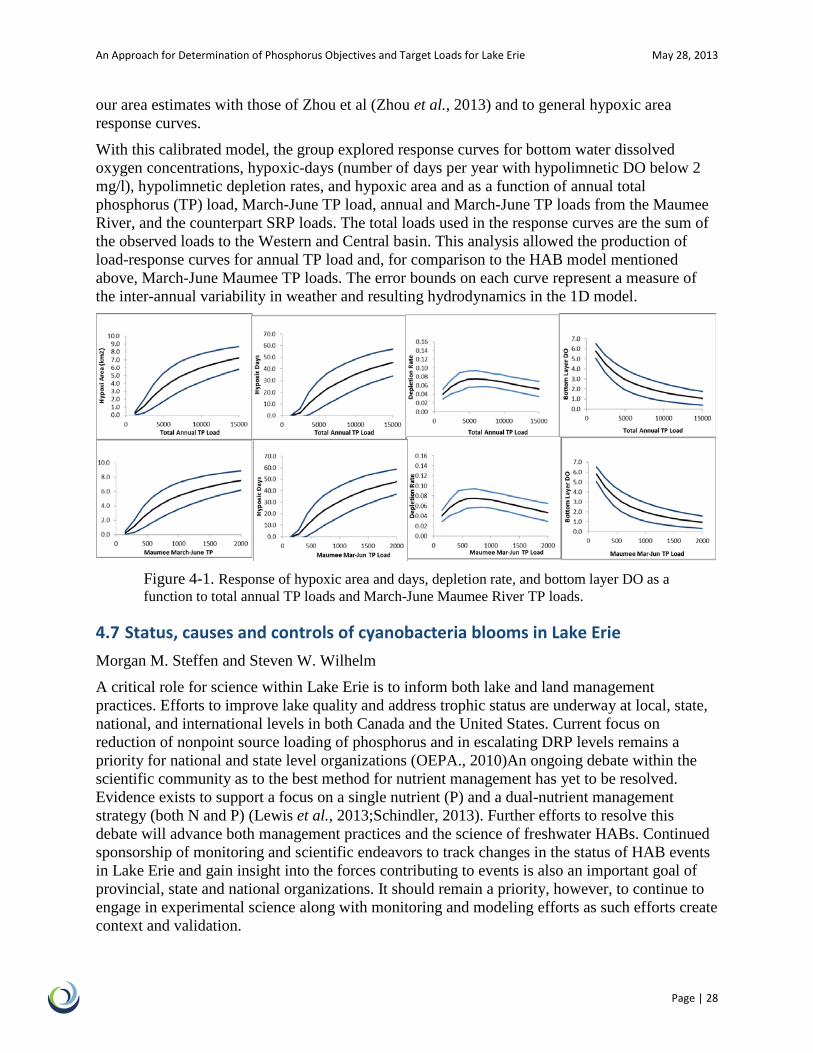
With this calibrated model, the group explored response curves for bottom water dissolved oxygen concentrations, hypoxic-days (number of days per year with hypolimnetic DO below 2 mg/l), hypolimnetic depletion rates, and hypoxic area and as a function of annual total phosphorus (TP) load, March-June TP load, annual and March-June TP loads from the Maumee River, and the counterpart SRP loads. The total loads used in the response curves are the sum of the observed loads to the Western and Central basin. This analysis allowed the production of load-response curves for annual TP load and, for comparison to the HAB model mentioned above, March-June Maumee TP loads. The error bounds on each curve represent a measure of the inter-annual variability in weather and resulting hydrodynamics in the 1D model.
Figure 4-1. Response of hypoxic area and days, depletion rate, and bottom layer DO as a function to total annual TP loads and March-June Maumee River TP loads.
4.7 Status, causes and controls of cyanobacteria blooms in Lake Erie Morgan M. Steffen and Steven W. Wilhelm
A critical role for science within Lake Erie is to inform both lake and land management practices. Efforts to improve lake quality and address trophic status are underway at local, state, national, and international levels in both Canada and the United States. Current focus on reduction of nonpoint source loading of phosphorus and in escalating DRP levels remains a priority for national and state level organizations (OEPA., 2010)An ongoing debate within the scientific community as to the best method for nutrient management has yet to be resolved. Evidence exists to support a focus on a single nutrient (P) and a dual-nutrient management strategy (both N and P) (Lewis et al., 2013;Schindler, 2013). Further efforts to resolve this debate will advance both management practices and the science of freshwater HABs. Continued sponsorship of monitoring and scientific endeavors to track changes in the status of HAB events in Lake Erie and gain insight into the forces contributing to events is also an important goal of provincial, state and national organizations. It should remain a priority, however, to continue to engage in experimental science along with monitoring and modeling efforts as such efforts create context and validation.
An Approach for Determination of Phosphorus Objectives and Target Loads for Lake Erie May 28, 2013
Page | 29
4.8 Current loads: Lake Erie Phosphorus Load Estimation: 2008 – 2011 David Dolan
Annual estimates (on a daily basis) for TP and SRP for the following time periods: Water Year (WY) 2008 – 2011 and Calendar Year (CY) 2008 – 2011. Estimates have been provided in spreadsheet format with spatial detail corresponding to the EcoFore project (i.e., 26 nodes covering major tributaries to Lake Erie). These spreadsheets will be made available as the data become complete (estimates through 2008 are final and 2009-2011 are still being updated).
4.9 External loading sources within the watershed Donald Scavia and Nathan Bosch
While non-point sources of phosphorus are the most important sources driving HABs and hypoxia, it is important to identify where to prioritize action. This effort is to identify those priority external loading sources with SWAT models of the most important watersheds. Using a suite of calibrated SWAT models, we delivered a set of maps and/or tables showing the highest phosphorus-yielding sub watersheds within each of the most important watersheds. Two maps (for TP and SRP) for each of 6 Lake Erie watersheds have been developed, showing high yield sub-watersheds as well as tables for each watershed with the yield numbers. These are average annual yields for each sub-watershed over the time period 1998- 2005. Yields are calculated by SWAT as material from land that enters stream channel, not what gets to mouth of river. Modeled soluble reactive phosphorus (SRP) and total phosphorus (TP) yields varied greatly among sub-watersheds within each of the six Lake Erie watersheds as well as between the watersheds.
4.10 Evaluate the implications of internal loads (magnitude, relative importance of internal load)
Murray Charlton
This report is based on literature review of estimates of the potential internal loads. However, because the internal loads are essentially a time-delayed response to external loads, the context will be to illustrate how internal loading can delay response, but that external loads will always be the driver.
The invasion of Dreissenid mussels has likely increased the efficiency of the internal load or recycle of phosphorus in shallow waters such as the west basin. Thus, nutrient controls may have to be more stringent than in the past.
Oxic phosphorus recycling can have a large effect on shallow waters as seen in the Bay of Quinte. This recycle is temperature sensitive; increasing temperatures will exacerbate conditions.
Hypoxic phosphorus regeneration from central basin sediment may be less important as a feedback mechanism now that external loads are somewhat controlled. Nevertheless, a return to higher algal populations would exacerbate the hypoxic events and lead to more important feedback consequences if warming scenarios happen.
None of the recycling mechanisms are susceptible to direct control. Instead they are central elements of how the lake processes nutrients.
An Approach for Determination of Phosphorus Objectives and Target Loads for Lake Erie May 28, 2013
Page | 30
5 Proposed Framework
5.1 Proposed Approach There are two overriding principles that will be followed in developing a proposed approach for updating the interim Lake Erie phosphorus objectives and loading targets. First, an application of multiple models will be used for the analysis, similar to what was done in the 1970s to establish and confirm the original P loading targets in the Agreement. Second, the philosophy in applying those models will be to begin with the biological response indicators of eutrophication in Lake Erie and use the models to compute a load-response relationship between external phosphorus loads and those indicators. That way whatever threshold is set for those eutrophication indicators can be related to an external loading target. The establishment of in-lake phosphorus concentration objectives will then merely be an additional and consistent output of that load-response relationship.
We also must remember that these lake systems are large, complex ecosystems. Their restoration will not be either an easy or quick process. Freedman, et. al., (2007) summarized some of the simple truths of restoration of large aquatic ecosystems based on experiences in Chesapeake Bay, the Everglades, and the Great Lakes. Among these truths are: to restore the water, focus on the land; system ecosystem structure and functioning must be considered in developing chemical targets; any management effort requires integrated research, monitoring, and modeling; and system response is not immediate and a long-term adaptive management approach should be developed.
One additional basic assumption should be mentioned at this time. It is that phosphorus (either total or dissolved reactive or some blend that represents bioavailable P) loading is assumed to be the independent variable in all of these load-response relationships being developed. There may be some sentiment to consider nitrogen load control in addition to phosphorus. There are times when Lake Erie can become nitrogen limited, but that generally only occurs when there is a large excess of available phosphorus in the system. One concern is that too much emphasis on nitrogen control without significant phosphorus reduction will only lead to large blooms of nitrogen-fixing cyanobacteria (Aphanizomenon or Anabaena). Also, most NPS BMPs will reduce both P and N loss, although by different relative amounts for different BMPs. Therefore, it is not logical to target N reduction because most load-response analysis to date shows good quantitative relationships with P load, and there is no guarantee that N reduction alone will reduce cyanobacteria blooms or Central Basin hypoxia reduction.
5.1.1 Application of Multiple Models to Develop Load – Response Relationships
The development of new phosphorus loading targets for Lake Erie amounts to a TMDL-like analysis similar to what was done for the Great Lakes eutrophication problems in the 1970s. The approach here involves first identifying the response variables that represent a eutrophication-related impairment in the lake, and then applying one or more models that quantitatively link those response variables to external forcing functions (nutrient loads and other environmental
An Approach for Determination of Phosphorus Objectives and Target Loads for Lake Erie May 28, 2013
Page | 31
conditions such as hydrology and meteorology). This modeling process produces a plot of the response variable as the dependent variable with the phosphorus loading as the independent variable. An attempt will be made, based on the models used for each plot to produce uncertainty bounds on the plot that represent a range of potential response for a given load.
The main difference now versus the 1970’s modeling is that the ecosystem structure and function in the lake has changed and there is an additional focus on nearshore issues as well as offshore. These differences require the use of new models that have been developed to address the changes in Lake Erie.
Based on the research and monitoring reviewed above, we can identify four eutrophication response indicators of concern for Lake Erie:
• Overall phytoplankton biomass as represented by chlorophyll a;
• cyanobacteria blooms (including Microcystis sp. and Lyngbya Wollei blooms.) in the Western Basin;
• hypoxia in hypolimnion of the Central Basin; and
• Cladophora in the nearshore areas of the Eastern Basin.
An “indicator”, as the list above shows, has a rather general definition that does not specify the spatial, temporal, frequency, or quantification method aspects of its definition. But to use these indicators in a quantitative analysis such as development of a load – response relationship requires the specification of how these indicators are to be measured including the four aspects mentioned above. We call the specification of how an indicator is to be quantified a “metric”. Of course, there are several metrics that can be used to quantify these indicators. The selection of a specific metric or metrics for each indicator involves understanding the use impairments generated by each as well as the capabilities of the model/s being used to develop the load-response relationship. For example, hypoxia in the Central Basin could be represented as the horizontal area with dissolved oxygen below 2 mg/L (such as in the Gulf of Mexico) or it could be expressed as the hypolimnion average dissolved oxygen concentration or as the volume-weighted hypolimnion oxygen depletion rate or as DO concentration in the bottom layer of the hypolimnion (such as done in the Chesapeake). We must also recognize that there is a temporal aspect to all of these metrics. For example, is the hypoxia area calculated over the entire summer stratification period or is it calculated for only the month of August? These are decisions that depend on model capabilities and deciding which metric or metrics best relate to fish or benthos impairments. These decisions will have to be made before modeling the load-response relationships for the above indicators.
5.1.2 Application of Multiple Models
There is precedent for using an ensemble (i.e., multiple) modeling approach for this type of assessment. A range of models with range of complexities and approaches that all use the same basic input data afford a comparison of results that can often be very constructive. Complexity in models can be expressed in terms of spatial, temporal, and process resolution. Reconciling differences among results in terms of the different assumptions used in various models provides insights about the most important sources and processes for a given system. In general, the benefits of applying multiple models of different complexity as identified by Bierman and Scavia (2013), include:
An Approach for Determination of Phosphorus Objectives and Target Loads for Lake Erie May 28, 2013
Page | 32
• Problems are viewed from different conceptual and operational perspectives; • The same datasets are mined in different ways; • Provides multiple lines of evidence; • Reduces the level of risk in environmental management decisions; and • Model diversity adds more value than model multiplicity.
Of course, the paradigm for this approach is the ensemble modeling conducted in the late 1970s to establish the original target P loads for the Great Lakes (Bierman, 1980). Here six models ranging in complexity from the Vollenweider empirical steady-state model (Vollenweider 1977) to the DiToro Lake Erie (DiToro and Connelly, 1980) and the Bierman Saginaw Bay models (Bierman and Dolan, 1981). The use of these multiple models in this assessment provided a quantitative framework for organizing and interpreting the existing data and a more informed basis for projecting the response to load reductions.
Examples of other ensemble approaches to support management decisions regarding large ecosystem include:
• The Multiple Management Models (M3) approach being developed for Chesapeake Bay by the Chesapeake Bay Program’s Scientific and Technical Advisory Committee (STAC) (http://www.chesapeake.org/stac/workshop.php?activity_id=222 );
• The International Joint Commission project that compared three different mass balance models for PCBs in Lake Ontario to assess the state of the art of modeling hydrophobic organic chemicals in large lakes (IJC, 1988);
• The use of multiple models to assess load – response relationships for hypoxia in the Gulf of Mexico (Scavia, et. al., 2004; Bierman and Scavia, 2013); and
• The use of multiple models to inform a nutrient TMDL for the Neuse River Estuary (Stow, et. al., 2003).
All of these efforts have provided new management insights and added confidence in using models for supporting management decisions.
This paper has identified the current models developed and applied in Lake Erie that may be used to implement a similar ensemble modeling approach for updating the Annex 4 objectives and target loads. The potential models for this assessment include those discussed in Section 3 above and included in Table 3-1. They can be referred to as:
• Chapra – dynamic total phosphorus model
• Stumpf – cyanobacteria index empirical model
• Leon - ELCOM–CAEDYM 3D whole lake hydrodynamic-water quality model
• Rucinski – 1D Central Basin hypoxia model
• DePinto – WLEEM 3D linked hydrodynamic –sediment transport – advanced eutrophication model for the Western Basin
• Zhang – ECOLE 2D whole lake model based on CE-QUAL-W2
• Auer – Great Lakes Cladophora Model
• Higgins – Cladophora Growth Model (CGM) for the Eastern Basin
An Approach for Determination of Phosphorus Objectives and Target Loads for Lake Erie May 28, 2013
Page | 33
Presented here is a suggested ensemble modeling approach based on these models and their applicability to the Lake Erie indicators listed above:
• Overall phytoplankton biomass as represented by chlorophyll a; The metric for this indicator might be something like a basin-specific, summer (June – August) average chlorophyll a concentration. Modeling this would require a model that simulates the time-variable total chlorophyll a in one or more of the Lake Erie basins. Therefore, the following models could be applied for this metric: Chapra, Leon, Zhang, Rucinski for the Central Basin, and DePinto for the Western Basin.
• Cyanobacteria blooms (especially Microcystis sp.) in the Western Basin; The metric for this indicator would be either the maximum basin-wide cyanobacteria biomass or the summer average cyanobacteria biomass in the basin. This metric therefore requires a model that is specific for the cyanobacteria functional group and either provides a time-variable simulation of that functional group or an empirical relationship for the metric in question. The Stumpf model is an empirical relationship between spring loading (March-June) from the Maumee River and the maximum cyanobacteria biomass as computed from the development of a cyanobacteria index from multi-spectral satellite image (MERIS). The Leon (although still in research mode), DePinto, and Zhang models all compute the cyanobacteria biomass on a time-variable basis and at a spatially resolution such that they can compute both maximum and summer average cyanobacteria biomass.
• Lyngbya Wollei blooms in the Western Basin; The University of Toledo group first found thick mats of the benthic blue-green alga, Lyngbya Wollei, in the Western Basin of Lake Erie in 2006 (Bridgeman and Penamon, 2010). His estimates of their Western Basin biomass or areal coverage may be selected as an eutrophication indicator. DePinto’s group is working to incorporate Lyngbya growth into their WLEEM model, but this is the only work being done to quantitatively related this nuisance alga to nutrient loads.
• Hypoxia in hypolimnion of the Central Basin; The hypoxia metric will likely be the number of hypoxic days in the Central Basin during a given summer stratification period, and/or the average areal extent of the hypoxic zone during a given summer month, and/or the average hypolimnion DO concentration during the summer stratified period. Three of the current models (Rucinski, Leon, and Chapra) can provide estimates of the relationship between these metrics and external phosphorus loads.
• Cladophora in the nearshore areas of the Eastern Basin.
The indicator of concern for the Eastern Basin is Cladophora growth in nearshore areas. Here the two Cladophora growth models of Auer and Higgins are candidates for this analysis. Both models could provide estimates of biomass per unit area and areal coverage, but both models would require a whole system model to provide boundary conditions that would allow them to relate the metrics to external loads. DePinto has incorporated the Auer Great Lakes Cladophora Model into their SAGEM2 model for Saginaw Bay and WLEEM for the Western Basin. That version of the DePinto model could be extended to the entire lake and provide a framework for the needed Cladophora calculations. In lieu of that, the Leon model could provide boundary conditions for either Cladophora model.
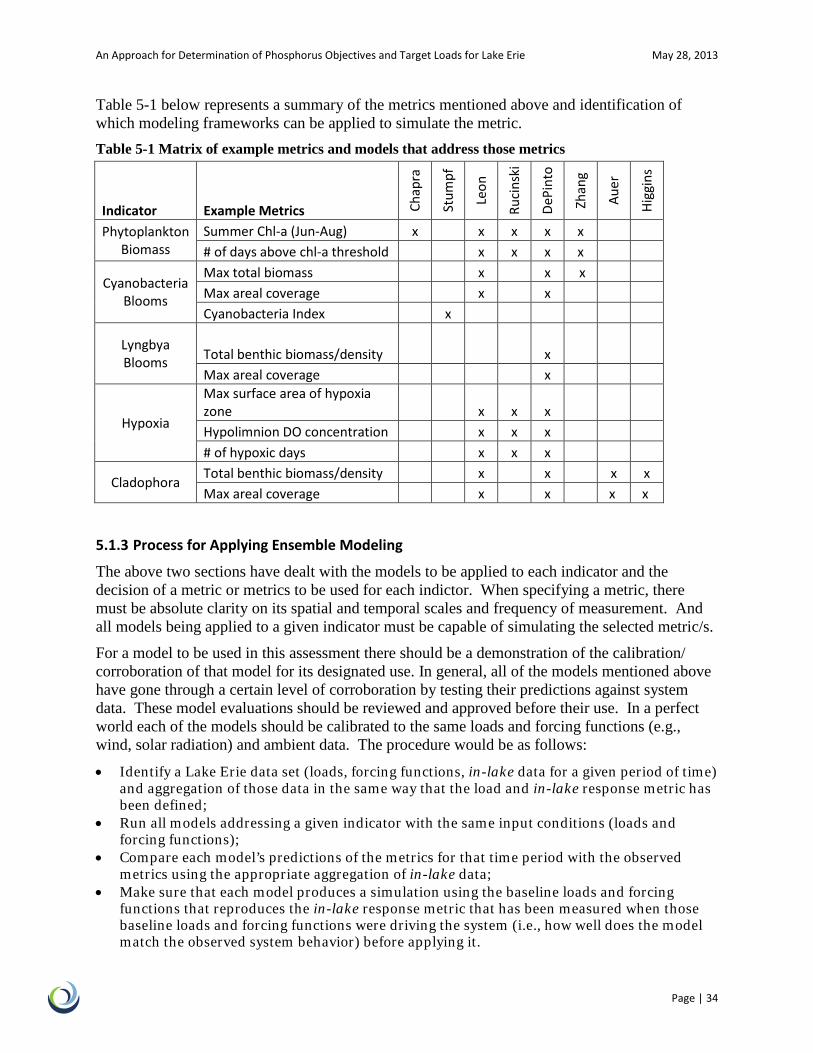
An Approach for Determination of Phosphorus Objectives and Target Loads for Lake Erie May 28, 2013
Page | 34
Table 5-1 below represents a summary of the metrics mentioned above and identification of which modeling frameworks can be applied to simulate the metric. Table 5-1 Matrix of example metrics and models that address those metrics
Indicator Example Metrics Chap
ra
Stum
pf
Leon
Ruci
nski
DePi
nto
Zhan
g
Auer
Higg
ins
Phytoplankton Biomass
Summer Chl-a (Jun-Aug) x x x x x # of days above chl-a threshold x x x x
Cyanobacteria Blooms
Max total biomass x x x Max areal coverage x x Cyanobacteria Index x
Lyngbya Blooms Total benthic biomass/density x
Max areal coverage x
Hypoxia
Max surface area of hypoxia zone x x x Hypolimnion DO concentration x x x # of hypoxic days x x x
Cladophora Total benthic biomass/density x x x x Max areal coverage x x x x
5.1.3 Process for Applying Ensemble Modeling
The above two sections have dealt with the models to be applied to each indicator and the decision of a metric or metrics to be used for each indictor. When specifying a metric, there must be absolute clarity on its spatial and temporal scales and frequency of measurement. And all models being applied to a given indicator must be capable of simulating the selected metric/s.
For a model to be used in this assessment there should be a demonstration of the calibration/ corroboration of that model for its designated use. In general, all of the models mentioned above have gone through a certain level of corroboration by testing their predictions against system data. These model evaluations should be reviewed and approved before their use. In a perfect world each of the models should be calibrated to the same loads and forcing functions (e.g., wind, solar radiation) and ambient data. The procedure would be as follows:
• Identify a Lake Erie data set (loads, forcing functions, in-lake data for a given period of time) and aggregation of those data in the same way that the load and in-lake response metric has been defined;
• Run all models addressing a given indicator with the same input conditions (loads and forcing functions);
• Compare each model’s predictions of the metrics for that time period with the observed metrics using the appropriate aggregation of in-lake data;
• Make sure that each model produces a simulation using the baseline loads and forcing functions that reproduces the in-lake response metric that has been measured when those baseline loads and forcing functions were driving the system (i.e., how well does the model match the observed system behavior) before applying it.
An Approach for Determination of Phosphorus Objectives and Target Loads for Lake Erie May 28, 2013
Page | 35
This process should be followed for each metric being evaluated. Ideally, an independent peer review panel will be employed to evaluate the models with respect to their use for application to the development of target P loads.
Each model will then be applied to develop a load-response relationship between the eutrophication metric being modeled on the ordinate and the loading that drives the model on the abscissa. Figure 3-2 is an example of a load-response plot for the Stumpf model. Similar to what was done for the Annex 3 review in the 1970s, it is important that all of the models are using a common Lake Erie baseline loading and other forcing functions, including the loading time series for both total and dissolved phosphorus from each major tributary and the Detroit River. Also, the baseline loads will represent a starting point for the model to relate the eutrophication metrics to the baseline loads and thereby judge the system response to load reductions.
Fortunately, Dave Dolan and Steve Chapra have completed an update of phosphorus loads for all of the Great Lakes and major embayments (Dolan and Chapra, 2012;Chapra and Dolan, 2012), including Lake Erie, for the period of 1994-2008. Also, Dolan has done a tributary and phosphorus form (i.e., TP and SRP) specific analysis as part of the University of Michigan led NSF Water Sustainability and Climate project. This work has contributed to the Lake Erie SRP and TP loads from 26 nodes for 2008 – 2011. We propose to use these two project results to develop the baseline phosphorus loads for the multiple model target analysis. This work will be used to develop a tributary-specific daily load of both SRP and TP for 26 nodes around Lake Erie. The load estimation approach of Dolan, combined with high frequency data from Heidelberg University, will be extended through 2012. Then, a baseline load year will be developed by an analysis of the period from 1994 – 2012. The analysis begins in the mid-1990s because that is when Heidelberg noticed the monotonic increasing of SRP load from the Maumee and Sandusky Rivers began. It seems that 2008 might be a good baseline load year choice because the total load for that year is 10,675 mt/y, which is not significantly different from the original Lake Erie target of 11,000 mt/y.
In producing the load-response plots for each model application, some of the models will also have computed in-lake phosphorus concentrations at various temporal and spatial scales for the loads analyzed. These ancillary model results will also be reported and compared against system data. These results can also be used to develop in-lake phosphorus objectives that are consistent with the loading targets derived from response indicators.
5.1.4 Strategy for integrating model-specific load-response relationships for making management decisions
Once the models have been applied to produce their respective load-response relationships, several decisions must be made to synthesize these ensemble results and to use them in support of establishing target phosphorus loads.
There are four basic questions that must be addressed in applying the ensemble model results to making management decisions. First, how do we aggregate the results of the multiple models that have been applied to each eutrophication metric? There are three options here: 1) develop an ensemble “average” of the load-response relationships for the various models applied to a given metric; 2) select the target load from what appears to be the “best” model among those being compared; and 3) somewhere in between the first two based on scientific weight-of-
An Approach for Determination of Phosphorus Objectives and Target Loads for Lake Erie May 28, 2013
Page | 36
evidence. There are numerous modeling issues involved with this process. For example, models will have different response times; models for cyanobacteria metrics may have a seasonal response time to load changes, while hypoxia models may require multiple years to respond fully to a load change. Should metric thresholds be set on the basis of achieving steady-state with the new loads or some fixed time interval after the load is achieved? The main consideration here is the time it might take the system to reach a steady-state condition with respect to the dynamic equilibrium driving phosphorus exchange between bottom sediments and water column. Also, the definition of a metric’s spatial and temporal aggregation may afford some flexibility in comparing and synthesizing multiple model results. In other words, we must recognize that one cannot define the “best” model independent of the scientific or management questions, and available data and resources.
Second, how should the target loads for the respective eutrophication endpoints be reconciled to produce a loading target for the Agreement that addresses each of the eutrophication indicators? We may find out that each indicator requires different spatial-temporal load targets and/or different targets for SRP versus TP. For example, meeting the Western Basin Microcystis bloom objective may require specific reduction of SRP loads from agricultural watersheds during the spring (March-June), while meeting Central Basin hypoxia objectives requires attention to TP loads during the entire year from all tributaries, direct point sources, and the Detroit River.
A third question to be answered is how to address the issue of uncertainty in the load – response relationships and the establishment of a “margin-of-safety” in setting target loads? Estimating uncertainty is relatively straightforward for simpler, empirical models but quantifying uncertainty for the more complex, process-based models. The application of these models to the Lake Erie model evaluation data set (mentioned above) should be able to provide some insights on relative model uncertainty.
Finally, once the above three questions have been addressed there still will remain a management decision to be made on: what is the target objective for each of the eutrophication metrics so that the load-response curves can be used to identify the revised target loads to be published in the Agreement?
Another point to be made is that the above modeling process will provide important support for establishing the revised target phosphorus loads to be accepted for the Great Lakes Water Quality Agreement. However, the final decision may also be based on the collective scientific insights that use monitoring studies and controlled experiments in addition to mathematical models. For example, it may be advisable to mine historical data to compute load-response relationships for historical conditions in either Lake Erie or other similar aquatic systems. If these relationships are not similar to what the current models suggest, then it would be very instructive to perform studies to find out why the relationships are different.
It may be advisable to develop an adaptive approach, where models and associated targets are updated on the basis of monitoring the system’s response to interim target loads that are achievable with a reasonable level of load reduction actions. This approach would also afford a way to arrive at a better estimate of uncertainty with respect to load – response relationships. For example, since we would expect the Microcystis blooms to respond quicker to load reductions than the Central Basin hypoxia, an Adaptive Management strategy might be to work on meeting the Microcystis bloom metric target loads and then evaluate how they system has responded
An Approach for Determination of Phosphorus Objectives and Target Loads for Lake Erie May 28, 2013
Page | 37
relative to the Central Basin hypoxia metric. Then additional load reduction plans might be developed on the basis of that evaluation.
Addressing and making decisions on all of these issues will probably require one or more large Lake Erie management workshops. The first workshop would serve as a scientific and model peer review process to review the model results and the science behind them. An independent peer review panel would be selected to review the work to assess model scientific soundness and accuracy. The peer review panel would also compare models with each other and with data to identify flaws and unknowns. They would also make judgments on whether sufficient data have been available to calibrate and constrain the models. The Panel would then meet with the modelers and Great Lakes resources managers (i.e., model users) to present and discuss their findings.
The second workshop would focus on a review of the model synthesis results with respect to developing and implementing the management decision-making process needed for Annex 4. This second management workshop will be organized under the auspices of the Great Lakes Water Quality Agreement Annex 4 Committee, perhaps with assistance from the Lake Erie Millennium Network. The workshop should seek to synthesize all of the various management efforts on Lake Erie mentioned in sections 3 and 4: the IJC Lake Erie Ecosystem Priority (including the TAcLE work products), the Lake Erie LaMP activities, the target load setting efforts of the Ohio Phosphorus Task Force II, and the Western Lake Erie Basin Partnership efforts.
An Approach for Determination of Phosphorus Objectives and Target Loads for Lake Erie May 28, 2013
Page | 38
6 References
Anderson,D.M., Glibert,P.M., Burkholder,J.M. 2002. Harmful Algal Blooms and Eutrophication: Nutrient Sources, Composition, and Consequences. Estuaries. Vol. 25 (4b). pp. 704-726.
Arend,K.K., Beletsky,D., DePinto,J.V., Ludsin,S., Roberts,J.J., Rucinksi,D.K., Scavia,D., Schwab,D.J., Hook,T.O. 2011. Seasonal and interannual effects of hypoxia on fish habitat quality in central Lake Erie. Freshwater Biology. Vol. 56. pp. 366-383.
Baker,D.B. 2011. The Sources and Transport of Bioavailable Phosphorus to Lake Erie Final Report - Overview. pp. 1-16. National Center for Water Quality Research, Heidelberg University, Tiffin, Ohio.
Bocaniov, S.A., Smith, R.E.H., Spillman, C.M., Hipsey, M.R., Leon, L.F. (2013) Three dimensional modeling of the impact of dreissenid mussels on phytoplankton in a large lake: Lake Erie, USA-Canada. (accepted Hydrobiologia).
Bierman,V.J. 1980. A Comparison of Models Developed for Phosphorus Management in the Great Lakes. Conference on Phosphorus Management Strategies for the Great Lakes. pp. 1-38.
Bierman, V.J., Jr. and D. Scavia. 2013. Hypoxia in the Gulf of Mexico: Benefits and Challenges of Using Multiple Models to Inform Management Decisions. Presentation at Multiple Models for Management (M3.2) in the Chesapeake Bay, Annapolis MD, February 25, 2013.
Bridgeman,T.B., Chaffin,J.D., filbrun,J.E. 2013. A novel method for tracking western Lake Erie Microcystis blooms, 2002–2011. Journal of Great Lakes Research. Vol. 39. pp. 83-89.
Bridgeman,T.B., Chaffin,J.D., Kane,D.D., Conroy,J.D., Panek,S.E., Armenio,P.M. 2012. From River to Lake: Phosphorus partitioning and algal community compositional changes in Western Lake Erie. Journal of Great Lakes Research. Vol. 38. pp. 90-97.
Bridgeman,T.B., Penamon,W.A. 2010. Lyngbya wollei in western Lake Erie. Journal of Great Lakes Research. Vol. 36. pp. 167-171.
Chaffin,J.D., Bridgeman,T.B., Heckathorn,S.A., Mishra,S. 2011. Assessment of Microcystis growth rate potential and nutrient status across a trophic gradient in western Lake Erie. Journal of Great Lakes Research. Vol. 37. pp. 92-100.
An Approach for Determination of Phosphorus Objectives and Target Loads for Lake Erie May 28, 2013
Page | 39
Chapra,S.C., Dolan,D.M. 2012. Great Lakes total phosphorus revisited: 2. Mass balance modeling. J Great Lakes Res. Vol. 38 (4). pp. 741-754.
Daloglu,I., Cho,K.H., Scavia,D. 2012. Evaluating Causes of Trends in Long-Term Dissolved Reactive Phosphorus Loads to Lake Erie. Environmental Science & Technology. Vol. 46. pp. 10660-10666.
Depew,D.C., Houben,A.J., Guildford,S.J., Hecky,R.E. 2011. Distribution of nuisance Cladophora in the lower Great Lakes: Patterns with land use, near shore water quality and dreissenid abundance. Journal of Great Lakes Research. Vol. 37. pp. 656-671.
DePinto,J.V., Lam,D., Auer,M.T., Burns,N., Chapra,S.C., Charlton,M.N., Dolan,D.M., Kreis,R., Howell,T., Scavia,D. 2006. EXAMINATION OF THE STATUS OF THE GOALS OF ANNEX 3 OF THE GREAT LAKES WATER QUALITY AGREEMENT. Rockwell,D., VanBochove,E., Looby,T. (eds). pp. 1-31.
Dolan,D.M., Chapra,S.C. 2012. Great Lakes total phosphorus revisited: 1. Loading analysis and update (1994-2008). J Great Lakes Res. Vol. 38 (4). pp. 730-740.
Edwards,W.J., Conroy,J.D., Culver,D.A. 2005. Hypolimnetic Oxygen Depletion Dynamics in the Central Basin of Lake Erie. Journal of Great Lakes Research. Vol. 31. pp. 262-271.
Freedman, P.L., Bierman, V.J., Jr., and DePinto, J.V. 2007. Hard lessons, simple truths. Water Environment and Technology. Vol. 19, No. 6: 57-62 (June, 2007).
Hecky, R.E., Smith, R.E.H., Barton, D.R., Guildford, S.A., Taylor, W.D., Howell, T.D., Charlton, M.N., 2004. The nearshore phosphorus shunt: a consequence of ecosystem engineering by dreissenids in the Laurentian Great Lakes Can. J. Fish. Aquat. Sci. 61: 1285–1293.
Hipsey, M.R., Romero, J.R.R., Antenucci, J.P., Imberger, J., 2006a. The computational aquatic ecosystem dynamics model (CAEDYM): a versatile water quality model for coupling with hydrodynamic drivers. Proc. 7th Int. Conference on Hydroinformatics, Nice, France.
Hipsey, M.R., Romero, J., Antenucci, J., Hamilton, D., 2006b. Computational Aquatic Ecosystem Dynamics Model CAEDYM Science Manual. Centre for Water Research, University of Western Australia.
Hodges, B.R., Imberger, J., Saggio, A., Winters, K., 2000. Modeling basin scale waves in a stratified lake. Limnol. Oceanogr. 45, 1603–1620.
Heidelberg 2012. 2011-2012 Annual Report National Center for Water Quality Research Heidelberg University. pp. 1-31. National Center for Water Quality Research, Heidelberg University, Tiffin, Ohio.
An Approach for Determination of Phosphorus Objectives and Target Loads for Lake Erie May 28, 2013
Page | 40
Higgins,S.N., Hecky,R.E., Guildford,S.J. 2005a. Modeling the Growth, Biomass, and Tissue Phosphorus Concentration of Cladophora glomerata in Eastern Lake Erie: Model Description and Field Testing. Journal of Great Lakes Research. Vol. 31. pp. 439-455.
Higgins,S.N., Howell,E.T., Hecky,R.E., Guildford,S.J., Smith,R.E. 2005b. The Wall of Green: The Status of Cladophora glomerata on the Northern Shores of Lake Erie's Eastern Basin, 1995–2002. Journal of Great Lakes Research. Vol. 31. pp. 547-563.
Horvatin,P.J., Adams,J. 2012. Partnering for Monitioring and Research Across the Great Lakes: The Cooperative Science and Monitoring Initiave. pp. 1-29.
IJC 2013. Assessment of Total Phosphorus and Dissolved Reactive Phosphorus Monitoring Programs within the Lake Erie Basin. pp. 1-15. International Joint Commission.
Krieger,K.A., Bur,M.T. 2009. Nearshore Hypoxia as a New Lake Erie Metric. pp. 1-38.
Lake Erie LaMP 2009. Status of Nutrient in the Lake Erie Basin. Prepared by the Lake Erie Nutrient Science Task Group for the Lake Erie Lakewide Management Plan.
Leon,L.F., Smith,R.E.H., Hipsey,M.R., Bocaniov,S.A., Higgins,S.N., Hecky,R.E., Antenucci,J.P., Imberger,J.A., Guildford,S.J. 2011. Application of a 3D hydrodynamic–biological model for seasonal and spatial dynamics of water quality and phytoplankton in Lake Erie. Journal of Great Lakes Research. Vol. 37. pp. 41-53.
Lewis,W.M.Jr., Wurtsbaugh,W.A., Paerl,H.W. 2013. Rationale for Control of Anthropogenic Nitrogen and Phosphorus to Reduce Eutrophication of Inland Waters. Environmental Science & Technology. Vol. 45. pp. 10300-10305.
LimnoTech 2010. Development, Calibration, and Application of the Lower Maumee River - Maumee Bay Model. pp. 1-127.
MDEQ 2006. Great Lakes Connecting Channels: 2005 Annual Data Report. pp. 1-73. Michigan Department of Environmental Quality.
OEPA 2013. Phosphorus Loading and Concentration Recommendations. pp. 1-4. Ohio Environmental Protection Agency.
OEPA. 2010. Ohio Lake Erie Phosphorus Task Force Final Report. pp. 1-109. Ohio Environmental Protection Agency.
Reutter,J.M., Ciborowski,J., DePinto,J.V., Bade,D., Baker,D., Bridgeman,T.B., Culver,D.A., Davis,S., Dayton,E., Kane,D.D., Mullen,R.W., Pennuto,C.M. 2011. Lake Erie Nutrient Loading and Harmful Algal Blooms: Research Findings and Management Implications. pp. 1-19.
An Approach for Determination of Phosphorus Objectives and Target Loads for Lake Erie May 28, 2013
Page | 41
Richards,R.P., Baker,B.D. 1993. Trends in Nutrient and Suspended Sediment Concentrations in Lake Erie Tributaries, 1975-1990. J.Great Lakes Res. Vol. 19 (2). pp. 200-211.
Rucinski,D.R., Beletsky,D., DePinto,J.V., Schwab,D.J., Scavia,D. 2010. A simple 1-dimensional, climate based dissolved oxygen model for the central basin of Lake Erie. Journal of Great Lakes Research. Vol. 36. pp. 465-476.
Saxton,M.A., D'souza,N.A., Bourbonniere,R.A., McKay,R.M.L., Wilhelm,S.W. 2012. Seasonal Si:C ratios in Lake Erie diatoms — Evidence of an active winter diatom community. Journal of Great Lakes Research. Vol. 38. pp. 206-211.
Scavia, D., Dubravko, J., and Bierman, V.J., Jr. 2004. Reducing Hypoxia in the Gulf of Mexico: Advice from Three Models. Estuaries. Vol. 27, No. 3, p. 419–425.
Schindler,D.W. 2013. The Dilemma of Controlling Cultural Eutrophication of Lakes. Proceedings of the Royal Society of Biological Sciences.
Stewart,T.W. 2008. Benthic Algae of Lake Erie (1865-2006): A Review of Assemblage Composition, Ecology, and Causes and Consequences of Changing Abundance. Ohio Journal of Science. Vol. 108 (5). pp. 82-94.
Stumpf,R.P., Wynne,T.T., Baker,D.B., Fahnenstiel,G.L. 2012. Interannual Variability of Cyanobacterial Blooms in Lake Erie. PLoS ONE. Vol. 7 (8). pp. 1-11.
Tomlinson,L.M., Auer,M.T., Bootsma,H.A., Owens,E.M. 2010. The Great Lakes Cladophora Model: Development, testing, and application to Lake Michigan. Journal of Great Lakes Research. Vol. 36. pp. 287-297.
United States and Canada 2012. 2012 Great Lakes Water Quality Agreement. USEPA and Environment Canada (ed). p. Annex 4. http://www.epa.gov/glnpo/glwqa/.
Vallentyne,J.R., Thomas,N.A. 1978. Fifth Year Review of Canada-United State Great Lakes Water Quality Agreement Report of Task Group III A Technical Group to Review Phosphorus Loadings. pp. 1-100.
Zhang,H., Culver,D.A., Boegman,L. 2011. Dreissenids in Lake Erie: an algal filter or a fertilizer? Aquatic Invasions. Vol. 6 (2). pp. 175-194.
Zhou,Y., Obenour,D.S., Johengen,T.H., Michalak,A.M. 2013. Spatial and Temporal Trends in Lake Erie Hypoxia, 1987-2007. Environmental Science & Technology. pp. 1-27.
An Approach for Determination of Phosphorus Objectives and Target Loads for Lake Erie May 28, 2013
Page | 42
7 Appendix A: List of All References
This is a complete listing of all of the references that were compiled for this discussion paper. Not all of the references were cited in the paper text due to space constraints.
Reference List
Anderson,D.M., Glibert,P.M., Burkholder,J.M. 2002. Harmful Algal Blooms and Eutrophication: Nutrient Sources, Composition, and Consequences. Estuaries. Vol. 25 (4b). pp. 704-726.
Anderson,R.M., Hobbs,B.F., Koonce,J.F., Locci,A.B. 2001. Using Decision Analysis to Choose Phosphorus Targets for Lake Erie. Environmental Management. Vol. 27 (2). pp. 235-252.
Arend,K.K., Beletsky,D., DePinto,J.V., Ludsin,S., Roberts,J.J., Rucinksi,D.K., Scavia,D., Schwab,D.J., Hook,T.O. 2011. Seasonal and interannual effects of hypoxia on fish habitat quality in central Lake Erie. Freshwater Biology. Vol. 56. pp. 366-383.
Armenio,P. 2011. Nutrient contributions from Dreissena spp. to Lyngbya wollei and Cladophora glomerata . pp. 1-50. The University of Toledo, Toledo, Ohio.
Auer,M.T., Tomlinson,L.M., Higgins,S.N., Malkin,S.Y., Howell,E.T., Bootsma,H.A. 2010. Great Lakes Cladophora in the 21st century: same algae-different ecosystem. J Great Lakes Res. Vol. 36. pp. 248-255.
Baker,D. 2010. Trends in Bioavailable Phosphorus Loading to Lake Erie. pp. 1-43. National Center for Water Quality Research, Heidelberg University, Tiffin, Ohio.
Baker,D.B. 2011. The Sources and Transport of Bioavailable Phosphorus to Lake Erie Final Report: Part 1 - Trends in Bioavailable Phosphorus Loading at River Monitoring Stations. pp. 1-30. National Center for Water Quality Research, Heidelberg University, Tiffin, Ohio.
Baker,D.B. 2011. The Sources and Transport of Bioavailable Phosphorus to Lake Erie Final Report: Part 4 - Bioavailabiltiy of Phosphorus in Contemporary Sewage Treatment Plant Effluents. pp. 1-18. National Center for Water Quality Research, Heidelberg University, Tiffin, Ohio.
Baker,D.B. 2011. The Sources and Transport of Bioavailable Phosphorus to Lake Erie Final Report - Overview. pp. 1-16. National Center for Water Quality Research, Heidelberg University, Tiffin, Ohio.
Baker,D.B. 2011. The Sources and Transport of Bioavailable Phosphorus to Lake Erie Final Report: Part 2 - Lagrangian Analysis of Bioavailable Phosphorus Transport from
An Approach for Determination of Phosphorus Objectives and Target Loads for Lake Erie May 28, 2013
Page | 43
Tributary Stations into Nearshore Zones. pp. 1-74. National Center for Water Quality Research, Heidelberg University, Tiffin, Ohio.
Barbiero,R.P., Tuchman,M.L. 2004. Long-term Dreissenid Impacts on Water Clarity in Lake Erie. J.Great Lakes Res. Vol. 30 (4). pp. 557-565.
Bierman,V.J. 1980. A Comparison of Models Developed for Phosphorus Management in the Great Lakes. Conference on Phosphorus Management Strategies for the Great Lakes. pp. 1-38.
Bierman, V.J., Jr. and D. Scavia. 2013. Hypoxia in the Gulf of Mexico: Benefits and Challenges of Using Multiple Models to Inform Management Decisions. Presentation at Multiple Models for Management (M3.2) in the Chesapeake Bay, Annapolis MD, February 25, 2013.
Binding,C.E., Greenberg,T.A., Bukata,R.P. 2012. An analysis of MODIS-derived algal and mineral turbidity in Lake Erie. Journal of Great Lakes Research. Vol. 38. pp. 107-116.
Bocaniov, S.A., Smith, R.E.H., Spillman, C.M., Hipsey, M.R., Leon, L.F. (2013) Three dimensional modeling of the impact of dreissenid mussels on phytoplankton in a large lake: Lake Erie, USA-Canada. (accepted Hydrobiologia).
Bosch,N.S., Allan,J.D., Dolan,D.M., Han,H., Richards,R.P. 2011. Application of the Soil and
Water Assessment Tool for six watersheds of Lake Erie: Model parameterization and calibration. Journal of Great Lakes Research. Vol. 37. pp. 263-271.
Bridgeman,T.B., Penamon,W.A. 2010. Lyngbya wollei in western Lake Erie. Journal of Great Lakes Research. Vol. 36. pp. 167-171.
Bridgeman,T.B., Chaffin,J.D., Kane,D.D., Conroy,J.D., Panek,S.E., Armenio,P.M. 2012. From River to Lake: Phosphorus partitioning and algal community compositional changes in Western Lake Erie. Journal of Great Lakes Research. Vol. 38. pp. 90-97.
Bridgeman,T.B., Chaffin,J.D., filbrun,J.E. 2013. A novel method for tracking western Lake Erie Microcystis blooms, 2002 –2011. Journal of Great Lakes Research. Vol. 39. pp. 83-89.
Burniston,D., McCrea,R., Klawunn,P., Ellison,R., Thompson,A., Bruxer,J. 2012. Detroit River Phosphorus Loading Determination. pp. 1-54. Environment Canada.
Burns,N.M., Rockwell,D., Bertram,P., Dolan,D.M., Ciborowski,J. 2005. Trends in Temperature, Secchi Depth, and Dissolved Oxygen Depletion Rates in the Central Basin of Lake Erie, 1983-2002. Journal of Great Lakes Research. Vol. 31 (2). pp. 35-49.
Carrick,H.J., Moon,J.B., Gaylord,B.F. 2005. Phytoplankton Dynamics and Hypoxia in Lake Erie: A Hypothesis Concerning Benthic-pelagic Coupling in the Central Basin. Journal of Great Lakes Research. Vol. 31 (2). pp. 111-124.
An Approach for Determination of Phosphorus Objectives and Target Loads for Lake Erie May 28, 2013
Page | 44
Chaffin,J.D., Kane,D.D. 2010. Burrowing mayfly (Ephemeroptera: Ephemeridae: Hexagenia spp.) bioturbation and bioirrigation: A source of internal phosphorus loading in Lake Erie. Journal of Great Lakes Research. Vol. 36. pp. 57-63.
Chaffin,J.D., Bridgeman,T.B., Heckathorn,S.A., Mishra,S. 2011. Assessment of Microcystis growth rate potential and nutrient status across a trophic gradient in western Lake Erie. Journal of Great Lakes Research. Vol. 37. pp. 92-100.
Chapra,S.C. 1977. Total Phosphorus model for the Great Lakes. Journal of the Environmental Engineering Division, American Society of Civil Engineers. Vol. 103 (EE2). pp. 147-161.
Chapra,S.C., Dolan,D.M. 2012. Great Lakes total phosphorus revisited: 2. Mass balance modeling. J Great Lakes Res. Vol. 38 (4). pp. 741-754.
Conroy,J.D., Kane,D.D., Dolan,D.M., Edwards,W.J., Charlton,M.N., Culver,D.A. 2012. Temporal Trends in Lake Erie Plankton Biomass: Roles of External Phosphorus Loading and Dreissenid Mussels. J.Great Lakes Res. Vol. 31. pp. 89-110.
Culver,D.A., Conroy,J.D. 2007. Impact of Dreissenid Mussel Population Changes on Lake Erie Nutrient Dynamics. pp. 1-18. Department of Evolution, Ecology, and Organismal Biology - The Ohio State University, Columbus, Ohio.
Daloglu,I., Cho,K.H., Scavia,D. 2012. Evaluating Causes of Trends in Long-Term Dissolved Reactive Phosphorus Loads to Lake Erie. Environmental Science & Technology. Vol. 46. pp. 10660-10666.
Davies,J.-M., Hecky,R.E. 2005. Initial Measurements of Benthic Photosynthesis and Respiration in Lake Erie. Journal of Great Lakes Research. Vol. 31 (2). pp. 195-207.
Davis,T.W., Koch,F., Marcoval,M.A., Wilhelm,S.W., Gobler,C.J. 2012. Mesozooplankton and microzooplankton grazing during cyanobacterial blooms in the western basin of Lake Erie. Harmful Algae. Vol. 15. pp. 26-35.
Depew,D.C., Houben,A.J., Guildford,S.J., Hecky,R.E. 2011. Distribution of nuisance Cladophora in the lower Great Lakes: Patterns with land use, near shore water quality and dreissenid abundance. Journal of Great Lakes Research. Vol. 37. pp. 656-671.
DePinto,J.V., Lam,D., Auer,M.T., Burns,N., Chapra,S.C., Charlton,M.N., Dolan,D.M., Kreis,R., Howell,T., Scavia,D. 2006. EXAMINATION OF THE STATUS OF THE GOALS OF ANNEX 3 OF THE GREAT LAKES WATER QUALITY AGREEMENT. Rockwell,D., VanBochove,E., Looby,T. (eds). pp. 1-31.
DePinto, J.V., T.C. Young, J.S. Bonner, P.W. Rodgers, "Microbial Recycle of Phytoplankton Phosphorus," Canadian Jour. Fish. Aquat. Sci., 43(2):336-342 (1986).
DePinto, J.V., T.C. Young and L.M. McIlroy, "Impact of Phosphorus Control Measures on Water Quality of the Great Lakes," Environ. Sci. Technology, 20(8):752-759 (1986).
An Approach for Determination of Phosphorus Objectives and Target Loads for Lake Erie May 28, 2013
Page | 45
DePinto, J.V., T.C. Young and D.K. Salisbury, "Impact of Phosphorus Availability on Modeling Phytoplankton Dynamics," Dutch Hydrobiological Bulletin 20(1/2):225-243 (1986).
DePinto, J.V., "An Experimental Apparatus for Evaluating Kinetics of Available Phosphorus Release from Aquatic Particulates," Water Research, 16 (6), 1065-1070 (1982).
DePinto, J.V., T.C. Young, J.S. Bonner, P.W. Rodgers, "Microbial Recycle of Phytoplankton Phosphorus," Canadian Jour. Fish. Aquat. Sci., 43(2):336-342 (1986).
DePinto, J.V., T.C. Young and L.M. McIlroy, "Impact of Phosphorus Control Measures on Water Quality of the Great Lakes," Environ. Sci. Technology, 20(8):752-759 (1986).
DePinto, J.V., T.C. Young and D.K. Salisbury, "Impact of Phosphorus Availability on Modeling Phytoplankton Dynamics," Dutch Hydrobiological Bulletin 20(1/2):225-243 (1986).
DePinto,J.V., Scavia,D. 2013. Models Can Support Establishment of Phosphorus Loading Targets for Lake Erie. pp. 1-59.
Di Toro,D.M., Connolly,J.P. 1980. Mathematical Models of Water Quality in Large Lakes. pp. 1-250.
Dolan,D.M., McGunagle,K.P. 2005. Lake Erie Total Phosphorus Loading Analysis and Update: 1996-2002. J.Great Lakes Res. Vol. 31. pp. 11-22.
Dolan,D.M., Chapra,S.C. 2012. Great Lakes total phosphorus revisited: 1. Loading analysis and update (1994-2008). J Great Lakes Res. Vol. 38 (4). pp. 730-740.
Eadie,B.J., Ludsin,S., Schwab,D.J., DePinto,J.V. 2004. Lake Erie Research Planning Workshop. pp. 1-28. GLERL/NOAA, Ann Arbor, MI.
Edwards,W.J., Conroy,J.D., Culver,D.A. 2005. Hypolimnetic Oxygen Depletion Dynamics in the Central Basin of Lake Erie. Journal of Great Lakes Research. Vol. 31. pp. 262-271.
Elsbury,K.E., Paytan,A., Ostrom,N.E., Kendall,C., Young,M.B., McLaughlin,K., Rollog,M.E., Watson,S. 2009. Using Oxygen Isotopes of Phosphate To Trace Phosphorus Sources and Cycling in Lake Erie. Environmental Science & Technology. Vol. 43 (9). pp. 3108-3114.
Han,H., Allan,J.D., Bosch,N.S. 2012. Historical pattern of phosphorus loading to Lake Erie watersheds. Journal of Great Lakes Research. Vol. 38. pp. 289-298.
Harris,G.P., Vollenweider,R.A. 1982. Paleolimnological Evidence of Early Eutrophican in Lake Erie. Canadian Journal of Fisheries and Aquatic Sciences. Vol. 39. pp. 618-626.
Hartig,J.H., Zarull,M.A., Ciborowski,J.J.H., Gannon,J.E., Wilke,E., Norwood,G., Vincent,A. 2007. State of the Strait Status and Trends of Key Indicators Detroit River and Western Lake Erie. Hartig,J.H., Zarull,M.A., Ciborowski,J.J.H., Gannon,J.E., Wilke,E., Norwood,G., Vincent,A. (eds). pp. 1-327. Great Lakes Institute for Environmental Research, University of Windsor, Ontario, Canada.
An Approach for Determination of Phosphorus Objectives and Target Loads for Lake Erie May 28, 2013
Page | 46
Hartig,J.H., Zarull,M.A., Ciborowski,J.J.H., Gannon,J.E., Wilke,E., Norwood,G., Vincent,A.N. 2009. Long-term ecosystem monitoring and assessment of the Detroit River and Western Lake Erie. Environmental Monitoring and Assessment. Vol. 158. pp. 87-104.
Hecky, R.E., Smith, R.E.H., Barton, D.R., Guildford, S.A., Taylor, W.D., Howell, T.D., Charlton, M.N., 2004. The nearshore phosphorus shunt: a consequence of ecosystem engineering by dreissenids in the Laurentian Great Lakes Can. J. Fish. Aquat. Sci. 61: 1285–1293.
Heidelberg 2012. 2011-2012 Annual Report National Center for Water Quality Research Heidelberg University. pp. 1-31. National Center for Water Quality Research, Heidelberg University, Tiffin, Ohio.
Hipsey, M.R., Romero, J.R.R., Antenucci, J.P., Imberger, J., 2006a. The computational aquatic ecosystem dynamics model (CAEDYM): a versatile water quality model for coupling with hydrodynamic drivers. Proc. 7th Int. Conference on Hydroinformatics, Nice, France.
Hipsey, M.R., Romero, J., Antenucci, J., Hamilton, D., 2006b. Computational Aquatic EcosystemDynamics Model CAEDYM Science Manual. Centre for Water Research, University of Western Australia. Dynamics Model CAEDYM Science Manual. Centre for Water Research, University of Western Australia.
Hodges, B.R., Imberger, J., Saggio, A., Winters, K., 2000. Modeling basin scale waves in a stratified lake. Limnol. Oceanogr. 45, 1603–1620.
Higgins,S.N., Hecky,R.E., Guildford,S.J. 2005. Modeling the Growth, Biomass, and Tissue Phosphorus Concentration of Cladophora glomerata in Eastern Lake Erie: Model Description and Field Testing. Journal of Great Lakes Research. Vol. 31. pp. 439-455.
Higgins,S.N., Howell,E.T., Hecky,R.E., Guildford,S.J., Smith,R.E. 2005. The Wall of Green: The Status of Cladophora glomerata on the Northern Shores of Lake Erie's Eastern Basin, 1995–2002. Journal of Great Lakes Research. Vol. 31. pp. 547-563.
Higgins,S.N., Hecky,R.E., Guildford,S.J. 2006. Environmental Controls of Cladophora Growth Dynamics in Eastern Lake Erie: Application of the Cladophora Growth Model (CGM). Journal of Great Lakes Research. Vol. 32. pp. 629-644.
Horvatin,P.J., Adams,J. 2012. Partnering for Monitioring and Research Across the Great Lakes: The Cooperative Science and Monitoring Initiave. pp. 1-29.
IJC 2013. Assessment of Total Phosphorus and Dissolved Reactive Phosphorus Monitoring Programs within the Lake Erie Basin. pp. 1-15. International Joint Commission.
Internal Joint Commission 1980. Phosphorus Management for the Great Lakes. pp. 1-143.
Joosse,P.J., Baker,B.D. 2011. Context for re-evaluating agricultural source phosphorus loadings to the Great Lakes. Canadian Journal of Soil Science. Vol. 91. pp. 317-327.
An Approach for Determination of Phosphorus Objectives and Target Loads for Lake Erie May 28, 2013
Page | 47
Krieger,K.A., Bur,M.T. 2009. Nearshore Hypoxia as a New Lake Erie Metric. pp. 1-38.
Kutovaya,O.A., McKay,R.M.L., Beall,B.F.N., Wilhelm,S.W., Kane,D.D., Chaffin,J.D., Brunberg,A.-K., Bullerjahn,G.S. 2012. Evidence against fluvial seeding of recurrent toxic blooms of Microcystis spp. in Lake Erie's western basin. Harmful Algae. Vol. 15. pp. 71-77.
Lake Erie LaMP 2009. Status of Nutrient in the Lake Erie Basin. Prepared by the Lake Erie Nutrient Science Task Group for the Lake Erie Lakewide Management Plan.
Lake Erie LaMP 2011. Lake Erie Binational Nutrient Management Strategy: Protecting Lake Erie by Managing Phosphorus. pp. 1-30. Prepared by the Lake Erie LaMP Work Group Nutrient Management Task Group.
Lambert,R.S. 2012. Great Lake Tributary Phosphorus Bioavailability. pp. 1-48. Michigan Technological University.
Leon,L.F., Imberger,J.A., Smith,R.E.H., Hecky,R.E., Lam,D., Schertzer,W.M. 2005. Modeling as a Tool for Nutrient Management in Lake Erie: a Hydrodynamics Study. Journal of Great Lakes Research. Vol. 31 (2). pp. 309-318.
Leon,L.F., Smith,R.E.H., Hipsey,M.R., Bocaniov,S.A., Higgins,S.N., Hecky,R.E., Antenucci,J.P., Imberger,J.A., Guildford,S.J. 2011. Application of a 3D hydrodynamic–biological model for seasonal and spatial dynamics of water quality and phytoplankton in Lake Erie. Journal of Great Lakes Research. Vol. 37. pp. 41-53.
Lesht,B., Fontaine,T.D., Dolan,D.M. 1991. Great Lakes Total Phosphorus Model: Post Audit and Regionalizes Sensitivity Analysis. Journal of Great Lakes Research. Vol. 17 (1). pp. 3-17.
Lewis,W.M.Jr., Wurtsbaugh,W.A., Paerl,H.W. 2013. Rationale for Control of Anthropogenic Nitrogen and Phosphorus to Reduce Eutrophication of Inland Waters. Environmental Science & Technology. Vol. 45. pp. 10300-10305.
LimnoTech 2010. Development, Calibration, and Application of the Lower Maumee River - Maumee Bay Model. pp. 1-127.
Ludsin,S.U., Kershner,M.W., Blocksom,K.A., Knigh,R.L., Stein,R.A. 2001. Life After Death in Lake Erie: Nutrient Controls Drive Fish Species Richness, Rehabilitation. Ecological Applications. Vol. 11 (3). pp. 731-746.
Matisoff,G., Neeson,T.M. 2005. Oxygen Concentration and Demand in Lake Erie Sediments. Journal of Great Lakes Research. Vol. 31 (2). pp. 284-295.
MDEQ 2006. Great Lakes Connecting Channels Data Evaluation and Trend Analysis Report. pp. 1-440.

An Approach for Determination of Phosphorus Objectives and Target Loads for Lake Erie May 28, 2013
Page | 48
MDEQ 2006. Great Lakes Connecting Channels: 2005 Annual Data Report. pp. 1-73. Michigan Department of Environmental Quality.
Michalak,A.M., others 2013. Record-setting algal bloom in Lake Erie caused by agricultural and meteorological trends consistent with expected future conditions. Proceedings of the National Academy of Sciences. Vol. PNAS Early Edition.
Millie,D.F., Fahnenstiel,G.L., Bressie,J.D., Pigg,R.J., Rediske,R.R., Klarer,D.M., Tester,P.A., Litaker,R.W. 2009. Late-summer phytoplankton in western Lake Erie (Laurentian Great Lakes): bloom distributions, toxicity, and environmental influences. Aquatic Ecology. Vol. 43. pp. 915-934.
Nickolls,K.H., Hopkins,G.J. 1993. Recent Changes in Lake Erie (North Shore) Phytoplankton: Cumulative Impacts of Phosphorus Loading Reductions and the Zebra Mussel Introduction. Journal of Great Lakes Research. Vol. 19 (4). pp. 637-647.
North,R.L., Smith,R.E.H., Hecky,R.E., Depew,D.C., León,L.F., Charlton,M.N., Guildford,S.J. 2012. Distribution of seston and nutrient concentrations in the eastern basin of Lake Erie pre- and post-dreissenid mussel invasion. J Great Lakes Res. Vol. 38. pp. 463-476.
OEPA 2013. Phosphorus Loading and Concentration Recommendations. pp. 1-4. Ohio Environmental Protection Agency.
OEPA. 2010. Ohio Lake Erie Phosphorus Task Force Final Report. pp. 1-109. Ohio Environmental Protection Agency.
Pothoven,S.A., Vanderploeg,H.A., Ludsin,S., Hook,T.O., Brandt,S.B. 2009. Feeding ecology of emerald shiners and rainbow smelt in central Lake Erie. Journal of Great Lakes Research. Vol. 35. pp. 190-198.
Reutter,J.M., Ciborowski,J., DePinto,J.V., Bade,D., Baker,D., Bridgeman,T.B., Culver,D.A., Davis,S., Dayton,E., Kane,D.D., Mullen,R.W., Pennuto,C.M. 2011. Lake Erie Nutrient Loading and Harmful Algal Blooms: Research Findings and Management Implications. pp. 1-19.
Richards,R.P., Baker,B.D. 1993. Trends in Nutrient and Suspended Sediment Concentrations in Lake Erie Tributaries, 1975-1990. J.Great Lakes Res. Vol. 19 (2). pp. 200-211.
Rucinski,D.R., Beletsky,D., DePinto,J.V., Schwab,D.J., Scavia,D. 2010. A simple 1-dimensional, climate based dissolved oxygen model for the central basin of Lake Erie. Journal of Great Lakes Research. Vol. 36. pp. 465-476.
Saxton,M.A., D'souza,N.A., Bourbonniere,R.A., McKay,R.M.L., Wilhelm,S.W. 2012. Seasonal Si:C ratios in Lake Erie diatoms — Evidence of an active winter diatom community. Journal of Great Lakes Research. Vol. 38. pp. 206-211.
Scavia, D., Dubravko, J., and Bierman, V.J., Jr. 2004. Reducing Hypoxia in the Gulf of Mexico: Advice from Three Models. Estuaries. Vol. 27, No. 3, p. 419–425.
An Approach for Determination of Phosphorus Objectives and Target Loads for Lake Erie May 28, 2013
Page | 49
Schindler,D.W. 2013. The Dilemma of Controlling Cultural Eutrophication of Lakes. Proceedings of the Royal Society of Biological Sciences.
Schwab,D.J., Beletsky,D., DePinto,J.V., Dolan,D.M. 2009. A hydrodynamic approach to modeling phosphorus distribution in Lake Erie. Journal of Great Lakes Research. Vol. 35. pp. 50-60.
Smith,D.A., Matisoff,G. 2008. Sediment Oxygen Demand in the Central Basin of Lake Erie. Journal of Great Lakes Research. Vol. 34. pp. 731-744.
Stewart,T.W. 2008. Benthic Algae of Lake Erie (1865-2006): A Review of Assemblage Composition, Ecology, and Causes and Consequences of Changing Abundance. Ohio Journal of Science. Vol. 108 (5). pp. 82-94.
Stumpf,R.P., Wynne,T.T., Baker,D.B., Fahnenstiel,G.L. 2012. Interannual Variability of Cyanobacterial Blooms in Lake Erie. PLoS ONE. Vol. 7 (8). pp. 1-11.
Thomas,N.A., Robertson,A., Sonzogni,W.C. 1979. Review of Control Objectives: New Targert Loads and Input Controls. Loehr,R.C., Martin,C.S., Rast,W. (eds) Phosphorus Management Strategies for Lakes. pp. 61-132, Ann Arbot.
Tomlinson,L.M., Auer,M.T., Bootsma,H.A., Owens,E.M. 2010. The Great Lakes Cladophora Model: Development, testing, and application to Lake Michigan. Journal of Great Lakes Research. Vol. 36. pp. 287-297.
United States and Canada 2012. 2012 Great Lakes Water Quality Agreement. USEPA and Environment Canada (ed). p. Annex 4. http://www.epa.gov/glnpo/glwqa/.
USACE 2009. Western Lake Erie Basin: State of the Basin. pp. 1-84. U.S. Army Corps of Engineers - Buffalo District.
Vallentyne,J.R., Thomas,N.A. 1978. Fifth Year Review of Canada-United State Great Lakes Water Quality Agreement Report of Task Group III A Technical Group to Review Phosphorus Loadings. pp. 1-100.
Wayne,T.T., Stumpf,R.P., Tomlinson,M.C., Fahnenstiel,G.L., Dyble,J., Schwab,D.J., Joshi,S.J. 2013. Evolution of a cyanobacterial bloom forecast system in western Lake Erie: Development and initial evaluation. Journal of Great Lakes Research.
Wilhelm,S.W., Bullerjahn,G.S., Eldridge,M.L., Kanto-Rinta,J.M., Poorvin,L., Bourbonniere,R.A. 2006. Seasonal Hypoxia and the Genetic Diversity of Prokaryote Populations in the Central Basin Hypolimnion of Lake Erie: Evidence for Abundant Cyanobacteria and Photosynthesis. Journal of Great Lakes Research. Vol. 32. pp. 657-671.
Wynne,T.T., Stumpf,R.P., Tomlinson,M.T., Dyble,J. 2010. Characterizing a cyanobacterial bloom in western Lake Erie using satellite imagery and meteorological data. Limnol.Oceanogr. Vol. 55 (5). pp. 2025-2036.
An Approach for Determination of Phosphorus Objectives and Target Loads for Lake Erie May 28, 2013
Page | 50
Young, T.C., J.V. DePinto, S.C. Martin, J.S. Bonner, "Algal-available Particulate Phosphorus in the Great Lakes Basin," Jour. Great Lakes Research, 111 (5), 434-446 (1985).
Zhang,H., Culver,D.A., Boegman,L. 2008. A two-dimensional ecological model of Lake Erie: Application to estimate dreissenid impacts on large lake plankton populations. Ecological Modeling. Vol. 214. pp. 219-241.
Zhang,H., Culver,D.A., Boegman,L. 2011. Dreissenids in Lake Erie: an algal filter or a fertilizer? Aquatic Invasions. Vol. 6 (2). pp. 175-194.
Zhou,Y., Obenour,D.S., Johengen,T.H., Michalak,A.M. 2013. Spatial and Temporal Trends in Lake Erie Hypoxia, 1987-2007. Environmental Science & Technology. pp. 1-27.