total cost of care measurement and affordability within ... · total cost of care measurement and...
TRANSCRIPT
Total Cost of Care Measurement and Affordability Within the Triple Aim
ICSI – MNCM Webinar May 22, 2013
Howard Epstein MD, FHM, CHIE Chief Health Systems Officer Institute for Clinical Systems Improvement [email protected] www.icsi.org
1
Tina Frontera, RN, MHA Chief Operating Officer Minnesota Community Measurement [email protected] www.mncm.org

Objectives
• Provide context and URGENCY for focus on TCOC measurement to achieve affordability within the Triple Aim framework
• Define basic Total Cost of Care (TCOC) terminology, principles and variation in the market
• Review MNCM methodology specifications for TCOC measurement
• Discuss how TCOC is being reported and used in new contracting arrangements between payers and providers
• Identify opportunities to reduce TCOC through quality improvement
2

ICSI 4.0: 2011 – present Plus Change Agent for the Triple Aim
3

Source: KaufmannHall August 2011 newsletter (http://www.KaufmanHall.com)
Healthcare Spending as a Driver of the National Debt
4

The World Health Report 2000: Spend ≠ Quality
Source: http://www.who.int/whr/2000/en/whr00_en.pdf
5

Total Cost per Person: Health Plan & Enrollee Shares
Source: MDH, Health Economics Program.
6

Projected State Revenue and Health Care Costs Relative to Budget
Source: General Fund Spending Outlook, presentation to the Budget Trends Commission, August 2008, Dybdal, Reitan and Broat
7

Social Determinants of Health
Source: Authors’ analysis and adaption from the University of Wisconsin Population Health Institute’s County Health Rankings model ©2010, http://www.countyhealthrankings.org/about-project/background
8
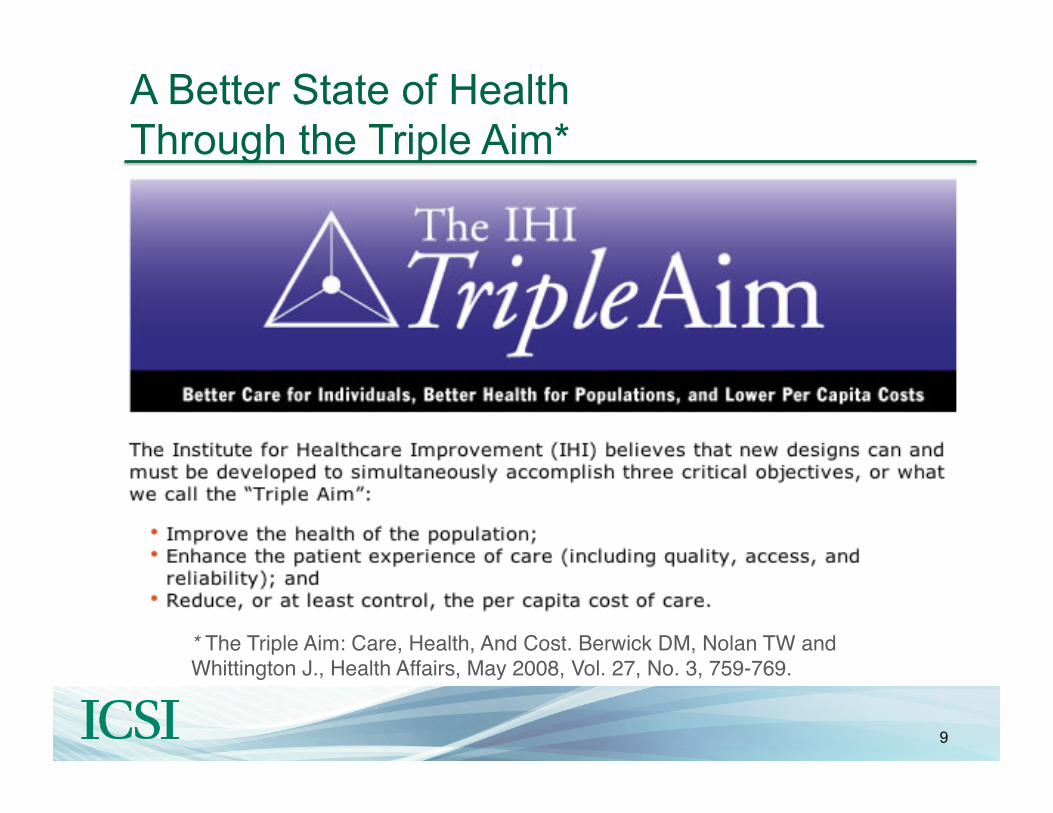
* The Triple Aim: Care, Health, And Cost. Berwick DM, Nolan TW and Whittington J., Health Affairs, May 2008, Vol. 27, No. 3, 759-769.
A Better State of Health
Through the Triple Aim*
9

MN
Com
mun
ity M
easu
rem
ent
MN Community Measurement
1. Accelerates improvement by measuring performance and publicly reporting health care information
2. A non profit multi-stakeholder, neutral source 3. Emerged out of community need to have a consistent
way of measurement and reporting in community 4. Helps align local and national initiatives
• Provide focus • Increase efficiency of measurement • Reduce overall community burden
5. Supports the Triple Aim: Health, Experience, Cost 10

MN
Com
mun
ity M
easu
rem
ent
Continuum of Cost/Value
Partial Unit Prices
Total Value
11
MN Community Measurement
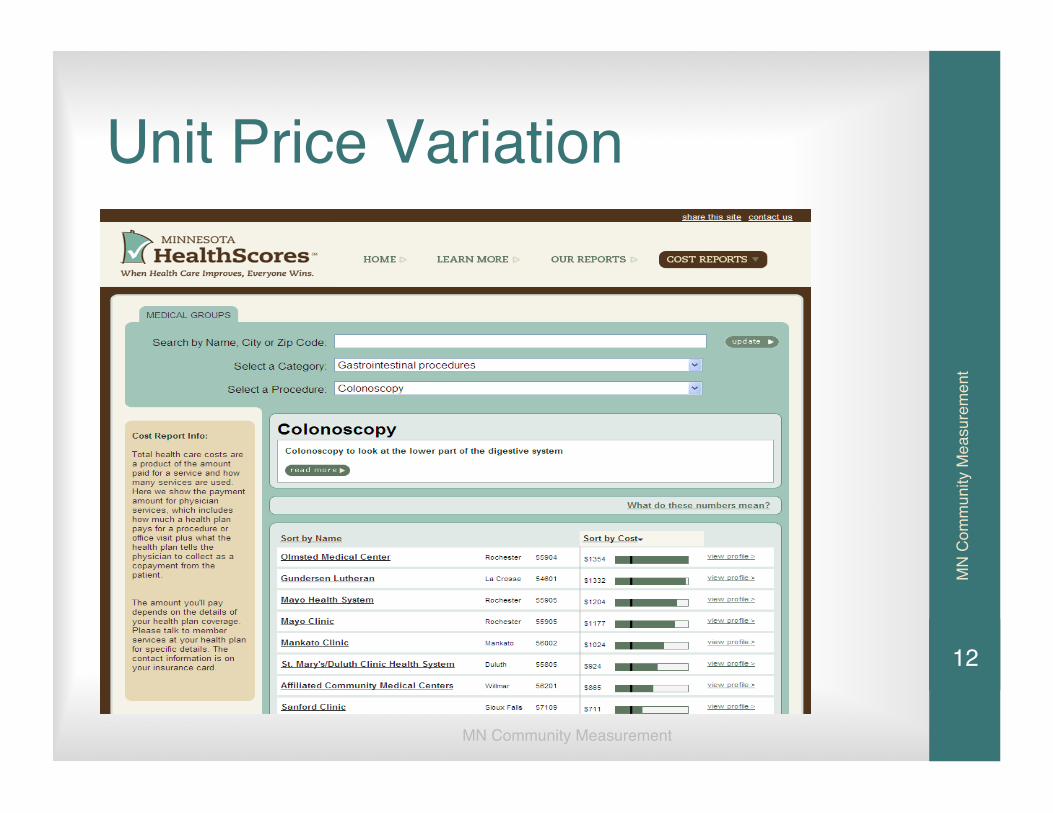
Unit Price Variation
MN
Com
mun
ity M
easu
rem
ent
12

MN
Com
mun
ity M
easu
rem
ent
COST TERMS/MODELS
• Partial Unit Price • Unit Price • DRG’s • ETG’s • Baskets of Care • Bundled Payment • Provider Peer Grouping • Ad Hoc Procedure/Diagnostic Grouping • Relative Resource Use • Total Cost of Care • Value Measures 13
MN
Com
mun
ity M
easu
rem
ent
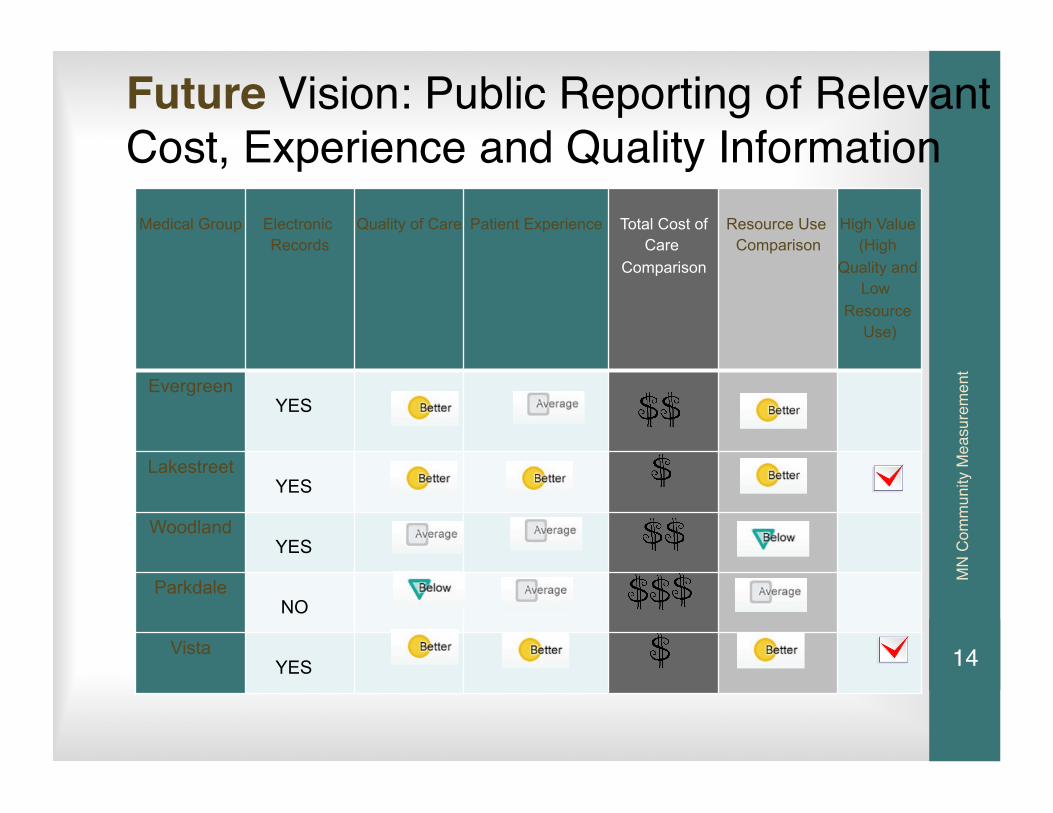
Future Vision: Public Reporting of Relevant Cost, Experience and Quality Information
Medical Group Electronic Records
Quality of Care Patient Experience Total Cost of Care
Comparison
Resource Use Comparison
High Value (High
Quality and Low
Resource Use)
Evergreen YES
Lakestreet YES
Woodland YES
Parkdale NO
Vista YES 14
MN
Com
mun
ity M
easu
rem
ent
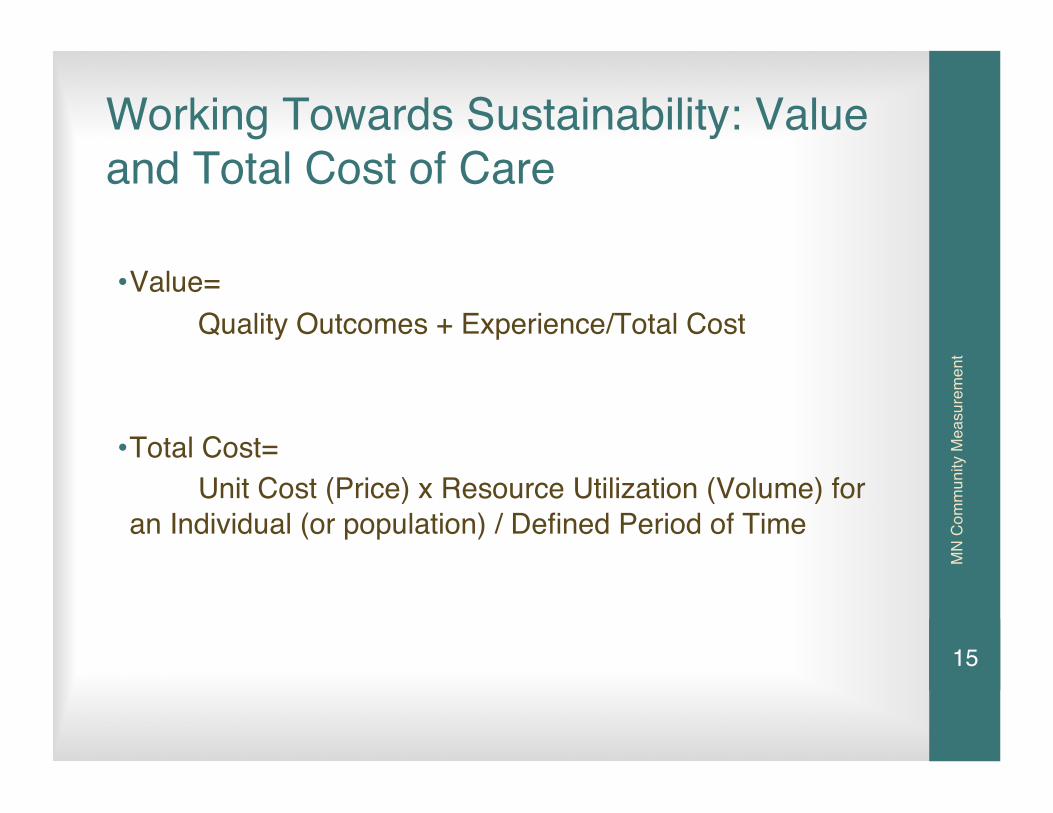
Working Towards Sustainability: Value and Total Cost of Care
• Value= Quality Outcomes + Experience/Total Cost
• Total Cost= Unit Cost (Price) x Resource Utilization (Volume) for an Individual (or population) / Defined Period of Time
15

MN
Com
mun
ity M
easu
rem
ent
Total Cost of Care Perspectives
$$$$________________________________________________ TOTAL COST TO SOCIETY: MEDICAL CARE, DISABILITY, PRODUCTIVITY, LONG TERM CARE, ETC. _________________________________________________ TOTAL COST OF MEDICAL CARE TO PURCHASERS/FUNDERS: GOVT., EMPLOYERS, INSURERS, SELF PAY INDIVIDUALS __________________________________________________ TOTAL COST OF MEDICAL CARE ATTRIBUTED TO PROVIDERS: FOR A PATIENT AND RISK ADJUSTED __________________________________________________ TOTAL COST OF MEDICAL CARE VISIBLE TO CONSUMERS: COPAYMENTS, OUT OF POCKET MAXIMUM, INSURANCE CONTRIBUTION, ETC. 16

MN
Com
mun
ity M
easu
rem
ent
*The Triple Aim: Care, Health, And Cost. Berwick DM, Nolan TW and Whittington J., Health Affairs, May 2008, Vol. 27, No. 3, 759-769.
Why a Common Methodology for Total Cost of Care?
• It’s Step 1 in Obtaining Alignment
• Promotes Transparency
• Consistency: Efficient, Comparable, Replicable
• To Increase Understanding: A Copay is Not the Total Cost
• “Savings” in One Area Does Not Mean Savings Overall
• To Support Efficiency / Resource Improvement Efforts
• A Starting Point For Drilling Down
17

MN
Com
mun
ity M
easu
rem
ent
Total Cost and Price Neutral Look:
18

MN
Com
mun
ity M
easu
rem
ent
Variation and ImprovementIs A Reality
• Variation of $1200 per person/per year by medical group in Minnesota.
• Variation of $1600 per person/per year for 265 groups and 750,000 Medicare recipients.
• Each percentage improvement in HbA1c and Lipid management decreased cost by $50 PP/PY. Total $5000 per patient.
• Practices with 30-65 MD FTEs had lower total cost and sometimes greater quality than large care systems.
• Emergency department visits for non emergency care varied from 3-13%.
Dowd, Knutson, Xu, Krazewski 19
MN
Com
mun
ity M
easu
rem
ent
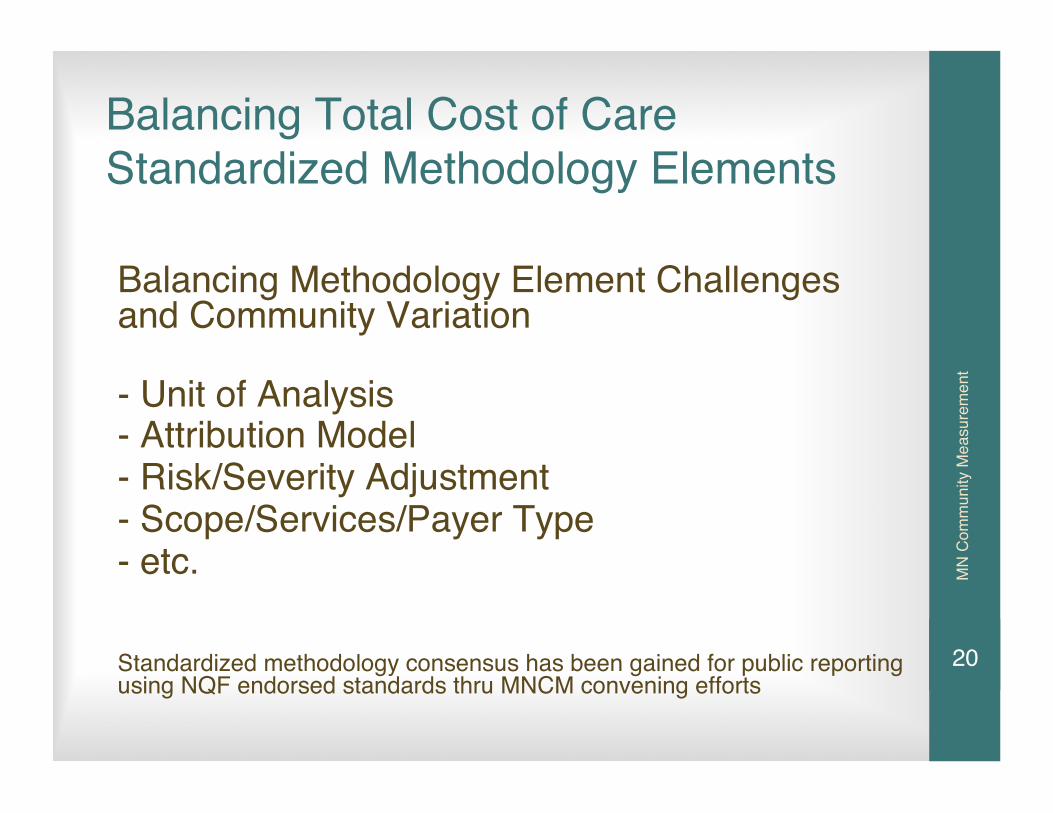
Balancing Total Cost of Care Standardized Methodology Elements
Balancing Methodology Element Challenges and Community Variation
- Unit of Analysis - Attribution Model - Risk/Severity Adjustment - Scope/Services/Payer Type - etc.
Standardized methodology consensus has been gained for public reporting using NQF endorsed standards thru MNCM convening efforts
20

*The Triple Aim: Care, Health, And Cost. Berwick DM, Nolan TW and Whittington J., Health Affairs, May 2008, Vol. 27, No. 3, 759-769. Head + Heart, Together

MN
Com
mun
ity M
easu
rem
ent
AttributionWho Has Responsibility for the Patient?
• “Non math” prospective model Self enrolled vs. assigned • “Math required” retrospective model thru claims to assign most involved provider with influence over patient - Primary care: majority visits vs. cost per year - Plurality rule: primary care, specialists - Look back period
“The perfect is the enemy of the good.” - Voltaire 22
MN
Com
mun
ity M
easu
rem
ent
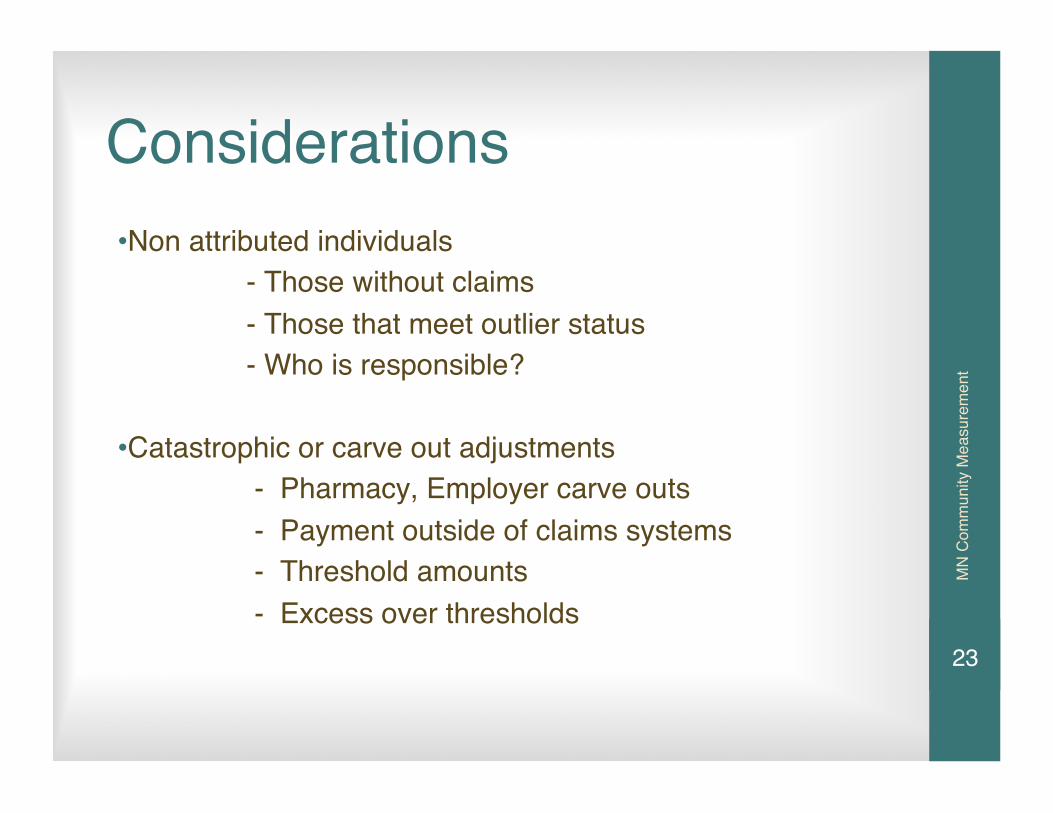
Considerations
• Non attributed individuals - Those without claims - Those that meet outlier status - Who is responsible?
• Catastrophic or carve out adjustments - Pharmacy, Employer carve outs - Payment outside of claims systems - Threshold amounts - Excess over thresholds
23

Cost Measure Advisory Group Membership
• Technical Advisory Group: Tina Morey-Allina*, Paul Berrisford-Entira Family Clinics*, Kathy Von Reuden-Essentia**, Andy McCoy-Fairview*, Rahul Koranne-Health East, Bill Telleen-Park Nicollet*, Sue Knudson/Chad Heim-HealthPartners***, Ernie Valente-BCBS*, Peter Thibodeau-Medica*, Terry Bernhard/Margaret Ranheim-PreferredOne***, Craig Christianson-UCare, Stefan Guildemeister-MDH, Nathan Moracco-SEGIP, Pete Benner-Citizen***, Matt Flory-Citizen**, Ann Carlson-General Mills, Kris Soegaard-MNBHCAG***, Mark Sonneborn-MHA, Janny Brust-MN Council Health Plans***, Cindy Keltner-AF4Q*, Howard Epstein-ICSI, Janet Silversmith-Minnesota Medical Association***.
• Clearing House Review Group (short term 2 meeting): Those above noted with a ** plus Paul Koehler-Blue Cross IT, Michelle Nied-Medica Communications
• Standardized Methodology Subgroup (long term): All those noted with a * above plus Holly Rodin-HealthEast, Kevan Edwards-MDH, Britta Lindvall-ICSI
24

MN
Com
mun
ity M
easu
rem
ent
TCOC Standardized Methodology Highlights
• Recommended methodology is in alignment with national standards (NQF endorsed)
• Attribution is balanced on the side of higher confidence in attribution over quantity of attributed patients
• There will be no member attribution if there is no claim • Will acknowledge and keep track of unattributed population for
future methodology refinement • Risk adjustment uses a standard commercial risk adjustment
software (same as the NQF endorsed risk adjustment methodology)
• Outlier status threshold is balanced for fair comparison of smaller and large providers over quantity of accounted costs
• Pharmacy costs will be imputed, when needed, for self insured employers
• This will be an evolutionary process
25
MN
Com
mun
ity M
easu
rem
ent
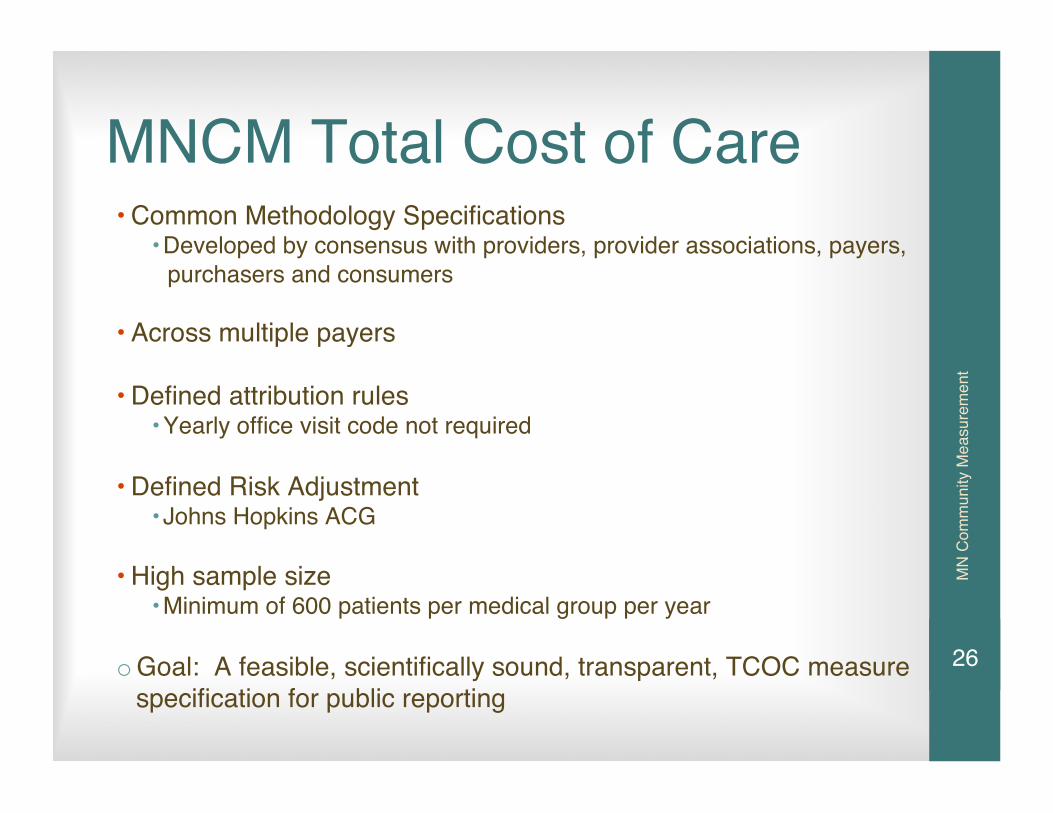
MNCM Total Cost of Care
• Common Methodology Specifications • Developed by consensus with providers, provider associations, payers,
purchasers and consumers
• Across multiple payers
• Defined attribution rules • Yearly office visit code not required
• Defined Risk Adjustment • Johns Hopkins ACG
• High sample size • Minimum of 600 patients per medical group per year
o Goal: A feasible, scientifically sound, transparent, TCOC measure specification for public reporting
26
MN
Com
mun
ity M
easu
rem
ent
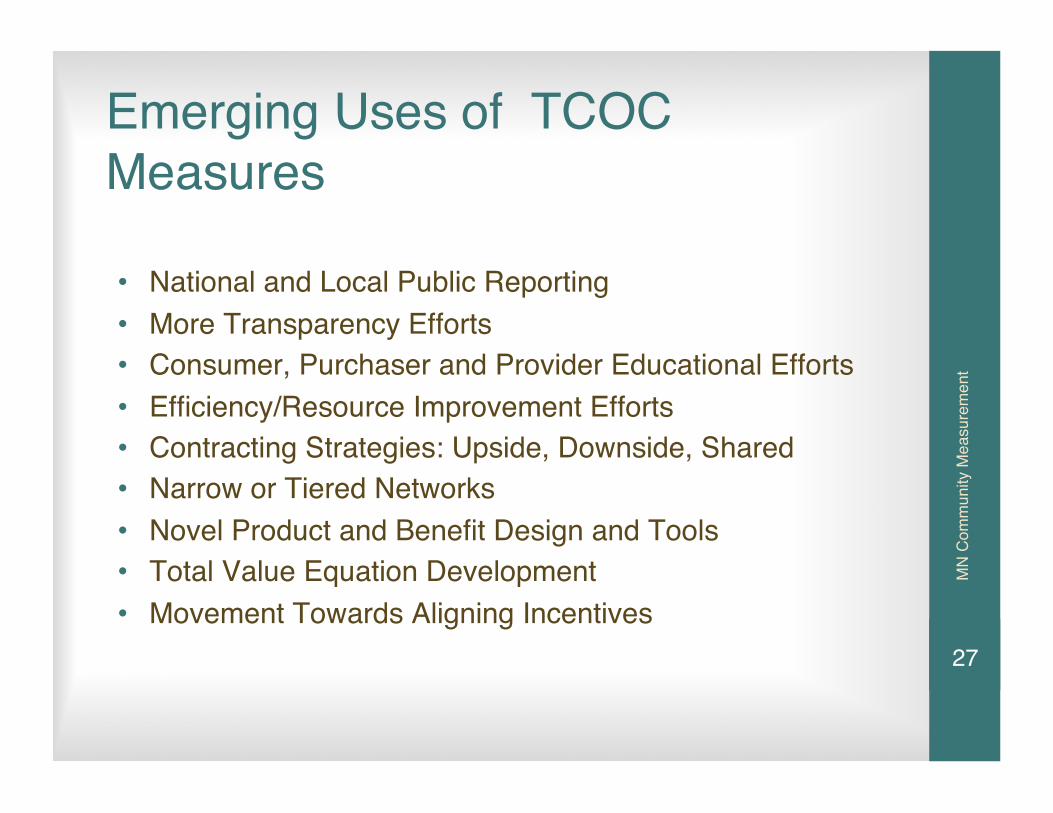
Emerging Uses of TCOC Measures
• National and Local Public Reporting • More Transparency Efforts • Consumer, Purchaser and Provider Educational Efforts • Efficiency/Resource Improvement Efforts • Contracting Strategies: Upside, Downside, Shared • Narrow or Tiered Networks • Novel Product and Benefit Design and Tools • Total Value Equation Development • Movement Towards Aligning Incentives
27
MN
Com
mun
ity M
easu
rem
ent
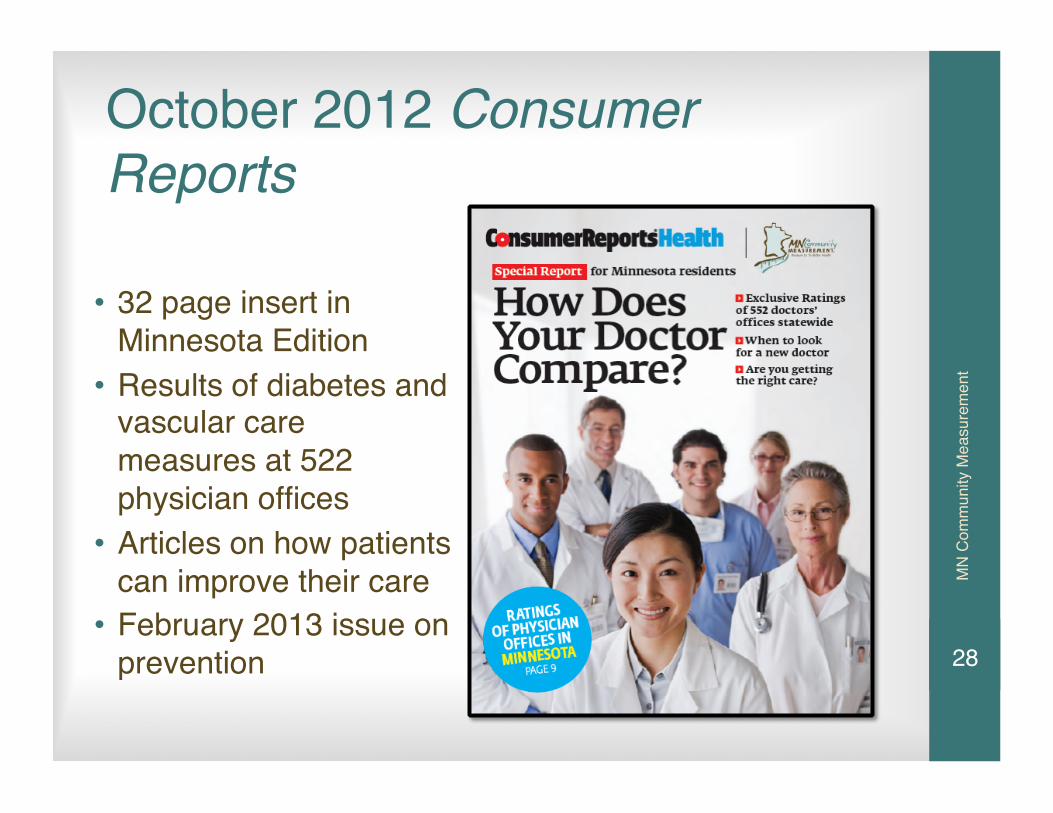
October 2012 Consumer Reports
• 32 page insert in Minnesota Edition
• Results of diabetes and vascular care measures at 522 physician offices
• Articles on how patients can improve their care
• February 2013 issue on prevention 28

MN
Com
mun
ity M
easu
rem
ent
Pulling Together as a Community to Reduce Total Cost of Care
MEASURE IT >>>>>>>>> IMPROVE IT
29
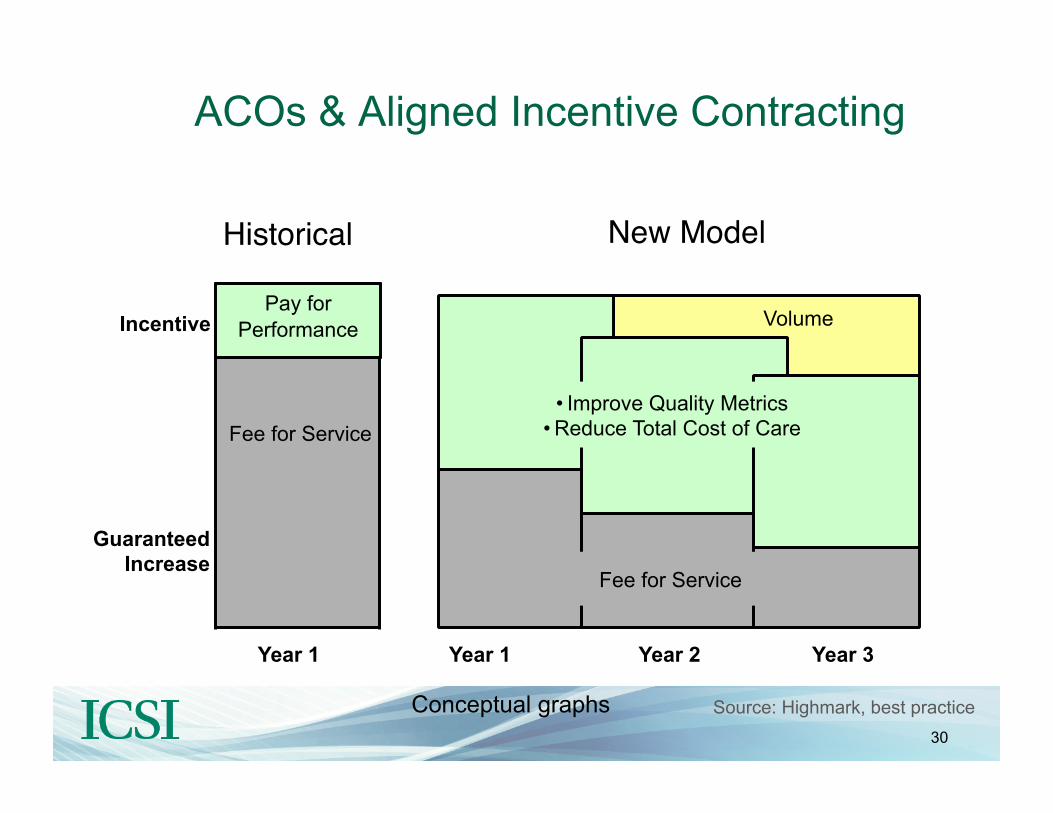
ACOs & Aligned Incentive Contracting
Historical New Model
Year 1
Fee for Service
Year 2 Year 1 Year 3
Pay for Performance
• Improve Quality Metrics • Reduce Total Cost of Care
Fee for Service
Guaranteed Increase
Incentive
Conceptual graphs
Volume
Source: Highmark, best practice 30
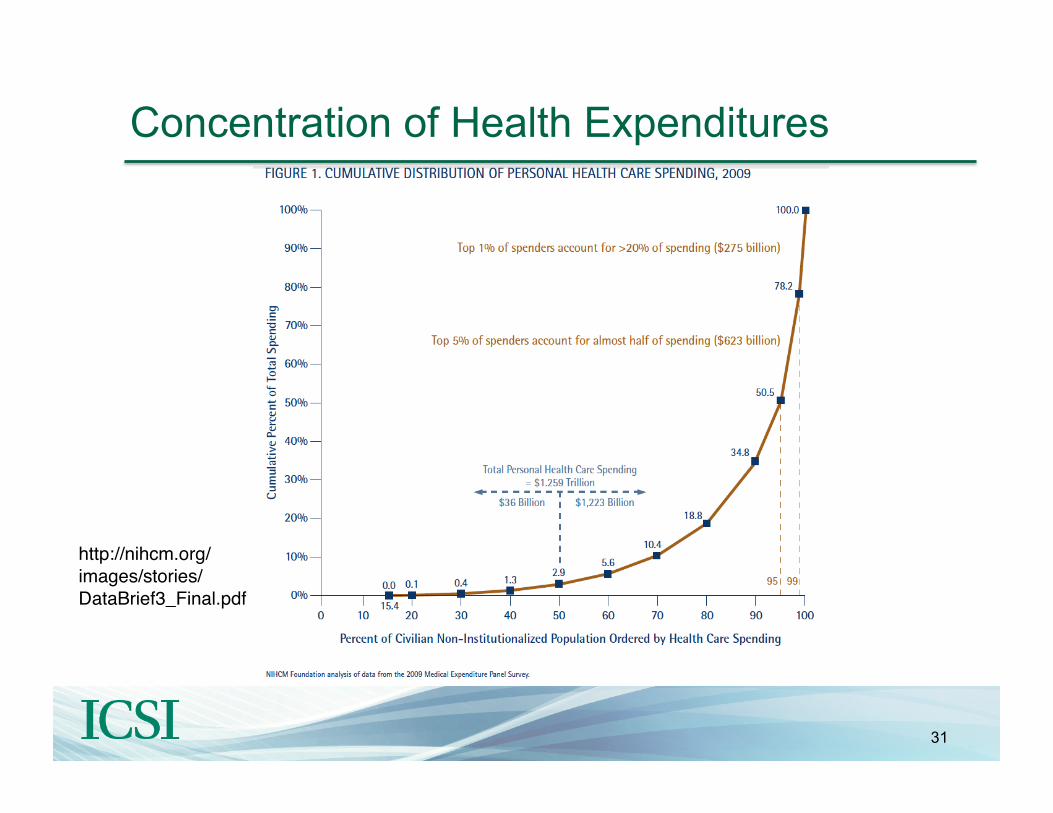
http://nihcm.org/images/stories/DataBrief3_Final.pdf
Concentration of Health Expenditures
31
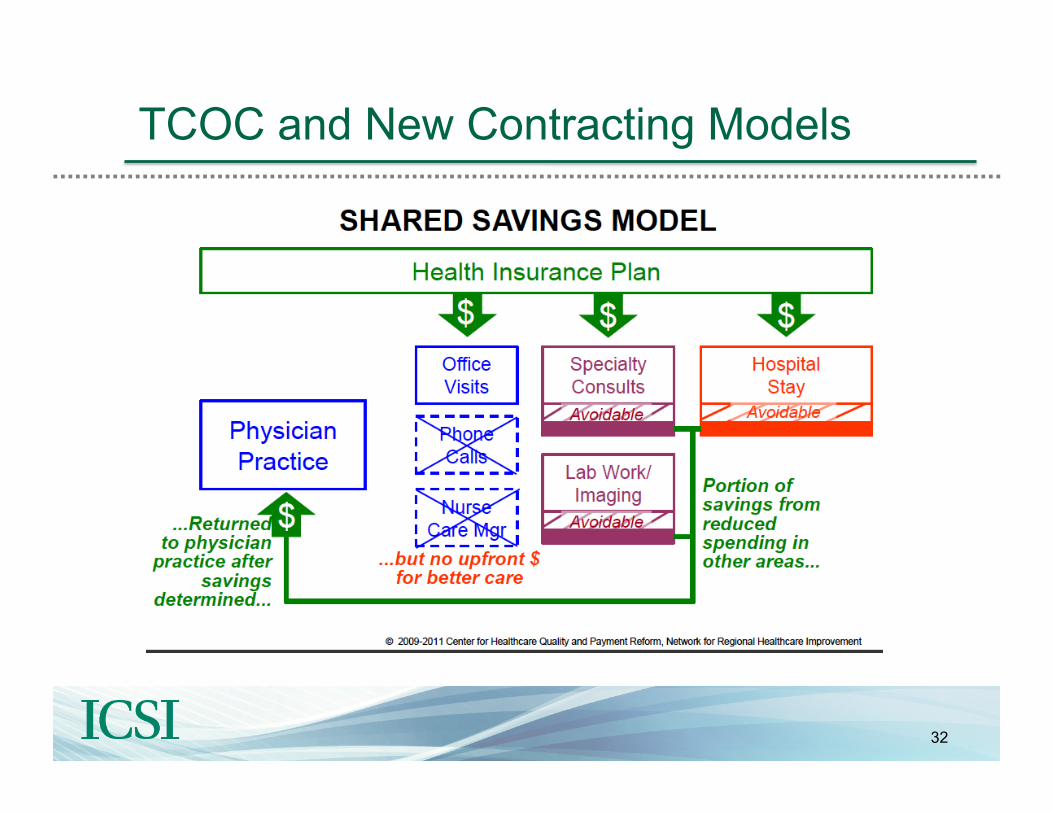
TCOC and New Contracting Models
32

Capitation vs. Accountable Care
Source: A. Robinow, The Potential of Global Payment: Insights from the Field, The Commonwealth Fund, February 2010.
“Under global payment, services that were profit centers instantly become cost centers.”
- Ann Robinow
33
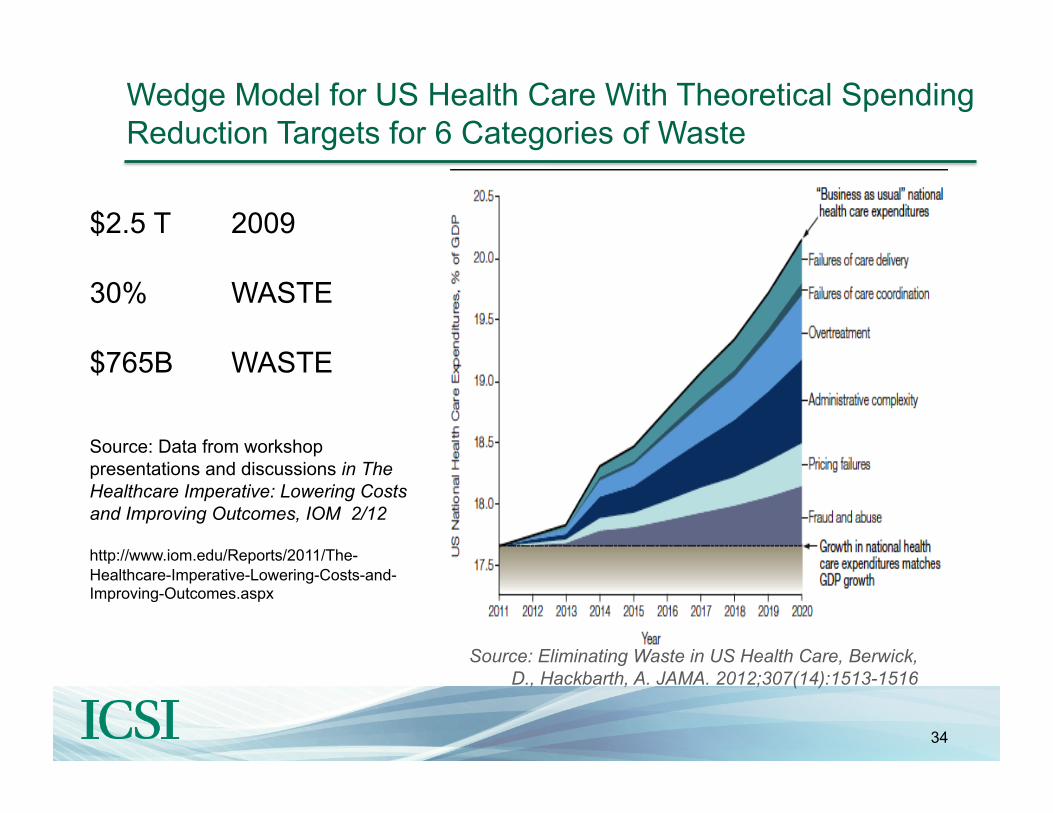
Wedge Model for US Health Care With Theoretical Spending Reduction Targets for 6 Categories of Waste
Source: Eliminating Waste in US Health Care, Berwick, D., Hackbarth, A. JAMA. 2012;307(14):1513-1516
$2.5 T 2009
30% WASTE
$765B WASTE
Source: Data from workshop presentations and discussions in The Healthcare Imperative: Lowering Costs and Improving Outcomes, IOM 2/12 http://www.iom.edu/Reports/2011/The-Healthcare-Imperative-Lowering-Costs-and-Improving-Outcomes.aspx
34

Opportunities for Waste Reduction Efforts
35

Opportunities Abound: Focus on Waste
PRESENT STATE
Errors
Potentially Preventable Events
Unnecessary Treatments
Inefficiencies
Services That Add Value
FUTURE STATE
Services That Add Value
WASTE
VALUE ADDED
TOTAL VALUE
36

National organizations representing medical specialists, as well as Consumer Reports, are working with the ABIM Foundation to help physicians, patients and other health care stakeholders think and talk about overuse of health care resources in the United States.
37

These Choosing Wisely® specialty society partners released their lists February 2013:
38
In Conclusion
• Addressing healthcare affordability and spending is an urgent economic and moral imperative
• Healthcare delivery and payment systems are evolving rapidly • Useful Quality and TCOC data is essential for provider success
under care and payment reform • Transparent reporting of quality and cost info can help to
optimize the value of healthcare
• There is much we can do to improve health and lower costs by reducing “waste” in the delivery system
39

Finally…
Additional resources from ICSI: https://www.icsi.org/health_initiatives/health_care_affordability/
Minnesota Community Measurement www.mncm.org
40