tornado and wind damage assessment guide · tornado and wind damage assessment guide. 2 draft...
TRANSCRIPT
1
The International Fujita (IF) Scale Tornado and Wind Damage Assessment Guide

2
Draft version 0.1 of 15 October 2018
Authored by the IF Scale Steering Group
The IF-Scale Steering group members are:
• Pieter Groenemeijer (ESSL), chair, editor
• Alois M. Holzer (ESSL)
• Martin Hubrig (independent forestry consultant)
• Thilo Kühne (ESSL)
• Lothar Bock (DWD, Germany)
• Juan de Dios Soriano (AEMET , Spain)
• Delia Gutiérrez-Rubio (AEMET, Spain)
• Rainer Kaltenberger (ZAMG, Austria)
• Bas van der Ploeg (Netherlands)
• Gabriel Strommer (ESSL)

3
Contents
Preface ............................................................................................................................................ 4
1 Introduction ............................................................................................................................. 5
1.1 History of wind speed scales for tornadoes ..................................................................... 5
1.2 Refinements and revisions ............................................................................................... 5
1.3 Principles of the IF-scale ................................................................................................... 7
2 The International Fujita Scale ................................................................................................ 10
2.1 The wind speeds of the IF-scale ..................................................................................... 10
2.2 Future adjustments in the light of new findings ............................................................ 11
2.3 Conducting a damage survey ......................................................................................... 11
3 Damage Indicator Inventory .................................................................................................. 13
3.1 Damage Indicator: Buildings - B ..................................................................................... 14
3.2 Road Vehicles – DI: V ...................................................................................................... 20
3.3 Trees - DI: T, TR............................................................................................................... 21
3.4 Train cars – DI: R ............................................................................................................. 25
3.5 Mobile Homes / Static Caravans – M* ........................................................................... 26
3.6 Poles and Towers – P...................................................................................................... 27
3.7 Fences - F ....................................................................................................................... 28
3.8 Signs and billboards – S .................................................................................................. 28
3.9 Scaffolding connected to walls – D ................................................................................ 29
3.10 Carports / Garages – G ................................................................................................... 30
3.11 Service station canopies – SS ......................................................................................... 30
3.12 Shipping containers – SC ................................................................................................ 31
3.13 Cranes – C ....................................................................................................................... 31
3.14 Outdoor furniture – O* .................................................................................................. 32
4 References ............................................................................................................................. 33
Appendix I: Photos and descriptions of undamaged structures of various sturdiness classes ... 35
Appendix II: Examples of damaged buildings .............................................................................. 41
Appendix III: Examples of tree damage ....................................................................................... 43
4
Preface
Draft Version 0.1:
This document is a description of the IF-scale, which was first presented at the ESSL workshop on
tornado and wind damage 4—7 September 2018 in Wiener Neustadt. It includes a number of
additions and revisions based on input from the Steering Group members in the weeks after that
workshop.
In its current form, it is a draft document that ESSL will seek to turn into a first mature version
1.0 in 2019 or 2020. In order to arrive at this first complete version of the document, additional
experts will be invited to join the steering group. Contributions from engineers are most urgently
needed in order to provide a stronger basis for comparing the sturdiness of structures out of
various building materials. With that knowledge, the building DI can be improved and a DI for
free-standing walls can be added.
Altogether, the DI’s for which not sufficient information was yet available to include them, and
that are planned to be included in the next version are: crop fields, shrubs and bushes, noise
barrier walls, jersey barriers, wind turbines, free standing masonry walls. Other DI’s may be
included as well.
Besides adding DI’s, the present DI’s need to be better illustrated by providing more examples of
damage.
Pieter Groenemeijer, Wessling, 15 October 2018

5
1 Introduction
1.1 History of wind speed scales for tornadoes
Those who study severe local wind phenomena such as tornadoes and microbursts have an
interest in comparing the intensity of such events. The biggest difficulty in estimating an event’s
intensity is that direct measurements of the wind speed are typically absent. Instead, the only
information available is the resulting damage.
Figure 1. Various wind speed scales used for tornado damage assessment.
To be able to compare events by means of the inflicted damage, several methods and scales have
been developed (Figure 1). Most prominently, Dr. Ted Fujita developed what has become known
as the Fujita scale (Fujita, 1981). Other wind speed scales include the TORRO- or T-scale (Meaden,
1976) and the newer Enhanced Fujita or EF-scale (McDonald and Mehta, 2006), discussed below.
The Fujita and T-scales are numbered series of descriptions of increasingly serious wind effects
on various objects, along with ranges of wind speeds thought to be responsible for causing the
respective damage. No justification for the wind speed estimates of these scales are provided.
The Fujita and T-scales have been used in the United States until 2007, and are still used in Europe
and other regions.
1.2 Refinements and revisions
Fujita’s revisions
In the 1990’s and 2000’s doubts arose in the USA about the accuracy of the wind speed estimates
of the Fujita-scale and the scale was revised and its description refined. In his 1992 memoirs
(Fujita, 1992), Fujita suggested that his scale be refined by taking the sturdiness of buildings into
account when assessing damages (Fig. 2).

6
Figure 2. The Fujita (F-) scale allowing for various building types with varying sturdiness. The extent of damages expressed various with both windspeed and sturdiness of structures. From: Fujita (1992).
In Europe, the European Severe Storms Laboratory has used an adapted version of the Fujita
(1992) approach, which was documented by Feuerstein et al (2012; see Figure 3). This
implementation includes an analogous approach to assess vegetation damage (not shown) and
allows for a distinction between the upper- and lower- ends of each intensity step.
Figure 3. F-scale ratings as a function of building sturdiness (A-F), and of loss ratio and Fujita damage class (f0-f5), as used by ESSL. Adapted from: Feuerstein et al (2012).
7
The Enhanced Fujita (EF-) scale
In 2007, an effort by Texas Tech University lead to refinements and revisions of the wind speed
estimates for particular damages leading to the Enhanced Fujita scale (McDonald and Mehta,
2006). A framework for the assessment of tornado damage was introduced by systematically
categorizing the effects of severe winds using the concepts of Degrees of Damage, and Damage
Indicators. A Damage Indicator (DI) is any specified object that may be affected by the wind and
a Degree of Damage (DoD) is the extent to which this object was damaged. The new wind speed
estimates of particular DoD of a particular DI were obtained by the method of expert elicitation.
A small number of persons, experts in engineering and meteorology, were asked to provide
estimates for each DoD/DI combination, the results of which were all taken into account and
used to provide a range of wind speeds likely responsible for having a particular damage effect.
Advantages of the EF-scale approach are (i) that the concepts of Damage Indicators and Degrees
of Damage were explicitly introduced, and (ii) that a high number of Damage Indicators were
defined. Drawbacks of the Enhanced Fujita are that the scale cannot be applied globally since the
range of Damage Indicators is clearly incomplete or even inapplicable in other countries. For
instance, the sturdiness of the Damage Indicator “Elementary School” in the USA may differ
greatly from that in another country. Furthermore, some obvious DI’s are missing, including many
that are not buildings, such as vehicles and vegetation. Another drawback is that the wind speeds
in the EF-scale have little scientific support in that they are typically not backed-up by
experiments or calculations.
International additions to the Enhanced Fujita (EF-) scale
In response to these limitations, adaptations and additions have been made in several areas
around the world, since the adoption of the Enhanced Fujita scale in 2007 by the U.S. National
Weather Service. Most prominently by scholars in Canada (Environment Canada, 2015; Sills et al,
2014), and Japan (JMA, 2015), who have officially adopted an adapted version of the EF-scale.
Several additional proposals have been made to include multiple new Damage Indicators such as
by Mahieu and Wesolek (2016), and by Hubrig (2015) who proposed extensions reflecting
damage to wooden trees. These additions were primarily motivated by the need for additional
Damage Indicators, beyond or replacing those used in the United States. In 2015, an international
workgroup convened to inventarize the various approaches used in practice in various regions of
the world to categorize tornado damage, which resulted in a report entitled “International
Approaches to Tornado Damage and Intensity Classification” (IAWE, 2017).
1.3 Principles of the IF-scale
The IF-scale has been developed based on the following three requirements stated by Doswell et
al (2009). First, it should be broadly applicable, covering a wide range of observed wind effects
and all possible wind speeds. Second, it should be accurate, or as accurate as possible given the

8
available data. Last, it should be consistent in the sense that it can be applied consistently over
time and across many regions, preferably globally.
Broad applicability
In order to guarantee broad applicability, the IF-scale foresees in dealing with wind effects to a
wide range of objects and structures, many more than have been covered in the EF-scale,
including trees. The concepts of DoD’s and DI’s are kept.
An important difference with the EF-scale is that built-up structures are not categorized based
on their function (cf. EF-scale: small retail building, one-family residence, ground school, etc.),
but on their sturdiness. On a national level, building codes for a buildings having a particular
function may exist, but this approach will not work internationally as these codes will differ from
one country to another.
Broad applicability also means also necessary that the scale can be applied to the entire range of
observed wind speeds. Since accurate Doppler radar measurements of wind speeds up 135 m/s
(Wurman et al, 2007), the scale should, although this is a challenging task, be able to address the
potential effects of such wind speeds on objects.
Finally, in this document broad applicability is taken to mean that the scale should be applicable
to many kinds of wind events, rather than exclusively to tornadoes. Although the type damage
caused by tornadoes may differ from that of downbursts, for instance by greater pressure
differences or more sudden changes in wind speed and direction, no scientific description of how
the type and intensity of damage typically differs is presently available. Therefore the working
hypothesis of the approach presented here is that those effects do not dominate the damage
intensity.
Accuracy
In order to ensure high accuracy, wind speed estimates should preferentially be based on
scientific research, e.g. engineering calculations andwind tunnel experiments, rather than
subjective assessments, wherever this is possible. Where this is not possible, subjective estimates
can be used. This approach has been taken with the EF-scale (McDonald and Mehta, 2006), the
Japanese EF-scale (JMA, 2015), the Canadian EF-scale (Environment Canada, 2015; Sills et al,
2014), etc. Especially in the case of estimated speeds, is thinkable that particular wind speed
estimates will require revision in the future as research evidence for better wind speed estimates
become available.
In contrast to other scales, the IF-scale does not use specified ranges of wind speed values for
each step of the scale, which might imply a higher accuracy than the scale can deliver, but instead
provides a central value and an associated error. In order to express lower wind speeds with a
higher precision, the IF-scale splits the lower steps of the scale into multiple steps using the
suffixes + or -, following Feuerstein et al. (2012), e.g. IF2+.
9
Consistency
In order to ensure that the scale can be applied consistently in areas where the Fujita- or T-scale
have been used in the past, the IF-scale has wind speeds that are compatible with those scales.
In other words, the IF3 wind speed value corresponds to the centre of the F3 wind speed range.
The aim of IF-scale is to present an approach that is fundamentally applicable around the globe.
It specifies the common denominator, to which further regional refinements can be made for
specific regions.
10
2 The International Fujita Scale
2.1 The wind speeds of the IF-scale
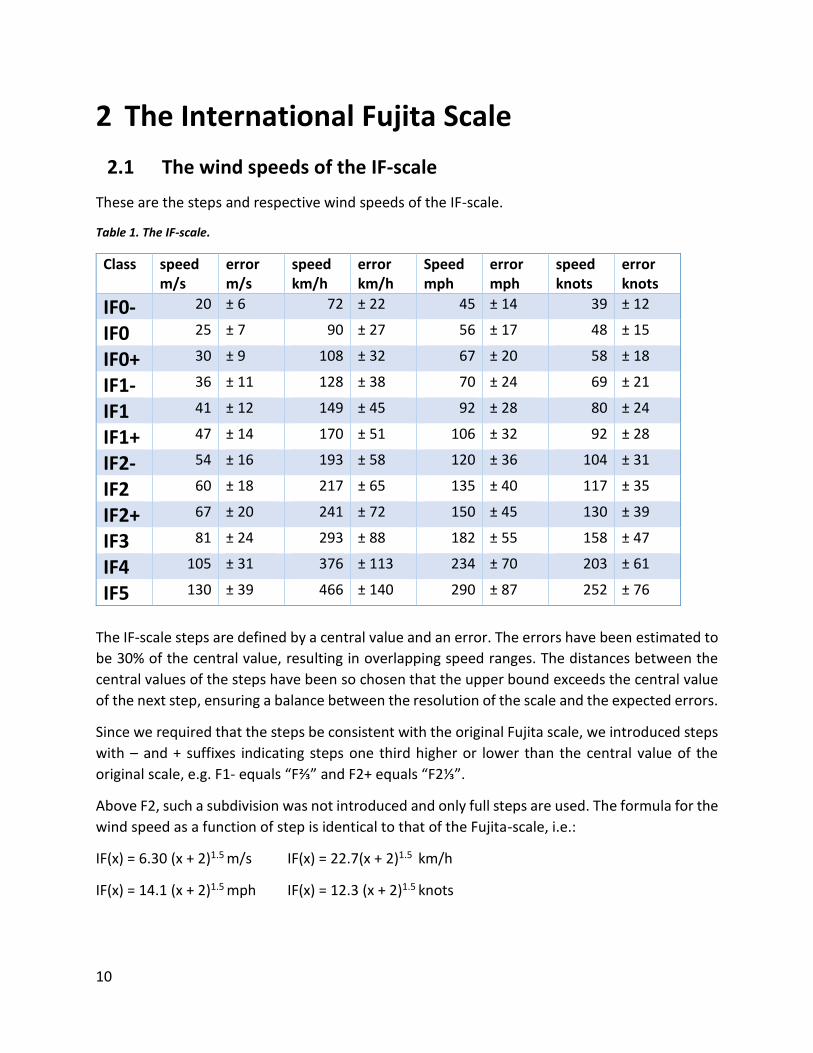
These are the steps and respective wind speeds of the IF-scale.
Table 1. The IF-scale.
Class speed m/s
error m/s
speed km/h
error km/h
Speed mph
error mph
speed knots
error knots
IF0- 20 ± 6 72 ± 22 45 ± 14 39 ± 12
IF0 25 ± 7 90 ± 27 56 ± 17 48 ± 15
IF0+ 30 ± 9 108 ± 32 67 ± 20 58 ± 18
IF1- 36 ± 11 128 ± 38 70 ± 24 69 ± 21
IF1 41 ± 12 149 ± 45 92 ± 28 80 ± 24
IF1+ 47 ± 14 170 ± 51 106 ± 32 92 ± 28
IF2- 54 ± 16 193 ± 58 120 ± 36 104 ± 31
IF2 60 ± 18 217 ± 65 135 ± 40 117 ± 35
IF2+ 67 ± 20 241 ± 72 150 ± 45 130 ± 39
IF3 81 ± 24 293 ± 88 182 ± 55 158 ± 47
IF4 105 ± 31 376 ± 113 234 ± 70 203 ± 61
IF5 130 ± 39 466 ± 140 290 ± 87 252 ± 76
The IF-scale steps are defined by a central value and an error. The errors have been estimated to
be 30% of the central value, resulting in overlapping speed ranges. The distances between the
central values of the steps have been so chosen that the upper bound exceeds the central value
of the next step, ensuring a balance between the resolution of the scale and the expected errors.
Since we required that the steps be consistent with the original Fujita scale, we introduced steps
with – and + suffixes indicating steps one third higher or lower than the central value of the
original scale, e.g. F1- equals “F⅔” and F2+ equals “F2⅓”.
Above F2, such a subdivision was not introduced and only full steps are used. The formula for the
wind speed as a function of step is identical to that of the Fujita-scale, i.e.:
IF(x) = 6.30 (x + 2)1.5 m/s IF(x) = 22.7(x + 2)1.5 km/h
IF(x) = 14.1 (x + 2)1.5 mph IF(x) = 12.3 (x + 2)1.5 knots

11
2.2 Future adjustments in the light of new findings
The Fujita scale has been adjusted to the Enhanced Fuita scale because of the feeling that the
wind speeds associated with a particular step on the scale was not current. This may, of course,
happen with the IF-scale too when new findings become available. For instance, it may become
known that the winds speeds of the higher steps – speeds of which very few accurate
measurements are available – need adjusting. This will require a revision of the original wind
speed function posed by Fujita. This ought to be done only in light of a solid body of support
resulting from scientific research. It may also be that it is found that a particular DI/DoD
combination is associated with another step on the IF-scale than described in the original manual.
This should be a smaller change. All changes should be communicated to the owner of the scale,
which is presently the IF-scale Steering Group.
2.3 Conducting a damage survey
In order to conduct a damage survey, we have formulated the following reocmmendations. First,
a survey is done as early as possible, but obviously after any emergency services have left the
site. Second, all individual Damage Indicators and Degrees of Damage should be recorded and
geo-referenced, as well as the resulting IF-rating. Optimally, references to photos of the damage
are stored as well, and optionally a description. Since, it is of interest to identify a damaging wind
event as a tornado or a straight-line wind event, the direction of falling of trees, or transportation
of debris is to be recorded as well. The convention is to indicate the origination direction of the
object, i.e. 180° is correct for a tree fallen towards the north, or an object displace from the south
to the north.
The process of recording this data can be streamlined using an application (app) on a mobile
device. Such software should result in a csv formatted table, as in Table 1. If an app cannot be
used, the table can also be filled manually. In order to allow a concise description of any type of
damage, all Damage Indicators have a short acronym.
Table 1. Example of a table with damage survey data.
# Lat. Lon. DI DoD IF Direction
of falling/
transport
Distance Trunk
Thickness
Description Link to
photos
1 45.4461 12.0393 BSB 1 2- Old Shed http://....
2 45.4482 12.0471 BNT- 2 ≥1 160° 10 m Tiles of shed http://....
3 45.4478 12.0476 TR2 1 1 180° 30 cm Uprooted
olive tree,
rotten 1/3
http://....
4 45.4484 12.0482 PL 2 2- 40° Light pole http://....

12
Acronyms
A particular type of damage is unambiguously defined by writing down the Damage Indicator and
the Degree of Damage. The Degree of Damage is a number, while the Damage Indicator is a
combination of characters indicating the DI type, and the subclass or vulnerability where
applicable.
The generic format is:
[DI type][DI subclass][DI vulnerability]/[DoD], or
[DI type][DI subclass][DI vulnerability]/[DoD]:[IF-rating]
Examples are:
BC/1:2+
A building [B] with sturdiness [C] has sustained a Degree of Damage 1 ('partially
destroyed'), resulting in a rating of IF2+.
TR3/1:1+
A tree [T] with rooting strength [R] 3 was uprooted [1], resulting in a rating IF1+
BNT+/1:1-
A building [B] having as non structural elements [N] strongly attached roof tiles [T+] lost
a few roof tiles, i.e. DoD1, [1], resulting in IF1-.
13
3 Damage Indicator Inventory
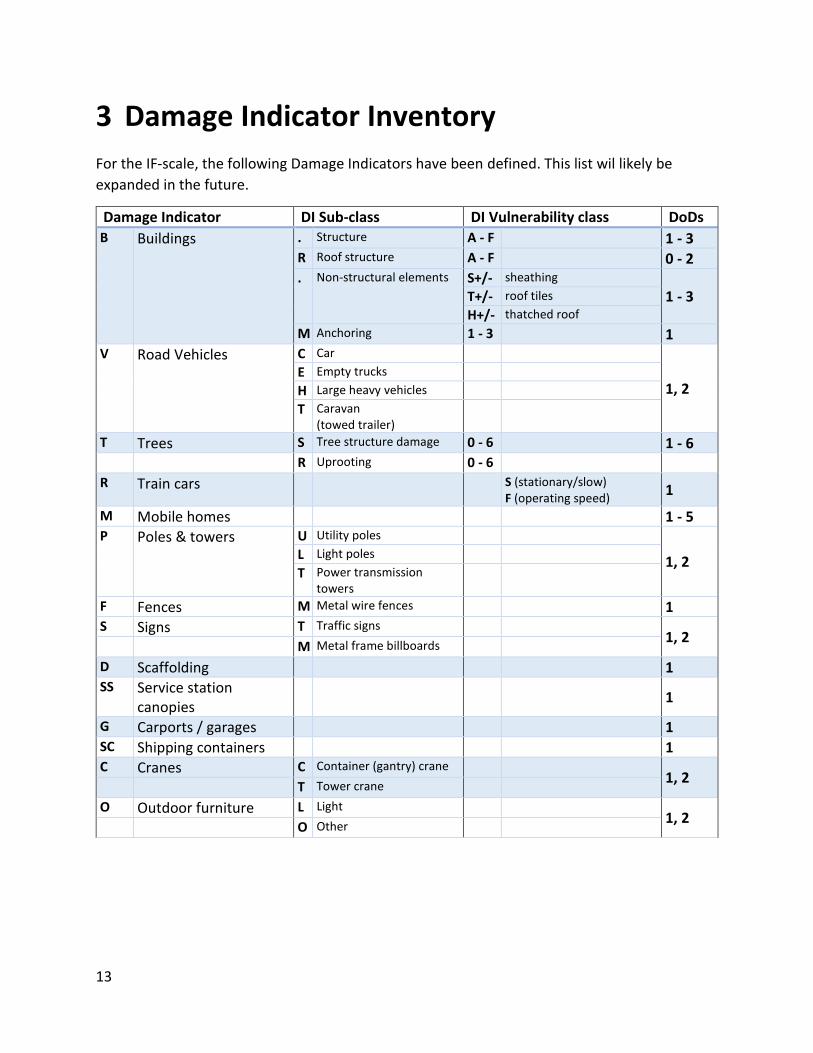
For the IF-scale, the following Damage Indicators have been defined. This list wil likely be
expanded in the future.
Damage Indicator DI Sub-class DI Vulnerability class DoDs
B Buildings . Structure A - F 1 - 3 R Roof structure A - F 0 - 2 . Non-structural elements S+/- sheathing
1 - 3 T+/- roof tiles
H+/- thatched roof
M Anchoring 1 - 3 1 V Road Vehicles C Car
1, 2 E Empty trucks
H Large heavy vehicles
T Caravan (towed trailer)
T Trees S Tree structure damage 0 - 6 1 - 6 R Uprooting 0 - 6 R Train cars S (stationary/slow)
F (operating speed) 1
M Mobile homes 1 - 5 P Poles & towers U Utility poles
1, 2 L Light poles
T Power transmission towers
F Fences M Metal wire fences 1 S Signs T Traffic signs
1, 2 M Metal frame billboards
D Scaffolding 1 SS Service station
canopies
1
G Carports / garages 1 SC Shipping containers 1 C Cranes C Container (gantry) crane
1, 2 T Tower crane
O Outdoor furniture L Light 1, 2
O Other
14
3.1 Damage Indicator: Buildings - B
Definition: Buildings are structures with a roof and walls standing more or less permanently in
one place. They include all forms of residential, commercial and industrial buildings as well as
outbuildings of any kind.
A building consists of a number of components. Each of these components is to be assessed
individually, when possible.
These components are:
1. the building’s structural elements, i.e. its frame or its walls
2. its roof structure
3. non-structural elements of the roof and/or walls
Additionally, a frame building may have been moved off its foundation.
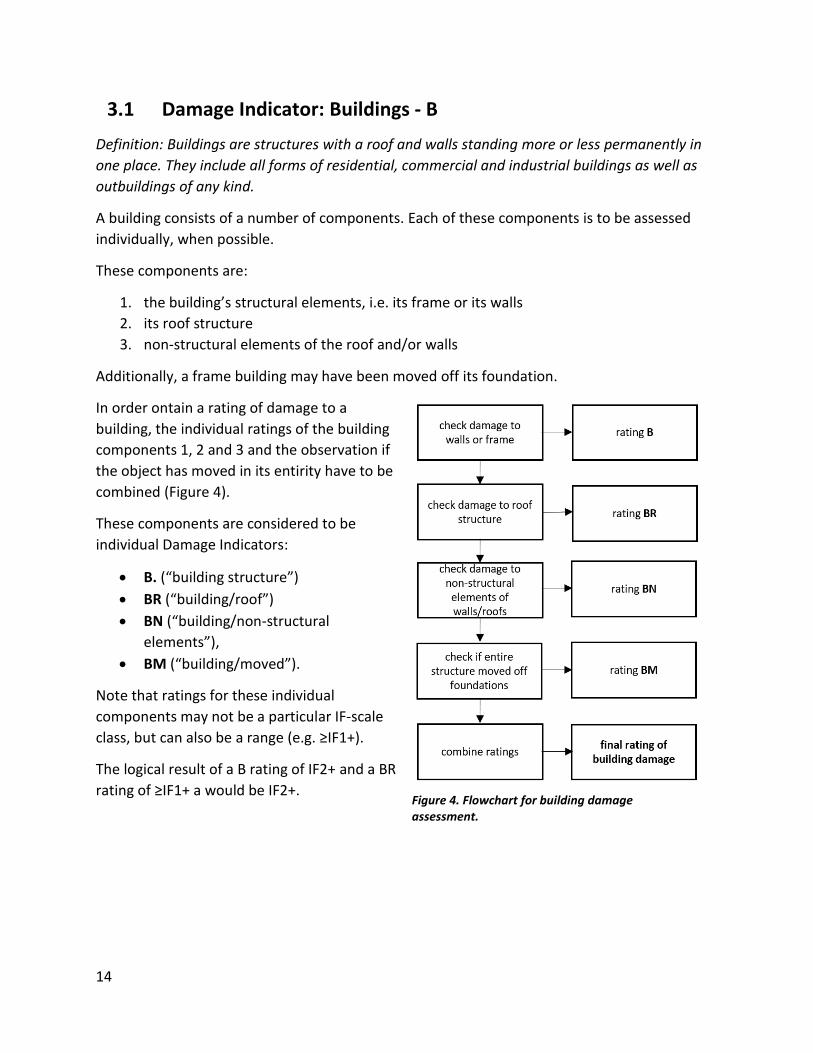
In order ontain a rating of damage to a
building, the individual ratings of the building
components 1, 2 and 3 and the observation if
the object has moved in its entirity have to be
combined (Figure 4).
These components are considered to be
individual Damage Indicators:
• B. (“building structure”)
• BR (“building/roof”)
• BN (“building/non-structural
elements”),
• BM (“building/moved”).
Note that ratings for these individual
components may not be a particular IF-scale
class, but can also be a range (e.g. ≥IF1+).
The logical result of a B rating of IF2+ and a BR
rating of ≥IF1+ a would be IF2+.
Figure 4. Flowchart for building damage assessment.
15
Damage to structural elements (walls or frame) – DI: B
If structural elements of a building fail, the sturdiness of the structure needs to be estimated in
order to know the minimal wind speed responsible for the damage. Buildings are constructed in
two fundamentally different ways: using a frame or using mass walls.
In frame structures, the frame gives the building its structural stability. The walls are made from
panels of wood, metal, glass or other materials that contribute relatively little to the strength of
the building. Frames are typically made of wood or metal.
In the case of mass walls, building material is stacked, and often connected by mortar or a
similar material, to form walls that carry the weight of the structure. Examples of mass wall
construction are brick masonry walls, walls of concrete blocks or wood log building. On average,
mass wall structures are somewhat more wind resistant than frame structures.
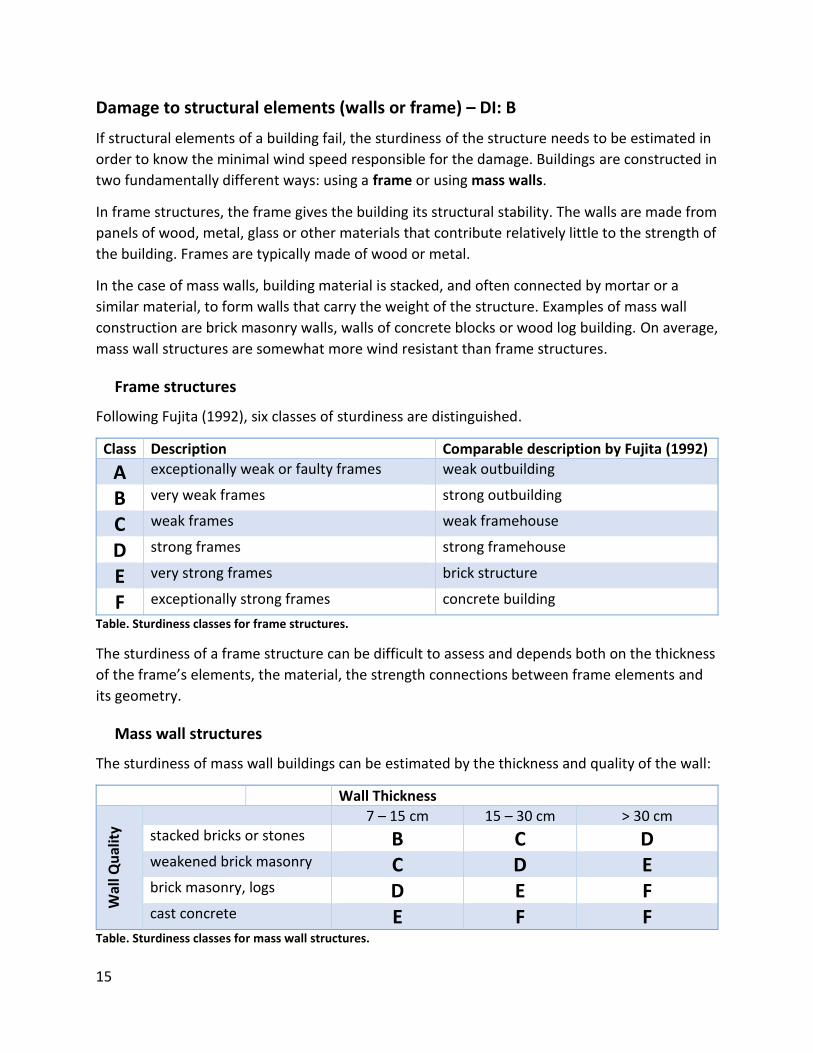
Frame structures
Following Fujita (1992), six classes of sturdiness are distinguished.
Class Description Comparable description by Fujita (1992)
A exceptionally weak or faulty frames weak outbuilding
B very weak frames strong outbuilding
C weak frames weak framehouse
D strong frames strong framehouse
E very strong frames brick structure
F exceptionally strong frames concrete building
Table. Sturdiness classes for frame structures.
The sturdiness of a frame structure can be difficult to assess and depends both on the thickness
of the frame’s elements, the material, the strength connections between frame elements and
its geometry.
Mass wall structures
The sturdiness of mass wall buildings can be estimated by the thickness and quality of the wall:
Wall Thickness
Wal
l Qu
alit
y
7 – 15 cm 15 – 30 cm > 30 cm stacked bricks or stones B C D weakened brick masonry C D E brick masonry, logs D E F cast concrete E F F
Table. Sturdiness classes for mass wall structures.
16
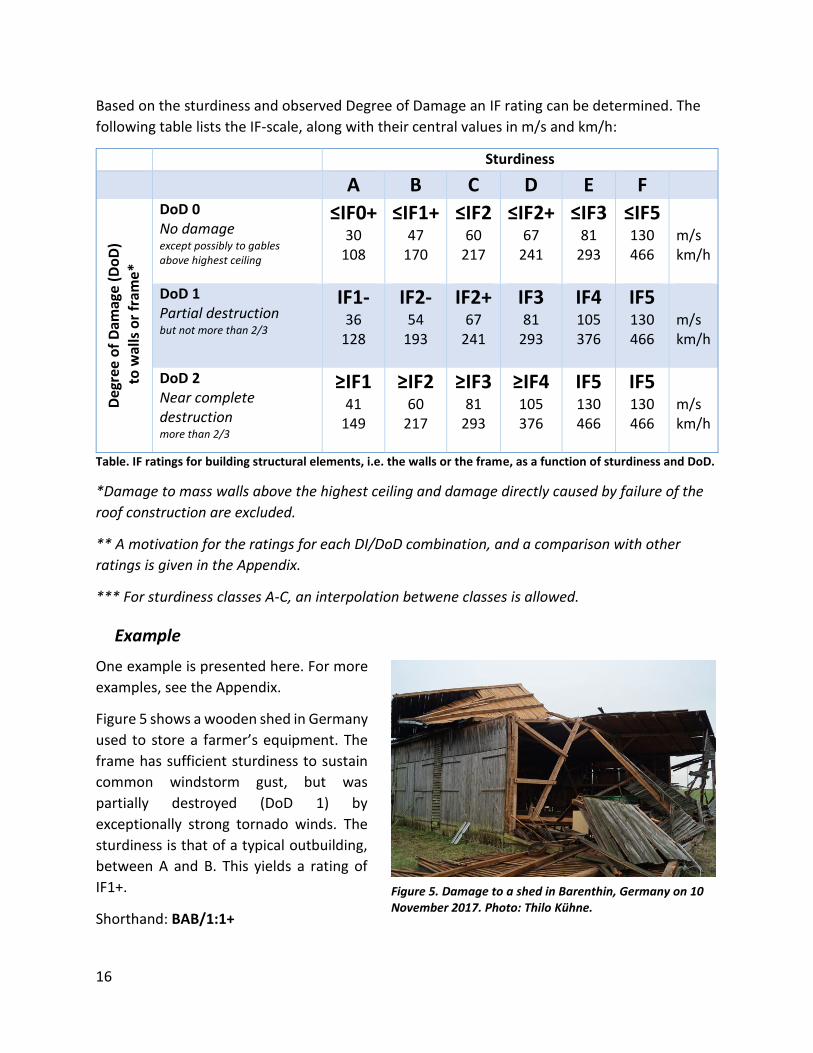
Based on the sturdiness and observed Degree of Damage an IF rating can be determined. The
following table lists the IF-scale, along with their central values in m/s and km/h:
Sturdiness
A B C D E F
Deg
ree
of
Dam
age
(D
oD
) t
o w
alls
or
fram
e*
DoD 0 No damage except possibly to gables above highest ceiling
≤IF0+ 30
108
≤IF1+ 47
170
≤IF2 60
217
≤IF2+ 67
241
≤IF3 81
293
≤IF5 130 466
m/s km/h
DoD 1 Partial destruction but not more than 2/3
IF1- 36
128
IF2- 54
193
IF2+ 67
241
IF3 81
293
IF4 105 376
IF5 130 466
m/s km/h
DoD 2 Near complete destruction more than 2/3
≥IF1 41
149
≥IF2 60
217
≥IF3 81
293
≥IF4 105 376
IF5 130 466
IF5 130 466
m/s km/h
Table. IF ratings for building structural elements, i.e. the walls or the frame, as a function of sturdiness and DoD.
*Damage to mass walls above the highest ceiling and damage directly caused by failure of the
roof construction are excluded.
** A motivation for the ratings for each DI/DoD combination, and a comparison with other
ratings is given in the Appendix.
*** For sturdiness classes A-C, an interpolation betwene classes is allowed.
Example
One example is presented here. For more
examples, see the Appendix.
Figure 5 shows a wooden shed in Germany
used to store a farmer’s equipment. The
frame has sufficient sturdiness to sustain
common windstorm gust, but was
partially destroyed (DoD 1) by
exceptionally strong tornado winds. The
sturdiness is that of a typical outbuilding,
between A and B. This yields a rating of
IF1+.
Shorthand: BAB/1:1+
Figure 5. Damage to a shed in Barenthin, Germany on 10 November 2017. Photo: Thilo Kühne.
17
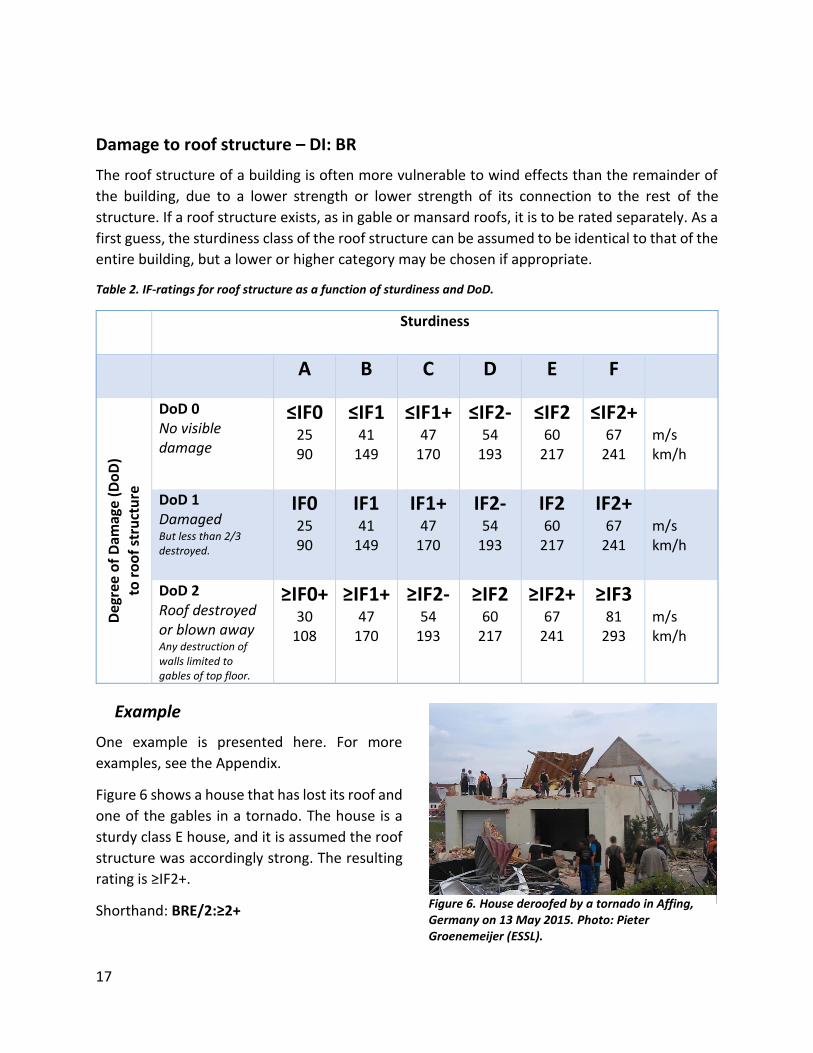
Damage to roof structure – DI: BR
The roof structure of a building is often more vulnerable to wind effects than the remainder of
the building, due to a lower strength or lower strength of its connection to the rest of the
structure. If a roof structure exists, as in gable or mansard roofs, it is to be rated separately. As a
first guess, the sturdiness class of the roof structure can be assumed to be identical to that of the
entire building, but a lower or higher category may be chosen if appropriate.
Table 2. IF-ratings for roof structure as a function of sturdiness and DoD.
Sturdiness
A B C D E F
Deg
ree
of
Dam
age
(Do
D)
to r
oo
f st
ruct
ure
DoD 0 No visible damage
≤IF0 25 90
≤IF1 41
149
≤IF1+ 47
170
≤IF2- 54
193
≤IF2 60
217
≤IF2+ 67
241
m/s km/h
DoD 1 Damaged But less than 2/3 destroyed.
IF0 25 90
IF1 41
149
IF1+ 47
170
IF2- 54
193
IF2 60
217
IF2+ 67
241
m/s km/h
DoD 2 Roof destroyed or blown away Any destruction of walls limited to gables of top floor.
≥IF0+ 30
108
≥IF1+ 47
170
≥IF2- 54
193
≥IF2 60
217
≥IF2+ 67
241
≥IF3 81
293
m/s km/h
Example
One example is presented here. For more
examples, see the Appendix.
Figure 6 shows a house that has lost its roof and
one of the gables in a tornado. The house is a
sturdy class E house, and it is assumed the roof
structure was accordingly strong. The resulting
rating is ≥IF2+.
Shorthand: BRE/2:≥2+
Figure 6. House deroofed by a tornado in Affing, Germany on 13 May 2015. Photo: Pieter Groenemeijer (ESSL).

18
Non-structural elements (tiles, shingles, sheathing, etc.) – DI: BN
Table 3 gives IF-scale ratings for damage to various types of non-structural elements of buildings.
A distinction is made between sheathing, roof tiles and thached roofs, and within these classes
between weak and strong attachment.
The weak category should be chosen where tiles or sheathing are not physically attached but
kept in place by their own weight and are light. When tiles or sheathing are well-attached, or
when roof tiles are exceptionally heavy, the strong category applies. For thatched roofs,
whenever the roof has small eaves and is smooth, the strong caetgory applies; otherwise the
weak category must be used.
Table 3. IF-rating for a number of non-structural elements of a buildng as a function of DoD.
S sheathing
(metal, cement, wood or other)
T tiles
H thatched
(straw, reed, ...)
S- weak
S+ strong
T- weak
T+ strong
H- weak
H+ strong
DoD 1 Some lost elements (< 25%)
≥IF0+ ≥IF1 IF0+ IF1- ≥IF1 ≥IF2-
DoD 2: Many lost elements (25-50%)
≥IF1- ≥IF1+ IF1- IF1 ≥IF1+ ≥IF2
DoD 3: Most elements lost (>50%)
≥IF1- ≥IF1+ ≥IF1 ≥IF1+ ≥IF1+ ≥IF2+
Example
One example is presented here. For more
examples, see the Appendix.
The images shows a house with a clay tile
roof, where heavy tiles are kept in place by
nails and their own weight (T+). Some tiles,
but less than 25% have been blown off
(DoD1), leading to a rating of IF1-.
Shorthand: BNT+/1:1-
Figure 7. A roof with a number of tiles having blown off in Bützow, Germany. Photo: Thilo Kühne (ESSL).

19
Failing anchoring: Structure moved off foundation (DI: BM)
This failure can occur with frame structures, e.g. wooden houses that moved off their
foundation. It can occur only when the anchoring was less wind-resistant than the frame
structure of the building, which typically means the anchoring was weak or faulty.
Category 0
small shed or outbuilding
1 one-storey
building
2 two-storey or
higher building
DoD 1 Building moved off foundations or overturned
≥IF0+ 30
108
≥IF1 41
149
≥IF2- 54
193
*In accordance with EF-scale (DI FR12 / DoD 5) and JEF-scale (DI 4 / DoD 2-3 and DI 10 / DoD
1,2)

20
3.2 Road Vehicles – DI: V
Degrees of Damage Category C
cars, vans E
empty trucks/lorries, similar vehicles with
large surface area
L large heavy vehicles:
buses, loaded trucks/lorries
T towed trailers
DoD 1 Sliding
IF1+ 47
170
IF1 41
149
IF1+ 47
170
IF1- 36
128
DoD 2 Overturning
IF2- 54
193
IF1+ 47
170
≥IF2 60
217
IF1 41
149
DoD 3 Displacement over large distance while overturning and/or being lofted (> 10 m)
≥IF2+ 67
241
≥IF2 60
217
≥IF3 81
293
≥IF2- 54
193
Estimates based on combining JMA(2015), Schmidlin et al. (2002), Haan et al (2017).
21
3.3 Trees - DI: T, TR
Introduction
In case of damage to trees, either (i) structural failure to parts of the tree occurred (branches or
trunk broken), or (ii) the root system was too weak (uprooting). The wind speed needed to
uproot or snap a tree depends strongly on the strength of the root system and soil conditions,
and on the strength of the trunk, respectively.
If the anchoring of the root system in the ground is stronger than the strength of the trunk, the
trunk breaks before the root system fails. Trunk snapping is comparatively more likely in quickly
varying winds, such as tornadoes, but this a a too complex factor to account for. Compression
failure occurs in trunks with a high flexural strength, but lower pressure resistance, ans is most
likely during the vegetation period.
The ability of trees to withstand wind damage depends on many factors. They include
• the strength of the wood
• the shape and dimension of the trunk and crown, which can be characterized by
o the typical ratio between tree height and trunk diameter, the “h/d ratio”
o adaptation to higher wind speeds in solitary trees and trees at forest edges
• whether the tree is bearing leaves
• the size and geometry of the root system
• soil type and soil condition, in particular its the water content
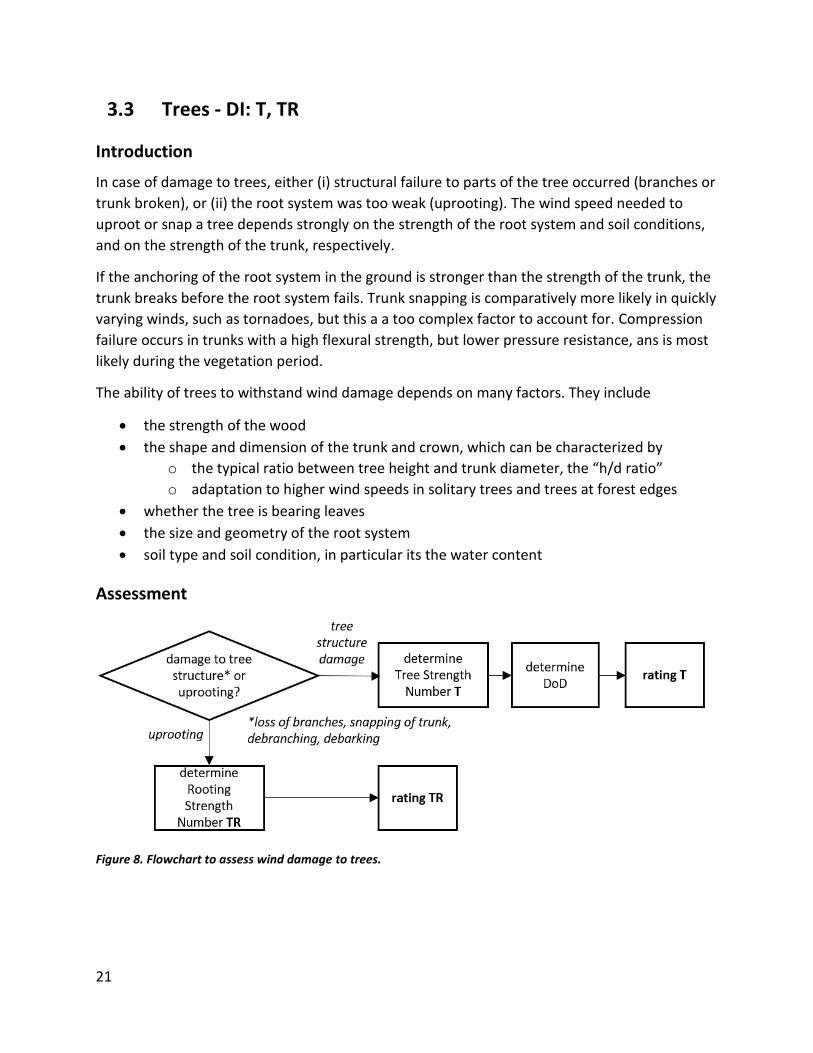
Assessment
Figure 8. Flowchart to assess wind damage to trees.
22
Tree damage assessment begins by first determining if the tree was uprooted, or if the tree’s
structure was damaged (Figure 8). These two cases represent two different damage indicators,
TR for uprooting and T for damage to the tree.
In case of structural damage, the Tree Strength Number is to be determined, in case of
uprooting the Rooting Strength Number. In combination with a Degree of Damage, these
numbers result in a rating. For uprooting, there is only Degree of Damage, i.e. “uprooted”.
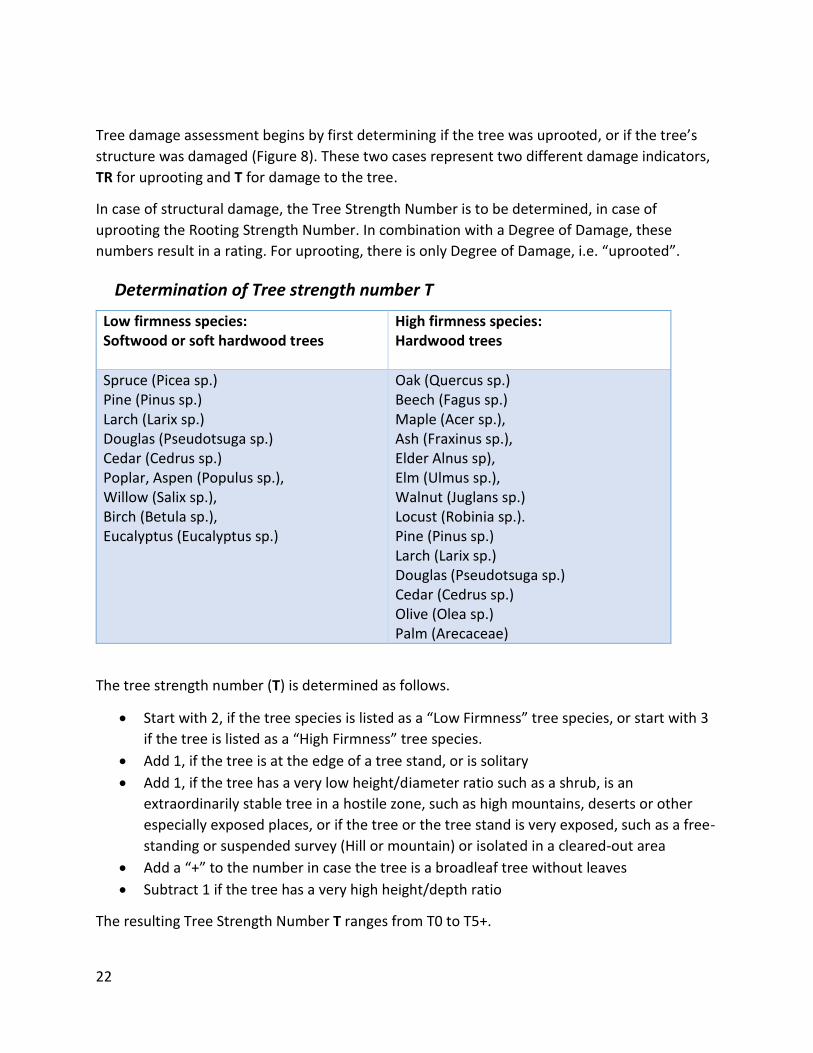
Determination of Tree strength number T
Low firmness species: Softwood or soft hardwood trees
High firmness species: Hardwood trees
Spruce (Picea sp.) Pine (Pinus sp.) Larch (Larix sp.) Douglas (Pseudotsuga sp.) Cedar (Cedrus sp.) Poplar, Aspen (Populus sp.), Willow (Salix sp.), Birch (Betula sp.), Eucalyptus (Eucalyptus sp.)
Oak (Quercus sp.) Beech (Fagus sp.) Maple (Acer sp.), Ash (Fraxinus sp.), Elder Alnus sp), Elm (Ulmus sp.), Walnut (Juglans sp.) Locust (Robinia sp.). Pine (Pinus sp.) Larch (Larix sp.) Douglas (Pseudotsuga sp.) Cedar (Cedrus sp.) Olive (Olea sp.) Palm (Arecaceae)
The tree strength number (T) is determined as follows.
• Start with 2, if the tree species is listed as a “Low Firmness” tree species, or start with 3
if the tree is listed as a “High Firmness” tree species.
• Add 1, if the tree is at the edge of a tree stand, or is solitary
• Add 1, if the tree has a very low height/diameter ratio such as a shrub, is an
extraordinarily stable tree in a hostile zone, such as high mountains, deserts or other
especially exposed places, or if the tree or the tree stand is very exposed, such as a free-
standing or suspended survey (Hill or mountain) or isolated in a cleared-out area
• Add a “+” to the number in case the tree is a broadleaf tree without leaves
• Subtract 1 if the tree has a very high height/depth ratio
The resulting Tree Strength Number T ranges from T0 to T5+.

23
Damage to the tree structure – DI: T
Note: To get the correct DoD in forest stands, choose the most prevalent DoD.
Tree strength number: T1 T1+ T2 T2+ T3 T3+ T4 T4+ T5 T5+ DoD 1 Twigs, dead branches and some small green branches broken off
IF0- IF0- IF0 IF0 IF0+
DoD 2 Some large green branches or part of crown broken off
IF0 IF0+ IF1- IF1 IF1+
DoD 3 Compression failure
IF1- IF1 IF1+ IF2- IF2 IF2+ IF3
DoD 4 Trunk snapped
IF1 IF1+ IF2- IF2 IF2+ IF 3
DoD 5 Strong debranching (> 60% of estimated crown volume ripped off)
IF2- IF2 IF2+ IF3
DoD 6* Isolated debarking of remaining tree parts due to impacts of small-sized debris
≥IF3
DoD 7* Extensive debarking (>60%) of remaining tree parts due to impacts of small-sized debris
≥IF4
*Debarking: Depending on the amount of debris and the thickness of the bark, debarking may
only begin at higher windspeeds, therefore, only lower bounds are specified in DoDs 6 and 7.
24
Uprooting – DI: TR*
To obtain the Rooting Strength number (TR), take the Tree firmness number (T)and make these
corrections:
• If the Tree firmness number has a “+”, remove the “+” and add 1
• If the stand is unstable, subtract 1.
• If the tree is rooted in fragile, wet ground, subtract 1.
• If the trunk is rotten until 1/3 of the trunk cross-section, subtract 1.
• If the trunk is rotten until 2/3 of the trunk cross-section*, subtract 2.
• If the tree is rooted in firm, rocky ground, add 1.
• If TR negative, set TR to 0
* Note: If the tree rot is worse or there are any other significant defects, no TR number can be
determined, and the damage is unratable.
Rooting strength number TR
TR0 TR1 TR2 TR3 TR4 TR5 ≥TR6
DoD 1 Uprooting
IF0+ IF1- IF 1 IF 1+ IF 2- IF2 IF2+
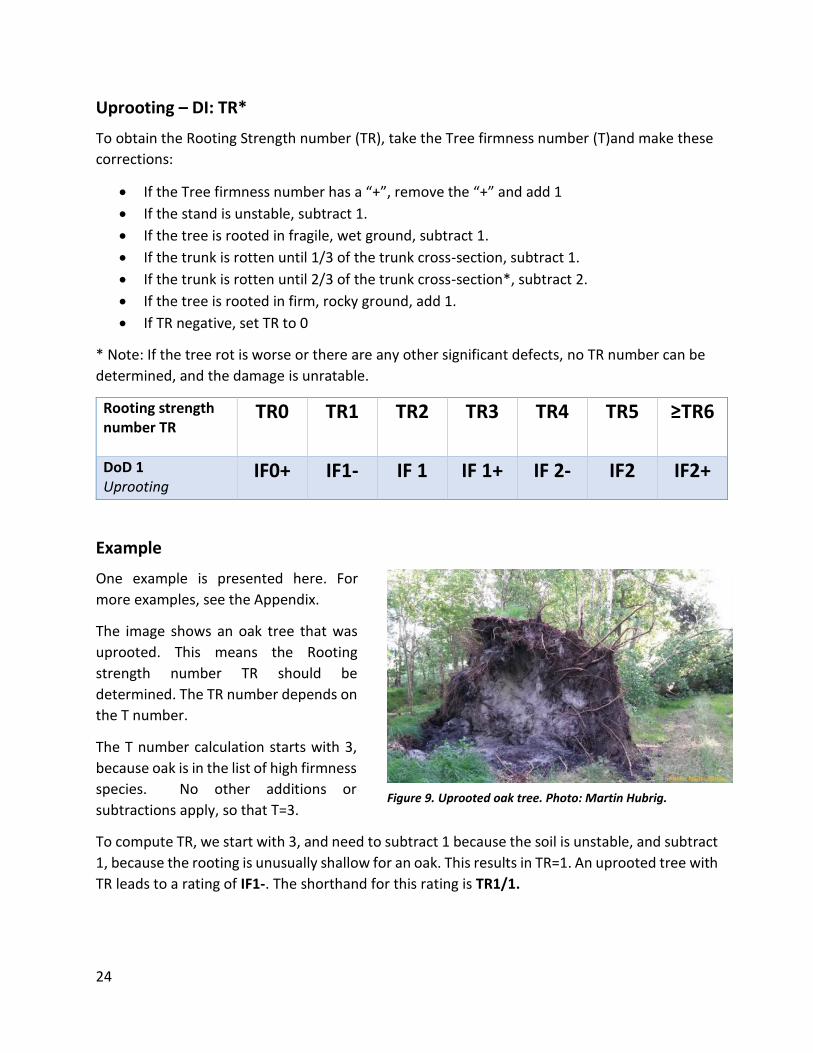
Example
One example is presented here. For
more examples, see the Appendix.
The image shows an oak tree that was
uprooted. This means the Rooting
strength number TR should be
determined. The TR number depends on
the T number.
The T number calculation starts with 3,
because oak is in the list of high firmness
species. No other additions or
subtractions apply, so that T=3.
To compute TR, we start with 3, and need to subtract 1 because the soil is unstable, and subtract
1, because the rooting is unusually shallow for an oak. This results in TR=1. An uprooted tree with
TR leads to a rating of IF1-. The shorthand for this rating is TR1/1.
Figure 9. Uprooted oak tree. Photo: Martin Hubrig.

25
3.4 Train cars – DI: R
S Stationary or operating at
< 25 m/s
F Operating at normal speed
DoD 1 Flipping or derailment
IF2- 54
193
IF1+ 47
170
m/s
km/h
* Estimates based on JMA(2015), rounded upward.
By Phil Richards from London, UK - 21.04.10 Sofia 31005, CC BY-SA 2.0, https://commons.wikimedia.org/w/index.php?curid=26695298
By Phil Richards from London, UK - 26.03.95 La Pobla de Segur, https://commons.wikimedia.org/w/index.php?curid=23047753
By Doug Sim - Own work, CC BY-SA 3.0, https://commons.wikimedia.org/w/index.php?curid=30305173
26
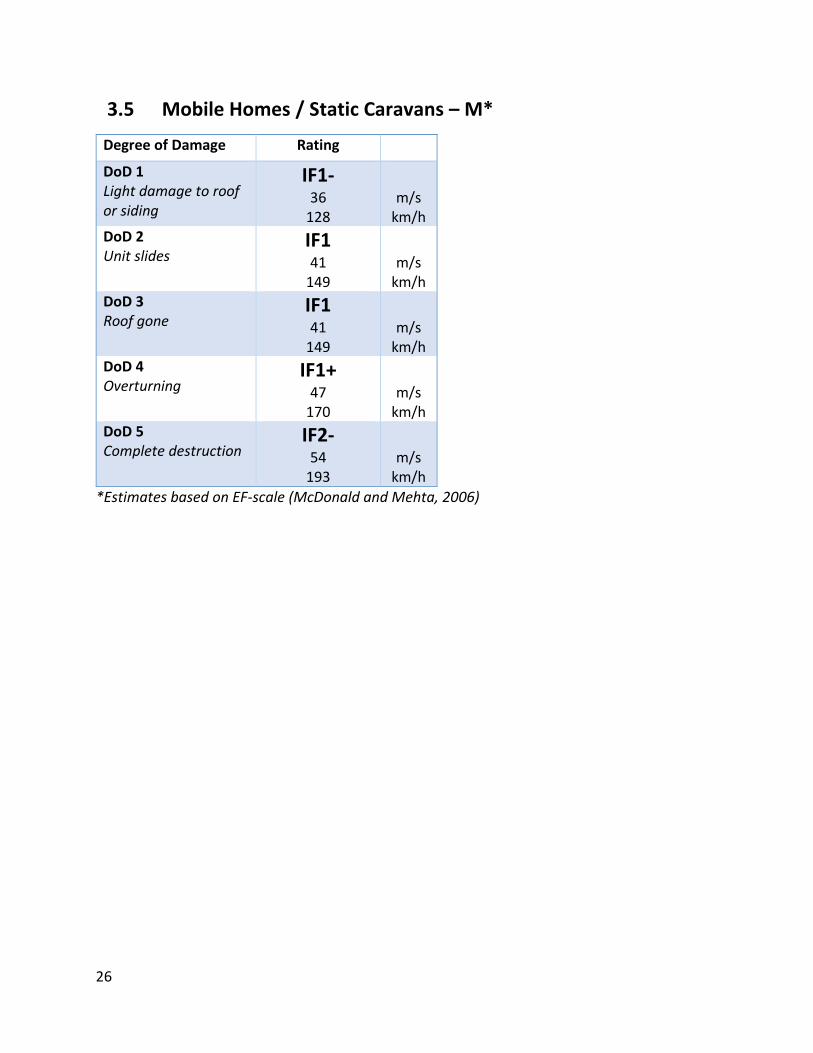
3.5 Mobile Homes / Static Caravans – M*
Degree of Damage Rating DoD 1 Light damage to roof or siding
IF1- 36
128
m/s
km/h DoD 2 Unit slides
IF1 41
149
m/s
km/h DoD 3 Roof gone
IF1 41
149
m/s
km/h DoD 4 Overturning
IF1+ 47
170
m/s
km/h DoD 5 Complete destruction
IF2- 54
193
m/s
km/h *Estimates based on EF-scale (McDonald and Mehta, 2006)

27
3.6 Poles and Towers – P
Degree of Damage U utility pole*
L light pole**
T power
transmission tower*
DoD 1 Deformed, bent or leaning
IF1- 36
128
IF1- 36
128
IF2 60
217
m/s
km/h DoD 2 Collapsed
IF1 41
149
IF1 41
149
IF2 60
217
m/s
km/h
* Estimate based on Canadian EF-scale (Sills et al., 2014)
** Estimate based on EF-scale (McDonald and Mehta, 2006)
28
3.7 Fences - F
Degree of Damage M metal wire
fences*
DoD 1 Partial or complete collapse
IF1- 36
128
m/s
km/h
* Estimate based on JMA (2015).
3.8 Signs and billboards – S
Degree of Damage T traffic signs*
M metal frame billboards*
DoD 1 Inclination or buckling of pillar(s)
IF1+ 47
170
IF1+ 47
170
m/s
km/h DoD 1 Collapse of pillar(s)
IF2- 54
193
IF2- 54
193
m/s
km/h
*Estimates based on JMA(2015).
** Estimates based on JMA(2015). Billboards with a wooden frame have greatly varying degrees
of sturdiness, because of their design or inadequate maintenance. This makes them poor
damage indicators.
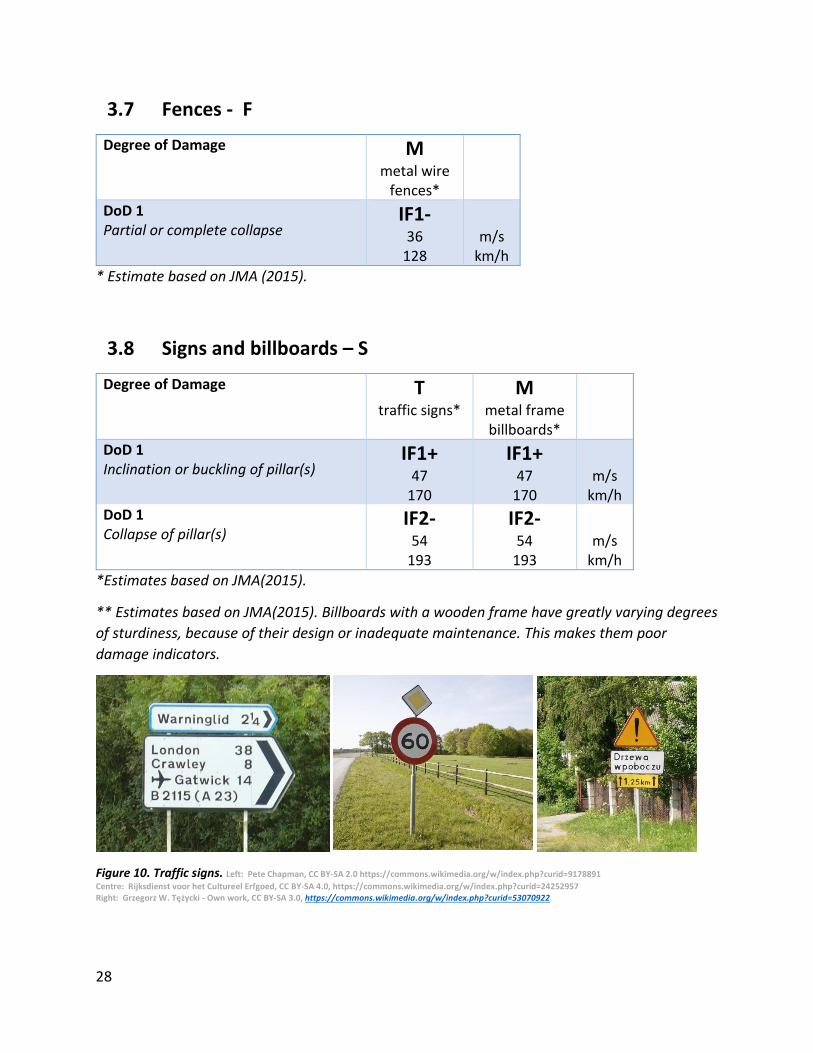
Figure 10. Traffic signs. Left: Pete Chapman, CC BY-SA 2.0 https://commons.wikimedia.org/w/index.php?curid=9178891
Centre: Rijksdienst voor het Cultureel Erfgoed, CC BY-SA 4.0, https://commons.wikimedia.org/w/index.php?curid=24252957 Right: Grzegorz W. Tężycki - Own work, CC BY-SA 3.0, https://commons.wikimedia.org/w/index.php?curid=53070922

29
Figure 11. Metal frame billboards. By Kolforn (Kolforn) https://commons.wikimedia.org/w/index.php?curid=43306855
By Jean Housen - Own work, CC BY-SA 3.0, https://commons.wikimedia.org/w/index.php?curid=20163037 By Lišiak - Own work, CC BY-SA 4.0, https://commons.wikimedia.org/w/index.php?curid=39072776
3.9 Scaffolding connected to walls – D
Degree of Damage DoD 1 Breakage of connections to walls
IF0+ 30
108
m/s
km/h
Note: Estimate based on JMA(2015).
Figure 12. Scaffolding. Left: by Plaats - Own work, CC BY-SA 3.0, https://commons.wikimedia.org/w/index.php?curid=17360293
Centre: by TheRunnerUp - Own work, CC BY-SA 3.0 at, https://commons.wikimedia.org/w/index.php?curid=28131152 Right: by Globetrotter19 - Own work, CC BY-SA 3.0, https://commons.wikimedia.org/w/index.php?curid=44053732

30
3.10 Carports / Garages – G
Degree of Damage DoD 1 Collapse
IF1+ 47
170
m/s
km/h
Figure 13. Carports / garages. By Aarp65 - Own work, CC BY-SA 3.0, https://commons.wikimedia.org/w/index.php?curid=30872535
By Ra Boe / Wikipedia, CC BY-SA 3.0 de, https://commons.wikimedia.org/w/index.php?curid=18177883 By Dr.Ing.S.Wetzel, de:Benutzer: Analemma - Own work (Original text: Eigenfoto), CC BY-SA 3.0 de, https://commons.wikimedia.org/w/index.php?curid=47928444
3.11 Service station canopies – SS
Degree of Damage DoD 1 Collapse
IF2- 54
193
m/s
km/h
Note: Estimate based on EF-Scale (McDonald and Mehta, 2006).
Figure 14. Service stations. Left: By Kulja - Own work, CC BY 3.0, https://commons.wikimedia.org/w/index.php?curid=837123 5
Right: By Tiia Monto - Own work, CC BY-SA 4.0, https://commons.wikimedia.org/w/index.php?curid=47617270

31
3.12 Shipping containers – SC
Degree of Damage L light*
(contents < 300 kg)
H heavy*
(contents > 300 kg)
DoD 1 Shifting / sliding
IF1- 36
128
IF1+ 47
170
m/s
km/h
Estimates based on JEF-scale (JMA, 2015).
Figure 15. Shipping containers. Left: By IAEA Imagebank - 02510199, CC BY-SA 2.0, https://commons.wikimedia.org/w/index.php?curid=36209242
Right: By Guillaume Baviere, Flickr - https://www.flickr.com/photos/84554176@N00/6133222589, CC BY 2.0, https://commons.wikimedia.org/w/index.php?curid=37188939
3.13 Cranes – C
Degree of Damage C gantry/
container crane*
TO tower crane
DoD 1 Collapse when in operation
IF1- 36
128
IF1- 36
128
m/s
km/h
DoD 2 Collapse when not in operation
IF2- 54
193
IF1+ 47
170
m/s
km/h
Estimate based on JEF-scale (JMA, 2015).

32
Figure 16. Container / gantry cranes. By Alf van Beem - Own work, Public Domain,
https://commons.wikimedia.org/w/index.php?curid=51959144 By Alf van Beem - Own work, CC0, https://commons.wikimedia.org/w/index.php?curid=26869428 By Polska Zielona Sieć from Kraków, Poland - Ostatni dzwonek dla Klimatu, CC BY 2.0, https://commons.wikimedia.org/w/index.php?curid=17899828
3.14 Outdoor furniture – O*
Degree of Damage L light unanchored
objects such as plastic chairs or tables,
unanchored trampolines
O other, heavier, objects
DoD 1 Overturned or shifted
IF0 25 90
IF0+ 30
108
m/s
km/h DoD 1 Carrier through the air for several metres
IF0+ 30
108
IF1 41
149
m/s
km/h
*Comparable to Canadian DI C-SFOF “Sheds fences or outdoor furniture” (Sills et al.)
Figure 17. Outdoor furniture (left: light; right: heavier) .By Johann Jaritz - Own work, CC BY-SA 3.0 at,
https://commons.wikimedia.org/w/index.php?curid=28977889
33
4 References
Doswell, C. A. III, H. E. Brooks, and N. Dotzek, 2009: On the implementation of the Enhanced
Fujita scale in the USA. Atmos. Res., 93, 554-563.
Environment Canada, 2018: Enhanced Fujita scale for wind damage, website:
https://www.canada.ca/en/environment-climate-change/services/seasonal-weather-
hazards/enhanced-fujita-scale-wind-damage.html
Feuerstein, B., P. Groenemeijer, E. Dirksen, M. Hubrig, A. M. Holzer, and N. Dotzek, 2012:
Towards an improved wind speed scale vs. damage description adapted for Central Europe.
Atmos. Res., 100, 547-564, http://dx.doi.org/10.1016/j.atmosres.2010.12.026
Fujita, T. T., 1981: Tornadoes and downbursts in the context of generalized planetary scales. J.
Atmos. Sci., 38, 1511–1534, https://doi.org/10.1175/1520-
0469(1981)038<1511:TADITC>2.0.CO;2.
Green, David W., Jerrold E. Winandy, and David E. Kretschmann, 1999: Mechanical Properties of
Wood, in: “Wood handbook : wood as an engineering material”, General Technical Report GTR-
113, USDA Forest Service, Forest Products Laboratory, Madison, WI, USA, pp. 4.1-4.45,
https://www.fs.usda.gov/treesearch/pubs/7149.
Fujita, T.T., 1992: Memoirs of an Effort to Unlock the Mystery of Severe Storms During the 50
Years 1942-1992, The University of Chicago, 1992.
Haan, F.L., Jr., P.P. Sarkarb, Gregory A. Koppc and Derek A. Stedman, 2017: Critical wind speeds
for tornado-induced vehicle movements, Journal of Wind Engineering and Industrial
Aerodynamics, 168, 1-8.
Holzer, Alois M., Thomas M. E. Schreiner, and Tomáš Púčik, 2018: A forensic re-analysis of one
of the deadliest European tornadoes. Nat. Hazards Earth Syst. Sci., 18, 1555-1565,
https://doi.org/10.5194/nhess-18-1555-2018
Hubrig, Martin, 2015: EF – Scale enlargement for wooden plants, 8th European Conference on
Severe Storms, Wiener Neustadt, Austria.
Japanese Meteorlogical Agency, 2015: Guidelines for the Japanese Enhanced Fujita Scale,
retrieved from:
http://www.data.jma.go.jp/obd/stats/data/bosai/tornado/kaisetsu/guideline_en.pdf
IAWE, 2017: International Approaches to Tornado Damage and Intensity Classification,
International Association of Wind Engineers (IAWE), International Tornado Working Group
34
McDonald, James and Kishor C. Mehta, 2006: A recommendation for an Enhanced Fujita scale
(EF-Scale), Wind Science and Engineering Research Center, Texas Tech University,
http://www.depts.ttu.edu/weweb/Pubs/fscale/EFScale.pdf.
Meaden, G.T., 1976. Tornadoes in Britain: their intensities and distribution in space and time.
The International Journal of Meteorology, 1, 242–251.
Schmidlin, Thomas, B. Hammer, P. King, Y. Ono, L Scott-Miller, and G. Thumann, 2002: Unsafe
at any (wind) speed?, Bulletin fo the American Meteorological Society, 83, 1821–1830.
Sills, David, M.L., Patrick J. McCarthy and Gergory A. Kopp, 2014: Implementation and
Application of the EF-Scale in Canada, 24th Conference on Severe Local Storms, American
Meteorological Society.
http://www.yorku.ca/pat/research/dsills/papers/SLS27/SLS2014_Sillsetal_EF-
Scale_ExtendedAbstract_Final2.pdf
Wurman, J., C. Alexander, P. Robinson, and Y. Richardson, 2007: Low-Level Winds in Tornadoes
and Potential Catastrophic Tornado Impacts in Urban Areas. Bull. Amer. Meteor. Soc., 88, 31–
46, https://doi.org/10.1175/BAMS-88-1-31
35
Appendix I:
Photos and descriptions of undamaged
buildings of various sturdiness classes
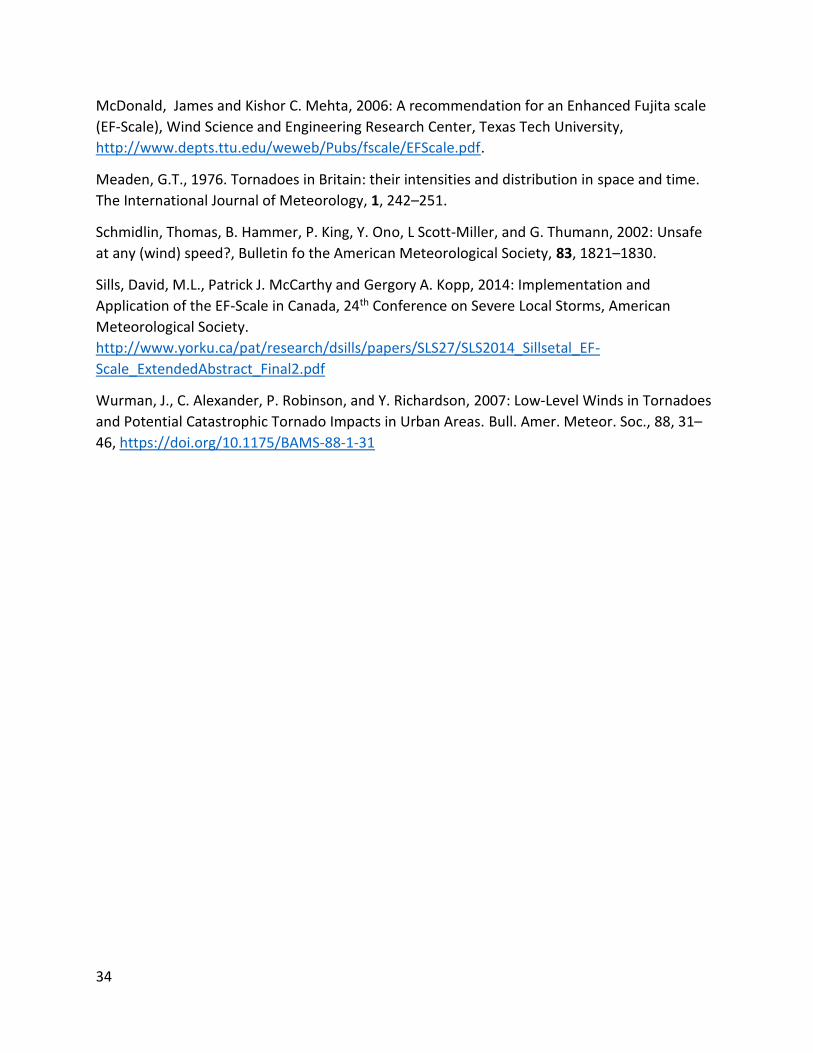
Class A
Characteristics:
• Thin wooden or metal panels, glass or mud walls
• Unanchored
• Lightweight
Typical examples: sheds, doghouses, or weak greenhouses
very weak frame with metal panels By Robin van Mourik - Flickr: Old garden shed near Glenorchy, CC BY-SA 2.0 https://commons.wikimedia.org/w/index.php?curid=19323803

36
Class B
Characteristics:
• Wood or metal frame with wood, metal panel, or glass siding
• Weak anchoring
Typical examples: structures typically not intended for permanent inhabitation such as sheds,
barns, stables, garages or stronger greenhouses
weak wooden frame with wooden panels By Renelibrary - Own work, CC BY-SA 3.0 https://commons.wikimedia.org/w/index.php?curid=31366017
metal frame structure with wooden panels By Micov - Own work, CC BY 3.0, https://commons.wikimedia.org/w/index.php?curid=4324950
metal frame with glass panels By National Rural Knowledge Exchange - Flickr, CC BY 2.0, https://commons.wikimedia.org/w/index.php?curid=3713996
37
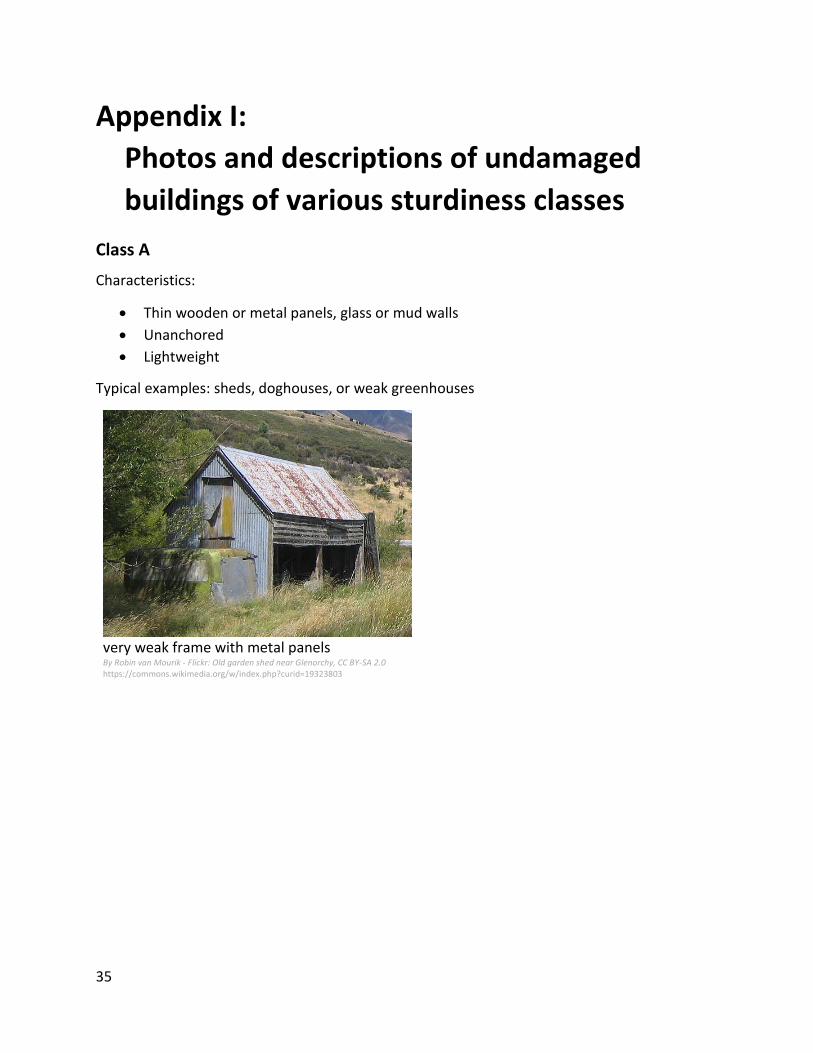
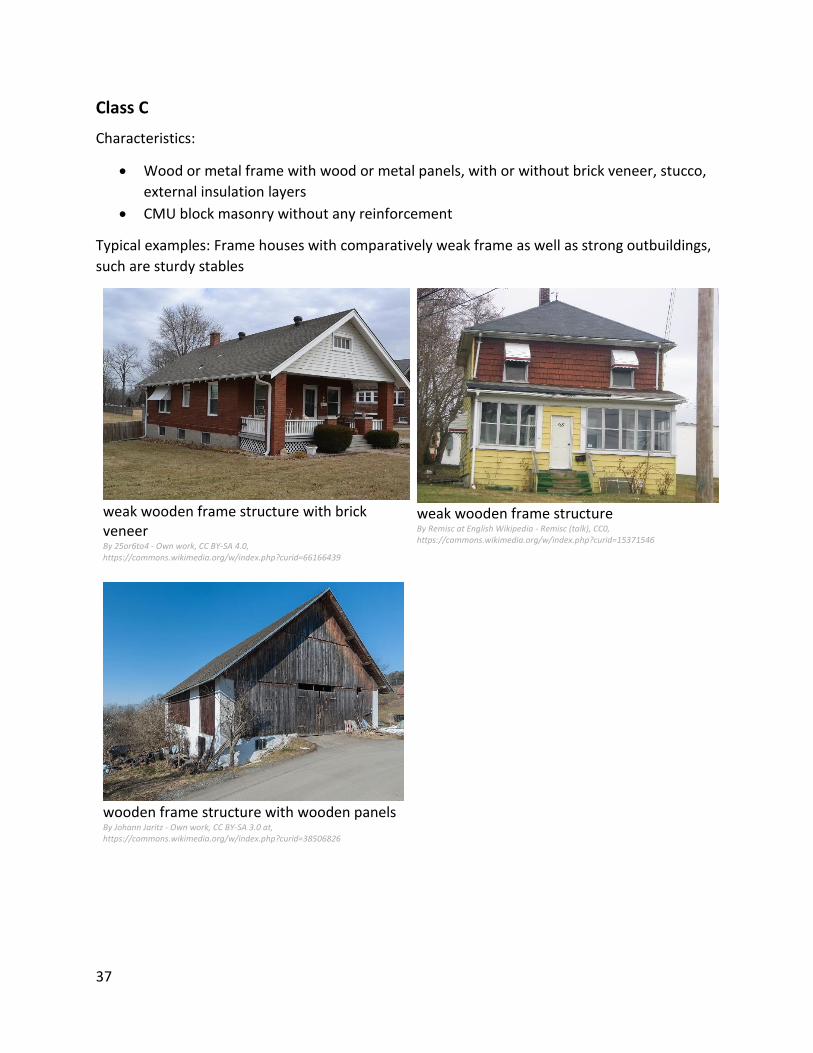
Class C
Characteristics:
• Wood or metal frame with wood or metal panels, with or without brick veneer, stucco,
external insulation layers
• CMU block masonry without any reinforcement
Typical examples: Frame houses with comparatively weak frame as well as strong outbuildings,
such are sturdy stables
weak wooden frame structure with brick veneer By 25or6to4 - Own work, CC BY-SA 4.0, https://commons.wikimedia.org/w/index.php?curid=66166439
weak wooden frame structure By Remisc at English Wikipedia - Remisc (talk), CC0, https://commons.wikimedia.org/w/index.php?curid=15371546
wooden frame structure with wooden panels By Johann Jaritz - Own work, CC BY-SA 3.0 at, https://commons.wikimedia.org/w/index.php?curid=38506826
38
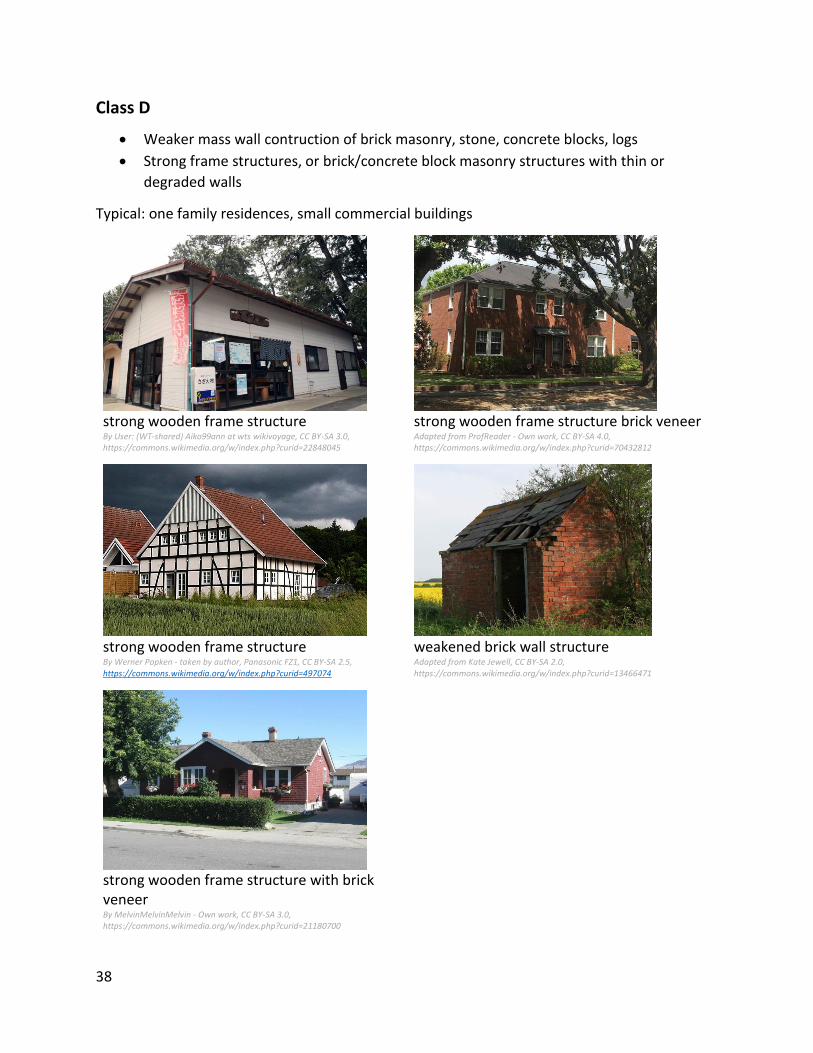
Class D
• Weaker mass wall contruction of brick masonry, stone, concrete blocks, logs
• Strong frame structures, or brick/concrete block masonry structures with thin or
degraded walls
Typical: one family residences, small commercial buildings
strong wooden frame structure By User: (WT-shared) Aiko99ann at wts wikivoyage, CC BY-SA 3.0, https://commons.wikimedia.org/w/index.php?curid=22848045
strong wooden frame structure brick veneer Adapted from ProfReader - Own work, CC BY-SA 4.0, https://commons.wikimedia.org/w/index.php?curid=70432812
strong wooden frame structure By Werner Popken - taken by author, Panasonic FZ1, CC BY-SA 2.5, https://commons.wikimedia.org/w/index.php?curid=497074
weakened brick wall structure Adapted from Kate Jewell, CC BY-SA 2.0, https://commons.wikimedia.org/w/index.php?curid=13466471
strong wooden frame structure with brick veneer By MelvinMelvinMelvin - Own work, CC BY-SA 3.0, https://commons.wikimedia.org/w/index.php?curid=21180700

39
Class E
• Strong mass wall contruction of brick masonry, stone, concrete blocks, logs
• Very strong frame structures
Typical: one family residences, commercial buildings
brick masonry mass wall structure By Evelyn Simak, CC BY-SA 2.0, https://commons.wikimedia.org/w/index.php?curid=13523321
wood log (load carrying) building structure Adapted from Pudelek - Own work, CC BY-SA 4.0, https://commons.wikimedia.org/w/index.php?curid=40665727
concrete block mass wall structure By Pavel Hrdlička, Wikipedia, CC BY-SA 3.0, https://commons.wikimedia.org/w/index.php?curid=34234877
brick masonry mass wall structure By Vincent van Zeijst - Own work, CC BY-SA 3.0, https://commons.wikimedia.org/w/index.php?curid=23414912
wood log (load carrying) building structure By Daniel Schwen - Own work, CC BY-SA 4.0,
https://commons.wikimedia.org/w/index.php?curid=7743664
brick masonry mass wall structure By Basotxerri - Own work, CC BY-SA 4.0, https://commons.wikimedia.org/w/index.php?curid=57525194
40
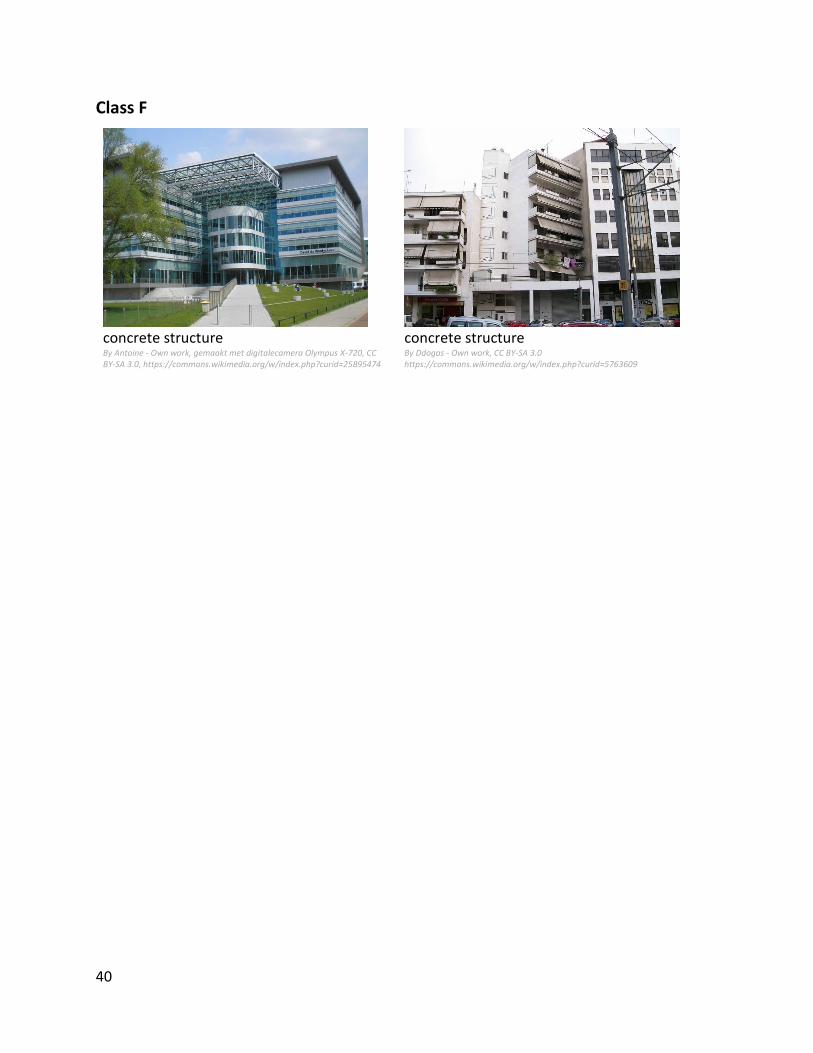
Class F
concrete structure By Antoine - Own work, gemaakt met digitalecamera Olympus X-720, CC BY-SA 3.0, https://commons.wikimedia.org/w/index.php?curid=25895474
concrete structure By Ddogas - Own work, CC BY-SA 3.0 https://commons.wikimedia.org/w/index.php?curid=5763609
41
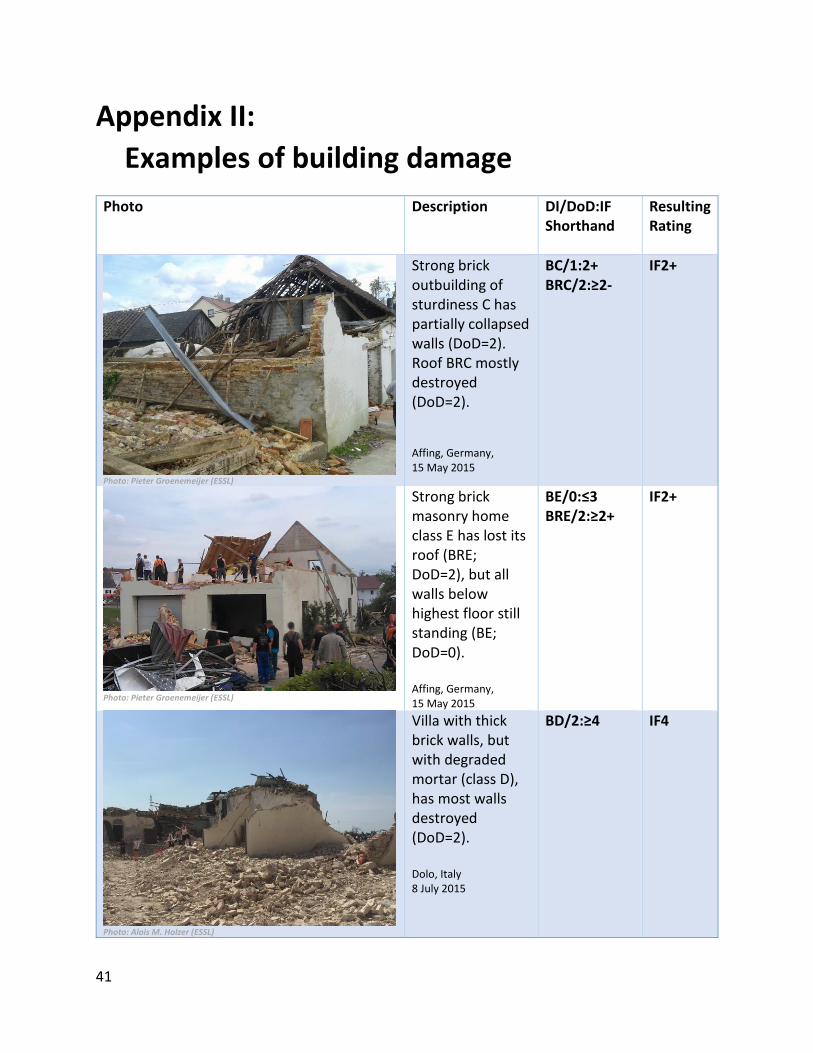
Appendix II:
Examples of building damage
Photo
Description DI/DoD:IF Shorthand
Resulting Rating
Photo: Pieter Groenemeijer (ESSL)
Strong brick outbuilding of sturdiness C has partially collapsed walls (DoD=2). Roof BRC mostly destroyed (DoD=2). Affing, Germany, 15 May 2015
BC/1:2+ BRC/2:≥2-
IF2+
Photo: Pieter Groenemeijer (ESSL)
Strong brick masonry home class E has lost its roof (BRE; DoD=2), but all walls below highest floor still standing (BE; DoD=0). Affing, Germany, 15 May 2015
BE/0:≤3 BRE/2:≥2+
IF2+
Photo: Alois M. Holzer (ESSL)
Villa with thick brick walls, but with degraded mortar (class D), has most walls destroyed (DoD=2). Dolo, Italy 8 July 2015
BD/2:≥4
IF4
42
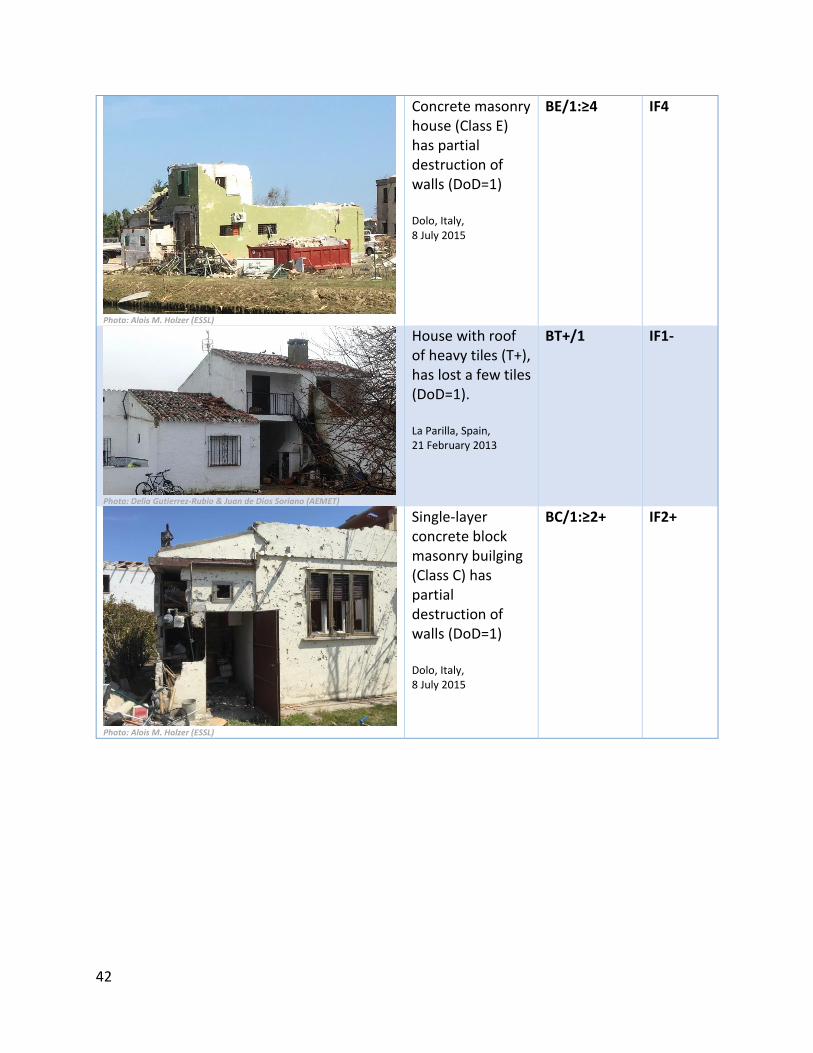
Photo: Alois M. Holzer (ESSL)
Concrete masonry house (Class E) has partial destruction of walls (DoD=1) Dolo, Italy, 8 July 2015
BE/1:≥4
IF4
Photo: Delia Gutierrez-Rubio & Juan de Dios Soriano (AEMET)
House with roof of heavy tiles (T+), has lost a few tiles (DoD=1). La Parilla, Spain, 21 February 2013
BT+/1 IF1-
Photo: Alois M. Holzer (ESSL)
Single-layer concrete block masonry builging (Class C) has partial destruction of walls (DoD=1) Dolo, Italy, 8 July 2015
BC/1:≥2+
IF2+

43
Appendix III:
Notes on values in matrices of Damage
indicator B “structure” and BR “roof”
BRA/2 is estimated based on the fact that sub-hurricane-force wind speeds often produce such
kind of damage in European wind storms at such measured gust speeds. IF-value: 30 m/s.
BRB/2 The IF value (47 m/s) is slightly higher than EF DI=SBO DoD 5 (roof lift up of small barns
and farm outbuildings @ 41 m/s), because these are “strong outbuildings”, and fits well with
JMA DI 7 DoD 3--4 (major loss of roofing materials, and loss/destruction of roof frame for small
non-residential wooden buildings @ 40--50 m/s). IF-value: 47 m/s.
BRC/2: JMA has Destruction/detachment of roof frames of its DI=9 (wooden livestock sheds) at
55 m/s, which probably are sturdy enough to fit into B-C2. B-C2 corresponds well to EF DI=FR12
DoD6 (roof gone for one/two family residences @ 54 m/s) and EF SRB DoD 7 (roof uplift or
collapse of small retail building @ 53 m/s). IF-value: 54 m/s.
BRD/2 corresponds to EF DI=ACT DoD 4 (Uplift or collapse of roof structure for apartments,
condominiums and townhouses @ 61 m/s). B-D2 is similar to JMA DI=2 prefabricated
industrialized steel-framed houses DoD’s 4 and 5 (destruction of roof frames/components, and
destruction of sheathing roof boards) @ 65 and 75 m/s, respectively. It may be argued that
these frames are so strong, that this DI fits typically in sturdiness class E. For wooden houses
and stores (JMA DI=1), loss of roofing structure is at 65 m/s. IF-value: 67 m/s.
BRE/2 is similar to DoD’s 8-10 of EF DI=IB (institutional building @ 63—68 m/s) and EF DI=ES,
JSHS (elementary, junior/senior high school) DoD’s 7 and 8, resp. (uplift/collapse of roof), at 56
m/s. Our estimate is 67 m/s, which is still lower than Feuerstein et al (2012) (F3-; 76 m/s) and
Fujita (1992) with 81—105 m/s (central values). Sills gives 63 m/s for heritage churches (C-HC
DoD 5) having > 80% of their roof removed and 54 m/s for solid masonry buildings having half
(but not all) of their roof removed. IF-value: 67 m/s.
BRF/2 was estimated to be F4 (105 m/s; central value) by Fujita. EF DI=LRB DoD5, MRB DoD8
and HRB DoD 9 have estimates of 59, 61, and 71 m/s; central values for roof collapse or
uplifting. IF-value: 81 m/s.
--
BA/1. IF-value: 36 m/s.
BB1 IF-value: 54 m/s for “strong outbuildings” is a little higher than EF DI=SBO DoD6 (collapse of
structure of small barns and farm outbuildings @ 43 m/s) which is the value for all (weak and
strong) outbuildings.

44
BC/1 JMA DI=9 (wooden livestock sheds) major deformation/collapse of upper structures occurs
at 60 m/s. Arguably, for weak framw hosues the value is a little higher. IF-value: 67 m/s.
BD/1 EF DI=FR12 (one to two family residences) DoD 8 (Most interior walls of top story
collapsed) occurs at 66 m/s. EF DI=ACT (apartments, condominiums, townhouses) has DoD 6
(most top story walls collapsed) at 70 m/s. EF DI=MAM (masonry apartments) has DoD
5(Collapse of top story walls) at 59 m/s. JMA DI=1 (wooden houses or stores) has no
intermediate DoD between some walls being damaged and the entire structure being
destroyed/collapsed, which it puts at 75 m/s. Fujita (1992) originally put this at 81 m/s,
Feuerstein et al (2012) at 87 m/s. IF-value: 81 m/s.
BE/1 EF DI’s for sturdy buildings DI=15—21, have top floor walls collapsing between 62 and 70
m/s, which seems very low. Sills DI=C-SMH (solid masonry house) DoD 6 (Exterior walls
collapsed) is consistent with 68 m/s. JMA DI=2 (Industrialized steel-framed houses -
prefabricated) has DoD 6 (Major destruction/collapse of main frames – story collapse) at 100
m/s. Fujita (1992) put this at 105. IF-value: 105 m/s.
BF/1. JMA has no DoD’s for DI=3 (reinforced concrete apartment buildings) representing
damage to the structural integrity, i.e. it is > 100 m/s. Fujita (1992) has 130 m/s. IF-value: 130
m/s.
--
BA/2: Weak outbuilding blown down is F1 per Fujita (1992), i.e. 41 m/s. This is typically
observed in European wind storms with such gusts. IF-value: 41 m/s.
BB/2: Strong outbuilding blown down is F2 per Fujita (1992), i.e. 60 m/s, while EF DI=SBO DoD6
(total destruction of small barns and farm outbuildings) = 50 m/s, but this includes class A
structures. IF-value: 60 m/s.
BC/2: Weak framehouse blown down is F3 per Fujita (1992), i.e. 81 m/s. EF DI=SRB (small retail
building) DoD8 Total destruction of entire building @ 75 m/s. EF DI=FR12 DoD10 (Total
destruction of one- or two-family residences) @ 76 m/s. JEF DI1 “Wooden houses and stores”
DoD 8 “Major destruction/collapse of main structures and frames” is @ 75 m/s. IF-value: 81
m/s, i.e. is only more-or-less consistent with (J)EF-scales if these buildings fall can be considered
“weak framehouses”.
BD/2: Strong framehouse blown down is F4 per Fujita (1992), i.e. 105 m/s. The IF-scale values
follow this, and are not consistent with the lower EF-scale estimates.
BE/2: Brick structure blown down is F5 per Fujita (1992), i.e. 130 m/s. The IF-scale values follow
this, and are not consistent with the lower EF-scale estimates. The Canadian EF DI=C-SMH (Solid
Masonry houses) has complete destruction at only 88 m/s.
BF/2: Concrete structure blown down is F5 per Fujita (1992), i.e. 130 m/s. The IF-scale values
follow this, and are not consistent with the lower EF-scale estimates.
45
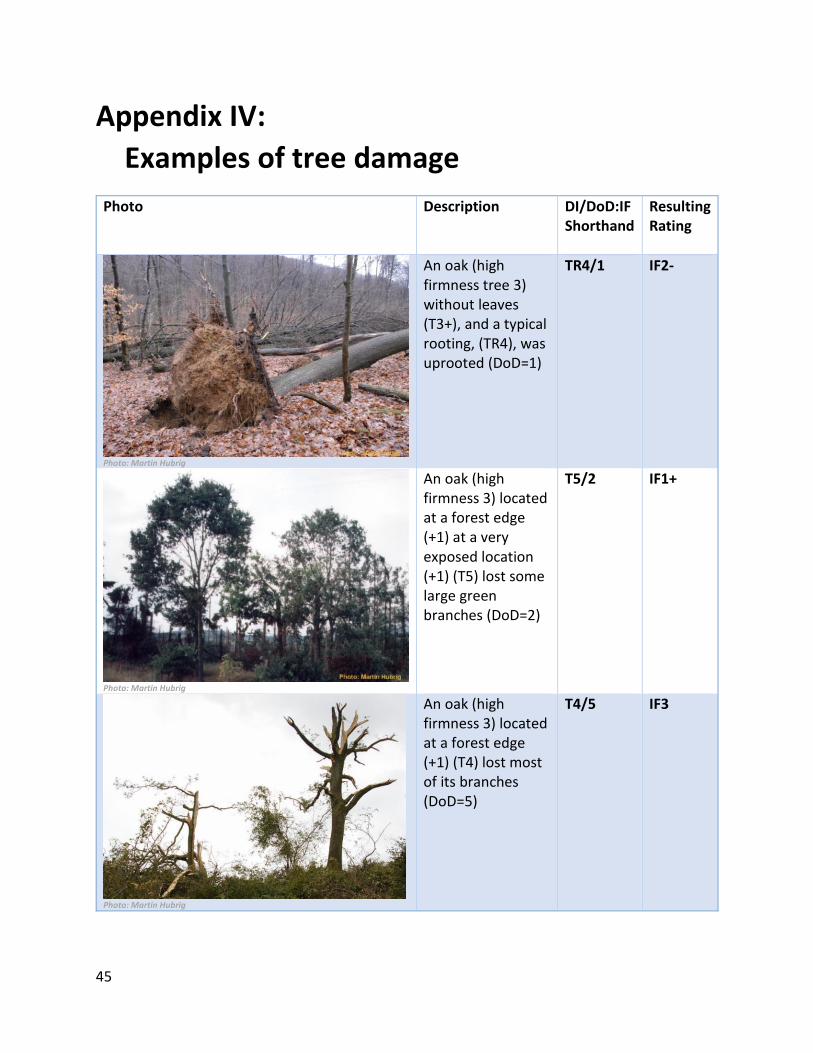
Appendix IV:
Examples of tree damage
Photo
Description DI/DoD:IF Shorthand
Resulting Rating
Photo: Martin Hubrig
An oak (high firmness tree 3) without leaves (T3+), and a typical rooting, (TR4), was uprooted (DoD=1)
TR4/1 IF2-
Photo: Martin Hubrig
An oak (high firmness 3) located at a forest edge (+1) at a very exposed location (+1) (T5) lost some large green branches (DoD=2)
T5/2 IF1+
Photo: Martin Hubrig
An oak (high firmness 3) located at a forest edge (+1) (T4) lost most of its branches (DoD=5)
T4/5 IF3
46
Photo: Martin Hubrig
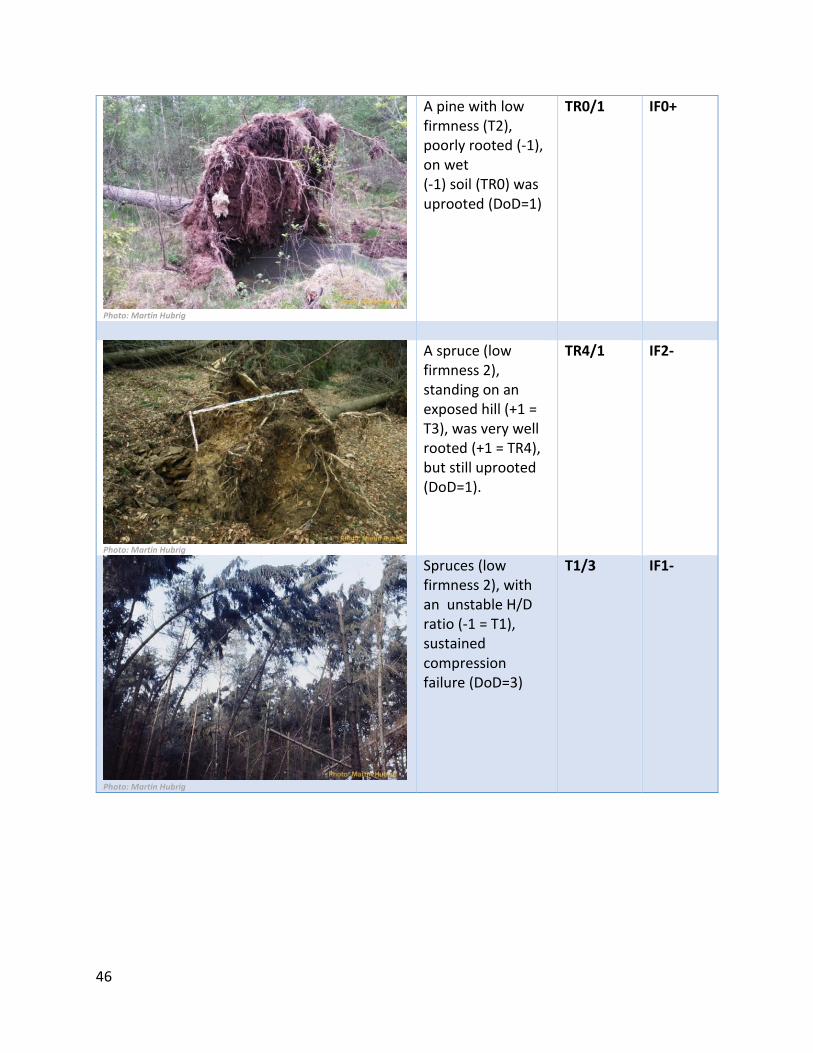
A pine with low firmness (T2), poorly rooted (-1), on wet (-1) soil (TR0) was uprooted (DoD=1)
TR0/1 IF0+
Photo: Martin Hubrig
A spruce (low firmness 2), standing on an exposed hill (+1 = T3), was very well rooted (+1 = TR4), but still uprooted (DoD=1).
TR4/1 IF2-
Photo: Martin Hubrig
Spruces (low firmness 2), with an unstable H/D ratio (-1 = T1), sustained compression failure (DoD=3)
T1/3 IF1-

47
Photo: Martin Hubrig
Spruces (low firmness 2), with an unstable H/D ratio (-1 = T1) had their trunks snapped (DoD=4)
T1/4 IF1+
Photo: Hartmut Höller
Spruces (low firmness 2), edge tree (+1=T3) had trunks snapped (DoD=4).
T3/4 IF2+
Photo: Martin Hubrig
An oak (high firmness 3), that was solitary (+1) had a 2/3 rotten trunk (not visible; -2 = T2) that snapped (DoD=4)
T2/4 IF2
48
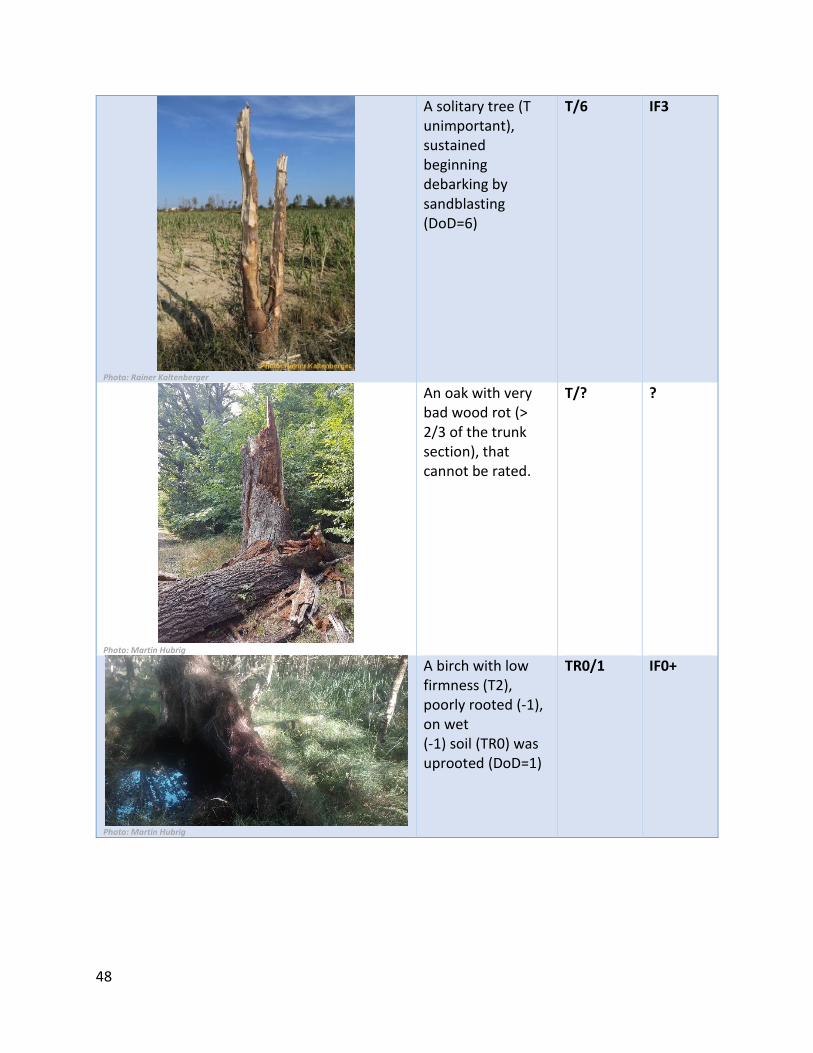
Photo: Rainer Kaltenberger
A solitary tree (T unimportant), sustained beginning debarking by sandblasting (DoD=6)
T/6 IF3
Photo: Martin Hubrig
An oak with very bad wood rot (> 2/3 of the trunk section), that cannot be rated.
T/? ?
Photo: Martin Hubrig
A birch with low firmness (T2), poorly rooted (-1), on wet (-1) soil (TR0) was uprooted (DoD=1)
TR0/1 IF0+