topographic and hydrographic survey data for the são ... · photograph of sunset on the grande...
TRANSCRIPT

U.S. Department of the InteriorU.S. Geological Survey
Data Series 965
Prepared in cooperation with the U.S. Army Corps of Engineers and the Company for Development of the São Francisco and Parnaíba River Valleys
Topographic and Hydrographic Survey Data for the São Francisco River near Torrinha, Bahia, Brazil, 2014

Cover: Photograph of Sunset on the Grande River, tributary to the São Francisco River, near Barra, Bahia, Brazil, looking upstream to the west. Photograph taken by Ben Dietsch, U.S. Geological Survey, May 30, 2014.
Topographic and Hydrographic Survey Data for the São Francisco River near Torrinha, Bahia, Brazil, 2014
By Ryan L. Fosness and Benjamin J. Dietsch
Prepared in cooperation with the U.S. Army Corps of Engineers and the Company for Development of the São Francisco and Parnaiba River Valleys
Data Series 965
U.S. Department of the InteriorU.S. Geological Survey

U.S. Department of the InteriorSALLY JEWELL, Secretary
U.S. Geological SurveySuzette M. Kimball, Acting Director
U.S. Geological Survey, Reston, Virginia: 2015
For more information on the USGS—the Federal source for science about the Earth, its natural and living resources, natural hazards, and the environment—visit http://www.usgs.gov or call 1–888–ASK–USGS.
For an overview of USGS information products, including maps, imagery, and publications, visit http://www.usgs.gov/pubprod/.
Any use of trade, firm, or product names is for descriptive purposes only and does not imply endorsement by the U.S. Government.
Although this information product, for the most part, is in the public domain, it also may contain copyrighted materials as noted in the text. Permission to reproduce copyrighted items must be secured from the copyright owner.
Suggested citation:Fosness, R.L., and Dietsch, B.J., 2015, Topographic and hydrographic survey data for the São Francisco River near Torrinha, Bahia, Brazil, 2014: U.S. Geological Survey Data Series 965, 28 p., http://dx.doi.org/10.3133/ds965.
ISSN 2327-638X (online)

iii
Contents
Abstract ...........................................................................................................................................................1Introduction.....................................................................................................................................................1
Purpose and Scope ..............................................................................................................................2Background and Description of Study Area ....................................................................................2
Topographic and Hydrographic Survey Methods ....................................................................................6Survey Control .......................................................................................................................................6Topographic Survey ............................................................................................................................10Hydrographic Survey and Streamflow Measurements ................................................................12
Topographic and Hydrographic Geospatial Data ...................................................................................15Streamflow Measurement Data ................................................................................................................18Quality Assurance and Quality Control ....................................................................................................19Summary........................................................................................................................................................23Acknowledgments .......................................................................................................................................23References Cited..........................................................................................................................................23Appendix A. Acoustic Doppler Current Profiler Post-Processing Tip Sheet ....................................27

iv
Figures 1. Map showing São Francisco River Basin and Torrinha-Itacoatiara study reach
along the São Francisco River near Torrinha, Bahia, Brazil ..................................................3 2. Map showing extent of Torrinha-Itacoatiara study reach, São Francisco River near
Torrinha, Bahia, Brazil, 2014 ........................................................................................................5 3. Map showing extent of Torrinha-Itacoatiara study reach, planned survey lines,
location of survey control bench marks, and location of discharge measurements on the São Francisco River near Torrinha, Bahia, Brazil, 2014 .............................................7
4. Photographs showing bench mark construction and completed bench mark on Grande do Pecado Island, São Francisco River near Torrinha, Bahia, Brazil, 2014 ..........8
5. Photograph showing bench mark with global navigation satellite systems survey equipment “base station” at Da Preguiça Island near Torrinha, Bahia, Brazil ..................9
6. Photograph showing topographic survey check shot data collection on Da Preguiça Island reference bench mark, Da Preguiça Island near Torrinha, Bahia, Brazil .............10
7. Photograph showing topographic survey data collection on exposed sand bar near Torrinha, Bahia, Brazil ................................................................................................................11
8. Photograph showing survey vessel, acoustic Doppler current profiler (ADCP), and real time kinetic global positioning system (RTK GPS) used to collect hydrographic data, Torrinha-Itacoatiara feasibility study, São Francisco River near Torrinha, Bahia, Brazil, 2014 .......................................................................................................................13
9. Photograph of the acoustic Doppler continuous profiler mount shown out of water in transportation position, Torrinha-Itacoatiara feasibility study, São Francisco River near Torrinha, Bahia, Brazil, 2014 ..................................................................................13
10. Photograph of data-acquisition laptop and navigation monitor, Torrinha-Itacoatiara feasibility study, São Francisco River near Torrinha, Bahia, Brazil, 2014 ..........................14
11. Graph showing distribution of elevations surveyed using an acoustic Doppler current profiler near Torrinha and Itacoatiara, Bahia, Brazil, May 22–June 10, 2015 ....16
Tables 1. Selected horizontal and vertical coordinate reference systems for topographic and
hydrographic surveys for the Torrinha-Itacoatiara feasibility study, São Francisco River near Torrinha, Bahia, Brazil, 2014 ....................................................................................9
2. Primary benchmark coordinates for topographic and hydrographic surveys for the Torrinha-Itacoatiara feasibility study, São Francisco River near Torrinha, Bahia, Brazil, 2014 ...................................................................................................................................16
3. Metadata, preview illustrations, and compressed geospatial data sets for the Torrinha-Itacoatiara feasibility study, São Francisco River near Torrinha, Bahia, Brazil, 2014 ...................................................................................................................................17
4. Summary of discharge measurement, São Francisco River near Grande do Pecado Island, Bahia, Brazil, June 10, 2014 ..........................................................................................18
5. Post-processed static global navigation satellite systems (GNSS) observations using Brazilian Institute of Geography and Statistics precise point positioning (IBGE PPP) for the Torrinha-Itacoatiara feasibility study, São Francisco River near Torrinha, Bahia, Brazil, 2014 ......................................................................................................20
6. Daily quality assurance and quality control for reference bench marks for the Torrinha-Itacoatiara feasibility study, São Francisco River near Torrinha, Bahia, Brazil, 2014 ...................................................................................................................................22
v
Conversion Factors
International System of Units to Inch/pound
Multiply By To obtain
Length
centimeter (cm) 0.3937 inch (in.)millimeter (mm) 0.03937 inch (in.)meter (m) 3.281 foot (ft) kilometer (km) 0.6214 mile (mi)kilometer (km) 0.5400 mile, nautical (nmi) meter (m) 1.094 yard (yd)
Areasquare meter (m2) 0.0002471 acre hectare (ha) 2.471 acresquare kilometer (km2) 247.1 acrehectare (ha) 0.003861 square mile (mi2) square kilometer (km2) 0.3861 square mile (mi2)
Flow rate
cubic meter per second (m3/s) 70.07 acre-foot per day (acre-ft/d) cubic meter per second (m3/s) 35.31 cubic foot per second (ft3/s)
Temperature in degrees Celsius (°C) may be converted to degrees Fahrenheit (°F) as follows:
°F = (1.8 ×°C) + 32.
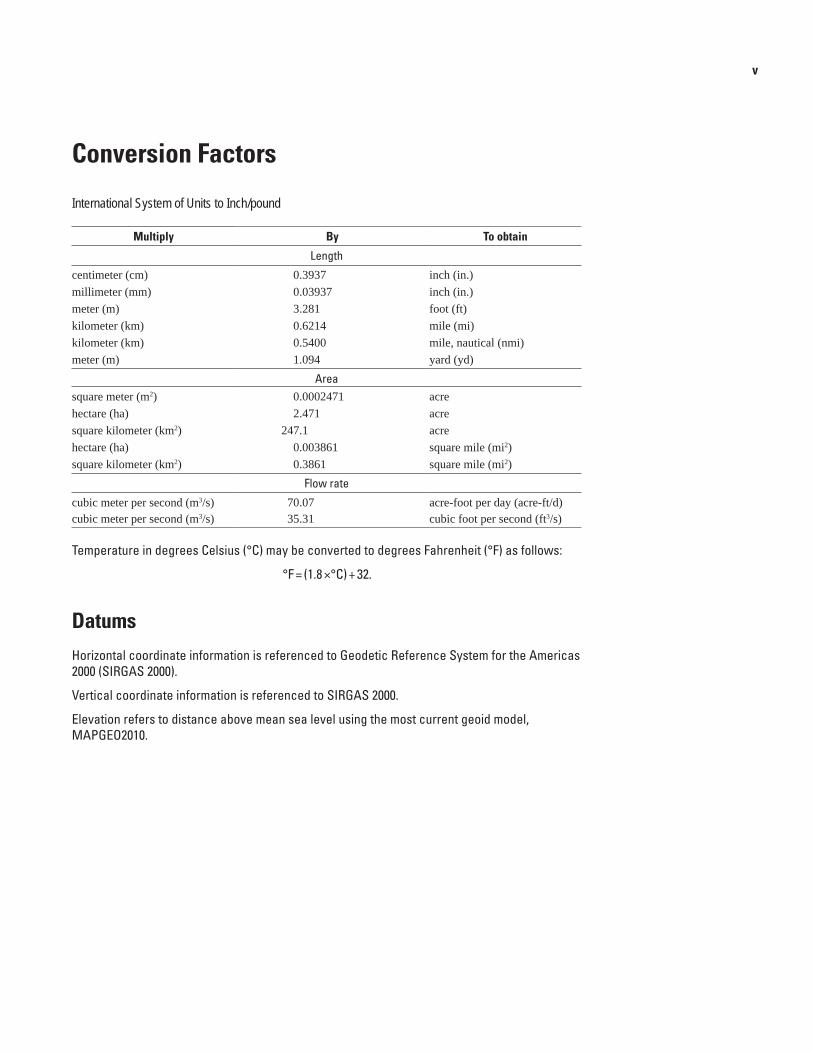
DatumsHorizontal coordinate information is referenced to Geodetic Reference System for the Americas 2000 (SIRGAS 2000).
Vertical coordinate information is referenced to SIRGAS 2000.
Elevation refers to distance above mean sea level using the most current geoid model, MAPGEO2010.

vi
Abbreviations
ADCP acoustic Doppler current profilerAHSFRA Administration of the Waterways of the São Francisco RiverANA National Water AgencyCODEVASF Company for Development of the São Francisco and Parnaíba River ValleysCRS coordinate reference systemGGA global positioning system fix dataGNSS global navigation satellite systemsGLONASS Russian Global Navigation Satellite SystemGPS global positioning systemIBGE Brazilian Institute of Geography and StatisticsOGP International Association of Oil and Gas ProducersPPP precise point positioningRBMC Brazilian Network for Continuous Monitoring of the GNSS SystemsSAP Strategic Action ProgramSIRGAS Geocentric Reference System for the AmericasUSACE U.S. Army Corps of EngineersUSGS U.S. Geological SurveyUTC coordinated universal timeUTM Universal Transverse MercatorVMT Velocity Mapping ToolboxVTG vector track and speed over ground

Topographic and Hydrographic Survey Data for the São Francisco River near Torrinha, Bahia, Brazil, 2014
By Ryan L. Fosness and Benjamin J. Dietsch
AbstractNavigable inland waterways, including lakes, rivers, and
reservoirs, are important transportation routes for people and goods in Brazil. Natural and anthropogenic effects coupled with recent severe droughts have led to decreased inland waterway navigation. The Company for Development of the São Francisco and Parnaíba River Valleys (CODEVASF) has recognized the decrease in waterway navigation and is investing resources to help restore selected reaches of the São Francisco River for navigation. In 2011, CODEVASF signed an agreement with the U.S. Army Corps of Engineers (USACE) seeking technical assistance and engineering expertise in waterway navigation and bank stabilization. The Torrinha-Itacoatiara study reach near Torrinha, Bahia was 1 of 12 conceptual waterway navigation improvement feasibility studies and was the focus of this study. The U.S. Geological Survey, in cooperation with the USACE and CODEVASF, collected topographic and hydrographic data from May 22 to June 12, 2014, to provide baseline data for supporting computational streamflow models.
This report presents the surveying techniques and data-processing methods used to collect, process, and disseminate topographic and hydrographic data. All standard and non-standard data-collection methods, techniques, and data process methods were documented. Additional discussion describes the quality-assurance and quality-control elements used in this study, along with the limitations for the Torrinha-Itacoatiara study reach data. The topographic and hydrographic geospatial data are published along with associated metadata.
IntroductionThe Company for Development of the São Francisco
and Parnaíba River Valleys (CODEVASF) operates under the Brazilian Ministry of National Integration as a non-profit public company. The mission statement of CODEVASF is: “Promoting the development of the São Francisco, Parnaíba, Itapecuru, and Mearim River valleys by utilizing
sustainable natural resources and productive activities for economic and social inclusion” (Company for Development of the São Francisco and Parnaíba River Valleys, 2014a). CODEVASF is responsible for numerous development projects within each of the river valley basins including for example irrigation improvement projects, improving farming efficiencies, municipal drinking water supply, wastewater treatment and disposal, soil erosion prevention, inland waterway navigation, and maintenance. Since 1970, CODEVASF has invested about 28 million dollars annually into development projects that resulted in the creation of about 495,000 jobs and agriculture production valued at 455 million dollars per year. The construction of municipal drinking water supply and wastewater treatment facilities has improved the water quality of the rivers and the health of the local residents. Overall, the development projects have significantly enhanced the general economy in each of the river valley basins (Company for Development of the São Francisco and Parnaíba River Valleys, 2006).
Navigable inland waterways, including lakes, rivers, and reservoirs, are important transportation routes for people and goods in Brazil (Administration of the Waterways of the São Francisco, 2015a). Benefits to waterway transportation generally include high load capacity, low fuel costs, reduced emissions, and low maintenance (Strategic Action Program, 2004; Administration of the Waterways of the São Francisco, 2015b). However, natural and anthropogenic effects, such as regulated streamflows and sedimentation resulting from the construction of dams, coupled with recent severe droughts, have led to degradation and reduced navigational use of inland waterways (Junqueira, 2002; Strategic Action Program, 2004). The construction of reservoirs has modified the temporal and spatial magnitude of streamflow and has impacted sediment-transport processes within the inland waterways. Since the completion of the five dams along the São Francisco River, total streamflow has decreased, most notably during the dry periods of the year. The decrease in total streamflow, coupled with an aggrading channel caused by high sediment loading from upstream tributaries, has caused shoals throughout the navigation reach that are only navigable by vessels with shallow drafts.

2 Topographic and Hydrographic Survey Data for the São Francisco River near Torrinha, Bahia, Brazil, 2014
CODEVASF has recognized the decrease in waterway navigation and is investing resources to help restore selected reaches of the São Francisco River for navigation (Company for Development of the São Francisco and Parnaíba River Valleys and U.S. Army Corps of Engineers, 2014). In December 2011, CODEVASF signed an agreement with the U.S. Army Corps of Engineers (USACE) seeking technical assistance and engineering expertise in waterway navigation and bank stabilization. Technical assistance included hydrologic and hydraulic streamflow modeling; geotechnical assessment; dredging; construction engineering; river bank stabilization; erosion monitoring and control; rock excavation; and navigation. CODEVASF identified 12 conceptual feasibility studies to collaborate with USACE on as a way to transfer knowledge regarding the processes used to complete inland waterway navigation projects. Since the beginning of the agreement, USACE engineers have maintained a full time office occupancy in Brasília, Federal District to assist with project planning. USACE engineering specialists traveled to Brazil to provide technical assistance for each applicable engineering field (Company for Development of the São Francisco and Parnaíba River Valleys and U.S. Army Corps of Engineers, 2014).
One of the 12 feasibility studies is located on the São Francisco River in the State of Bahia (fig. 1). The feasibility study site (hereafter referred to as the Torrinha-Itacoatiara study reach) was the focus of this study and was recently scoped for potential waterway navigation improvements (Company for Development of the São Francisco and Parnaíba River Valleys and U.S. Army Corps of Engineers, 2014). As part of the navigation improvement design process, USACE and CODEVASF developed a two-dimensional hydrodynamic model to simulate streamflow and potential channel improvement designs in the existing channel. However, the hydrodynamic model was developed using limited topographic and hydrographic data previously collected in the study reach. Additionally, the methods and accuracy of the previously collected topographic and hydrographic data and geospatial references were undocumented (Company for Development of the São Francisco and Parnaíba River Valleys and U.S. Army Corps of Engineers, 2014). In May and June 2014, the U.S. Geological Survey (USGS)in cooperation with the USACE and CODEVASF and with logistical support from the Brazilian Army, collected additional topographic and hydrographic data in the Torrinha-Itacoatiara study reach, which are documented in this report. The USGS and Brazilian Army collected topographic and hydrographic data, including survey cross sections of the riverbanks and riverbed, depth averaged streamflow velocities, and instantaneous streamflow measurements of the river. The topographic and hydrographic data will be used to develop and update the USACE/CODEVASF hydrodynamic model to aid in the design of river restoration and construction projects.
Purpose and Scope
This report discusses methods and results of USGS topographic and hydrographic surveys, conducted in cooperation with USACE and CODEVASF from May 22 to June 12, 2014, in the Torrinha-Itacoatiara study reach on the São Francisco River near Torrinha, Bahia, Brazil. The extent of the surveys included areas for planned channel reconstruction and the extent of an existing two-dimensional hydrodynamic model in the feasibility study reach.
Survey control bench marks were constructed to define the horizontal and vertical coordinates within the study area. A topographic survey extended elevation data from the existing water surface to the top of the riverbanks. The hydrographic survey included bathymetry (riverbed elevations), depth-averaged velocities, and two instantaneous discharge measurements. Topographic and hydrographic data were collected along planned lines within the study area to capture the hydraulic and geomorphological characteristics of the river. Data-collection methods, techniques, and data process methods were documented. Topographic and hydrographic geospatial data are published along with this report in compressed data format along with associated metadata. Additional discussion describes quality assurance and quality control and their associated limitations used for the Torrinha-Itacoatiara study reach project data.
Background and Description of Study Area
CODEVASF-managed operational areas include the São Francisco, Parnaíba, Itapecuru, and Mearim River valleys, spanning nearly 1 million km2 across 10 States in eastern Brazil (fig. 1). CODEVASF projects support nearly 1 million municipalities serving more than 26.8 million residents (Company for Development of the São Francisco and Parnaíba River Valleys, 2014b).
This study was located in the São Francisco River valley (basin) (fig. 1). The São Francisco River headwaters originate in the Canastra Mountains (fig. 1) at an elevation of about 1,485 m in south-central Minas Gerais. From the mouth in the Atlantic Ocean upstream to the headwaters, the São Francisco River is about 2,863 river kilometers (rkm) long with a drainage area of about 636,920 km2 (Strategic Action Program, 2004). The basin area includes 7 States, 503 municipalities, and a population of almost 13.3 million residents (Strategic Action Program, 2004). Located in the tropical region of Brazil, the climate varies from arid to humid. The Cerrado and Caatinga terrestrial ecosystems, native only to Brazil, are the predominant vegetation cover in the São Francisco River Basin. The climate is warm and semi-humid with median daily temperatures generally ranging from 18 to 27 °C with dry periods typically extending 4–6 months (Strategic Action Program, 2004). Annual precipitation in the Cerrado ranges from 1,100 to 2,000 mm and occurs almost entirely during the summer rainy season (January–April).
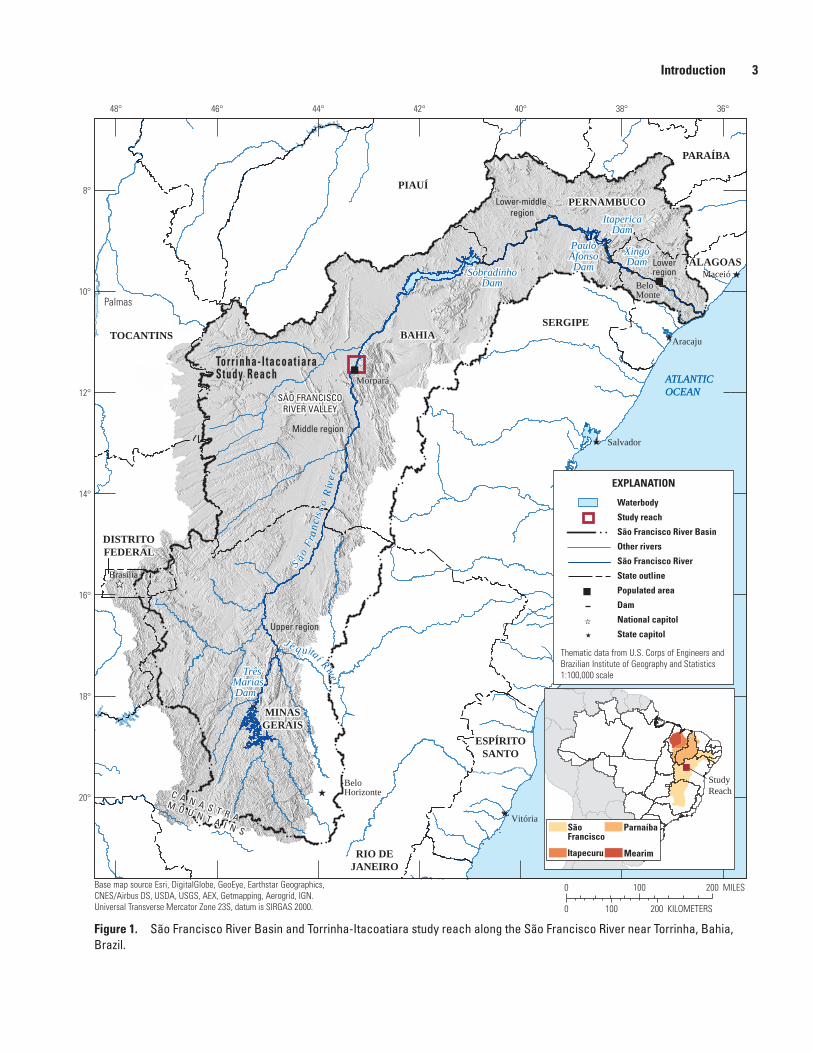
Introduction 3
Figure 1. São Francisco River Basin and Torrinha-Itacoatiara study reach along the São Francisco River near Torrinha, Bahia, Brazil.
tac15-1015_fig01
^
^
^
^
^
^̂
MorparáMorpará
BeloMonteBeloMonte
Torr inha- I tacoat iaraStudy ReachTorr inha- I tacoat iaraStudy Reach
SobradinhoDam
SobradinhoDam
XingóDamXingóDam
Três Marias
Dam
Três Marias
Dam
ItapericaDam
ItapericaDam
PauloAfonsoDam
PauloAfonsoDam
Brasília
BeloHorizonte
Vitória
Palmas
Salvador
Aracaju
Maceió
PARAÍBAPARAÍBA
SERGIPESERGIPE
RIO DEJANEIRORIO DE
JANEIRO
DISTRITOFEDERALDISTRITOFEDERAL
ESPÍRITOSANTO
ESPÍRITOSANTO
PERNAMBUCOPERNAMBUCO
BAHIABAHIA
MINASGERAISMINASGERAIS
ALAGOASALAGOAS
TOCANTINSTOCANTINS
PIAUÍPIAUÍ
JJee qq uuiittaaíí RR iivvee rr
SS ããooFFrr
aannccii
ss ccoo
RRiivv
eerr
C A N A S T R AM O U N T A I N S
C A N A S T R AM O U N T A I N S
SÃO FRANCISCORIVER VALLEY
SÃO FRANCISCORIVER VALLEY
Middle regionMiddle region
Upper regionUpper region
Lower-middle region
Lower-middle region
LowerregionLowerregion
ATLANTICOCEANATLANTICOCEAN
0 100 200 KILOMETERS
0 100 200 MILESBase map source Esri, DigitalGlobe, GeoEye, Earthstar Geographics,CNES/Airbus DS, USDA, USGS, AEX, Getmapping, Aerogrid, IGN.Universal Transverse Mercator Zone 23S, datum is SIRGAS 2000.
36°38°40°42°44°46°48°
8°
10°
12°
14°
16°
18°
20°
"
StudyReach
SãoFrancisco
Itapecuru
Parnaíba
Mearim
EXPLANATION
Waterbody
Study reach
São Francisco River Basin
Other rivers
São Francisco River
State outline
Populated area
Dam
National capitol
State capitol
Thematic data from U.S. Corps of Engineers and Brazilian Institute of Geography and Statistics 1:100,000 scale
4 Topographic and Hydrographic Survey Data for the São Francisco River near Torrinha, Bahia, Brazil, 2014
The Cerrado ecosystem is predominantly savanna, a mixture of sparsely distributed trees, shrubs, and dense grasses. The Caatinga climate is warm and semi-arid to arid with similar temperatures and rainy and dry seasons as the Cerrado, but with reduced precipitation ranging from 200 to 800 mm/y (Strategic Action Program, 2004). Because of the extended dry periods and lower precipitation than the Cerrado, the terrain is predominantly desert shrubs, cactus, with very few large trees. Much of the area near the river valleys has been altered to support agriculture with about 105,700 ha cultivated (Company for Development of the São Francisco and Parnaíba River Valleys, 2006).
Because of the size of the basin and highly variable physiographic characteristics, the São Francisco River Basin was divided into four regions. The Upper region extends from the headwaters to the confluence with the Jequitaí River downstream of the Três Marias Dam. The Middle region begins at the confluence with the Jequitaí River and extends downstream to the Sobradinho Dam. The Lower-middle region extends from the Sobradinho Dam downstream to the city of Belo Monte, and the Lower region continues downstream of Belo Monte to the confluence with the Atlantic Ocean (Strategic Action Program, 2004).
Mean annual streamflow (at the mouth) of the São Francisco River is about 2,846 m3/s, but ranges annually from about 1,077 to 5,290 m3/s (National Water Agency, 2015). About 75 percent of the streamflow originates in the Upper region, where monthly median streamflow ranges from 637 m3/s in August to 1,303 m3/s in February. Nineteen perennial tributaries contribute streamflow to the Middle region, and monthly median streamflow ranges from 1,419 m3/s in September to 4,393 m3/s in February.
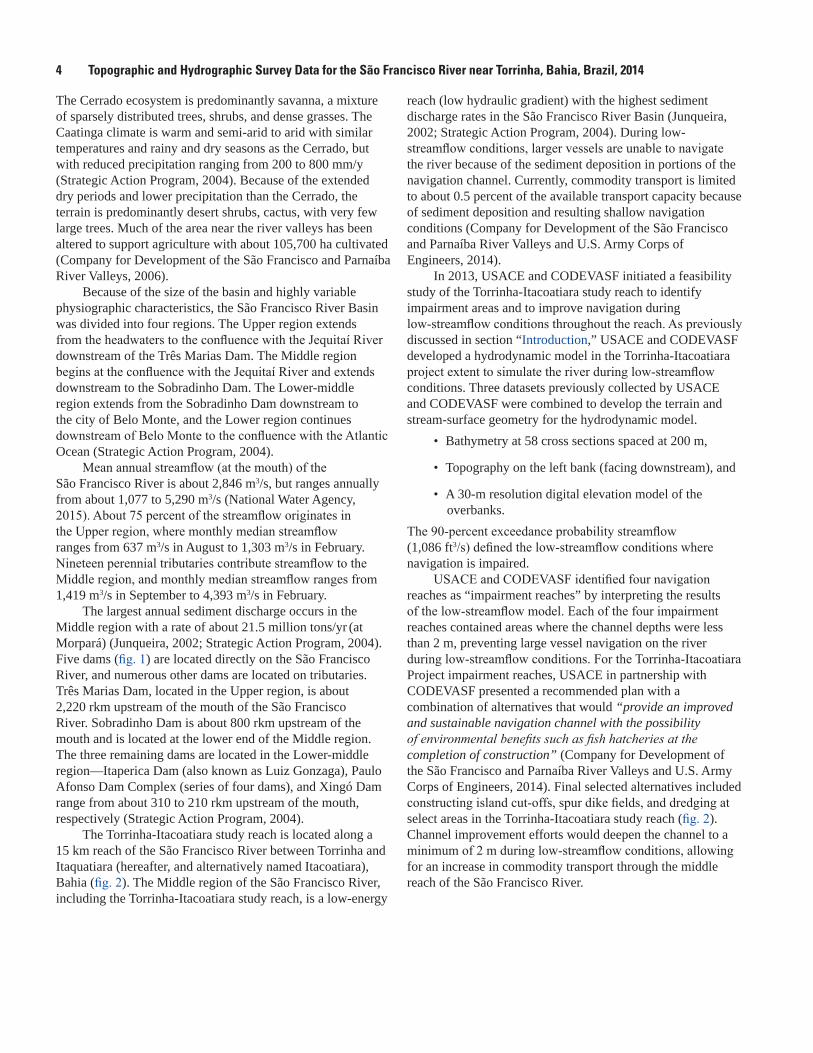
The largest annual sediment discharge occurs in the Middle region with a rate of about 21.5 million tons/yr (at Morpará) (Junqueira, 2002; Strategic Action Program, 2004). Five dams (fig. 1) are located directly on the São Francisco River, and numerous other dams are located on tributaries. Três Marias Dam, located in the Upper region, is about 2,220 rkm upstream of the mouth of the São Francisco River. Sobradinho Dam is about 800 rkm upstream of the mouth and is located at the lower end of the Middle region. The three remaining dams are located in the Lower-middle region—Itaperica Dam (also known as Luiz Gonzaga), Paulo Afonso Dam Complex (series of four dams), and Xingó Dam range from about 310 to 210 rkm upstream of the mouth, respectively (Strategic Action Program, 2004).
The Torrinha-Itacoatiara study reach is located along a 15 km reach of the São Francisco River between Torrinha and Itaquatiara (hereafter, and alternatively named Itacoatiara), Bahia (fig. 2). The Middle region of the São Francisco River, including the Torrinha-Itacoatiara study reach, is a low-energy
reach (low hydraulic gradient) with the highest sediment discharge rates in the São Francisco River Basin (Junqueira, 2002; Strategic Action Program, 2004). During low-streamflow conditions, larger vessels are unable to navigate the river because of the sediment deposition in portions of the navigation channel. Currently, commodity transport is limited to about 0.5 percent of the available transport capacity because of sediment deposition and resulting shallow navigation conditions (Company for Development of the São Francisco and Parnaíba River Valleys and U.S. Army Corps of Engineers, 2014).
In 2013, USACE and CODEVASF initiated a feasibility study of the Torrinha-Itacoatiara study reach to identify impairment areas and to improve navigation during low-streamflow conditions throughout the reach. As previously discussed in section “Introduction,” USACE and CODEVASF developed a hydrodynamic model in the Torrinha-Itacoatiara project extent to simulate the river during low-streamflow conditions. Three datasets previously collected by USACE and CODEVASF were combined to develop the terrain and stream-surface geometry for the hydrodynamic model.
• Bathymetry at 58 cross sections spaced at 200 m,
• Topography on the left bank (facing downstream), and
• A 30-m resolution digital elevation model of the overbanks.
The 90-percent exceedance probability streamflow (1,086 ft3/s) defined the low-streamflow conditions where navigation is impaired.
USACE and CODEVASF identified four navigation reaches as “impairment reaches” by interpreting the results of the low-streamflow model. Each of the four impairment reaches contained areas where the channel depths were less than 2 m, preventing large vessel navigation on the river during low-streamflow conditions. For the Torrinha-Itacoatiara Project impairment reaches, USACE in partnership with CODEVASF presented a recommended plan with a combination of alternatives that would “provide an improved and sustainable navigation channel with the possibility of environmental benefits such as fish hatcheries at the completion of construction” (Company for Development of the São Francisco and Parnaíba River Valleys and U.S. Army Corps of Engineers, 2014). Final selected alternatives included constructing island cut-offs, spur dike fields, and dredging at select areas in the Torrinha-Itacoatiara study reach (fig. 2). Channel improvement efforts would deepen the channel to a minimum of 2 m during low-streamflow conditions, allowing for an increase in commodity transport through the middle reach of the São Francisco River.
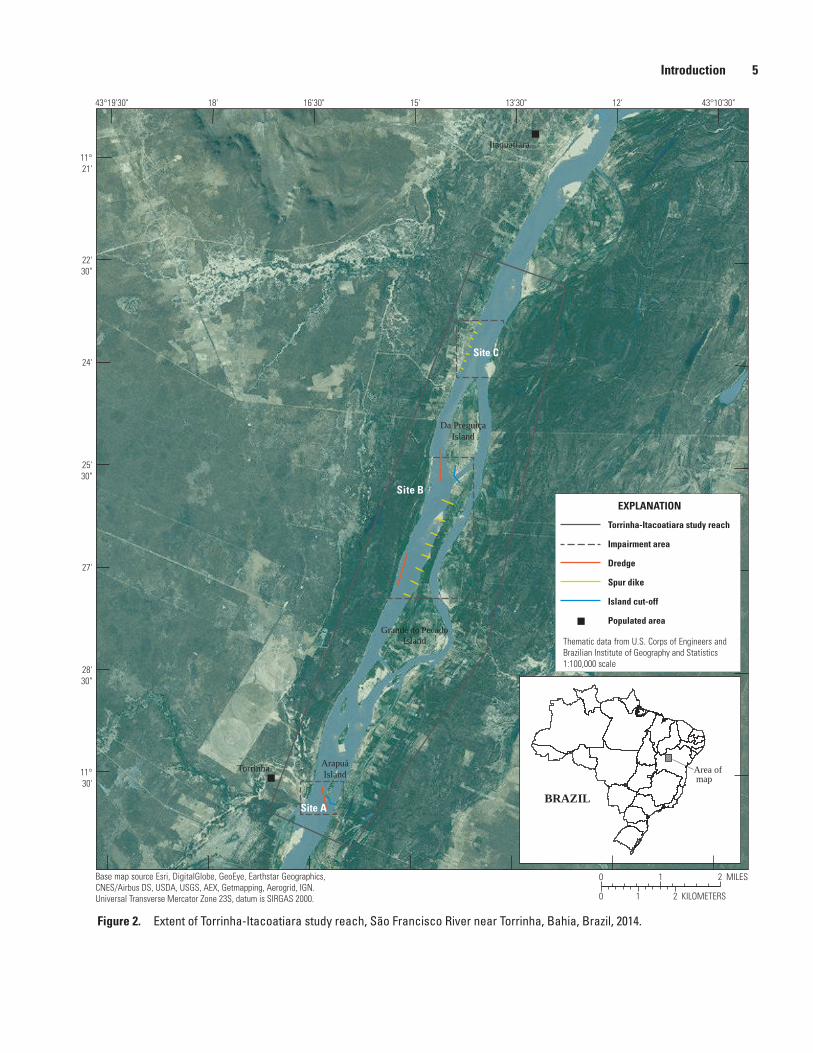
Introduction 5
Figure 2. Extent of Torrinha-Itacoatiara study reach, São Francisco River near Torrinha, Bahia, Brazil, 2014.
tac15-1015_fig02
Torrinha
Itaquatiara
ArapuáIsland
Da PreguiçaIsland
Grande do PecadoIsland
Site B
Site C
Site ABRAZIL
Area of map
0 1 2 MILES
0 1 2 KILOMETERS
Base map source Esri, DigitalGlobe, GeoEye, Earthstar Geographics,CNES/Airbus DS, USDA, USGS, AEX, Getmapping, Aerogrid, IGN.Universal Transverse Mercator Zone 23S, datum is SIRGAS 2000.
43°10'30"12'13'30"15'16'30"18'43°19'30"
11°21'
22'30"
24'
25'30"
27'
28'30"
11°30'
EXPLANATION
Torrinha-Itacoatiara study reach
Impairment area
Dredge
Spur dike
Island cut-off
Populated area
Thematic data from U.S. Corps of Engineers and Brazilian Institute of Geography and Statistics 1:100,000 scale

6 Topographic and Hydrographic Survey Data for the São Francisco River near Torrinha, Bahia, Brazil, 2014
Topographic and Hydrographic Survey Methods
The USGS collected topographic and hydrographic geospatial data to aid USACE and CODEVASF in developing and updating the hydrodynamic models using current (as of 2014) geospatial river geometry. USACE and CODEVASF used the hydrodynamic models to simulate various streamflow scenarios with modified river geometry from planned construction projects including island cut-offs, spur dike fields, and dredging. Accurate topographic and hydrographic data are necessary to produce high-quality hydrodynamic models. Topographic data were collected to extend the land-surface elevation from the intersection with the existing water surface to high-elevation areas that are not inundated during bankfull conditions. Hydrographic data were collected in areas below the existing water surface and included bathymetry, depth-averaged velocity, and instantaneous discharge measurements. In addition to developing and updating hydrodynamic models, hydrographic data can be used to calibrate and verify the model output data against measured values in the modeling area.
Topographic and hydrographic survey data were collected along a series of cross sections generally oriented perpendicular to the direction of streamflow. The Torrinha-Itacoatiara study reach was divided into impairment and non-impairment areas, as described by Company for Development of the São Francisco and Parnaíba River Valleys and U.S. Army Corps of Engineers (2014). For this study, impairment reaches described by Company for Development of the São Francisco and Parnaíba River Valleys and the U.S. Army Corps of Engineers (2014) as “Impairment Reach 2” and “Impairment Reach 3” were combined, resulting in three separate study areas referred to as sites A, B, and C (fig. 2). Site A is located near the upstream extent of the study area near Arapuá Island (fig. 2) and is consistent with “Impairment Reach 1” as described by Company for Development of the São Francisco and Parnaíba River Valleys and U.S. Army Corps of Engineers (2014). An island cut-off and dredging area are proposed along the 0.5 km impairment reach (site A) near Arapuá Island downstream of the ferry crossing at Torrinha. Site B is located near the middle of the study area in the navigation channel beginning about half way down Grande do Pecado Island to where the channel separates around Da Preguiça Island (fig. 2) and is consistent with “Impairment Reaches 2 and 3” as described by Company for Development of the São Francisco and Parnaíba River Valleys and U.S. Army Corps of Engineers (2014). Proposed river structures include spur dikes along Grande do Pecado Island, an island cut-off at Da Preguiça Island, and dredging along a 4 km reach of site B. Site C begins near the bottom of Da Preguiça Island and contains a proposed spur dike field along the western bank extending about 1.5 km downstream. The spatial locations of the recommended plan features provided the
extents of the island cut-offs, spur dike fields, and dredging areas in each of the study reaches (fig. 2). Planned survey lines generally were spaced at 60-m intervals in the impairment areas (fig. 3) to meet USACE hydrographic survey guidelines for construction projects and site investigations (U.S. Army Corps of Engineers, 2013). Non-impairment areas included the remaining portion of the navigation channel and the side channel located on the eastern side of Da Preguiça and Grande do Pecado Islands (fig. 3). Planned survey lines generally were spaced at 200 m in non-impairment areas (fig. 3) to provide sufficient coverage for general river navigation surveys (U.S. Army Corps of Engineers, 2013).
Survey Control
Survey controls did not exist in the study area; therefore, a new control network was established prior to the start of the topographic and hydrographic surveys. Horizontal and vertical survey controls were established by setting temporary bench marks (fig. 4) on Da Preguiça and Grande do Pecado Islands.
Two survey control bench marks were constructed on each island—a “primary” bench mark for daily set-up of the survey equipment and a “reference” bench mark for daily quality assurance checks. Each site was located above the top of bank with good visibility of the open sky and separated nearly equidistant in the study area. The islands also provided a secure location to set the survey equipment and provided quick access by boat. Bench marks were constructed in a plastic pipe that was driven about 1 m below the ground and filled with concrete (fig. 4A). An aluminum survey marker coupled with 10 mm diameter rebar was placed flush in the wet concrete and allowed to cure. The bench mark name and reference point were marked on each of the bench marks after the concrete had adequately cured (fig. 4B). For this study, standard bench mark construction procedures described by Guidance in Brazilian Institute of Geography and Statistics (2007) were not followed due to the lack of time and materials.
The Geocentric Reference System for the Americas 2000 (SIRGAS, 2000) was the geographic coordinate reference system (CRS) used in this study (table 1). On February 25, 2005, SIRGAS 2000 became the official geodetic coordinate reference system for Brazil, replacing the topocentric South American Datum 1969 (Brazilian Institute of Geography and Statistics, 2008). SIRGAS 2000 was designed for use with global navigation satellite systems (GNSS), including the United States’ Global Positioning System (GPS), Russian Global Navigation Satellite System (GLONASS), and other planned satellite systems (Brazilian Institute of Geography and Statistics, 2008). All coordinate references to SIRGAS 2000 in this report are calculated to epoch 2000.4 (Brazilian Institute of Geography and Statistics, 2013). The projected CRS used in this study was “SIRGAS 2000 / UTM zone 23 S.”

Topographic and Hydrographic Survey Methods 7
Figure 3. Extent of Torrinha-Itacoatiara study reach, planned survey lines, location of survey control bench marks, and location of discharge measurements on the São Francisco River near Torrinha, Bahia, Brazil, 2014.
tac15-1015_fig03
Torrinha
Da PreguiçaIsland
Grande do PecadoIsland
ArapuáIsland
Site B
Site C
Site A
43°12'13'30"15'16'30"43°18'
11°22'30"
24'
25'30"
27'
28'30"
30'
11°31'30"
0 1 2 MILES
0 1 2 KILOMETERS
Base map source Esri, DigitalGlobe, GeoEye, Earthstar Geographics,CNES/Airbus DS, USDA, USGS, AEX, Getmapping, Aerogrid, IGN.Universal Transverse Mercator Zone 23S, datum is SIRGAS 2000.
BRAZIL
Area of map
Thematic data from U.S. Corps of Engineers and Brazilian Institute of Geography and Statistics 1:100,000 scale
EXPLANATION
Torrinha-Itacoatiara study reach
Impairment area
Planned survey lines
Discharge measurement location
Populated area

8 Topographic and Hydrographic Survey Data for the São Francisco River near Torrinha, Bahia, Brazil, 2014
Figure 4. (A) Bench mark construction and (B) completed bench mark on Grande do Pecado Island, São Francisco River near Torrinha, Bahia, Brazil, 2014. Photograph (A) taken by Calvin Creech, U.S. Army Corps of Engineers, May 21, 2014, and (B) taken by Ryan Fosness, U.S. Geological Survey, May 24, 2014.
A
B

Topographic and Hydrographic Survey Methods 9
The selected geodetic parameter registry code identifier was European Petroleum Survey Group 31983 (International Association of Oil and Gas Producers, 2012). Because the selected reference system was geocentric (ellipsoid based), it required a geoid model to derive an orthometric height (hereinafter referred to as elevation). The selected geoid model for Brazil was MAPGEO2010 (Brazilian Institute of Geography and Statistics, 2008).
Horizontal and vertical coordinates were established for each survey control bench mark using survey-grade GNSS survey equipment (fig. 5). Hereinafter, GNSS refers to a combination of globally available satellite systems including the United States GPS and the Russian GLONASS. Recommended procedures described in Brazilian Institute of Geography and Statistics (2008), Henning (2011), and Rydlund and Densmore (2012) were followed for collecting static GNSS data including detailed background, equipment descriptions, techniques, and methods for GNSS surveys. A GNSS receiver, referred to as the “base station,” was positioned over
a primary control bench mark and logged a static file each survey day. Static data were not collected at reference bench marks; “observed control point” style observations were collected at each reference bench mark (Rydlund and Densmore, 2012). The observed control point provided coordinates at each reference bench mark that were used for daily quality assurance checks.
Table 1. Selected horizontal and vertical coordinate reference systems for topographic and hydrographic surveys for the Torrinha-Itacoatiara feasibility study, São Francisco River near Torrinha, Bahia, Brazil, 2014.
[Abbreviations: CRS, Coordinate Reference System; EPSG, European Petroleum Survey Group; SIRGAS, Geodetic Reference System for the Americas; UTM, Universal Transverse Mercator]
Type Name UnitsEPSG
identifier
Projected CRS SIRGAS 2000 / UTM zone 23S Meters 31983Geographic CRS SIRGAS 2000 Degree 4674Map projection UTM Zone 23 South MetersMap projection method Transverse Mercator
Map projection parameters Values Units
Latitude of natural origin 0° DegreeLongitude of natural origin 45° W DegreeScale factor at natural origin 1.0False easting, in grid units 500000.0 MetersFalse northing, in grid units 10000000.0 MetersCoordinate axes East / North Meters
Figure 5. Bench mark with global navigation satellite systems survey equipment “base station” at Da Preguiça Island near Torrinha, Bahia, Brazil. Photograph taken by Ben Dietsch, U.S. Geological Survey, May 28, 2014.
10 Topographic and Hydrographic Survey Data for the São Francisco River near Torrinha, Bahia, Brazil, 2014
Topographic Survey
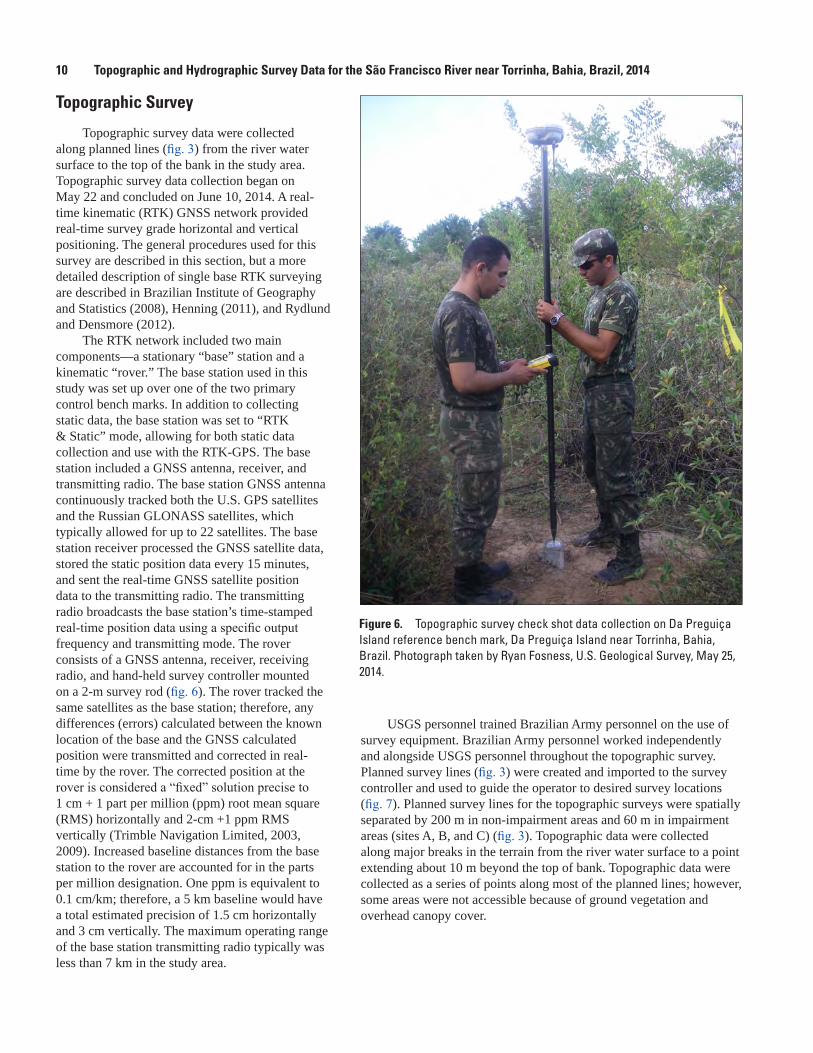
Topographic survey data were collected along planned lines (fig. 3) from the river water surface to the top of the bank in the study area. Topographic survey data collection began on May 22 and concluded on June 10, 2014. A real-time kinematic (RTK) GNSS network provided real-time survey grade horizontal and vertical positioning. The general procedures used for this survey are described in this section, but a more detailed description of single base RTK surveying are described in Brazilian Institute of Geography and Statistics (2008), Henning (2011), and Rydlund and Densmore (2012).
The RTK network included two main components—a stationary “base” station and a kinematic “rover.” The base station used in this study was set up over one of the two primary control bench marks. In addition to collecting static data, the base station was set to “RTK & Static” mode, allowing for both static data collection and use with the RTK-GPS. The base station included a GNSS antenna, receiver, and transmitting radio. The base station GNSS antenna continuously tracked both the U.S. GPS satellites and the Russian GLONASS satellites, which typically allowed for up to 22 satellites. The base station receiver processed the GNSS satellite data, stored the static position data every 15 minutes, and sent the real-time GNSS satellite position data to the transmitting radio. The transmitting radio broadcasts the base station’s time-stamped real-time position data using a specific output frequency and transmitting mode. The rover consists of a GNSS antenna, receiver, receiving radio, and hand-held survey controller mounted on a 2-m survey rod (fig. 6). The rover tracked the same satellites as the base station; therefore, any differences (errors) calculated between the known location of the base and the GNSS calculated position were transmitted and corrected in real-time by the rover. The corrected position at the rover is considered a “fixed” solution precise to 1 cm + 1 part per million (ppm) root mean square (RMS) horizontally and 2-cm +1 ppm RMS vertically (Trimble Navigation Limited, 2003, 2009). Increased baseline distances from the base station to the rover are accounted for in the parts per million designation. One ppm is equivalent to 0.1 cm/km; therefore, a 5 km baseline would have a total estimated precision of 1.5 cm horizontally and 3 cm vertically. The maximum operating range of the base station transmitting radio typically was less than 7 km in the study area.
USGS personnel trained Brazilian Army personnel on the use of survey equipment. Brazilian Army personnel worked independently and alongside USGS personnel throughout the topographic survey. Planned survey lines (fig. 3) were created and imported to the survey controller and used to guide the operator to desired survey locations (fig. 7). Planned survey lines for the topographic surveys were spatially separated by 200 m in non-impairment areas and 60 m in impairment areas (sites A, B, and C) (fig. 3). Topographic data were collected along major breaks in the terrain from the river water surface to a point extending about 10 m beyond the top of bank. Topographic data were collected as a series of points along most of the planned lines; however, some areas were not accessible because of ground vegetation and overhead canopy cover.
Figure 6. Topographic survey check shot data collection on Da Preguiça Island reference bench mark, Da Preguiça Island near Torrinha, Bahia, Brazil. Photograph taken by Ryan Fosness, U.S. Geological Survey, May 25, 2014.

Topographic and Hydrographic Survey Methods 11
Figure 7. Topographic survey data collection on exposed sand bar near Torrinha, Bahia, Brazil. Photograph taken by Ryan Fosness, U.S. Geological Survey, May 22, 2014.
Prior to the start of the topographic and hydrographic survey, two static survey files were collected and post-processed on May 21 using IBGE precise point positioning (PPP) to establish “ultra-rapid” (Brazilian Institute of Geography and Statistics, 2008) solutions for each of the two primary control bench marks. The ultra-rapid static solution was used for the duration of the survey and provided reasonably accurate (±15 cm) coordinates for each bench mark (Brazilian Institute of Geography and Statistics, 2013). Final coordinates were not required during the field survey, but reasonable accuracy was necessary to navigate the planned survey lines.
Static GNSS data were collected daily at the base station (primary bench mark) and post-processed using the IBGE-PPP and the baseline processing and network adjustment software. In July 2014, all static survey files collected at the base station receiver were processed using the IBGE-PPP (Brazilian Institute of Geography and Statistics, 2013). Selected static files associated with the most precise IBGE-PPP results were post-processed using baseline processing and network-adjustment procedures (Trimble Navigation Limited, 2014). Final primary bench mark horizontal and vertical coordinates were established from the fully constrained network adjustment (Rydlund and Densmore, 2012). Fully
constrained network adjusted solutions for each of the primary bench marks, RSF1 and RSF2, were directly tied into Brazilian Network for Continuous Monitoring of GNSS Systems (RBMC) using six sites surrounding the study area (Brazilian Institute of Geography and Statistics, 2008, 2013). Fully constrained, network-adjusted final primary bench mark coordinates typically provide the least amount of uncertainty (opposed to the IBGE-PPP results) (Rydlund and Densmore, 2012). Static GNSS data were not collected at the reference bench marks; therefore, network adjusted solution could not be calculated.
Topography data were exported into Trimble® Business Center and survey locations, antenna heights, and data quality were reviewed for errors. After the final primary bench mark coordinates were established, all topographic survey data previously imported were shifted from ultra-rapid to final primary bench mark coordinates. Data were shifted based on the local geographic coordinate reference system (latitude, longitude, and ellipsoid height) using Trimble® Business Center (Trimble Navigation Limited, 2014). Final output included both geographic coordinates (latitude, longitude, ellipsoid height) and projected coordinates (northing, easting, elevation).

12 Topographic and Hydrographic Survey Data for the São Francisco River near Torrinha, Bahia, Brazil, 2014
Hydrographic Survey and Streamflow Measurements
Hydrographic survey data were collected from May 22 through June 10, 2015, using an acoustic Doppler current profiler (ADCP) coupled with an RTK-GNSS rover. The collected hydrographic data consisted of three elements—riverbed elevations derived from bathymetry, depth-averaged streamflow velocity, and an instantaneous discharge measurement. Hydrographic data were collected as the boat moved across the river at over 300 planned cross sections distributed throughout the reach. Data collection software integrated and stored the depth and velocity data from the ADCP and the horizontal and vertical positioning data from the GNSS data in real time. Data processing required computer software to extract bathymetry and velocity data from the raw ADCP and GNSS files and to summarize and map the information. A single instantaneous discharge measurement quantified the streamflow of the river at the time of the survey, and the variation of streamflow around Grande do Pecado Island.
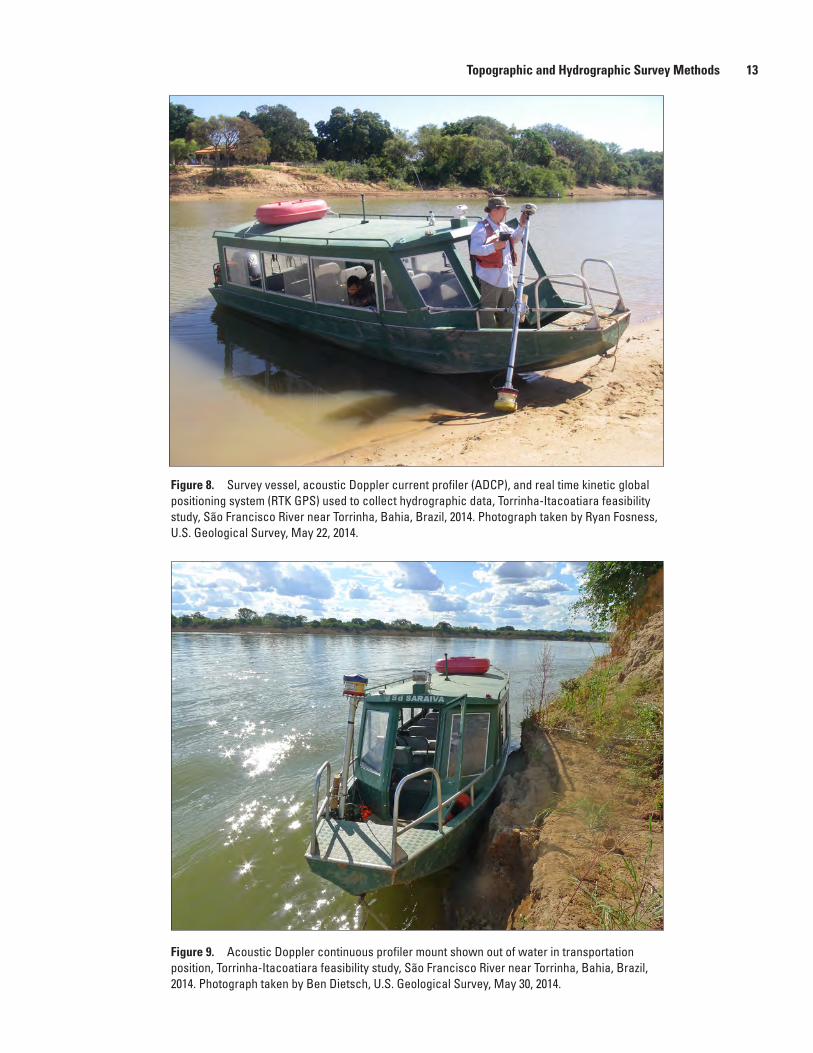
The ADCP used for this study, a 1,200 kilohertz (kHz) Teledyne RD Instruments Workhorse Rio Grande, has four beams offset 20 degrees from nadir (ADCP phase center, oriented downward) and has a profiling depth range of 0.3–25 m (Teledyne RD Instruments, 2014) (fig. 8). Depth measurements were obtained from each of the four beams. Each beam transmits acoustic pulses into the water column, which are reflected from particles, such as sediment, and from the riverbed. In simplified terms, the frequencies of the transmitted and received acoustic pulses are compared to determine the relative magnitude and direction of the water velocity in three dimensions. An ADCP measures velocities throughout the water column except the area near the transducer face (blanking distance) and near the riverbed. The ADCP requires 12 volts direct current input from an external power source and communicates to a laptop computer using RS-232 serial communications. The ADCP has onboard sensors that provide temperature corrections, tilt (pitch and roll) information, and compass orientation. An onboard clock allows the data stream from the ADCP to be synchronized with other data streams, such as those from a GNSS receiver. WinRiver II was the data collection software that processed the real-time ADCP depth, velocity, and discharge data and interfaces with the GNSS data stream (Teledyne RD Instruments, 2013). A personal computer (PC) running Windows® 2000 or higher is required to run WinRiver II. A serial port is required; however, because many PCs do not contain serial ports, a Universal Serial Bus (USB) or Personal Computer Memory Card International Association(PCMCIA) serial port adapter can be used to connect to the ADCP and the GNSS.
A GNSS rover was configured in WinRiver II as an external navigation device and supplied navigation data during the hydrographic data collection. The GNSS rover
was connected by radio link to the same base station used in the topographic survey. The GNSS rover was configured to output National Marine Electronics Association 0183 standard (NMEA-0183) messages describing navigation data such as time, position, GNSS quality data, speed, and heading. Navigation data were output from the rover at a frequency of 10 Hz and a baud rate of 38,400 kilobytes per second. Selected NMEA-0183 messages output to WinRiver II included Global Positioning System Fix Data (GGA) and Vector Track and speed over Ground (VTG) (Teledyne RD Instruments, 2013). WinRiver II recorded an additional message (RDENS) in the navigation data file describing the sequential ADCP ensemble number and PC time (Teledyne RD Instruments, 2013). PC time was set to the GGA time of position, in Coordinated Universal Time (UTC) format, and corrected for the local time zone (-03:00 UTC). Selected fields in the GGA message included time of position, latitude, longitude, GNSS quality, mean-sea-level elevation, and geoid offset height. VTG NMEA-0183 data provided ADCP speed and heading data used during the survey to assist in navigation.
The ADCP was mounted to the boat using a custom aluminum mounting pole and bracket (fig. 9), a simplified version of the “Kentucky mount” (Mueller and others, 2013). Only non-ferrous hardware, such as aluminum and stainless steel, was used in the mount to avoid interference to the compass that can be caused by ferrous objects. The mounting hardware consisted of a circular aluminum plate (230 mm diameter, 6 mm thick), an aluminum pipe rail base flange, an aluminum pipe (sized to fit the base flange and of sufficient length to achieve adequate draft), and an aluminum pipe rail fascia-mount flange. Holes were drilled in the circular plate corresponding to the mounting holes on the ADCP, and stainless-steel threaded rod and locking nuts were used to fasten the ADCP to the plate through the holes. Another set of holes was drilled into the circular plate to attach the base flange with stainless steel nuts and bolts. The aluminum pipe was inserted into the base flange and secured with set screws. The top of the aluminum pipe was fastened to the fascia flange with set screws. The fascia flange was attached to the hand rail on the boat with U-bolts and metal straps in a configuration that allowed the ADCP to be rotated into and out of the water without permitting the assembly to slide sideways along the rail. A bracket for the GNSS antenna was attached to an aluminum pipe that was sized in such a way that it could be inserted into the pipe used for the ADCP mount. The corresponding holes were drilled in the mounting pipes for both instruments so that the GNSS antenna mounting pipe could be bolted to the ADCP mounting pipe when the ADCP was in the water or so that it could be quickly removed before the ADCP mount was rotated out of the water (fig. 9). In this configuration, the position of the GNSS antenna relative to the ADCP was a fixed distance. The measured distance from the GNSS antenna to the ADCP was used in the computation of riverbed elevations from the raw ADCP bathymetry. For this study, the vertical offset distance from the antenna center to the ADCP center was 2.33 m.
Topographic and Hydrographic Survey Methods 13
Figure 8. Survey vessel, acoustic Doppler current profiler (ADCP), and real time kinetic global positioning system (RTK GPS) used to collect hydrographic data, Torrinha-Itacoatiara feasibility study, São Francisco River near Torrinha, Bahia, Brazil, 2014. Photograph taken by Ryan Fosness, U.S. Geological Survey, May 22, 2014.
Figure 9. Acoustic Doppler continuous profiler mount shown out of water in transportation position, Torrinha-Itacoatiara feasibility study, São Francisco River near Torrinha, Bahia, Brazil, 2014. Photograph taken by Ben Dietsch, U.S. Geological Survey, May 30, 2014.
14 Topographic and Hydrographic Survey Data for the São Francisco River near Torrinha, Bahia, Brazil, 2014
In addition to the ADCP, the GNSS, and the laptop computer, other pieces of ancillary equipment were used during the survey. Hand-held radios were used to communicate with topographic surveyors and crew members on shore. A toolkit with tools, a multimeter, and spare parts was kept on the boat to service the ADCP, GNSS, and boat. A folding rule was used to measure and check the offset distance from the phase center GNSS antenna to the phase center ADCP. A laser rangefinder was used to estimate distances for discharge measurements and to aid in navigation. An electrical generator was used to supply power to the laptop computer, the monitor, and 12-volt battery chargers. Ancillary equipment to be used with ADCPs when collecting data is shown in Mueller and others (2013).
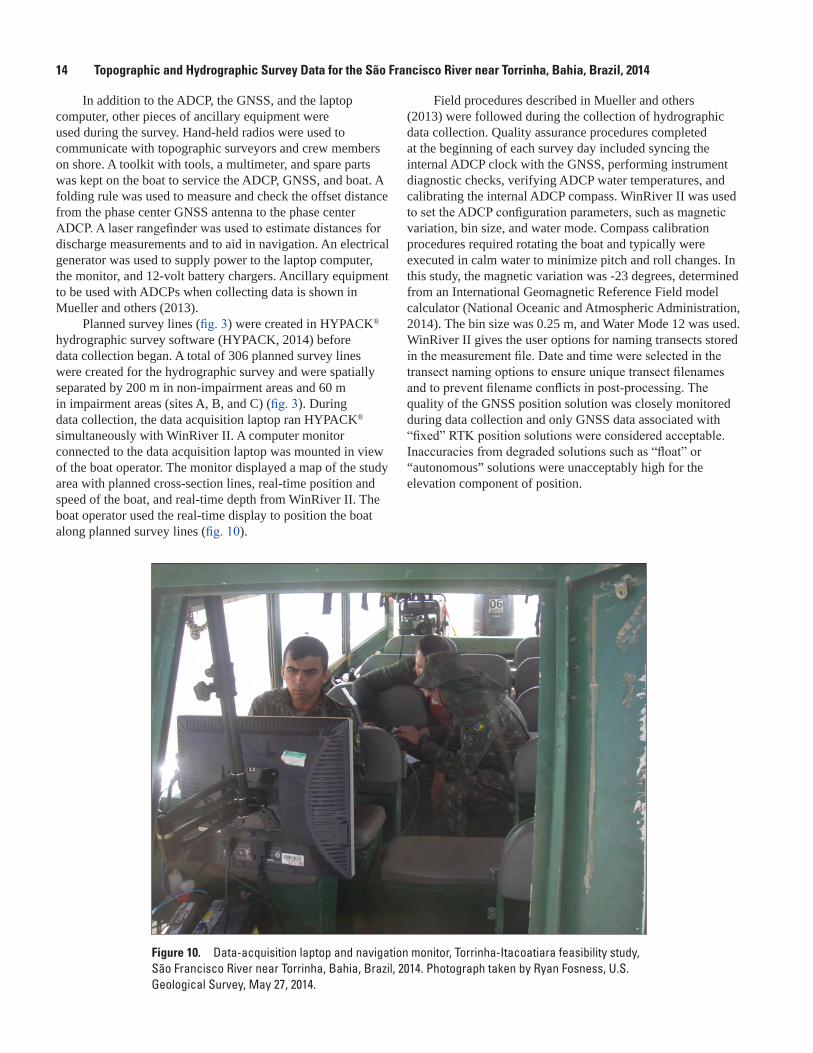
Planned survey lines (fig. 3) were created in HYPACK® hydrographic survey software (HYPACK, 2014) before data collection began. A total of 306 planned survey lines were created for the hydrographic survey and were spatially separated by 200 m in non-impairment areas and 60 m in impairment areas (sites A, B, and C) (fig. 3). During data collection, the data acquisition laptop ran HYPACK® simultaneously with WinRiver II. A computer monitor connected to the data acquisition laptop was mounted in view of the boat operator. The monitor displayed a map of the study area with planned cross-section lines, real-time position and speed of the boat, and real-time depth from WinRiver II. The boat operator used the real-time display to position the boat along planned survey lines (fig. 10).
Field procedures described in Mueller and others (2013) were followed during the collection of hydrographic data collection. Quality assurance procedures completed at the beginning of each survey day included syncing the internal ADCP clock with the GNSS, performing instrument diagnostic checks, verifying ADCP water temperatures, and calibrating the internal ADCP compass. WinRiver II was used to set the ADCP configuration parameters, such as magnetic variation, bin size, and water mode. Compass calibration procedures required rotating the boat and typically were executed in calm water to minimize pitch and roll changes. In this study, the magnetic variation was -23 degrees, determined from an International Geomagnetic Reference Field model calculator (National Oceanic and Atmospheric Administration, 2014). The bin size was 0.25 m, and Water Mode 12 was used. WinRiver II gives the user options for naming transects stored in the measurement file. Date and time were selected in the transect naming options to ensure unique transect filenames and to prevent filename conflicts in post-processing. The quality of the GNSS position solution was closely monitored during data collection and only GNSS data associated with “fixed” RTK position solutions were considered acceptable. Inaccuracies from degraded solutions such as “float” or “autonomous” solutions were unacceptably high for the elevation component of position.
Figure 10. Data-acquisition laptop and navigation monitor, Torrinha-Itacoatiara feasibility study, São Francisco River near Torrinha, Bahia, Brazil, 2014. Photograph taken by Ryan Fosness, U.S. Geological Survey, May 27, 2014.

Topographic and Hydrographic Geospatial Data 15
Hydrographic data were recorded in WinRiver II as a measurement file, which records all transect data, configuration information, and quality assurance and quality control. A transect began when the boat was positioned at the intersection of a planned line nearest to the riverbank. The boat operator would navigate the boat along the planned line across the river channel at speeds at or near the water speed, avoiding sharp changes in speed or direction. At the opposite bank, data recording was stopped (end of transect), and the boat would move to the next planned line. In some cases, data were collected longitudinally along the bank as the boat was repositioned to the next planned line. Separate raw ADCP data and GNSS navigation data file were recorded for each transect. Typically, a new WinRiver II measurement file was started at the beginning of the day, if computer performance was affected by file size, or after the equipment was restarted in the middle of the day.
An instantaneous discharge measurement was obtained near the middle of the study reach on June 10, 2015. The instantaneous discharge was measured in the main channel and the east side channel to capture the total streamflow of the São Francisco River (fig. 3). The standard discharge measurement using a boat-mounted ADCP described in Mueller and others (2013) were followed to complete the measurements.
Non-standard techniques were required to post-process the hydrographic data from depth to a riverbed elevation and summarize the depth averaged velocity. The USGS software, Velocity Mapping Toolbox (VMT) (Parsons and others, 2013), was used to read and process the raw WinRiver II files. Bathymetric and velocity data were processed separately using the same general procedure. A complete and detailed step-by-step procedure for post-processing raw hydrographic data is provided in appendix A. The general procedures used to process and convert the hydrographic data to riverbed elevations and depth-averaged velocity is summarized below.
• Reviewed WinRiver II files and removed erroneous data;
• Output all data from WinRiver II to ASCII text;
• Processed four-beam bathymetry and depth-averaged velocity in the Velocity Mapping Toolbox (VMT);
• Correlated GNSS data (time-based syncing) to four-beam bathymetry;
• Transformed geographic CRS from WGS84 to SIRGAS 2000;
• Shifted GNSS coordinates (ultra-rapid to final);
• Projected SIRGAS 2000 coordinates to UTM Zone 23 South;
• Calculated the elevation using the MAPGEO2010 local geoid model;
• Summarized distribution of bathymetry and velocity data.
The ADCP measurement, quality assurance, and quality-control procedures followed those described in Mueller and others (2013). Routines in WinRiver II estimate discharge in unmeasured parts of a river cross section including near the transducer face, near the bottom, and near the riverbanks. The blanking distance, or portion of the water column below the transducer face not measured, was set to 0.25 m as typically assigned for 1,200 kHz Rio Grande units. Similarly, unmeasured portions of the cross section near the riverbed were estimated using the WinRiver II power curve extrapolation function and a coefficient determined in the software program “extrap” (Mueller, 2013). Near the banks, unmeasured portions of the cross section were estimated based on an assumption of triangular bank type and distances measured using a laser rangefinder. For the instantaneous discharge measurement, the average of four reciprocal passes across the channel, with a total measurement exposure time greater than 12 minutes U.S. Geological Survey, 2011), was used to represent the discharge.
Topographic and Hydrographic Geospatial Data
Final coordinates for primary bench marks are presented in both geographic and projected coordinate reference systems (table 2). Geographic coordinates are in SIRGAS 2000 (reference epoch: 2000.4). Projected coordinates are in UTM Zone 23 South (SIRGAS 2000 datum). Primary bench mark error represents the positional uncertainty calculated in the network adjustment. Reference bench marks describe the shifted topographic survey observed control point coordinates. The reference bench marks were not network adjusted; therefore, error estimates were not calculated.
Topographic and hydrographic geospatial data are published in compressed ESRI® shapefile vector format (Earth Systems Research Institute, 2012). The shapefile format maintains the attributes, coordinate reference system and metadata and can be used in a wide variety of geographic information system (GIS) software products. Topographic and hydrographic data are published in three metadata files representing the Torrinha-Itacoatiara study reach (table 3). The metadata links in table 3 provide direct links to the metadata files describing the identification, data quality, spatial data organization and reference, entity and attribute, distribution, and metadata reference information. The metadata file also includes a preview image and link to the compressed shapefile. The preview image link in table 3 provides a preview of the completed dataset. The compressed shapefile links also are provided in table 3. The metadata file should be referenced for a complete description of both the methods used to create the file and the data.

16 Topographic and Hydrographic Survey Data for the São Francisco River near Torrinha, Bahia, Brazil, 2014
Table 2. Primary benchmark coordinates for topographic and hydrographic surveys for the Torrinha-Itacoatiara feasibility study, São Francisco River near Torrinha, Bahia, Brazil, 2014.
[Bench mark identification: Manually post-processed baselines to a fully constrained network adjustment. Projected coordinates: Projected in SIRGAS 2000 datum. Abbreviations: SIRGAS, Geodetic Reference System for the Americas; UTM, Universal Transverse Mercator; dd, decimal degrees; m, meters]
Bench mark identification
Geographic coordinates (SIRGAS 2000)
Projected coordinates (UTM Zone 23 South)
Error (95-percent confidence interval)
Latitude (dd)
Longitude (dd)
Ellipsoid height
(m)
Northing (m)
Easting (m)
Elevation (m)
Northing (m)
Easting (m)
Elevation (m)
RSF1 -11.471 -43.258 392.029 8731359.18 690055.705 408.381 0.006 0.006 0.011RSF2 -11.426 -43.24 391.101 8736286.358 692013.785 407.456 0.005 0.006 0.008
tac15-1015_fig11
0
500
1,000
1,500
2,000
2,500
3,000
3,500
4,000
4,500
5,000
393 394 395 396 397 398 399 400 401 402 403 0
10
20
30
40
50
60
70
80
90
100
Num
ber o
f bat
hym
etric
poi
nts
Cum
ulat
ive
perc
ent o
f bat
hym
etric
poi
nts
low
er th
an in
dica
ted
elev
atio
n
Elevation, in meters, based on the MAPGEO2010 model
EXPLANATION
Number of bathymetric points
Cumulative percent
Figure 11. Distribution of elevations surveyed using an acoustic Doppler current profiler near Torrinha and Itacoatiara, Bahia, Brazil, May 22–June 10, 2015.
The frequency distribution of elevations measured during the hydrographic survey is shown in figure 11. The minimum orthometric elevation observed during the study was 393.5 m and was associated with a deep area on the left bank of the main channel 4 km upstream of the downstream end of the
study reach. Sandbars were present along the eastern side of the main channel near the deep area. The maximum elevation observed during the study was 402.1 m and corresponds to the shallowest depths surveyed during the study.

Topographic and Hydrographic Geospatial Data 17
Table 3. Metadata, preview illustrations, and compressed geospatial data sets for the Torrinha-Itacoatiara feasibility study, São Francisco River near Torrinha, Bahia, Brazil, 2014.
Geospatial data type
Preview images and metadata
Topographic SFR_Topography_2014 [GIS data]
Hydrographic SFR_Bathymetry_2014 [GIS data]
SFR_Velocity_2014 [GIS data]

18 Topographic and Hydrographic Survey Data for the São Francisco River near Torrinha, Bahia, Brazil, 2014
Streamflow Measurement DataInstantaneous discharge was measured on June 10, 2014
in the main channel in the side channel of the São Francisco River near the downstream extent of Grande do Pecado Island (fig. 3). Measured instantaneous discharge was 672 m3/s in the main channel and 97 m3/s in the side channel of the São Francisco River (table 4). Total streamflow, estimated by summing the main and side-channel instantaneous discharges, was 769 m3/s—about 73 percent lower than the mean annual streamflow (2,846 m3/s) and about 30 percent lower than the 90-percent exceedance probability streamflow (1,086 m3/s) (Company for Development of the São Francisco and Parnaíba River Valleys and U.S. Army Corps of Engineers, 2014;
National Water Agency, 2015). The stability of the channel bed in both measured areas generally was firm and predominantly sand substrate. In the main channel of the São Francisco River, the left-bank (western) two-thirds of the cross sections typically ranged in depth from about 1.8 to 2.8 m and comprised about 50 percent of the total flow, whereas depths in the right-bank (eastern) third typically ranged from 2.8 to 5.8 m. In the side channel of the São Francisco River, the cross section typically ranged in depth from about 2.5 to 4.0 m, and velocity in the side channel generally was greater near the middle of the cross section than near the banks. At both locations, the vertical velocity distribution predominantly matched a standard depth-velocity distribution profile from the water surface to the riverbed.
Table 4. Summary of discharge measurement, São Francisco River near Grande do Pecado Island, Bahia, Brazil, June 10, 2014.
[Abbreviations: SIRGAS 2000, Geocentric Reference System for the Americas; m, meter; m2, square meters; s, second; m3/s, cubic meters per second; UTC, Coordinated Universal Time]
Latitude (SIRGAS 2000)
Longitude (SIRGAS 2000)
Site identification
Measurement number
Date and time
Time zone code
Measurement duration
11° 28' 6.7'' S 43° 15' 33.5'' W 112807431533 1 06-10-14 15:30 UTC -3:00 0:1911° 28' 30.4’’ S 43° 15' 13.7'' W 112830431514 1 06-10-14 14:30 0:14
Latitude (SIRGAS 2000)
Longitude (SIRGAS 2000)
Site identification
Channel
NameFlow (m3/s)
Width (m)
Velocity (m/s)
Area (m2)
11° 28' 6.7'' S 43° 15' 33.5'' W 112807431533 Mainchannel
672 399 0.62 1,196
11° 28' 30.4'' S 43° 15' 13.7'' W 112830431514 Sidechannel
97 108 0.33 311
Quality Assurance and Quality Control 19
Quality Assurance and Quality ControlQuality assurance (QA) and quality control (QC)
procedures are necessary to maintain precision and achieve the highest degree of accuracy. A number of standardized processes were followed to ensure precision throughout the survey. A complete list of potential sources of GNSS errors and a list of quality assurance procedures considered for this study are described in Brazilian Institute of Geography and Statistics (2008) and Rydlund and Densmore (2012). Field activities were documented in a survey log that recorded all metadata such as equipment, antenna offsets, personnel, and quality control check shots, and other set-up information. Bench marks were constructed in open areas with minimal obstructions to reduce the chance for multipath error. A fixed height tripod was used to ensure consistent antenna height from the bench mark to the GNSS antenna, and multiple antenna heights were used throughout the survey. The base GNSS antenna was leveled at the beginning of the day, and verified at the end of the day. Static GNSS data were collected daily and post-processed to describe any variation in horizontal and vertical positioning.
Recording a check shot on the reference bench mark at the beginning and end of each day was a useful quality assurance method to determine if any errors had been introduced into the survey. The check shot was reviewed in the field to determine if any significant horizontal or vertical coordinate shifts occurred.
Procedures in Mueller and others (2013) were followed to provide quality assurance of hydrographic and discharge data. Each day, water temperature was measured with a calibrated thermometer and compared with temperatures reported by the ADCP to validate speed-of-sound readings. The offset between the ADCP phase center and the RTK-GPS antenna was measured and frequently verified. ADCP draft, instrument tests, beam checks, and calibrations of the ADCP compass were executed at the beginning of each day. During surveying, the boat was operated at a speed near or less than the water speed. Laser rangefinders were used to estimate unmeasured parts of the cross sections near banks.
Quality control measures were included for each component of the study and were designed to assess the quality of the survey. Static GNSS survey data were processed using IBGE-PPP (table 5) to document the daily post-processed horizontal and vertical positioning at each
primary bench mark (Brazilian Institute of Geography and Statistics, 2013). The IBGE-PPP data do not necessarily indicate that the physical horizontal and vertical coordinates changed on a daily basis, but rather reflect the variability in IBGE-PPP positioning techniques combined with equipment set-up error. The same equipment and offsets were used for most of the survey; therefore, human and introduced equipment set-up error was minimized.
RTK-GNSS horizontal and vertical positioning check shots were collected daily at each reference bench mark co-located with the primary base station (table 6). Each check shot was collected using the same methods as the data collected in the field for both the topographic and hydrographic surveys. A check shot was collected at the beginning of the day and compared to the recorded position. If the check shot was not within the error tolerance of the equipment, the base station was checked and the survey was restarted. A check shot also was collected at the end of the day to ensure the positioning was consistent throughout the day. The primary and reference bench marks used in this study remained stable for the duration of the study. However, the spatial positioning of the bench marks could change over time as a result of natural shifting of the tectonic plates and settling of the bench marks in the fine-grained soil.
Topographic and hydrographic data were collected to best represent the general pattern of the terrain. In certain instances, a tree or debris blocked the general terrain so the topography was surveyed slightly off the planned lines to best represent the general features of the terrain. In areas where riparian canopy or thick vegetation prevented the topography to be surveyed, the next available area upstream or downstream was surveyed instead of directly along the planned line. Shallow water prevented the collection of hydrographic data in some areas of the study reach. Particularly, a 3-km reach of a narrow side channel east of the main channel could not be surveyed because of extremely shallow water. For this reach of the side channel, it is possible that some deep pools may have been present but were not surveyed with the ADCP. In other areas of the study reach, large submerged bars limited access by boat. In these cases, it may be likely that the elevation was shallower than adjacent areas of the channel. Large spatial gaps in the bathymetric and velocity data should be evaluated on a case-by-case basis to avoid interpolating bed elevations that may not be representative.

20 Topographic and Hydrographic Survey Data for the São Francisco River near Torrinha, Bahia, Brazil, 2014Ta
ble
5.
Post
-pro
cess
ed s
tatic
glo
bal n
avig
atio
n sa
telli
te s
yste
ms
(GN
SS) o
bser
vatio
ns u
sing
Bra
zilia
n In
stitu
te o
f Geo
grap
hy a
nd S
tatis
tics
prec
ise
poin
t pos
ition
ing
(IBGE
PPP
) fo
r the
Tor
rinha
-Itac
oatia
ra fe
asib
ility
stu
dy, S
ão F
ranc
isco
Riv
er n
ear T
orrin
ha, B
ahia
, Bra
zil, 2
014.
[Ant
enna
hei
ght:
Ref
eren
ce to
bot
tom
of a
nten
na m
ount
; rec
eive
r and
ant
enna
type
R8
GN
SS/S
PS88
x In
tern
al. P
roje
cted
coo
rdin
ates
: Geo
id M
odel
MA
PGEO
2010
. Abb
revi
atio
ns: d
d, d
ecim
al d
egre
e; G
MT,
G
reen
wic
h M
ean
Tim
e; h
h:m
m:s
s, ho
urs:
min
utes
:sec
onds
; hr,
hour
s; m
, met
ers]
Poin
t id
entif
icat
ion
Star
t dat
e an
d tim
e (G
MT
-3 h
r)D
urat
ion
(hh:
mm
:ss)
Obs
er-
vatio
ns
used
File
nam
eA
nten
na
heig
ht
(m)
Solu
tion
type
Geo
grap
hic
coor
dina
tes
(SIR
GA
S 20
00)
Proj
ecte
d co
ordi
nate
s (U
TM Z
one
23 S
outh
)
Latit
ude
(d
d)Lo
ngitu
de
(dd)
Ellip
soid
he
ight
(m
)
Nor
thin
g (m
)Ea
stin
g (m
)El
evat
ion
(m)
RSF
1
Prim
ary
benc
h m
ark
05-2
1-14
04:5
7 p.
m.
2:01
:30
487
6616
1410
.T01
2.25
Fina
l-1
1.47
1063
89-4
3.25
7685
392.
0287
3135
9.17
869
0055
.731
408.
3705
-22-
1401
:46
p.m
.6:
04:3
01,
459
6400
1421
.T02
2.25
Fina
l-1
1.47
1063
78-4
3.25
7685
2839
2.01
8731
359.
190
6900
55.7
0140
8.36
05-2
3-14
12:0
7 p.
m.
6:36
:45
1,58
864
0014
31.T
022.
25Fi
nal
-11.
4710
6369
-43.
2576
8531
391.
9887
3135
9.20
069
0055
.698
408.
3305
-24-
1412
:07
p.m
.7:
05:4
51,
704
6400
1441
.T02
2.05
Fina
l-1
1.47
1063
86-4
3.25
7685
1139
1.99
8731
359.
181
6900
55.7
1940
8.34
06-0
6-14
11:3
2 p.
m.
7:50
:00
1,88
164
0015
70.T
022.
05Fi
nal
-11.
4710
6353
-43.
2576
8494
391.
9987
3135
9.21
869
0055
.737
408.
3406
-09-
1412
:07
p.m
.7:
07:1
51,
710
6400
1600
.T02
2.05
Fina
l-1
1.47
1063
69-4
3.25
7685
0639
2.02
8731
359.
200
6900
55.7
2540
8.37
06-1
0-14
01:0
1 p.
m.
5:15
:00
1,26
164
0016
10.T
022.
05Fi
nal
-11.
4710
6369
-43.
2576
8519
392.
0487
3135
9.20
069
0055
.710
408.
39
Poin
t id
entif
icat
ion
Star
t dat
e an
d tim
e
(GM
T -3
hr)
Dur
atio
n (h
h:m
m:s
s)
Obs
er-
vatio
ns
used
File
nam
eA
nten
na
heig
ht
(m)
Solu
tion
type
95-p
erce
nt c
onfid
ence
inte
rval
Nor
thin
g (m
)Ea
stin
g (m
)El
evat
ion
(m)
RSF
1
Prim
ary
benc
h m
ark
05-2
1-14
04:5
7 p.
m.
2:01
:30
487
6616
1410
.T01
2.25
Fina
l0.
008
0.04
40.
033
05-2
2-14
01:4
6 p.
m.
6:04
:30
1,45
964
0014
21.T
022.
25Fi
nal
0.00
40.
019
0.02
505
-23-
1412
:07
p.m
.6:
36:4
51,
588
6400
1431
.T02
2.25
Fina
l0.
003
0.01
10.
016
05-2
4-14
12:0
7 p.
m.
7:05
:45
1,70
464
0014
41.T
022.
05Fi
nal
0.00
30.
014
0.01
706
-06-
1411
:32
p.m
.7:
50:0
01,
881
6400
1570
.T02
2.05
Fina
l0.
008
0.03
90.
038
06-0
9-14
12:0
7 p.
m.
7:07
:15
1,71
064
0016
00.T
022.
05Fi
nal
0.00
20.
005
0.00
906
-10-
1401
:01
p.m
.5:
15:0
01,
261
6400
1610
.T02
2.05
Fina
l0.
002
0.00
70.
011

Quality Assurance and Quality Control 21Ta
ble
5.
Post
-pro
cess
ed s
tatic
glo
bal n
avig
atio
n sa
telli
te s
yste
ms
(GN
SS) o
bser
vatio
ns u
sing
Bra
zilia
n In
stitu
te o
f Geo
grap
hy a
nd S
tatis
tics
prec
ise
poin
t pos
ition
ing
(IBGE
PPP
) fo
r the
Tor
rinha
-Itac
oatia
ra fe
asib
ility
stu
dy, S
ão F
ranc
isco
Riv
er n
ear T
orrin
ha, B
ahia
, Bra
zil, 2
014.
—Co
ntin
ued
Poin
t ID
Star
t dat
e an
d tim
e (G
MT
-3 h
r)D
urat
ion
(hh:
mm
:ss)
Obs
er-
vatio
ns
used
File
nam
eA
nten
na
heig
ht
(m)
Solu
tion
type
Geo
grap
hic
coor
dina
tes
(SIR
GA
S 20
00)
Proj
ecte
d co
ordi
nate
s (U
TM Z
one
23 S
outh
)
Latit
ude
(d
d)Lo
ngitu
de
(dd)
Ellip
soid
he
ight
(m
)
Nor
thin
g (m
)Ea
stin
g (m
)El
evat
ion
(m)
RSF
2
Prim
ary
Ben
ch
Mar
k
05-2
1-14
0424
p.m
.2:
04:1
549
849
1414
10.T
021.
685
Fina
l-1
1.42
6417
31-4
3.24
0016
1739
1.12
8736
286.
359
6920
13.7
7040
7.48
05-2
6-14
11:2
9 a.
m.
7:45
:45
1,86
464
0014
60.T
022.
05Fi
nal
-11.
4264
1728
-43.
2400
1617
391.
0787
3628
6.36
269
2013
.770
407.
4305
-27-
1411
:07
a.m
.7:
48:4
51,
876
6400
1470
.T02
2.05
Fina
l-1
1.42
6417
33-4
3.24
0016
3339
1.10
8736
286.
356
6920
13.7
5240
7.46
05-2
8-14
11:1
7 a.
m.
7:54
:15
1,89
864
0014
80.T
022.
05Fi
nal
-11.
4264
1739
-43.
2400
1639
1.12
8736
286.
349
6920
13.7
8840
7.48
05-2
9-14
11:0
6 a.
m.
4:12
:30
1,01
164
0014
90.T
022.
05Fi
nal
-11.
4264
1722
-43.
2400
1631
391.
1387
3628
6.36
869
2013
.755
407.
4905
-30-
1412
:27
p.m
.6:
59:4
51,
680
6400
1501
.T02
2.05
Fina
l-1
1.42
6417
39-4
3.24
0016
1939
1.12
8736
286.
349
6920
13.7
6740
7.48
05-3
1-14
11:3
3 a.
m.
7:49
:30
1,87
964
0015
10.T
022.
05Fi
nal
-11.
4264
1717
-43.
2400
1608
391.
1387
3628
6.37
469
2013
.780
407.
4906
-02-
1411
:24
a.m
.7:
52:4
51,
892
6400
1530
.T02
2.05
Fina
l-1
1.42
6417
17-4
3.24
0015
9739
1.09
8736
286.
374
6920
13.7
9240
7.45
06-0
3-14
11:2
0 a.
m.
3:06
:45
748
6400
1540
.T02
2.05
Fina
l-1
1.42
6417
25-4
3.24
0015
8139
1.10
8736
286.
365
6920
13.8
1040
7.46
06-0
3-14
02:2
9 a.
m.
4:26
:00
1,06
564
0015
41.T
022.
05Fi
nal
-11.
4264
1731
-43.
2400
1608
391.
1387
3628
6.35
969
2013
.779
407.
4906
-04-
1411
:23
a.m
.5:
25:0
01,
301
6400
1550
.T02
2.05
Fina
l-1
1.42
6417
31-4
3.24
0016
1939
1.21
8736
286.
359
6920
13.7
6740
7.57
06-0
4-14
04:5
3 p.
m.
2:14
:45
540
6400
1551
.T02
2.05
Fina
l-1
1.42
6417
31-4
3.24
0016
6939
1.09
8736
286.
359
6920
13.7
1340
7.45
06-0
7-14
11:3
3 a.
m.
7:09
:30
1,71
964
0015
80.T
022.
05Fi
nal
-11.
4264
1733
-43.
2400
1642
391.
0987
3628
6.35
669
2013
.743
407.
45
Poin
t ID
Star
t dat
e an
d tim
e (G
MT
-3 h
r)D
urat
ion
(hh:
mm
:ss)
Obs
er-
vatio
ns
used
File
nam
eA
nten
na
heig
ht
(m)
Solu
tion
type
95-p
erce
nt c
onfid
ence
inte
rval
Nor
thin
g (m
)Ea
stin
g (m
)El
evat
ion
(m)
RSF
2
Prim
ary
Ben
ch
Mar
k
05-2
1-14
0424
p.m
.2:
04:1
549
849
1414
10.T
021.
685
Fina
l0.
010
0.03
60.
051
05-2
6-14
11:2
9 a.
m.
7:45
:45
1,86
464
0014
60.T
022.
05Fi
nal
0.00
40.
013
0.01
805
-27-
1411
:07
a.m
.7:
48:4
51,
876
6400
1470
.T02
2.05
Fina
l0.
006
0.02
10.
024
05-2
8-14
11:1
7 a.
m.
7:54
:15
1,89
864
0014
80.T
022.
05Fi
nal
0.00
20.
010
0.01
205
-29-
1411
:06
a.m
.4:
12:3
01,
011
6400
1490
.T02
2.05
Fina
l0.
004
0.02
00.
024
05-3
0-14
12:2
7 p.
m.
6:59
:45
1,68
064
0015
01.T
022.
05Fi
nal
0.00
30.
009
0.01
505
-31-
1411
:33
a.m
.7:
49:3
01,
879
6400
1510
.T02
2.05
Fina
l0.
001
0.00
50.
009
06-0
2-14
11:2
4 a.
m.
7:52
:45
1,89
264
0015
30.T
022.
05Fi
nal
0.00
10.
004
0.00
806
-03-
1411
:20
a.m
.3:
06:4
574
864
0015
40.T
022.
05Fi
nal
0.00
40.
011
0.01
606
-03-
1402
:29
a.m
.4:
26:0
01,
065
6400
1541
.T02
2.05
Fina
l0.
002
0.00
80.
011
06-0
4-14
11:2
3 a.
m.
5:25
:00
1,30
164
0015
50.T
022.
05Fi
nal
0.01
20.
059
0.05
906
-04-
1404
:53
p.m
.2:
14:4
554
064
0015
51.T
022.
05Fi
nal
0.02
40.
080
0.08
006
-07-
1411
:33
a.m
.7:
09:3
01,
719
6400
1580
.T02
2.05
Fina
l0.
003
0.00
90.
016

22 Topographic and Hydrographic Survey Data for the São Francisco River near Torrinha, Bahia, Brazil, 2014
Table 6. Daily quality assurance and quality control for reference bench marks for the Torrinha-Itacoatiara feasibility study, São Francisco River near Torrinha, Bahia, Brazil, 2014.
[Projected coordinates: Projected in SIRGAS 2000 datum. Abbreviations: dd, decimal degrees; m, meters; RMS, Root Mean Square]
Bench mark identification
Date Reference
Geographic coordinates (SIRGAS 2000)
Projected coordinates (UTM Zone 23 South)
95-percent confidence interval
Latitude (dd)
Longitude (dd)
Ellipsoid (m)
Northing (m)
Easting (m)
Elevation (m)
RMSHorizontal precision
(m)
Vertical precision
(m)
RSF 1 Reference bench mark
05-22-14 Beginning -11.471 -43.257 390.83 8731328.896 690122.745 407.18 0.003 0.007 0.01End -11.471 -43.257 390.83 8731328.889 690122.73 407.18 0.004 0.005 0.01
05-23-14 Beginning -11.471 -43.257 390.84 8731328.888 690122.738 407.19 0.003 0.005 0.01End -11.471 -43.257 390.83 8731328.874 690122.754 407.18 0.003 0.006 0.01
05-24-14 Beginning -11.471 -43.257 390.87 8731328.901 690122.732 407.22 0.003 0.005 0.01End -11.471 -43.257 390.84 8731328.904 690122.739 407.19 0.003 0.02 0.03
06-06-14 Beginning -11.471 -43.257 390.82 8731328.876 690122.75 407.18 0.002 0.005 0.009End -11.471 -43.257 390.82 8731328.874 690122.738 407.17 0.002 0.009 0.01
06-09-14 Beginning -11.471 -43.257 390.83 8731328.882 690122.768 407.18 0.003 0.01 0.02End -11.471 -43.257 390.82 8731328.887 690122.765 407.17 0.002 0.008 0.01
06-10-14 Beginning -11.471 -43.257 390.82 8731328.896 690122.765 407.17 0.003 0.006 0.01End -11.471 -43.257 390.84 8731328.876 690122.746 407.19 0.003 0.02 0.03
RSF 2 Reference bench mark
05-26-14 Beginning -11.426 -43.240 390.97 8736309.727 692045.198 407.33 0.003 0.01 0.03End -11.426 -43.240 390.98 8736309.713 692045.205 407.33 0.003 0.01 0.02
05-27-14 Beginning -11.426 -43.240 390.98 8736309.718 692045.218 407.34 0.003 0.01 0.04End -11.426 -43.240 390.97 8736309.714 692045.228 407.33 0.003 0.005 0.009
05-28-14 Beginning -11.426 -43.240 390.99 8736309.735 692045.211 407.35 0.002 0.005 0.01End -11.426 -43.240 390.97 8736309.724 692045.227 407.33 0.003 0.01 0.02
05-29-14 Beginning -11.426 -43.240 390.96 8736309.705 692045.238 407.32 0.002 0.007 0.01End -11.426 -43.240 390.98 8736309.704 692045.233 407.33 0.0 0.0 0.0
05-30-14 Beginning -11.426 -43.240 390.98 8736309.731 692045.254 407.34 0.002 0.01 0.02End -11.426 -43.240 390.97 8736309.725 692045.241 407.33 0.003 0.01 0.03
05-31-14 Beginning -11.426 -43.240 390.98 8736309.692 692045.239 407.34 0.003 0.01 0.02End -11.426 -43.240 390.98 8736309.716 692045.228 407.33 0.002 0.008 0.01
06-02-14 Beginning -11.426 -43.240 390.98 8736309.689 692045.212 407.33 0.002 0.008 0.0106-03-14 Beginning -11.426 -43.240 390.99 8736309.728 692045.193 407.34 0.004 0.005 0.01
End -11.426 -43.240 390.97 8736309.721 692045.187 407.33 0.002 0.007 0.0106-04-14 Beginning -11.426 -43.240 390.98 8736309.723 692045.243 407.34 0.004 0.02 0.03
End -11.426 -43.240 390.98 8736309.718 692045.233 407.34 0.002 0.004 0.00906-07-14 Beginning -11.426 -43.240 390.98 8736309.728 692045.229 407.34 0.004 0.01 0.03
End -11.426 -43.240 390.97 8736309.704 692045.22 407.33 0.003 0.01 0.02

References Cited 23
SummaryNavigable inland waterways, including lakes, rivers, and
reservoirs, are important transportation routes for people and goods in Brazil. Natural and anthropogenic effects coupled with recent severe droughts have led to decreased inland waterway navigation. The Company for Development of the São Francisco and Parnaíba River Valleys (CODEVASF) has recognized the decrease in waterway navigation and is investing resources to help restore selected reaches of the São Francisco River for navigation. In 2011, CODEVASF signed an agreement with the U.S. Army Corps of Engineers (USACE) seeking technical assistance and engineering expertise in waterway navigation and bank stabilization. The Torrinha-Itacoatiara study reach near Torrinha, Bahia, was 1 of 12 conceptual feasibility studies identified by USACE and CODEVASF and is the focus of the study described in this report. USACE and CODEVASF used previously collected topographic and hydrographic surveys to develop a two-dimensional hydrodynamic model to simulate the existing channel and the channel under various reconstruction scenarios. Based on the modeling results, select areas in the Torrinha-Itacoatiara study reach were scoped by USACE and CODEVASF for dredging and channel construction, including the installation of channel cutoffs and spur dikes. However, the methods and accuracy of the data previously collected by CODEVASF and the associated geospatial references were undocumented. An updated and refined survey was desired to provide better resolution to improve the hydrodynamic models. In May and June 2014, the USGS, in cooperation with the USACE and CODEVASF, collected topographic and hydrographic data that will be used to develop and update the hydrodynamic models and aid in the design of river restoration and construction projects.
This report presented the results of a study to collect, process, and disseminate topographic and hydrographic data in the Torrinha-Itacoatiara study reach on the São Francisco River near Torrinha, Bahia, Brazil. The extent of the survey included planned channel reconstruction areas and existing two-dimensional hydrodynamic modeling extent in the feasibility study reach. This report also presented the surveying and data-processing techniques and methods. Additional discussion described the quality-assurance and quality control procedures used in this study along with the limitations for the Torrinha-Itacoatiara project data.
Survey control bench marks were constructed to define the horizontal and vertical coordinates in the study area. A topographic survey extended elevation data from hydrographic survey to the top of the riverbank. The hydrographic survey included riverbed elevation, depth-averaged velocity, and two instantaneous discharge measurements. Topographic and hydrographic data were collected along narrowly spaced intervals in the planned channel reconstruction areas of the project extent to capture the hydraulic and geomorphological characteristics of the river. Outside of the planned channel reconstruction areas, hydrographic and topographic transects
were surveyed at coarser spacing in the study area. All standard and non-standard data collection, processing, quality assurance, quality control methods, and results were documented. The topographic and hydrographic geospatial data were published in three separate metadata files. Each metadata file contains a full description of the data, preview image, and link to the data in compressed data format.
AcknowledgmentsThe authors would like to thank the Brazilian
Army for providing generous accommodations and warm hospitality for the duration of the survey. Special acknowledgment is extended to Lieutenant Victor H. Brizueña, J. Leôncio do N. Silva, Marisérgio S. Lopes, Cristiano da S. Batista, and A. Temótio de Oliveira for their translation, assistance with topographic and hydrographic data collection, boat piloting, and tremendous logistical support. The authors also would like to thank Rafael Siqueira Brito (CODEVASF), Robert Mrse and Calvin Creech (USACE), and the USGS Georgia Water Science Center for providing valuable logistical support.
References Cited
Administration of the Waterways of the São Francisco, 2015a: Administration of the Waterways of the São Francisco, accessed February 2015, at http://www.ahsfra.gov.br/?op=conteudo&id=133&menuId=165.
Administration of the Waterways of the São Francisco, 2015b, Transport: Administration of the Waterways of the São Francisco, accessed February 2015, at http://www.ahsfra.gov.br/?op=conteudo&id=138&menuId=170.
Brazilian Institute of Geography and Statistics, 2007, Instructions for approval stations established by other institutions: Directorate of Geosciences, Geodesy Coordination, Rio de Janeiro, 10 p., accessed April 2009, at ftp://geoftp.ibge.gov.br/documentos/geodesia/pdf/homologacao_de_marcos.pdf.
Brazilian Institute of Geography and Statistics, 2008, Recommendations for relative static GPS surveys: Directorate of Geosciences, Geodesy Coordination, Rio de Janeiro, 35 p., accessed April 2014, at ftp://geoftp.ibge.gov.br/documentos/geodesia/pdf/recom_gps_internet.pdf.
Brazilian Institute of Geography and Statistics, 2013, IBGE-PPP online application user manual: Directorate of Geosciences, Geodesy Coordination, Rio de Janeiro, December 2013, 33 p., accessed April 2014, at http://www.ibge.gov.br/home/geociencias/geodesia/ppp/manual_ppp.pdf.

24 Topographic and Hydrographic Survey Data for the São Francisco River near Torrinha, Bahia, Brazil, 2014
Brazilian Institute of Geography and Statistics, 2015, Geoid undulation model: Directorate of Geosciences, Geodesy Coordination, Rio de Janeiro, accessed January 2015, at http://www.ibge.gov.br/english/geociencias/geodesia/modelo_geoidal.shtm.
Company for Development of the São Francisco and Parnaíba River Valleys, 2006, About CODEVASF: Company for Development of the São Francisco and Parnaíba River Valleys, accessed January 2015, at http://www.codevasf.gov.br/principal/promocao-e-divulgacao/eurocentro/download/aboutcodevasf.ppt/view.
Company for Development of the São Francisco and Parnaíba River Valleys, 2014a, Mission and vision of the future: Company for Development of the São Francisco and Parnaíba River Valleys, accessed January 2015, at http://www2.codevasf.gov.br/empresa/missao.
Company for Development of the São Francisco and Parnaíba River Valleys, 2014b, Operating areas: Company for Development of the São Francisco and Parnaíba River Valleys, accessed January 2015, at http://www2.codevasf.gov.br/osvales.
Company for Development of the São Francisco and Parnaíba River Valleys and U.S. Army Corps of Engineers, 2014, Torrinha-Itacoatiara task 3 report–Project development (feasibility study): Brasília, Federal District and Mobile, Alabama, 108 p.
Earth Systems Research Institute, 2012, ArcGIS™ Desktop—Release 10.1 Service Pack 1: Redlands, California, Earth Systems Research Institute.
Henning, W., 2011, User guidelines for single base real time GNSS Positioning (version 2.1): National Geodetic Survey, 131 p.
HYPACK, 2014, HYPACK User Manual: Middletown, Connecticut, HYPACK, Inc., accessed April 2014, at ftp://ftp.hypack.com/Documents/Manuals/English/HYPACK%20Manual/2014%20Release/2014%20Release.pdf.
International Association of Oil and Gas Producers, 2012, Surveying and positioning guidance note number 7, part 1, using the EPSG geodetic parameter dataset (version 8): International Association of Oil and Gas Producers Publication 373-7-1, 41 p.
Junqueira, R.A., 2002, Activity 2.2 C—Multitemporal analysis of the dynamic of alteration of the conformation of the São Francisco Riverbed–Middle reach, executive summary of the final report: Company for the Development of the Valleys of the São Francisco and Paraiba Rivers, Ministry of Regional Integration, 71 p.
Mueller, D.S., 2013, extrap–Software to assist the selection of extrapolation methods for moving-boat ADCP streamflow measurements: Computers and Geosciences, v. 54, 2013, p. 211–218, http://dx.doi.org/10.1016/j.cageo.2013.02.001.
Mueller, D.S., Wagner, C.R., Rehmel, M.S., Oberg, K.A,, and Rainville, Francois, 2013, Measuring discharge with acoustic Doppler current profilers from a moving boat (ver. 2.0): U.S. Geological Survey Techniques and Methods, book 3, chap. A22, 95 p., http://dx.doi.org/10.3133/tm3A22.
National Oceanic and Atmospheric Administration, 2014, Magnetic fields calculators: National Oceanic and Atmospheric Administration, accessed January 29, 2014, at http://www.ngdc.noaa.gov/geomag-web/.
National Water Agency, 2015, Hydrographic region of São Francisco: National Water Agency, Brasilia, Federal District, accessed January 2015, at http://www2.ana.gov.br/Paginas/portais/bacias/SanFrancisco.aspx.
Parsons, D.R., Jackson, P.R., Czuba, J.A., Oberg, K.A., Mueller, D.S., Rhoads, B., Best, J.L., Johnson, K.K., Engel, F., and Riley, J., 2013, Velocity Mapping Toolbox (VMT)—A processing and visualization suite for moving-vessel ADCP measurements: Earth Surface Processes and Landforms, v. 38, no. 11, p 1,244–1,260, doi: 10.1002/esp.3367.
Rydlund, P.H., Jr., and Densmore, B.K., 2012, Methods of practice and guidelines for using survey grade global navigation satellite systems (GNSS) to establish vertical datum in the United States Geological Survey: U.S. Geological Survey Techniques and Methods, book 11, chap. D1, 102 p. plus appendixes.
Strategic Action Program, 2004, Strategic Action Program for integrated management of the São Francisco River Basin and its coastal zone: Brasilia, Federal District, TDA Desenho and Arte Ltda., Final report, 336 p., ISBN 85-98276-02-2.
Teledyne RD Instruments, 2013, WinRiver II Software User’s Guide: San Diego, California, Teledyne RD Instruments, Inc., P/N 957–6231–00, 208 p. plus appendences.
Teledyne RD Instruments, 2014, Workhorse Rio Grande ADCP: San Diego, California, Teledyne RD Instruments, Inc., accessed December 15, 2014, at http://www. rdinstruments.com/datasheets/rio_grande_ds_lr.pdf.
Trimble Navigation Limited, 2003, Real-time kinematic surveying training guide: Westminster, Colorado, Trimble® Navigation Limited, Part no. 33142-40, Revision D, 354 p.

References Cited 25
Trimble Navigation Limited, 2009, User Guide—Trimble® R8 GNSS Receiver Trimble R6/5800 GPS Receivers (ver. 4.00, revision A): Westminster, Colorado, Trimble® Navigation Limited, Engineering and Construction Group, 84 p.
Trimble Navigation Limited, 2014, Trimble Business Center software release notes, versions 3.22 (64-bit) and 2.98.1 (32-bit): Westminster, Colorado, Trimble® Navigation Limited, Geospatial Division. 8 p.
U.S. Geological Survey, 2011, Exposure time for ADCP moving-boat discharge measurements made during steady flow conditions: U.S. Geological Survey Office of Surface Water Technical Memorandum 2011.08, 4 p., accessed November 19, 2014, at https://hydroacoustics.usgs.gov/memos/OSW2011-08.pdf.
U.S. Army Corps of Engineers, 2013, Engineering and design—Hydrographic surveying: U.S. Army Corps of Engineers, Manual no. EM 1110–2–1003, 560 p.


Appendix A 27
Appendix A. Acoustic Doppler Current Profiler Post-Processing Tip SheetProcedures documented in Mueller and others (2013)
were followed when collecting data using an acoustic Doppler current profiler (ADCP) for the study described in this report. Appendix A documents the additional steps followed to process ADCP data to meet the goals of the study and serves as a guide for future data collection and processing.
Prior to post-processing, configuration offsets (ADCP transducer depth and magnetic variation), clock settings, internal ADCP tests, and calibrations for each measurement file and corresponding transects were reviewed in WinRiverII software. Transects were reprocessed using GGA as the navigational reference (instead of the default bottom-tracking) to remove poor-quality GNSS data. The reviewed WinRiver II measurement data were exported to “Classic” ASCII output data files (Teledyne RD Instruments, 2013). The ASCII transect files were output and copied to a single directory for efficient file access.
Bathymetric Survey Post-Processing
A batch processing routine in the USGS software Velocity Mapping Toolbox (VMT) version 4.06 (Parsons and others, 2013) was used to extract bathymetric data derived from each of the four ADCP beams. VMT corrects adjusts the 20° beam angle for each of the four beams, resulting in a corrected bathymetric depth for each beam. The unique cross-section number “XS Num” was assigned to each transect, and the batch job was saved to a Microsoft® Excel file. The horizontal grid node spacing was set to 1 m, and the water surface elevation was set to 0 m. The water-surface elevation was not used in the analysis because the GNSS rover provided a real-time elevation that was recorded in the navigation file. The depth to elevation correction is described in the following sections. The batch processing resulted in a bathymetry data file for each transect with fields containing ensemble number, easting, northing, depth (relative to the phase center of the ADCP head), date and time, heading, pitch, roll, and transect number. All transect files were then combined into a single “4-beam bathymetry” file containing four-beam bathymetry data for all transect files in the project. Because VMT did not offer a way to integrate all navigation data, a custom script was developed to extract horizontal and vertical position information from each of the WinRiver II navigation data files associated with each transect. The script located the GGA message (position information) preceding each instance of an RDENS message (ensemble information) and output a new
“positioning” ASCII file containing horizontal and vertical position information associated with each ADCP ensemble for each transect. The “4-beam bathymetry” file was joined to the “positioning” data file based on correlating date, time, and ensemble numbers. The resulting “4-beam 3D bathymetry” file contained both bathymetry and corresponding horizontal and vertical positioning data.
WGS84 latitude, longitude, and mean sea level (MSL) elevation coordinates output in the GGA message represent the coordinates at the phase center of the GNSS rover. MSL elevation was calculated internally based on a simplified default “global” geoid in the GNSS rover receiver and is not appropriate for large-scale (higher resolution) surveys. MSL elevation data were reduced to ellipsoid heights by adding message fields “geoid separation” to “MSL elevation” into a new attribute field “GNSS Ellipsoid Height” in the “4-beam 3D bathymetry” file (eqn. 1).
EHGNSS = MSLGNSS + Geoid (1)
where MSLGNSS = MSL elevation, phase center GNSS, Geoid = Geoid Separation, and EHGNSS = Ellipsoid Height, phase center GNSS.
An additional attribute field, “Riverbed Ellipsoid Height,” was created to reduce the GNSS ellipsoid height to the ellipsoid height of the riverbed. The riverbed ellipsoid height was calculated by subtracting the offset distance from the centroid, or “phase center.” of the GNSS antenna to the phase center ADCP to reduce the ellipsoid height to the ADCP phase center (eqn. 2). To reduce the ellipsoid height from the ADCP phase center to the riverbed, the depth (relative to the phase center of the ADCP head) was subtracted from the ADCP ellipsoid height.
EHRIVER = EHGNSS – (AO + D) (2)
where AO = Antenna Offset, phase center GNSS to
phase center ADCP, D = Depth (Phase center ADCP to riverbed [one
depth per beam]), EHRIVER = Ellipsoid Height, riverbed, and EHGNSS = Ellipsoid Height, Global Navigation
Satellite Systems.

28 Topographic and Hydrographic Survey Data for the São Francisco River near Torrinha, Bahia, Brazil, 2014
The new field represented the unadjusted (rapid-static) WGS84 geographic coordinates (latitude, longitude, and ellipsoid height) of the riverbed. Spatial data were transformed from the global geographic CRS WGS84 to the local geographic CRS SIRGAS 2000. The same coordinate shift used in the topographic survey (rapid-static to final adjustments computed for the RTK base station coordinates) was applied to the SIRGAS 2000 GCS coordinates using a GIS routine. Because the coordinate shift varied depending on the referenced primary bench mark, another database operation joined the bathymetric data to a database table containing RTK base station corrections based on date and time. The adjusted GCS horizontal coordinates (latitude/longitude) were projected to UTM zone 23 south coordinates using a GIS routine. The ellipsoid heights of the riverbed, required an additional offset to represent the riverbed as orthometric elevations. The MAPGEO2010 geoid model software version 1.0 (Brazilian Institute of Geography and Statistics, 2015) was used to create a localized geoid height grid. The grid was created by: 1. Generating an input file containing coordinate pairs
across the study area at a spacing of 110 m,
2. Using the MAPGEO2010 software tool to compute the geoid height for each coordinate pair, and
3. Interpolating a GIS grid from the coordinate pairs with geoid heights.
Across the study area, geoid values in the grid ranged from -16.37 to -16.32 m. A GIS routine was used to extract values from the localized geoid grid at the bathymetry point locations and to populate this value in a new field in the bathymetry database table. Lastly, the field representing the geoid value was subtracted from the field containing ellipsoid height values to create a new database field containing the orthometric elevations of the riverbed based on the MAPGEO2010 model. Four fields from the bathymetry database table were exported to a final comma-separated file: X, Y, ellipsoid height of the riverbed, and orthometric elevation of the riverbed.
Velocity Mapping Post-Processing
Velocity data were post-processed using similar steps as those described previously for the bathymetry data. The
Velocity Mapping Toolbox (VMT) version 4.06 (Parsons and others, 2013) was used to compute a depth-averaged velocity for each ADCP ensemble. In the VMT user-interface, the “Batch Mode” option was selected to process multiple ASCII files exported from WinRiver II. In the batch mode interface, the batch job (comma spaced value file) created for the bathymetry data post-processing was imported. The horizontal grid node spacing was set to 1 m, and the water surface elevation was set to 0 m. The “Batch Process Velocity” option was selected, thereby producing an intermediate velocity data file for each transect with fields including ensemble number, latitude, longitude, date and time, and depth-averaged velocity magnitude and direction. Next, the data file was imported into ESRI® ArcGIS™, and the latitude and longitude data were transformed into the SIRGAS coordinate system. Database fields containing the SIRGAS coordinates for each velocity data point were created. The resulting easting and northing fields contained GNSS-derived positions unadjusted for translational changes because of adjustments of RTK base station coordinates. The same adjustments computed for the final primary base station coordinates (see section, “Topographic Survey”) were applied to the easting and northing fields of the database table. The values of the adjustments varied depending on the base station and bench mark used at the time each transect was collected; therefore, another database operation based on date and time information was used to join the bathymetric data to a database table containing RTK base station corrections. New database fields, representing the adjusted easting and northing of each point, were created by adding the RTK base station corrections to the uncorrected bathymetry position fields.
The depth-averaged velocity database table was exported to a final comma-separated file. Data in the output file included projected coordinates, date, northing (in meters, SIRGAS 2000), easting (in meters, SIRGAS), ADCP heading (in degrees), ADCP pitch (in degrees), water temperature (in degrees Celsius), average depth, depth measured by each of the four Beams, backscatter value, the easting component of depth-averaged velocity (in centimeters per second), the northing component of depth-averaged velocity (in centimeters per second), the magnitude of depth-averaged velocity (in centimeters per second), the cardinal direction of depth-averaged velocity (in degrees), the vertical component of depth-averaged velocity (in centimeters per second), and the base station associated with the GNSS-derived position.

Publishing support provided by the U.S. Geological Survey Science Publishing Network, Tacoma Publishing Service Center
For more information concerning the research in this report, contact the Director, Idaho Water Science Center U.S. Geological Survey 230 Collins Road Boise, Idaho 83702 http://id.water.usgs.gov

Fosness and Dietsch—Topographic and H
ydrographic Survey Data for the São Francisco River near Torrinha, B
ahia, Brazil, 2014—
Data Series 9 6 5
ISSN 2327-638X (online)http://dx.doi.org/10.3133/ds965