the yellow river water quality improvement projectbiomonitor.com/yellowriver.pdf · 2 introduction...
TRANSCRIPT
Commonwealth Biomonitoring, Inc.
8061 Windham Lake Drive Indianapolis IN 46214 ( 317 ) 297 - 7713
[email protected] www.biomonitor.com
The Yellow River Water Quality Improvement Project
Prepared for:
Indiana Department of Environmental ManagementARN 00-39
Prepared by:
Commonwealth Biomonitoring, Inc.and
The City of Plymouth, Indiana
September 2002
TABLE OF CONTENTS
Page
Executive Summary 1Introduction 2Methods and Materials 3Results 4Discussion 16 Summary and Recommendations 17Literature Cited 18
Appendices
A. Instream E.coli dataB. Sterile sandbag monitoring dataC. PAH dataD. Public education materials
Tables
Table 1. Summary of E.coli monitoring data 5Table 2. Streamguard oil detect data (June/July 2001) 7Table 3. Streamguard oil detect data (July/August 2001) 8Table 4. PAH compounds in SPMDs 9Table 5. SPMD analysis in Schuh Ditch 10Table 6. Storm filter sediment removal data 11Table 7. Storm filter oil and grease removal data 13Table 8. Storm filter PAH removal data 14Table 9. Priority ranking for PAH removal 15
Figures
Figure 1. The study area 2Figure 2. A comparison of E.coli values at Plymouth and Knox 5Figure 3. Sites for sterile sandbag monitoring 6Figure 4. Sites for installation of Streamguard oil detect units 7
(June/July 2001)Figure 5. Sites for installation of Streamguard oil detect units 8
(July/August 2001)Figure 6. Sites for PAH monitoring in SPMDs 9Figure 7. Sites for storm filter monitoring 12
1
EXECUTIVE SUMMARY
The City of Plymouth, Indiana received a Section 319 water quality grant from theIndiana Department of Environmental Management to monitor pollutants associated withnonpoint source runoff in the Yellow River watershed and to explore ways to reduce pollutantinputs. This was a follow-up study to previous water quality monitoring done in the watershed.
Several novel monitoring techniques were used. These included sterile sandbagsfor locating E.coli sources, semipermeable membrane devices (SPMDs) for locatingPAH sources, and oil detectors for locating oil and grease sources.
The bacteria analyses showed that E.coli levels in the river are often quite high,especially during wet weather. The most important sources were upstream from Plymouth. Unsewered areas in Wyatt, Indiana (upstream from Plymouth) combined sewer overflows inBremen, and areas of livestock production were important sources of bacteria in the watershed.
Polycyclic aromatic hydrocarbons (PAH) and oil and grease compounds were present atrelatively high levels as well. Schuh Ditch, draining the northern part of Plymouth, was animportant source of these chemicals. There are many acres of asphalt streets and parking lotsin this industrial area of the city.
Geofabric storm filter inserts were used to trap sediment and oil in Plymouth’s urbanstormwater. Twelve sites were monitored regularly for a year. Trapped sediment at each sitevaried from 0.5 to 17 kg per storm event (more than 0.3 inches of rainfall in 24 hours). Theaverage was about 5 kg per storm event. The filters were also successful in trapping oil andgrease in stormwater (41 to 95% removal). Efficiency of the filters for removing most PAHcompounds was lower (less than 14% for total PAHs). However, removal rates of 25 to 40%were achieved for some PAH components, including benzofluoranthene, which was common inPlymouth stormwater and is potentially toxic to aquatic life at low concentrations.
Regular use of these storm filters within the City of Plymouth could eliminate over 15,000kg of sediment and associated nutrients and chemicals from entering Yellow River each year ata cost of about $15,000 per year.
Public education materials produced as part of this contract included a project website,two project brochures, and a public meeting.
Recommendations for future directions include (1) continuing the storm filter program,(2) concentrating stormwater control efforts on the Schuh Ditch watershed, (3) considering theuse of other best management practices for stormwater cleanup, and (4) working with IDEM andlocal Soil and Water Conservation Districts to reduce E.coli loading from unsewered areas,combined sewer overflows, and livestock.
2
INTRODUCTION
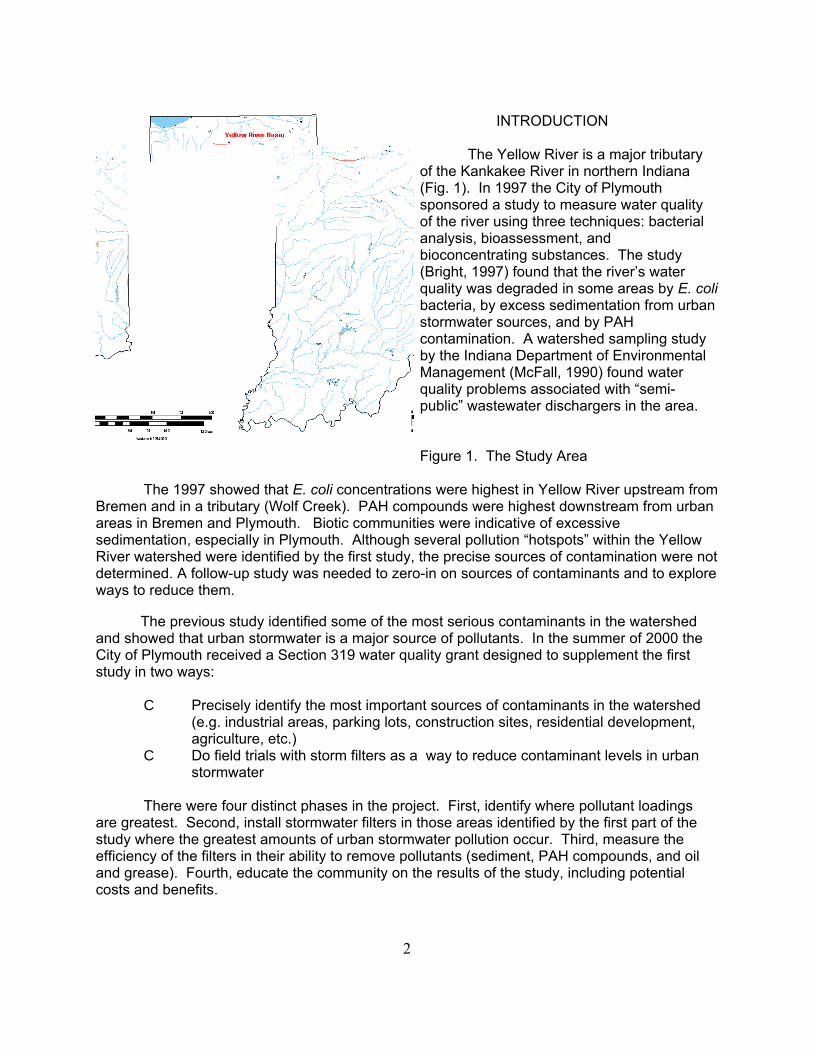
The Yellow River is a major tributaryof the Kankakee River in northern Indiana(Fig. 1). In 1997 the City of Plymouthsponsored a study to measure water qualityof the river using three techniques: bacterialanalysis, bioassessment, andbioconcentrating substances. The study(Bright, 1997) found that the river’s waterquality was degraded in some areas by E. colibacteria, by excess sedimentation from urbanstormwater sources, and by PAHcontamination. A watershed sampling studyby the Indiana Department of EnvironmentalManagement (McFall, 1990) found waterquality problems associated with “semi-public” wastewater dischargers in the area.
Figure 1. The Study Area
The 1997 showed that E. coli concentrations were highest in Yellow River upstream fromBremen and in a tributary (Wolf Creek). PAH compounds were highest downstream from urbanareas in Bremen and Plymouth. Biotic communities were indicative of excessivesedimentation, especially in Plymouth. Although several pollution “hotspots” within the YellowRiver watershed were identified by the first study, the precise sources of contamination were notdetermined. A follow-up study was needed to zero-in on sources of contaminants and to exploreways to reduce them.
The previous study identified some of the most serious contaminants in the watershedand showed that urban stormwater is a major source of pollutants. In the summer of 2000 theCity of Plymouth received a Section 319 water quality grant designed to supplement the firststudy in two ways:
C Precisely identify the most important sources of contaminants in the watershed(e.g. industrial areas, parking lots, construction sites, residential development,agriculture, etc.)
C Do field trials with storm filters as a way to reduce contaminant levels in urbanstormwater
There were four distinct phases in the project. First, identify where pollutant loadingsare greatest. Second, install stormwater filters in those areas identified by the first part of thestudy where the greatest amounts of urban stormwater pollution occur. Third, measure theefficiency of the filters in their ability to remove pollutants (sediment, PAH compounds, and oiland grease). Fourth, educate the community on the results of the study, including potentialcosts and benefits.
3
METHODS AND MATERIALS
The project used several novel monitoring techniques. The sterile sandbag technique[2] has been shown to locate important sources of bacteria without repeated sampling. Semipermeable membrane devices (SPMDs) have been used to locate sources ofbioaccumulating chemicals [4]. Oil absorbance samplers have been used to locate and quantifysources of oil and grease in stormwater. In addition to these relatively novel monitoringtechniques, grab samples of water were collected and analyzed weekly for E. coli bacteria. Shown below is a summary of samples taken as part of this project:
Parameter When Where Why
E. coli weekly Yellow River Provide instream datain water 100 weeks 3 sites above and below urban
influence under various flow and weather regimes.
E. coli summer Yellow River Determine most importantin sandbags 1 time 10 sites sources of bacteria at many
locations using a singlesampling device and singlemonitoring period
PAH in summer Yellow River Determine where PAHs areSPMDs 1 time 8 sites originating in the watershed.
Monitor storm filter efficiency3 storm filters for PAH removal.
Sediment summer 10 storm filters Measure storm filter in filters 1 time efficiency for sediment
removal.
Oil and Grease summer 3 storm filters Measure storm filterin filters 1 time efficiency for oil and grease
removal.
4
RESULTS
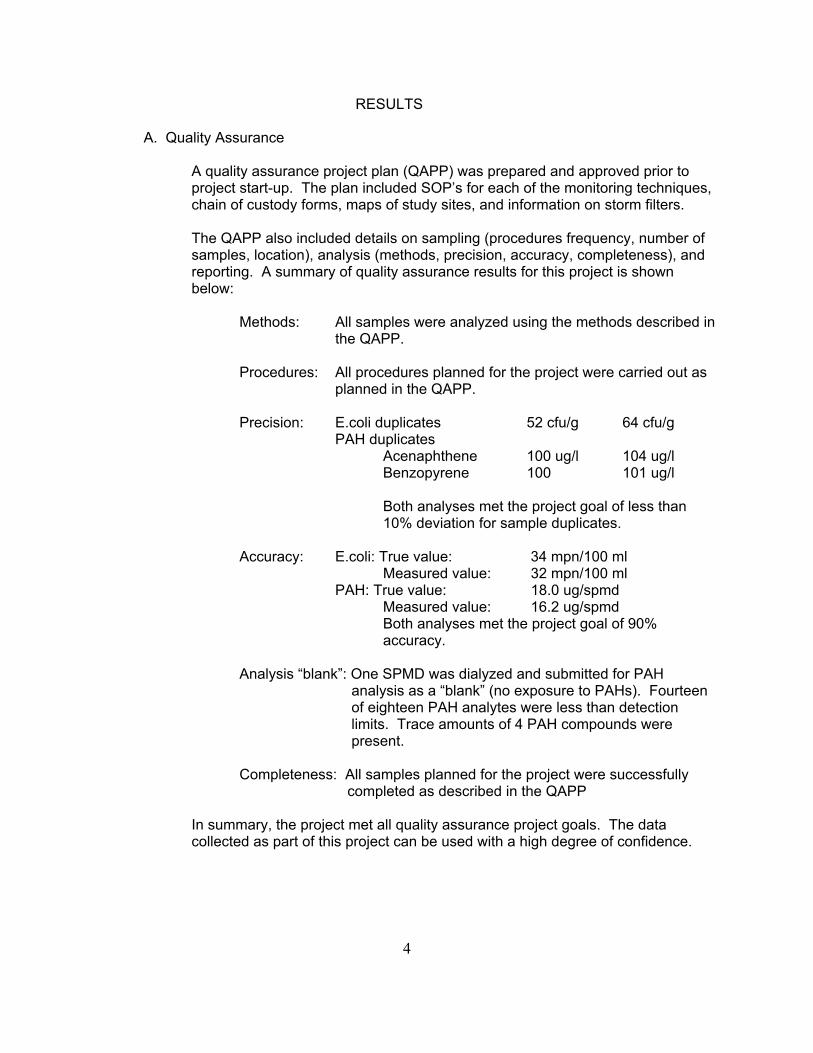
A. Quality Assurance
A quality assurance project plan (QAPP) was prepared and approved prior toproject start-up. The plan included SOP’s for each of the monitoring techniques,chain of custody forms, maps of study sites, and information on storm filters.
The QAPP also included details on sampling (procedures frequency, number ofsamples, location), analysis (methods, precision, accuracy, completeness), andreporting. A summary of quality assurance results for this project is shownbelow:
Methods: All samples were analyzed using the methods described inthe QAPP.
Procedures: All procedures planned for the project were carried out asplanned in the QAPP.
Precision: E.coli duplicates 52 cfu/g 64 cfu/gPAH duplicates
Acenaphthene 100 ug/l 104 ug/lBenzopyrene 100 101 ug/l
Both analyses met the project goal of less than10% deviation for sample duplicates.
Accuracy: E.coli: True value: 34 mpn/100 mlMeasured value: 32 mpn/100 ml
PAH: True value: 18.0 ug/spmdMeasured value: 16.2 ug/spmdBoth analyses met the project goal of 90%accuracy.
Analysis “blank”: One SPMD was dialyzed and submitted for PAH analysis as a “blank” (no exposure to PAHs). Fourteen of eighteen PAH analytes were less than detection limits. Trace amounts of 4 PAH compounds were present.
Completeness: All samples planned for the project were successfully completed as described in the QAPP
In summary, the project met all quality assurance project goals. The datacollected as part of this project can be used with a high degree of confidence.
5
0500
1000150020002500
Weekly Value (Apr-Oct 2001)
MPN
per
100
ml
Plymouth Area Knox Area
Yellow RiverE.coli per 100 ml
B. Instream Bacteria Monitoring
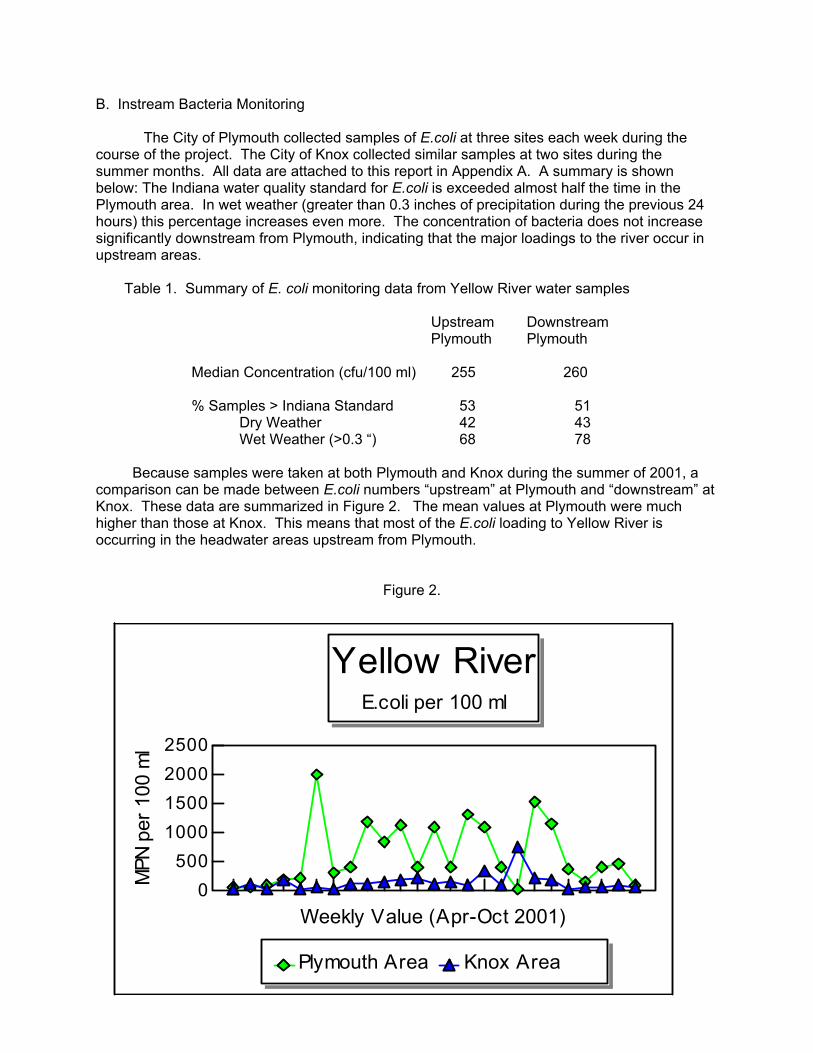
The City of Plymouth collected samples of E.coli at three sites each week during thecourse of the project. The City of Knox collected similar samples at two sites during thesummer months. All data are attached to this report in Appendix A. A summary is shownbelow: The Indiana water quality standard for E.coli is exceeded almost half the time in thePlymouth area. In wet weather (greater than 0.3 inches of precipitation during the previous 24hours) this percentage increases even more. The concentration of bacteria does not increasesignificantly downstream from Plymouth, indicating that the major loadings to the river occur inupstream areas.
Table 1. Summary of E. coli monitoring data from Yellow River water samples
Upstream DownstreamPlymouth Plymouth
Median Concentration (cfu/100 ml) 255 260
% Samples > Indiana Standard 53 51Dry Weather 42 43Wet Weather (>0.3 “) 68 78
Because samples were taken at both Plymouth and Knox during the summer of 2001, acomparison can be made between E.coli numbers “upstream” at Plymouth and “downstream” atKnox. These data are summarized in Figure 2. The mean values at Plymouth were muchhigher than those at Knox. This means that most of the E.coli loading to Yellow River isoccurring in the headwater areas upstream from Plymouth.
Figure 2.
6
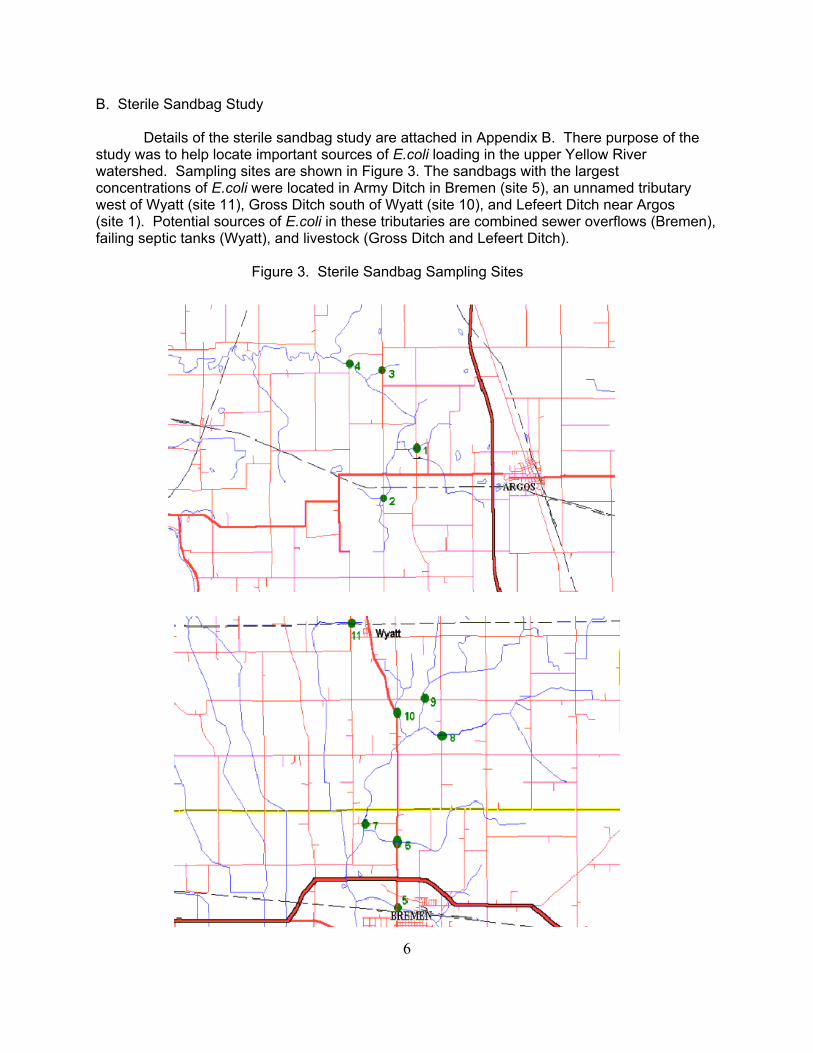
B. Sterile Sandbag Study
Details of the sterile sandbag study are attached in Appendix B. There purpose of thestudy was to help locate important sources of E.coli loading in the upper Yellow Riverwatershed. Sampling sites are shown in Figure 3. The sandbags with the largestconcentrations of E.coli were located in Army Ditch in Bremen (site 5), an unnamed tributarywest of Wyatt (site 11), Gross Ditch south of Wyatt (site 10), and Lefeert Ditch near Argos (site 1). Potential sources of E.coli in these tributaries are combined sewer overflows (Bremen),failing septic tanks (Wyatt), and livestock (Gross Ditch and Lefeert Ditch).
Figure 3. Sterile Sandbag Sampling Sites
7
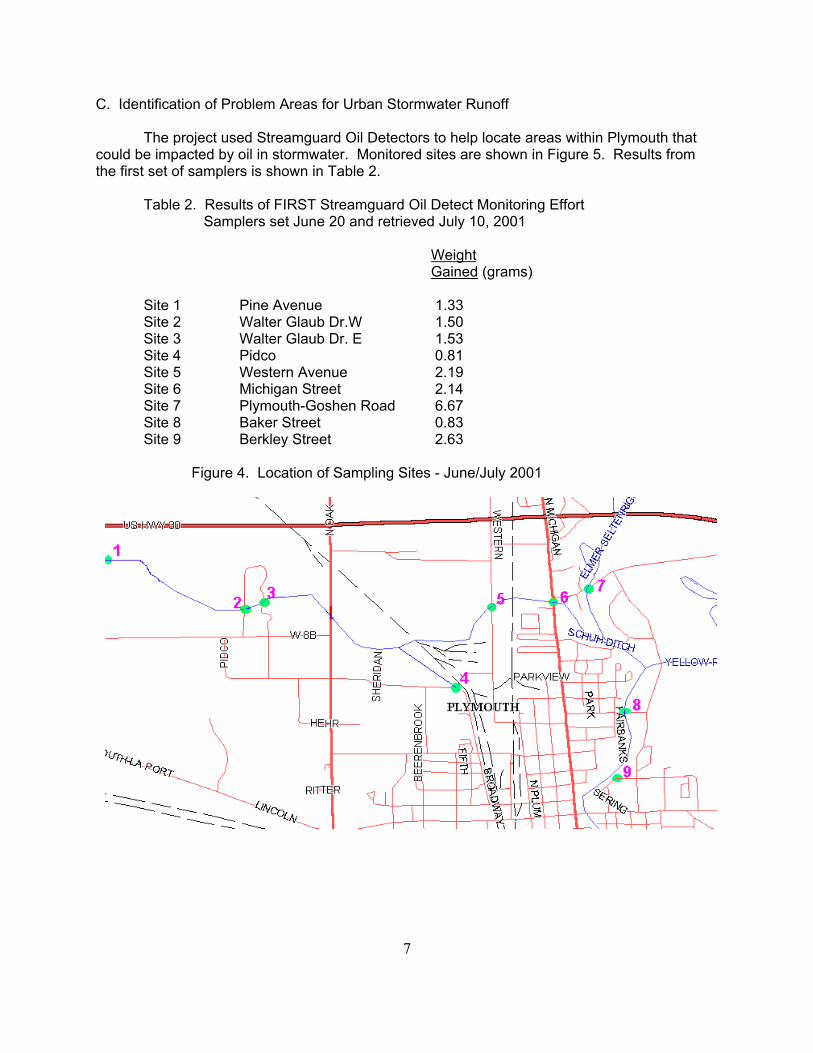
C. Identification of Problem Areas for Urban Stormwater Runoff
The project used Streamguard Oil Detectors to help locate areas within Plymouth thatcould be impacted by oil in stormwater. Monitored sites are shown in Figure 5. Results fromthe first set of samplers is shown in Table 2.
Table 2. Results of FIRST Streamguard Oil Detect Monitoring Effort Samplers set June 20 and retrieved July 10, 2001
WeightGained (grams)
Site 1 Pine Avenue 1.33 Site 2 Walter Glaub Dr.W 1.50 Site 3 Walter Glaub Dr. E 1.53 Site 4 Pidco 0.81 Site 5 Western Avenue 2.19 Site 6 Michigan Street 2.14 Site 7 Plymouth-Goshen Road 6.67 Site 8 Baker Street 0.83 Site 9 Berkley Street 2.63
Figure 4. Location of Sampling Sites - June/July 2001
8
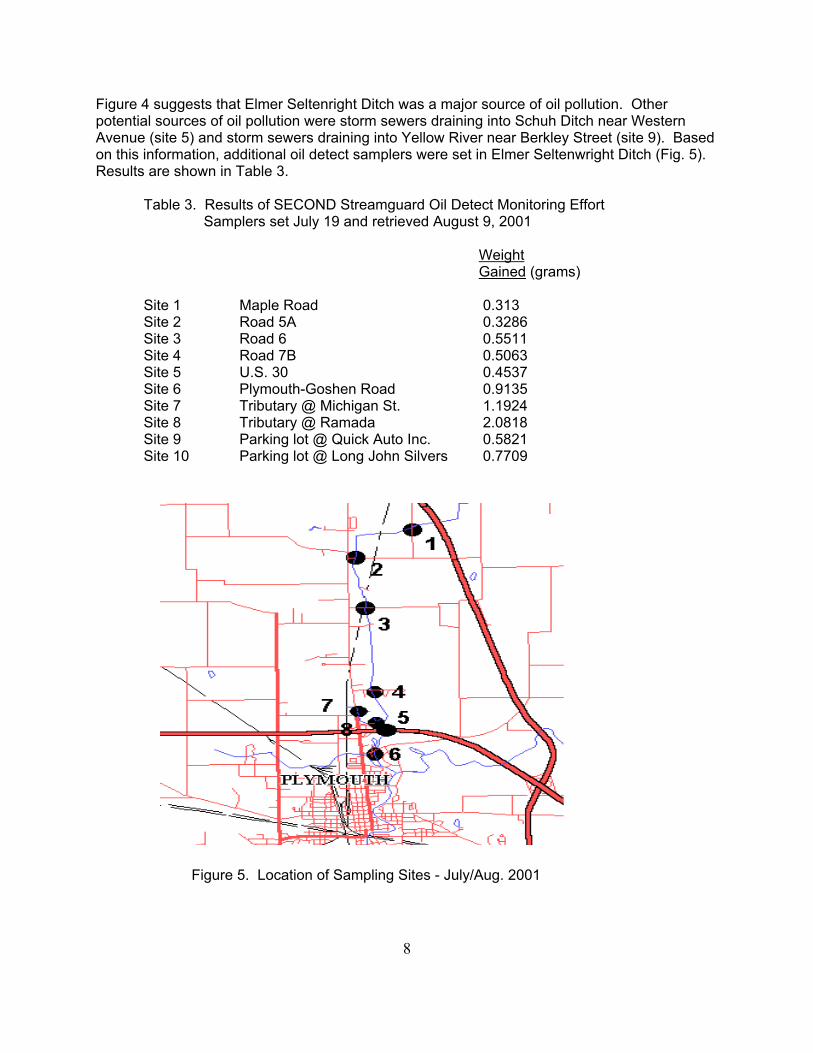
Figure 4 suggests that Elmer Seltenright Ditch was a major source of oil pollution. Otherpotential sources of oil pollution were storm sewers draining into Schuh Ditch near WesternAvenue (site 5) and storm sewers draining into Yellow River near Berkley Street (site 9). Basedon this information, additional oil detect samplers were set in Elmer Seltenwright Ditch (Fig. 5).Results are shown in Table 3.
Table 3. Results of SECOND Streamguard Oil Detect Monitoring Effort Samplers set July 19 and retrieved August 9, 2001
WeightGained (grams)
Site 1 Maple Road 0.313Site 2 Road 5A 0.3286Site 3 Road 6 0.5511Site 4 Road 7B 0.5063Site 5 U.S. 30 0.4537Site 6 Plymouth-Goshen Road 0.9135Site 7 Tributary @ Michigan St. 1.1924Site 8 Tributary @ Ramada 2.0818Site 9 Parking lot @ Quick Auto Inc. 0.5821Site 10 Parking lot @ Long John Silvers 0.7709
Figure 5. Location of Sampling Sites - July/Aug. 2001
9
The second set of samples suugests that the small tributary flowing past the RamadaInn is the largest source of hydrocarbon pollutants. Efforts to control oil-related pollution shouldconcentrate on this tributary.
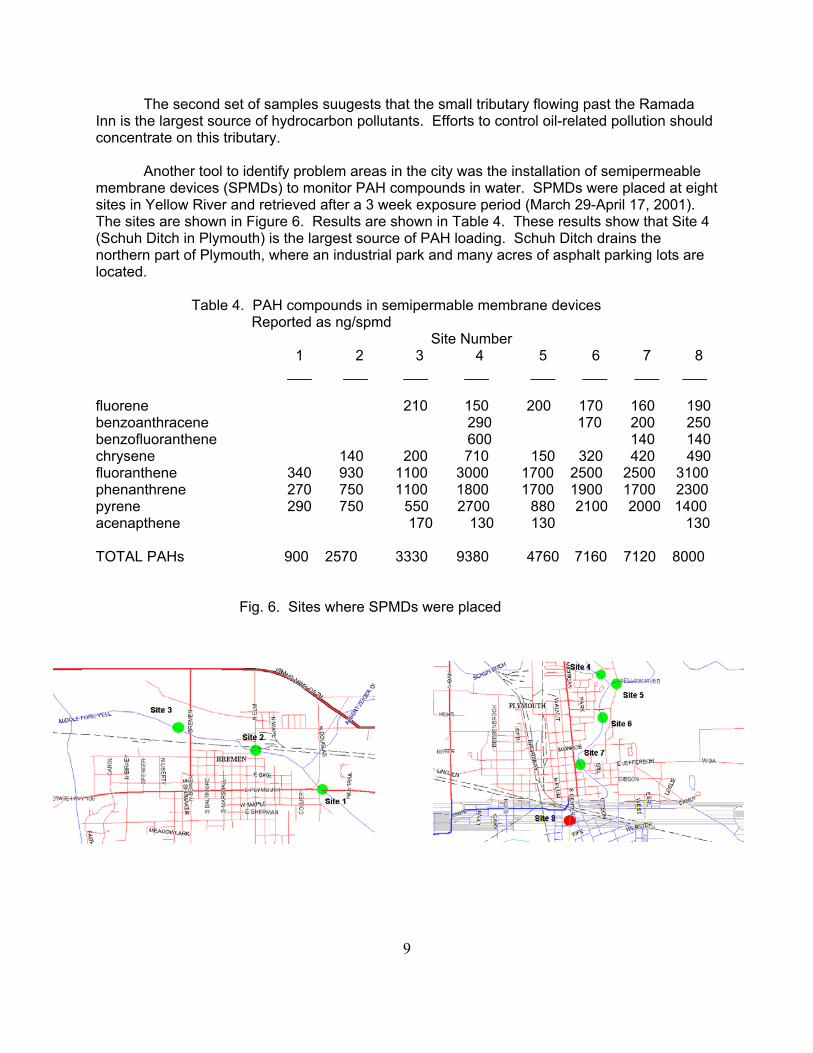
Another tool to identify problem areas in the city was the installation of semipermeablemembrane devices (SPMDs) to monitor PAH compounds in water. SPMDs were placed at eightsites in Yellow River and retrieved after a 3 week exposure period (March 29-April 17, 2001). The sites are shown in Figure 6. Results are shown in Table 4. These results show that Site 4(Schuh Ditch in Plymouth) is the largest source of PAH loading. Schuh Ditch drains thenorthern part of Plymouth, where an industrial park and many acres of asphalt parking lots arelocated.
Table 4. PAH compounds in semipermable membrane devices Reported as ng/spmd
Site Number 1 2 3 4 5 6 7 8___ ___ ___ ___ ___ ___ ___ ___
fluorene 210 150 200 170 160 190 benzoanthracene 290 170 200 250benzofluoranthene 600 140 140chrysene 140 200 710 150 320 420 490fluoranthene 340 930 1100 3000 1700 2500 2500 3100phenanthrene 270 750 1100 1800 1700 1900 1700 2300pyrene 290 750 550 2700 880 2100 2000 1400acenapthene 170 130 130 130
TOTAL PAHs 900 2570 3330 9380 4760 7160 7120 8000
Fig. 6. Sites where SPMDs were placed
10
Additional SPMDs were set within the Schuh Ditch watershed, to help locate importantsources of PAHs. One sampler was set in Schuh Ditch upstream from Elmer Seltenwright Ditch(Site 9). A second sampler was set in Elmer Seltenwright Ditch upstream from Schuh Ditch(Site 10). A third sampler was set in a storm sewer draining into the Plymouth airport stormgrate (Site 11). These samplers were set on August 15 and retrieved on September 11, 2001. Results are shown in Table 5.
Table 5. Results of SPMD analysis within Schuh Ditch Drainage
Site Number 9 10 11___ ___ ___
fluorene 410 190 48 benzoanthracene 650 460 18 benzofluoranthene 1440 630 70chrysene 1900 1400 220 fluoranthene 10000 5900 370 phenanthrene 5000 2100 340 pyrene 2000 3100 270acenapthene 160 160 16 anthracene 330 130 26napthalene 50acenapthylene 10benzopyrene 180dibenzoanthracene 20
TOTAL PAHs 22160 14070 1378
These results show that Schuh Ditch upstream from Elmer Seltenwright Ditch is themost important source of PAH loadings in the watershed. Efforts to control urban stormwaterpollution should concentrate on this area.
11
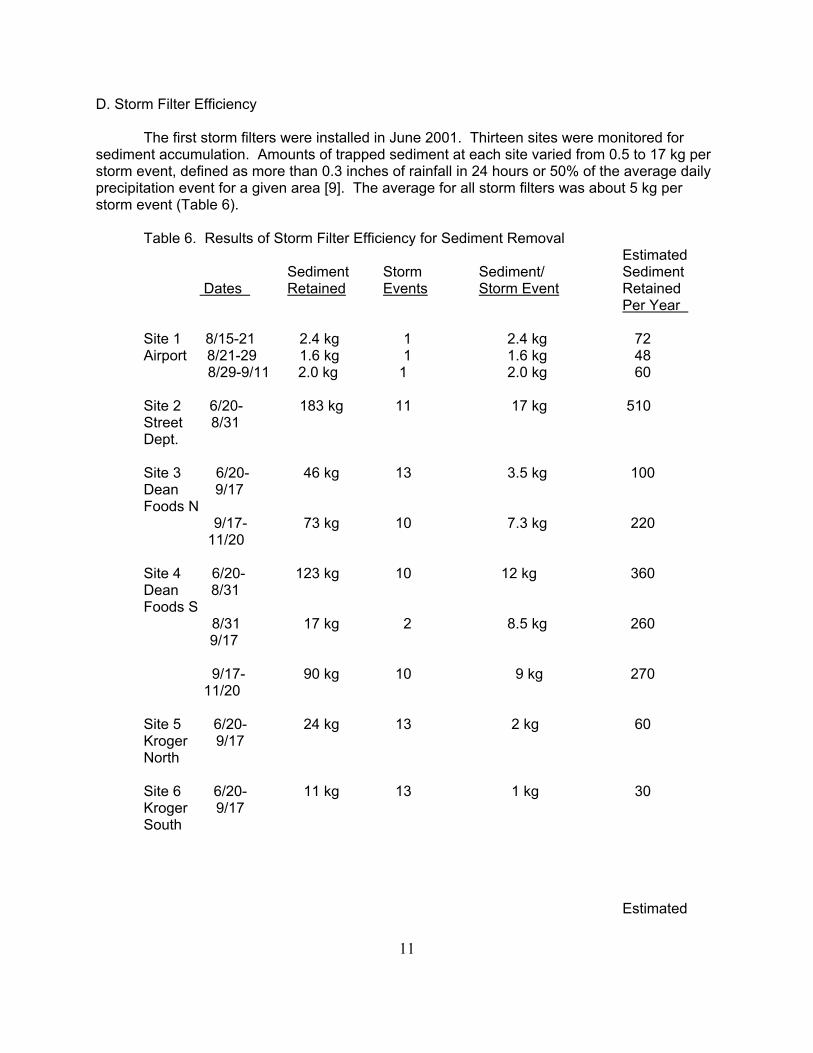
D. Storm Filter Efficiency
The first storm filters were installed in June 2001. Thirteen sites were monitored forsediment accumulation. Amounts of trapped sediment at each site varied from 0.5 to 17 kg perstorm event, defined as more than 0.3 inches of rainfall in 24 hours or 50% of the average dailyprecipitation event for a given area [9]. The average for all storm filters was about 5 kg perstorm event (Table 6).
Table 6. Results of Storm Filter Efficiency for Sediment RemovalEstimated
Sediment Storm Sediment/ Sediment Dates Retained Events Storm Event Retained
Per Year
Site 1 8/15-21 2.4 kg 1 2.4 kg 72Airport 8/21-29 1.6 kg 1 1.6 kg 48
8/29-9/11 2.0 kg 1 2.0 kg 60
Site 2 6/20- 183 kg 11 17 kg 510 Street 8/31Dept.
Site 3 6/20- 46 kg 13 3.5 kg 100Dean 9/17Foods N
9/17- 73 kg 10 7.3 kg 220 11/20
Site 4 6/20- 123 kg 10 12 kg 360Dean 8/31Foods S
8/31 17 kg 2 8.5 kg 260 9/17
9/17- 90 kg 10 9 kg 270 11/20
Site 5 6/20- 24 kg 13 2 kg 60Kroger 9/17North
Site 6 6/20- 11 kg 13 1 kg 30Kroger 9/17South
Estimated
12
Sediment Storm Sediment/ Sediment Dates Retained Events Storm Event Retained
Per Year
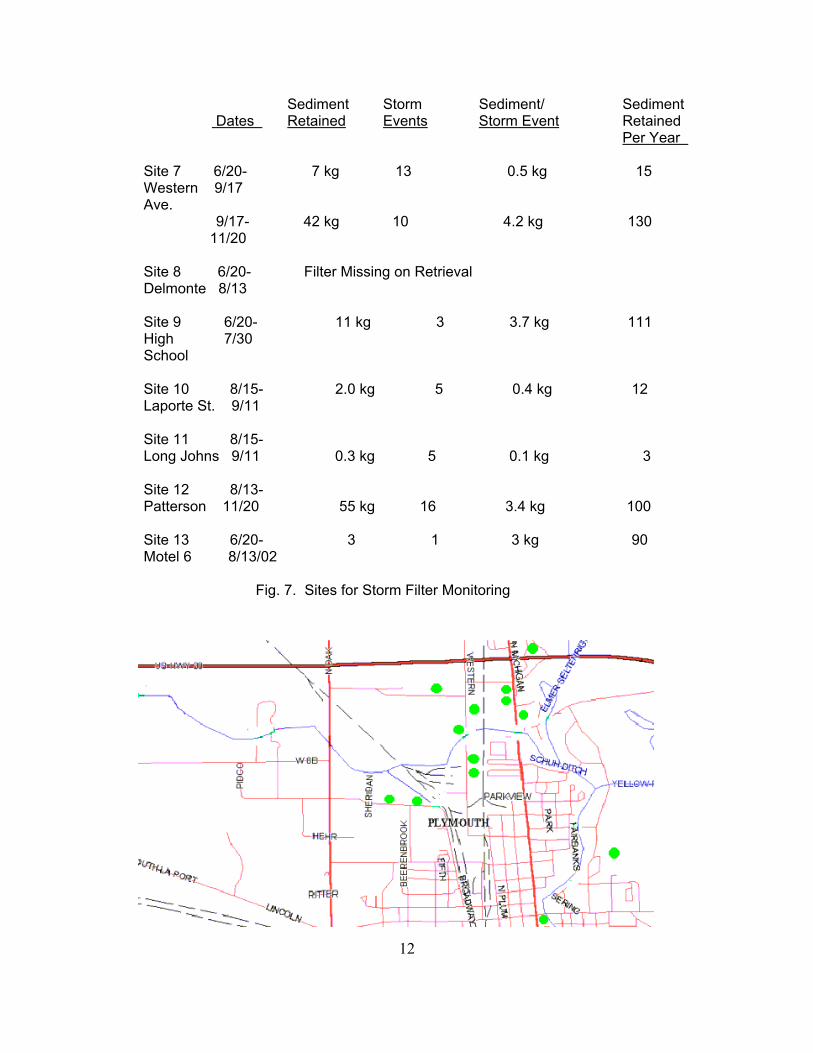
Site 7 6/20- 7 kg 13 0.5 kg 15Western 9/17Ave.
9/17- 42 kg 10 4.2 kg 130 11/20
Site 8 6/20- Filter Missing on RetrievalDelmonte 8/13
Site 9 6/20- 11 kg 3 3.7 kg 111High 7/30School
Site 10 8/15- 2.0 kg 5 0.4 kg 12Laporte St. 9/11
Site 11 8/15-Long Johns 9/11 0.3 kg 5 0.1 kg 3
Site 12 8/13-Patterson 11/20 55 kg 16 3.4 kg 100
Site 13 6/20- 3 1 3 kg 90Motel 6 8/13/02
Fig. 7. Sites for Storm Filter Monitoring
13
In Indiana, there are an average of 30 storm events per year where precipitationexceeds 0.3 inches in a 24-hour period [9]. If each filter removes 5 kg of sediment from urbanstormwater, as indicated by the data in Table 2, 150 kg of sediment could be kept from reachingYellow River in the course of a year. The City of Plymouth has hundreds of storm grates alongits streets. If filters are installed and maintained in 100 of them, it would be possible to eliminatethe discharge of over 15,000 kg (20 pickup loads) of sediment and its associated nutrients andtoxic chemicals to Yellow River each year.
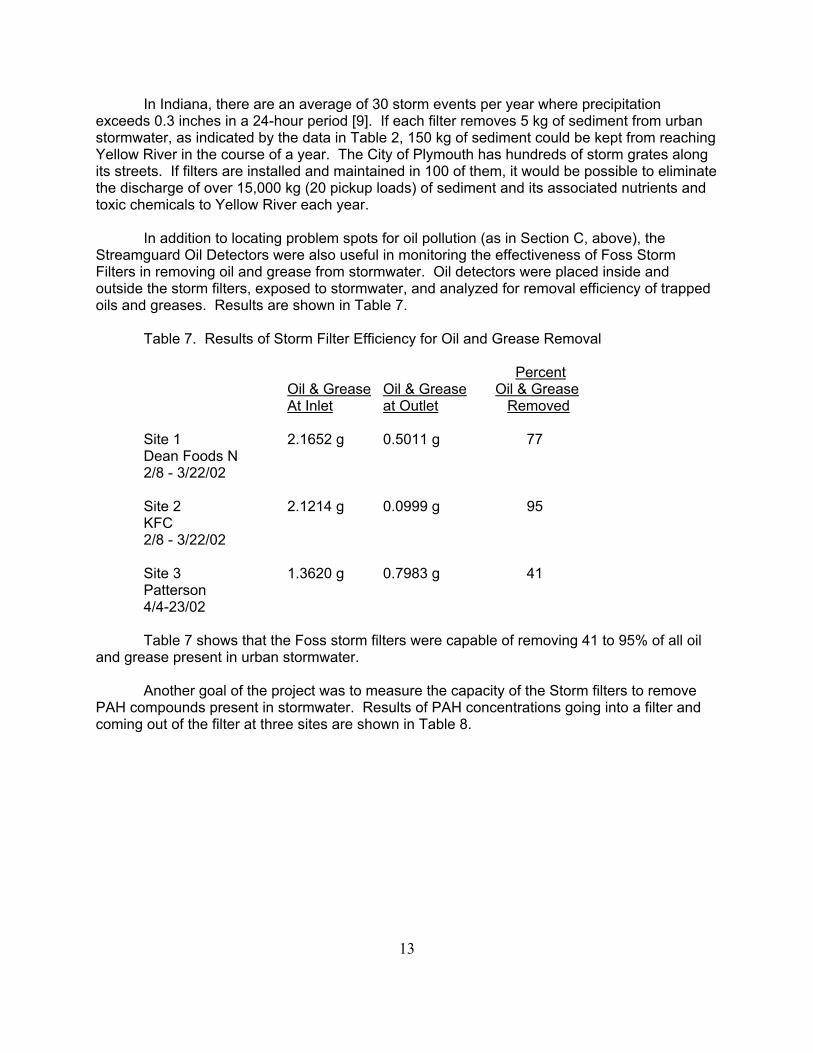
In addition to locating problem spots for oil pollution (as in Section C, above), theStreamguard Oil Detectors were also useful in monitoring the effectiveness of Foss StormFilters in removing oil and grease from stormwater. Oil detectors were placed inside andoutside the storm filters, exposed to stormwater, and analyzed for removal efficiency of trappedoils and greases. Results are shown in Table 7.
Table 7. Results of Storm Filter Efficiency for Oil and Grease Removal
PercentOil & Grease Oil & Grease Oil & GreaseAt Inlet at Outlet Removed
Site 1 2.1652 g 0.5011 g 77Dean Foods N2/8 - 3/22/02
Site 2 2.1214 g 0.0999 g 95KFC2/8 - 3/22/02
Site 3 1.3620 g 0.7983 g 41Patterson4/4-23/02
Table 7 shows that the Foss storm filters were capable of removing 41 to 95% of all oiland grease present in urban stormwater.
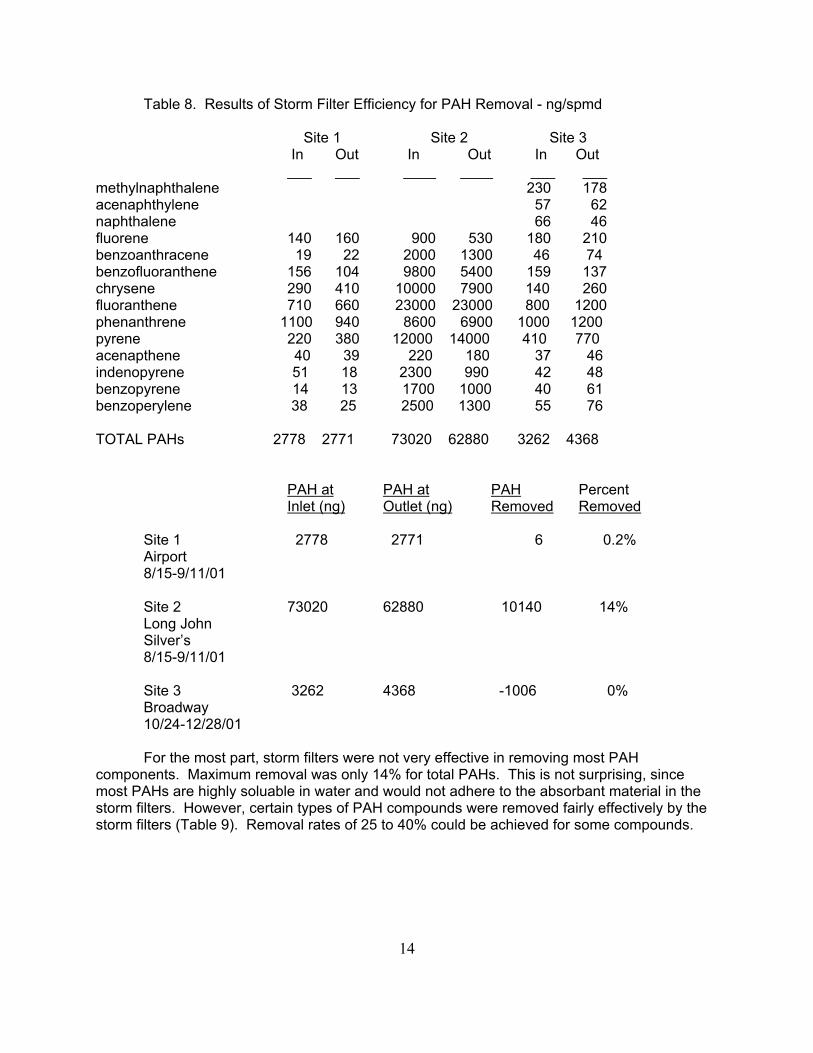
Another goal of the project was to measure the capacity of the Storm filters to removePAH compounds present in stormwater. Results of PAH concentrations going into a filter andcoming out of the filter at three sites are shown in Table 8.
14
Table 8. Results of Storm Filter Efficiency for PAH Removal - ng/spmd
Site 1 Site 2 Site 3 In Out In Out In Out ___ ___ ____ ____ ___ ___
methylnaphthalene 230 178acenaphthylene 57 62naphthalene 66 46fluorene 140 160 900 530 180 210benzoanthracene 19 22 2000 1300 46 74benzofluoranthene 156 104 9800 5400 159 137chrysene 290 410 10000 7900 140 260fluoranthene 710 660 23000 23000 800 1200phenanthrene 1100 940 8600 6900 1000 1200pyrene 220 380 12000 14000 410 770acenapthene 40 39 220 180 37 46indenopyrene 51 18 2300 990 42 48benzopyrene 14 13 1700 1000 40 61benzoperylene 38 25 2500 1300 55 76
TOTAL PAHs 2778 2771 73020 62880 3262 4368
PAH at PAH at PAH PercentInlet (ng) Outlet (ng) Removed Removed
Site 1 2778 2771 6 0.2%Airport8/15-9/11/01
Site 2 73020 62880 10140 14%Long JohnSilver’s8/15-9/11/01
Site 3 3262 4368 -1006 0%Broadway10/24-12/28/01
For the most part, storm filters were not very effective in removing most PAHcomponents. Maximum removal was only 14% for total PAHs. This is not surprising, sincemost PAHs are highly soluable in water and would not adhere to the absorbant material in thestorm filters. However, certain types of PAH compounds were removed fairly effectively by thestorm filters (Table 9). Removal rates of 25 to 40% could be achieved for some compounds.
15
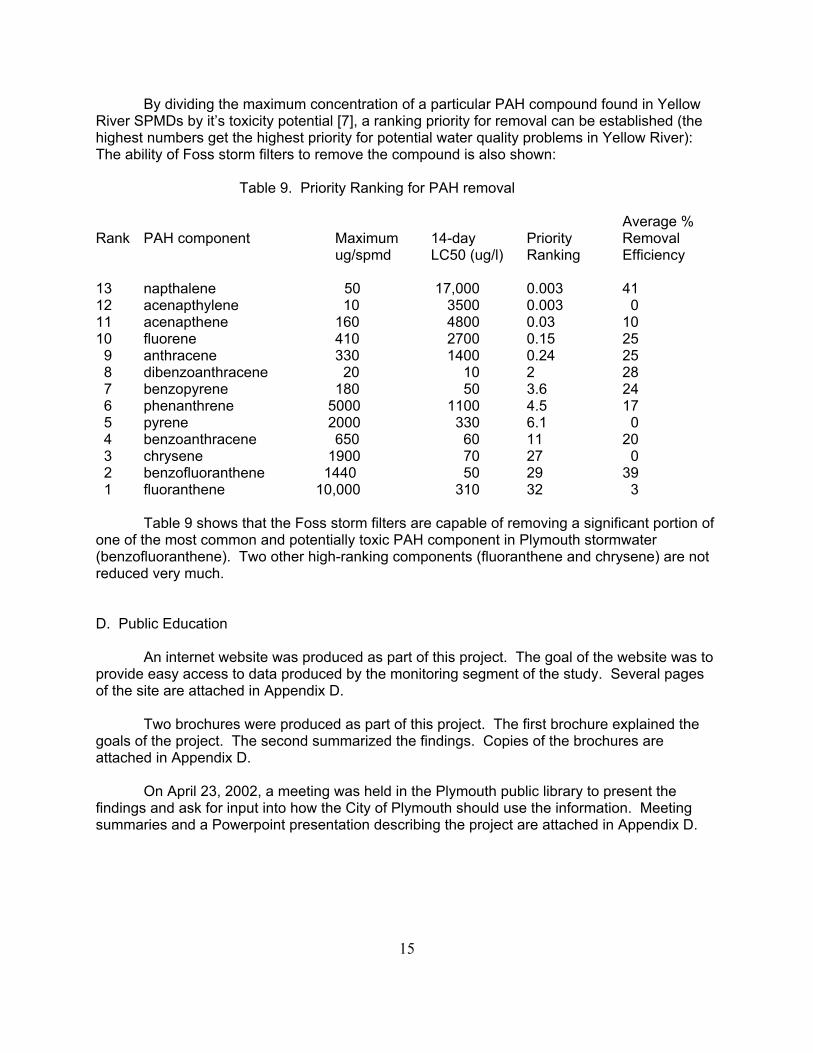
By dividing the maximum concentration of a particular PAH compound found in YellowRiver SPMDs by it’s toxicity potential [7], a ranking priority for removal can be established (thehighest numbers get the highest priority for potential water quality problems in Yellow River):The ability of Foss storm filters to remove the compound is also shown:
Table 9. Priority Ranking for PAH removal
Average %Rank PAH component Maximum 14-day Priority Removal
ug/spmd LC50 (ug/l) Ranking Efficiency
13 napthalene 50 17,000 0.003 4112 acenapthylene 10 3500 0.003 011 acenapthene 160 4800 0.03 1010 fluorene 410 2700 0.15 25 9 anthracene 330 1400 0.24 25 8 dibenzoanthracene 20 10 2 28 7 benzopyrene 180 50 3.6 24 6 phenanthrene 5000 1100 4.5 17 5 pyrene 2000 330 6.1 0 4 benzoanthracene 650 60 11 20 3 chrysene 1900 70 27 0 2 benzofluoranthene 1440 50 29 39 1 fluoranthene 10,000 310 32 3
Table 9 shows that the Foss storm filters are capable of removing a significant portion ofone of the most common and potentially toxic PAH component in Plymouth stormwater(benzofluoranthene). Two other high-ranking components (fluoranthene and chrysene) are notreduced very much.
D. Public Education
An internet website was produced as part of this project. The goal of the website was toprovide easy access to data produced by the monitoring segment of the study. Several pagesof the site are attached in Appendix D.
Two brochures were produced as part of this project. The first brochure explained thegoals of the project. The second summarized the findings. Copies of the brochures areattached in Appendix D.
On April 23, 2002, a meeting was held in the Plymouth public library to present thefindings and ask for input into how the City of Plymouth should use the information. Meetingsummaries and a Powerpoint presentation describing the project are attached in Appendix D.

16
DISCUSSION
Many Indiana streams are impacted by excessive E.coli that impair their use forrecreational activities [10]. The Yellow River is currently not on Indiana’s list of impairedwaterbodies but the upper watershed clearly has E.coli concentrations high enough to be ofconcern. The sterile sandbag technique was useful in locating some of these pathogensources. Additional sampling in Gross Ditch and Lefeert Ditch would be useful in furtherpinpointing important sources in these Yellow River tributaries.
Excessive sediment inputs are another common cause of use impairment in waters ofthe United States [11]. A previous study of the Yellow River showed that excessive sedimentscaused mild impairment to the aquatic community in the Plymouth area [3]. Therefore,sediment control should remain an important goal for the community. This study demonstratedthat using storm filters in urban stormwater inlets was an effective way to reduce sediment andoil loading to surface water. A program of installing and maintaining storm filters in Plymouthcould reduce sediment inputs by 15,000 kg per year. The type of storm filter used in this studyis relatively inexpensive (less than $100) and can be used for up to a year before replacement. The cost for filters in 100 stormwater inlets would be less than $10,000 annually. Maintenanceis also relatively easy. The additional labor costs to check, empty, and replace these filterswould vary according to rainfall and drive time, but in a city like Plymouth would probably beless than $5000 per year. A total program of storm filter maintenance would be approximately$15,000 annually. If 15,000 kg of sediment are removed annually, the cost per kilogram is $1.
PAH compounds are a common component in urban stormwater [8]. They are ofenvironmental concern because they are potentially toxic to aquatic life at low concentrations [7]and because they have the potential to bioconcentrate to even higher levels in fish and otheraquatic life [4]. Their toxicity is greatly enhanced when they are exposed to sunlight [12], acommon occurrence in stormwater. The highest PAH concentrations in SPMDs occurred inSchuh Ditch (site 9), which drains the northern half of Plymouth. This area of the city is highlyindustrial, with numerous areas of impervious surface for parking, loading, and manufacturing. An urban stormwater runoff program for Plymouth should focus its attention on controls in theSchuh Ditch area.
Fluoranthene was the PAH compound that appeared in highest concentrations inPlymouth stormwater. This was also true in a previous study of urban stormwater constituentsin Birmingham, Alabama [8]. Since fluoranthene concentrations are high and because thiscompound also has the highest potential for toxicity, finding an effective way to reduce loadingsshould be a high priority. Table 9 shows that the storm filters used in this study had almost noability to remove fluoranthene. Therefore, other ways of reducing or treating fluoranthene areneeded. However, benzofluoranthene, which was common in most samples and is potentiallytoxic to aquatic life in low concentrations, was reduced by almost 40% by Foss storm filters. Therefore, although not effective for all PAH contamination, use of Foss storm filters can helpreduce some of the most toxic components.
17
Other best management practices (BMPs) for urban stormwater control should also beconsidered. Many of these are described in detail by others [13]. Some of these are alreadybeing used by the City of Plymouth. For example, the city already has an aggressive streetsweeping program. Other BMPs may include use of porous pavement, construction ofstormwater retention ponds, installation of swales and filter strips, flushing storm drains,implementing a vehicle spill control plan, and setting up a used oil recycling program.
RECOMMENDATIONS
1. Continue to use storm filter inserts on as many stormwater inlets as possible.
2. Concentrate urban stormwater control efforts on the Schuh Ditch watershed.
3. Consider the use of additional best management practices to improve water quality in urban stormwater.
4. Work with the Indiana Department of Environmental Management to encourage elimination of failing sewers near Wyatt and reduction of combined sewer overflows in Bremen. Work with the Marshall County Soil and Water Conservation District to locate important sources of E.coli loading from livestock.
18
LITERATURE CITED
1. Standard Methods for the Examination of Water and Wastewater, 18th Edition, Edited byArnold E. Greenberg, Lenore S. Clesceri, and Andrew D. Lewis, 1992. American PublicHealth Association, Washington, D.C.
2. Huckins, J.N. et al., 1990. Semipermeable membrane devices containing model lipid: anew approach to monitoring the bioavailability of lipophilic contaminants and estimatingtheir bioconcentration potential. Chemosphere 20: 533-552.
3. Bright, G.R. 1997. Water quality study of the Yellow River in Marshall and StarkeCounties of Indiana. ARN 97-922. Indiana Department of Environmental Management,Office of Water Management. 22 pp. + appendices.
4. Nix, P.G., M.M. Daykin, and K.L. Vikas, 1994. Fecal pollution events reconstructed andsources identified using a sediment bag grid. Water Environment Res. 66: 814-818.
5. GC-MS Method 3550B: Gas Chromatography/Mass Spectrometry for Semi-volatileorganics: EPA SW 846. Environmental Protection Agency, Sept. 1986.
6. McFall, L. 1990. Upper Yellow River Intensive Segment Survey: June and July 1990. Indiana Department of Environmental Management, Office of Water, Indianapolis, IN
7. Lee, J.H., P.F. Landrum, L.J. Field, and C.H. Koh, 2001. Application of a polycyclicaromatic hydrocarbond model and a logistic regression model to sediment toxicity databased on a species specif, water only LC50 Toxic Unit for Hyalella azteca. Environ.Toxicol. Chem. 20: 2102-2113.
8. Pitt, R. R. Field, M. Lalor, and M. Brown, 1995. Urban stormwater toxic pollutants:assessment, sources, and treatability. Water Env. Res. 67: 260-275.
9. National Oceanographic and Atmospheric Administration (NOAA). Unpublished datasummary of average precipitation for Indiana. Washington, D.C.
10. Indiana Department of Environmental Management, 2000. Indiana water quality [305b]report. Office of Water Management, Planning Branch. Indianapolis, IN
11. U.S. EPA, 1995. National water quality inventory, 1994 report to Congress. EPA 841-R-95-005. Office of Water, Washington, D.C.
12. Yousef, S.E. et al, 2002. Quantitative structure-activity relationship for the photoinducedtoxicity of PAHs to the luminescent bacteria Vibrio fischeri. Envir. Toxicol. Chem.21:2225-2232.
13. Caraco. D. and R. Claytor. 1997. Stormwater BMP design supplement for cold climates. Center for Watershed Protection, Ellicott City, MD.

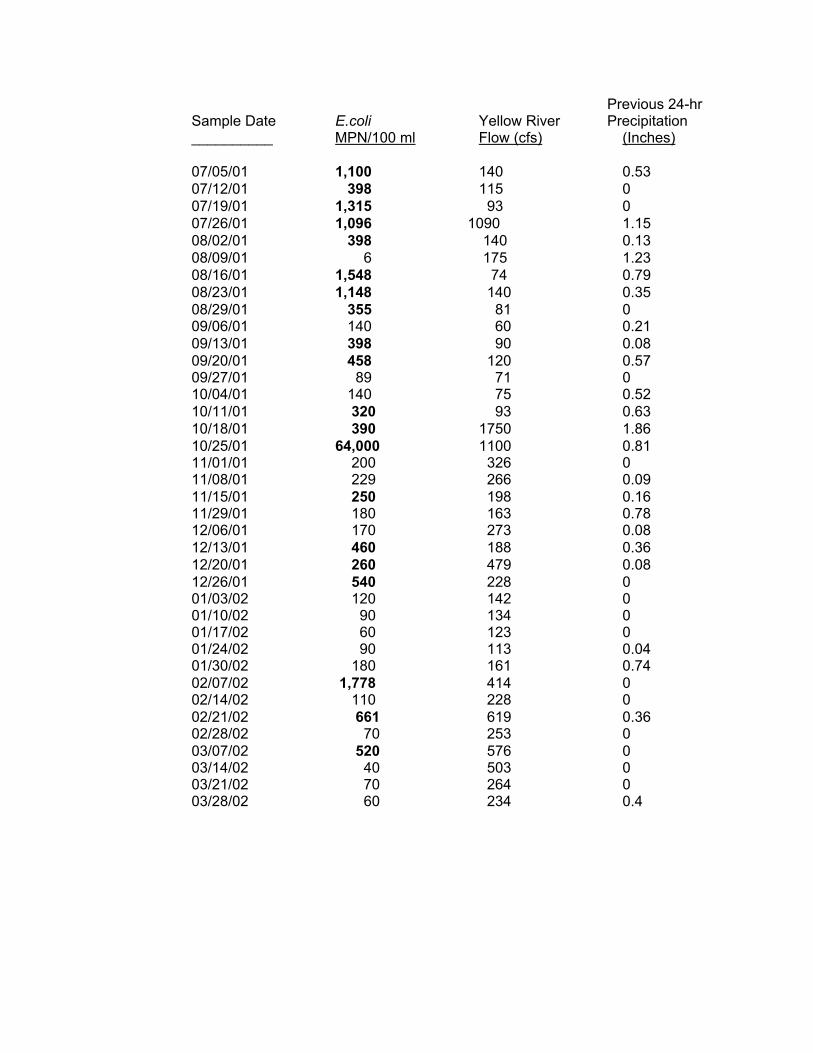
Appendix A. Instream E.coli Data
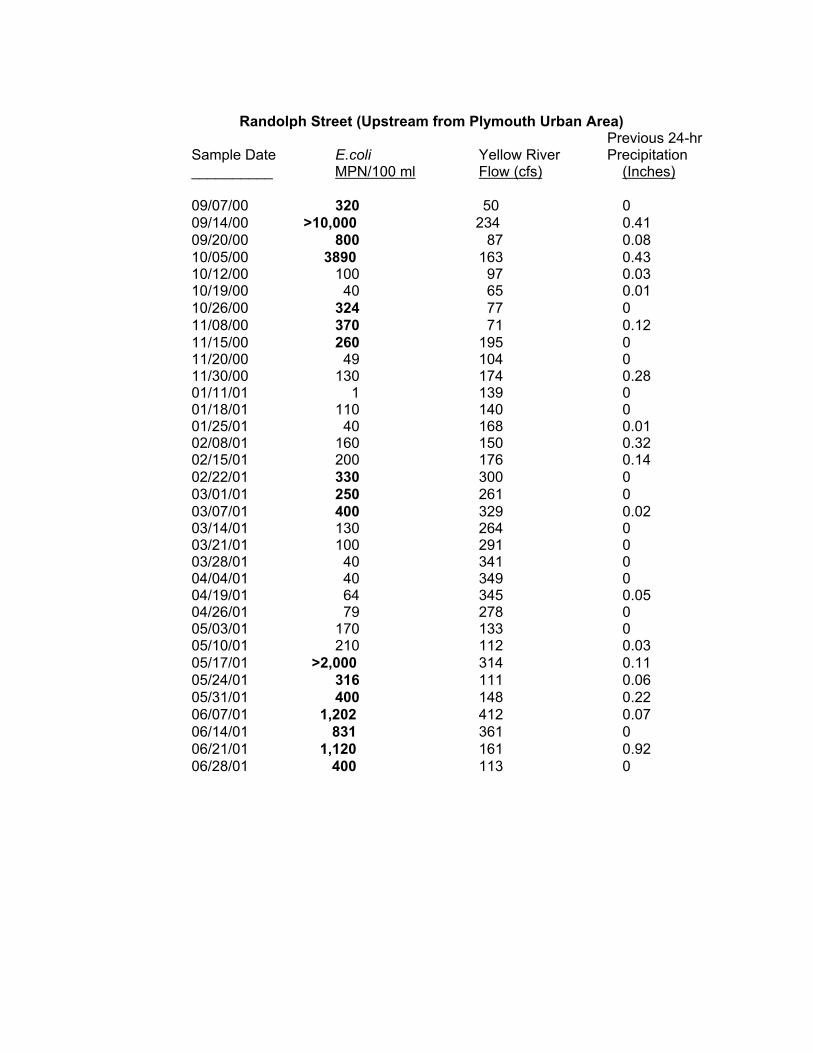
Randolph Street (Upstream from Plymouth Urban Area) Previous 24-hr
Sample Date E.coli Yellow River Precipitation__________ MPN/100 ml Flow (cfs) (Inches)
09/07/00 320 50 009/14/00 >10,000 234 0.4109/20/00 800 87 0.0810/05/00 3890 163 0.4310/12/00 100 97 0.0310/19/00 40 65 0.0110/26/00 324 77 011/08/00 370 71 0.1211/15/00 260 195 011/20/00 49 104 011/30/00 130 174 0.2801/11/01 1 139 001/18/01 110 140 001/25/01 40 168 0.0102/08/01 160 150 0.3202/15/01 200 176 0.1402/22/01 330 300 003/01/01 250 261 003/07/01 400 329 0.0203/14/01 130 264 003/21/01 100 291 003/28/01 40 341 004/04/01 40 349 004/19/01 64 345 0.0504/26/01 79 278 005/03/01 170 133 005/10/01 210 112 0.0305/17/01 >2,000 314 0.1105/24/01 316 111 0.0605/31/01 400 148 0.2206/07/01 1,202 412 0.0706/14/01 831 361 006/21/01 1,120 161 0.9206/28/01 400 113 0
Previous 24-hrSample Date E.coli Yellow River Precipitation__________ MPN/100 ml Flow (cfs) (Inches)
07/05/01 1,100 140 0.5307/12/01 398 115 007/19/01 1,315 93 007/26/01 1,096 1090 1.1508/02/01 398 140 0.1308/09/01 6 175 1.2308/16/01 1,548 74 0.7908/23/01 1,148 140 0.3508/29/01 355 81 009/06/01 140 60 0.2109/13/01 398 90 0.0809/20/01 458 120 0.5709/27/01 89 71 010/04/01 140 75 0.5210/11/01 320 93 0.6310/18/01 390 1750 1.8610/25/01 64,000 1100 0.8111/01/01 200 326 011/08/01 229 266 0.0911/15/01 250 198 0.1611/29/01 180 163 0.7812/06/01 170 273 0.0812/13/01 460 188 0.3612/20/01 260 479 0.0812/26/01 540 228 001/03/02 120 142 001/10/02 90 134 001/17/02 60 123 001/24/02 90 113 0.0401/30/02 180 161 0.7402/07/02 1,778 414 002/14/02 110 228 002/21/02 661 619 0.3602/28/02 70 253 003/07/02 520 576 003/14/02 40 503 003/21/02 70 264 003/28/02 60 234 0.4
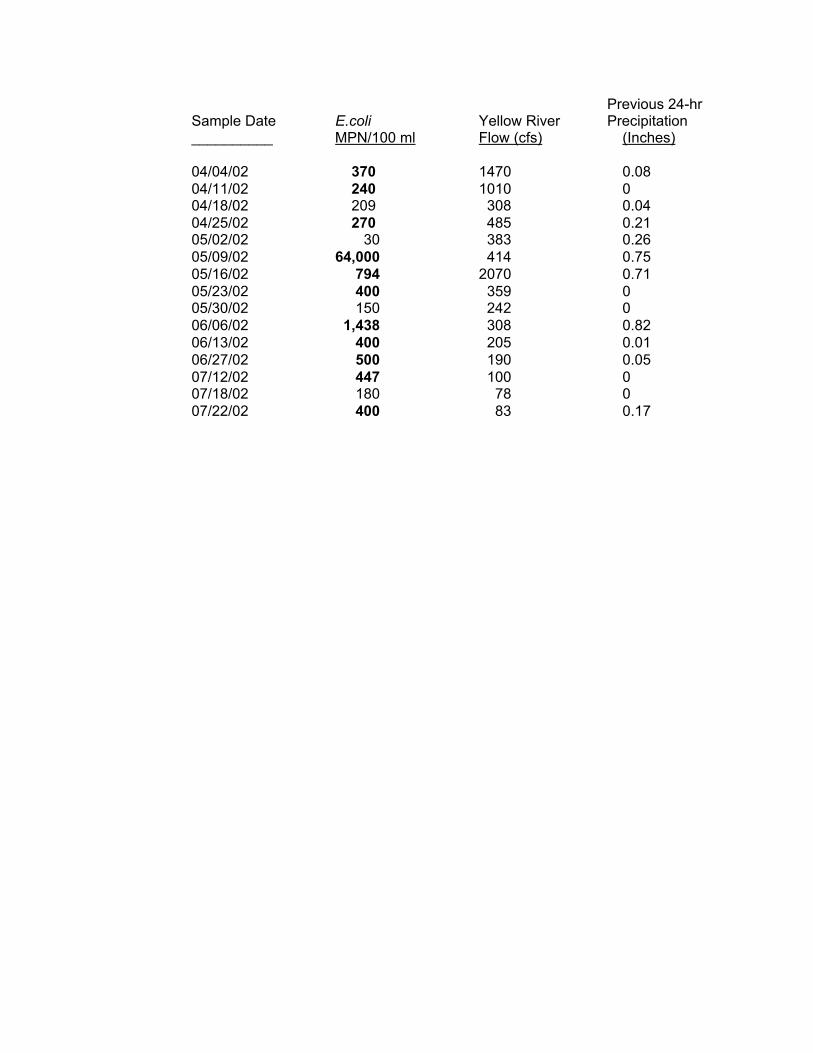
Previous 24-hrSample Date E.coli Yellow River Precipitation__________ MPN/100 ml Flow (cfs) (Inches)
04/04/02 370 1470 0.0804/11/02 240 1010 004/18/02 209 308 0.0404/25/02 270 485 0.2105/02/02 30 383 0.2605/09/02 64,000 414 0.7505/16/02 794 2070 0.7105/23/02 400 359 005/30/02 150 242 006/06/02 1,438 308 0.8206/13/02 400 205 0.0106/27/02 500 190 0.0507/12/02 447 100 007/18/02 180 78 007/22/02 400 83 0.17
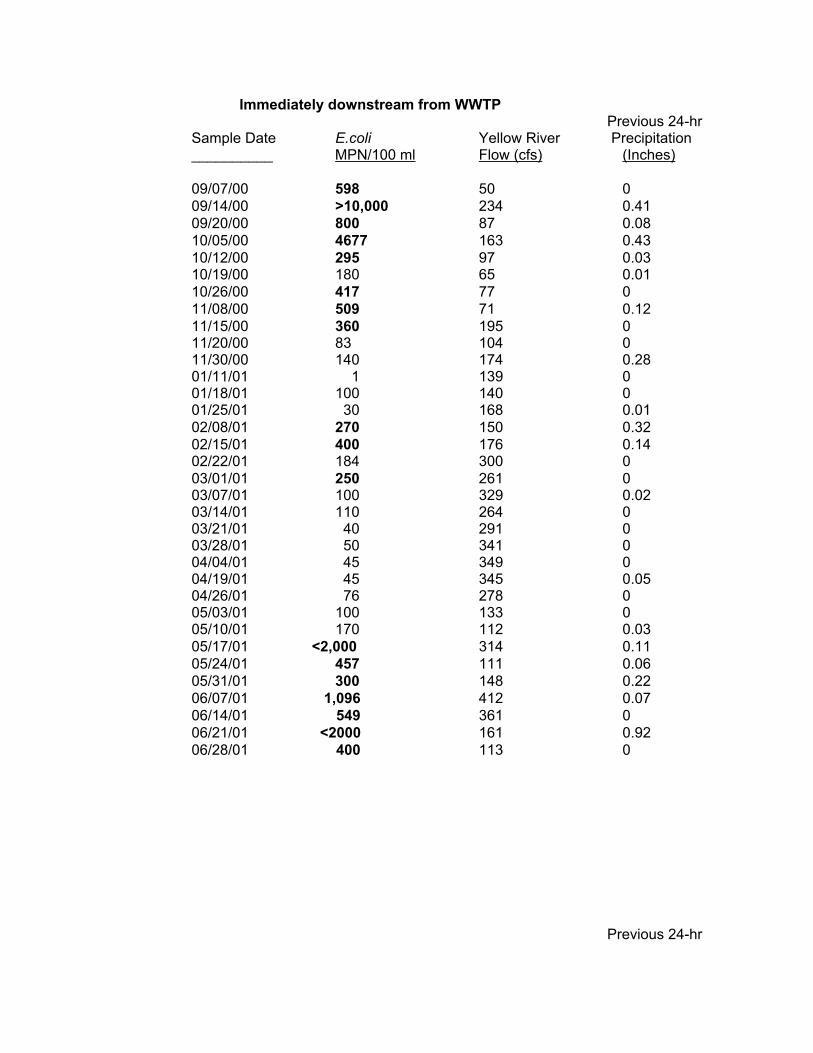
Immediately downstream from WWTP Previous 24-hr
Sample Date E.coli Yellow River Precipitation__________ MPN/100 ml Flow (cfs) (Inches)
09/07/00 598 50 009/14/00 >10,000 234 0.4109/20/00 800 87 0.0810/05/00 4677 163 0.4310/12/00 295 97 0.0310/19/00 180 65 0.0110/26/00 417 77 011/08/00 509 71 0.1211/15/00 360 195 011/20/00 83 104 011/30/00 140 174 0.2801/11/01 1 139 001/18/01 100 140 001/25/01 30 168 0.0102/08/01 270 150 0.3202/15/01 400 176 0.1402/22/01 184 300 003/01/01 250 261 003/07/01 100 329 0.0203/14/01 110 264 003/21/01 40 291 003/28/01 50 341 004/04/01 45 349 004/19/01 45 345 0.0504/26/01 76 278 005/03/01 100 133 005/10/01 170 112 0.0305/17/01 <2,000 314 0.1105/24/01 457 111 0.0605/31/01 300 148 0.2206/07/01 1,096 412 0.0706/14/01 549 361 006/21/01 <2000 161 0.9206/28/01 400 113 0
Previous 24-hr
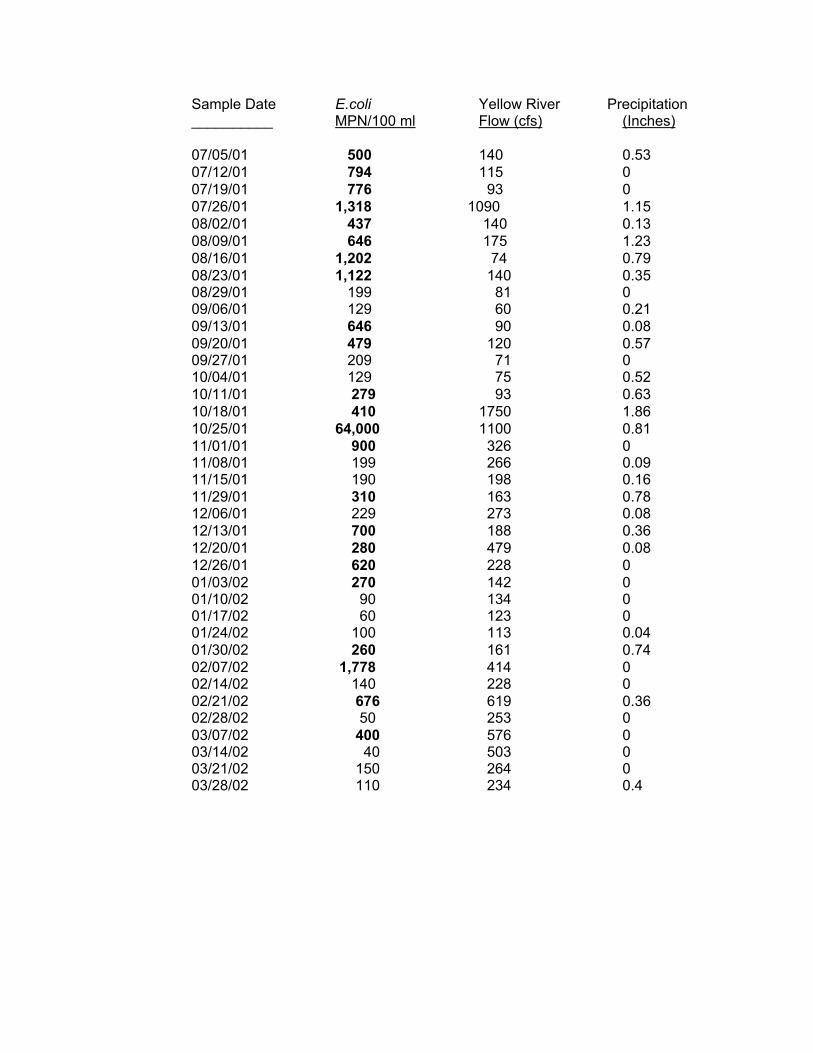
Sample Date E.coli Yellow River Precipitation__________ MPN/100 ml Flow (cfs) (Inches)
07/05/01 500 140 0.5307/12/01 794 115 007/19/01 776 93 007/26/01 1,318 1090 1.1508/02/01 437 140 0.1308/09/01 646 175 1.2308/16/01 1,202 74 0.7908/23/01 1,122 140 0.3508/29/01 199 81 009/06/01 129 60 0.2109/13/01 646 90 0.0809/20/01 479 120 0.5709/27/01 209 71 010/04/01 129 75 0.5210/11/01 279 93 0.6310/18/01 410 1750 1.8610/25/01 64,000 1100 0.8111/01/01 900 326 011/08/01 199 266 0.0911/15/01 190 198 0.1611/29/01 310 163 0.7812/06/01 229 273 0.0812/13/01 700 188 0.3612/20/01 280 479 0.0812/26/01 620 228 001/03/02 270 142 001/10/02 90 134 001/17/02 60 123 001/24/02 100 113 0.0401/30/02 260 161 0.7402/07/02 1,778 414 002/14/02 140 228 002/21/02 676 619 0.3602/28/02 50 253 003/07/02 400 576 003/14/02 40 503 003/21/02 150 264 003/28/02 110 234 0.4

Previous 24-hrSample Date E.coli Yellow River Precipitation__________ MPN/100 ml Flow (cfs) (Inches)
04/04/02 420 1470 0.0804/11/02 246 1010 004/18/02 170 308 0.0404/25/02 320 485 0.2105/02/02 30 383 0.2605/09/02 64,000 414 0.7505/16/02 794 2070 0.7105/23/02 400 359 005/30/02 150 242 006/06/02 1,438 308 0.8206/13/02 400 205 0.0106/27/02 500 190 0.0507/12/02 447 100 007/18/02 180 78 007/22/02 400 83 0.17
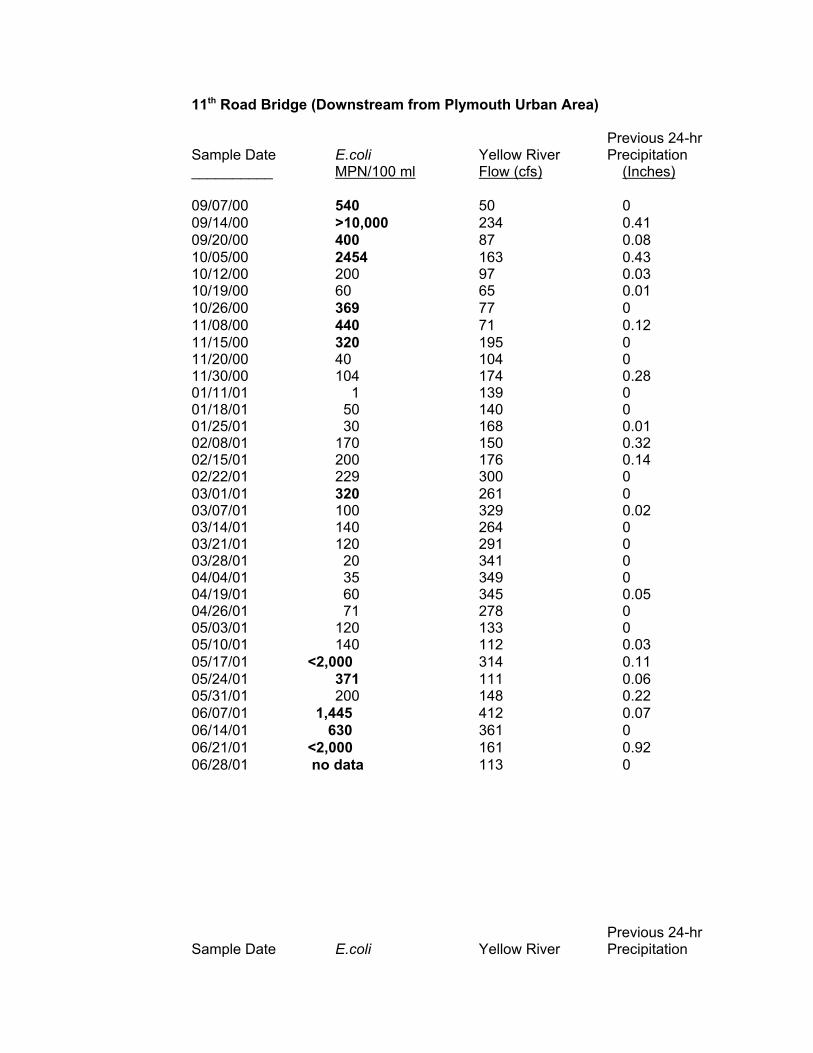
11th Road Bridge (Downstream from Plymouth Urban Area)
Previous 24-hrSample Date E.coli Yellow River Precipitation__________ MPN/100 ml Flow (cfs) (Inches)
09/07/00 540 50 009/14/00 >10,000 234 0.4109/20/00 400 87 0.0810/05/00 2454 163 0.4310/12/00 200 97 0.0310/19/00 60 65 0.0110/26/00 369 77 011/08/00 440 71 0.1211/15/00 320 195 011/20/00 40 104 011/30/00 104 174 0.2801/11/01 1 139 001/18/01 50 140 001/25/01 30 168 0.0102/08/01 170 150 0.3202/15/01 200 176 0.1402/22/01 229 300 003/01/01 320 261 003/07/01 100 329 0.0203/14/01 140 264 003/21/01 120 291 003/28/01 20 341 004/04/01 35 349 004/19/01 60 345 0.0504/26/01 71 278 005/03/01 120 133 005/10/01 140 112 0.0305/17/01 <2,000 314 0.1105/24/01 371 111 0.0605/31/01 200 148 0.2206/07/01 1,445 412 0.0706/14/01 630 361 006/21/01 <2,000 161 0.9206/28/01 no data 113 0
Previous 24-hrSample Date E.coli Yellow River Precipitation
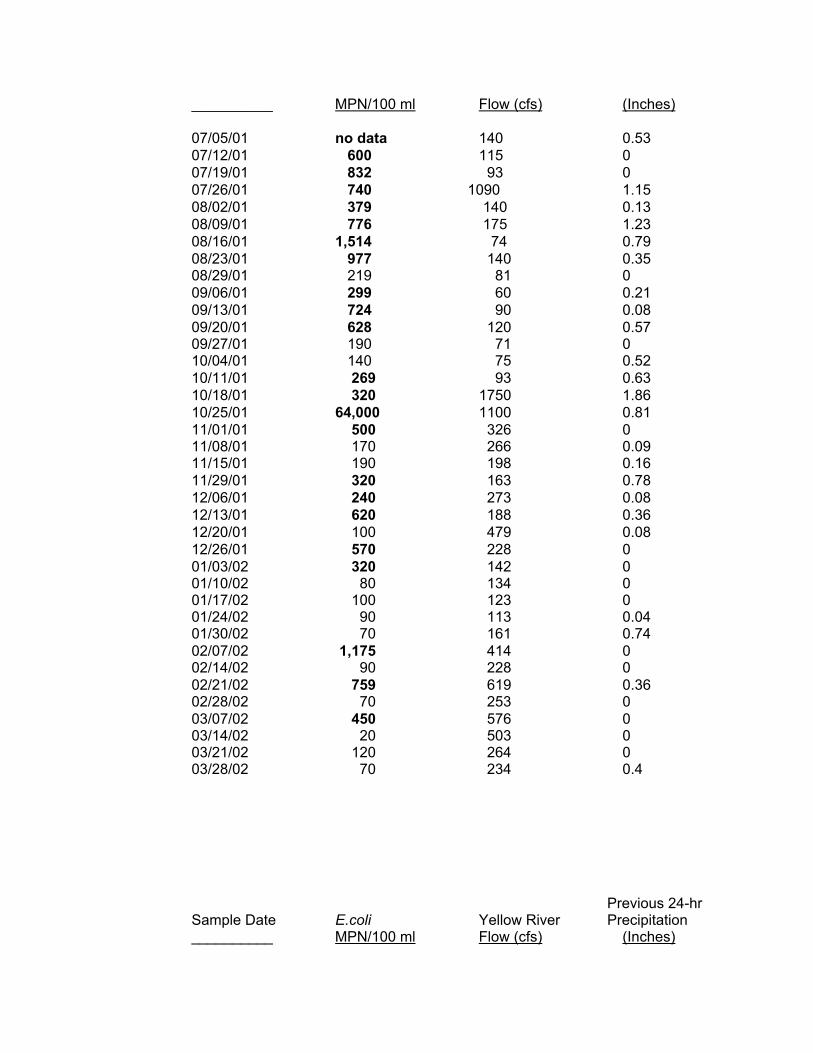
__________ MPN/100 ml Flow (cfs) (Inches)
07/05/01 no data 140 0.5307/12/01 600 115 007/19/01 832 93 007/26/01 740 1090 1.1508/02/01 379 140 0.1308/09/01 776 175 1.2308/16/01 1,514 74 0.7908/23/01 977 140 0.3508/29/01 219 81 009/06/01 299 60 0.2109/13/01 724 90 0.0809/20/01 628 120 0.5709/27/01 190 71 010/04/01 140 75 0.5210/11/01 269 93 0.6310/18/01 320 1750 1.8610/25/01 64,000 1100 0.8111/01/01 500 326 011/08/01 170 266 0.0911/15/01 190 198 0.1611/29/01 320 163 0.7812/06/01 240 273 0.0812/13/01 620 188 0.3612/20/01 100 479 0.0812/26/01 570 228 001/03/02 320 142 001/10/02 80 134 001/17/02 100 123 001/24/02 90 113 0.0401/30/02 70 161 0.7402/07/02 1,175 414 002/14/02 90 228 002/21/02 759 619 0.3602/28/02 70 253 003/07/02 450 576 003/14/02 20 503 003/21/02 120 264 003/28/02 70 234 0.4
Previous 24-hrSample Date E.coli Yellow River Precipitation__________ MPN/100 ml Flow (cfs) (Inches)
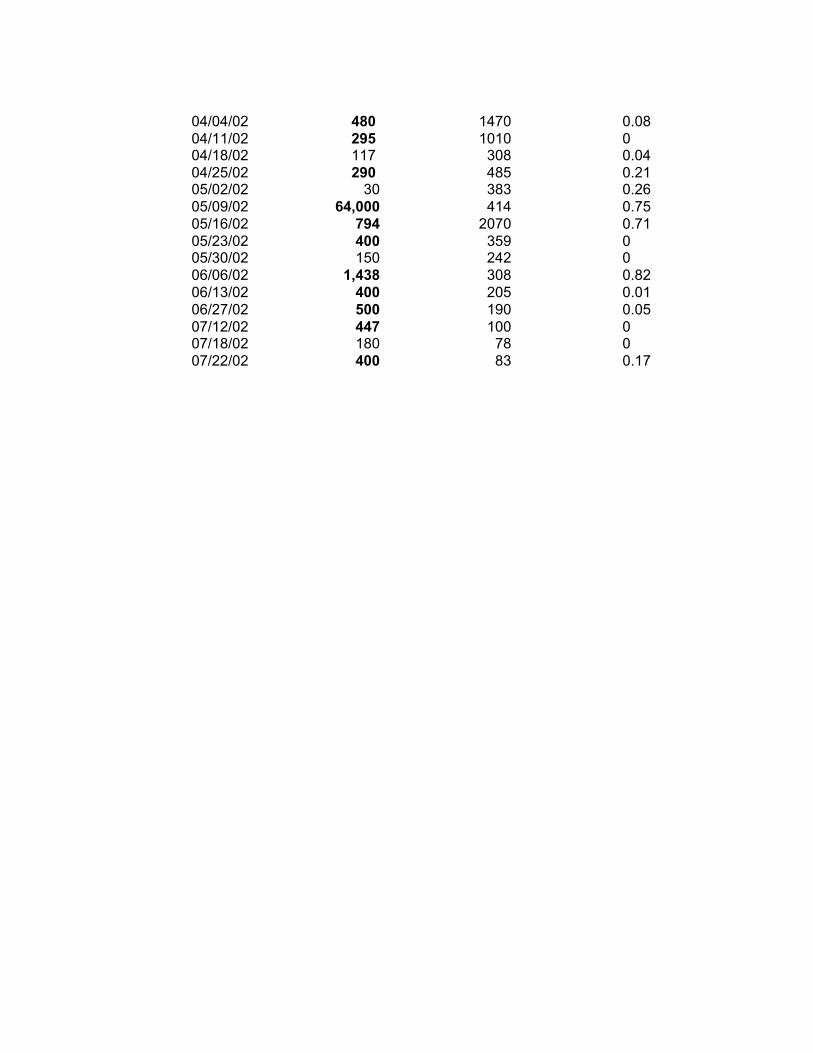
04/04/02 480 1470 0.0804/11/02 295 1010 004/18/02 117 308 0.0404/25/02 290 485 0.2105/02/02 30 383 0.2605/09/02 64,000 414 0.7505/16/02 794 2070 0.7105/23/02 400 359 005/30/02 150 242 006/06/02 1,438 308 0.8206/13/02 400 205 0.0106/27/02 500 190 0.0507/12/02 447 100 007/18/02 180 78 007/22/02 400 83 0.17
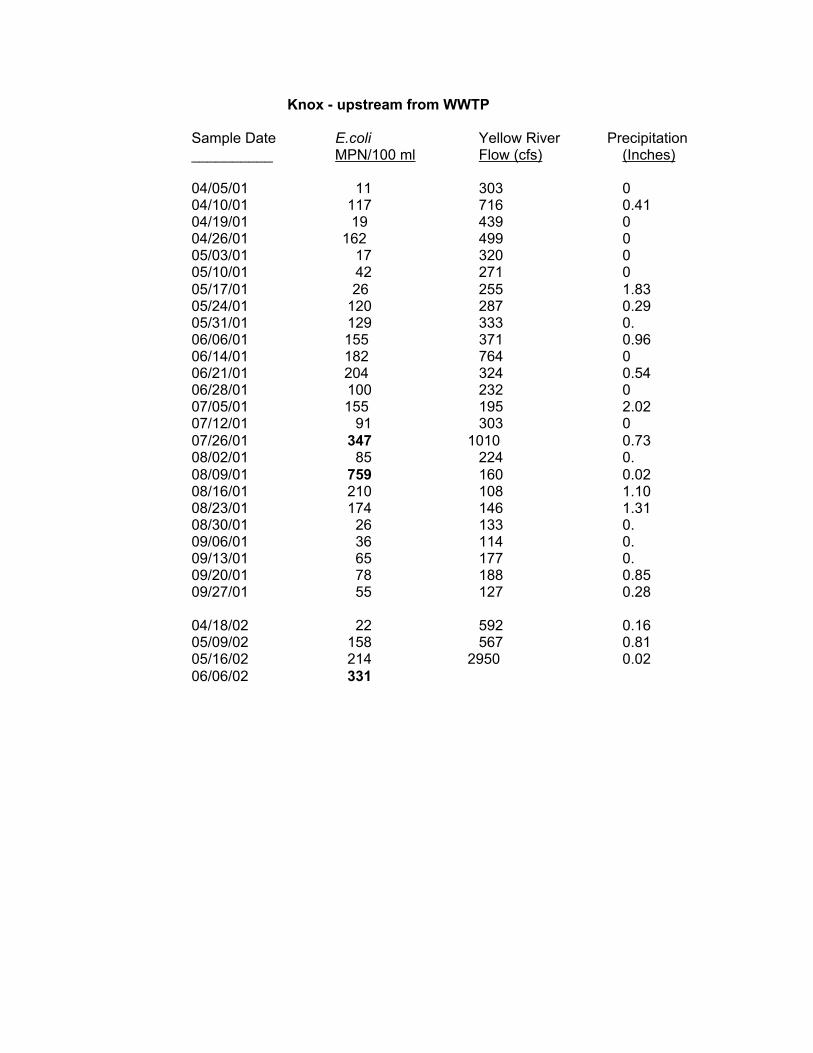
Knox - upstream from WWTP
Sample Date E.coli Yellow River Precipitation__________ MPN/100 ml Flow (cfs) (Inches)
04/05/01 11 303 004/10/01 117 716 0.4104/19/01 19 439 004/26/01 162 499 005/03/01 17 320 005/10/01 42 271 005/17/01 26 255 1.8305/24/01 120 287 0.2905/31/01 129 333 0.06/06/01 155 371 0.9606/14/01 182 764 006/21/01 204 324 0.5406/28/01 100 232 007/05/01 155 195 2.0207/12/01 91 303 007/26/01 347 1010 0.7308/02/01 85 224 0.08/09/01 759 160 0.0208/16/01 210 108 1.1008/23/01 174 146 1.3108/30/01 26 133 0.09/06/01 36 114 0. 09/13/01 65 177 0. 09/20/01 78 188 0.8509/27/01 55 127 0.28
04/18/02 22 592 0.1605/09/02 158 567 0.8105/16/02 214 2950 0.0206/06/02 331
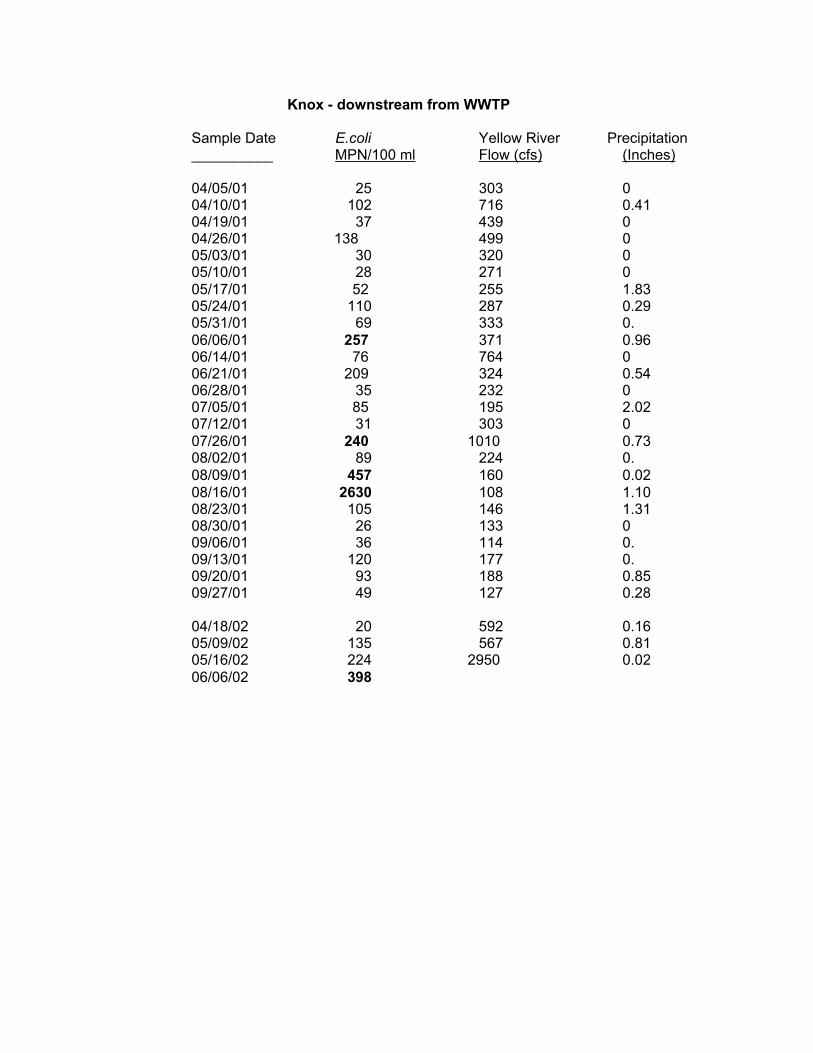
Knox - downstream from WWTP
Sample Date E.coli Yellow River Precipitation__________ MPN/100 ml Flow (cfs) (Inches)
04/05/01 25 303 004/10/01 102 716 0.4104/19/01 37 439 004/26/01 138 499 005/03/01 30 320 005/10/01 28 271 005/17/01 52 255 1.8305/24/01 110 287 0.2905/31/01 69 333 0.06/06/01 257 371 0.9606/14/01 76 764 006/21/01 209 324 0.5406/28/01 35 232 007/05/01 85 195 2.0207/12/01 31 303 007/26/01 240 1010 0.7308/02/01 89 224 0.08/09/01 457 160 0.0208/16/01 2630 108 1.1008/23/01 105 146 1.3108/30/01 26 133 009/06/01 36 114 0. 09/13/01 120 177 0. 09/20/01 93 188 0.8509/27/01 49 127 0.28
04/18/02 20 592 0.1605/09/02 135 567 0.8105/16/02 224 2950 0.0206/06/02 398

Appendix B. Sterile Sandbag Monitoring Data

Appendix C. PAH Data

Appendix D. Public Education Materials