topic a: irish economic history to independence outline topic title eoi ch dates a irish economic...
TRANSCRIPT

T C D M . S C . ( E P S ) – R O N A N L Y O N S – E C 8 0 0 1
I R I S H E C O N O M I C P O L I C Y I S S U E S & C O N T E X T
TOPIC A: IRISH ECONOMIC HISTORY TO
INDEPENDENCE

MODULE OUTLINE
Topic Title EoI Ch Dates
A Irish Economic History to Independence 1+ MT1-2
B Irish Economic History since Independence 1+ MT3-4
C The Economy & Economic Growth 2, 7 MT5-6
D Public Finances, Debt & Taxation 3, 4 MT8-9
E The Labour Market 6 MT10-11
F Social Justice & Inequality 8 HT1-2
G Regulation & Competition 5 HT3-4
H Competitiveness & Trade 9, 11 HT5-6
I Health & Education 12, 13 HT8-9
J Natural Resources & Real Estate 10, 14* HT10-11

ADMIN
• Lectures: Fridays, 10.30-12.00 both (MT, HT) terms
• Contacting me…
• Offices Hours: Wednesdays, 10.00-12.30 (MT)
• More practically, by email: [email protected]
• Assessment:
• MT: of 5 essays, do 2 – 1100-1200 words (20%)
• HT: of 5 essays, do 1 – 2500 words (20%)
• Exam: answer 4 questions from a choice of 8 (60%)
• Full details to follow

TOPIC A: STRUCTURE
Irish Economic History to Independence
1. Why bother?
2. The Irish Economy before Waterloo
3. From Waterloo to the Great Famine
4. The Great Famine
5. The Post-Famine Economy

TOPIC A. READINGS
• Cormac O Grada,
‘Ireland: A New
Economic History, 1780-
1939’
• In particular parts II, III, IV
• Hone your skimming skills!
• John O’Hagan & Carol
Newman, ‘Economy of
Ireland’ (12th Edition)
• Chapter 1, Historical
Background

WHY BOTHER?
• Why bother studying
economic history at all?
• And why bother studying
Irish economic history,
especially pre-
Independence?
THE VALUE OF ECONOMIC HISTORY
• Two main reasons why economists are interested in
economic history
• Context is crucial: can’t understand Ireland since 2007
without understanding the Celtic Tiger economy, which was a product of the Irish economy between the 1960s and
1980s, itself a reaction to the economy of the 1930s-1950s…
etc.
• Our only laboratory: to test an economic theory, we must apply it to something that happened (i.e. the past)
• In addition, it’s fascinating!
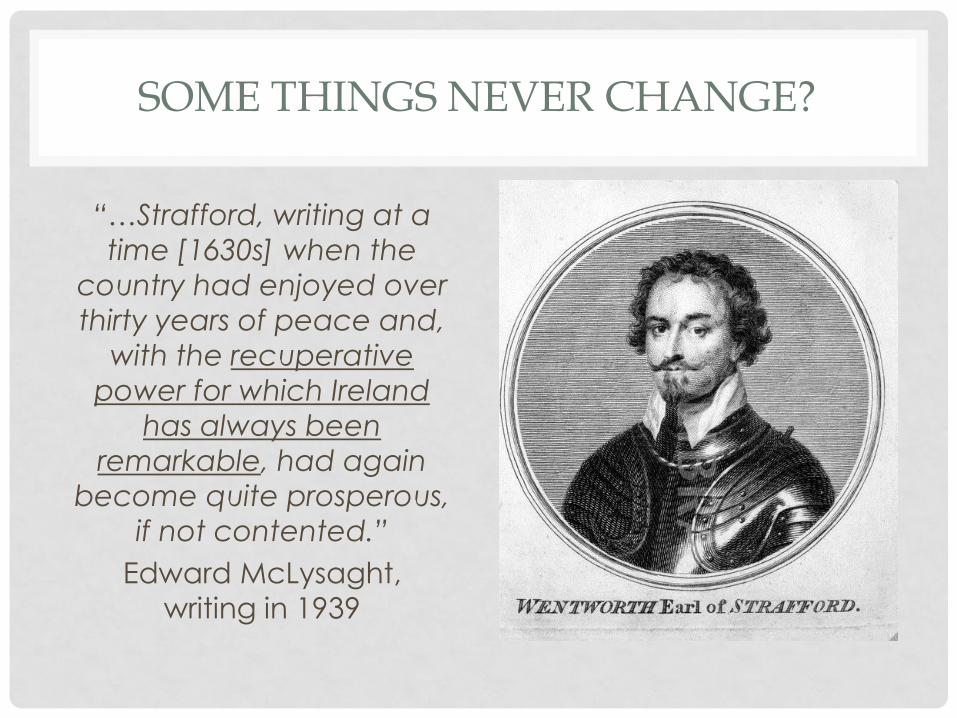
SOME THINGS NEVER CHANGE?
“…Strafford, writing at a
time [1630s] when the
country had enjoyed over
thirty years of peace and,
with the recuperative
power for which Ireland
has always been
remarkable, had again
become quite prosperous,
if not contented.”
Edward McLysaght,
writing in 1939

A ROAD-MAP FOR THE TOPIC
• Aspects to study
• Population, Income & Living Standards
• Land, Agriculture & Trade
• Commerce, Infrastructure & Finance
• Landmark years
• 1815 – End of Napoleonic Wars
• 1845 – Start of Great Famine
• 1922 – Independence & Partition
APPROPRIATE METRICS OF SUCCESS
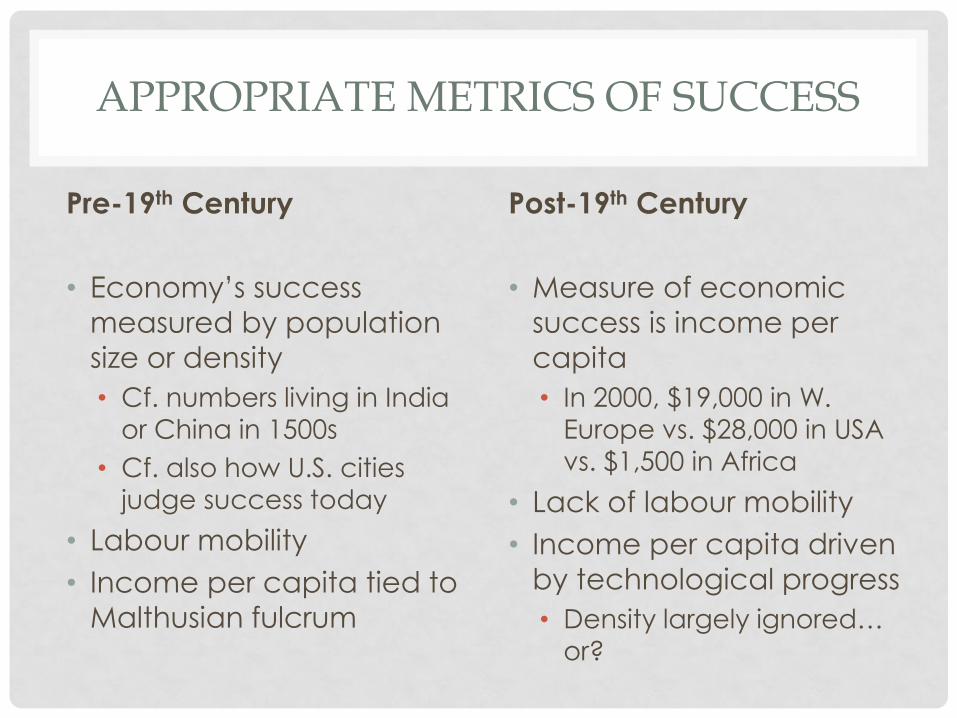
Pre-19th Century
• Economy’s success
measured by population
size or density
• Cf. numbers living in India
or China in 1500s
• Cf. also how U.S. cities judge success today
• Labour mobility
• Income per capita tied to
Malthusian fulcrum
Post-19th Century
• Measure of economic
success is income per
capita
• In 2000, $19,000 in W.
Europe vs. $28,000 in USA
vs. $1,500 in Africa
• Lack of labour mobility
• Income per capita driven
by technological progress
• Density largely ignored…
or?

TOPIC A: STRUCTURE
Irish Economic History to Independence
1. Why bother?
2. The Irish Economy before Waterloo
3. From Waterloo to the Great Famine
4. The Great Famine
5. The Post-Famine Economy

PRE-1815: DEMOGRAPHICS
• Ireland a demographic
outlier in western Europe
since the 1600s
• Case study of the link
between people and
prosperity
• Rapidly growing pop in
second half of 1700s
• Slow-down pre-Famine
• 1780-1815 “false dawn”?
• Contemporary opinion:
1780s and 1790s a time of
economic progress
0.0%
0.2%
0.4%
0.6%
0.8%
1.0%
1.2%
1.4%
1.6%
1.8%
1753
-17
91
1791
-18
21
1821
-18
41
Annual population growth
Dickson
et al
Lee

PROSPERITY SEEN IN PROPERTY MKT
Number of deeds registered by year, 1708-1800
Registry being set up
Boom in late 1700s
Source: O’Rourke & Polak

IRELAND AS DEMOGRAPHIC OUTLIER
-0.6%
-0.4%
-0.2%
0.0%
0.2%
0.4%
0.6%
0.8%
1.0%
1600-1820 1820-1980 1980-2014
Average annual population growth, by period
Ireland
"Big 5" of
Western
Europe
Source: Maddison dataset

BASICS OF MALTHUSIAN ECONOMICS
• Boost in productivity (e.g.
new strain of rice/potato)
leads to prosperity…
• … which leads to higher
population…
• … spreading resources
among greater pop’n…
• …driving incomes back to “pre-boost” levels
• Same logic in reverse:
• Negative shock (e.g. bad
crop) reduces pop’n → ↑
land per head, driving up
incomes (and thus births) Thomas Malthus (1766-1834)

A MALTHUSIAN BASKET CASE?
• Two key relationships in Malthusian model
1. Wages rise with land-labour ratio (technology)
2. Population growth rises with income
• Did opposite of (2) apply in Ireland?
• Was there a negative relationship between income and
‘nuptiality’ (% that married)?
• Measuring fertility
• Demographers’ preferred measure is combination of marital
fertility (how many children per marriage) and nuptiality
(how many marriages per cohort)
• Balance of evidence: fertility high but nuptiality low,
compared to other countries
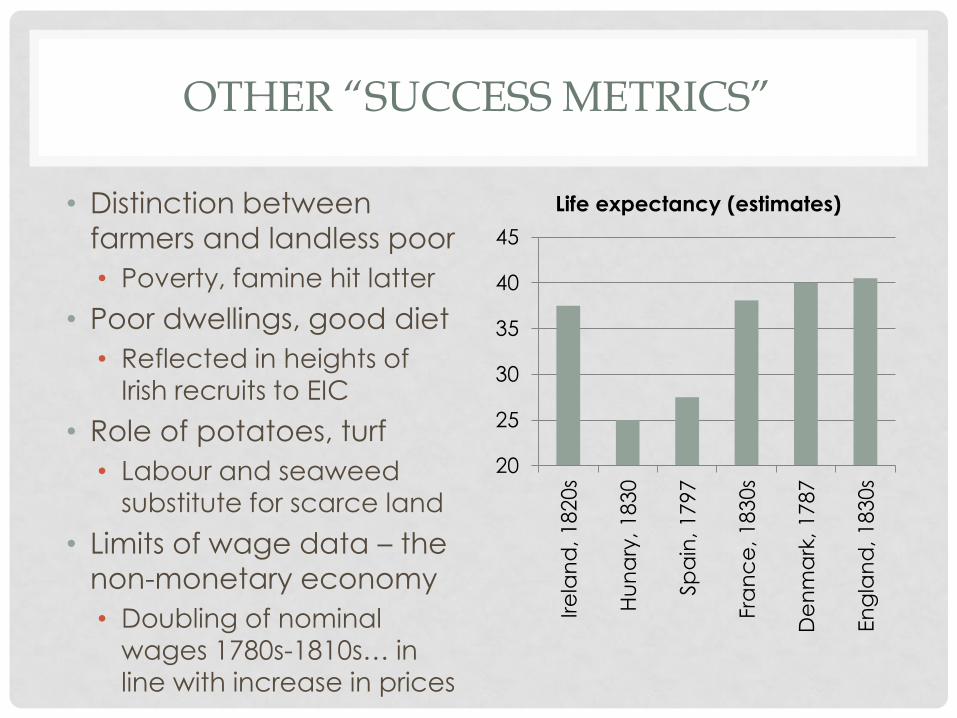
OTHER “SUCCESS METRICS”
• Distinction between
farmers and landless poor
• Poverty, famine hit latter
• Poor dwellings, good diet
• Reflected in heights of
Irish recruits to EIC
• Role of potatoes, turf
• Labour and seaweed substitute for scarce land
• Limits of wage data – the
non-monetary economy
• Doubling of nominal
wages 1780s-1810s… in
line with increase in prices
20
25
30
35
40
45
Ire
lan
d, 1
82
0s
Hu
na
ry, 18
30
Sp
ain
, 1
79
7
Fra
nc
e, 1
83
0s
De
nm
ark
, 1
78
7
En
gla
nd
, 1
830s
Life expectancy (estimates)
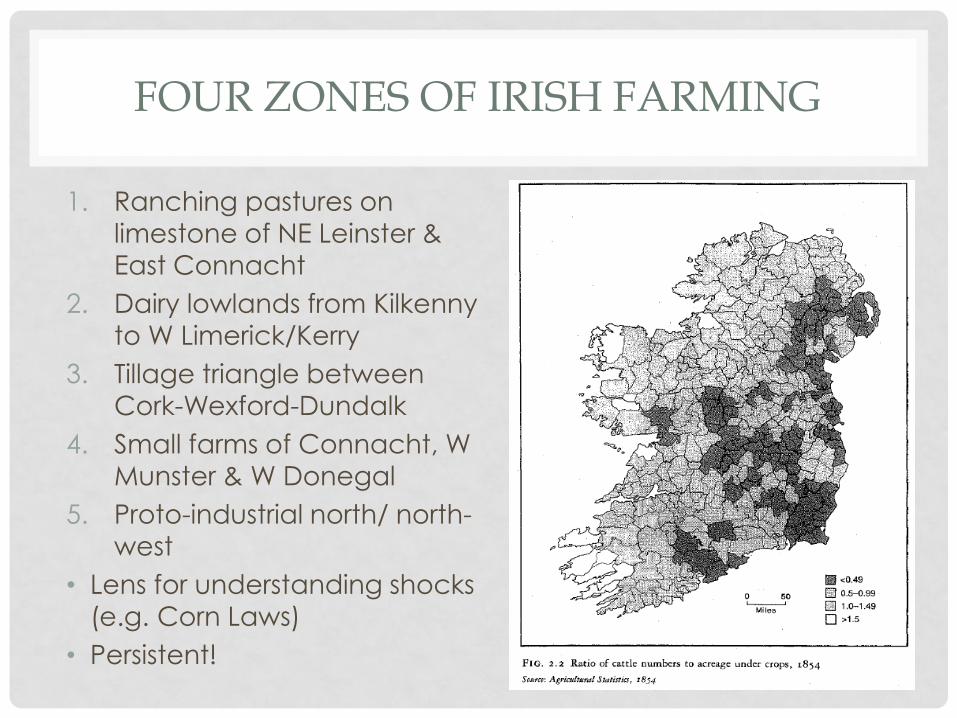
FOUR ZONES OF IRISH FARMING
1. Ranching pastures on limestone of NE Leinster &
East Connacht
2. Dairy lowlands from Kilkenny
to W Limerick/Kerry
3. Tillage triangle between
Cork-Wexford-Dundalk
4. Small farms of Connacht, W
Munster & W Donegal
5. Proto-industrial north/ north-
west
• Lens for understanding shocks (e.g. Corn Laws)
• Persistent!
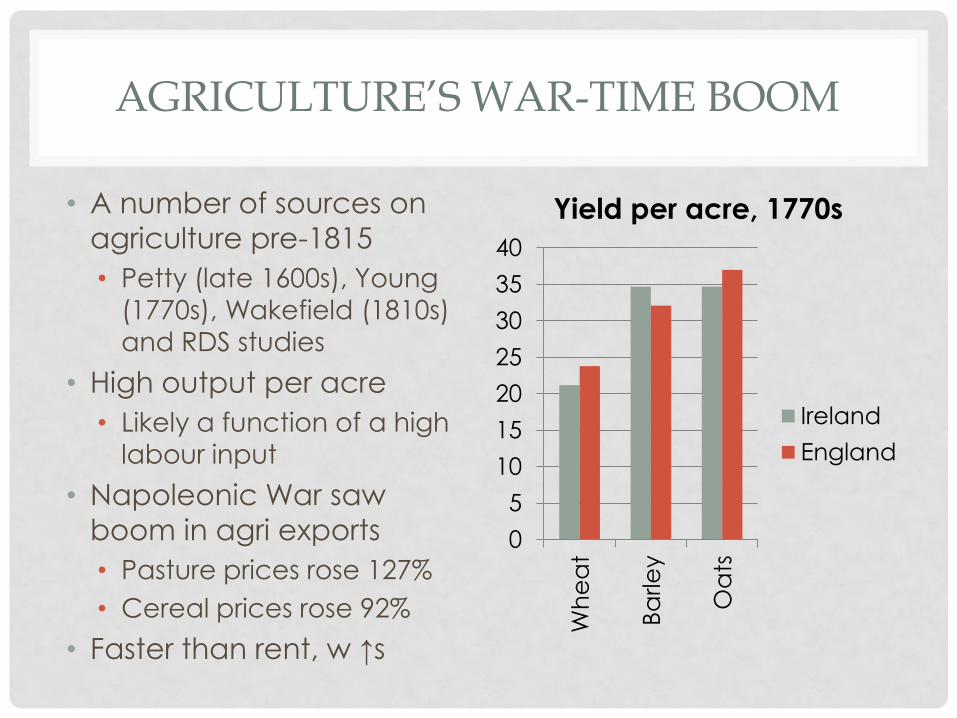
AGRICULTURE’S WAR-TIME BOOM
• A number of sources on
agriculture pre-1815
• Petty (late 1600s), Young
(1770s), Wakefield (1810s)
and RDS studies
• High output per acre
• Likely a function of a high
labour input
• Napoleonic War saw
boom in agri exports
• Pasture prices rose 127%
• Cereal prices rose 92%
• Faster than rent, w ↑s
0
5
10
15
20
25
30
35
40
Wh
ea
t
Ba
rle
y
Oa
ts
Yield per acre, 1770s
Ireland
England
GROWTH IN TRADE & COMMERCE
• Economic integration typically measured through
flows, in particular flows of goods (i.e. trade)
• Measure globalization through this
• Britain and Ireland became significantly more
integrated during 1700s
• Four-fold increase in trade, vs. ~50% for rest-of-world
• Ireland comprised 15% of British trade by 1780, vs. 4% in 1700
• Some pull-back from this in 1780s/1790s
• Promotion of domestic industry by Irish
• Livestock fairs as a measure of commercialization:
• From 700 in 1660s to 3,000 in 1770s to 5,000 in 1845
THE ACT OF UNION
• Political (parliament) & economic (customs) union
• Article 6 allowed 50%/35% tariff on calicoes/muslins to
remain for 7 years before falling to 10%
• Transitional period of protection – all duties to end in 1821
• In retrospect, debt formula far more important
• Ratio of 1:7.5 (similar to trade volumes), i.e. 1:3.6 in per
capita… but relative to per capita incomes?
• 1801-1816: Irish state spent £63m domestically and
£97m as contribution to joint expenditure
• ~1/2 met by tax; no attempt to introduce land, income tax
• National debt soared £27m to £107m – merged in 1817
• Post-war economic gloom amid agri crisis
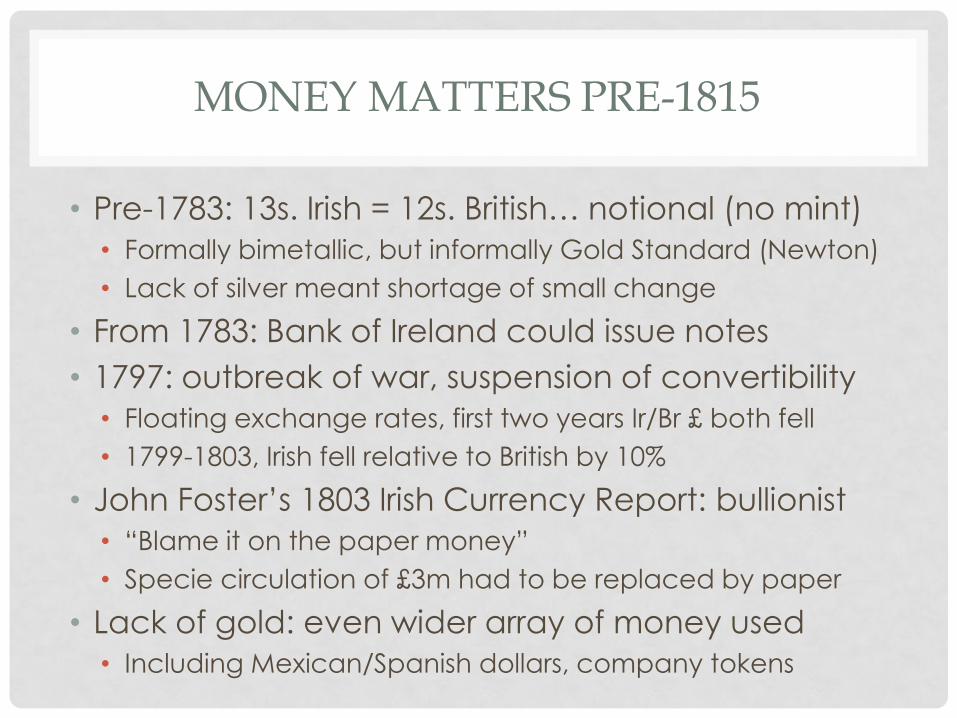
MONEY MATTERS PRE-1815
• Pre-1783: 13s. Irish = 12s. British… notional (no mint)
• Formally bimetallic, but informally Gold Standard (Newton)
• Lack of silver meant shortage of small change
• From 1783: Bank of Ireland could issue notes
• 1797: outbreak of war, suspension of convertibility
• Floating exchange rates, first two years Ir/Br £ both fell
• 1799-1803, Irish fell relative to British by 10%
• John Foster’s 1803 Irish Currency Report: bullionist
• “Blame it on the paper money”
• Specie circulation of £3m had to be replaced by paper
• Lack of gold: even wider array of money used
• Including Mexican/Spanish dollars, company tokens

IRELAND’S EARLY BANKS
• “Precocious” start to banking after 1690s revolution
• Failures meant that by 1760, merchants could not be
bankers – and no. of partners limited to 6
• Explosion of private banks, could issue small notes
• 23 in Youghal! A few notorious examples
• In general, though, needed BofI stock as reserves
• Failures clustered in 1814-16, 1820 – typically bad agri years
• Crisis in May 1820: BofI as lender of last resort
• Ulster pound: BofI not recognised
• War meant two exchange rates with London: Dublin, Belfast
• Convertibility resumed in 1821; single UK pound 1826

TOPIC A: STRUCTURE
Irish Economic History to Independence
1. Why bother?
2. The Irish Economy before Waterloo
3. From Waterloo to the Great Famine
4. The Great Famine
5. The Post-Famine Economy

IRELAND BEFORE THE FAMINE
George O’Brien (1921)
“The destiny of Ireland in
the early 19th Century was
very largely moulded by
the ideas of two great
economists, Adam Smith
and Malthus, and of the
two, the latter was
probably the more
influential.”
Joel Mokyr (1983)
“At least as far as pre-
famine Ireland is
concerned, Malthusian
models seem to have
little explanatory power.”
VS.
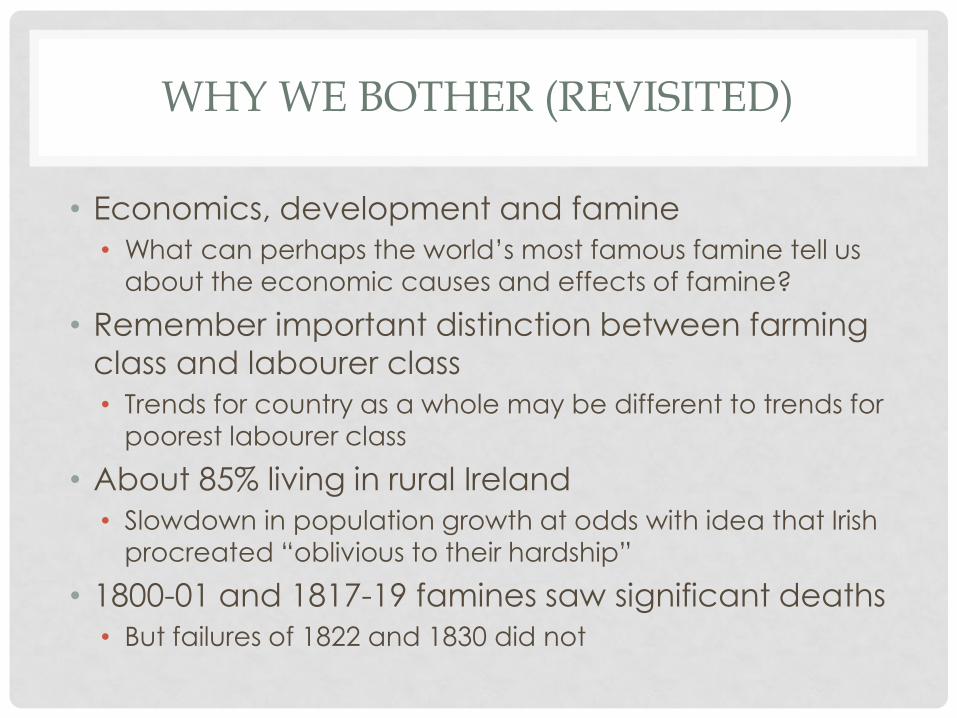
WHY WE BOTHER (REVISITED)
• Economics, development and famine
• What can perhaps the world’s most famous famine tell us
about the economic causes and effects of famine?
• Remember important distinction between farming
class and labourer class
• Trends for country as a whole may be different to trends for
poorest labourer class
• About 85% living in rural Ireland
• Slowdown in population growth at odds with idea that Irish
procreated “oblivious to their hardship”
• 1800-01 and 1817-19 famines saw significant deaths
• But failures of 1822 and 1830 did not
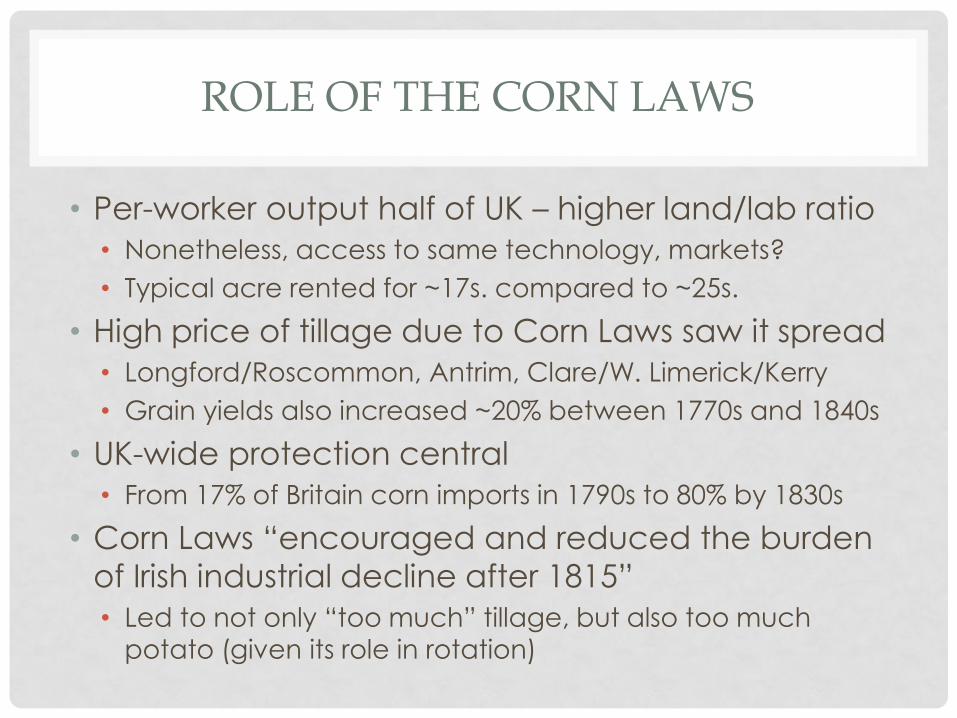
ROLE OF THE CORN LAWS
• Per-worker output half of UK – higher land/lab ratio
• Nonetheless, access to same technology, markets?
• Typical acre rented for ~17s. compared to ~25s.
• High price of tillage due to Corn Laws saw it spread
• Longford/Roscommon, Antrim, Clare/W. Limerick/Kerry
• Grain yields also increased ~20% between 1770s and 1840s
• UK-wide protection central
• From 17% of Britain corn imports in 1790s to 80% by 1830s
• Corn Laws “encouraged and reduced the burden
of Irish industrial decline after 1815”
• Led to not only “too much” tillage, but also too much
potato (given its role in rotation)

IRELAND’S TRANSPORT BOOM(S)
• Underpins market economy (like financial services)
• A mini-boom in road infrastructure & mail coaches
• Regular Limerick-Dublin service by 1760s, Belfast from 1789
• Belfast-Dublin: travel time from 21hrs (1802) to 14hrs (1825)
• Much less success with canals (vs. Britain)
• Only 1 of 5 could be deemed a success – lack of S or D?
• Then again, British success down to coal deposits
• A world leader in ferries & steamships
• 1818, Belfast-Greenock; by 1836 Dublin to Liverpool, London
and Glasgow
• By 1840s, 100 regular crossing, with intense fare competition
• Railway mania mid-1840s – 17/100 schemes by 1850

TRANSFORMATION OF BANKING
• Remember: pre-1820s, many small banks
• Removal of restrictions on # partners, merchants in 1824
• 1825-45: all of Ireland main’s banks (except BofI)
• Northern Bank, Provincial Bank [landlord bank par excellence], Hibernian (all 1825)
• National Bank, 1830s [O’Connell brainchild and millstone!]
• Upper and middle class clientele
• Core business was converting rural deposits into urban
commercial loans, typically 1-year
• Despite competition, high dividends
• From 5% (Royal, National) to 10% (BofI, Northern)
• Bank of Ireland still special (LOLR)

CYCLES BUT NOT TREND
80
85
90
95
100
105
110
1825
1826
1827
1828
1829
1830
1831
1832
1833
1834
1835
1836
1837
1838
1839
1840
1841
1842
1843
1844
1845
Share price index of Irish banks, 1825-1845

FERTILITY BEFORE THE FAMINE
• Fertility: Evidence from
Quakers suggests that
marital fertility in Ireland
was high but fell between
late 1700s and early 1800s
• Nuptiality: pre-Famine, a
high proportion never
married (10-12%)
• Census 1841 implies
increasing marriage age
during 1830s – ~15,000
“averted births” 0.32
0.33
0.34
0.35
0.36
0.37
0.38
0.39
0.40
0.41
Ireland
1840s
England
1851
Germany
1875
Italy
1865
Measure of fertility
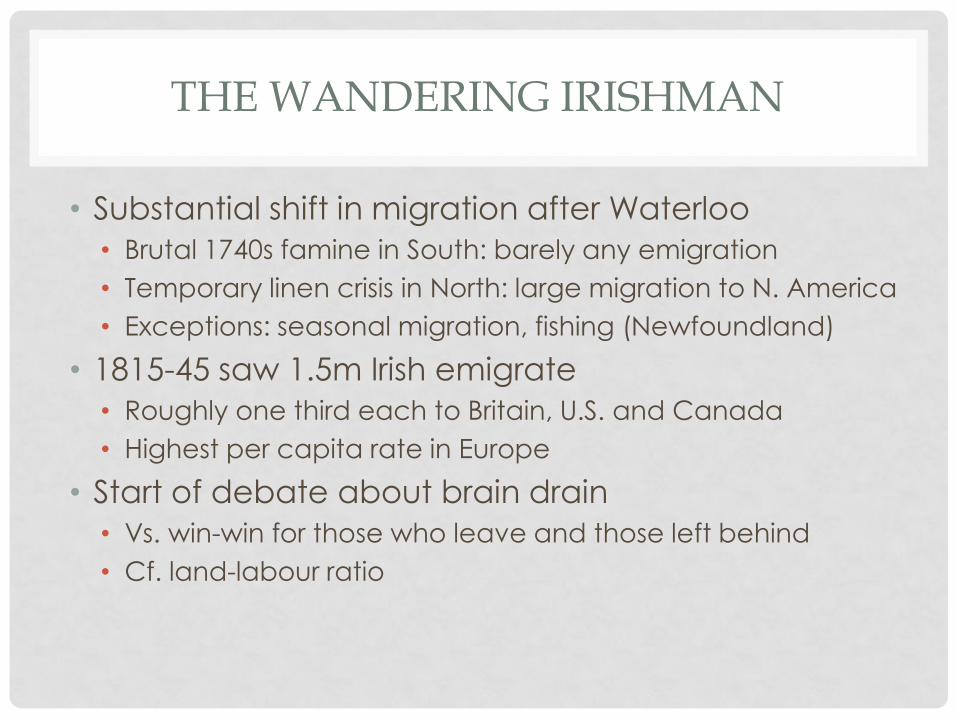
THE WANDERING IRISHMAN
• Substantial shift in migration after Waterloo
• Brutal 1740s famine in South: barely any emigration
• Temporary linen crisis in North: large migration to N. America
• Exceptions: seasonal migration, fishing (Newfoundland)
• 1815-45 saw 1.5m Irish emigrate
• Roughly one third each to Britain, U.S. and Canada
• Highest per capita rate in Europe
• Start of debate about brain drain
• Vs. win-win for those who leave and those left behind
• Cf. land-labour ratio
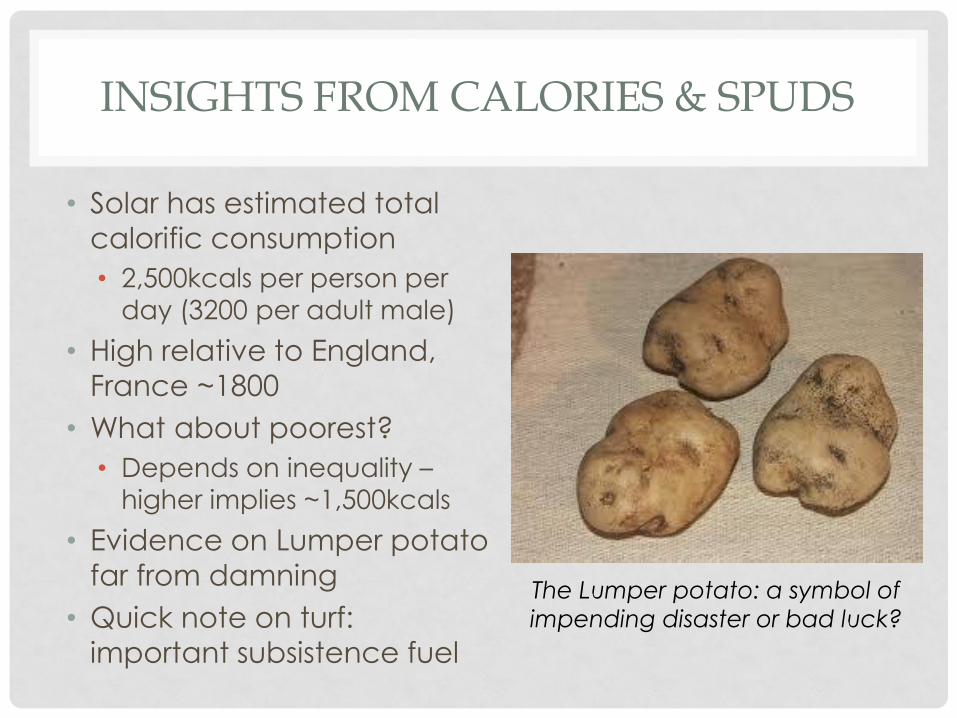
INSIGHTS FROM CALORIES & SPUDS
• Solar has estimated total
calorific consumption
• 2,500kcals per person per
day (3200 per adult male)
• High relative to England,
France ~1800
• What about poorest?
• Depends on inequality – higher implies ~1,500kcals
• Evidence on Lumper potato
far from damning
• Quick note on turf:
important subsistence fuel
The Lumper potato: a symbol of
impending disaster or bad luck?

ANTHROPOMETRICS
• Ireland’s “height
advantage” seems to
have persisted into 1800s
• Nutritious if boring diet
• Evidence from
Philadelphia immigration
• 1850s, 60s: Irish migrants
had heavier babies than other groups
98.0
98.2
98.4
98.6
98.8
99.0
99.2
99.4
99.6
1780
1790
1800
1810
1820
1830
1840
1850
Komlos’s Index of Heights of
Army Recruits
Ireland
EnglandCaveats:
Who joins the army? What
backgrounds/incomes? Do
trends in general employment
matter?
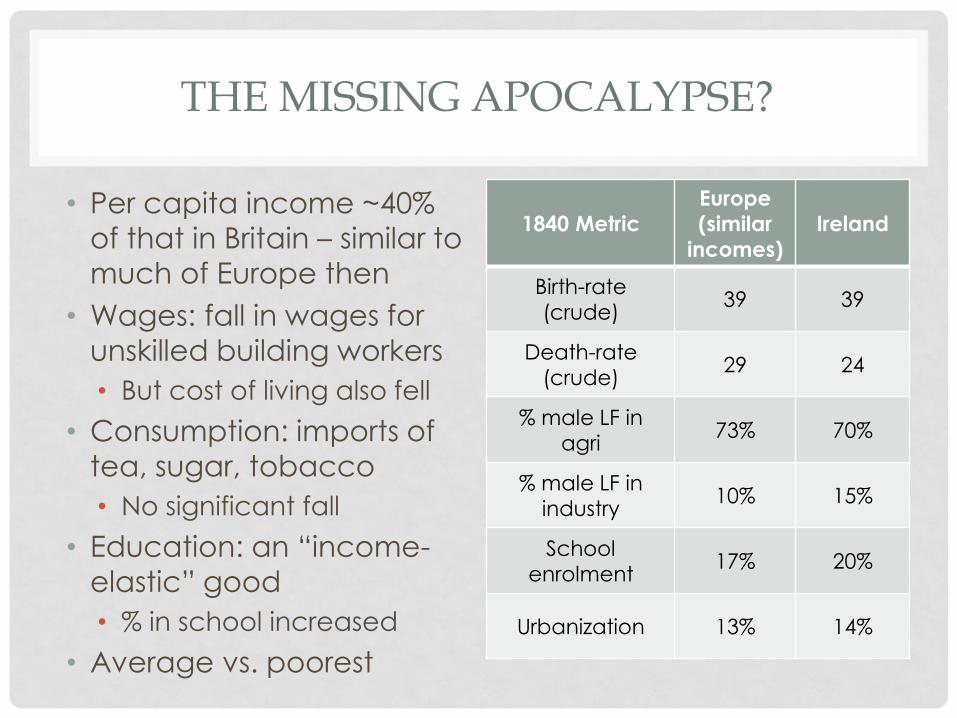
THE MISSING APOCALYPSE?
• Per capita income ~40%
of that in Britain – similar to
much of Europe then
• Wages: fall in wages for
unskilled building workers
• But cost of living also fell
• Consumption: imports of
tea, sugar, tobacco
• No significant fall
• Education: an “income-
elastic” good
• % in school increased
• Average vs. poorest
1840 Metric
Europe
(similar
incomes)
Ireland
Birth-rate
(crude) 39 39
Death-rate
(crude) 29 24
% male LF in
agri 73% 70%
% male LF in
industry 10% 15%
School
enrolment 17% 20%
Urbanization 13% 14%

STUTTERING TO A HALT?
• High-frequency data from the banks show
downturns in 1815, early 1830s and early 1840s, as
well as 1846-51
• Roy Foster & Ray Crotty: 1815 was the turning point
for Ireland, not 1845
• The Famine merely an acceleration of a downward trend
• Deindustrialization following union: agri from 40% of exports in 1780s to 62% in 1820s
• But Irish terms-of-trade (price of exports vs. imports)
actually improved significantly 1800s-1830s
• Little evidence of economic stagnation pre-1845

TOPIC A: STRUCTURE
Irish Economic History to Independence
1. Why bother?
2. The Irish Economy before Waterloo
3. From Waterloo to the Great Famine
4. The Great Famine
5. The Post-Famine Economy
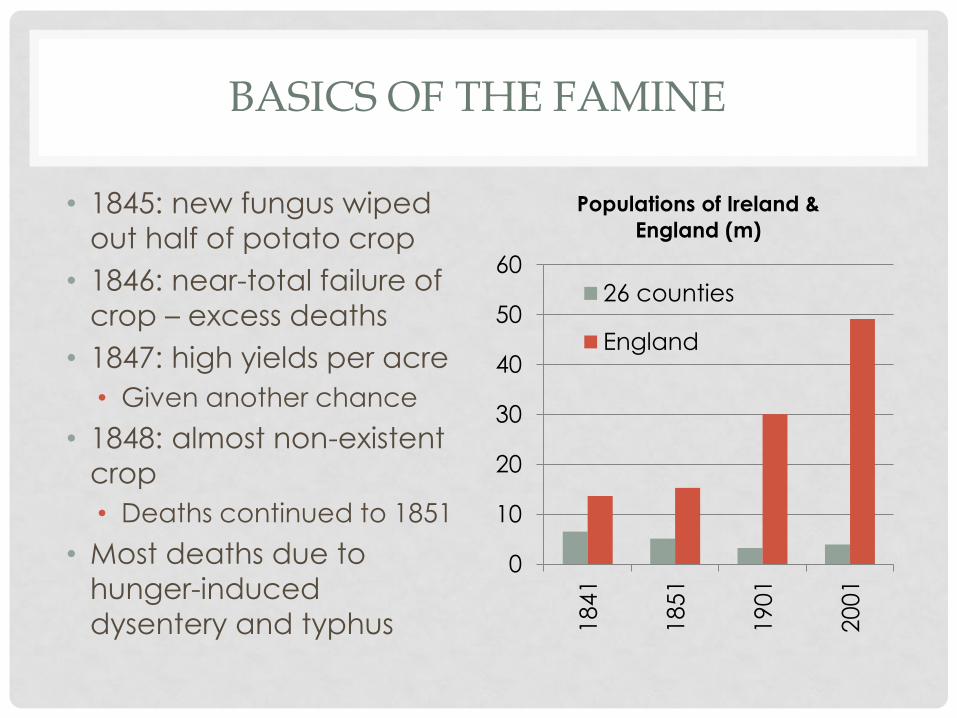
BASICS OF THE FAMINE
• 1845: new fungus wiped
out half of potato crop
• 1846: near-total failure of
crop – excess deaths
• 1847: high yields per acre
• Given another chance
• 1848: almost non-existent
crop
• Deaths continued to 1851
• Most deaths due to
hunger-induced
dysentery and typhus
0
10
20
30
40
50
60
1841
1851
1901
2001
Populations of Ireland &
England (m)
26 counties
England
DEMOGRAPHIC TOLL
• Counterfactual: What would population have been
without Famine?
• Excess deaths – numbers converge on 1m
• Averted births – often forgotten, a further 0.4m
• Half of deaths were of under-10s
• Household formers of the 1860s
• Regional impact varied
• Mokyr: perhaps 1 in 4 people in Connacht died by 1851
• Ukrainian famine of 1930s only other recent
European famine of similar scale (10-20%)
• Finnish (1860s), Flemish and Dutch crises less than 100,000

WHO WAS TO BLAME?
• Government? Landlords? Landless?
• Famine was more likely unpredictable than
inevitable – given pattern of crises since 1800
• Note that 1845 shortfall was just about dealt with
• Potatoes “stored” in pigs, tougher to transport vs. grain
• “Moralists” vs. “environmentalists”
• The Economist (est. 1840s): “it is no man’s business to provide for another”
• Belief markets could do more than governments,
hence removal of grain import tariffs
• Board of Works replaced in 1847 with direct food grants
(soup kitchens) – as most too unfit to do any work
BOTTOM-UP RESPONSES
• Ireland was a net food exporter pre-Famine
• Enough corn, butter and meat to feed population
• Fall-off in calories produced by ~1/2
• Not offset by extra corn or livestock
• Robbery, and stealing of cattle and sheep, rose
dramatically
• Vs. rape, which fell dramatically during the Famine
• The landlord response
• Those who did, those who couldn’t, those who didn’t
• Few studies of landlord rent receipts during this period
• As before, farmers vs. landless class

CROTTY VS. O’ROURKE
• A 45% decline in rural employment 1840s-1870s
• A shift in labour demand? Or in labour supply?
• Crotty: Famine merely accelerated rural decline in
employment
• Due to shift from labour-intensive tillage to livestock
• O’Rourke: developed model of 1840s Irish economy
• Shift in prices towards livestock would actually have increased agri employment (by 6%-30%)
• Extra potato – labour-intensive – needed for animal feed
• Black Death vs. Great Famine
• No antidote to fungus until 1880s, so a shock to capital
productivity as well as to labour supply

TOPIC A: STRUCTURE
Irish Economic History to Independence
1. Why bother?
2. The Irish Economy before Waterloo
3. From Waterloo to the Great Famine
4. The Great Famine
5. The Post-Famine Economy

MORE TO FOLLOW…
• Slides update next week