tools for maintaining and optimizing scr system performanceferco.com/files/mp258.pdf · tools for...
TRANSCRIPT

MP2581
Tools for Maintaining and Optimizing SCR System Performance
L. J. Muzio, T. D. MartzFossil Energy Research Corp.
Laguna Hills, CA
EPA FCC Technical Team Meeting #17November 10, 2009
Baltimore, MD

MP2582
FERCo SCR Background and Experience

MP2583
FERCo SCR Background and Experience
NOx control experts; serving the electric utility industry since 1984 (SCR, SNCR, Burner Tuning, Low NOx Burners)
Involved with SCR design and testing for 15+ years– Pilot Studies– Cold Flow Modeling– Catalyst Testing (Laboratory & In Situ Activity)– AIG Tuning– System Performance Diagnostics
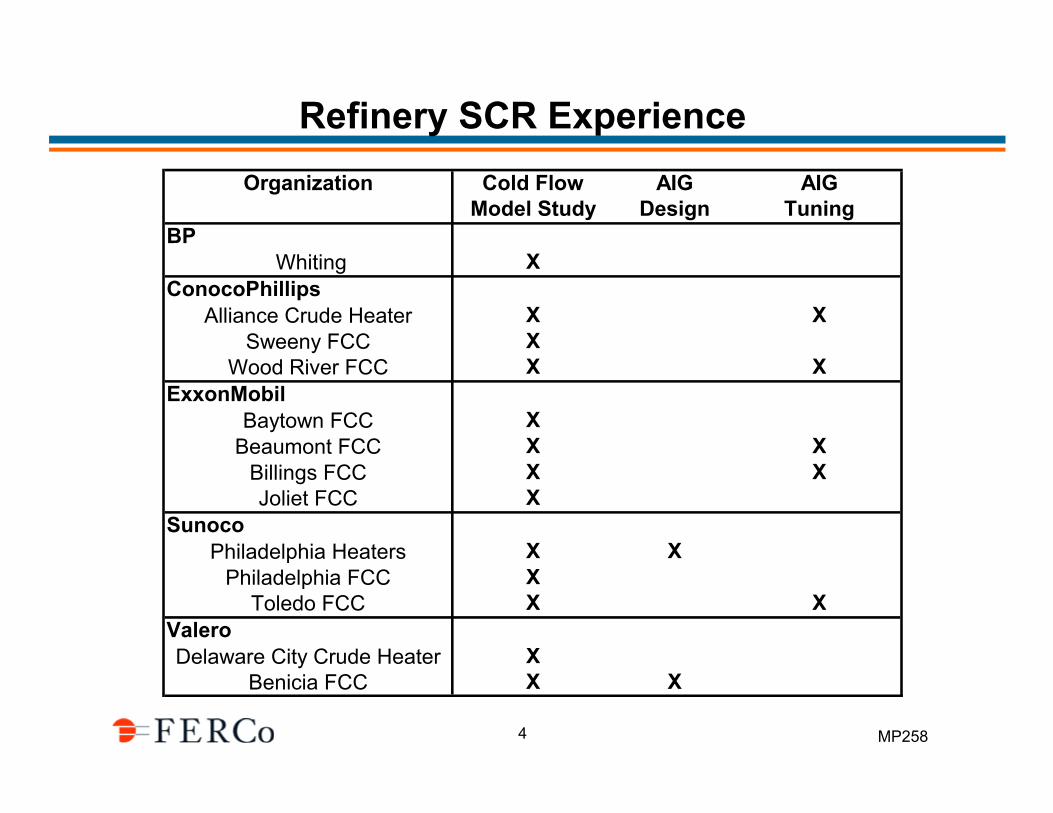
Since 2002, performed numerous SCR flow model studies and AIG tuning programs for refinery SCR systems:
MP2584
Refinery SCR ExperienceOrganization Cold Flow AIG AIG
Model Study Design TuningBP
Whiting XConocoPhillips
Alliance Crude Heater X XSweeny FCC X
Wood River FCC X XExxonMobil
Baytown FCC XBeaumont FCC X X
Billings FCC X XJoliet FCC X
SunocoPhiladelphia Heaters X X
Philadelphia FCC XToledo FCC X X
ValeroDelaware City Crude Heater X
Benicia FCC X X

MP2585
Tools for Maintaining and OptimizingSCR System Performance
Utilizing Physical Cold Flow & CFD Modeling for SCR Design
Measuring and Tuning Catalyst NH3/NOx Distribution
Catalyst Management
Measuring Catalyst Activity
Continuous NH3 Slip Monitoring
Measuring SO2/SO3 Conversion
Measuring Catalyst Velocity Distribution
Identifying Gas Sneakage
Topics
Note:Most of the topics we will discuss involve NOx measurements at the catalyst exit. Include a permanent sampling grid at the exit during construction to facilitate these measurements.

MP2586
SCR
NH3 Injection:(Uniform NH3/NOx Critical)
Catalyst Layer(s)
Turning Vanes to give uniform Velocity across the Catalyst
NO + NH3 + ¼ O2 → N2 + 1.5H2O (1)6NO2 + 8NH3 → 7N2 + 6H2O (2)2NO2 + 4NH3 + O2 → 3N2 + 6H2O (3)
Flue gas (650-750°F)
SCR Performance:• NOx Reduction• Ammonia Slip

MP2587
Physical Cold Flow and CFD Modelingfor SCR Design

MP2588
SCR Flow Model Study
Specific Model Performance Goals
Catalyst Inlet Velocity Profile RMS < 15%
RMS < 5%
System Pressure Loss Minimize
Catalyst Inlet NH3 Profile
Catalyst Inlet Temperature Profile +/- 20°F
Measurement Criteria
Profiles Measured atCatalyst Inlet
AIG Design(Evaluation / Optimization)
Turning Vane Design
Flow Distribution Devices(Perforated Plates / Resistance Bars)

MP2589
Technical Approach – Physical Model
Geometric Similarity– Scale Linear Dimensions– Scale Factor 1/8 to 1/20– Clear Acrylic Walls
Dynamic Similarity– Keep Flow Fully Turbulent (Re > 20,000)– Match Full-Scale Velocity Head, (ρV2)/2
• Implication: Vm ~ 0.7 * Vfs– Match Pressure Coefficient (PC = DP / (ρV2)/2)– Match Catalyst Pressure Drop, DPcat
– Match AIG Momentum Ratio (ρV2)jet / (ρV2)bulk

MP25810
Physical Flow Model and Full Scale Results Comparison
Predicted Ammonia Distribution, Flow Model(Normalized)
Actual Ammonia Distribution, Full Scale System(Normalized)
FCC Catalyst Inlet (AIG Valves Wide Open)
0 5 10 15 20East Wall (ft)
0
5
10
15
20
Sou
th W
all (
ft)
RMS = 3.6%
0 5 10 15 20
East Wall (Inches)
0
5
10
15
20
Sou
th W
all (
Inch
es)
RMS: 3.6%
MP25811
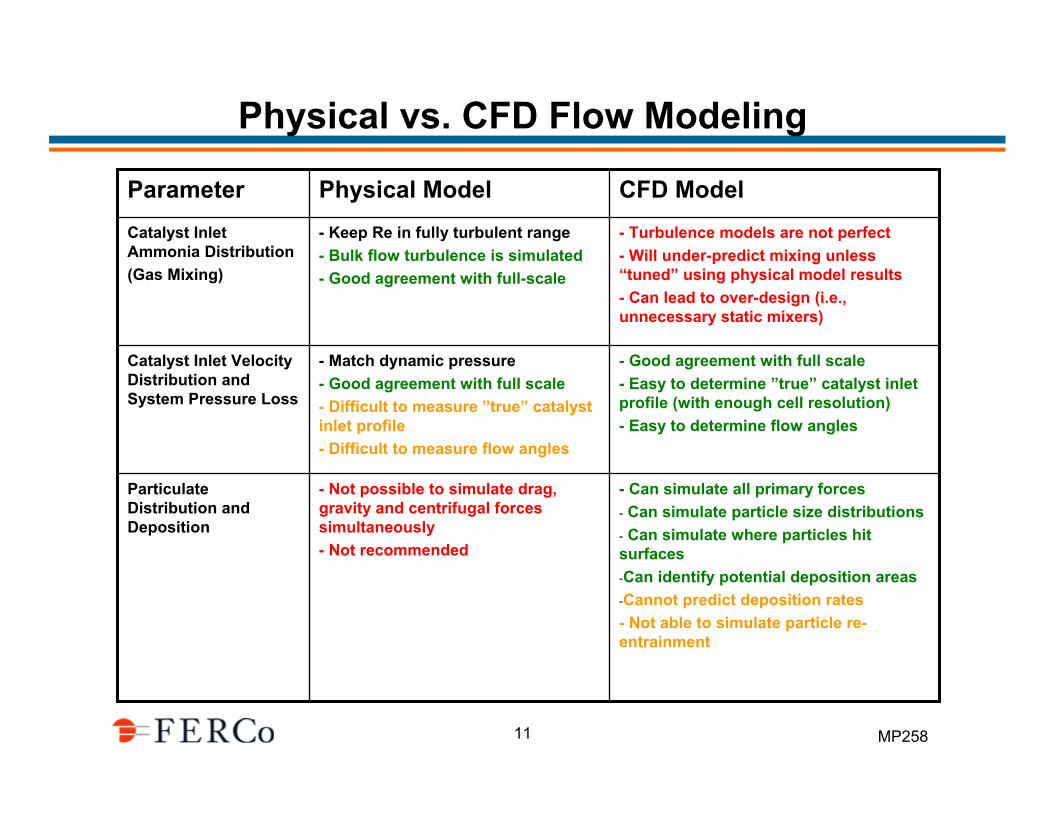
Physical vs. CFD Flow Modeling
- Can simulate all primary forces- Can simulate particle size distributions- Can simulate where particles hit surfaces-Can identify potential deposition areas-Cannot predict deposition rates- Not able to simulate particle re-entrainment
- Not possible to simulate drag, gravity and centrifugal forces simultaneously- Not recommended
Particulate Distribution and Deposition
- Good agreement with full scale- Easy to determine ”true” catalyst inlet profile (with enough cell resolution)- Easy to determine flow angles
- Match dynamic pressure- Good agreement with full scale- Difficult to measure ”true” catalyst inlet profile- Difficult to measure flow angles
Catalyst Inlet Velocity Distribution and System Pressure Loss
- Turbulence models are not perfect- Will under-predict mixing unless “tuned” using physical model results- Can lead to over-design (i.e., unnecessary static mixers)
- Keep Re in fully turbulent range - Bulk flow turbulence is simulated- Good agreement with full-scale
Catalyst Inlet Ammonia Distribution(Gas Mixing)
CFD ModelPhysical ModelParameter

MP25812
Measuring and TuningCatalyst NH3/NOx Distribution

MP25813
NH3/NOx Distribution and AIG Tuning
0
2
4
6
8
10
80 90 100
NOx Reduction, %
NH
3 sl
ip, p
pm
RMS=2.5% RMS=5% RMS=7.5% RMS=10% RMS=15%

MP25814
AIG Design Influences Tuning
Flow Into PageFlow Into Page
Flow
mixer mixer
Flow
mixer mixer
Flow Flow
Cross Grids Two Zones Multi-Zones
Mixer with 1-D Adj. Mixer with Multi Zone Grid Bluff Body Mixer
MP25815
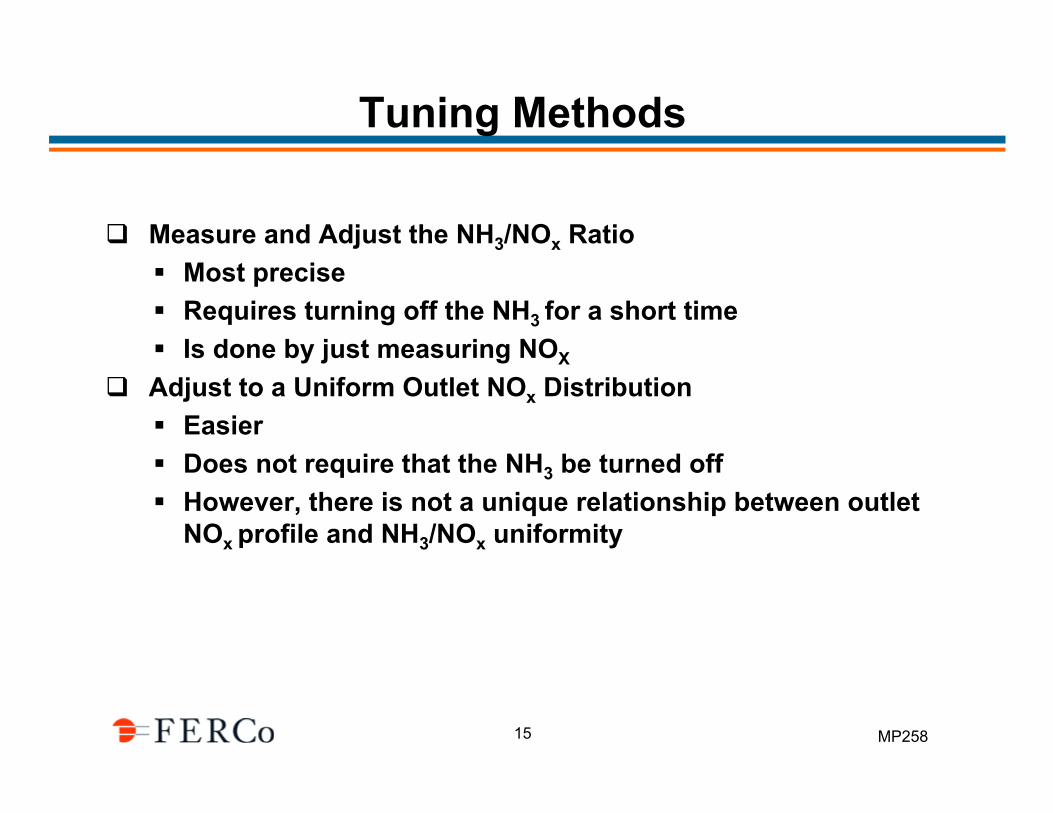
Tuning Methods
Measure and Adjust the NH3/NOx RatioMost preciseRequires turning off the NH3 for a short timeIs done by just measuring NOX
Adjust to a Uniform Outlet NOx DistributionEasierDoes not require that the NH3 be turned offHowever, there is not a unique relationship between outlet NOx profile and NH3/NOx uniformity
MP25816
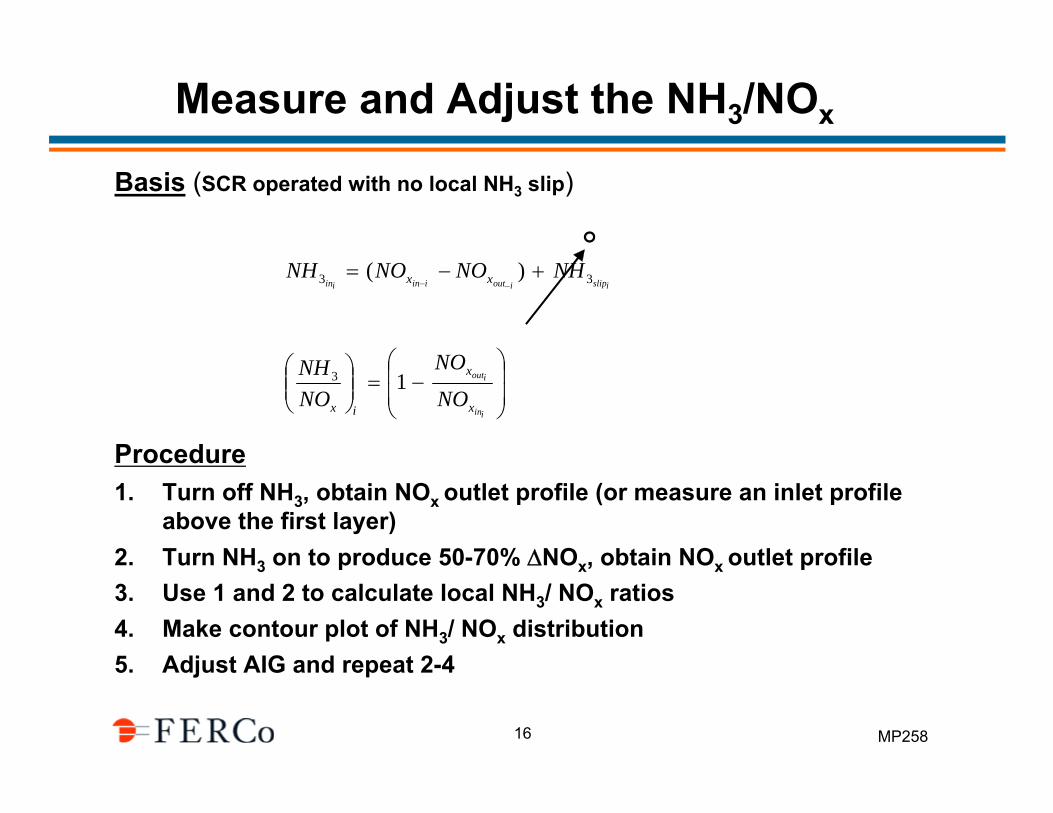
Measure and Adjust the NH3/NOx
Basis (SCR operated with no local NH3 slip)
Procedure1. Turn off NH3, obtain NOx outlet profile (or measure an inlet profile
above the first layer)2. Turn NH3 on to produce 50-70% ΔNOx, obtain NOx outlet profile3. Use 1 and 2 to calculate local NH3/ NOx ratios4. Make contour plot of NH3/ NOx distribution5. Adjust AIG and repeat 2-4
islipioutiiniinNHNONONH xx 33 )( +−=
−−
⎟⎟
⎠
⎞
⎜⎜
⎝
⎛−=⎟⎟
⎠
⎞⎜⎜⎝
⎛
iin
iout
x
x
ix NO
NO
NONH 13

MP25817
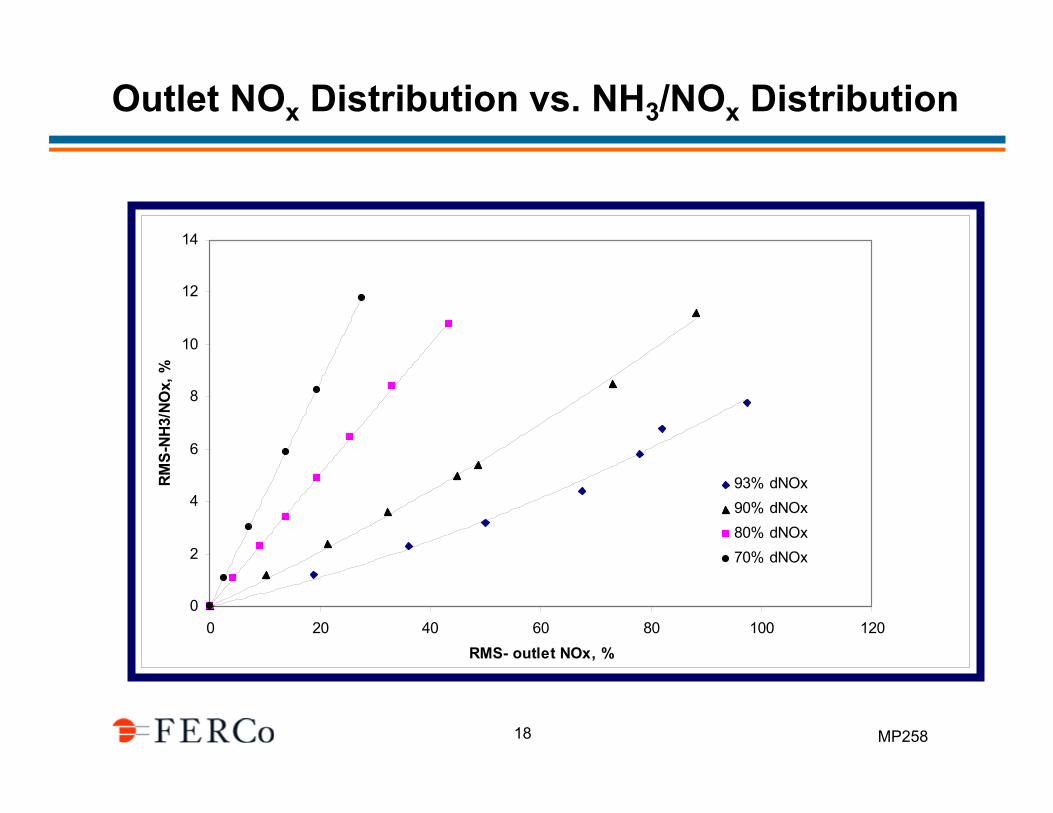
Adjust to a Uniform Outlet NOx Distribution
Performed Without Turning Off the Ammonia
The Relationship Between The Outlet NOx Profile and NH3/NOx Distribution Depends On Operating Conditions
MP25818
Outlet NOx Distribution vs. NH3/NOx Distribution
0
2
4
6
8
10
12
14
0 20 40 60 80 100 120RMS- outlet NOx, %
RMS
-NH3
/NO
x, %
93% dNOx90% dNOx80% dNOx70% dNOx
MP25819
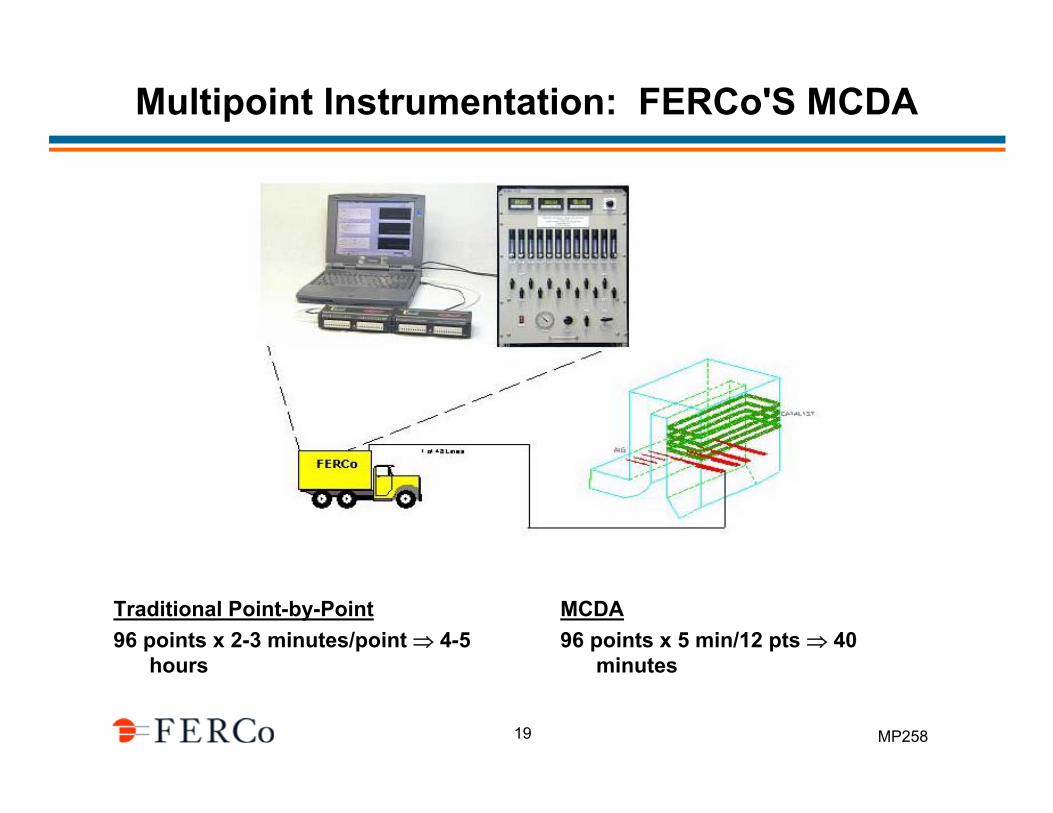
Multipoint Instrumentation: FERCo'S MCDA
Traditional Point-by-Point96 points x 2-3 minutes/point ⇒ 4-5
hours
MCDA96 points x 5 min/12 pts ⇒ 40
minutes

MP25820
AIG Tuning, FCC SCR System
NH3/NOx RMS = 6.0%
0 5 10 15 20 25 300
5
10
15
20
25
NH3/NOx RMS = 1.0%
0 5 10 15 20 25 300
5
10
15
20
25
As Found RMS = 6.0% Tuned RMS = 1.0%
Normalized NH3/NOx Distribution
MP25821
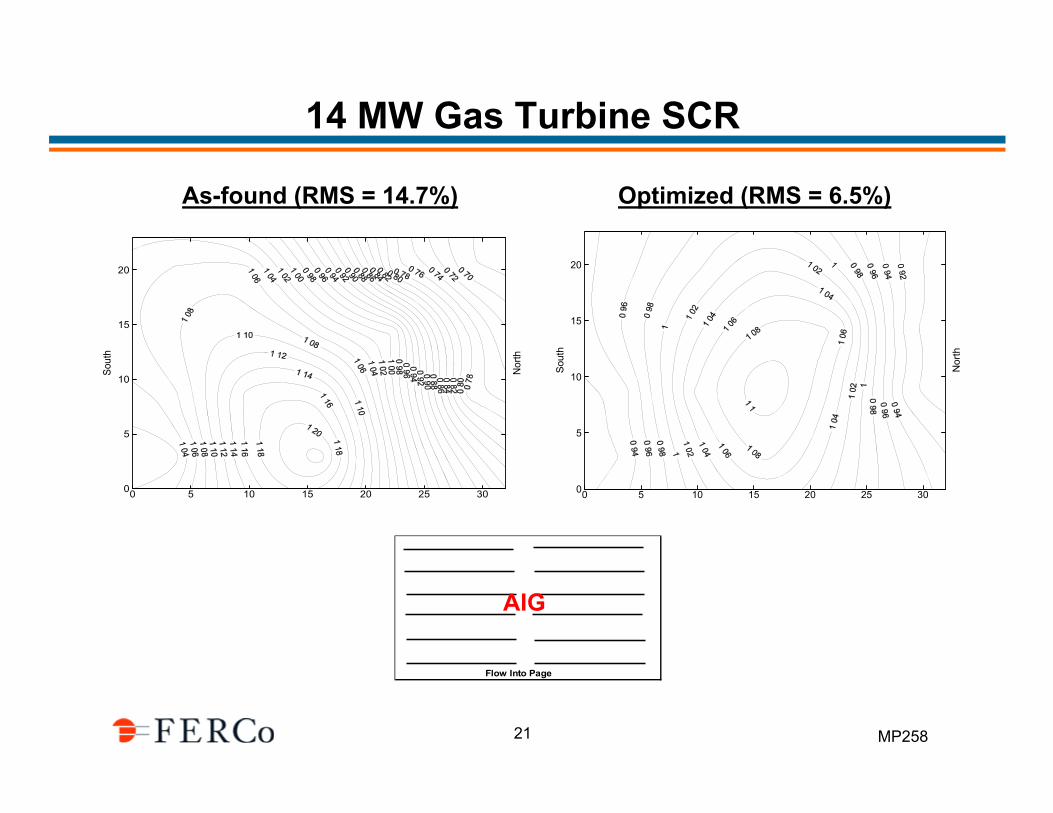
14 MW Gas Turbine SCR
As-found (RMS = 14.7%) Optimized (RMS = 6.5%)
0 5 10 15 20 25 300
5
10
15
20
Sout
h
Nor
th
0 5 10 15 20 25 300
5
10
15
20
Sout
h
Nor
th
Flow Into Page
AIG
MP25822
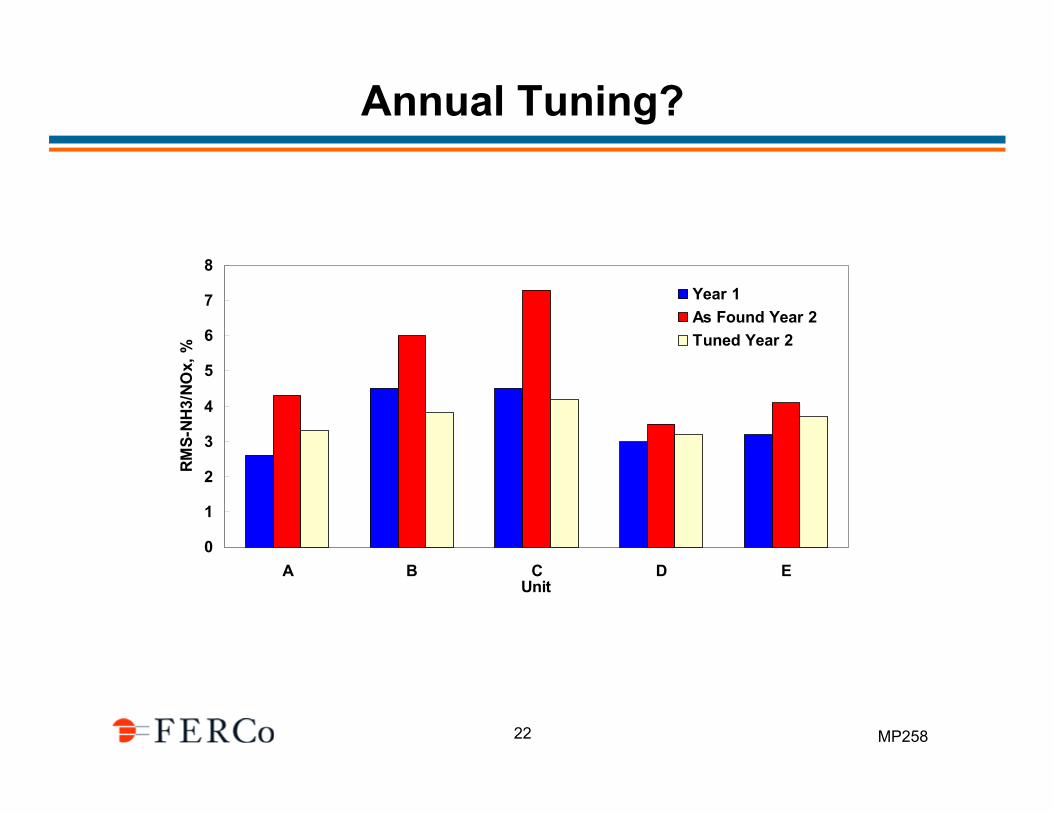
Annual Tuning?
0
1
2
3
4
5
6
7
8
A B C D EUnit
RM
S-N
H3/
NO
x, %
Year 1As Found Year 2Tuned Year 2

MP25823
Catalyst Management
MP25824
Catalyst Management
What is Catalyst management?– Keeping track of catalyst activity to ensure continued environmental
compliance
How is Catalyst Management Done?– Periodically determining the activity of the catalyst in the reactor– Laboratory analysis (if a sample can be obtained)– In situ analysis (later discussion topic)– Utilize catalyst management software for planning
Why is it Done?– Forecast when catalyst additions or replacements are necessary– Is the addition of a spare layer adequate, or is replacement necessary?– Provide sufficient lead time to procure catalyst (6-9 months)
MP25825
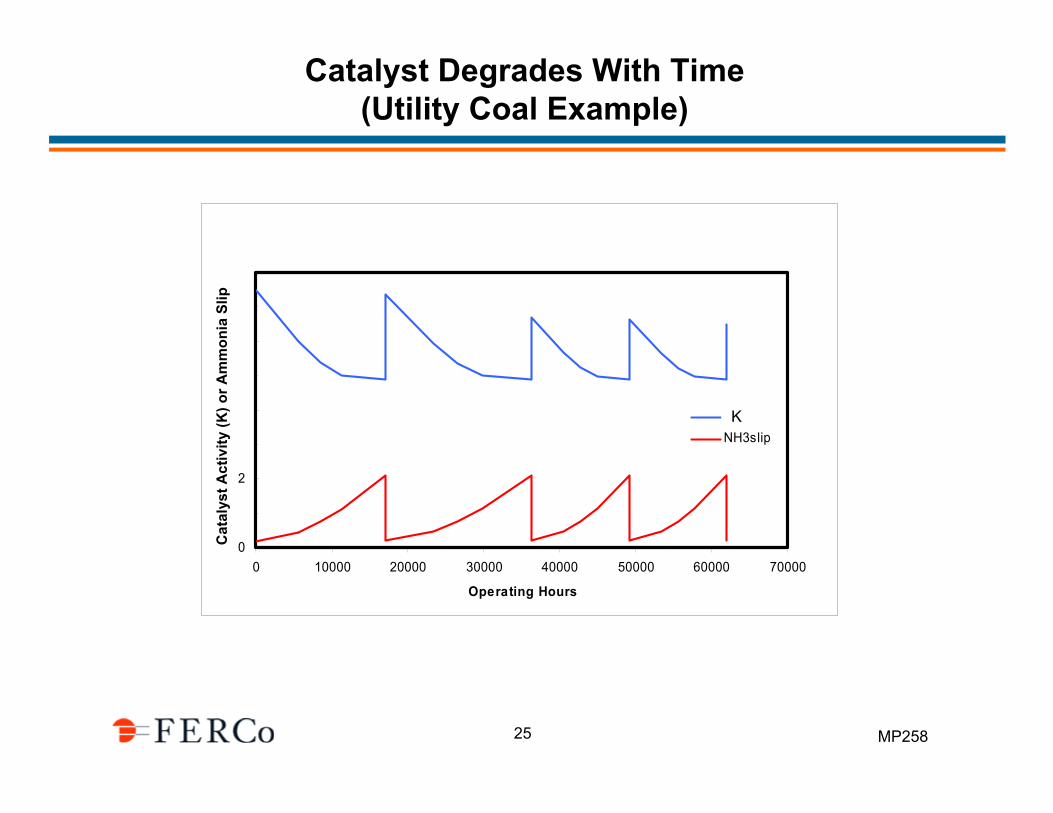
Catalyst Degrades With Time(Utility Coal Example)
0
2
4
6
8
0 10000 20000 30000 40000 50000 60000 70000
Operating Hours
Reac
tor
Pot
entia
l, or
NH
3 sl
ip
RPNH3slip
Cat
alys
t Act
ivity
(K) o
r Am
mon
ia S
lip
K
MP25826
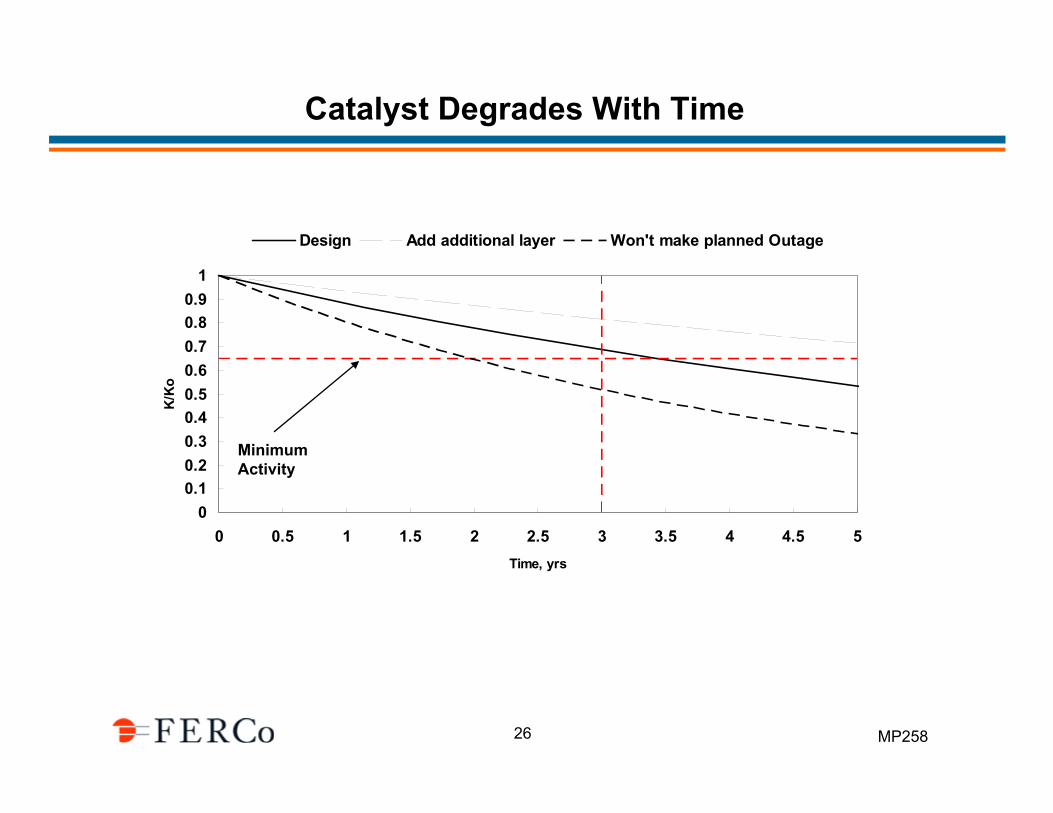
Catalyst Degrades With Time
00.10.20.30.40.50.60.70.80.9
1
0 0.5 1 1.5 2 2.5 3 3.5 4 4.5 5Time, yrs
K/K
o
Design Add additional layer Won't make planned Outage
Minimum Activity

MP25827
Deactivation Rates Key to Catalyst Management
Catalyst Management depends on accurately measuring catalyst deactivation for each layer
K/Ko
0
0.1
0.2
0.3
0.4
0.5
0.6
0.7
0.8
0.9
1
1.1
0 5000 10000 15000 20000 25000Operating Hours
K/K
oLayer 1 Layer 2 Layer 3 Layer 4 Layer 5

MP25828
Comprehensive Catalyst Management Tools
Activity Decay Model
SCR Process Simulation Model
Activity Catalyst Geometry
DeactivationData
Unit Operating, Cost Factors
Reactor Design
NH3/NO Ratio
Informed Catalyst ManagementDecisions
Planned Outages

MP25829
Example: EPRI’s CatReact
Case 1
Layer 1 Layer 2 Layer 3 Layer 4 Layer 5
Startup 1 1 1Event 1 1Event 2 1Event 3 1Event 4 1Event 5 1Event 6 1Event 7 1Event 8 1Event 9 1Event 10 1Event 11 1Event 12 1Event 13 1Event 14 1Event 15 1Event 16 1Event 17 1Event 18 1Event 19 1Event 20 1
Note: Numbers signify Catalyst Type
Calculation Scenario
Initiate Calculaton
CATREACT
UnitData
SCRData
CatalystData
Time Factors
EconomicFactors
Planned Outages
CapacityFactors
Input Buttons
Calculate
OutputData
1 1+1
2 2+1
3 3+1
4
1+2
2+2
3+2
4+1
Reset All Forms
Catalyst Deactivation
Check for Changes

MP25830
Catalyst Activity Measurement

MP25831
In Situ Catalyst Activity Measurement*
- Traditional catalyst activity measurement requires plantoutage to extract sample
- FERCo’s new KnoxCheckTM
system measures catalystactivity in situ
- No outage required- Provides more data forcatalyst management
Activity K
* Patent Pending
Activity K

MP25832
In Situ Catalyst Activity Measurement*
Laboratory:
Test Conditions:AVd = Design Area VelocityNH3/NOx = 1
Measure:ΔNOx
Calculate:K = -AVd ln(1-ΔNOx)
In Situ:
Test Conditions:AV,FS = Full-Scale Area VelocityNH3/NOx > 1(NH3 added only in test sections)
Measure:ΔNOx
Calculate:K = -AV,FS ln(1-ΔNOx)
* Patent Pending
MP25833
In Situ Catalyst Activity Measurements
MP25834
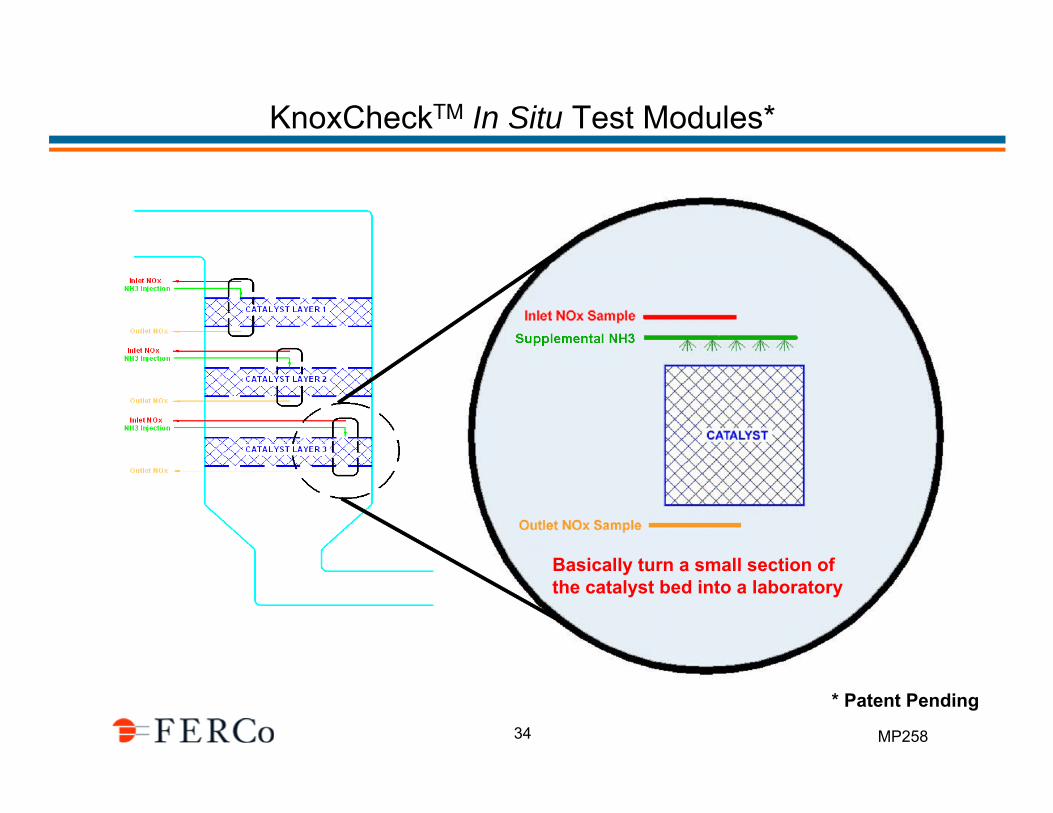
KnoxCheckTM In Situ Test Modules*
* Patent Pending
Basically turn a small section of the catalyst bed into a laboratory

MP25835
In Situ vs Laboratory Activity Measurements
0.0
0.2
0.4
0.6
0.8
1.0
1.2
Insitu Vendor 3rd Party
K/K
vend
or

MP25836
Typical KNOxCheckTM Test Results
dNO maximum = 77.3% dNO maximum = 86.6% dNO maximum = 91.3%
Catalyst Layer 3Catalyst Layer 2Catalyst Layer 1
0
10
20
30
40
50
60
70
80
90
100
0.0 0.5 1.0 1.5 2.0
AIG NH3/NO
dNO
(%)
0
10
20
30
40
50
60
70
80
90
100
0.0 0.5 1.0 1.5 2.0
AIG NH3/NO
dNO
(%)
0
10
20
30
40
50
60
70
80
90
100
0.0 0.5 1.0 1.5 2.0
AIG NH3/NO
dNO
(%)

MP25837
In Situ KnoxCheckTM Measurements: Individual Layers
4-years of operation beginning in 2005
700 MW unit
E. bituminous coal
SCR on-line May 2002
Seasonal operation
Two reactors
3 + 1 configuration
Initial load: 3 layers honeycomb catalyst
Layer 1 replaced with plate catalyst prior to 2006 ozone season
0.00
0.10
0.20
0.30
0.40
0.50
0.60
0.70
0.80
0.90
1.00
0 5000 10000 15000 20000 25000
Operating Hours
Rel
ativ
e R
eact
or P
oten
tial (
RP/
RPo
)
Layer 1Layer 2Layer 3 2005 2006 2007 2008

MP25838
In Situ KnoxCheckTM Measurements: 700 MW SCR
0.00
0.10
0.20
0.30
0.40
0.50
0.60
0.70
0.80
0.90
1.00
0 5000 10000 15000 20000 25000
Operating Hours
Lab
ora
tory
Rel
ativ
e A
ctiv
ity (K
/Ko
)
Layer 2Layer 3
0.00
0.10
0.20
0.30
0.40
0.50
0.60
0.70
0.80
0.90
1.00
0 5000 10000 15000 20000 25000
Operating Hours
Rel
ativ
e R
eact
or P
ote
ntia
l (R
P/R
Po)
Layer 2
Layer 3
(a) Annual Laboratory Analysis(b) On-Demand KnoxCheckTM
Measurements
In S
itu R
elat
ive
Act
ivity
(K/K
0)

MP25839
Continuous Ammonia Slip Monitoring

MP25840
Continuous Gas Phase NH3 Instrumentation
Measurement Method• In situ• Tunable IR Laser Spectroscopy• WM,TTFM or Fast Scan Techniques
Manufacturers- Analyzers• Unisearch Associates• NEO (Norsk Elektro Optikk)( Servomex)• Siemens AG Automation• LTG Lasertech ( not yet commercial)• Sick-Maihak• OPSIS• Boreal Laser
Manufacturers- Auto Align System• Bergman’s Mechatronics LLC
MP25841
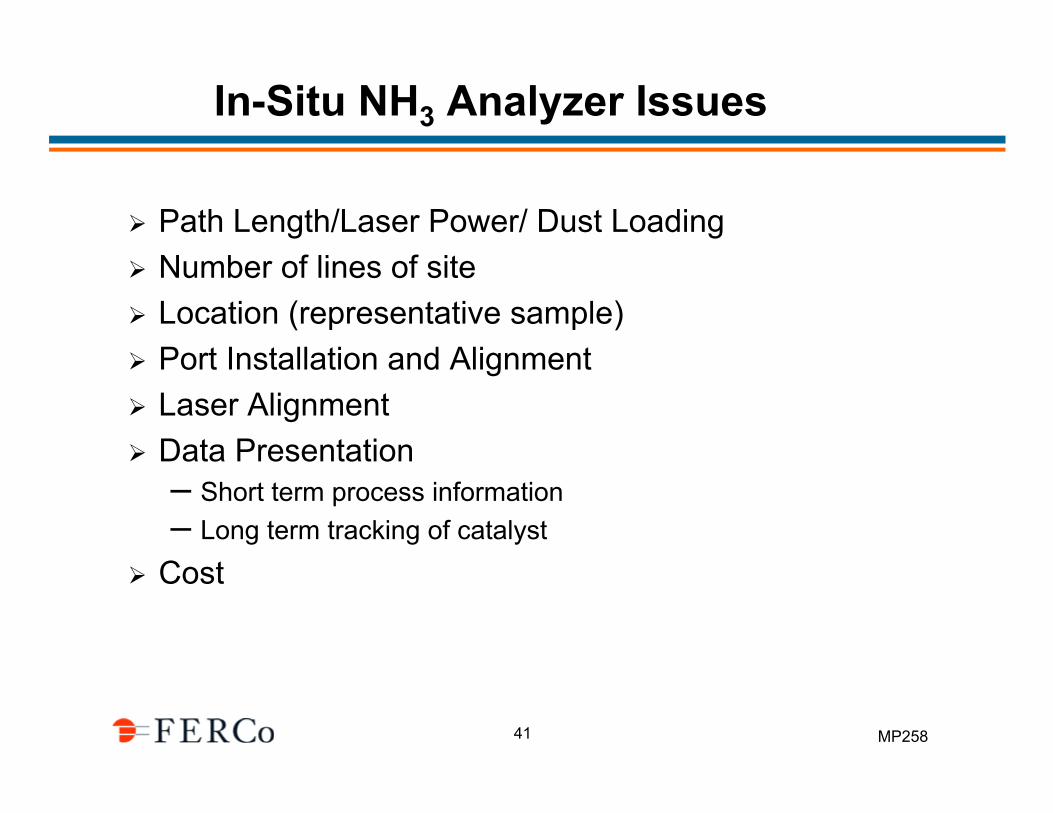
In-Situ NH3 Analyzer Issues
Path Length/Laser Power/ Dust LoadingNumber of lines of siteLocation (representative sample)Port Installation and AlignmentLaser AlignmentData Presentation– Short term process information– Long term tracking of catalyst
Cost
MP25842
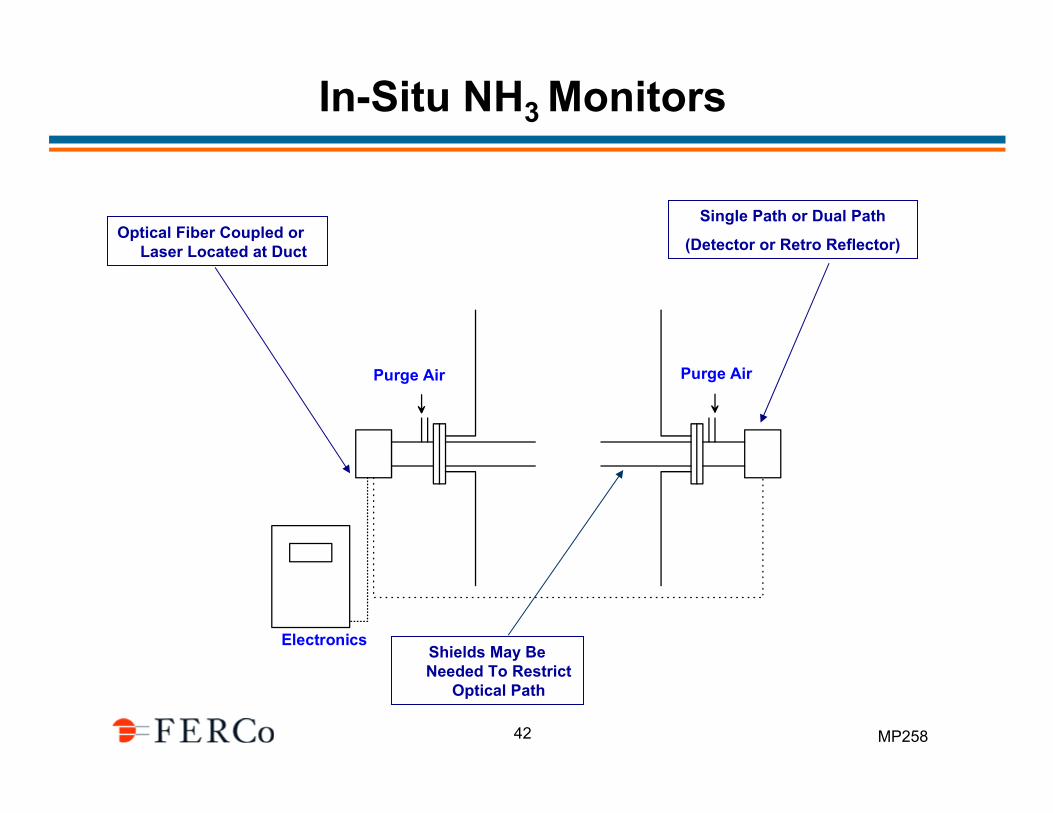
In-Situ NH3 Monitors
Purge Air Purge Air
Electronics
Optical Fiber Coupled or Laser Located at Duct
Single Path or Dual Path
(Detector or Retro Reflector)
Shields May Be Needed To Restrict
Optical Path

MP25843
NH3 Monitor Characteristics
(a) TTFM: Two Tone Frequency Modulation (2nd Derivative Spectroscopy)(b) Wavelength Modulation (2nd Derivative Spectroscopy)
Manufacturer Fiber Optic Coupled
Maximum Lines
of Sight
Beam Split/ Multiplexed
Measurement Technique
Cost
Unisearch Yes 2
32
Beam Split Multiplexed
Fast Scan 42 K$ (2-Lines of Sight)
65 K$
(4-Lines of Sight)
Siemens Yes 3 Beam Split (3 paths)
TTFM (a) 30 K$ (1-Line of Sight
60 K$
(3-Lines of Sight)
NEO No 1 NA WM (b) 38 K$
)

MP25844
Measuring SO2/SO3 Conversion
MP25845
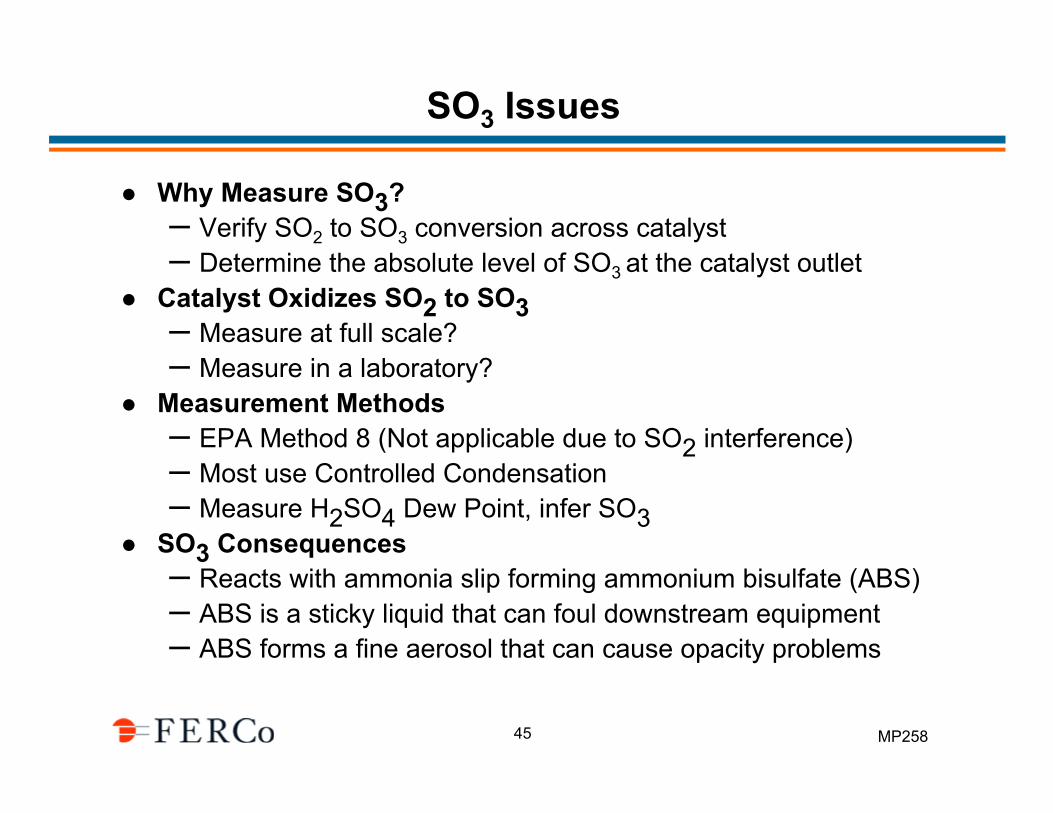
SO3 Issues
Why Measure SO3?– Verify SO2 to SO3 conversion across catalyst– Determine the absolute level of SO3 at the catalyst outlet
Catalyst Oxidizes SO2 to SO3– Measure at full scale?– Measure in a laboratory?
Measurement Methods– EPA Method 8 (Not applicable due to SO2 interference)– Most use Controlled Condensation– Measure H2SO4 Dew Point, infer SO3
SO3 Consequences– Reacts with ammonia slip forming ammonium bisulfate (ABS)– ABS is a sticky liquid that can foul downstream equipment– ABS forms a fine aerosol that can cause opacity problems
MP25846
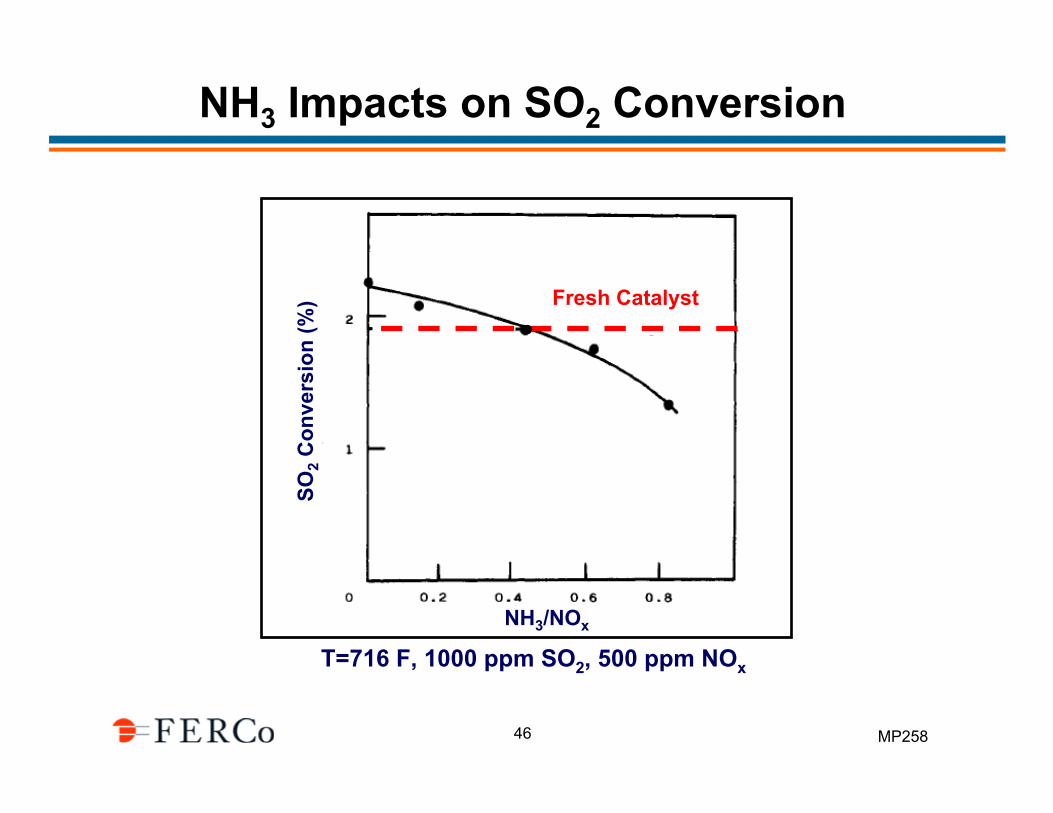
NH3 Impacts on SO2 Conversion
T=716 F, 1000 ppm SO2, 500 ppm NOx
SO2
Con
vers
ion
(%) Fresh Catalyst
NH3/NOx
MP25847
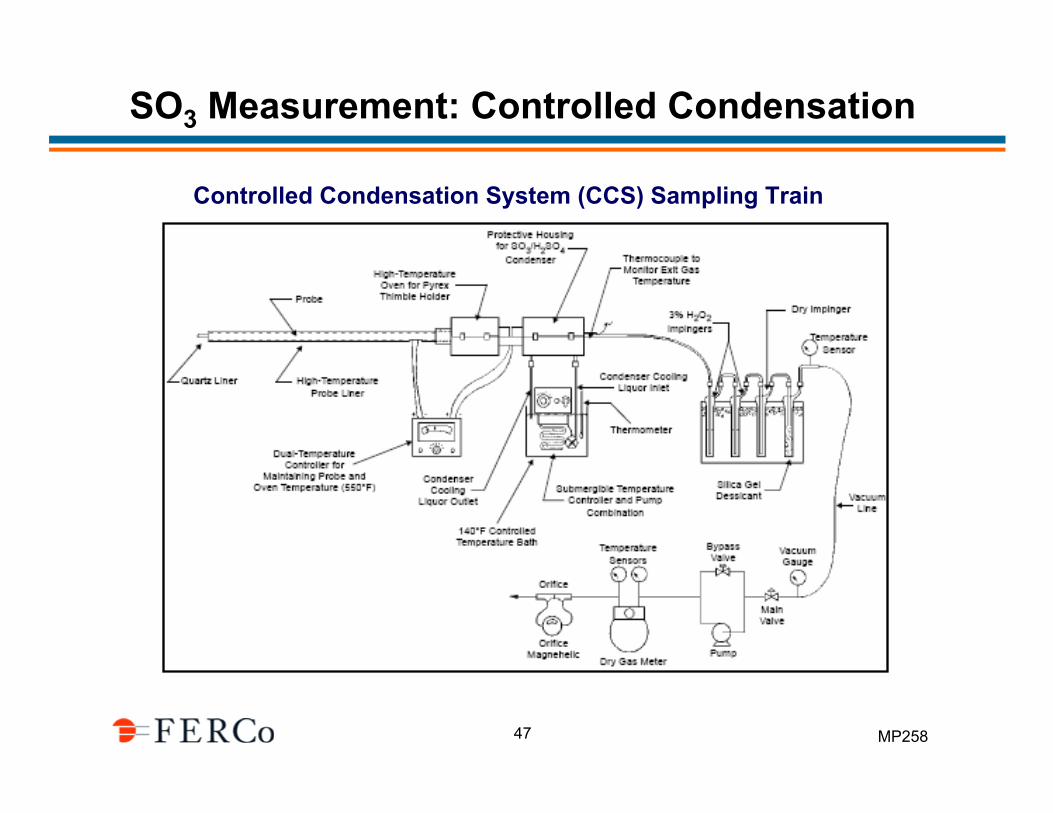
SO3 Measurement: Controlled Condensation
Controlled Condensation System (CCS) Sampling Train

MP25848
SO3 Measurement: Controlled Condensation
Sample Flow

MP25849
Industry Need for Continuous SO3 Measurement Method
0.010.1
110
1001000
10000100000
200 400 600 800 1000Temperature, F
H2S
O4/
SO3SO3 and H2SO4 are
gas phase species
Approach Advantages Disadvantages
FTIR-Extractive >Can potentially measure both >ExpensiveSO3 and H2SO4 >Complex Instrument
>Need to maintain sample at high Temperature
FTIR- Insitu >Can potentially measure both >ExpensiveSO3 and H2SO4 >Complex Instrument>Sample heating unnecessary >High Power IR source required?
DOAS-Extractive >Relatively inexpensive >Only measures SO3
DOAS-Insitu >Relatively inexpensive >Only measures SO3>High Power UV sources available
Breen ABS/H2SO4 >Relatively inexpensive >Measures Dewpoint- need Dewpoint >Simple measurement correlation to extract H2SO4
Severen Science >Relatively inexpensive >Skilled operator required> Automated Wet Chemical Meas. >Little data available
MP25850
Measuring Catalyst Velocity Distribution

MP25851
Catalyst Velocity Distribution
Velocity uniformity typically in the specification
Velocity uniformity established during the SCR Design (Cold Flow and/or CFD)
Can it be measured at full scale?– Difficult; large reactors, long probes, low velocities(~15 ft/sec)– Pitot Probes, Thermal Anemometers– Pitot Probe dPs ~0.02 in H2O– Velocity profile re-aligns very close to the surface
Velocity distribution can be inferred using NOx measurements

MP25852
Local Outlet NOx VS. NH3 Injection Rate
0
20
40
60
0 50 100 150 200
Ammonia Injection Rate, lb/hr
Loca
l Out
let N
Ox,
ppm
raw
pt-1pt-2pt-3pt-4pt-5pt-6pt-7pt-8pt-9pt-10pt-11pt-12pt-13pt-14pt-15pt-16pt-17pt-18pt-19pt-20
NOx variations due to velocity maldistribution NOx variations due
primarily to NH3/NOx maldistribution
0
1
2
3
4
5
6
7
8
9
10
150 160 170 180 190 200
Am m onia Injection Rat e, lb/hr
Loca
l Out
let N
Ox,
ppm
raw
dNOx=1-e-K/Av

MP25853
Velocity Profile for a Coal-Fired SCR
Cold Flow Model (RMS = 5.8%)
0 5 10 15 20 25 30 35 400
5
10
15
20
25
30
35
40
45
50
0 5 10 15 20 25 30 35 400
5
10
15
20
25
30
35
40
45
50
Full Scale (RMS = 3.6%)

MP25854
Identifying Gas Sneakage

MP25855
Gas Sneakage
Improper perimeter sealsImproper seals between catalyst modulesDifficult to diagnose just looking at overall performance

MP25856
Gas Sneakage
0
20
40
60
0 0.5 1 1.5
NH3/NOx, scaled by ammonia injection
NOx
, ppm
pt-1pt-2pt-3pt-4pt-5pt-6pt-7pt-8pt-9pt-10pt-11pt-12pt-13pt-14pt-15pt-16pt-17pt-18pt-19pt-20
Plot Local NH3/NOx rather than ammonia injection rate
Data should fall on a single line defined by the catalyst activity

MP25857
Gas Sneakage
0
2
4
6
8
10
12
14
16
18
20
22
24
26
28
30
0.0 0.1 0.2 0.3 0.4 0.5 0.6 0.7 0.8 0.9 1.0 1.1 1.2 1.3 1.4 1.5
NH3/NOx
NO
-out
, ppm
As-Found
0
2
4
6
8
10
12
14
16
18
20
22
24
26
28
30
0.0 0.1 0.2 0.3 0.4 0.5 0.6 0.7 0.8 0.9 1.0 1.1 1.2 1.3 1.4 1.5
NH3/NOx
NO
-out
, ppm
Repaired

MP25858
Summary
Cold Flow/CFD– Cold flow recommended (better simulation of mixing)– CFD does a better job with particulate
AIG Tuning– Important activity– Easy to do– How often for FCC SCRs?
Catalyst Management/Catalyst Activity– New activity for FCC units– Requires knowledge of Activity vs Time– KNOxCheck® allows online determination of activity
Continuous NH3 Monitors– Recommended (TDL analyzers)
SO3 Measurements– Why? ( SO2/SO3 conversion, outlet SO3?)– Controlled Condensation
Other– Velocity Profiles and Sneakage– Can be determined with NOx measurements

MP25859
Questions?