vfm tools: optimizing value for money in health spending
TRANSCRIPT
VfM Tools:
Optimizing Value for Money
in Health SpendingWhat Ministries of Finance should know
Michael Borowitz, Chief Economist Global Fund
Sarah Barber, Head of WHO office, South Africa
Tomas Roubal, Health economist, WHO office, former health economist Czech Ministry of Health
Karen Hofmans, Wits, head of Priceless project, part of NICE-Gates network in South Africa.
2
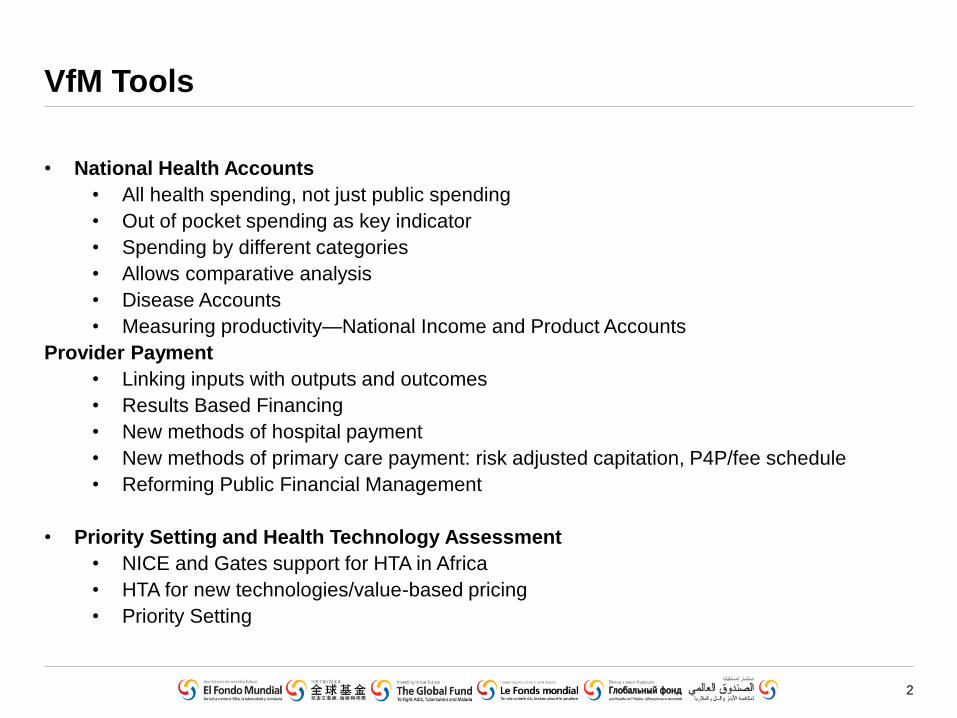
VfM Tools
• National Health Accounts
• All health spending, not just public spending
• Out of pocket spending as key indicator
• Spending by different categories
• Allows comparative analysis
• Disease Accounts
• Measuring productivity—National Income and Product Accounts
Provider Payment
• Linking inputs with outputs and outcomes
• Results Based Financing
• New methods of hospital payment
• New methods of primary care payment: risk adjusted capitation, P4P/fee schedule
• Reforming Public Financial Management
• Priority Setting and Health Technology Assessment
• NICE and Gates support for HTA in Africa
• HTA for new technologies/value-based pricing
• Priority Setting
3
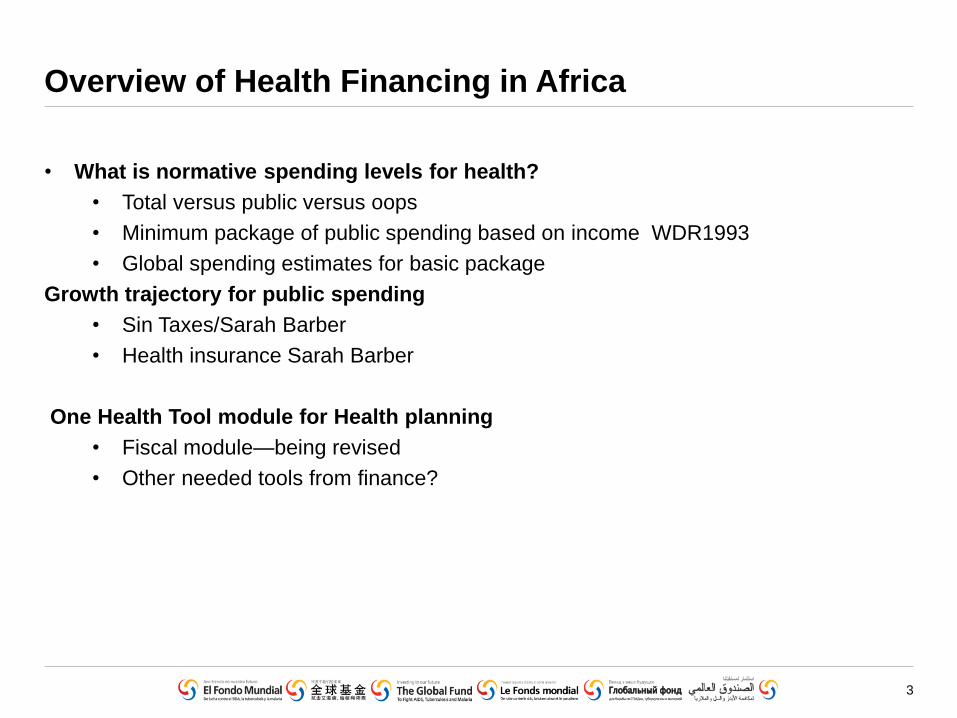
Overview of Health Financing in Africa
• What is normative spending levels for health?
• Total versus public versus oops
• Minimum package of public spending based on income WDR1993
• Global spending estimates for basic package
Growth trajectory for public spending
• Sin Taxes/Sarah Barber
• Health insurance Sarah Barber
One Health Tool module for Health planning
• Fiscal module—being revised
• Other needed tools from finance?
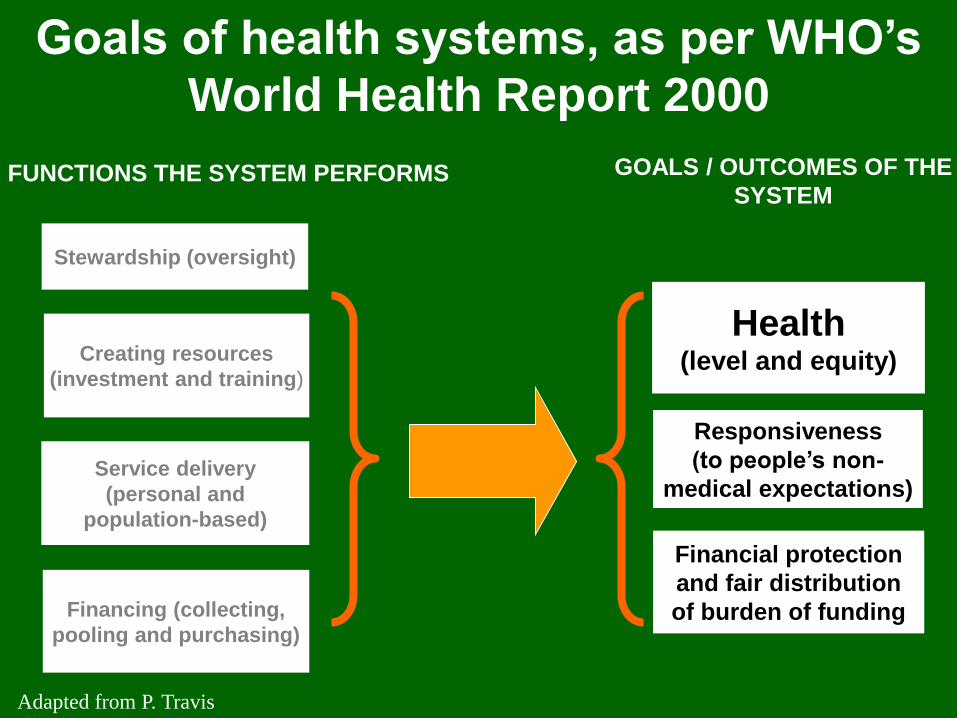
Stewardship (oversight)
Financing (collecting,
pooling and purchasing)
FUNCTIONS THE SYSTEM PERFORMS GOALS / OUTCOMES OF THE
SYSTEM
Health(level and equity)
Financial protection
and fair distribution
of burden of funding
Responsiveness
(to people’s non-
medical expectations)
Creating resources
(investment and training)
Service delivery
(personal and
population-based)
Goals of health systems, as per WHO’s
World Health Report 2000
Adapted from P. Travis
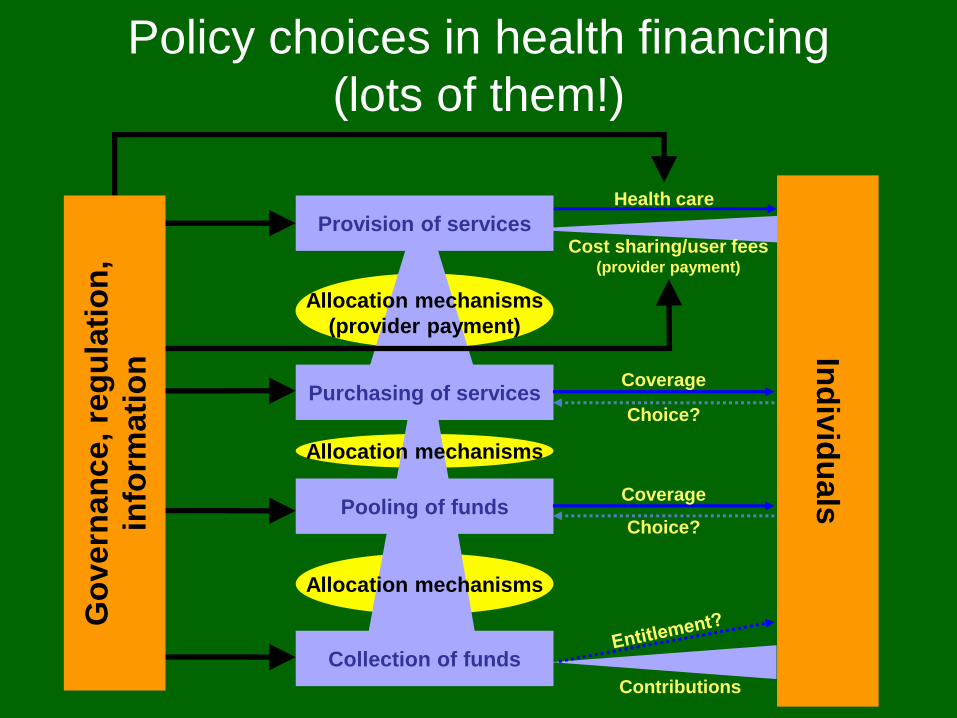
Cost sharing/user fees(provider payment)
Health care
Ind
ivid
uals
Collection of funds
Provision of services
Purchasing of services
Pooling of funds
Allocation mechanisms
Allocation mechanisms
(provider payment)
Allocation mechanisms
Coverage
Coverage
Choice?
Choice?
Contributions
Go
ve
rnan
ce, re
gu
lati
on
,
info
rmati
on
Policy choices in health financing
(lots of them!)
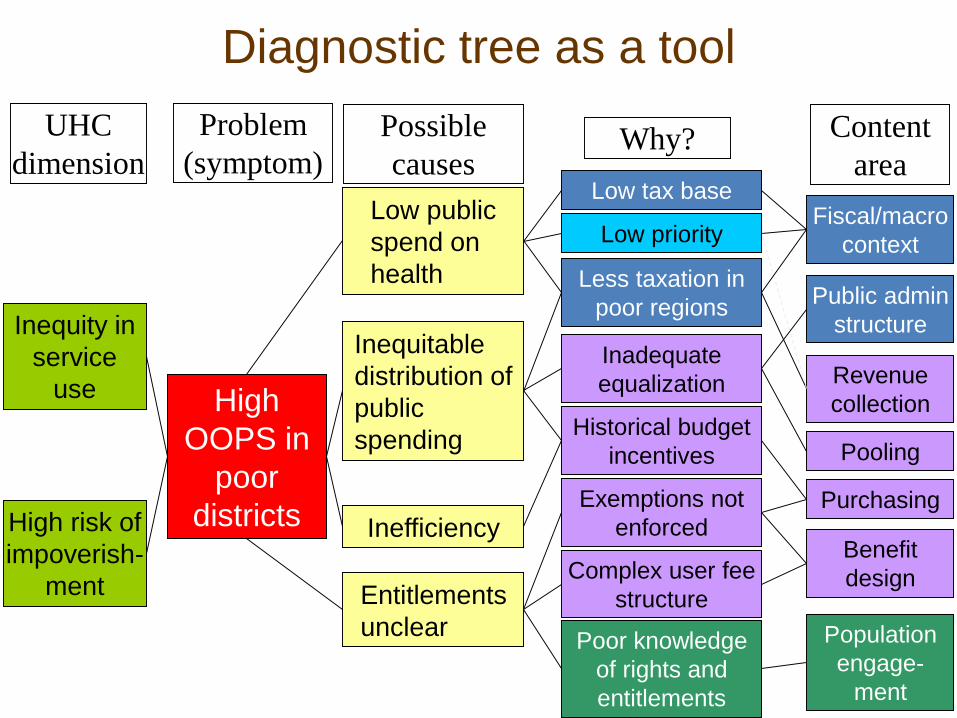
Diagnostic tree as a tool
Low public
spend on
health
Inequitable
distribution of
public
spending
Inefficiency
Possible
causes
Entitlements
unclear
High
OOPS in
poor
districts
Problem
(symptom)
UHC
dimension
Inequity in
service
use
High risk of
impoverish-
ment
Why?
Revenue
collection
Content
area
Population
engage-
ment
Benefit
design
Fiscal/macro
context
Public admin
structure
Pooling
Purchasing
Inadequate
equalization
Historical budget
incentives
Poor knowledge
of rights and
entitlements
Complex user fee
structure
Exemptions not
enforced
Less taxation in
poor regions
Low tax base
Low priority
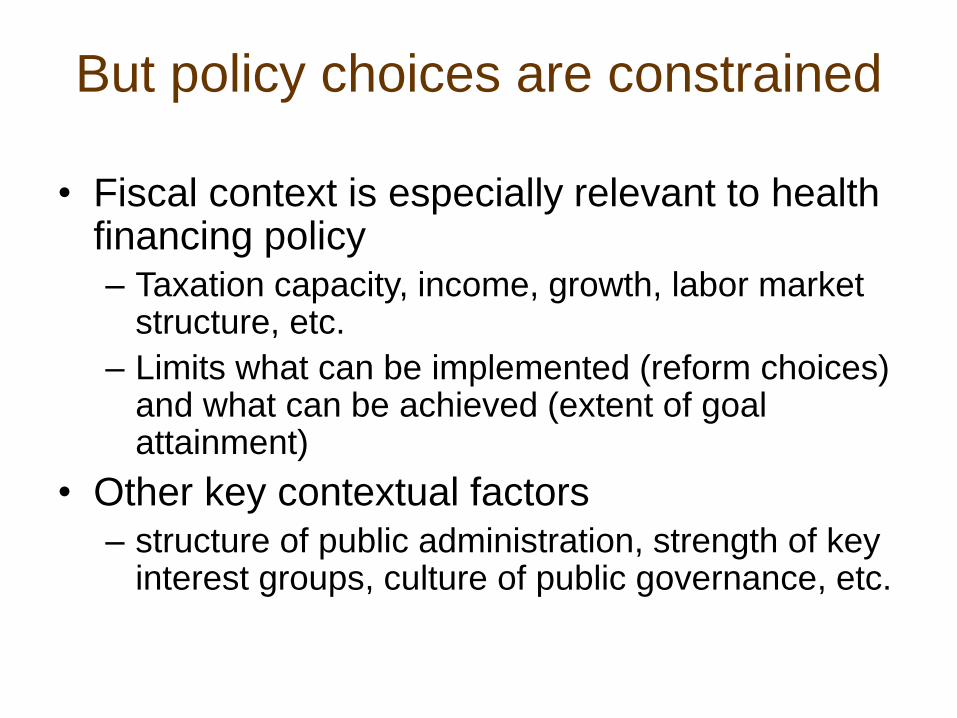
But policy choices are constrained
• Fiscal context is especially relevant to health financing policy
– Taxation capacity, income, growth, labor market structure, etc.
– Limits what can be implemented (reform choices) and what can be achieved (extent of goal attainment)
• Other key contextual factors
– structure of public administration, strength of key interest groups, culture of public governance, etc.
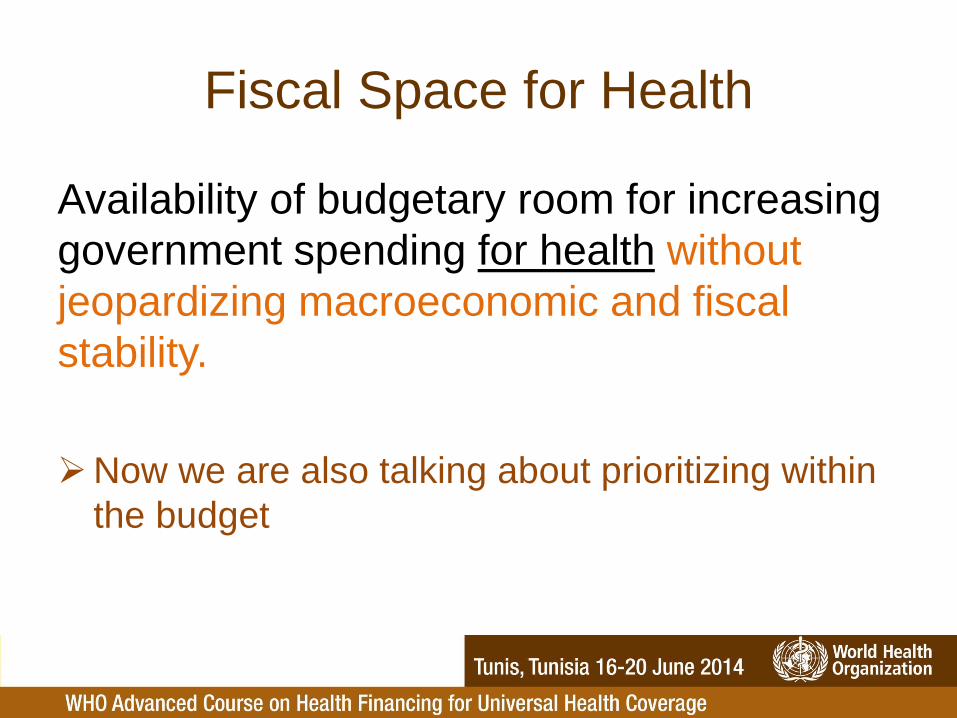
Fiscal Space for Health
Availability of budgetary room for increasing
government spending for health without
jeopardizing macroeconomic and fiscal
stability.
Now we are also talking about prioritizing within
the budget
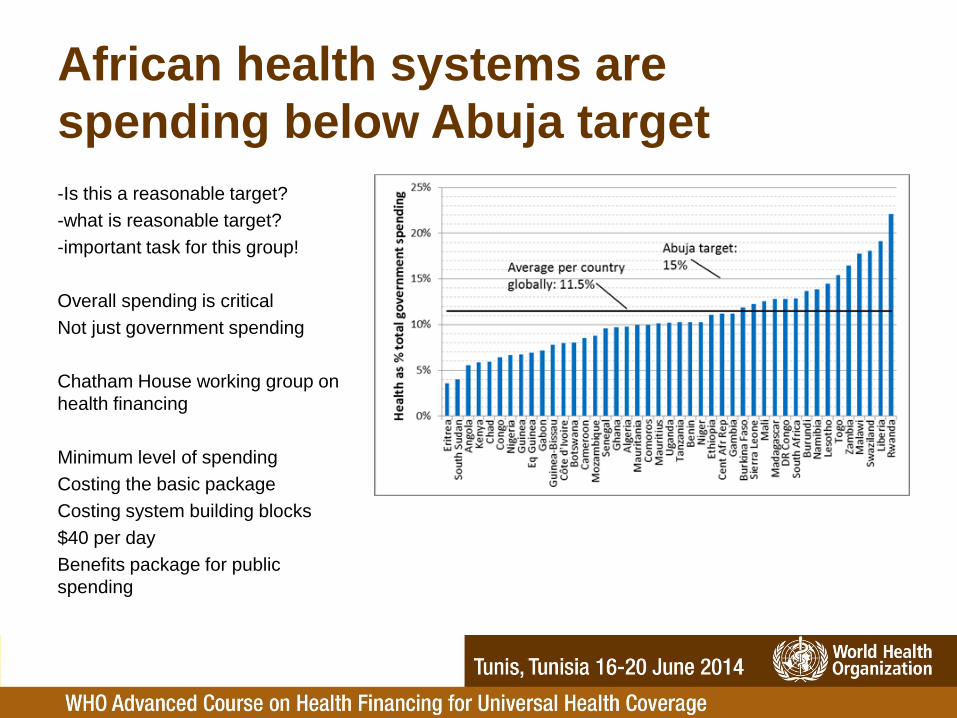
African health systems are
spending below Abuja target
-Is this a reasonable target?
-what is reasonable target?
-important task for this group!
Overall spending is critical
Not just government spending
Chatham House working group on
health financing
Minimum level of spending
Costing the basic package
Costing system building blocks
$40 per day
Benefits package for public
spending
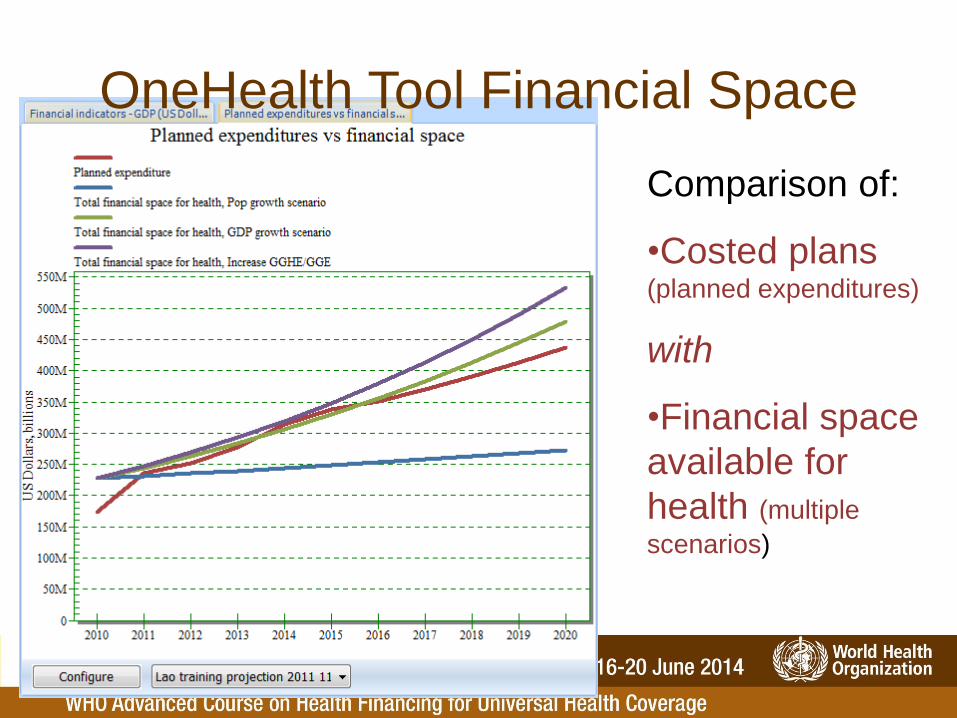
Comparison of:
•Costed plans (planned expenditures)
with
•Financial space
available for
health (multiple
scenarios)
OneHealth Tool Financial Space

OOP varies from
4% to 76% of
THE in 2012
Influenced by a
number of factors
including HF
policy
Wide variation in OOP
Source: WHO estimates for 2012, countries with population > 600,000
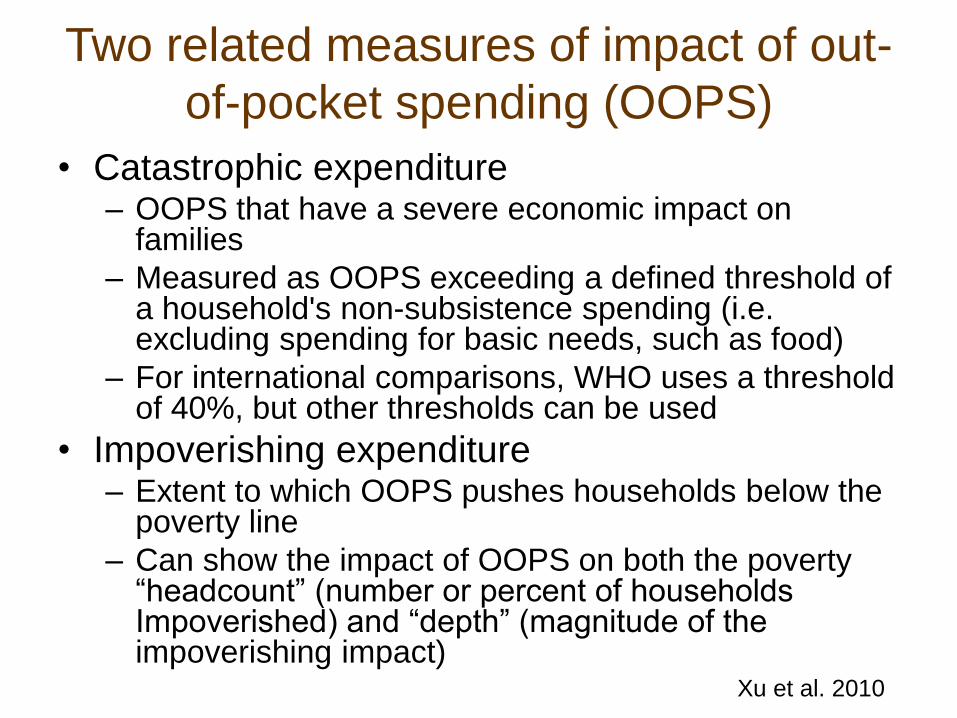
• Catastrophic expenditure – OOPS that have a severe economic impact on
families
– Measured as OOPS exceeding a defined threshold of a household's non-subsistence spending (i.e. excluding spending for basic needs, such as food)
– For international comparisons, WHO uses a threshold of 40%, but other thresholds can be used
• Impoverishing expenditure– Extent to which OOPS pushes households below the
poverty line
– Can show the impact of OOPS on both the poverty “headcount” (number or percent of households Impoverished) and “depth” (magnitude of the impoverishing impact)
Two related measures of impact of out-
of-pocket spending (OOPS)
Xu et al. 2010
Financial protection
0.00%
2.00%
4.00%
6.00%
8.00%
10.00%
12.00%
Sou
th A
fric
a
Gha
na
Cro
atia
Ma
law
i
Cape
Verd
e
Djib
ou
ti
Th
aila
nd
Jo
rdan
Phili
ppin
es
Mo
rocco
Me
xic
o
Rw
an
da
Za
mb
ia
Yem
en
Sen
ega
l
Arg
en
tin
a
Tu
nis
ia
Sri L
an
ka
Ken
ya
Burk
ina
Fa
so
Ukra
ine
Leb
ano
n
Ban
gla
de
sh
Ugan
da
Nepa
l
Cam
bod
ia
Ind
one
sia
Egyp
t
Ind
ia
Kyrg
yzsta
n
Re
pu
blic
of M
old
ova
Chin
a
Colo
mb
ia
Geo
rgia
Côte
d'Iv
oir
e
Bra
zil
Vie
t N
am
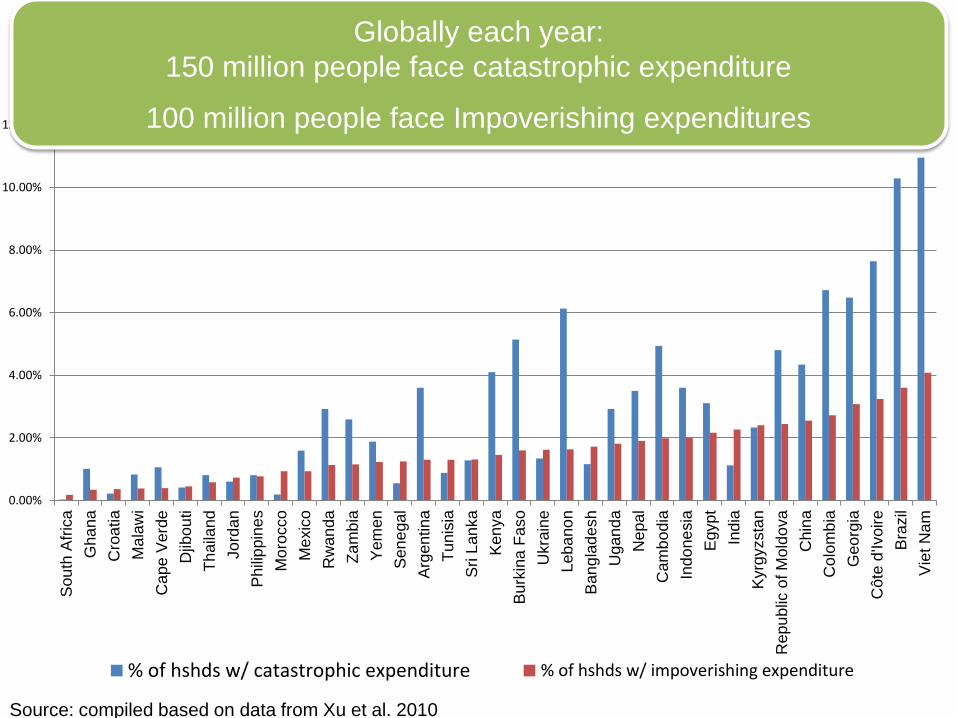
% of hshds w/ catastrophic expenditure % of hshds w/ impoverishing expenditure
Globally each year:
150 million people face catastrophic expenditure
100 million people face Impoverishing expenditures
Source: compiled based on data from Xu et al. 2010
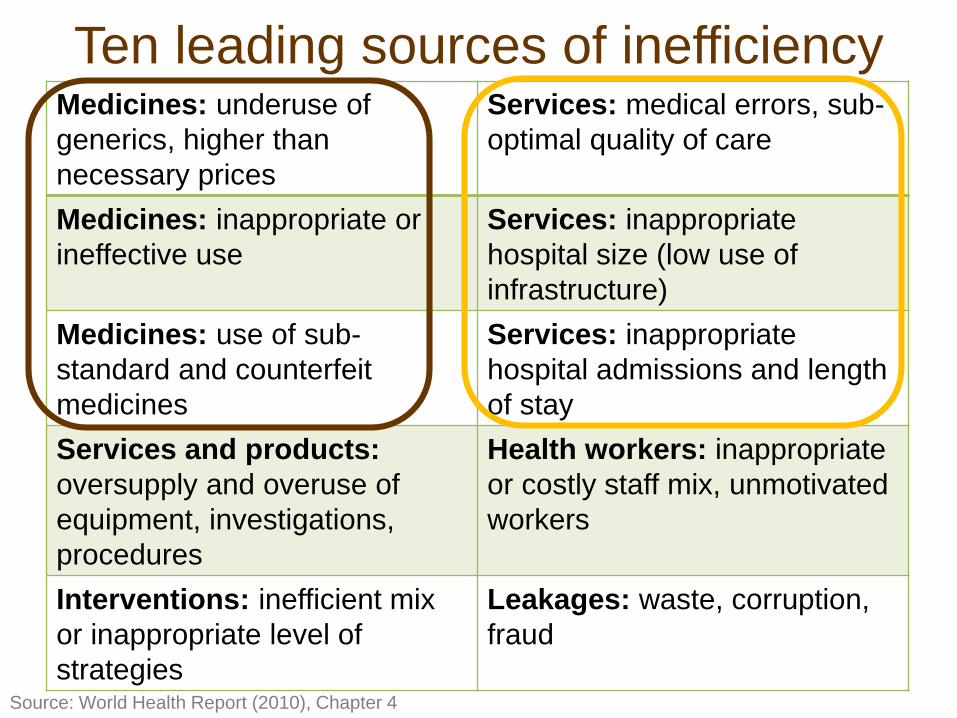
Medicines: underuse of
generics, higher than
necessary prices
Services: medical errors, sub-
optimal quality of care
Medicines: inappropriate or
ineffective use
Services: inappropriate
hospital size (low use of
infrastructure)
Medicines: use of sub-
standard and counterfeit
medicines
Services: inappropriate
hospital admissions and length
of stay
Services and products:
oversupply and overuse of
equipment, investigations,
procedures
Health workers: inappropriate
or costly staff mix, unmotivated
workers
Interventions: inefficient mix
or inappropriate level of
strategies
Leakages: waste, corruption,
fraud
Ten leading sources of inefficiency
Source: World Health Report (2010), Chapter 4
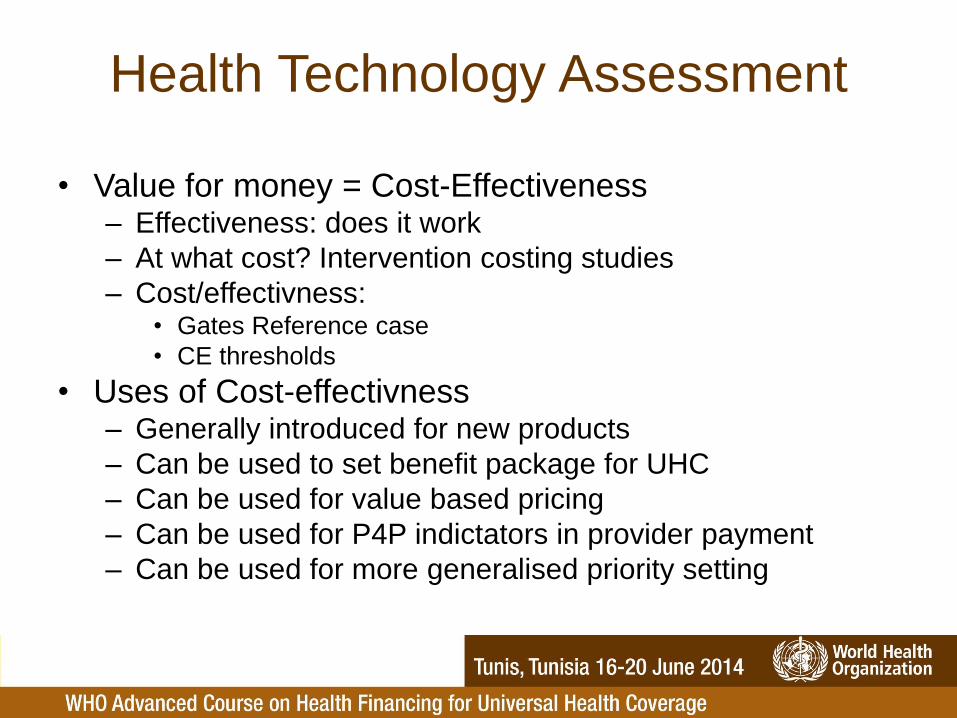
• Value for money = Cost-Effectiveness– Effectiveness: does it work
– At what cost? Intervention costing studies
– Cost/effectivness:• Gates Reference case
• CE thresholds
• Uses of Cost-effectivness– Generally introduced for new products
– Can be used to set benefit package for UHC
– Can be used for value based pricing
– Can be used for P4P indictators in provider payment
– Can be used for more generalised priority setting
Health Technology Assessment
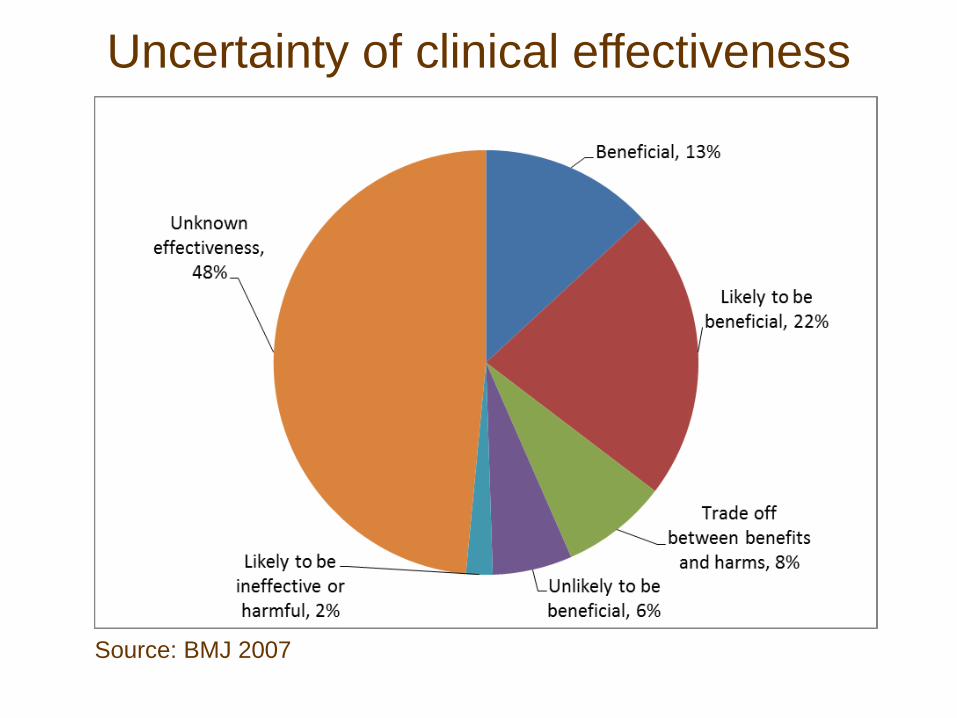
Uncertainty of clinical effectiveness
Source: BMJ 2007
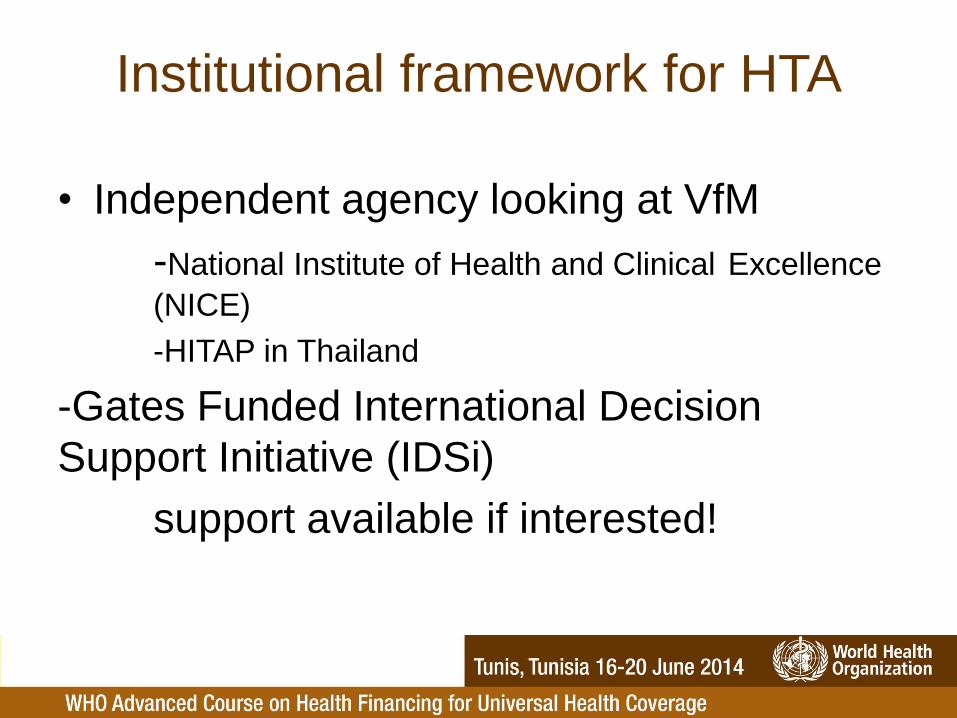
• Independent agency looking at VfM
-National Institute of Health and Clinical Excellence
(NICE)
-HITAP in Thailand
-Gates Funded International Decision
Support Initiative (IDSi)
support available if interested!
Institutional framework for HTA
The Gates Reference Case on Economic Evaluation:
The Gates-RC (Reference Case) sets out a standardised methodology based oncommon principles of good practice for the planning, conduct and reporting ofeconomic evaluations for informing priority setting in health.
The Bill and Melinda Gates Foundation commissioned the development of theGates-RC to be used in economic evaluations that receive BMGF funding, but theGates-RC has many further potential uses including:• empowering policy makers in low and middle-income countries to make their own
investment decisions based on relevant and high quality economic analyses;• driving methodological research; and• challenging the way donors and development partners think about the evidence
required to inform investments in health.• Using the reference case for Global Fund decisions on new technologies
This information session has been designed specifically Geneva-based colleagueswho were unable to attend the recent Gates-RC launch events in London. Thesession will introduce elements of the Gates-Reference Case and facilitate discussionabout the relevance of the Gates-Reference Case to individual organisations.
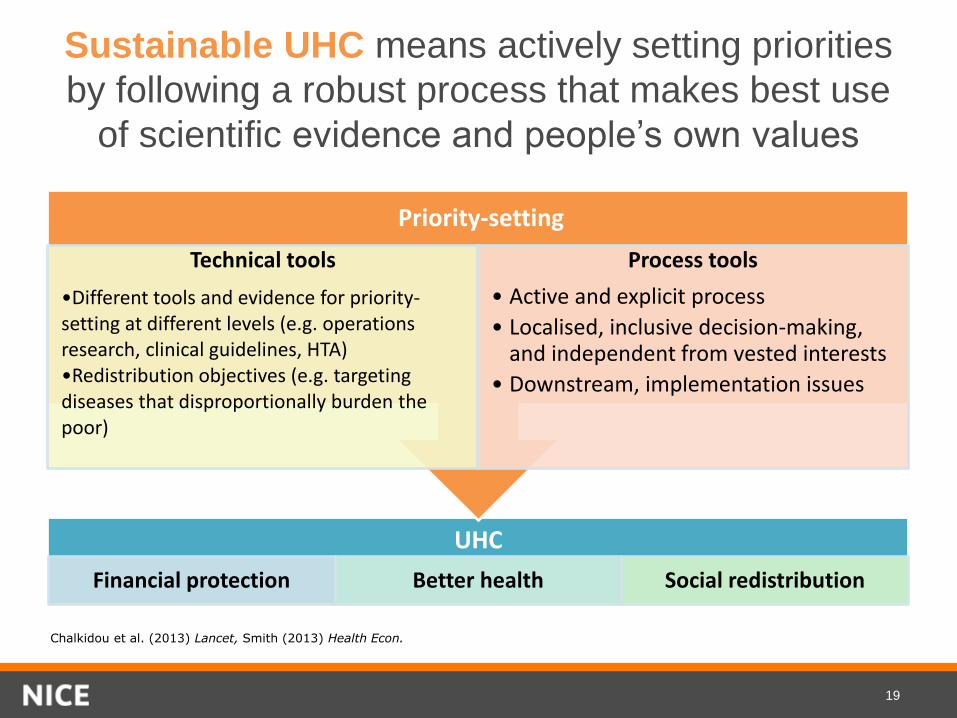
Sustainable UHC means actively setting priorities
by following a robust process that makes best use
of scientific evidence and people’s own values
19
UHC
Financial protection Better health Social redistribution
Technical tools
•Different tools and evidence for priority-setting at different levels (e.g. operations research, clinical guidelines, HTA)•Redistribution objectives (e.g. targeting diseases that disproportionally burden the poor)
Process tools
• Active and explicit process
• Localised, inclusive decision-making, and independent from vested interests
• Downstream, implementation issues
Chalkidou et al. (2013) Lancet, Smith (2013) Health Econ.
Priority-setting
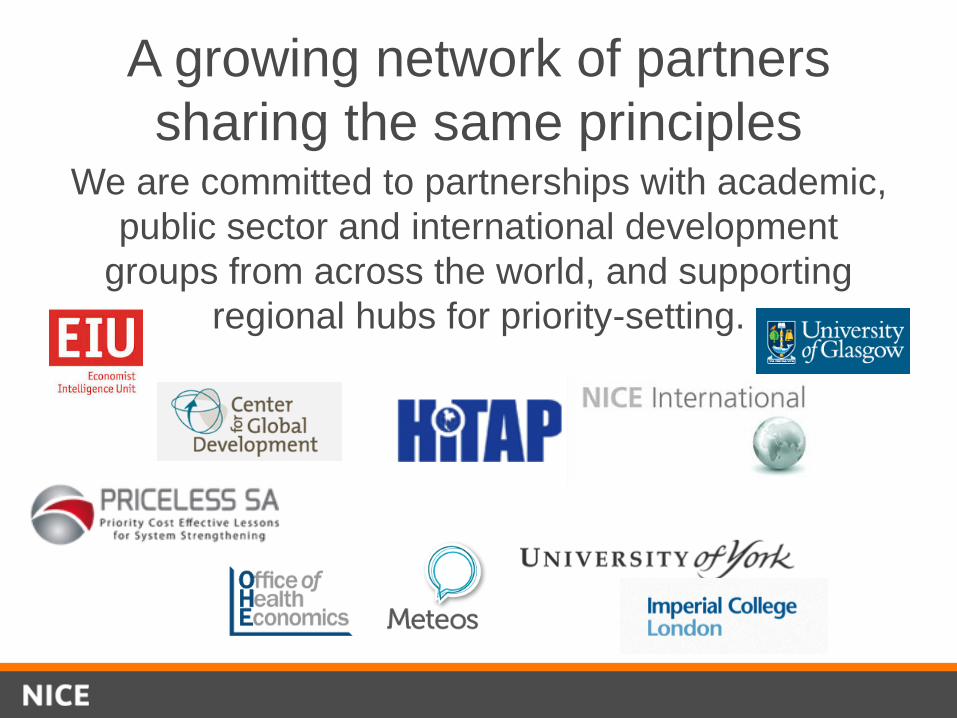
A growing network of partners
sharing the same principlesWe are committed to partnerships with academic,
public sector and international development
groups from across the world, and supporting
regional hubs for priority-setting.

Health Technology Assessment in South Africa
CABRI Johannesburg
2014
Karen HofmanUniversity of Witwatersrand School of Public Health
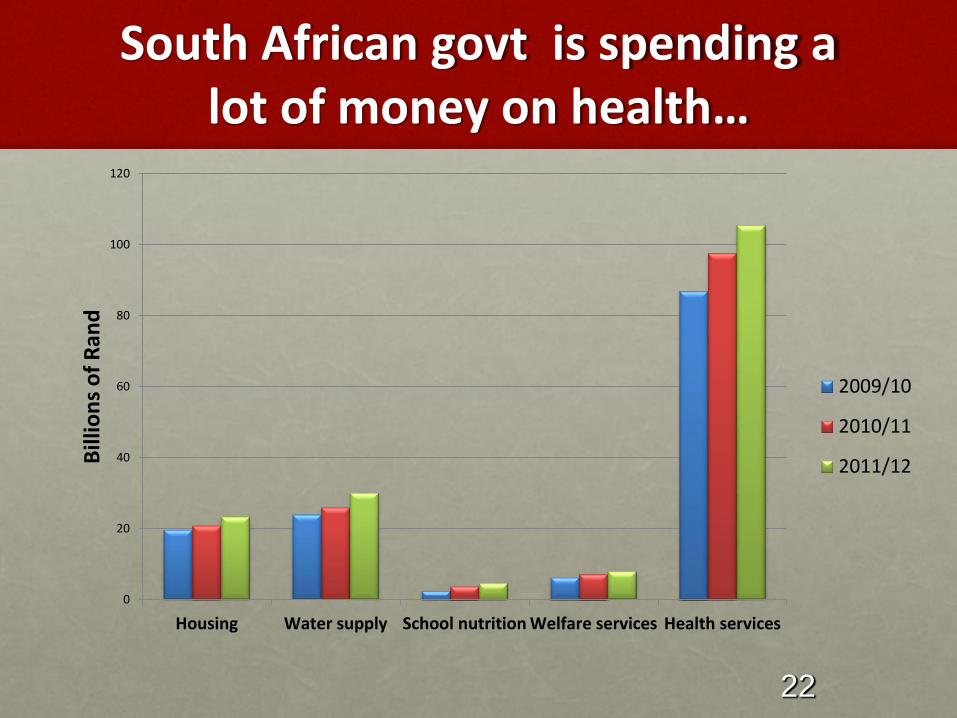
South African govt is spending a lot of money on health…
0
20
40
60
80
100
120
Housing Water supply School nutrition Welfare services Health services
Bill
ion
s o
f R
and
2009/10
2010/11
2011/12
22

South African govt is spending a lot of money on health…
0
20
40
60
80
100
120
Housing Water supply School nutrition Welfare services Health services
Bill
ion
s o
f R
and
2009/10
2010/11
2011/12
24
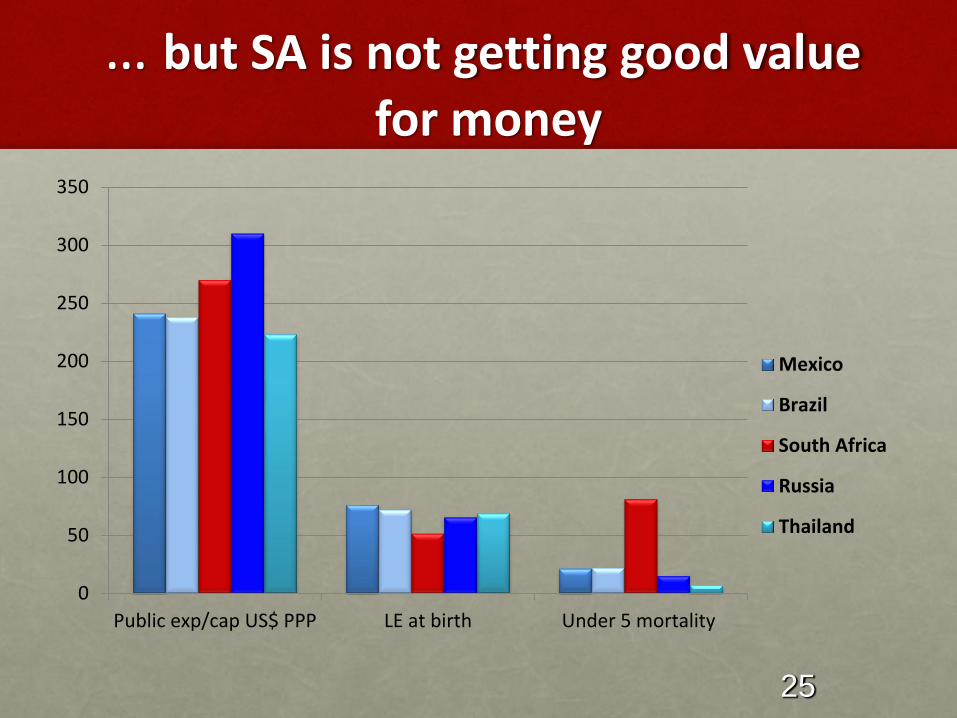
… but SA is not getting good value
for money
0
50
100
150
200
250
300
350
Public exp/cap US$ PPP LE at birth Under 5 mortality
Mexico
Brazil
South Africa
Russia
Thailand
25
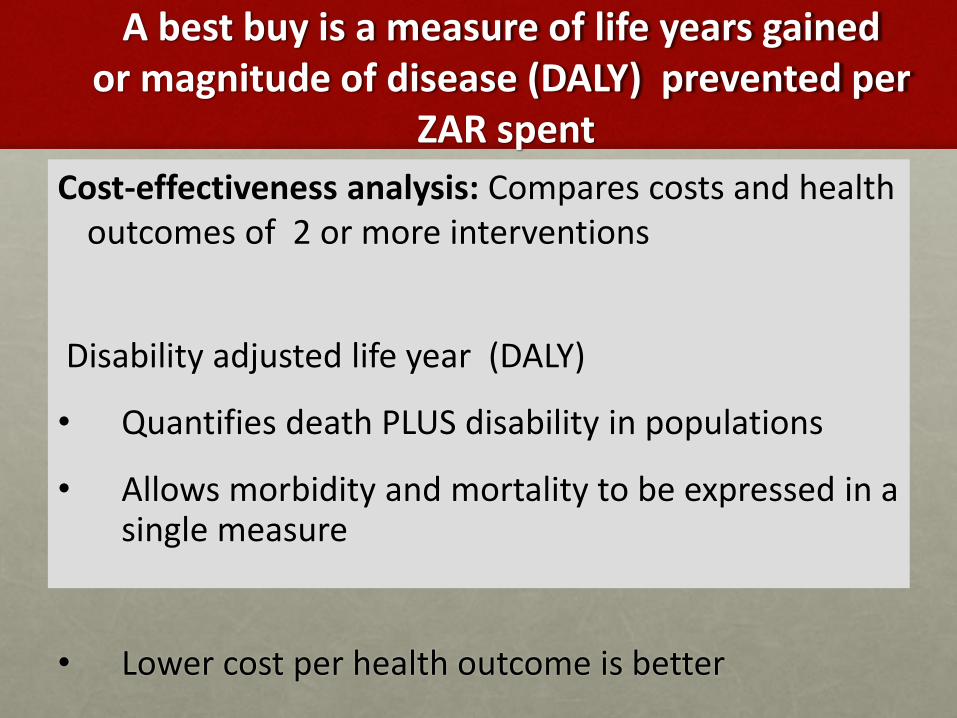
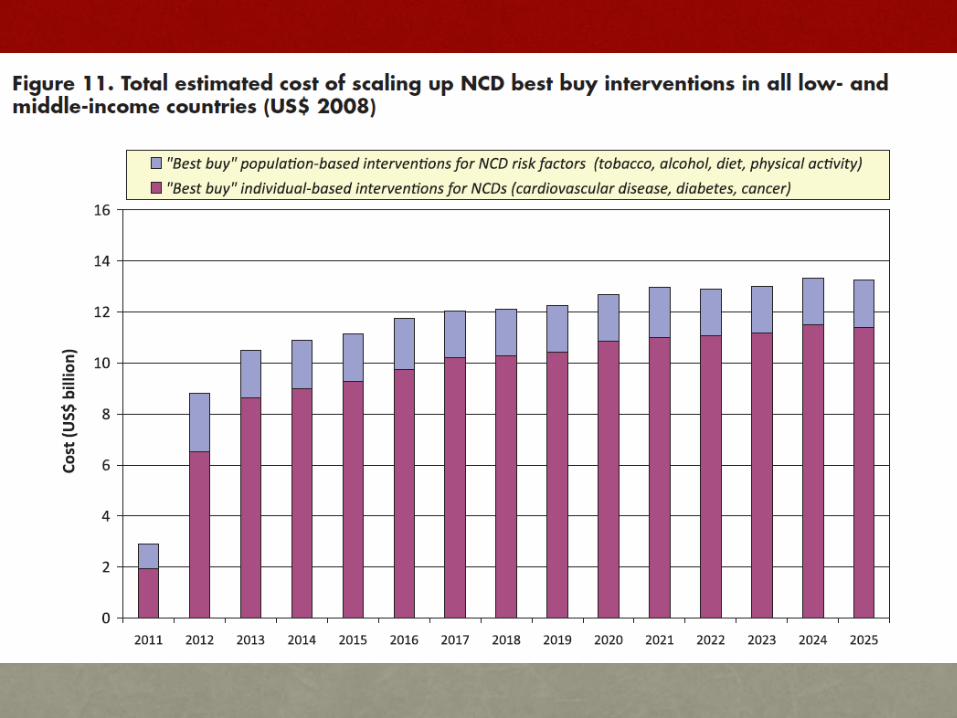
A best buy is a measure of life years gained or magnitude of disease (DALY) prevented per
ZAR spent
Cost-effectiveness analysis: Compares costs and health outcomes of 2 or more interventions
Disability adjusted life year (DALY)
• Quantifies death PLUS disability in populations
• Allows morbidity and mortality to be expressed in a single measure
• Lower cost per health outcome is better
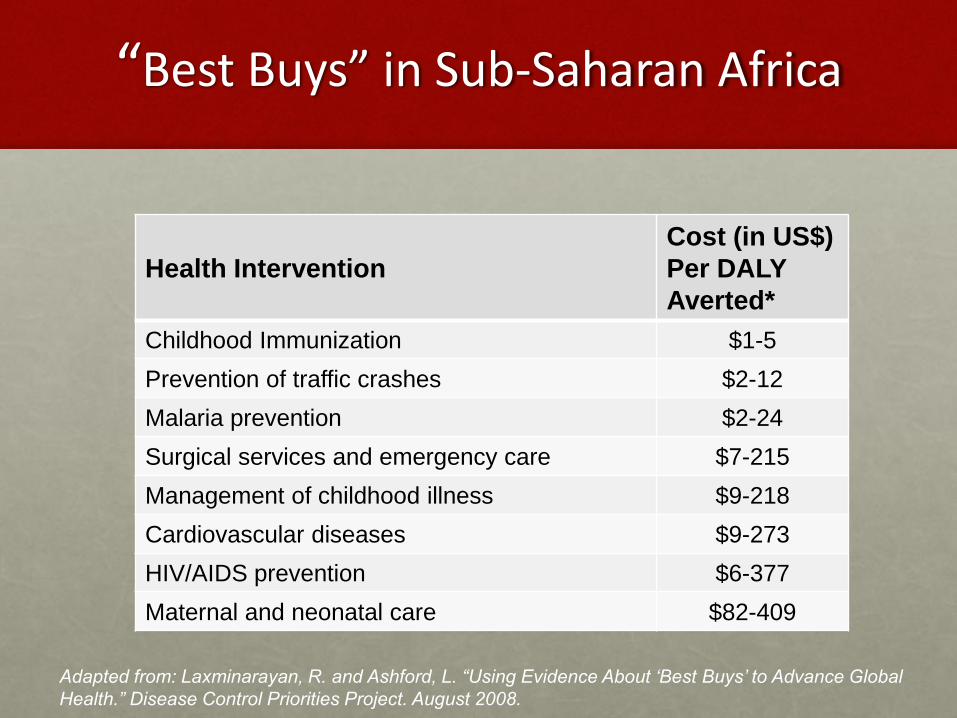
“Best Buys” in Sub-Saharan Africa
Health Intervention
Cost (in US$)
Per DALY
Averted*
Childhood Immunization $1-5
Prevention of traffic crashes $2-12
Malaria prevention $2-24
Surgical services and emergency care $7-215
Management of childhood illness $9-218
Cardiovascular diseases $9-273
HIV/AIDS prevention $6-377
Maternal and neonatal care $82-409
Adapted from: Laxminarayan, R. and Ashford, L. “Using Evidence About ‘Best Buys’ to Advance Global
Health.” Disease Control Priorities Project. August 2008.

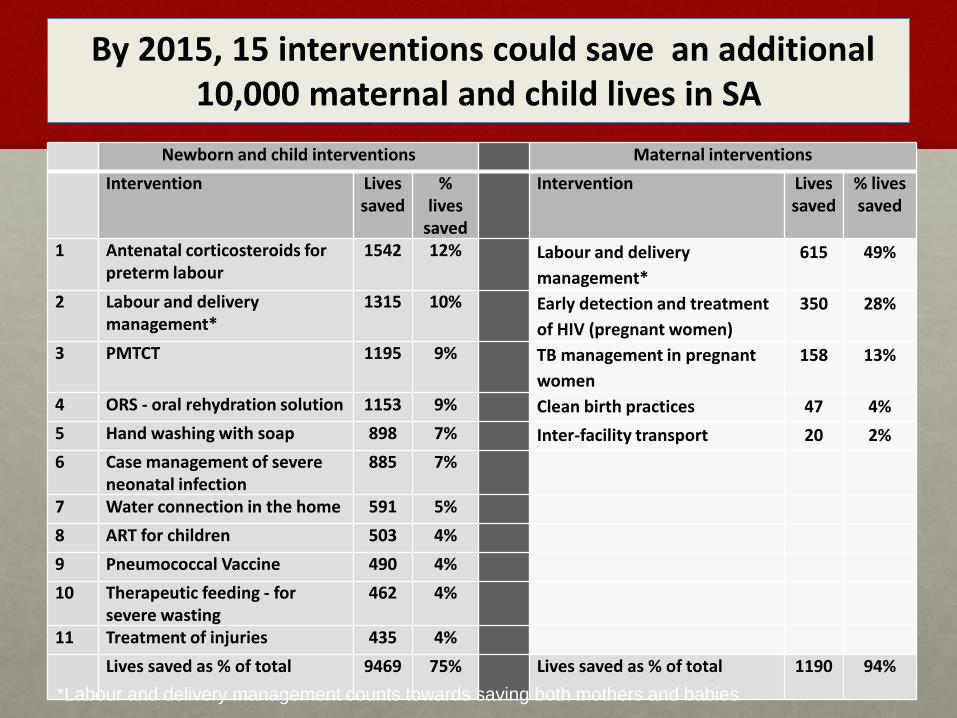
By 2015, 15 interventions could save an additional 10,000 maternal and child lives in SA
Newborn and child interventions Maternal interventions
Intervention Lives saved
% lives
saved
Intervention Lives saved
% lives saved
1 Antenatal corticosteroids for preterm labour
1542 12% Labour and delivery
management*
615 49%
2 Labour and delivery management*
1315 10% Early detection and treatment
of HIV (pregnant women)
350 28%
3 PMTCT 1195 9% TB management in pregnant
women
158 13%
4 ORS - oral rehydration solution 1153 9% Clean birth practices 47 4%
5 Hand washing with soap 898 7% Inter-facility transport 20 2%
6 Case management of severe neonatal infection
885 7%
7 Water connection in the home 591 5%
8 ART for children 503 4%
9 Pneumococcal Vaccine 490 4%
10 Therapeutic feeding - for severe wasting
462 4%
11 Treatment of injuries 435 4%
Lives saved as % of total 9469 75% Lives saved as % of total 1190 94%
*Labour and delivery management counts towards saving both mothers and babies

PRICELESS SA
Priority
Cost Effective
Lessons for
Systems
Strengthening
South Africa
SYSTEMATIC DECISION-MAKING for HEALTH BASED ON EVIDENCE
32
Priority setting for HIV/AIDS, TB, Malaria, MCH, health
systems
• Many different models for optimising spending for HIV/AIDS
• New World Bank Optimyze includes best solution for money of allocative efficiency
• New models for TB
• Working on malaria
• MCH model with LIST—SA PRICELESS project
• One Health should has overall system tools
• Global Fund can support tool use in your country through Special Initiative
• Modelling combined with country support process
33
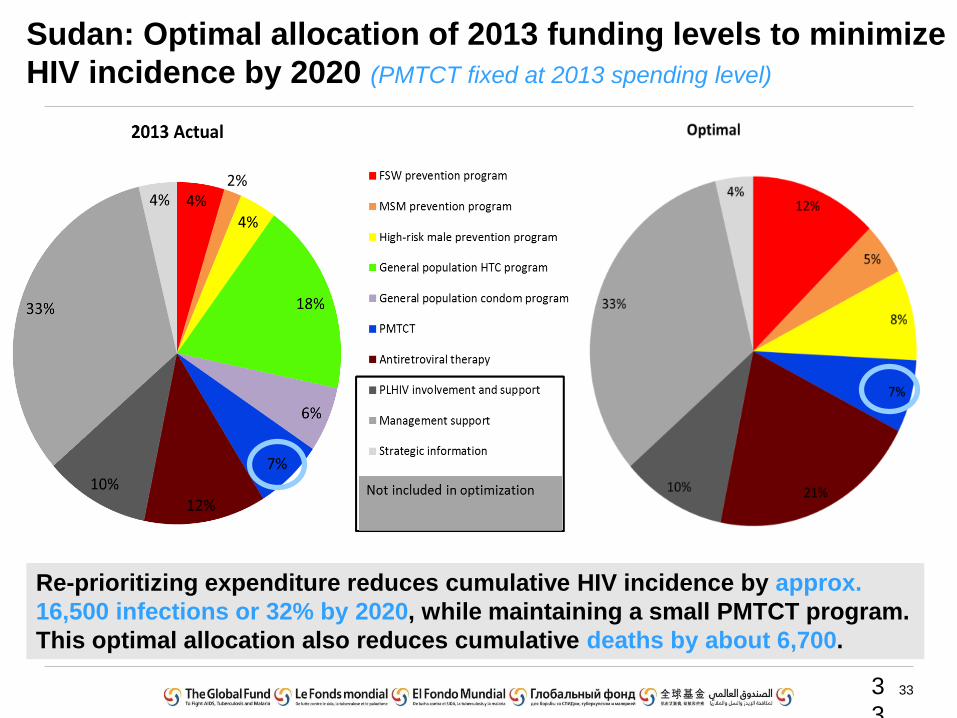
Sudan: Optimal allocation of 2013 funding levels to minimize
HIV incidence by 2020 (PMTCT fixed at 2013 spending level)
3
3
Re-prioritizing expenditure reduces cumulative HIV incidence by approx.
16,500 infections or 32% by 2020, while maintaining a small PMTCT program.
This optimal allocation also reduces cumulative deaths by about 6,700.
34
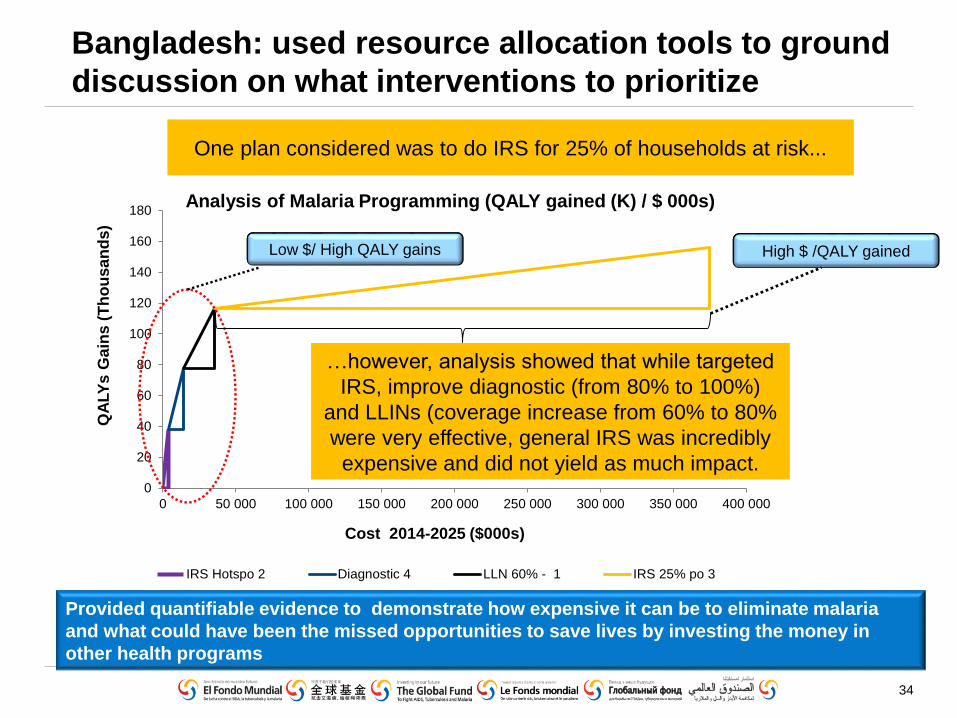
Bangladesh: used resource allocation tools to ground
discussion on what interventions to prioritize
0
20
40
60
80
100
120
140
160
180
0 50 000 100 000 150 000 200 000 250 000 300 000 350 000 400 000
QA
LY
s G
ain
s (
Th
ou
sa
nd
s)
IRS Hotspo 2 Diagnostic 4 LLN 60% - 1 IRS 25% po 3
…however, analysis showed that while targeted
IRS, improve diagnostic (from 80% to 100%)
and LLINs (coverage increase from 60% to 80%
were very effective, general IRS was incredibly
expensive and did not yield as much impact.
One plan considered was to do IRS for 25% of households at risk...
Cost 2014-2025 ($000s)
Low $/ High QALY gains High $ /QALY gained
Analysis of Malaria Programming (QALY gained (K) / $ 000s)
Provided quantifiable evidence to demonstrate how expensive it can be to eliminate malaria
and what could have been the missed opportunities to save lives by investing the money in
other health programs
35
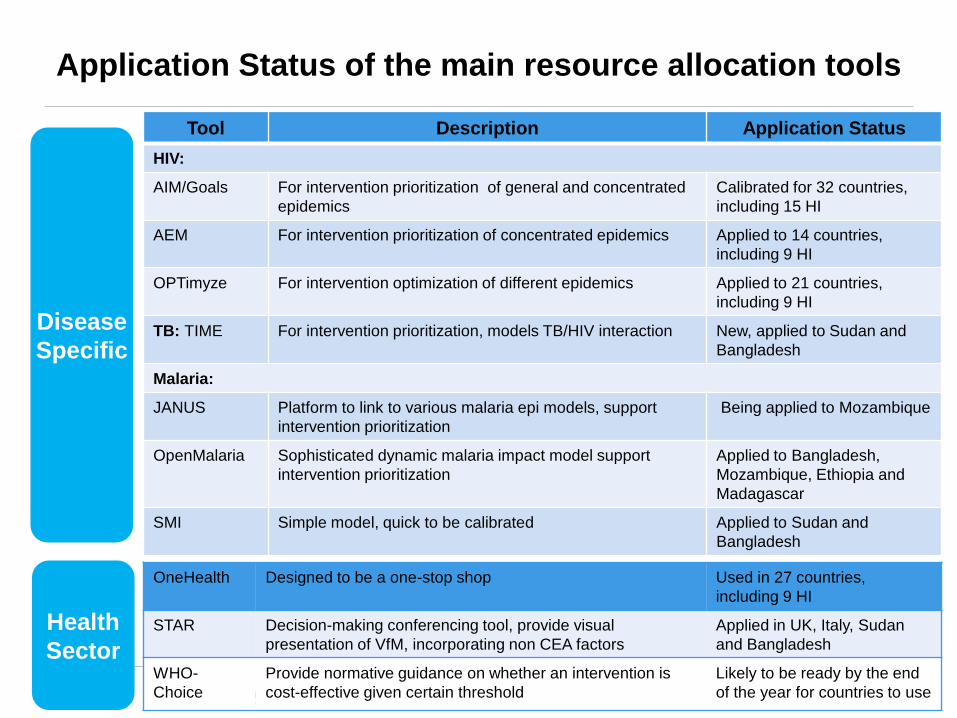
Application Status of the main resource allocation tools
Disease
Specific
Health
Sector
Tool Description Application Status
HIV:
AIM/Goals For intervention prioritization of general and concentrated
epidemics
Calibrated for 32 countries,
including 15 HI
AEM For intervention prioritization of concentrated epidemics Applied to 14 countries,
including 9 HI
OPTimyze For intervention optimization of different epidemics Applied to 21 countries,
including 9 HI
TB: TIME For intervention prioritization, models TB/HIV interaction New, applied to Sudan and
Bangladesh
Malaria:
JANUS Platform to link to various malaria epi models, support
intervention prioritization
Being applied to Mozambique
OpenMalaria Sophisticated dynamic malaria impact model support
intervention prioritization
Applied to Bangladesh,
Mozambique, Ethiopia and
Madagascar
SMI Simple model, quick to be calibrated Applied to Sudan and
Bangladesh
OneHealth Designed to be a one-stop shop Used in 27 countries,
including 9 HI
STAR Decision-making conferencing tool, provide visual
presentation of VfM, incorporating non CEA factors
Applied in UK, Italy, Sudan
and Bangladesh
WHO-
Choice
Provide normative guidance on whether an intervention is
cost-effective given certain threshold
Likely to be ready by the end
of the year for countries to use
36
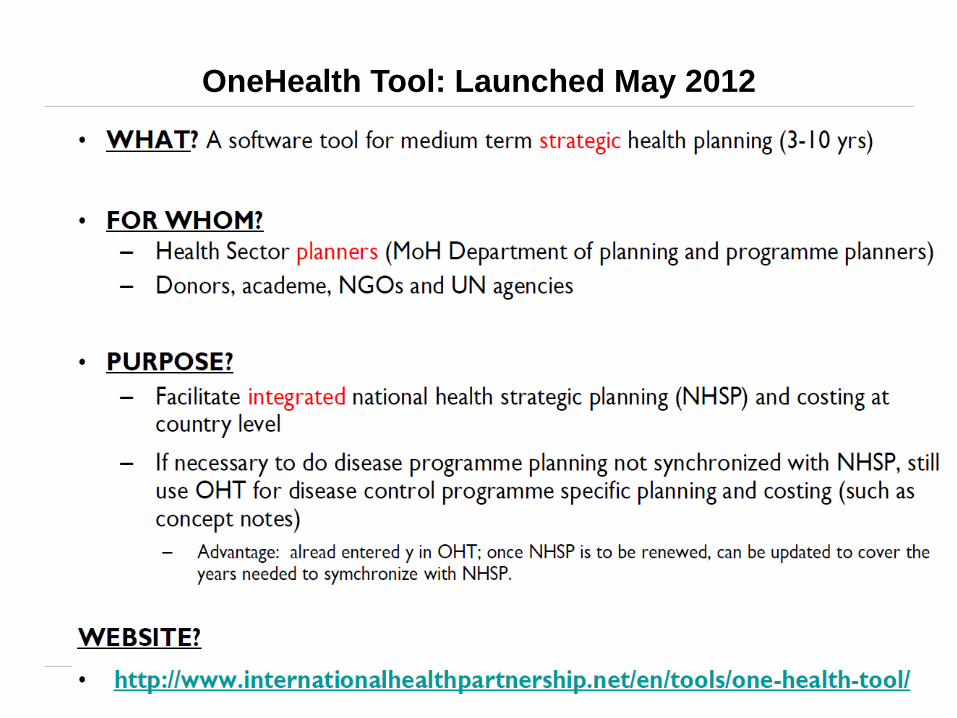
OneHealth Tool: Launched May 2012
3
6
37
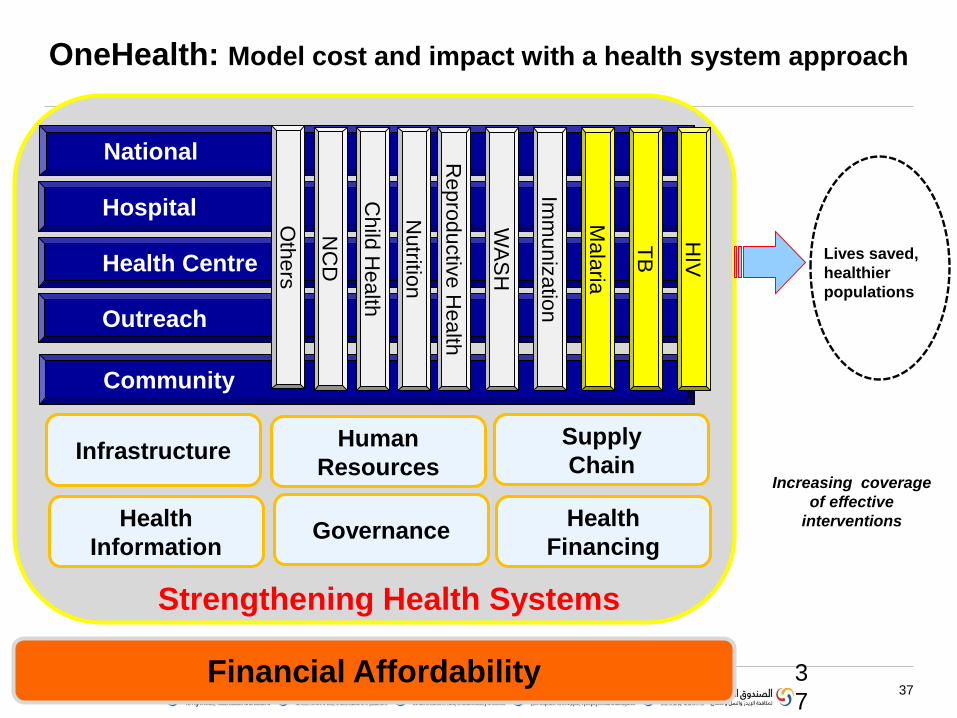
OneHealth: Model cost and impact with a health system approach
3
7
National
Hospital
Health Centre
Outreach
Community M
ala
ria
TB
HIV
Repro
ductiv
e H
ealth
WA
SH
Imm
un
iza
tion
Child
Health
Nutritio
n
NC
D
Oth
ers
InfrastructureHuman
Resources
Supply
Chain
Health
Information Governance
Health
Financing
Strengthening Health Systems
Financial Affordability
Lives saved,
healthier
populations
Increasing coverage
of effective
interventions
38
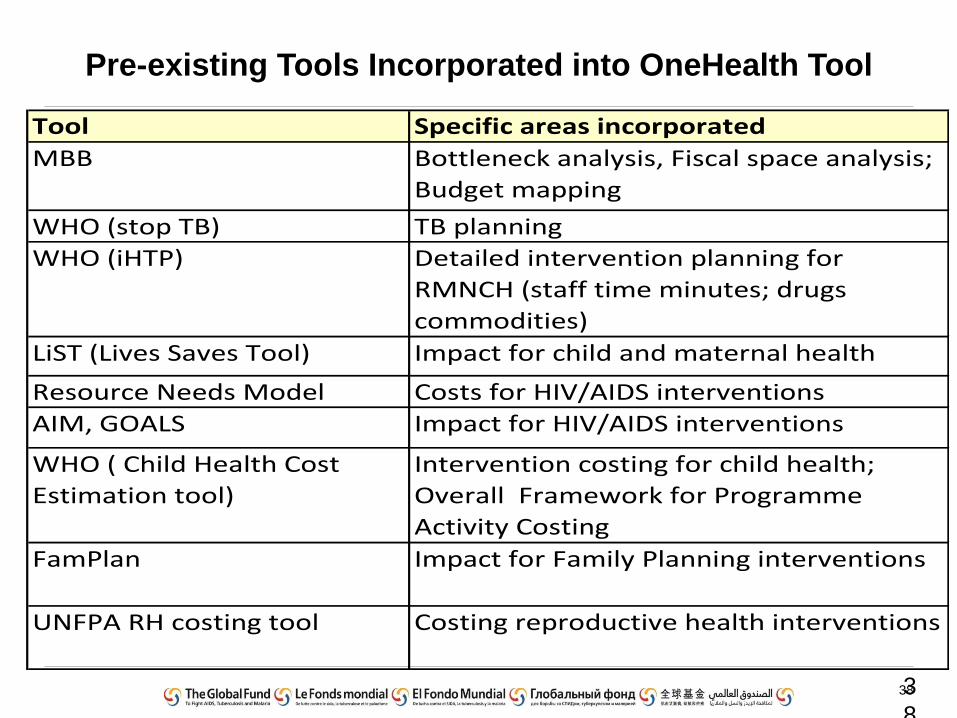
Pre-existing Tools Incorporated into OneHealth Tool
3
8
Tool Specific areas incorporated
MBB Bottleneck analysis, Fiscal space analysis;
Budget mapping
WHO (stop TB) TB planning
WHO (iHTP) Detailed intervention planning for
RMNCH (staff time minutes; drugs
commodities)
LiST (Lives Saves Tool) Impact for child and maternal health
Resource Needs Model Costs for HIV/AIDS interventions
AIM, GOALS Impact for HIV/AIDS interventions
WHO ( Child Health Cost
Estimation tool)
Intervention costing for child health;
Overall Framework for Programme
Activity Costing
FamPlan Impact for Family Planning interventions
UNFPA RH costing tool Costing reproductive health interventions
39
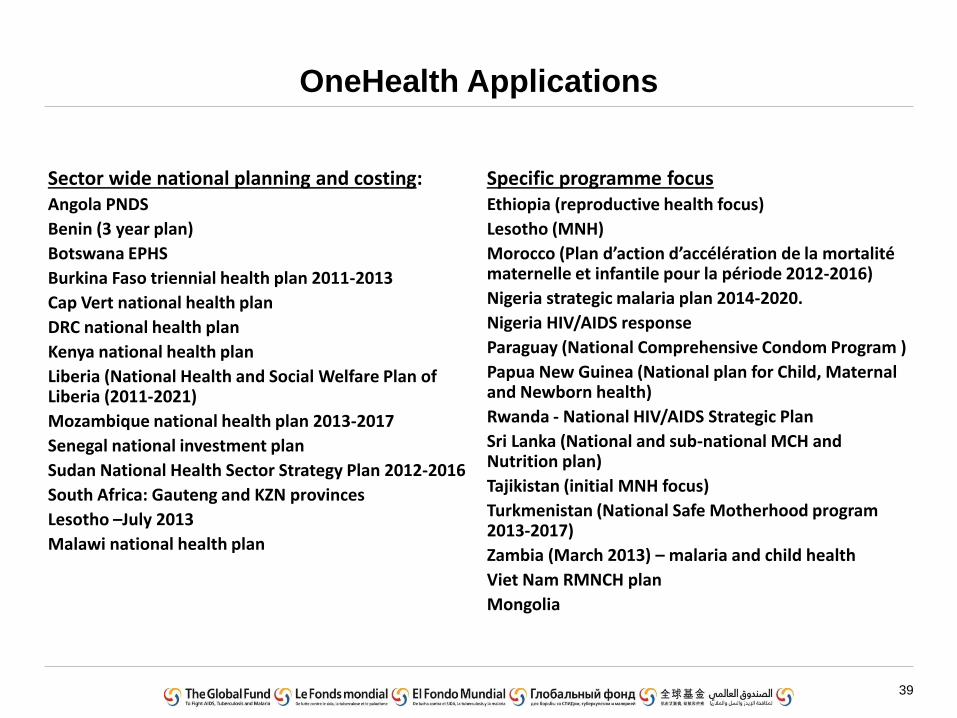
OneHealth Applications
Sector wide national planning and costing:Angola PNDS
Benin (3 year plan)
Botswana EPHS
Burkina Faso triennial health plan 2011-2013
Cap Vert national health plan
DRC national health plan
Kenya national health plan
Liberia (National Health and Social Welfare Plan of Liberia (2011-2021)
Mozambique national health plan 2013-2017
Senegal national investment plan
Sudan National Health Sector Strategy Plan 2012-2016
South Africa: Gauteng and KZN provinces
Lesotho –July 2013
Malawi national health plan
Specific programme focusEthiopia (reproductive health focus)
Lesotho (MNH)
Morocco (Plan d’action d’accélération de la mortalité maternelle et infantile pour la période 2012-2016)
Nigeria strategic malaria plan 2014-2020.
Nigeria HIV/AIDS response
Paraguay (National Comprehensive Condom Program )
Papua New Guinea (National plan for Child, Maternal and Newborn health)
Rwanda - National HIV/AIDS Strategic Plan
Sri Lanka (National and sub-national MCH and Nutrition plan)
Tajikistan (initial MNH focus)
Turkmenistan (National Safe Motherhood program 2013-2017)
Zambia (March 2013) – malaria and child health
Viet Nam RMNCH plan
Mongolia
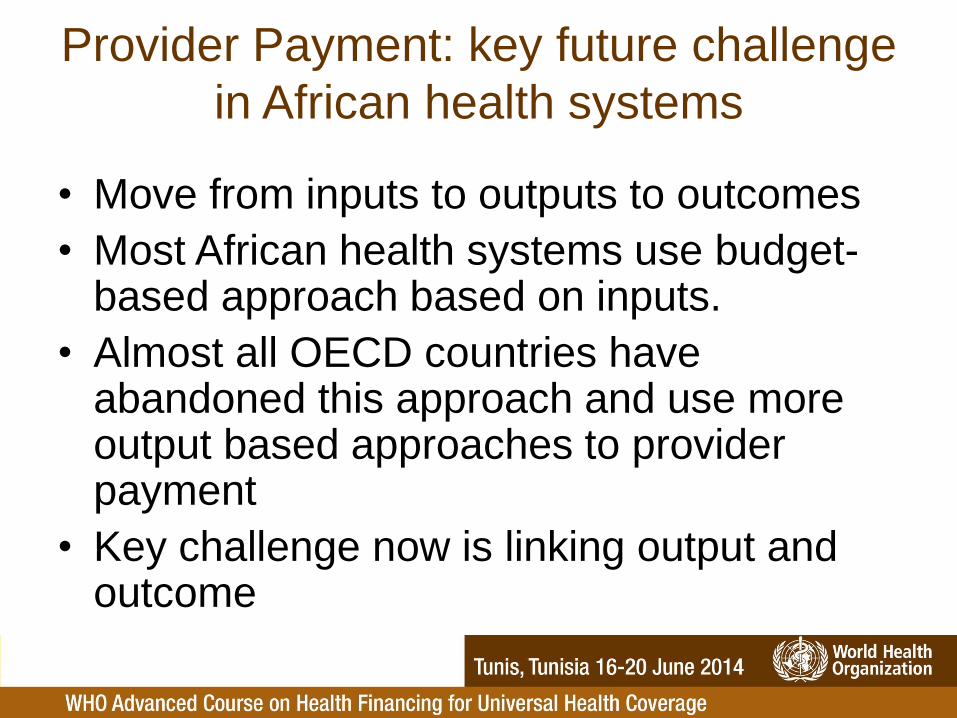
• Move from inputs to outputs to outcomes
• Most African health systems use budget-based approach based on inputs.
• Almost all OECD countries have abandoned this approach and use more output based approaches to provider payment
• Key challenge now is linking output and outcome
Provider Payment: key future challenge
in African health systems
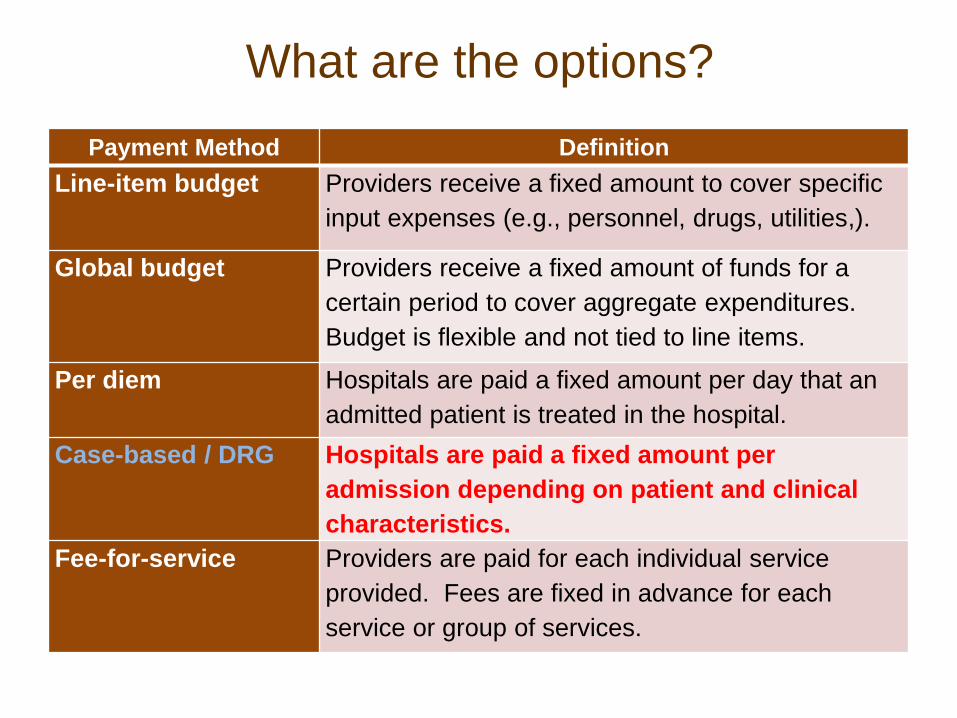
What are the options?
Payment Method Definition
Line-item budget Providers receive a fixed amount to cover specific
input expenses (e.g., personnel, drugs, utilities,).
Global budget Providers receive a fixed amount of funds for a
certain period to cover aggregate expenditures.
Budget is flexible and not tied to line items.
Per diem Hospitals are paid a fixed amount per day that an
admitted patient is treated in the hospital.
Case-based / DRG Hospitals are paid a fixed amount per
admission depending on patient and clinical
characteristics.
Fee-for-service Providers are paid for each individual service
provided. Fees are fixed in advance for each
service or group of services.
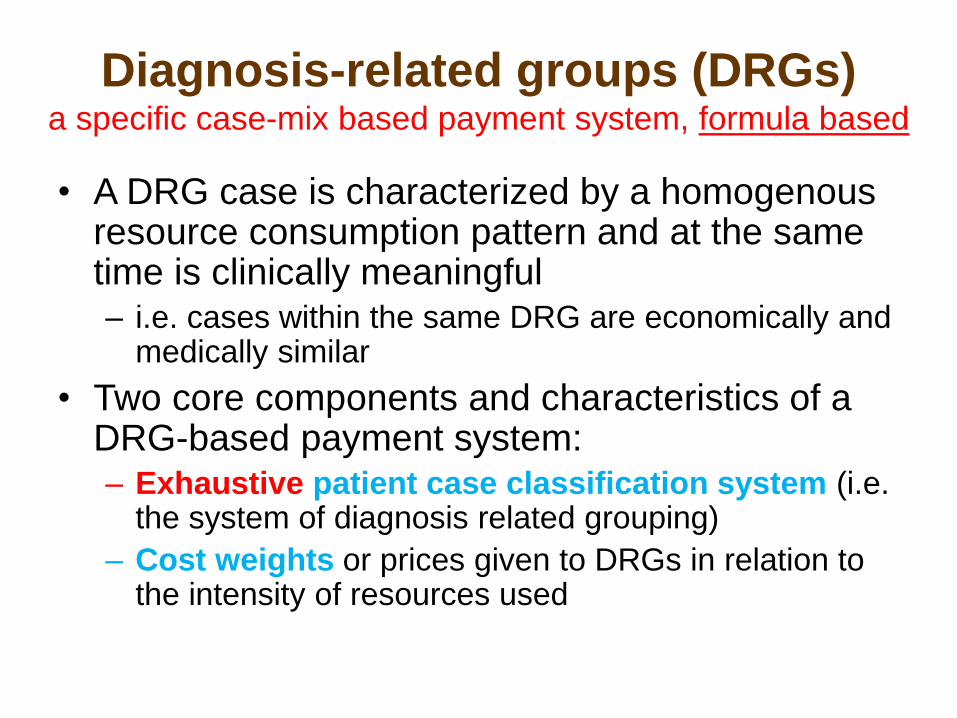
Diagnosis-related groups (DRGs) a specific case-mix based payment system, formula based
• A DRG case is characterized by a homogenous resource consumption pattern and at the same time is clinically meaningful – i.e. cases within the same DRG are economically and
medically similar
• Two core components and characteristics of a DRG-based payment system:– Exhaustive patient case classification system (i.e.
the system of diagnosis related grouping)
– Cost weights or prices given to DRGs in relation to the intensity of resources used
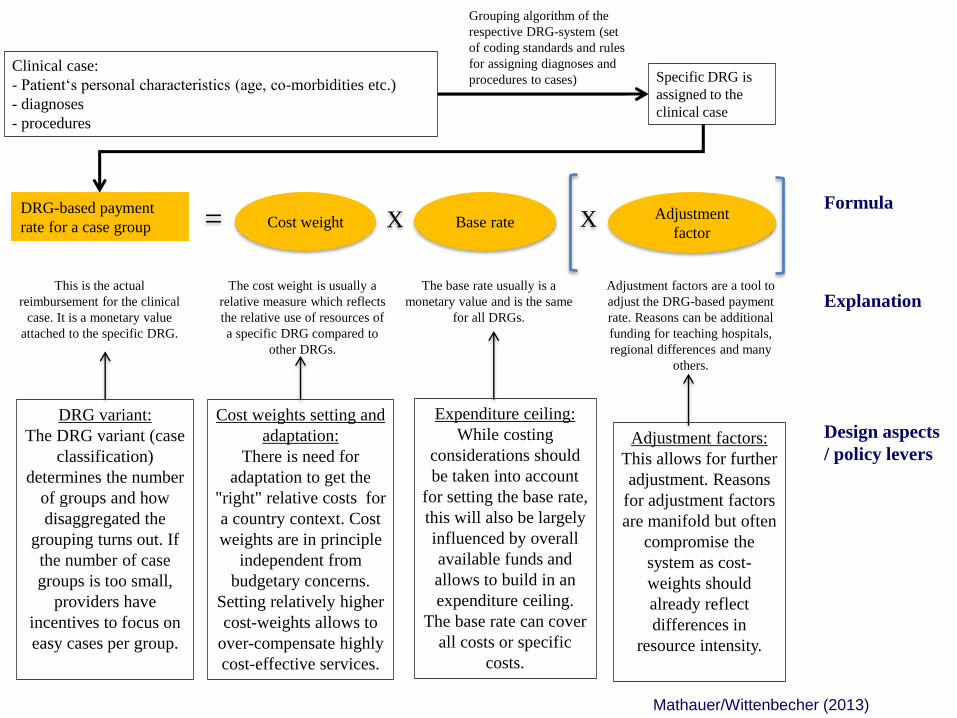
The base rate usually is a
monetary value and is the same
for all DRGs.
Grouping algorithm of the
respective DRG-system (set
of coding standards and rules
for assigning diagnoses and
procedures to cases)
The cost weight is usually a
relative measure which reflects
the relative use of resources of
a specific DRG compared to
other DRGs.
Cost weights setting and
adaptation:
There is need for
adaptation to get the
"right" relative costs for
a country context. Cost
weights are in principle
independent from
budgetary concerns.
Setting relatively higher
cost-weights allows to
over-compensate highly
cost-effective services.
This is the actual
reimbursement for the clinical
case. It is a monetary value
attached to the specific DRG.
Adjustment factors are a tool to
adjust the DRG-based payment
rate. Reasons can be additional
funding for teaching hospitals,
regional differences and many
others.
Expenditure ceiling:
While costing
considerations should
be taken into account
for setting the base rate,
this will also be largely
influenced by overall
available funds and
allows to build in an
expenditure ceiling.
The base rate can cover
all costs or specific
costs.
Clinical case:
- Patient‘s personal characteristics (age, co-morbidities etc.)
- diagnoses
- procedures
Specific DRG is
assigned to the
clinical case
Adjustment factors:
This allows for further
adjustment. Reasons
for adjustment factors
are manifold but often
compromise the
system as cost-
weights should
already reflect
differences in
resource intensity.
Design aspects
/ policy levers
Explanation
DRG variant:
The DRG variant (case
classification)
determines the number
of groups and how
disaggregated the
grouping turns out. If
the number of case
groups is too small,
providers have
incentives to focus on
easy cases per group.
Base rateAdjustment
factorXCost weight X=
DRG-based payment
rate for a case group
Formula
Mathauer/Wittenbecher (2013)
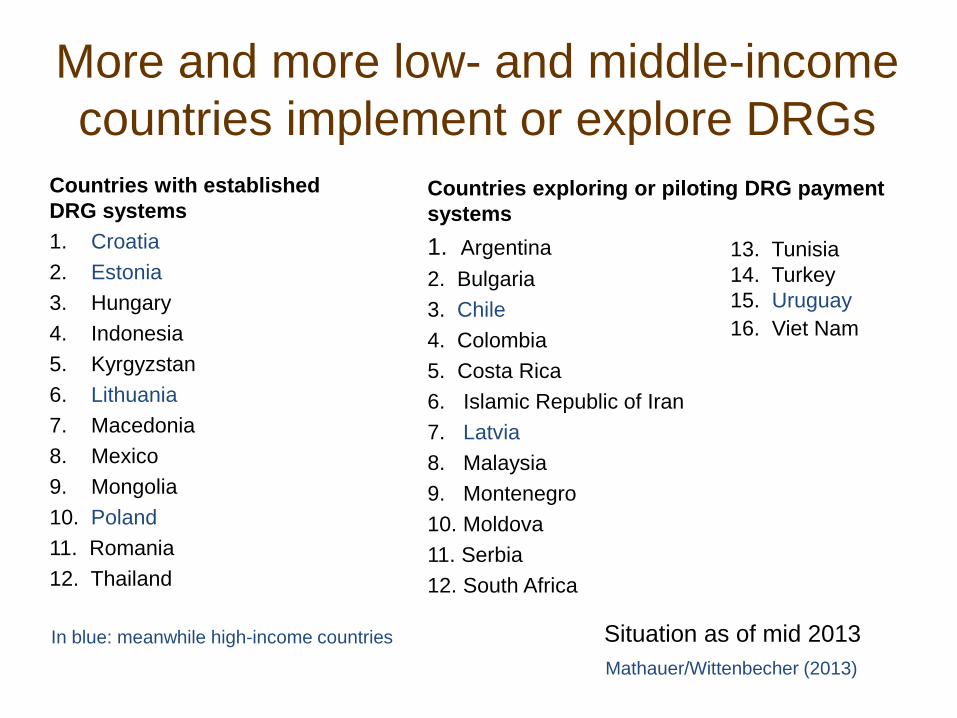
More and more low- and middle-income
countries implement or explore DRGs
Countries with established
DRG systems
1. Croatia
2. Estonia
3. Hungary
4. Indonesia
5. Kyrgyzstan
6. Lithuania
7. Macedonia
8. Mexico
9. Mongolia
10. Poland
11. Romania
12. Thailand
Countries exploring or piloting DRG payment
systems
1. Argentina
2. Bulgaria
3. Chile
4. Colombia
5. Costa Rica
6. Islamic Republic of Iran
7. Latvia
8. Malaysia
9. Montenegro
10. Moldova
11. Serbia
12. South Africa
13. Tunisia
14. Turkey
15. Uruguay
16. Viet Nam
In blue: meanwhile high-income countries Situation as of mid 2013
Mathauer/Wittenbecher (2013)
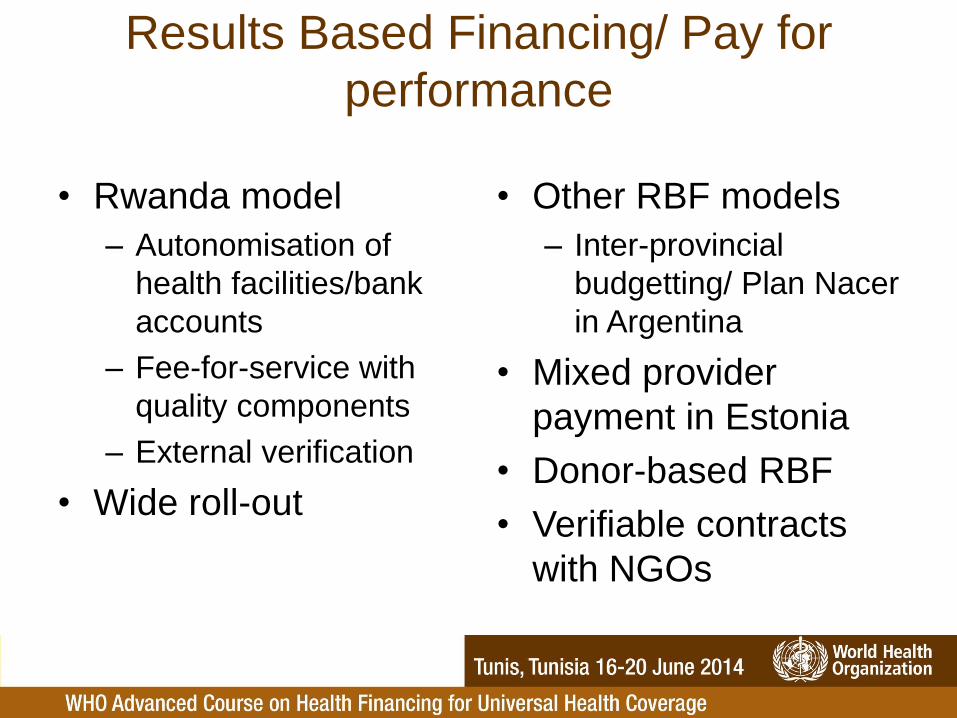
Results Based Financing/ Pay for
performance
• Rwanda model
– Autonomisation of
health facilities/bank
accounts
– Fee-for-service with
quality components
– External verification
• Wide roll-out
• Other RBF models
– Inter-provincial
budgetting/ Plan Nacer
in Argentina
• Mixed provider
payment in Estonia
• Donor-based RBF
• Verifiable contracts
with NGOs