tool chests and cabinets from china. international trade commission publication 4753 january 2018...
TRANSCRIPT
U.S. International Trade CommissionPublication 4753 January 2018
Washington, DC 20436
Tool Chests and Cabinets from China
Investigation No. 701-TA-575 (Final)
U.S. International Trade Commission
COMMISSIONERS
Rhonda K. Schmidtlein, Chairman David S. Johanson, Vice Chairman
Irving A. Williamson Meredith M. Broadbent
Catherine DeFilippo
Staff assigned
Address all communications to Secretary to the Commission
United States International Trade Commission Washington, DC 20436
Director of Operations
Abu Kanu, Investigator David Guberman, Industry Analyst
Amelia Preece, Economist Emily Kim, Accountant
Lita David-Harris, Statistician Nataline Viray-Fung, Attorney
Douglas Corkran, Supervisory Investigator
U.S. International Trade CommissionWashington, DC 20436
www.usitc.gov
Publication 4753 January 2018
Tool Chests and Cabinets from China
Investigation No. 701-TA-575 (Final)

CONTENTS Page
i
Determination ....................................................................................................................... 1 Views of the Commission……………………………………………………………………………………………………….3 Part I: Introduction .............................................................................................................. I-1
Background ................................................................................................................................ I-1
Statutory criteria and organization of the report ..................................................................... I-2
Statutory criteria ................................................................................................................... I-2
Organization of report ........................................................................................................... I-3
Market summary ....................................................................................................................... I-3
Summary data and data sources ............................................................................................... I-4
Previous and related investigations .......................................................................................... I-4
Nature and extent of subsidies and sales at LTFV .................................................................... I-5
Subsidies ................................................................................................................................ I-5
Sales at LTFV .......................................................................................................................... I-6
The subject merchandise .......................................................................................................... I-7
Commerce’s scope ................................................................................................................ I-7
Tariff treatment ................................................................................................................... I-10
The product ............................................................................................................................. I-11
Description and applications ............................................................................................... I-11
Manufacturing processes .................................................................................................... I-17
Domestic like product issues ................................................................................................... I-19
Physical characteristics and uses ......................................................................................... I-20
Manufacturing facilities and production employees .......................................................... I-20
Interchangeability ................................................................................................................ I-21
Customer and producer perceptions .................................................................................. I-21
Channels of distribution ...................................................................................................... I-21
Price ..................................................................................................................................... I-21
Part II: Conditions of competition in the U.S. market........................................................... II-1 U.S. market characteristics....................................................................................................... II-1
U.S. purchasers ......................................................................................................................... II-1
Channels of distribution ........................................................................................................... II-2
Geographic distribution ........................................................................................................... II-2
Supply and demand considerations ......................................................................................... II-3
U.S. supply ............................................................................................................................ II-3
CONTENTS
Page
ii
U.S. demand ......................................................................................................................... II-5
Substitutability issues ............................................................................................................... II-9
Lead times .......................................................................................................................... II-10
Knowledge of country sources ........................................................................................... II-10
Factors affecting purchasing decisions............................................................................... II-10
Branding ............................................................................................................................. II-12
Comparisons of domestic products, subject imports, and nonsubject imports ................ II-14
Comparison of U.S.-produced and imported tool chests and cabinets ............................. II-17
Elasticity estimates ................................................................................................................. II-19
U.S. supply elasticity ........................................................................................................... II-19
U.S. demand elasticity ........................................................................................................ II-19
Substitution elasticity ......................................................................................................... II-20
Part III: U.S. producers’ production, shipments, and employment ...................................... III-1 U.S. producers ......................................................................................................................... III-1
U.S. production, capacity, and capacity utilization ................................................................. III-2
Alternative products ............................................................................................................ III-3
U.S. producers’ U.S. shipments and exports ........................................................................... III-3
U.S. producers’ inventories ..................................................................................................... III-4
U.S. producers’ imports and purchases .................................................................................. III-4
U.S. employment, wages, and productivity ............................................................................ III-4
Part IV: U.S. imports, apparent U.S. consumption, and market shares ............................... IV-1 U.S. importers.......................................................................................................................... IV-1
U.S. imports ............................................................................................................................. IV-2
Negligibility .............................................................................................................................. IV-3
Cumulation considerations ..................................................................................................... IV-3
Fungibility ............................................................................................................................ IV-4
Geographical markets ......................................................................................................... IV-4
Presence in the market ....................................................................................................... IV-4
Apparent U.S. consumption .................................................................................................... IV-5
U.S. market shares .................................................................................................................. IV-5
CONTENTS
Page
iii
Part V: Pricing data ............................................................................................................. V-1
Factors affecting prices ............................................................................................................ V-1
Raw material costs ............................................................................................................... V-1
U.S. inland transportation costs ........................................................................................... V-1
Pricing practices ....................................................................................................................... V-2
Pricing methods .................................................................................................................... V-2
Sales terms and discounts .................................................................................................... V-2
Price leadership .................................................................................................................... V-3
Price data .................................................................................................................................. V-3
Import purchase cost data ................................................................................................... V-5
Differences within products ................................................................................................. V-8
Price trends ........................................................................................................................... V-8
Price comparisons ................................................................................................................ V-9
Lost sales and lost revenue .................................................................................................... V-10
Part VI: Financial experience of U.S. producers .................................................................. VI-1 Background .............................................................................................................................. VI-1
Operations on tool chests and cabinets .................................................................................. VI-1
Net sales .............................................................................................................................. VI-1
Cost of goods sold and gross profit or (loss) ....................................................................... VI-2
SG&A expenses and operating income or (loss) ................................................................. VI-3
Other expenses net income or (loss)................................................................................... VI-3
Variance analysis ................................................................................................................. VI-3
Capital expenditures and research and development expenses ............................................ VI-4
Assets and return on assets .................................................................................................... VI-4
Capital and investment ........................................................................................................... VI-4
CONTENTS
Page
iv
Part VII: Threat considerations and information on nonsubject countries .......................... VII-1
The industry in China .............................................................................................................. VII-2
Changes in operations ........................................................................................................ VII-3
Operations on tool chests and cabinets ............................................................................. VII-4
Alternative products ........................................................................................................... VII-4
Exports ................................................................................................................................ VII-5
The industry in Vietnam ......................................................................................................... VII-6
Changes in operations ........................................................................................................ VII-7
Operations on tool chests and cabinets ............................................................................. VII-7
Alternative products ........................................................................................................... VII-8
Exports ................................................................................................................................ VII-8
The industries in the subject countries .................................................................................. VII-9
U.S. inventories of imported merchandise .......................................................................... VII-11
U.S. importers’ outstanding orders ...................................................................................... VII-12
Antidumping or countervailing duty orders in third-country markets ................................ VII-13
Information on nonsubject countries .................................................................................. VII-13
Appendixes A. Federal Register notices ................................................................................................. A-1
B. List of hearing witnesses (reserved) ............................................................................... B-1
C. Summary data ................................................................................................................ C-1
D. Comments concerning the domestic like product ......................................................... D-1
E. Petitioner’s responses to the Commission’s questions ……………………………………….......... E-1
Note— Information that would reveal confidential operations of individual concerns may not be published and therefore has been deleted. Such deletions are indicated by asterisks. ***
1
UNITED STATES INTERNATIONAL TRADE COMMISSION
Investigation No. 701-TA-575 (Final) Tool Chests and Cabinets from China
DETERMINATION
On the basis of the record1 developed in the subject investigation, the United States International Trade Commission (“Commission”) determines, pursuant to the Tariff Act of 1930 (“the Act”), that an industry in the United States is materially injured by reason of imports of tool chests and cabinets from China, provided for in subheadings 7326.90.35, 7326.90.86, and 9403.20.00 of the Harmonized Tariff Schedule of the United States, that have been found by the Department of Commerce (“Commerce”) to be subsidized by the government of China.
BACKGROUND
The Commission, pursuant to section 705(b) of the Act (19 U.S.C. 1671d(b), instituted this investigation effective April 11, 2017, following receipt of a petition filed with the Commission and Commerce by Waterloo Industries Inc., Sedalia, Missouri. The final phase of the investigation was scheduled by the Commission following notification of a preliminary determination by Commerce that imports of tool chests and cabinets from China were subsidized within the meaning of section 703(b) of the Act (19 U.S.C. 1671b(b)). Notice of the scheduling of the final phase of the Commission’s investigation and of a public hearing to be held in connection therewith was given by posting copies of the notice in the Office of the Secretary, U.S. International Trade Commission, Washington, DC, and by publishing the notice in the Federal Register on September 25, 2017 (82 FR 44657). The hearing was held in Washington, DC, on November 28, 2017, and all persons who requested the opportunity were permitted to appear in person or by counsel.
1 The record is defined in sec. 207.2(f) of the Commission’s Rules of Practice and Procedure (19 CFR 207.2(f)).

3
Views of the Commission
Based on the record in the final phase of this investigation, we determine that an industry in the United States is materially injured by reason of imports of tool chests and cabinets (“tool chests”) from China found by the U.S. Department of Commerce (“Commerce”) to be subsidized by the government of China.
I. Background
On April 11, 2017, Waterloo Industries Inc. (“Waterloo”), a domestic producer of tool chests, filed antidumping and countervailing duty petitions with Commerce and the Commission. Representatives appeared at the hearing accompanied by counsel and Waterloo submitted prehearing and posthearing briefs.
Two respondent groups actively participated in the final phase of these investigations. Representatives and counsel for Zhongshan Geelong Manufacturing Co. Ltd., Geelong Sales (MCO) Ltd., and Geelong Sales Co. International (HK) Ltd. (collectively, “Geelong”), producers and importers of subject merchandise from China, appeared at the hearing and jointly submitted prehearing and posthearing briefs. Representatives and counsel for Sears Holding Corporation (“Sears”), a purchaser of tool chests, appeared at the hearing and submitted prehearing and posthearing briefs. The Home Depot (“Home Depot”) submitted a prehearing brief but did not appear at the hearing or submit a posthearing brief.
Although the petitions for the antidumping and countervailing duty investigations were filed on the same day, the investigation schedules became staggered when Commerce extended the deadline for its preliminary determinations only in the antidumping investigations, thereby necessitating an earlier final determination in the countervailing duty investigation than in the antidumping investigations.1
U.S. Industry data are based on questionnaire responses from two domestic producers that accounted for 100 percent of domestic production of in-scope tool chests. U.S. import data are based on questionnaire responses of 21 U.S. importers of tool chests, which accounted for the majority of tool chest imports from China, Vietnam, and nonsubject sources in 2016. The Commission received usable foreign producer questionnaire responses from 14 producers or exporters in China, accounting for the majority of exports of subject merchandise from China in 2016, and from five producers in Vietnam, accounting for the majority of production of subject merchandise from Vietnam.2
1 See 19 U.S.C. § 1677(7)(g)(iii). Pursuant to the statutory provision on staggered investigations,
the record for the antidumping duty investigations will be the same as that for the countervailing duty investigation except that the final Commerce antidumping determinations and the parties’ final comments concerning those determinations will be added to the record. Commerce is currently scheduled to issue its final antidumping determinations on March 31, 2018. See 82 Fed. Reg. 53456, 53458 (Nov. 26, 2017).
2 CR at I-5-6, PR at I-4.
4
II. Domestic Like Product
A. In General
In determining whether an industry in the United States is materially injured or threatened with material injury by reason of imports of subject merchandise, the Commission first defines the “domestic like product” and the “industry.”3 Section 771(4)(A) of the Tariff Act of 1930, as amended (“the Tariff Act”), defines the relevant domestic industry as the “producers as a whole of a domestic like product, or those producers whose collective output of a domestic like product constitutes a major proportion of the total domestic production of the product.”4 In turn, the Tariff Act defines “domestic like product” as “a product which is like, or in the absence of like, most similar in characteristics and uses with, the article subject to an investigation.”5
The decision regarding the appropriate domestic like product in an investigation is a factual determination, and the Commission has applied the statutory standard of “like” or “most similar in characteristics and uses” on a case-by-case basis.6 No single factor is dispositive, and the Commission may consider other factors it deems relevant based on the facts of a particular investigation.7 The Commission looks for clear dividing lines among possible like products and disregards minor variations.8 Although the Commission must accept Commerce’s determination as to the scope of the imported merchandise that is subsidized or sold at less than fair value,9 the Commission determines what domestic product is like the
3 19 U.S.C. § 1677(4)(A). 4 19 U.S.C. § 1677(4)(A). 5 19 U.S.C. § 1677(10). 6 See, e.g., Cleo Inc. v. United States, 501 F.3d 1291, 1299 (Fed. Cir. 2007); NEC Corp. v.
Department of Commerce, 36 F. Supp. 2d 380, 383 (Ct. Int’l Trade 1998); Nippon Steel Corp. v. United States, 19 CIT 450, 455 (1995); Torrington Co. v. United States, 747 F. Supp. 744, 749 n.3 (Ct. Int’l Trade 1990), aff’d, 938 F.2d 1278 (Fed. Cir. 1991) (“every like product determination ‘must be made on the particular record at issue’ and the ‘unique facts of each case’”). The Commission generally considers a number of factors, including the following: (1) physical characteristics and uses; (2) interchangeability; (3) channels of distribution; (4) customer and producer perceptions of the products; (5) common manufacturing facilities, production processes, and production employees; and, where appropriate, (6) price. See Nippon, 19 CIT at 455 n.4; Timken Co. v. United States, 913 F. Supp. 580, 584 (Ct. Int’l Trade 1996).
7 See, e.g., S. Rep. No. 96-249 at 90-91 (1979). 8 Nippon, 19 CIT at 455; Torrington, 747 F. Supp. at 748-49; see also S. Rep. No. 96-249 at 90-91
(Congress has indicated that the like product standard should not be interpreted in “such a narrow fashion as to permit minor differences in physical characteristics or uses to lead to the conclusion that the product and article are not ‘like’ each other, nor should the definition of ‘like product’ be interpreted in such a fashion as to prevent consideration of an industry adversely affected by the imports under consideration.”).
9 See, e.g., USEC, Inc. v. United States, 34 Fed. Appx. 725, 730 (Fed. Cir. 2002) (“The ITC may not modify the class or kind of imported merchandise examined by Commerce.”); Algoma Steel Corp. v. (Continued...)

5
imported articles Commerce has identified.10 B. Product Description
Commerce defined the scope of the imported merchandise under investigation as follows:
All metal tool chests and cabinets, including top chests, intermediate chests, tool cabinets and side cabinets, storage units, mobile work benches, and work stations and that have the following physical characteristics:
(1) a body made of carbon, alloy, or stainless steel and/or other metals; (2) two or more drawers for storage in each individual unit; (3) a width (side to side) exceeding 15 inches for side cabinets and exceeding
21 inches for all other individual units but not exceeding 60 inches; (4) a depth (front to back) exceeding 10 inches but not exceeding 24 inches;
and (5) prepackaged for retail sale.
For purposes of this scope, the width parameter applies to each individual unit, i.e., each individual top chest, intermediate top chest, tool cabinet, side cabinet, storage unit, mobile work bench, and work station. Prepackaged for retail sale means the units are packaged in a cardboard box or other container suitable for retail display and sale. Subject tool chests and cabinets are covered whether imported in assembled or unassembled form. Subject merchandise includes tool chests and cabinets produced in China or Vietnam but assembled, prepackaged for sale, or subject to other minor processing in a third country prior to importation into the United States. Similarly, it would include tool chests and cabinets produced in China or Vietnam that are later found to be assembled, prepackaged for sale, or subject to other minor processing after importation into the United States. Subject tool chests and cabinets may also have doors and shelves in addition to drawers, may have handles (typically mounted on the sides), and may have a work
(…Continued) United States, 688 F. Supp. 639, 644 (Ct. Int’l Trade 1988), aff’d, 865 F.3d 240 (Fed. Cir.), cert. denied, 492 U.S. 919 (1989).
10 Hosiden Corp. v. Advanced Display Mfrs., 85 F.3d 1561, 1568 (Fed. Cir. 1996) (the Commission may find a single like product corresponding to several different classes or kinds defined by Commerce); Cleo, 501 F.3d at 1298 n.1 (“Commerce’s {scope} finding does not control the Commission’s {like product} determination.”); Torrington, 747 F. Supp. at 748-52 (affirming the Commission’s determination defining six like products in investigations in which Commerce found five classes or kinds).
6
surface on the top. Subject tool chests and cabinets may be uncoated (e.g., stainless steel), painted, powder coated, galvanized, or otherwise coated for corrosion protection or aesthetic appearance.
Subject tool chests and cabinets may be packaged as individual units or in sets. When prepackaged in sets, they typically include a cabinet with one or more chests that stack on top of the cabinet. Tool cabinets act as a base tool storage unit and typically have rollers, casters, or wheels to permit them to be moved more easily when loaded with tools. Work stations and work benches are tool cabinets with a work surface on the top that may be made of rubber, plastic, metal, wood, or other materials.
Top chests are designed to be used with a tool cabinet to form a tool storage unit. The top chests may be mounted on top of the base tool cabinet or onto an intermediate chest. They are often packaged as a set with tool cabinets or intermediate chests, but may also be packaged separately. They may be packaged with mounting hardware (e.g. bolts) and instructions for assembling them onto the base tool cabinet or onto an intermediate tool chest which rests on the base tool cabinet. Smaller top chests typically have handles on the sides, while the larger top chests typically lacks handles. Intermediate tool chests are designed to sit on top of the floor standing tool cabinet and to be used underneath the top tool chest. Although they may be packaged or used separately from the tool cabinet, intermediate chests are designed to be used in conjunction with tool cabinets. Intermediate chests typically do not have handles, but the intermediate and top chests may have the capability of being bolted together. Side cabinets are designed to be bolted or otherwise attached to the side of the base storage cabinet to expand the storage capacity of the base tool cabinet.
Subject tool chests and cabinets also may be packaged with a tool set included. Packaging a subject tool chest and cabinet with a tool set does not remove an otherwise covered subject tool chest and cabinet from the scope. When this occurs the tools are not part of the subject merchandise. All tool chests and cabinets that meet the above definition are included in the scope unless otherwise specifically excluded.
Excluded from the scope of the investigations are tool boxes, chests, and cabinets with bodies made of plastic, carbon fiber, wood, or other non-metallic substances. Also excluded from the scope of the investigations are industrial grade steel tool chests and cabinets. The excluded industrial grade steel tool chests and cabinets are those:

7
(1) having a body that is over 60 inches wide; or (2) having each of the following physical characteristics:
(a) a body made of steel that is 0.047 inches or more in thickness; (b) a body depth (front to back) exceeding 21 inches; and (c) a unit weight that exceeds the maximum unit weight shown below for
each width range:
Weight to Width Ratio Tool Chests Inches Maximum Pounds
> 21 ≤25 90 > 25 ≤28 115 > 28 ≤30 120 > 30 ≤32 130 > 32 ≤34 140 > 34 ≤36 150 > 36 ≤38 160 > 38 ≤40 170 > 40 ≤42 180 > 42 ≤44 190 > 44 ≤46 200 > 46 ≤48 210 > 48 ≤50 220 > 50 ≤52 230 > 52 ≤54 240 > 54 ≤56 250 > 56 ≤58 260 > 58 ≤60 270
Weight to Width Ratio Tool Cabinets Inches Maximum Pounds
> 21 ≤25 155 > 25 ≤28 170 > 28 ≤30 185 > 30 ≤32 200 > 32 ≤34 215 > 34 ≤36 230 > 36 ≤38 245 > 38 ≤40 260 > 40 ≤42 280
8
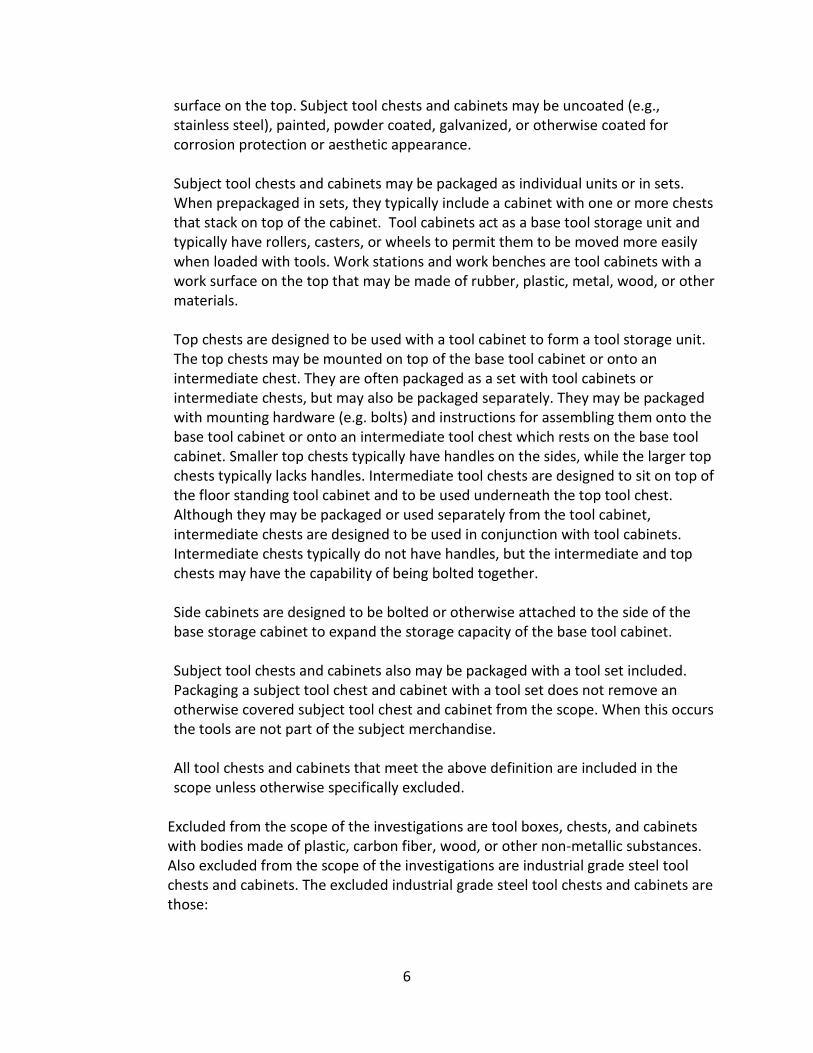
Weight to Width Ratio Tool Cabinets Inches Maximum Pounds
> 42 ≤44 290 > 44 ≤46 300 > 46 ≤48 310 > 48 ≤50 320 > 50 ≤52 330 > 52 ≤54 340 > 54 ≤56 350 > 56 ≤58 360 > 58 ≤60 370
Also excluded from the scope of the investigations are service carts. The excluded service carts have all of the following characteristics:
(1) casters, wheels, or other similar devices which allow the service cart to be rolled from place to place;
(2) a flat top or flat lid on top of the unit that opens; (3) a space or gap between the casters, wheels, or other similar devices, and
the bottom of the enclosed storage space (e.g., drawers) of at least 10 inches; and
(4) a total unit height, including casters, of less than 48 inches.
Also excluded from the scope of the investigations are work benches having each of the following characteristics:
(1) a solid top working surface; (2) no drawers, one drawer, or two drawers in a side-by side configuration; and (3) the unit is supported by legs and the unit has no solid front, side, or back
panels enclosing the body of the unit. Also excluded from the scope of the investigations are metal filing cabinets that are configured to hold hanging file folders and are classified in the Harmonized Tariff Schedule of the United States (HTSUS) at subheading 9403.10.0020.
Merchandise subject to the investigation is classified under HTSUS categories 9403.20.0021, 9403.20.0026, 9403.20.0030, and 7326.90.8688 but may also be classified under HTSUS category 7326.90.3500. While HTSUS subheadings are
9
provided for convenience and Customs purposes, the written description of the scope of this investigation is dispositive.11
Tool chests are designed for the storage of tools and equipment. They are generally
produced from carbon, alloy, or stainless steel. Tool chests can be differentiated by such factors as size, color, number and load rating of drawers, type of drawer slides, type of latching system, thickness of primary construction material, lock type, type and load rating of casters or wheels, and total load rating and storage capacity. Some tool chests have additional features like power strips, USB ports, and Bluetooth connectivity (which enables keyless locking and unlocking).12
C. Arguments of the Parties
In the preliminary phase of these investigations, the Commission defined the domestic like product as consisting of tool chests and cabinets, coextensive with the scope. It observed that no party argued for a different domestic like product in the preliminary phase, but respondents had indicated that in any final phase of these investigations, the Commission should consider including certain out-of-scope tool chests in the domestic like product.13
Petitioner’s Arguments. Petitioner contends that the Commission should continue to define the domestic like product as tool chests and cabinets, coextensive with the scope (which they refer to as “retail” tool chests), and that the Commission should continue to exclude out-of-scope “industrial” tool chests and cabinets. Petitioner argues that retail and industrial tool chests have different physical characteristics (i.e. different gauges of steel and load capacities), are used by different end users, are sold in different distribution channels, are not interchangeable, and are produced by different manufacturers, using different processes and different employees.14 It contends that only two domestic producers manufacture retail tool chests (one of which produces a small volume of industrial tool chests). Petitioner also contends that four domestic producers produce only industrial products and do not produce retail tool chests.15
Petitioner contends that the channels of distribution for retail and industrial tool chests are different because *** shipments of retail tool chests are to retailers whereas industrial tool
11 Certain Tool Chests and Cabinets from the People’s Republic of China: Final Affirmative
Countervailing Duty Determination, 82 Fed. Reg. 56,582 (Nov. 29, 2017) (“Commerce Final CVD Determination”).
12 CR at I-14-17, PR at I-11-12. 13 Tool Chests and Cabinets from China and Vietnam, Inv. Nos. 701-TA-575 and 731-TA-1360-
1361 (Preliminary), USITC Pub. 4697 (June 2017) (“Preliminary Determinations”) at 9-11. 14 Petitioner Prehearing Brief at 8-13; Hearing Tr. at 26-28 (Stremmel). 15 Petitioner Prehearing Brief at 10. Petitioner also notes that respondents improperly rely on
foreign production operations in their arguments. Petitioner argues that the Commission has repeatedly rejected such arguments that attempt to define the domestic like product based on foreign production operations. Tr. at 45 (Cannon); Petitioner Prehearing Brief at 11, 14-15.
10
chests are sold directly to consumers through “truck jobbers” or industrial distributors.16 Petitioner also argues that consumers and producers do not perceive retail and industrial tool chests as the same product.17 It argues that prices for retail tool chests are typically $100 to $800 whereas prices for industrial tool chests are generally $2,000 to $15,000.18
Respondents’ Arguments. Respondents contend that the Commission should include all metal tool chests, including those with dimensions exceeding the specifications in the scope definition, in the definition of the domestic like product.19 According to respondents, all tool chests serve the same purpose, have substantial overlap in features (such as metal gauge, size of wheels or casters, load bearing and weight bearing ratings, and drawer latching mechanisms), are used in the same applications, are interchangeable, and compete in the same market.20 Respondents also argue that the term “industrial” as used by petitioner is misleading, since the tool chest industry does not have standard definitions for “industrial” equipment. Respondents note that “industrial” is instead a marketing term.21 Respondents argue that the inclusion of a retail packaging requirement in the scope creates artificial lines within a continuum of tool chest products and that the Commission should disregard whether or not tool chests are pre-packaged when defining the domestic like product.22
Respondents argue that professionals purchase tool chests through similar channels of distribution as retail consumers: online or from a retailer.23 Respondents observe that marketing material from Sears lists qualities such as material type, steel gauge, capacity, and other characteristics, but not the specific characteristics (i.e. measurements or number of drawers) used by petitioner in its scope definition.24 They argue that customers and producers generally perceive all tool chests as competing with each other, and that all tool chests are perceived as having the same purpose.25
Respondents contend that questionnaire responses also indicate that in-scope and out-of- scope tool chests are produced in similar facilities using similar equipment and employees.26
16 Petitioner Prehearing Brief at 14. 17 Petitioner Prehearing Brief at 14-15. Petitioner observes that many purchasers and importers
perceived differences between retail and industrial tool chests based on ***. It argues that retail tool chests cannot withstand an industrial work environment and that a retail customer would not pay the significantly higher cost for an industrial grade tool chest.
18 Petitioner Prehearing Brief at 16. 19 Geelong Prehearing Brief at 8; Home Depot Prehearing Brief at 12-13. 20 Geelong Prehearing Brief at 10-15; Home Depot Prehearing Brief at 13-17; Tr. at 150 (Enger).
Respondents argue that 12 of 15 responding importers reported that retail and industrial tool chests were mostly or fully comparable with each other in terms of physical characteristics and uses, and that 11 of 15 responding importers stated such tool chests were interchangeable. Sears Prehearing Brief at 13.
21 Geelong Prehearing Brief at 10-11. 22 Geelong Prehearing Brief at 8. 23 Geelong Prehearing Brief at 16; Home Depot Prehearing Brief at 18. 24 Geelong Prehearing Brief at 13-14. 25 Geelong Prehearing Brief at 16-17. 26 Geelong Prehearing Brief at 18-19; Home Depot Prehearing Brief at 17.
11
They argue that there are no distinct manufacturers for particular sizes of tool chests, and observe that Waterloo testified that it can make tool chests of any size.27 Respondents contend that tool chests are priced along a continuum that recognizes a premium for features such as power strips.28
D. Domestic Like Product Analysis
Based on the record, we define a single domestic like product consisting of tool chests, coextensive with the scope.
Physical Characteristics and Uses. Both in-scope tool chests and those tool chests outside the scope have a common end-use: the storage of tools.29 In-scope tool chests are prepackaged for retail sale and typically are purchased by consumers for residential use.30 In contrast, out-of-scope industrial tool chests that respondents seek to include in the domestic like product are generally intended for professional use and are consequently larger in size and are designed to withstand usage in a commercial setting.31 They are also higher quality insofar as they are produced using heavier gauge steel and of better materials.32
Market participants provided mixed responses when asked to compare in-scope with out-of-scope tool chests regarding characteristics and uses. All responding U.S. producers indicated that in-scope retail tool chests were only somewhat or never comparable to out-of-scope industrial tool chests.33 Three of 15 responding importers reported that they were fully comparable, six reported they were mostly comparable, and six reported they were sometimes or never comparable.34 Three of 14 responding purchasers reported that they were fully comparable, five reported they were mostly comparable, and *** reported they were sometimes or never comparable.35
The narrative responses of the questionnaire respondents provide some insight as to the perceived similarities and differences between in- and out-of-scope products. The similarity between the products most commonly discussed is that all tool chests store tools.36 The difference between the products most commonly discussed – including by a majority of responding producers and purchasers – is that there are quality differences between the in-scope and out-of-scope products, with numerous market participants further stating that these
27 Geelong Prehearing Brief at 20. 28 Geelong Prehearing Brief at 21, 46-47. 29 See CR/PR at Table D-1 (*** comments on physical characteristics and uses). 30 E.g., Tr. 21 (Nictakis). 31 Tr. at 27 (Stremmel) (“Although you might hear of a retail tool chest marketed as heavy duty
or professional, that does not mean the tool chest is an industrial product. That is just marketing. The difference between the retail product and the industrial product in physical characteristics is night and day”).
32 See, e.g., CR/PR at Table D-1; Petitioner Prehearing Brief at 8-9. 33 CR/PR at Table I-3. 34 CR/PR at Table I-3. 35 CR/PR at Table I-3. 36 See CR/PR at Table D-1.
12
distinctions result in in-scope and out-of-scope tool chests being intended for different types of end users.37 Other differences reported by questionnaire respondents, although less frequently than quality differences, concern differences in size and steel gauge.38
We recognize that Petitioner’s use of the term “industrial” to refer to out-of-scope tool chests may not indicate an established industry standard for a separate category of tool chests, as there appear to be out-of-scope tool chests that are sold by retailers to home users.39 For example, Home Depot states that its best-selling retail tool chest is a 66.3 inch wide mobile workbench which is out-of-scope because it exceeds the width requirements set forth in the scope.40 Similarly, some respondents observed that certain in-scope tool chests could be used by professionals.41 On the whole, however, questionnaire respondents acknowledged that industrial grade tool chests tend to be larger, heavier duty, constructed differently, and intended for use in professional settings.42
We find the record indicates that while some lower-end, out-of-scope tool chests can share some characteristics with higher-end, in-scope tool chests, out-of-scope tool chests generally have specifications and characteristics that are intended for a professional setting.
Manufacturing Facilities, Production Processes and Employees. In-scope and out-of-scope tool chests are produced at different facilities and/or using different equipment and employees.43 Waterloo and Metal Box Industries (“MBI”) are the only two domestic producers of the in-scope merchandise. All other domestic producers that produce out-of-scope merchandise do not produce any in-scope merchandise. Waterloo produces a small volume of out-of-scope tool chests and reports that it produces in-scope and out-of-scope tool chests on different production lines, using different production methods and different employees. While all tool chests generally are produced from cold-rolled steel, Waterloo’s in-scope tool chests are
37 Such differences in quality were cited by four of five producers and seven of 13 purchasers, but only four of 17 importers. See CR/PR at Table D-1. Even within the group of purchasers, responses on this point were varied. See id. (while purchaser ***).
38 See CR/PR at Table D-1. 39 See, e.g., CR/PR at Table D-4 (***) and Table D-1 (response of importer ***). 40 Home Depot Prehearing Brief at 14. 41 Tr. at 164-165 (LeBell). 42 CR/PR at Table D-1. At least 12 questionnaire respondents assert that industrial grade tool
chests are heavier duty and designed for professional settings whereas only three respondents assert that industrial tool chests were identical to in-scope retail tool chests.
43 While Geelong asserts that its in- and out-of-scope tool chests are manufactured on similar production lines, Geelong Prehearing Brief at 20, the Commission’s domestic like product analysis examines similarities and distinctions between domestically produced items. See, Aluminum Foil from China, Inv. Nos. 701-TA-570 and 731-TA-1346 (Preliminary), USITC Pub. 4684 (May 2017) at 8; Large Residential Washers from China, Inv. No. 731-TA-1306 (Preliminary), USITC Pub. 4591 (Feb. 2016) at 10.
Questionnaire respondents provided mixed responses concerning manufacturing and production of in- and out-of-scope tool chests. *** producers stated manufacturing/production were fully or mostly comparable for in- and out-of-scope tool chests, whereas *** stated they were never comparable. *** importers stated they were fully or mostly comparable, and *** reported they were sometimes or never comparable. *** purchasers indicated they were fully or mostly comparable, and *** reported they were sometimes or never comparable. CR/PR at Table I-3.

13
mass produced on automated production lines whereas its out-of-scope tool chests are custom made and designed and produced using different welding and painting equipment. Similarly, different employees are used for the production of in-scope and out-of-scope tool chests.44
Channels of Distribution. In-scope tool chests are generally sold to retailers, whereas out-of-scope tool chests are generally sold directly to professional consumers or industrial distributors and may be ***.45 With regard to custom tool chests, design services are often offered to the customer.46 Four of five responding U.S. producers indicated that in-scope and out-of-scope tool chests were never comparable in terms of channels of distribution, and one indicated they were fully comparable. Seven of 15 responding importers stated they were fully or mostly comparable, whereas eight stated they were sometimes or never comparable. Five of 12 responding purchasers indicated they were fully or mostly comparable, while seven stated they were sometimes or never comparable.47
Interchangeability. All responding domestic producers and the majority of responding importers reported that in-scope and out-of-scope merchandise were sometimes or never interchangeable. Purchasers were evenly divided, with half reporting that in-scope and out-of-scope tool chests were fully or mostly interchangeable, and half reporting that they were sometimes or never interchangeable.48 Some industry participants indicated that while some consumers may elect to purchase expensive, high end industrial grade tool chests for home use,49 in-scope merchandise generally does not meet the demands of a professional setting.50
Producer and Customer Perceptions. All responding domestic producers and the majority of responding importers reported that in-scope and out-of-scope tool chests were sometimes or never comparable in terms of customer and producer perceptions. Purchasers were evenly divided with half reporting they were fully or mostly comparable, and half reporting that they were sometimes or never comparable in terms of customer and producer perceptions.51 Four purchasers commented that customers generally viewed the products as similar products. However, more (seven) purchasers discussed differences in size and quality.52 Additionally, ***, an importer described by another market participant as ***,53 indicated that ***.54
Price. All responding producers and the majority of responding importers and purchasers indicated that the price of in-scope and out-of-scope merchandise is somewhat or never comparable.55 The record indicates that while there may be some overlap in prices,
44 CR at I-25, PR at I-19; Waterloo Prehearing Brief at 10-13. 45 Waterloo Prehearing Brief at 14; CR/PR at Table D-3. 46 Waterloo Prehearing Brief at 14; CR/PR at Table D-3. 47 CR/PR at Table I-2. 48 CR/PR at Table I-2. 49 See, e.g., CR/PR at Table D-1 (***) (*** comment). 50 See, e.g., CR/PR at Table D-2 (***). 51 CR/PR at Table I-3. 52 CR/PR at Table D-4. 53 CR/PR at Table D-1 (***). 54 CR/PR at Table D-4. 55 CR/PR at Table I-3.
14
particularly at the upper end of the in-scope price range, out-of-scope merchandise is generally priced higher than in-scope merchandise.56 While this may seem to suggest a continuum of prices,57 the record indicates that prices for out-of-scope merchandise are generally significantly higher than those for in-scope merchandise.58 Questionnaire respondents generally attribute the difference in price to differences in size and quality between in- and out-of-scope merchandise.59
Conclusion. We find there is a clear dividing line between domestically produced in-scope tool chests and larger out-of-scope tool chests. Larger out-of-scope tool chests are not only made to different dimensional specifications, but are also made of higher quality materials, and are intended principally for industrial applications. While all tool chests have the same end use (tool storage), the majority of in-scope tool chests have different characteristics and are intended for different end users (i.e., homeowners) than the majority of out-of-scope tool chests (i.e., professional users). Domestic manufacturers produce in- and out-of-scope tool chests using different equipment, production processes, and employees, and in-scope tool chests generally are not sold to industrial distributors or directly to professional consumers.
In terms of interchangeability and producer and customer perceptions, the record is mixed, although the majority of responding producers and importers indicated that in- and out-of-scope merchandise generally had limited or no comparability. While a few home users will sometimes purchase high-end, out-of-scope tool chests for their home workshops, the record indicates that in-scope tool chests are not often used in, and are generally not suitable for, the professional settings in which out-of-scope tool chests are generally used. Out-of-scope tool chests tend to be priced at substantially higher price points than in-scope tool chests. In light of the foregoing, we define a single domestic like product consisting of tool chests, coextensive with the scope.
III. Domestic Industry
The domestic industry is defined as the domestic “producers as a whole of a domestic like product, or those producers whose collective output of a domestic like product constitutes a major proportion of the total domestic production of the product.”60 In defining the domestic industry, the Commission’s general practice has been to include in the industry producers of all domestic production of the like product, whether toll-produced, captively consumed, or sold in the domestic merchant market.
In the final phase of these investigations, petitioner contends that the Commission should define the domestic industry as consisting of all domestic producers of in-scope tool
56 Waterloo Prehearing Brief at 16; CR/PR at Table D-6. 57 One importer stated that ***. CR/PR at Table D-6 (***). Another importer mentions ***.
CR/PR at Table D-6 (***). 58 For example, petitioner describes a six-drawer domestically produced out-of-scope unit that is
priced at $2,285 and compares it to a five-drawer in-scope unit that retails for $299. Waterloo Prehearing Brief at 16. One purchaser described ***. CR/PR at Table D-1 (***).
59 CR/PR at Table D-6. 60 19 U.S.C. § 1677(4)(A).
15
chests, specifically Waterloo and MBI.61 No respondent party makes any arguments pertaining to domestic industry.
A. Related Parties
We must determine whether any producer of the domestic like product should be excluded from the domestic industry pursuant to section 771(4)(B) of the Tariff Act. This provision allows the Commission, if appropriate circumstances exist, to exclude from the domestic industry producers that are related to an exporter or importer of subject merchandise or which are themselves importers.62 Exclusion of such a producer is within the Commission’s discretion based upon the facts presented in each investigation.63
In the preliminary phase of these investigations, the Commission considered whether to exclude *** from the domestic industry as related parties and concluded that appropriate circumstances did not exist to exclude any domestic producer from the domestic industry. The Commission thus defined the domestic industry as consisting of all domestic producers of tool chests.64
In the final phase of these investigations, petitioner Waterloo is a related party because it is owned by an importer of subject merchandise.65 Waterloo was purchased by SBD in July 2017, two months before the end of the period of investigation (“POI”).66 While Waterloo did not import subject tool chests, SBD imported subject merchandise from *** during the POI.67 Waterloo is the petitioner in these investigations and accounted for *** percent of domestic production of tool chests in 2016.68 Additionally, the record shows that SBD had a *** volume
61 Waterloo Prehearing Brief at 17-18. 62 See Torrington Co. v. United States, 790 F. Supp. 1161, 1168 (Ct. Int’l Trade 1992), aff’d
without opinion, 991 F.2d 809 (Fed. Cir. 1993); Sandvik AB v. United States, 721 F. Supp. 1322, 1331-32 (Ct. Int’l Trade 1989), aff’d mem., 904 F.2d 46 (Fed. Cir. 1990); Empire Plow Co. v. United States, 675 F. Supp. 1348, 1352 (Ct. Int’l Trade 1987).
63 The primary factors the Commission has examined in deciding whether appropriate circumstances exist to exclude a related party include the following:
(1) the percentage of domestic production attributable to the importing producer; (2) the reason the U.S. producer has decided to import the product subject to investigation
(whether the firm benefits from the LTFV sales or subsidies or whether the firm must import in order to enable it to continue production and compete in the U.S. market);
(3) whether inclusion or exclusion of the related party will skew the data for the rest of the industry;
(4) the ratio of import shipments to U.S. production for the imported product; and (5) whether the primary interest of the importing producer lies in domestic production or
importation. Changzhou Trina Solar Energy Co. v. USITC, 100 F. Supp.3d 1314, 1326-31 (Ct. Int’l. Trade 2015); see also Torrington Co. v. United States, 790 F. Supp. at 1168.
64 Preliminary Determinations, USITC Pub. 4697 at 11-13. 65 19 U.S.C. § 1677(4)(B)(ii)(II). 66 The POI in this investigation is from January 1, 2014 to September 30, 2017. 67 CR/PR at Tables III-2 and IV-1. 68 CR/PR at Table III-1.
16
of subject imports compared to Waterloo’s domestic production.69 The timing of the change in ownership and SBD’s *** volume of imports compared to Waterloo’s domestic production indicates that Waterloo/SBD’s principal interest lies in domestic production. Additionally, because Waterloo accounts for *** domestic production of in-scope tool chests, its exclusion would skew data for the domestic industry.70 No party has argued that Waterloo be excluded from the domestic industry. Accordingly, we find that appropriate circumstances do not exist to exclude Waterloo from the domestic industry.
In light of our domestic like product definition, we define the domestic industry to include all domestic producers of in-scope tool chests.
IV. Cumulation71
For purposes of evaluating the volume and effects for a determination of material injury by reason of subject imports, section 771(7)(G)(i) of the Tariff Act requires the Commission to cumulate subject imports from all countries as to which petitions were filed and/or investigations self-initiated by Commerce on the same day, if such imports compete with each other and with the domestic like product in the U.S. market. In assessing whether subject imports compete with each other and with the domestic like product, the Commission generally has considered four factors:
(1) the degree of fungibility between subject imports from different countries and between subject imports and the domestic like product, including consideration of specific customer requirements and other quality related questions;
(2) the presence of sales or offers to sell in the same geographic markets of subject imports from different countries and the domestic like product;
69 SBD imported *** units of subject merchandise in 2014, *** units in 2015, and *** units in
2016; it imported *** units from January to September 2016 (“interim” 2016) and *** units in interim 2017. Waterloo produced *** units in 2014, *** units in 2015, and *** units in 2016; it produced *** units in interim 2016 and *** units in interim 2017. CR/PR at Table III-8.
70 Waterloo had a *** operating income ratio than the other domestic producer throughout the POI. CR/PR at Table VI-3.
71 Pursuant to Section 771(24) of the Tariff Act, imports from a subject country of merchandise corresponding to a domestic like product that account for less than 3 percent of all such merchandise imported into the United States during the most recent 12 months for which data are available preceding the filing of the petition shall be deemed negligible. 19 U.S.C. §§ 1671b(a), 1673b(a), 1677(24)(A)(i).
Negligibility is not an issue in these investigations. Subject imports from China accounted for *** percent as a share of total imports of tool chests and subject imports from Vietnam accounted for *** percent as a share of total imports by quantity for April 2016-March 2017, the 12-month period preceding filing of the petitions. CR/PR at Table IV-3.
17
(3) the existence of common or similar channels of distribution for subject imports from different countries and the domestic like product; and
(4) whether the subject imports are simultaneously present in the market.72
While no single factor is necessarily determinative, and the list of factors is not exclusive, these factors are intended to provide the Commission with a framework for determining whether the subject imports compete with each other and with the domestic like product.73 Only a “reasonable overlap” of competition is required.74
Petitioner argues that the Commission should cumulate subject imports from China with subject imports from Vietnam, on the basis that tool chests from all sources are interchangeable, directly compete with each other, are sold through the same channels of distribution (to retailers), and were sold in each year of the POI.75 Respondents make no arguments pertaining to cumulation.
The statutory threshold for cumulation is satisfied in these investigations because Petitioners filed the antidumping and countervailing duty petitions with respect to both subject countries on the same day, April 11, 2017.76
Fungibility. All responding producers reported that subject tool chests from China and Vietnam were always interchangeable with each other and the domestic like product. The majority of responding importers and purchasers reported that imports from each subject source were always or frequently interchangeable with each other and with the domestic product, with one exception.77 Majorities or pluralities of responding purchasers reported that subject imports from China and Vietnam were comparable to each other with respect to all product characteristics, that subject imports from China were comparable to the domestic product in 14 of 18 characteristics, and that subject imports from Vietnam were comparable to the domestic like product in 11 of 18 characteristics.78 Appreciable percentages of the domestic product, subject imports from China, and subject imports from Vietnam were
72 See Certain Cast-Iron Pipe Fittings from Brazil, the Republic of Korea, and Taiwan, Inv. Nos. 731-TA-278-280 (Final), USITC Pub. 1845 (May 1986), aff’d, Fundicao Tupy, S.A. v. United States, 678 F. Supp. 898 (Ct. Int’l Trade), aff’d, 859 F.2d 915 (Fed. Cir. 1988).
73 See, e.g., Wieland Werke, AG v. United States, 718 F. Supp. 50 (Ct. Int’l Trade 1989). 74 The Statement of Administrative Action (SAA) to the Uruguay Round Agreements Act (URAA),
expressly states that “the new section will not affect current Commission practice under which the statutory requirement is satisfied if there is a reasonable overlap of competition.” H.R. Rep. No. 103-316, Vol. I at 848 (1994) (citing Fundicao Tupy, S.A. v. United States, 678 F. Supp. at 902; see Goss Graphic Sys., Inc. v. United States, 33 F. Supp. 2d 1082, 1087 (Ct. Int’l Trade 1998) (“cumulation does not require two products to be highly fungible”); Wieland Werke, AG, 718 F. Supp. at 52 (“Completely overlapping markets are not required.”).
75 Petitioner Prehearing Brief at 19-25. 76 None of the statutory exceptions to cumulation apply. 77 CR/PR at Table II-11. A plurality of purchasers stated that the domestic like product and
subject imports from Vietnam were always or frequently interchangeable, with the remainder reporting that they were sometimes interchangeable. Id.
78 CR/PR at Table II-10.
18
prepackaged sets, top chests, or tool cabinets.79 Channels of Distribution. *** of subject imports from Vietnam were *** during the POI.
Over *** percent of subject imports from China were *** during the POI. Domestic producers reported selling *** percent of their U.S. tool chest shipments to retailers.80
Geographic Overlap. Subject imports from China and Vietnam were sold in all geographic regions of the United States throughout the POI, as were domestically produced tool chests.81
Simultaneous Presence in Market. Imports of tool chests from China and Vietnam, as well as the domestic like product, were present in the U.S. market in every month of the POI.82
Conclusion. The record demonstrates that imports from each subject country are fungible with the domestic like product and each other, are sold in similar channels of distribution, were simultaneously present in the U.S. market, and were sold throughout all geographic regions during the POI. In light of the foregoing, we find that there is a reasonable overlap of competition between the domestic like product and imports from each subject country and among imports from each subject country. We therefore cumulate subject imports from China and Vietnam for purposes of our material injury analysis.
V. Material Injury by Reason of Subject Imports
Based on the record in the final phase of this investigation, we find that an industry in the United States is materially injured by reason of imports of tool chests from China that Commerce has found are subsidized by the government of China.
A. Legal Standards
In the final phase of antidumping and countervailing duty investigations, the Commission determines whether an industry in the United States is materially injured or threatened with material injury by reason of the imports under investigation.83 In making this determination, the Commission must consider the volume of subject imports, their effect on prices for the domestic like product, and their impact on domestic producers of the domestic like product, but only in the context of U.S. production operations.84 The statute defines
79 CR/PR at Table IV-4. 80 CR/PR at Table II-1. 81 CR/PR at Table II-2. 82 See, e.g. CR/PR at Tables III-6 and IV-7. 83 19 U.S.C. §§ 1671d(b), 1673d(b). The Trade Preferences Extension Act of 2015, Pub. L. 114-27,
amended the provisions of the Tariff Act pertaining to Commission determinations of material injury and threat of material injury by reason of subject imports in certain respects. We have applied these amendments here.
84 19 U.S.C. § 1677(7)(B). The Commission “may consider such other economic factors as are relevant to the determination” but shall “identify each {such} factor ... and explain in full its relevance to the determination.” 19 U.S.C. § 1677(7)(B).
19
“material injury” as “harm which is not inconsequential, immaterial, or unimportant.”85 In assessing whether the domestic industry is materially injured by reason of subject imports, we consider all relevant economic factors that bear on the state of the industry in the United States.86 No single factor is dispositive, and all relevant factors are considered “within the context of the business cycle and conditions of competition that are distinctive to the affected industry.”87
Although the statute requires the Commission to determine whether the domestic industry is “materially injured or threatened with material injury by reason of” unfairly traded imports,88 it does not define the phrase “by reason of,” indicating that this aspect of the injury analysis is left to the Commission’s reasonable exercise of its discretion.89 In identifying a causal link, if any, between subject imports and material injury to the domestic industry, the Commission examines the facts of record that relate to the significance of the volume and price effects of the subject imports and any impact of those imports on the condition of the domestic industry. This evaluation under the “by reason of” standard must ensure that subject imports are more than a minimal or tangential cause of injury and that there is a sufficient causal, not merely a temporal, nexus between subject imports and material injury.90
In many investigations, there are other economic factors at work, some or all of which may also be having adverse effects on the domestic industry. Such economic factors might include nonsubject imports; changes in technology, demand, or consumer tastes; competition among domestic producers; or management decisions by domestic producers. The legislative history explains that the Commission must examine factors other than subject imports to ensure that it is not attributing injury from other factors to the subject imports, thereby inflating an otherwise tangential cause of injury into one that satisfies the statutory material injury threshold.91 In performing its examination, however, the Commission need not isolate
85 19 U.S.C. § 1677(7)(A). 86 19 U.S.C. § 1677(7)(C)(iii). 87 19 U.S.C. § 1677(7)(C)(iii). 88 19 U.S.C. §§ 1671d(a), 1673d(a). 89 Angus Chemical Co. v. United States, 140 F.3d 1478, 1484-85 (Fed. Cir. 1998) (“{T}he statute
does not ‘compel the commissioners’ to employ {a particular methodology}.”), aff’g, 944 F. Supp. 943, 951 (Ct. Int’l Trade 1996).
90 The Federal Circuit, in addressing the causation standard of the statute, observed that “{a}s long as its effects are not merely incidental, tangential, or trivial, the foreign product sold at less than fair value meets the causation requirement.” Nippon Steel Corp. v. USITC, 345 F.3d 1379, 1384 (Fed. Cir. 2003). This was further ratified in Mittal Steel Point Lisas Ltd. v. United States, 542 F.3d 867, 873 (Fed. Cir. 2008), where the Federal Circuit, quoting Gerald Metals, Inc. v. United States, 132 F.3d 716, 722 (Fed. Cir. 1997), stated that “this court requires evidence in the record ‘to show that the harm occurred “by reason of” the LTFV imports, not by reason of a minimal or tangential contribution to material harm caused by LTFV goods.’” See also Nippon Steel Corp. v. United States, 458 F.3d 1345, 1357 (Fed. Cir. 2006); Taiwan Semiconductor Industry Ass’n v. USITC, 266 F.3d 1339, 1345 (Fed. Cir. 2001).
91 SAA at 851-52 (“{T}he Commission must examine other factors to ensure that it is not attributing injury from other sources to the subject imports.”); S. Rep. 96-249 at 75 (1979) (the Commission “will consider information which indicates that harm is caused by factors other than less-(Continued...)

20
the injury caused by other factors from injury caused by unfairly traded imports.92 Nor does the “by reason of” standard require that unfairly traded imports be the “principal” cause of injury or contemplate that injury from unfairly traded imports be weighed against other factors, such as nonsubject imports, which may be contributing to overall injury to an industry.93 It is clear that the existence of injury caused by other factors does not compel a negative determination.94
Assessment of whether material injury to the domestic industry is “by reason of” subject imports “does not require the Commission to address the causation issue in any particular way” as long as “the injury to the domestic industry can reasonably be attributed to the subject imports” and the Commission “ensure{s} that it is not attributing injury from other sources to the subject imports.”95 Indeed, the Federal Circuit has examined and affirmed various
(…Continued) than-fair-value imports.”); H.R. Rep. 96-317 at 47 (1979) (“in examining the overall injury being experienced by a domestic industry, the ITC will take into account evidence presented to it which demonstrates that the harm attributed by the petitioner to the subsidized or dumped imports is attributable to such other factors;” those factors include “the volume and prices of nonsubsidized imports or imports sold at fair value, contraction in demand or changes in patterns of consumption, trade restrictive practices of and competition between the foreign and domestic producers, developments in technology and the export performance and productivity of the domestic industry”); accord Mittal Steel, 542 F.3d at 877.
92 SAA at 851-52 (“{T}he Commission need not isolate the injury caused by other factors from injury caused by unfair imports.”); Taiwan Semiconductor Industry Ass’n, 266 F.3d at 1345 (“{T}he Commission need not isolate the injury caused by other factors from injury caused by unfair imports ... . Rather, the Commission must examine other factors to ensure that it is not attributing injury from other sources to the subject imports.” (emphasis in original)); Asociacion de Productores de Salmon y Trucha de Chile AG v. United States, 180 F. Supp. 2d 1360, 1375 (Ct. Int’l Trade 2002) (“{t}he Commission is not required to isolate the effects of subject imports from other factors contributing to injury” or make “bright-line distinctions” between the effects of subject imports and other causes.); see also Softwood Lumber from Canada, Inv. Nos. 701-TA-414 and 731-TA-928 (Remand), USITC Pub. 3658 at 100-01 (Dec. 2003) (Commission recognized that “{i}f an alleged other factor is found not to have or threaten to have injurious effects to the domestic industry, i.e., it is not an ‘other causal factor,’ then there is nothing to further examine regarding attribution to injury”), citing Gerald Metals, 132 F.3d at 722 (the statute “does not suggest that an importer of LTFV goods can escape countervailing duties by finding some tangential or minor cause unrelated to the LTFV goods that contributed to the harmful effects on domestic market prices.”).
93 S. Rep. 96-249 at 74-75; H.R. Rep. 96-317 at 47. 94 See Nippon Steel Corp., 345 F.3d at 1381 (“an affirmative material-injury determination under
the statute requires no more than a substantial-factor showing. That is, the ‘dumping’ need not be the sole or principal cause of injury.”).
95 Mittal Steel, 542 F.3d at 877-78; see also id. at 873 (“While the Commission may not enter an affirmative determination unless it finds that a domestic industry is materially injured ‘by reason of’ subject imports, the Commission is not required to follow a single methodology for making that determination ... {and has} broad discretion with respect to its choice of methodology.”) citing United States Steel Group v. United States, 96 F.3d 1352, 1362 (Fed. Cir. 1996) and S. Rep. 96-249 at 75. In its (Continued...)
21
Commission methodologies and has disavowed “rigid adherence to a specific formula.”96 The Federal Circuit’s decisions in Gerald Metals, Bratsk, and Mittal Steel all involved
cases where the relevant “other factor” was the presence in the market of significant volumes of price-competitive nonsubject imports. The Commission interpreted the Federal Circuit’s guidance in Bratsk as requiring it to apply a particular additional methodology following its finding of material injury in cases involving commodity products and a significant market presence of price-competitive nonsubject imports.97 The additional “replacement/benefit” test looked at whether nonsubject imports might have replaced subject imports without any benefit to the U.S. industry. The Commission applied that specific additional test in subsequent cases, including the Carbon and Certain Alloy Steel Wire Rod from Trinidad and Tobago determination that underlies the Mittal Steel litigation.
Mittal Steel clarifies that the Commission’s interpretation of Bratsk was too rigid and makes clear that the Federal Circuit does not require the Commission to apply an additional test nor any one specific methodology; instead, the court requires the Commission to have “evidence in the record” to “show that the harm occurred ‘by reason of’ the LTFV imports,” and requires that the Commission not attribute injury from nonsubject imports or other factors to subject imports.98 Accordingly, we do not consider ourselves required to apply the replacement/benefit test that was included in Commission opinions subsequent to Bratsk.
The progression of Gerald Metals, Bratsk, and Mittal Steel clarifies that, in cases involving commodity products where price-competitive nonsubject imports are a significant factor in the U.S. market, the Court will require the Commission to give full consideration, with adequate explanation, to non-attribution issues when it performs its causation analysis.99
The question of whether the material injury threshold for subject imports is satisfied notwithstanding any injury from other factors is factual, subject to review under the substantial
(…Continued) decision in Swiff-Train v. United States, 793 F.3d 1355 (Fed. Cir. 2015), the Federal Circuit affirmed the Commission’s causation analysis as comporting with the Court’s guidance in Mittal.
96 Nucor Corp. v. United States, 414 F.3d 1331, 1336, 1341 (Fed. Cir. 2005); see also Mittal Steel, 542 F.3d at 879 (“Bratsk did not read into the antidumping statute a Procrustean formula for determining whether a domestic injury was ‘by reason’ of subject imports.”).
97 Mittal Steel, 542 F.3d at 875-79. 98 Mittal Steel, 542 F.3d at 873 (quoting from Gerald Metals, 132 F.3d at 722), 875-79 & n.2
(recognizing the Commission’s alternative interpretation of Bratsk as a reminder to conduct a non-attribution analysis).
99 To that end, after the Federal Circuit issued its decision in Bratsk, the Commission began to present published information or send out information requests in the final phase of investigations to producers in nonsubject countries that accounted for substantial shares of U.S. imports of subject merchandise (if, in fact, there were large nonsubject import suppliers). In order to provide a more complete record for the Commission’s causation analysis, these requests typically seek information on capacity, production, and shipments of the product under investigation in the major source countries that export to the United States. The Commission plans to continue utilizing published or requested information in the final phase of investigations in which there are substantial levels of nonsubject imports.
22
evidence standard.100 Congress has delegated this factual finding to the Commission because of the agency’s institutional expertise in resolving injury issues.101
B. Conditions of Competition and the Business Cycle
The following conditions of competition inform our analysis of whether there is material injury by reason of subject imports.
1. Demand Considerations
Demand for tool chests tends to track the overall U.S. economy and, to some extent, housing starts.102 The record also indicates that there is some seasonality in demand for tool chests, with higher demand during certain holidays.103 Market participants reported mixed perceptions of demand, with the majority reporting that demand increased or was unchanged during the POI, and a smaller number reporting that demand declined or fluctuated.104 Demand as measured by apparent U.S. consumption declined by *** percent from 2014 to 2016. Apparent U.S. consumption was *** units in 2014 and in 2015 and *** units in 2016; it was *** units in interim 2016 and *** units in interim 2017.105
2. Supply Considerations
The domestic industry supplied a decreasing share of the U.S. tool chest market during the POI. Its share of the U.S. market declined from *** percent in 2014 to *** percent in 2015 and *** percent in 2016; it was *** percent in interim 2016 and *** percent in interim 2017.106 Waterloo is the largest producer of the domestic like product, accounting for the vast majority of domestic supply.107 In July 2017, SBD purchased Waterloo.108
100 We provide a full analysis of other factors alleged to have caused any material injury
experienced by the domestic industry in our respective discussions of volume, price effects, and impact. 101 Mittal Steel, 542 F.3d at 873; Nippon Steel Corp., 458 F.3d at 1350, citing U.S. Steel Group, 96
F.3d at 1357; S. Rep. 96-249 at 75 (“The determination of the ITC with respect to causation is ... complex and difficult, and is a matter for the judgment of the ITC.”).
102 Petitioner Prehearing Brief at 25. 103 CR at II-10, PR at II-6; Tr. at 224 (LeBell); Petitioner Posthearing Brief at Exhibit 9. 104 All domestic producers and the majority of responding importers and purchasers reported
that demand had increased or was stable during the POI. CR/PR at Table II-4. Tr. at 80 (Cannon) and 186-187 (Moyer and Enger).
105 CR/PR at Table IV-8. 106 CR/PR at Table IV-8. 107 Waterloo closed three plants prior to the POI. ***. Petitioner Prehearing Brief at Exhibit 2;
Tr. at 47 (Cannon). 108 CR at III-2 n.2, PR at III-1 n.2. Respondents contend that the record does not contain
sufficient information concerning the circumstances surrounding Waterloo’s acquisition by SBD. Geelong Posthearing Brief at 2-3. However, respondents raise no challenge to any of Waterloo’s (Continued...)
23
Cumulated subject imports supplied an increasing share of the U.S. tool chest market during the POI and were the leading source by the end of the POI. Subject imports’ share of the U.S. market increased from *** percent in 2014 to *** percent in 2015 and *** percent in 2016; it was *** percent in interim 2016 and *** percent in interim 2017.109
Nonsubject imports from Canada, Mexico, and Taiwan held a small and decreasing share of the U.S. market during the POI.110 Nonsubject imports’ share of apparent U.S. consumption declined from *** percent in 2014 to *** percent in 2015 and *** percent in 2016; it was *** percent in interim 2016 and *** percent in interim 2017.111
3. Substitutability and Other Conditions
The record indicates that there is a moderate degree of substitutability between subject imports and domestically produced tool chests.112 All responding domestic producers indicated that subject imports were always substitutable with the domestic like product. The majority of responding importers and purchasers reported that subject imports were always or frequently substitutable for the domestic like product.113 As discussed further below in section V.D (Price) regarding substitutability, parties disagree as to whether subject imports contain more innovative features, but the evidence demonstrates that domestic producers can also provide tool chests with innovative features desired by purchasers.114
The record indicates that price is one of the most important factors in purchasing decisions. In ranking the top three factors in their purchasing decisions, purchasers cited price second most frequently, following only quality.115 The majority of purchasers (14 of 20) indicated that they sometimes purchase the lowest-priced product (two reported always purchasing the lowest priced product and four reported never doing so).116
Tool chests are prepackaged for sale directly to consumers, primarily through home improvement stores, club stores, hardware stores, other retail outlets, and online.117 Many (…Continued) financial data or related information, and Waterloo provided information related to this acquisition when requested by the Commission.
109 CR/PR at Table IV-8. 110 CR at II-8, PR at II-5; see also Questionnaire Responses of CSPS Industries, SPG International,
Home Depot, and Waterloo. 111 CR/PR at Table IV-8. 112 CR at II-16, PR at II-10. 113 CR/PR at Table II-11. 114 See Tr. at 32 (Sallee), 72-74 (Nictakis) (“They’re all – you know we talk about innovation and
things like that, but it’s a power strip or it’s a clam shell lid and things are – you know they’re not self-driving cars”); Petitioner Prehearing Brief at 23, 28-33, and Exhibit 1; Petitioner Posthearing Brief at Exhibit 1, pp. 5-8 and 9-12, Exhibit 7, ¶¶ 4-8 (***).
115 CR/PR at Table II-6; CR at II-17, PR at II-17. 116 CR at II-17-18, PR at II-10-11. 117 CR at II-3, PR at II-2. The record shows that there is a small online market for tool chests and
that some retailers with physical stores also sell tool chests online. Tr. at 80 (Nicktakis), 149 (Enger), 182 (Enger).
24
large retailers and home improvement stores own the brands under which tool chests are sold. Some examples are Home Depot’s “Husky” brand, Lowe’s “Kobalt” brand, and the “Craftsman” brand long associated with Sears.118 The record indicates that the domestic industry and subject imports have supplied tool chests for the same retailer for the same brand at the same time.119 During the POI, virtually all subject imports from Vietnam and the large majority of subject imports from China were imported for retail sale to consumers, primarily by major big-box retailers.120 In the United States, Home Depot is the largest purchaser and the *** direct importer of tool chests.121
During the POI, Sears, ***, experienced significant financial difficulties.122 The record indicates that it closed many of its stores and decreased purchases of tool chests for its Craftsman brand.123 Waterloo was the primary supplier of tool chests to Sears, which purchased approximately *** percent of Waterloo’s production volume in 2016.124
C. Volume of Subject Imports
Section 771(7)(C)(i) of the Tariff Act provides that the “Commission shall consider whether the volume of imports of the merchandise, or any increase in that volume, either in absolute terms or relative to production or consumption in the United States, is significant.”125
We find that the volume of cumulated subject imports was significant. Cumulated subject imports increased from 1.1 million units in 2014 to 1.5 million units in 2015, and decreased slightly to 1.3 million units in 2016, a level higher than that at the beginning of the POI; the volume of cumulated subject imports was 943,014 units in interim 2016 and 986,158 units in interim 2017.126 The volume of cumulated subject imports increased as apparent U.S. consumption and domestic production declined by *** percent and *** percent, respectively, from 2014 to 2016.127 As a result, cumulated subject imports experienced significant gains in market share directly at the expense of the domestic industry. Cumulated subject import market share increased from *** percent in 2014 to *** percent in 2015 and *** percent in
118 CR at II-20, PR at II-12-13; Tr. at 40 (Kruger). 119 CR/PR at Table II-8; Tr. at 81 (Sallee). 120 CR at II-3, PR at II-2. 121 CR at II-2 and V-15, PR at II-1-2 and V-5. 122 CR at II-2 and II-11-12, PR at II-2, 7-8. 123 CR at II-2 n.6, PR at II-2 n.6; see, e.g., Geelong Prehearing Brief at 54. 124 CR at II-11 n.19, PR at II-7 n.19. 125 19 U.S.C. § 1677(7)(C)(i). 126 CR/PR at Table IV-2. We find that the volume of subject imports was affected by the
pendency of these investigations. The domestic industry reported increased sales after the petitions were filed, and secured new business with large retailers with products that were previously deemed not price competitive. See Petitioner Prehearing Brief at 59-60; Petitioner Posthearing Brief at Exhibit 12. We therefore reduce the weight given to the market share data for interim 2017, pursuant to 19 U.S.C. § 1677(7)(I).
127 CR/PR at Table III-4.
25
2016; it was *** percent in interim 2016 and *** percent in interim 2017.128 By contrast, the domestic industry’s market share declined by *** percentage points from 2014 to 2016.129 Cumulated subject imports as a share of U.S. production also rose from *** percent in 2014 to *** percent in 2015 and *** percent in 2016; it was *** percent in interim 2016 and *** percent in interim 2017.130
In light of the foregoing, we find that the volume of cumulated subject imports was significant in absolute terms and relative to U.S. production and consumption.
D. Price Effects of the Subject Imports
Section 771(7)(C)(ii) of the Tariff Act provides that, in evaluating the price effects of the subject imports, the Commission shall consider whether
(I) there has been significant price underselling by the imported merchandise as compared with the price of domestic like products of the United States, and
(II) the effect of imports of such merchandise otherwise depresses prices to a significant degree or prevents price increases, which otherwise would have occurred, to a significant degree.131
As referenced above, we find that there is a moderate degree of substitutability between subject imports and the domestic like product. Respondents argue that there is limited substitutability because subject imports provide more innovative features than the domestic industry.132 However, the record demonstrates that Waterloo is capable of providing features desired by purchasers, but not at the same price points as subject imports.133 The record also indicates that price is an important factor in purchasing decisions. Price was the second most cited factor for purchasing decisions by purchasers.134 Other evidence clearly shows the important role that price plays for purchasers, including evidence that purchasers made requests to domestic producers to lower prices and statements that domestic producers’ prices were not competitive.135
128 CR/PR at Table IV-8. 129 CR/PR at Table C-1. The domestic industry’s market share was *** percent in 2014, ***
percent in 2015, and *** percent in 2016; it was *** percent in interim 2016 and *** percent in interim 2017. Id. at Table IV-8.
130 CR at IV-2, PR at IV-2. 131 19 U.S.C. § 1677(7)(C)(ii). 132 See Geelong Prehearing Brief at 27-28. 133 See Tr. at 32 (Sallee), 72-74 (Nictakis); Petitioner Prehearing Brief at 23, 28-33, and Exhibit 1;
Petitioner Posthearing Brief at Exhibit 1, pp. 5-8 and 9-12, Exhibit 7, ¶¶ 4-8. 134 CR at II-17-18, PR at II-10; CR/PR at Table II-6. 135 Petitioner Posthearing Brief at Exhibits 9-18 (providing email chains between domestic
producers and purchasers discussing price). In one instance, a purchaser initially told a domestic producer that ***, but after the petitions were filed, ***. Petitioner Posthearing Brief at Exhibit 2 (***) (Continued...)
26
The Commission collected quarterly pricing data from U.S. producers and importers on four pricing products for products shipped to unrelated U.S. customers.136 137 Two U.S. producers and six importers provided usable pricing data for sales of the requested pricing products, although not all firms reported pricing for all products for all quarters. The pricing data reported by these firms accounted for *** percent of U.S. producers’ commercial shipments, *** percent of subject imports from China (*** percent of U.S. commercial shipments of subject imports from China), and *** percent of subject imports from Vietnam (*** percent of U.S. commercial shipments of subject imports from Vietnam).138 These data yielded a total of 50 quarterly price comparisons, with subject imports underselling the domestic like product in 18 of the 50 quarterly comparisons, or 36 percent of comparisons, at average margins ranging from *** percent from January 2014 to September 2017.139
(…Continued) (***) and *** (***); Tr. at 221-222 (LeBell) (discussing Waterloo lowering prices and winning a sale from Lowe’s).
136 The pricing products were: Product 1 – 26-27 inch wide top chest sold in combination with a 26-27 inch wide rolling
cabinet, each with a body of cold-rolled carbon steel, having 9 to 10 total drawers (across both units) with ball bearing drawer slides, a minimum chest depth (front to back) of 15 inches, a minimum cabinet depth of 18 inches and a combined unit weight (not shipping weight) of 150 to 180 lbs.
Product 2 – 40-46 inch wide top chest sold in combination with a 40-46 inch wide rolling cabinet, each with a body of cold-rolled carbon steel, having 16-21 drawers (across both units) with ball bearing slides, a chest depth of and cabinet depth of 16 to 19 inches and a combined unit weight (not shipping weight) of less than 420 lbs.
Product 3 – 50-56 inch wide top chest sold in combination with a 50-56 inch wide rolling cabinet, each with a body of cold-rolled carbon steel, having 15 to 18 drawers (across both units) with ball bearing slides, a chest depth of and cabinet depth of 16 to 21 inches and a combined unit weight (not shipping weight) of less than 500 lbs.
Product 4 – 45-56 inch wide top workstation or mobile workbench, with a body of cold-rolled carbon steel, having 8 to 11 drawers or doors with ball bearing slides, a top work surface, a unit depth of 17-24 inches, and a unit weight (not shipping weight) of less than 175 lbs. This category specifically excludes work stations or mobile workbenches in which the body is made of stainless steel but includes tool chests and cabinets in which the drawers or door fronts are made of stainless steel.
137 As discussed above, we find that the pendency of the investigations has affected the tool chest market. See Petitioner Prehearing Brief at 59-60; Petitioner Posthearing Brief at Exhibit 12. We therefore accord reduced weight to the pricing and direct import cost data gathered for Q2 2017 and Q3 2017, pursuant to 19 U.S.C. § 1677(7)(I).
138 CR at V-6, PR at V-4. 139 CR/PR at Table V-13. Subject imports oversold the domestic like product in 32 of 50 quarterly
comparisons, at average margins ranging from *** percent. Id. Pricing data from Q1 2014 through Q1 2017 yielded 44 quarterly price comparisons, with subject
imports underselling the domestic like product in 18 of 44 quarterly price comparisons at average margins ranging from 15.8 to 17.3 percent. The volume of subject imports involved in quarters with underselling was *** units, compared with *** units of subject imports in quarters with overselling. Calculated from data on the record.
27
While the price comparison data show predominantly overselling with respect to the number of quarters, the volume of subject imports involved in quarters with underselling is substantially larger than the volume involved in the overselling comparisons. There were *** units of subject imports in quarters with underselling, compared to *** units of subject imports in quarters with overselling.140
An important characteristic of this market is that a substantial share of subject imports entered the United States as direct imports by retailers.141 For the four pricing products, the volume of direct imports of subject merchandise was substantially greater than the volume shipped by importers to unrelated U.S. customers. Direct import cost data accounted for *** percent of subject imports from China and *** percent of subject imports from Vietnam in 2016.142 For the requested pricing products, 73 instances of quarterly purchase cost data for direct imports were reported.143 The record shows that the purchase cost of direct imports of subject imports was lower than the prices for the domestic like product in 52 of 73 instances, or 71.2 percent of the instances.144 Moreover, on a volume basis, there were *** units of direct imports in quarters in which the purchase cost was lower than the price for the domestic like product, and only *** units of direct imports in quarters in which the purchase cost was higher than the prices for the domestic like product.145
Because imports for internal consumption may not be at the same level of trade as shipments by importers to unrelated U.S. customers, we requested that direct importers provide additional estimated costs above landed duty paid value associated with their importing activities. Seven importers reported logistical or supply costs ranging from three to 15 percent; four reported warehouse costs of two to seven percent, and one reported 30 percent.146 However, the average difference between direct import purchase costs and domestic prices was 40.2 percent, substantially higher than the estimated additional costs
140 CR/PR at Table V-13. In response to the Commission’s purchaser questionnaire, 13 or 20 responding purchasers confirmed that they had purchased subject imports instead of U.S.-produced product and ten of these purchasers reported that subject imports were priced lower. CR at V-30-31 and Table V-15, PR at V-10 and Table V-15.
141 CR at V-15-16, PR at V-5-6; e.g., Tr. at 102 (Cannon); Petitioner Prehearing Brief at 34. 142 CR at V-15, PR at V-5-6. 143 Calculated from CR/PR at Tables V-7-10. 144 Calculated from CR/PR at Tables V-7-10. 145 Calculated from CR/PR at Tables V-7-10. Direct import purchase cost data from Q1 2014
through Q1 2017 show that the purchase cost of direct subject imports was lower than the prices for the domestic like product in 46 of 63 instances. On a volume basis, *** units of direct imports were involved in quarters in which the purchase cost was lower than the price for the domestic like product, and only *** units of direct imports in quarters in which the purchase cost was higher than the prices for the domestic like product. Id.
146 CR at V-25, PR at V-7. The 30 percent figure was reported by ***, which accounted for only *** percent of subject imports, CR/PR at Table IV-1, and *** percent of the total volume of direct import cost data. Calculated from data on the record.
28
reported by direct importers for their importing activities.147 The differences between direct import purchase costs and prices for the domestic like product were particularly noteworthy for Pricing Product 1, in which subject imports were below the domestic like product in all instances.148
Considering all quarterly pricing data available, including traditional price comparison data and direct import purchase cost data, we find that subject import prices were generally lower than the prices for the domestic like product.149 We therefore find there has been significant underselling by cumulated subject imports.
We have also considered price trends during the POI. Prices for all four domestically produced products were lower at the end of the POI than at the beginning. Declines in domestic prices ranged from *** to *** percent.150 We acknowledge that apparent U.S. consumption declined between 2014 and 2016 but also observe that cumulated subject imports increased despite such declines in consumption. There are also mixed responses from market participants regarding the demand trend over the POI, with only a small minority reporting that demand decreased.151 We therefore find that the substantial volume of low-priced subject imports depressed domestic prices to a significant degree.152 153
147 Calculated from CR/PR at Tables V-7-10. The average difference between direct import
purchase costs and domestic prices from Q1 2014 through Q1 2017 was 41.9 percent. Calculated from data on the record.
148 Compare CR/PR at Table V-7 with Table V-3. 149 The parties disagree on how the Commission should assess direct import purchase cost data
in these investigations. Geelong Posthearing Brief, Attachment A at 39-41; Petitioner Prehearing Brief at 41-43. Respondents argue that we should not give any weight at all to the direct import cost data . Tr. at 205 (Maleshavich); Geelong Posthearing Brief at 7. Given the prevalence of direct imports in this market, we find it appropriate to use this data set in our analysis; failure to do so would ignore a large part of the market. We note that, consistent with our practice in other investigations, we have collected data that enables us to assess the direct import purchase cost data in light of purchasers’ costs for direct importing. Based on this record, the purchase cost data for direct imports demonstrates that subject imports were generally available at a lower cost to purchasers than the prices of the domestic like product, supporting a finding of significant underselling.
150 CR/PR at Table V-12. There is some evidence that at least one domestic producer reduced prices in order to compete with lower-priced imports from China. CR at V-31, PR at V-10. Domestic prices from Q1 2014 through Q1 2017 showed declines ranging from *** to *** percent. Calculated from data on the record.
151 CR/PR at Table II-4. 152 Respondents contend that the Commission should consider domestic AUV data, which
increased over the POI. Geelong Prehearing Brief at 49. We do not rely on AUV data due to the likelihood that they are affected by changes in product mix given the range of tool chest products and prices. See, e.g., Geelong Prehearing Brief at 47; Polyethylene Retail Carrier Bags from Indonesia, Taiwan, and Vietnam, Inv. Nos. 701-TA-462 and 731-TA-1156-1158 (Final), USITC 4144 (April 2010) at 27, n. 168 (finding the probative value of AUV’s to be “questionable,” given evidence of wide variations in price depending on weight and other physical attributes); Oil Country Tubular Goods from Austria, Brazil, China, France, Germany, India, Indonesia, Romania, South Africa, Spain, Turkey, Ukraine, and (Continued...)
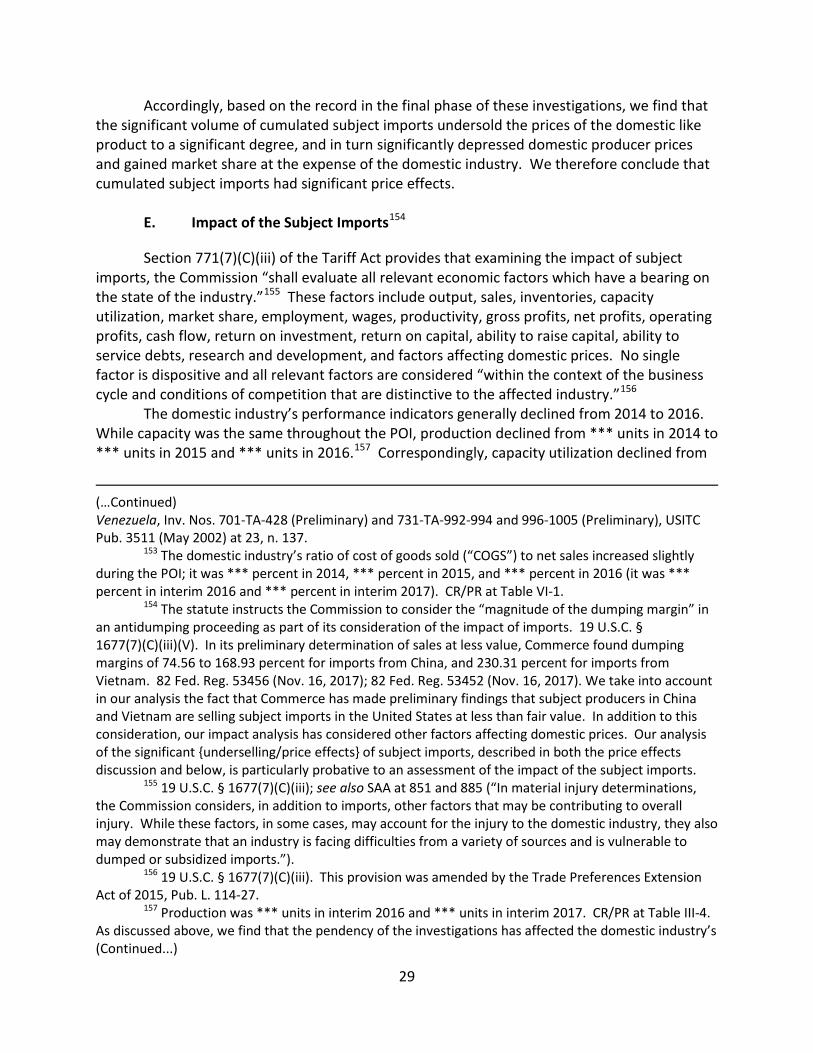
29
Accordingly, based on the record in the final phase of these investigations, we find that the significant volume of cumulated subject imports undersold the prices of the domestic like product to a significant degree, and in turn significantly depressed domestic producer prices and gained market share at the expense of the domestic industry. We therefore conclude that cumulated subject imports had significant price effects.
E. Impact of the Subject Imports154
Section 771(7)(C)(iii) of the Tariff Act provides that examining the impact of subject imports, the Commission “shall evaluate all relevant economic factors which have a bearing on the state of the industry.”155 These factors include output, sales, inventories, capacity utilization, market share, employment, wages, productivity, gross profits, net profits, operating profits, cash flow, return on investment, return on capital, ability to raise capital, ability to service debts, research and development, and factors affecting domestic prices. No single factor is dispositive and all relevant factors are considered “within the context of the business cycle and conditions of competition that are distinctive to the affected industry.”156
The domestic industry’s performance indicators generally declined from 2014 to 2016. While capacity was the same throughout the POI, production declined from *** units in 2014 to *** units in 2015 and *** units in 2016.157 Correspondingly, capacity utilization declined from
(…Continued) Venezuela, Inv. Nos. 701-TA-428 (Preliminary) and 731-TA-992-994 and 996-1005 (Preliminary), USITC Pub. 3511 (May 2002) at 23, n. 137.
153 The domestic industry’s ratio of cost of goods sold (“COGS”) to net sales increased slightly during the POI; it was *** percent in 2014, *** percent in 2015, and *** percent in 2016 (it was *** percent in interim 2016 and *** percent in interim 2017). CR/PR at Table VI-1.
154 The statute instructs the Commission to consider the “magnitude of the dumping margin” in an antidumping proceeding as part of its consideration of the impact of imports. 19 U.S.C. § 1677(7)(C)(iii)(V). In its preliminary determination of sales at less value, Commerce found dumping margins of 74.56 to 168.93 percent for imports from China, and 230.31 percent for imports from Vietnam. 82 Fed. Reg. 53456 (Nov. 16, 2017); 82 Fed. Reg. 53452 (Nov. 16, 2017). We take into account in our analysis the fact that Commerce has made preliminary findings that subject producers in China and Vietnam are selling subject imports in the United States at less than fair value. In addition to this consideration, our impact analysis has considered other factors affecting domestic prices. Our analysis of the significant {underselling/price effects} of subject imports, described in both the price effects discussion and below, is particularly probative to an assessment of the impact of the subject imports.
155 19 U.S.C. § 1677(7)(C)(iii); see also SAA at 851 and 885 (“In material injury determinations, the Commission considers, in addition to imports, other factors that may be contributing to overall injury. While these factors, in some cases, may account for the injury to the domestic industry, they also may demonstrate that an industry is facing difficulties from a variety of sources and is vulnerable to dumped or subsidized imports.”).
156 19 U.S.C. § 1677(7)(C)(iii). This provision was amended by the Trade Preferences Extension Act of 2015, Pub. L. 114-27.
157 Production was *** units in interim 2016 and *** units in interim 2017. CR/PR at Table III-4. As discussed above, we find that the pendency of the investigations has affected the domestic industry’s (Continued...)

30
*** percent in 2014 to *** percent in 2015 and *** percent in 2016.158 U.S. shipments also declined, from *** units in 2014 to *** units in 2015 and *** units in 2016.159 The domestic industry’s share of apparent U.S. consumption declined from *** percent in 2014 to *** percent in 2015 and *** percent in 2016.160 However, end-of-period inventories declined from *** units in 2014 to *** units in 2015 and *** units in 2016.161
The domestic industry’s employment indicators were mixed during the POI. The number of production and related workers declined from *** in 2014 to *** in 2015, and then increased slightly to *** in 2016.162 Total hours worked decreased from *** hours in 2014 to *** hours in 2015 before increasing to *** in 2016.163 Wages paid decreased from $*** in 2014 to $*** in 2015, then increased to $*** in 2016.164 Average hourly wages were $*** in 2014, $*** in 2015, and $*** in 2016.165 Productivity declined from *** units per hour in 2014 to *** in 2015, and to *** in 2016.166
The domestic industry’s financial performance declined from 2014 to 2016. The value of total net sales declined from $*** in 2014 to $*** in 2015 and $*** in 2016.167 Gross profits declined from $*** in 2014 to $*** in 2015 and $*** in 2016.168 The domestic industry’s COGS to net sales ratio increased from *** percent in 2014 to *** percent in 2015 and *** percent in 2016.169 Operating income declined from $*** in 2014 to $*** in 2015 and $*** in 2016.170
(…Continued) performance. We therefore accord reduced weight to the data used to assess the impact of subject imports (including the domestic industry’s performance indicators) for interim 2017, pursuant to 19 U.S.C. § 1677(7)(I).
158 Capacity utilization was *** percent in interim 2016 and *** percent in interim 2017. CR/PR at Table III-4.
159 Shipments were *** units in interim 2016 and *** units in interim 2017. CR/PR at Table III-6. 160 The domestic industry’s share of the U.S. market was *** percent in interim 2016 and ***
percent in interim 2017. CR/PR at Table IV-8. 161 Inventories were *** units in interim 2016 and *** units in interim 2017. CR/PR at Table III-7. 162 The number of workers was *** in interim 2016 and *** in interim 2017. CR/PR at Table III-
9. 163 Hours worked were *** hours in interim 2016 and *** hours in interim 2017. CR/PR at Table
III-9. 164 Wages paid were $*** in interim 2016 and $*** in interim 2017. CR/PR at Table III-9. 165 Average hourly wages were $*** in interim 2016 and $*** in interim 2017. CR/PR at Table III-
9. 166 Productivity was *** units per hour in interim 2016 and *** units per hour in interim 2017.
CR/PR at Table III-9. 167 Total net sales were valued at $*** in interim 2016 and $*** in interim 2017. CR/PR at Table
VI-1. 168 Gross profits were $*** in interim 2016 and $*** in interim 2017. CR/PR at Table VI-1. 169 The COGS to net sales ratio was *** percent in interim 2016 and *** percent in interim 2017.
CR/PR at Table VI-1. 170 Operating income was $*** in interim 2016 and $*** in interim 2017. CR/PR at Table VI-1.
The domestic industry’s net income was identical to its operating income. Id.

31
The domestic industry’s operating income margin declined from *** percent in 2014 to *** percent in 2015 and *** percent in 2016.171
The domestic industry’s capital expenditures and research and development (“R&D”) expenses trends were mixed during the POI. Capital expenditures increased from $*** in 2014 to $*** in 2015 and $*** in 2016.172 R&D expenses fluctuated but declined overall; they were $*** in 2014, $*** in 2015, and $*** in 2016.173
As discussed above, the volume of cumulated subject imports was significant, both in absolute terms and relative to U.S. consumption and production. The cumulated subject imports significantly undersold the domestic like product throughout the POI, taking market share from the domestic industry and causing domestic prices to fall, which resulted in lower revenue for domestic producers. These lower revenues in turn led to the domestic industry’s declining financial performance from 2014 to 2016.174
We have considered whether there were other factors that may have had an impact on the domestic industry during the POI to ensure that we are not attributing injury from these factors to subject imports. Respondents argue that the domestic industry’s decline was caused by Sears’ financial decline because Sears was Waterloo’s primary customer.
Sears’ problems during the POI, however, do not fully explain declines in the performance of the domestic industry from 2014 to 2016. While a substantial share of Waterloo’s sales were to Sears over the POI, the record indicates that Waterloo actively sought to gain and retain sales to other purchasers, and that these efforts were adversely impacted by competition from low-priced subject imports.175 In particular, the record shows instances in which Waterloo’s sales bids were rejected on the basis of price.176 Waterloo reported being told by purchasers that subject imports were less expensive and that Waterloo should not bid because it could not compete.177 As further evidence that Waterloo was attempting to sell to purchasers other than Sears, Waterloo gained business with Lowes and Walmart after the petitions were filed.178 Finally, we note that MBI, which experienced declines similar to
171 Operating income margin was *** percent in interim 2016 and *** percent in interim 2017.
CR/PR at Table VI-1. 172 Capital expenditures were $*** in interim 2016 and $*** in interim 2017. CR/PR at Table VI-
4. 173 R&D expenses were $*** in interim 2016 and $*** in interim 2017. CR/PR at Table VI-4. 174 We also note that in interim 2017, when subject import market share fell due to the
pendency of the investigations, the domestic industry’s condition improved. 175 Petitioner Posthearing Brief at Exhibits 7 (¶¶ 23, 27-29), 10, and 12-18. 176 Petitioner Posthearing Brief at Exhibits 12-13, 16 (***). 177 Tr. at 67-68 (Nictakis) (“I like to go out and call on customers and I personally accompany
them and time and time again the answer was the same. It was you’re too expensive. I can get it cheaper in China and Vietnam. You need to take your price down. Don’t even bother bidding. You’re not even close. It’s not worth your time.”). Waterloo also provided some evidence that it lost established lines previously sold to purchasers other than Sears before the POI to lower-priced subject imports during the POI and did not gain back these sales until after the petitions were filed. Petitioner Posthearing Brief at Exhibit 9 (detailing product lines sold to ***).
178 Petitioner Prehearing Brief at 59-60.

32
Waterloo’s, never sold to Sears, and therefore its declining performance cannot be attributed to Sears’ problems.179 180
Respondents also contend that the domestic industry cannot provide innovative features, refused to bid on certain products during the POI, or was unable to provide products within the timeline required by purchasers.181 The record indicates that the domestic industry is generally able to provide innovations and features desired by purchasers,182 but not at the prices set by subject imports. In addition, purchasers reported that innovation is important for branding and that ***. SBD acquired the Craftsman brand from Sears in March 2017 ***.183 The low prices of subject imports are also not consistent with respondents’ arguments that subject imports are superior with respect to innovations and features. After the petitions were filed and preliminary duties were imposed, the domestic industry gained business from certain large retailers, demonstrating that it is able to provide the features sought by purchasers.184 To the extent that the domestic industry was unable to meet the delivery times requested by some purchasers,185 the volume of sales involved was relatively small, and does not adequately explain the full magnitude of the lost sales and decline in market share that the domestic industry experienced during the POI.
We recognize that apparent U.S. consumption declined during the POI. However, the extent of any actual decline in demand is unclear, given that market participants mostly reported that demand was increasing, stable, or fluctuating. Furthermore, any decline in demand during the POI does not explain the shift in market share from the domestic industry to subject imports nor fully explain the domestic industry’s production and shipment declines. Apparent U.S. consumption declined *** percent between 2014 and 2016 but domestic production fell by *** percent and domestic shipments declined by *** percent, as cumulated subject imports increased both in volume and market share.186
We have also considered the presence of nonsubject imports. As described above, nonsubject imports were a small and decreasing source of supply during the POI. Nonsubject imports’ share of apparent consumption declined from *** percent in 2014 to *** percent in
179 Tr. at 41 (Kruger) (“MBI does not sell *** Sears”); CR/PR at Table VI-3. 180 In addition, we note that the decline in Sears’ tool chest purchasers cannot be fully explained
by that company’s financial difficulties or changes in overall operations. The decline in Sears’ tool chest purchases was greater than its declines in overall purchases; its ***. Tr. at 52 (Cannon) and accompanying confidential chart 20. There is some evidence that Sears’ tool chest business was itself affected by competitors’ increased purchases of low-priced subject imports over the POI. During the POI ***. Geelong Prehearing Brief at 41 (***); Petitioner Posthearing Brief at Exhibit 9; CR at V-15, PR at V-15. There is also evidence, albeit from prior to the POI, that Sears viewed Home Depot as a low-priced competitor for sales of tool chests to end-users. Petitioner Posthearing Brief at Exhibit 6.
181 Tr. at 140-141 (Stremmel); Geelong Prehearing Brief at 27, 31-32. 182 See Tr. at 32 (Sallee), 72-74 (Nictakis); Petitioner Prehearing Brief at 23, 28-33, and Exhibit 1;
Petitioner Posthearing Brief at Exhibit 1, pp. 5-8 and 9-12, Exhibit 7, ¶¶ 4-8. 183 CR at II-23, VI-1, and E-4, PR at II-13, VI-1, and E-1. 184 Petitioner Prehearing Brief at 59-60. 185 See, e.g., Tr. at 92-93 (Nictakis). 186 CR/PR at Tables III-4, III-6, and IV-8.

33
2015 and *** percent in 2016; their share was *** percent in interim 2016 and *** percent in interim 2017.187 We therefore find that nonsubject imports do not explain the declines in the domestic industry’s condition during the POI.
VI. Conclusion
For the reasons stated above, we determine that an industry in the United States is materially injured by reason of subject imports of tool chests and cabinets from China that are subsidized by the government of China.
187 CR/PR at Table IV-8.

I-1
PART I: INTRODUCTION
BACKGROUND
These investigations result from petitions filed with the U.S. Department of Commerce (“Commerce”) and the U.S. International Trade Commission (“USITC” or “Commission”) by Waterloo Industries Inc., Sedalia, Missouri, on April 11, 2017, alleging that an industry in the United States is materially injured and threatened with material injury by reason of subsidized imports of tool chests and cabinets1 from China and less-than-fair-value (“LTFV”) imports of tool chests and cabinets from China and Vietnam. The following tabulation provides information relating to the background of these investigations.2 3 4
Effective date Action April 11, 2017 Petition filed with Commerce and the Commission;
institution of Commission investigations (82 FR 18309, April 18, 2017)
May 1, 2017 Commerce’s notice of initiation of antidumping investigation (82 FR 21523, May 9, 2017); Commerce’s notice of initiation of countervailing duty investigation (82 FR21516, May 9, 2017)
May 26, 2017 Commission’s preliminary determinations September 15, 2017 Commerce’s countervailing duty preliminary determination;
scheduling of final phase of Commission investigation (82 FR 43332, September 15, 2017)
November 7, 2013 Commerce’s preliminary antidumping duty determinations (82 FR 53456 and 82 FR 53453, November 16, 2017).
November 22, 2017 Commerce’s final countervailing duty determination (82 FR 56582, November 29, 2017)
November 28, 2017 Commission’s hearing January 3, 2018 Commission’s voted (China countervailing duty) January 16, 2018 Commission’s views (China countervailing duty) March 31, 2018 Commerce’s final antidumping duty determinations
(expected) PENDING Commission’s vote, opinion (China, Vietnam antidumping
duty)
1 See the section entitled “The Subject Merchandise” in Part I of this report for a complete description of the merchandise subject in this proceeding.
2 Pertinent Federal Register notices are referenced in appendix A, and may be found at the Commission’s website (www.usitc.gov)
3 The U.S. Department of Commerce did not align its final countervailing duty determination with its final antidumping duty determinations.
4 A list of witnesses appearing at the hearing is presented in appendix B of this report.
I-2
STATUTORY CRITERIA AND ORGANIZATION OF THE REPORT
Statutory criteria
Section 771(7)(B) of the Tariff Act of 1930 (the “Act”) (19 U.S.C. § 1677(7)(B)) provides
that in making its determinations of injury to an industry in the United States, the Commission-- shall consider (I) the volume of imports of the subject merchandise, (II) the effect of imports of that merchandise on prices in the United States for domestic like products, and (III) the impact of imports of such merchandise on domestic producers of domestic like products, but only in the context of production operations within the United States; and. . . may consider such other economic factors as are relevant to the determination regarding whether there is material injury by reason of imports.
Section 771(7)(C) of the Act (19 U.S.C. § 1677(7)(C)) further provides that--5 In evaluating the volume of imports of merchandise, the Commission shall consider whether the volume of imports of the merchandise, or any increase in that volume, either in absolute terms or relative to production or consumption in the United States is significant.. . .In evaluating the effect of imports of such merchandise on prices, the Commission shall consider whether. . .(I) there has been significant price underselling by the imported merchandise as compared with the price of domestic like products of the United States, and (II) the effect of imports of such merchandise otherwise depresses prices to a significant degree or prevents price increases, which otherwise would have occurred, to a significant degree.. . . In examining the impact required to be considered under subparagraph (B)(i)(III), the Commission shall evaluate (within the context of the business cycle and conditions of competition that are distinctive to the affected industry) all relevant economic factors which have a bearing on the state of the industry in the United States, including, but not limited to. . . (I) actual and potential decline in output, sales, market share, gross profits, operating profits, net profits, ability to service debt, productivity, return on investments, return on assets, and utilization of capacity, (II) factors affecting domestic prices, (III) actual and potential negative effects on cash flow, inventories, employment, wages, growth, ability to raise capital, and investment, (IV) actual and potential negative effects on the existing development and production efforts of the domestic industry, including efforts to develop a derivative or more
5 Amended by PL 114-27 (as signed, June 29, 2015), Trade Preferences Extension Act of 2015.
I-3
advanced version of the domestic like product, and (V) in {an antidumping investigation}, the magnitude of the margin of dumping.
In addition, Section 771(7)(J) of the Act (19 U.S.C. § 1677(7)(J)) provides that—6 (J) EFFECT OF PROFITABILITY.—The Commission may not determine that there is no material injury or threat of material injury to an industry in the United States merely because that industry is profitable or because the performance of that industry has recently improved.
Organization of report
Part I of this report presents information on the subject merchandise, subsidy and dumping margins, and domestic like product. Part II of this report presents information on conditions of competition and other relevant economic factors. Part III presents information on the condition of the U.S. industry, including data on capacity, production, shipments, inventories, and employment. Parts IV and V present the volume of subject imports and pricing of domestic and imported products, respectively. Part VI presents information on the financial experience of U.S. producers. Part VII presents the statutory requirements and information obtained for use in the Commission’s consideration of the question of threat of material injury as well as information regarding nonsubject countries.
MARKET SUMMARY
Tool chests and cabinets generally are used to store tools and equipment. The leading U.S. producer of tool chests and cabinets is Waterloo, while leading producers of tool chests and cabinets outside the United States include Zhongshan Geelong Manufacturing Co. Ltd. (“Geelong”) and Jiangsu Tongrun Equipment Technology Co. Ltd. (“Jiangsu Tongrun”) of China and the CSPS Group of Vietnam. The leading U.S. importers of tool chests and cabinets from China are *** while the leading importer of tool chests and cabinets from Vietnam is ***. The leading importer of tool chests and cabinets from Canada, the only nonsubject source of imports to the United States,7 is ***.
Apparent U.S. consumption of tool chests and cabinets totaled approximately *** units *** in 2016. Currently, two firms are known to produce tool chests and cabinets in the United States.8 U.S. producers’ U.S. shipments of tool chests and cabinets totaled *** units *** in 2016, and accounted for *** percent of apparent U.S. consumption by quantity and *** percent by value. U.S. imports from subject sources totaled approximately 1.3 million units ($244.6 million) in 2016 and accounted for *** percent of apparent U.S. consumption by
6 Amended by PL 114-27 (as signed, June 29, 2015), Trade Preferences Extension Act of 2015. 7 Conference transcript, p. 166 (Enger). 8 Six firms submitted complete or partial responses to producers’ questionnaires but only two firms
reported production of tool chests and cabinets as defined below.
I-4
quantity and *** percent by value. U.S. imports from nonsubject sources totaled *** units *** in 2016 and accounted for *** percent of apparent U.S. consumption by quantity and *** percent by value.
SUMMARY DATA AND DATA SOURCES
A summary of data collected in these investigations is presented in appendix C.9 Except as noted, U.S. industry data are based on questionnaire responses of two firms that accounted for all known U.S. production of tool chests and cabinets during 2016.10
U.S. imports are based on the questionnaire responses of 21 importers that accounted for the majority of imports from China, Vietnam, and nonsubject sources during 2016.11
Foreign industry data for China are based on the questionnaire responses of 13 producers and one exporting firm that staff believes accounted for the majority of tool chest and cabinet production and exports to the United States from China during 2016. Foreign industry data for Vietnam are based on the questionnaire responses of five producers and exporters that reported accounting for the majority of tool chests and cabinets produced in Vietnam and the majority of exports to the United States from Vietnam during 2016.12
PREVIOUS AND RELATED INVESTIGATIONS
Tool chests and cabinets have not been the subject of any prior countervailing duty or antidumping duty investigation in the United States.
9 Quantity data are presented in terms of units. For the purposes of this report, a unit includes a prepackage tool chest set when sold as a unit and individual top chests, intermediate chests, tool cabinets, and/or side cabinets when sold separately.
10 Petitioner Waterloo argues that Waterloo and Metal Box International (“MBI”) represent 100 percent of U.S. production of tool chests and cabinets. Petitioner’s post conference brief, pp. 12-13 and exh. 6. Waterloo and MBI primarily sell to***, whereas Matco Tools Corporation (“Matco”) and Stanley Black & Decker sell primarily to ***. Further information regarding responding U.S. producers and their shipments of tool chests and cabinets (broadly defined) can be found in table C-2.
11 Responding U.S. importers reported importing *** units from China, and responding Chinese exporters’ reported exporting *** units to the United States. Responding U.S. importers reported importing *** units from Vietnam. Vietnamese exporters’ reported exports to the United States of ***. Respondent Geelong testified that it knew of only one importer of tool chests and cabinets from Canada, SPG International. Conference transcript, p. 141 (Enger). ***.
12 The five producers and exporters from Vietnam submitted a single, joint questionnaire response. The five firms are: Amex Metal Corp.; Clearwater Metal Vietnam JSC; CSPS Co., Ltd.; Kinox Corp.; and Rabat Corp. (collectively “CSPS Group”).
I-5
NATURE AND EXTENT OF SUBSIDIES AND SALES AT LTFV
Subsidies
On November 29, 2017, Commerce published its Federal Registry Notice regarding its countervailing duty determination on tool chests and cabinets from China.13 Table I-1 presents Commerce’s findings concerning subsidy programs pertaining to the production of tool chests and cabinets in China. Commerce identified the following government programs in China to be countervailable:
1. Preferential lending • Policy loans to the tool chest industry • Grant programs
2. Export credits from Export-Import Bank of China • Export credit guarantees • Export buyer’s credit
3. Tax programs • Income tax deductions for research and development (“R&D”) expenses
under the enterprise income tax law • Provincial Government of Guangdong tax offset for R&D
4. Government provision of goods and services for less than adequate remuneration (“LTAR”)
• Government provision of hot-rolled/cold-rolled coiled steel for LTAR • Provision of electricity for LTAR
5. Grant Programs • Government of China (“GOC”) and sub-central government subsidies for
the development of famous brands and China world top brands • Special fund for energy savings technology reform • Small and medium-sized enterprises (SMEs) international market
exploration/development fund • SME technology innovation fund
13 Certain Tool Chests and Cabinets from the People’s Republic of China: Final Affirmative Countervailing Duty Determination, 82 FR 56582, November 29, 2017.

I-6
Table I-1 Tool chests and cabinets: Commerce’s final subsidy determination with respect to imports from China
Entity Final countervailable subsidy
margin (percent)
Jiangsu Tongrun Equipment Technology Co., Ltd 15.09 Zhongshan Geelong Manufacturing Co., Ltd 14.03 Nineteen separate firms 14.39
Thirty separate firms 95.96
All others 14.39 Source: 82 FR 56583, November 29, 2017.
Sales at LTFV
On November 16, 2017, Commerce published a notice in the Federal Register of its preliminary determinations of sales at LFTV with respect to tool chests and cabinets from China and Vietnam. Table I-2 presents Commerce’s dumping margins with respect to imports of tool chests and cabinets from China and Vietnam. Commerce’s final determinations are pending.
Table I-2 Tool chests and cabinets: Commerce’s preliminary weight-average LTFV margins with respect to imports from China and Vietnam
Exporter Producer Preliminary dumping margin (percent)
China Geelong Sales (Macao Commercial Offshore) Limited Zhongshan Geelong Manufacturing Co., Ltd 168.93
The Tongrun Single Entity Changshu City Jiangrun Metal Product Co., Ltd and The Tongrun Single Entity 90.40
All others All others 145.99 Vietnam
Clearwater Metal Single Entity Clearwater Metal Single Entity 230.31 Vietnam-wide Entity 230.31 Source: Certain Tool Chests and Cabinets From China and the Socialist Republic of Vietnam: Preliminary Affirmative Determination of Sales at Less Than Fair Value, Postponement of Final Determination and Extension of Provisional Measures, in Part, 82 FR 53456, November 16, 2017 and 82 FR 53453, November 16, 2017.
I-7
THE SUBJECT MERCHANDISE
Commerce’s scope14
In the current proceeding, Commerce has defined the scope as follows: All metal tool chests and cabinets, including top chests, intermediate chests, tool cabinets and side cabinets, storage units, mobile work benches, and work stations and that have the following physical characteristics:
(1) a body made of carbon, alloy, or stainless steel and/or other metals; (2) two or more drawers for storage in each individual unit; (3) a width (side to side) exceeding 15 inches for side cabinets and exceeding
21 inches for all other individual units but not exceeding 60 inches; (4) a depth (front to back) exceeding 10 inches but not exceeding 24 inches;
and (5) prepackaged for retail sale.
For purposes of this scope, the width parameter applies to each individual unit, i.e., each individual top chest, intermediate top chest, tool cabinet, side cabinet, storage unit, mobile work bench, and work station. Prepackaged for retail sale means the units are packaged in a cardboard box or other container suitable for retail display and sale. Subject tool chests and cabinets are covered whether imported in assembled or unassembled form. Subject merchandise includes tool chests and cabinets produced in China or Vietnam but assembled, prepackaged for sale, or subject to other minor processing in a third country prior to importation into the United States. Similarly, it would include tool chests and cabinets produced in China or Vietnam that are later found to be assembled, prepackaged for sale, or subject to other minor processing after importation into the United States. Subject tool chests and cabinets may also have doors and shelves in addition to drawers, may have handles (typically mounted on the sides), and may have a work surface on the top. Subject tool chests and cabinets may be uncoated (e.g., stainless steel), painted, powder coated, galvanized, or otherwise coated for corrosion protection or aesthetic appearance.
Subject tool chests and cabinets may be packaged as individual units or in sets. When prepackaged in sets, they typically include a cabinet with one or more chests
14 Certain Tool Chests and Cabinets from the People’s Republic of China: Final Affirmative Countervailing Duty Determination, 82 FR 56582, November 29, 2017.
I-8
that stack on top of the cabinet. Tool cabinets act as a base tool storage unit and typically have rollers, casters, or wheels to permit them to be moved more easily when loaded with tools. Work stations and work benches are tool cabinets with a work surface on the top that may be made of rubber, plastic, metal, wood, or other materials.
Top chests are designed to be used with a tool cabinet to form a tool storage unit. The top chests may be mounted on top of the base tool cabinet or onto an intermediate chest. They are often packaged as a set with tool cabinets or intermediate chests, but may also be packaged separately. They may be packaged with mounting hardware (e.g. bolts) and instructions for assembling them onto the base tool cabinet or onto an intermediate tool chest which rests on the base tool cabinet. Smaller top chests typically have handles on the sides, while the larger top chests typically lacks handles. Intermediate tool chests are designed to sit on top of the floor standing tool cabinet and to be used underneath the top tool chest. Although they may be packaged or used separately from the tool cabinet, intermediate chests are designed to be used in conjunction with tool cabinets. Intermediate chests typically do not have handles, but the intermediate and top chests may have the capability of being bolted together. Side cabinets are designed to be bolted or otherwise attached to the side of the base storage cabinet to expand the storage capacity of the base tool cabinet.
Subject tool chests and cabinets also may be packaged with a tool set included. Packaging a subject tool chest and cabinet with a tool set does not remove an otherwise covered subject tool chest and cabinet from the scope. When this occurs the tools are not part of the subject merchandise. All tool chests and cabinets that meet the above definition are included in the scope unless otherwise specifically excluded.
Excluded from the scope of the investigations are tool boxes, chests, and cabinets with bodies made of plastic, carbon fiber, wood, or other non-metallic substances. Also excluded from the scope of the investigations are industrial grade steel tool chests and cabinets. The excluded industrial grade steel tool chests and cabinets are those:
(1) having a body that is over 60 inches wide; or (2) having each of the following physical characteristics:
(a) a body made of steel that is 0.047 inches or more in thickness; (b) a body depth (front to back) exceeding 21 inches; and (c) a unit weight that exceeds the maximum unit weight shown below for
each width range:
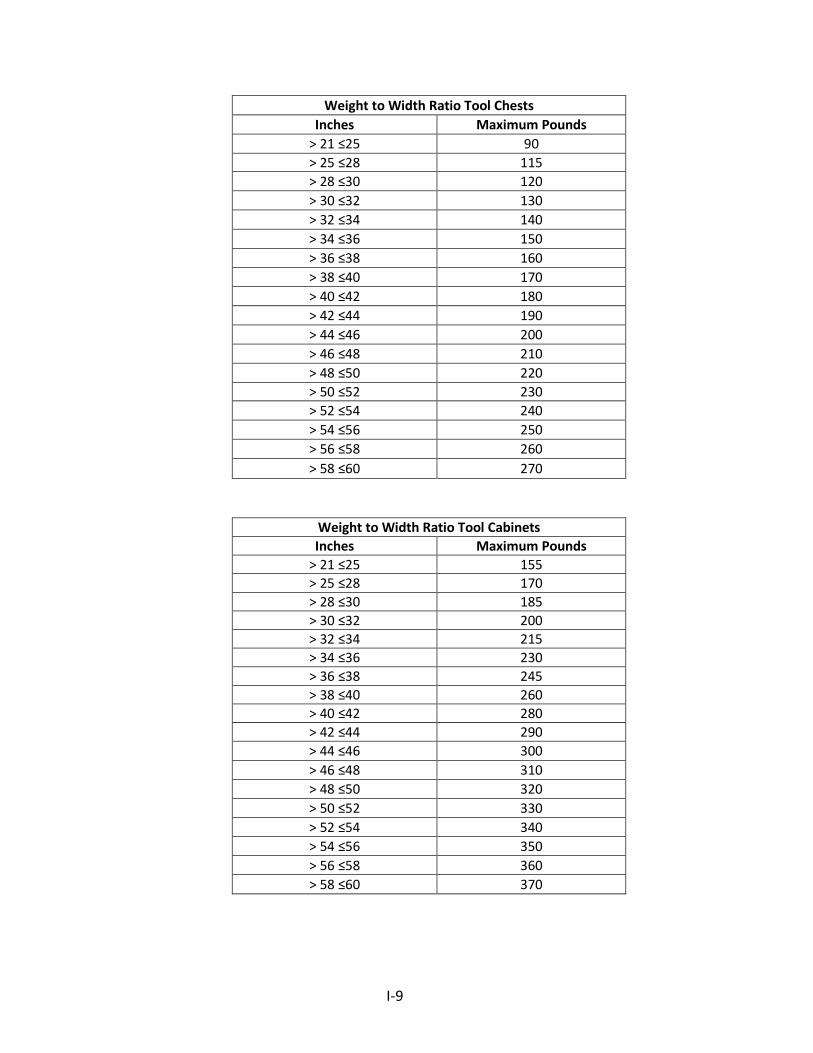
I-9
Weight to Width Ratio Tool Chests Inches Maximum Pounds
> 21 ≤25 90 > 25 ≤28 115 > 28 ≤30 120 > 30 ≤32 130 > 32 ≤34 140 > 34 ≤36 150 > 36 ≤38 160 > 38 ≤40 170 > 40 ≤42 180 > 42 ≤44 190 > 44 ≤46 200 > 46 ≤48 210 > 48 ≤50 220 > 50 ≤52 230 > 52 ≤54 240 > 54 ≤56 250 > 56 ≤58 260 > 58 ≤60 270
Weight to Width Ratio Tool Cabinets Inches Maximum Pounds
> 21 ≤25 155 > 25 ≤28 170 > 28 ≤30 185 > 30 ≤32 200 > 32 ≤34 215 > 34 ≤36 230 > 36 ≤38 245 > 38 ≤40 260 > 40 ≤42 280 > 42 ≤44 290 > 44 ≤46 300 > 46 ≤48 310 > 48 ≤50 320 > 50 ≤52 330 > 52 ≤54 340 > 54 ≤56 350 > 56 ≤58 360 > 58 ≤60 370

I-10
Also excluded from the scope of the investigations are service carts. The excluded service carts have all of the following characteristics:
(1) casters, wheels, or other similar devices which allow the service cart to be rolled from place to place;
(2) a flat top or flat lid on top of the unit that opens; (3) a space or gap between the casters, wheels, or other similar devices, and
the bottom of the enclosed storage space (e.g., drawers) of at least 10 inches; and
(4) a total unit height, including casters, of less than 48 inches.
Also excluded from the scope of the investigations are work benches having each of the following characteristics:
(1) a solid top working surface; (2) no drawers, one drawer, or two drawers in a side-by side configuration; and (3) the unit is supported by legs and the unit has no solid front, side, or back
panels enclosing the body of the unit. Also excluded from the scope of the investigations are metal filing cabinets that are configured to hold hanging file folders and are classified in the Harmonized Tariff Schedule of the United States (HTSUS) at subheading 9403.10.0020.
Merchandise subject to the investigation is classified under HTSUS categories 9403.20.0021, 9403.20.0026, 9403.20.0030, and 7326.90.8688 but may also be classified under HTSUS category 7326.90.3500. While HTSUS subheadings are provided for convenience and Customs purposes, the written description of the scope of this investigation is dispositive.
Tariff treatment
Based upon the scope set forth by the Department of Commerce, information available to the Commission indicates that the merchandise subject to these investigations are imported under subheadings 7326.90.8615 (statistical reporting number 7326.90.8688, a residual or “basket” category for nonenumerated articles of iron or steel), and 9403.20.00 (statistical
15 On January 1, 2017, HTSUS subheading 7326.90.85 was redesignated as HTSUS subheading 7326.90.86 and its statistical reporting numbers were redesignated accordingly. See Presidential Proclamation 9549 of December 1, 2016 and minutes of the Committee for Statistical Annotation of the Tariff Schedules, as noted in the Change Record—Basic Edition (2017), HTSUS (2017) Basic Edition, February 2017, pp. 62-63.
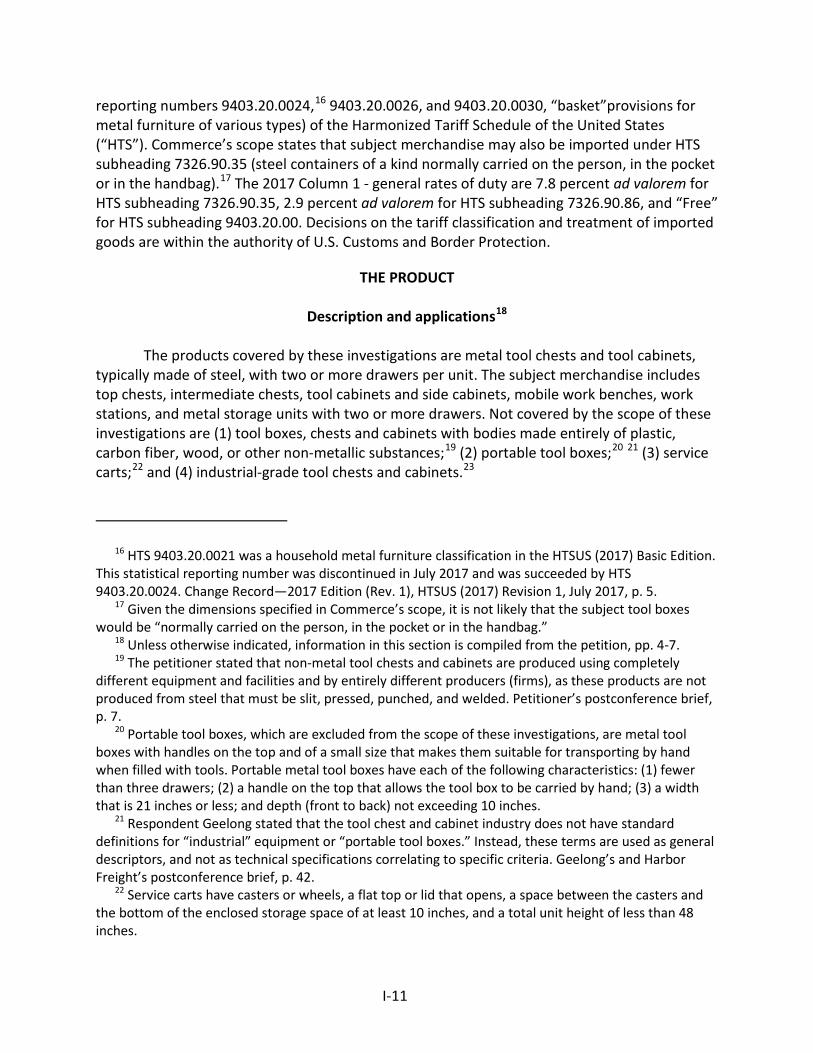
I-11
reporting numbers 9403.20.0024,16 9403.20.0026, and 9403.20.0030, “basket”provisions for metal furniture of various types) of the Harmonized Tariff Schedule of the United States (“HTS”). Commerce’s scope states that subject merchandise may also be imported under HTS subheading 7326.90.35 (steel containers of a kind normally carried on the person, in the pocket or in the handbag).17 The 2017 Column 1 - general rates of duty are 7.8 percent ad valorem for HTS subheading 7326.90.35, 2.9 percent ad valorem for HTS subheading 7326.90.86, and “Free” for HTS subheading 9403.20.00. Decisions on the tariff classification and treatment of imported goods are within the authority of U.S. Customs and Border Protection.
THE PRODUCT
Description and applications18
The products covered by these investigations are metal tool chests and tool cabinets, typically made of steel, with two or more drawers per unit. The subject merchandise includes top chests, intermediate chests, tool cabinets and side cabinets, mobile work benches, work stations, and metal storage units with two or more drawers. Not covered by the scope of these investigations are (1) tool boxes, chests and cabinets with bodies made entirely of plastic, carbon fiber, wood, or other non-metallic substances;19 (2) portable tool boxes;20 21 (3) service carts;22 and (4) industrial-grade tool chests and cabinets.23
16 HTS 9403.20.0021 was a household metal furniture classification in the HTSUS (2017) Basic Edition. This statistical reporting number was discontinued in July 2017 and was succeeded by HTS 9403.20.0024. Change Record—2017 Edition (Rev. 1), HTSUS (2017) Revision 1, July 2017, p. 5.
17 Given the dimensions specified in Commerce’s scope, it is not likely that the subject tool boxes would be “normally carried on the person, in the pocket or in the handbag.”
18 Unless otherwise indicated, information in this section is compiled from the petition, pp. 4-7. 19 The petitioner stated that non-metal tool chests and cabinets are produced using completely
different equipment and facilities and by entirely different producers (firms), as these products are not produced from steel that must be slit, pressed, punched, and welded. Petitioner’s postconference brief, p. 7.
20 Portable tool boxes, which are excluded from the scope of these investigations, are metal tool boxes with handles on the top and of a small size that makes them suitable for transporting by hand when filled with tools. Portable metal tool boxes have each of the following characteristics: (1) fewer than three drawers; (2) a handle on the top that allows the tool box to be carried by hand; (3) a width that is 21 inches or less; and depth (front to back) not exceeding 10 inches.
21 Respondent Geelong stated that the tool chest and cabinet industry does not have standard definitions for “industrial” equipment or “portable tool boxes.” Instead, these terms are used as general descriptors, and not as technical specifications correlating to specific criteria. Geelong’s and Harbor Freight’s postconference brief, p. 42.
22 Service carts have casters or wheels, a flat top or lid that opens, a space between the casters and the bottom of the enclosed storage space of at least 10 inches, and a total unit height of less than 48 inches.
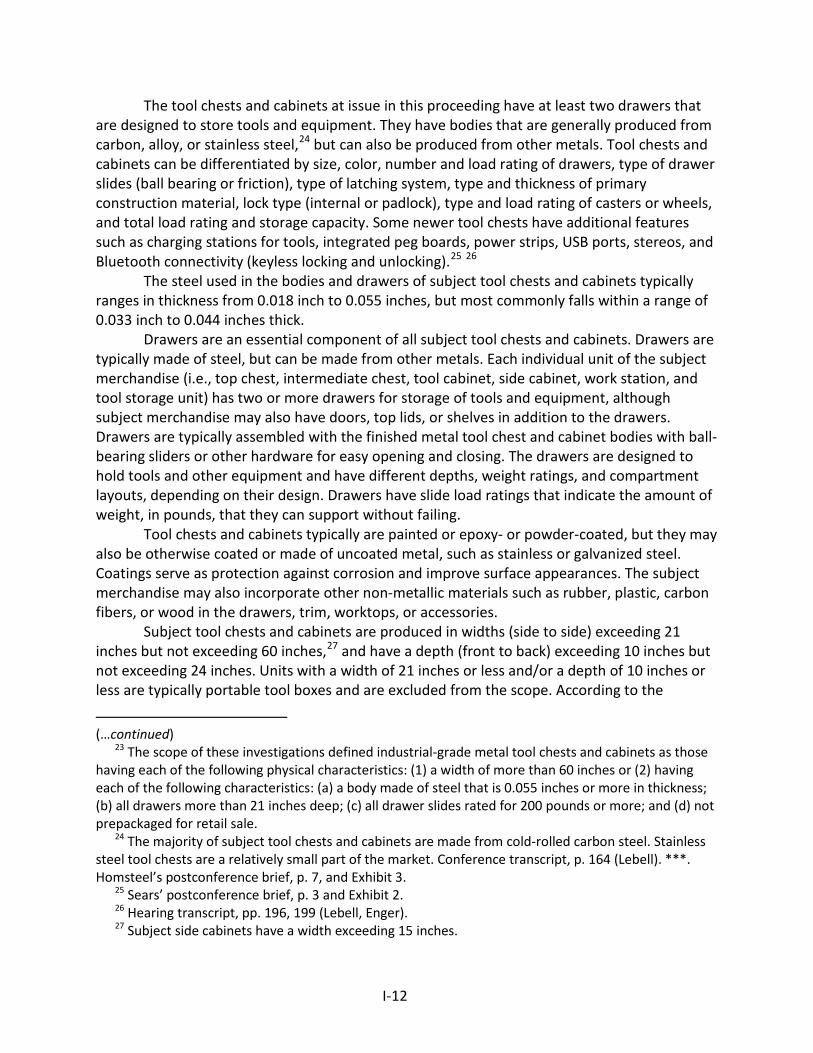
I-12
The tool chests and cabinets at issue in this proceeding have at least two drawers that are designed to store tools and equipment. They have bodies that are generally produced from carbon, alloy, or stainless steel,24 but can also be produced from other metals. Tool chests and cabinets can be differentiated by size, color, number and load rating of drawers, type of drawer slides (ball bearing or friction), type of latching system, type and thickness of primary construction material, lock type (internal or padlock), type and load rating of casters or wheels, and total load rating and storage capacity. Some newer tool chests have additional features such as charging stations for tools, integrated peg boards, power strips, USB ports, stereos, and Bluetooth connectivity (keyless locking and unlocking).25 26
The steel used in the bodies and drawers of subject tool chests and cabinets typically ranges in thickness from 0.018 inch to 0.055 inches, but most commonly falls within a range of 0.033 inch to 0.044 inches thick.
Drawers are an essential component of all subject tool chests and cabinets. Drawers are typically made of steel, but can be made from other metals. Each individual unit of the subject merchandise (i.e., top chest, intermediate chest, tool cabinet, side cabinet, work station, and tool storage unit) has two or more drawers for storage of tools and equipment, although subject merchandise may also have doors, top lids, or shelves in addition to the drawers. Drawers are typically assembled with the finished metal tool chest and cabinet bodies with ball-bearing sliders or other hardware for easy opening and closing. The drawers are designed to hold tools and other equipment and have different depths, weight ratings, and compartment layouts, depending on their design. Drawers have slide load ratings that indicate the amount of weight, in pounds, that they can support without failing.
Tool chests and cabinets typically are painted or epoxy- or powder-coated, but they may also be otherwise coated or made of uncoated metal, such as stainless or galvanized steel. Coatings serve as protection against corrosion and improve surface appearances. The subject merchandise may also incorporate other non-metallic materials such as rubber, plastic, carbon fibers, or wood in the drawers, trim, worktops, or accessories.
Subject tool chests and cabinets are produced in widths (side to side) exceeding 21 inches but not exceeding 60 inches,27 and have a depth (front to back) exceeding 10 inches but not exceeding 24 inches. Units with a width of 21 inches or less and/or a depth of 10 inches or less are typically portable tool boxes and are excluded from the scope. According to the
(…continued)
23 The scope of these investigations defined industrial-grade metal tool chests and cabinets as those having each of the following physical characteristics: (1) a width of more than 60 inches or (2) having each of the following characteristics: (a) a body made of steel that is 0.055 inches or more in thickness; (b) all drawers more than 21 inches deep; (c) all drawer slides rated for 200 pounds or more; and (d) not prepackaged for retail sale.
24 The majority of subject tool chests and cabinets are made from cold-rolled carbon steel. Stainless steel tool chests are a relatively small part of the market. Conference transcript, p. 164 (Lebell). ***. Homsteel’s postconference brief, p. 7, and Exhibit 3.
25 Sears’ postconference brief, p. 3 and Exhibit 2. 26 Hearing transcript, pp. 196, 199 (Lebell, Enger). 27 Subject side cabinets have a width exceeding 15 inches.
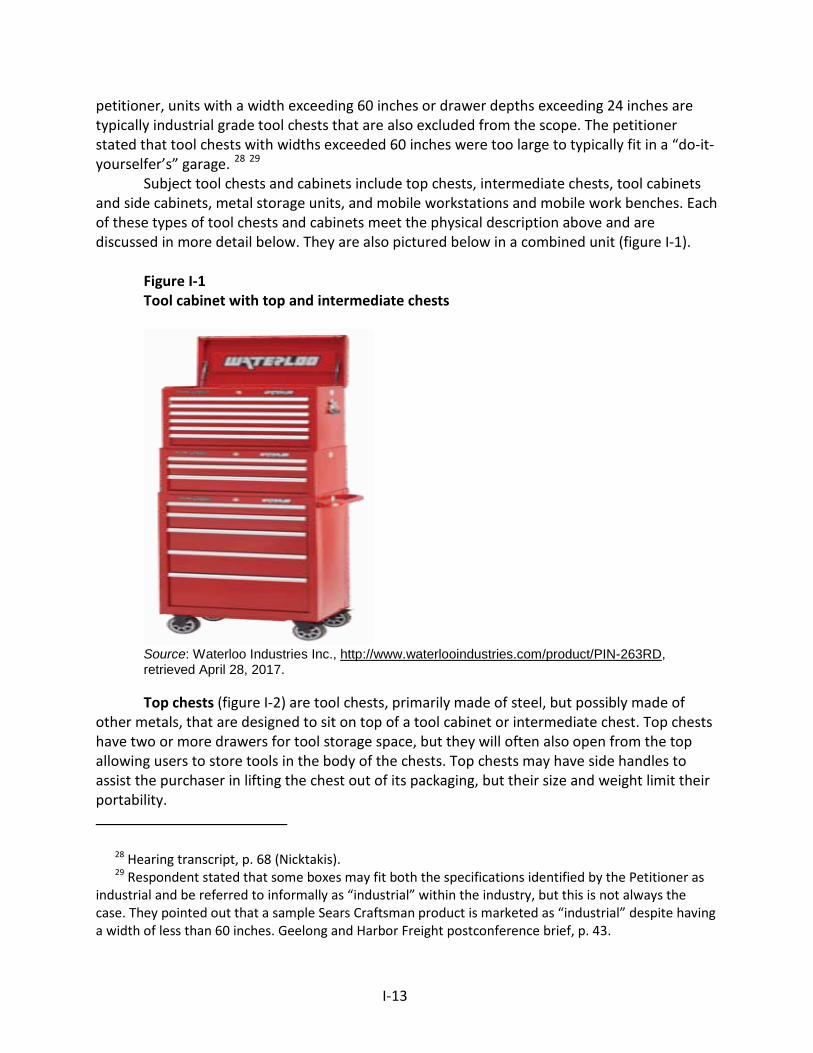
I-13
petitioner, units with a width exceeding 60 inches or drawer depths exceeding 24 inches are typically industrial grade tool chests that are also excluded from the scope. The petitioner stated that tool chests with widths exceeded 60 inches were too large to typically fit in a “do-it-yourselfer’s” garage. 28 29
Subject tool chests and cabinets include top chests, intermediate chests, tool cabinets and side cabinets, metal storage units, and mobile workstations and mobile work benches. Each of these types of tool chests and cabinets meet the physical description above and are discussed in more detail below. They are also pictured below in a combined unit (figure I-1).
Figure I-1 Tool cabinet with top and intermediate chests
Source: Waterloo Industries Inc., http://www.waterlooindustries.com/product/PIN-263RD, retrieved April 28, 2017. Top chests (figure I-2) are tool chests, primarily made of steel, but possibly made of
other metals, that are designed to sit on top of a tool cabinet or intermediate chest. Top chests have two or more drawers for tool storage space, but they will often also open from the top allowing users to store tools in the body of the chests. Top chests may have side handles to assist the purchaser in lifting the chest out of its packaging, but their size and weight limit their portability.
28 Hearing transcript, p. 68 (Nicktakis). 29 Respondent stated that some boxes may fit both the specifications identified by the Petitioner as
industrial and be referred to informally as “industrial” within the industry, but this is not always the case. They pointed out that a sample Sears Craftsman product is marketed as “industrial” despite having a width of less than 60 inches. Geelong and Harbor Freight postconference brief, p. 43.
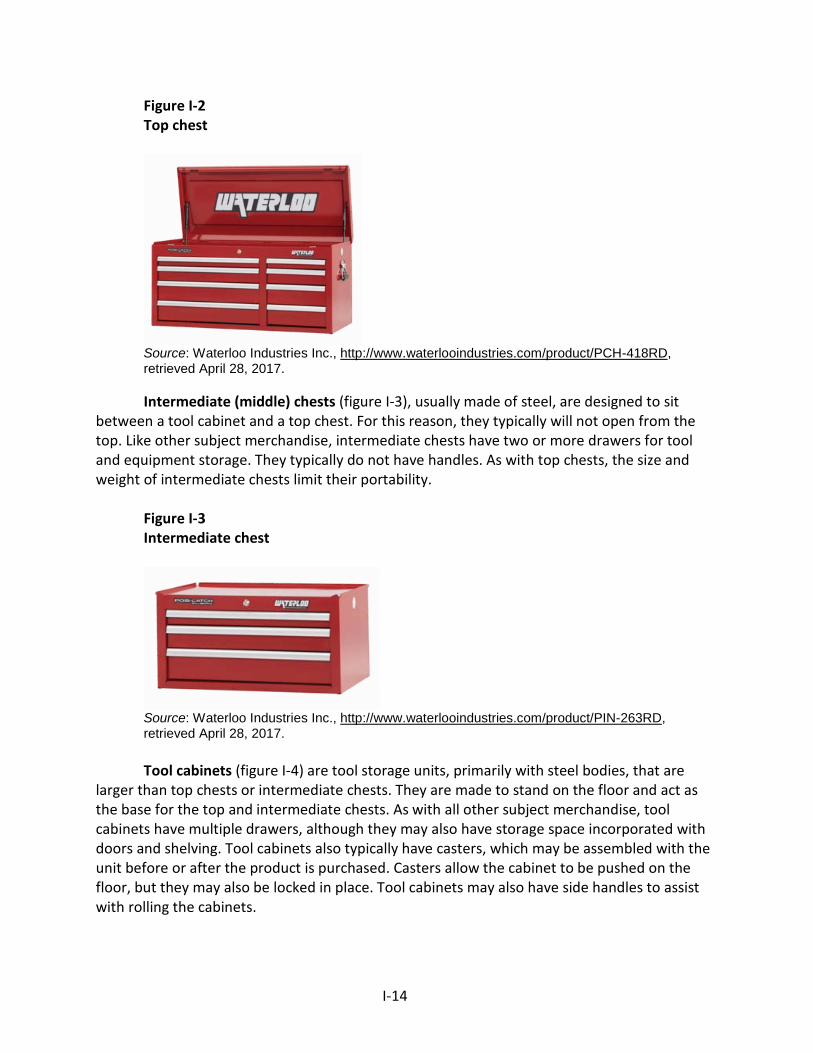
I-14
Figure I-2 Top chest
Source: Waterloo Industries Inc., http://www.waterlooindustries.com/product/PCH-418RD, retrieved April 28, 2017. Intermediate (middle) chests (figure I-3), usually made of steel, are designed to sit
between a tool cabinet and a top chest. For this reason, they typically will not open from the top. Like other subject merchandise, intermediate chests have two or more drawers for tool and equipment storage. They typically do not have handles. As with top chests, the size and weight of intermediate chests limit their portability.
Figure I-3 Intermediate chest
Source: Waterloo Industries Inc., http://www.waterlooindustries.com/product/PIN-263RD, retrieved April 28, 2017. Tool cabinets (figure I-4) are tool storage units, primarily with steel bodies, that are
larger than top chests or intermediate chests. They are made to stand on the floor and act as the base for the top and intermediate chests. As with all other subject merchandise, tool cabinets have multiple drawers, although they may also have storage space incorporated with doors and shelving. Tool cabinets also typically have casters, which may be assembled with the unit before or after the product is purchased. Casters allow the cabinet to be pushed on the floor, but they may also be locked in place. Tool cabinets may also have side handles to assist with rolling the cabinets.
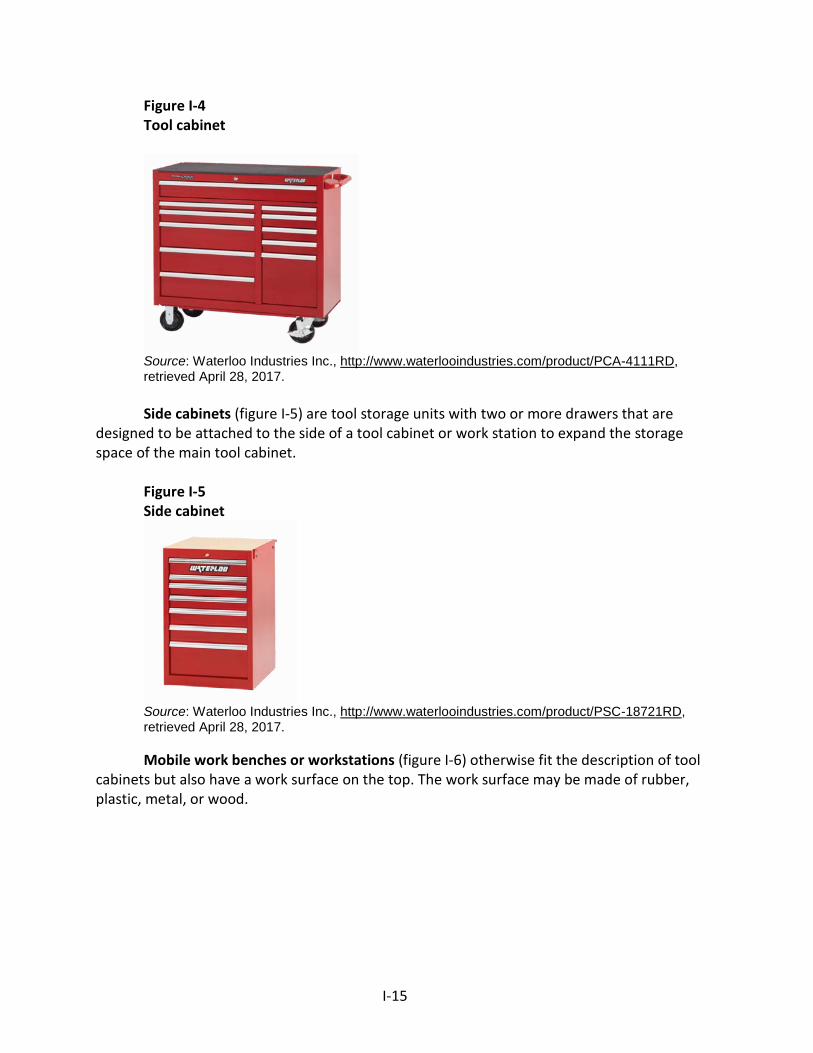
I-15
Figure I-4 Tool cabinet
Source: Waterloo Industries Inc., http://www.waterlooindustries.com/product/PCA-4111RD, retrieved April 28, 2017. Side cabinets (figure I-5) are tool storage units with two or more drawers that are
designed to be attached to the side of a tool cabinet or work station to expand the storage space of the main tool cabinet.
Figure I-5 Side cabinet
Source: Waterloo Industries Inc., http://www.waterlooindustries.com/product/PSC-18721RD, retrieved April 28, 2017. Mobile work benches or workstations (figure I-6) otherwise fit the description of tool
cabinets but also have a work surface on the top. The work surface may be made of rubber, plastic, metal, or wood.
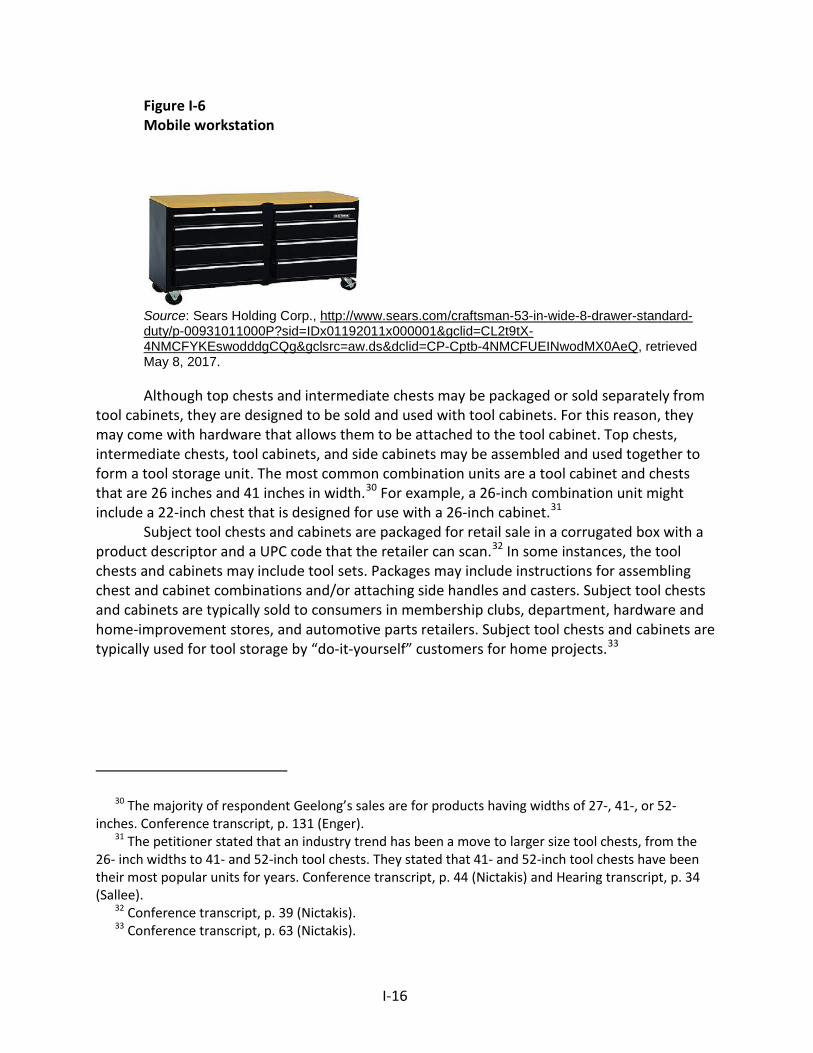
I-16
Figure I-6 Mobile workstation
Source: Sears Holding Corp., http://www.sears.com/craftsman-53-in-wide-8-drawer-standard-duty/p-00931011000P?sid=IDx01192011x000001&gclid=CL2t9tX-4NMCFYKEswodddgCQg&gclsrc=aw.ds&dclid=CP-Cptb-4NMCFUEINwodMX0AeQ, retrieved May 8, 2017. Although top chests and intermediate chests may be packaged or sold separately from
tool cabinets, they are designed to be sold and used with tool cabinets. For this reason, they may come with hardware that allows them to be attached to the tool cabinet. Top chests, intermediate chests, tool cabinets, and side cabinets may be assembled and used together to form a tool storage unit. The most common combination units are a tool cabinet and chests that are 26 inches and 41 inches in width.30 For example, a 26-inch combination unit might include a 22-inch chest that is designed for use with a 26-inch cabinet.31
Subject tool chests and cabinets are packaged for retail sale in a corrugated box with a product descriptor and a UPC code that the retailer can scan.32 In some instances, the tool chests and cabinets may include tool sets. Packages may include instructions for assembling chest and cabinet combinations and/or attaching side handles and casters. Subject tool chests and cabinets are typically sold to consumers in membership clubs, department, hardware and home-improvement stores, and automotive parts retailers. Subject tool chests and cabinets are typically used for tool storage by “do-it-yourself” customers for home projects.33
30 The majority of respondent Geelong’s sales are for products having widths of 27-, 41-, or 52-inches. Conference transcript, p. 131 (Enger).
31 The petitioner stated that an industry trend has been a move to larger size tool chests, from the 26- inch widths to 41- and 52-inch tool chests. They stated that 41- and 52-inch tool chests have been their most popular units for years. Conference transcript, p. 44 (Nictakis) and Hearing transcript, p. 34 (Sallee).
32 Conference transcript, p. 39 (Nictakis). 33 Conference transcript, p. 63 (Nictakis).
I-17
Manufacturing processes34
In U.S. plants, production of subject tool chests is highly automated and most steps are performed with minimal amounts of manual labor until final assembly.35 Subject tool chests are typically produced to standard sizes and configurations and are usually made in large production runs36 both to increase production efficiency and minimize the downtime required to reconfigure production equipment between production batches.37 38 Producers that use automated production processes typically operate separate lines for different sizes of tool chests. The petitioner produces 26-inch wide tool chests on one production line and 40- and 52-inch wide tool chests on a separate line.39 The petitioner stated that it can produce other sizes of tool chests, like 32-inch wide tool chests, but those would be made manually and production costs would be higher than those produced on automated equipment.40 41
The production process typically begins with the slitting coils of cold-rolled, flat-rolled carbon steel42 and/or stainless steel43 into widths suitable for forming the panels and drawers of tool chests and cabinets.44 The thickness of the coiled steel varies depending on the design and level of durability required for the individual chest or cabinet as well as the individual piece (i.e., drawer or chest and cabinet unit) that will be produced. The thicknesses may range from 0.018 inch to 0.055 inches but most commonly fall within a range of 0.033 inch to 0.044 inches.
34 Unless otherwise indicated, information in this section was compiled from the petition, pp. 7-8. 35 Staff fieldwork and interview with ***. 36 ***. Staff fieldwork and interview with ***. 37 Staff fieldwork and interview with ***. 38 Industrial tool chests tend to be more customized and are produced in smaller quantities on
separate production lines. Staff fieldwork and interview with ***. 39 Hearing transcript, pp. 86-87 (Nictakis). 40 Hearing transcript, pp. 131-132 (Nictakis). 41 The petitioner stated that the costs to reconfigure an automated production line to produce a
different size tool chest include $30,000-$50,000 for a new die used to form parts and “seven figures” for a new automated welding line. Hearing transcript, p. 133 (Nictakis).
42 According to its website, Waterloo purchases 100 percent of its cold-rolled steel from U.S. steel mills. Steel is the largest component of their products, accounting for about 40 percent of the total cost of its products. Waterloo Industries Inc., http://www.waterlooindustries.com/about-waterloo/made-in-usa, retrieved May 2, 2017. ***. Petitioner’s posthearing brief, Exhibit 1, p. 3.
43 Subject tool chests and cabinets made from carbon or stainless steel can be produced with the same equipment. Waterloo stated that it has the capability to produce stainless steel tool chests at its plant in Missouri but it did not produce them during the period of investigation because customers were unwilling to pay the higher prices of stainless steel products. Petitioner’s prehearing brief, Exhibit 3, p. 2.
Producing stainless steel tool chests and cabinets is more labor intensive because materials need to be protected to avoid scratching, and welding and finishing work is more detailed than in carbon-steel tool chests and cabinets. Conference transcript, p. 156 (Lebell).
44 The process may also begin with flat sheets that have already been cut from coils, but most modern U.S. production facilities cut their own sheets from coils.

I-18
The coils are slit to various widths depending on the part that will be produced from the slit steel.
The slit steel moves through various processes to produce the component parts of the cabinets and chests (body panels, drawers, dividers, etc.). First, the steel is fed into a series of presses and punch machines where it is cut to size, punched, and bent into various shapes necessary to create the components.45 Second, the various component pieces are welded together to form the drawers, bodies, lids, and other components of the chests and cabinets. Welding parts for subject tool chests can be automated because welds are made in the same spots for tool chests of the same size.46
The individual parts are then washed before being coated with paint, typically by one of two processes— either electro-coating (or "e-coating") or powder coating. E-coating involves electrically charging the metal parts and placing them in a bath of paint that holds the opposite charge. The parts are moved through the paint for a short period during which the paint adheres to the part. The part is then sprayed with a clear coat and is cured in an oven. Powder coating also involves electrically charging the parts and the coating with opposite charges, but the coating is a dry powder that is sprayed on.47
Once the components are painted, the parts are assembled by hand into finished tool chests and cabinets. Ball bearing slides, casters, drawer pulls, name plates, and rubber mats and other hardware and accessories are incorporated into the product at the assembly stage or are packaged together with the tool chests and cabinets.48 Lastly, the finished tool chests and cabinets are packaged in corrugated boxes and labeled for retail sale before they leave the factory floor.49
***.50 The petitioner produces nonsubject industrial tool chests and cabinets at the same plant
that it produces subject tool chests and cabinets but with different manufacturing equipment.51
45 Presses are fitted with custom dies that form the steel into the desired parts and are capable of high-volume production runs. ***. This process is sometimes referred to as “hard tooling.” Hearing transcript, pp. 67-68 (Nictakis). Parts for industrial tool chests are typically made in small production runs using laser cutting machines. By contrast, the process is slower and more labor intensive than that used for retail tool chests and the equipment is capable of producing much larger parts than auto presses. Staff fieldwork and interview with ***.
46 By contrast, welding parts for industrial tool chests is labor intensive and performed primarily by workers using handheld tools. Weld spots differ depending on how the tool chest is configured, so more time is involved in this step compared to that for subject tool chests. ***. Staff fieldwork and interview with ***.
47 ***. Staff fieldwork and interview with ***. 48 The petitioner stated that at its plant, 22 employees assemble about 100 subject tool chests per
hour, in contrast 26-27 employees assemble five nonsubject industrial tool chests per hour. Hearing transcript, p. 59 (Nicktakis).
49 Petitioner’s postconference brief, p. 4. 50 ***. 51 Conference transcript, p. 22 (Nictakis).
I-19
The petitioner stated that manufacturing industrial tool chests requires different welding and painting equipment than subject tool chests, and different employees weld and assemble these products.52 53 The petitioner stated that portable tool boxes and tool chests are produced on different equipment, through different processes, and by different employees54 than subject tool chests.55
DOMESTIC LIKE PRODUCT ISSUES
In the preliminary phase of these investigations, the Commission noted that “{d}omestic producers generally reported that the products were not comparable for most of the like product factors, while importers more often found industrial tool chests and, to a lesser extent, portable tool boxes, to be comparable to the in-scope product. The record generally indicates that out-of-scope industrial metal tool chests and, to a lesser extent, portable metal tool boxes, are similar in some respects but different in others to in-scope tool chests and cabinets. Based on the current record we do not define the domestic like product more broadly than the scope. However, we will reconsider this issue in any final phase investigations.”56 The Commission’s decision regarding the appropriate domestic product(s) that are “like” the subject imported product is based on a number of factors including: (1) physical characteristics and uses; (2) common manufacturing facilities and production employees; (3) interchangeability; (4) customer and producer perceptions; (5) channels of distribution; and (6) price.
Petitioner concurs with the Commission’s six factor like product test to determine in-scope retail tool chests and out of scope industrial tool chests.57 58 In addition, petitioner
52 Conference transcript, p. 42 (Nictakis). 53 The Petitioner stated that they have dedicated space and equipment for producing nonsubect
industrial tool chests and cabinets, but they have started cross-training their employees to be able to work on retail and industrial tool chests and cabinets production lines. They stated that this was primarily done to avoid laying off employees owing to declines in their sales volumes. Conference transcript, p. 47 (Nictakis).
54 ***. Staff fieldwork and interview with ***. 55 Petitioner’s postconference brief, p. 7. 56 Tool Chests and Cabinets from China and Vietnam, Investigation Nos. 701-TA-575 and 731-TA-
1360-1361 (Preliminary), USITC Publication 4697, June 2017, p. 11. 57 Petitioner’s prehearing brief, pp. 6-7. 58 According to the petitioner, industrial tool chests and tool cabinets are larger and heavier than
subject tool chests and tool cabinets, are produced from thicker gauge steel, have deeper drawers that are rated for much heavier loads, and are not packaged for retail sale. Industrial-grade tool chests are used for industrial tool storage, such as in automotive mechanic shops, and are designed to be serviced (repaired onsite). Industrial tool chests are also sold through different channels of distribution than subject tool chests and cabinets; they are sold directly to commercial distributors, professional garages, and other industrial establishments. Petitioner’s postconference brief, pp. 8-9.

I-20
argues the Commission limits the domestic like product test to facts on products produced and manufactured in the United States.59
Joint respondents assert that the domestic like product definition should be expanded to include out of scope industrial tool chests because a broader definition supports the market realities, which includes most producers’ production, and retailers’ product lines of steel tool chest and cabinets.60
Information regarding these factors, as they relate to in-scope and other (primarily industrial) tool chests and tool cabinets, is presented in table I-3 and discussed in Appendix D.
Table I-3 Tool chests and cabinets: Comparability of in-scope tool chests and cabinets to other tool chests and cabinets’ physical characteristics and uses, manufacturing facilities, interchangeability, customer and producer perceptions, and price
Product pair U.S. producers U.S. importers U.S. purchasers
F M S N F M S N F M S N Characteristics and uses --- --- 2 3 3 6 3 3 3 5 3 3 Interchangeability --- --- 2 3 3 3 6 3 5 2 5 2 Manufacuting, production 1 1 --- 2 6 4 2 1 4 2 4 1 Channels of distribution 1 --- --- 4 4 3 5 3 4 1 6 1 Customer and producer perceptions --- --- 2 3 3 2 6 4 3 3 3 3 Price --- --- 1 4 3 1 7 4 1 2 6 3
Source: Compiled from data submitted in response to Commission questionnaires.
Physical characteristics and uses
Producers (in-scope and non-retail), importers, and purchasers were asked to compare in-scope tool chests and cabinets with other tool chests and cabinets on the basis of the differences and similarities in physical characteristics and uses. Table I-3 summarizes their responses and Appendix D presents them in full.
Manufacturing facilities and production employees
Producers (in-scope and non-retail), importers, and purchasers were asked to compare
in-scope tool chests and cabinets with other tool chests and cabinets on the basis of whether the products are manufactured in the same facilities, from the same inputs, on the same machinery and equipment, and using the same employees. Table I-3 summarizes their responses and Appendix D presents them in full.
59 Petitioner’s prehearing brief, p. 6. 60 Joint Respondents’ prehearing brief, p. 3.

I-21
Interchangeability
Producers (in-scope and non-retail), importers, and purchasers were asked to compare in-scope tool chests and cabinets with other tool chests and cabinets on the basis of the ability to substitute the products in the same application. Table I-3 summarizes their responses and Appendix D presents them in full.
Customer and producer perceptions
Producers (in-scope and non-retail), importers and purchasers were asked to compare
in-scope tool chests and cabinets with other tool chests and cabinets on the basis of perceptions as to the differences and/or similarities in the products in the market. Table I-3 summarizes their responses and Appendix D presents them in full.
Channels of distribution
Producers (in-scope and non-retail), importers and purchasers were asked to compare
in-scope tool chests and cabinets with other tool chests and cabinets on the basis of the channels of distribution/market situation through which the products are sold. Table I-3 summarizes their responses and Appendix D presents them in full, while table I-4 presents a comparison of U.S. producers’ shipment volumes by channel.
Table I-4 Tool chests and cabinets: Channels of distribution, 2016
* * * * * * *
Price
Producers, importers, and purchasers were asked to compare in-scope tool chests and cabinets with other tool chests and cabinets on the basis of whether prices are comparable or differ between the products. Table I-3, summarizes their responses and Appendix D presents them in full. As shown in table I-5, the average unit value of U.S. producers’ tool chest is *** and for other types of tool chests and cabinets is ***.
Table I-5 Tool chests and cabinets: Average unit prices
* * * * * * *

II-1
PART II: CONDITIONS OF COMPETITION IN THE U.S. MARKET
U.S. MARKET CHARACTERISTICS
Tool chests and cabinets include top chests, intermediate chests, tool cabinets, side cabinets, mobile work benches, work stations, and metal storage units, and include two or more drawers per unit. They are typically manufactured from cold-rolled steel and may include drawers, trim, or other components.1 Tool chests and cabinets are prepackaged for retail sale and typically are placed in homes and garages and used for tool and equipment storage by consumers.2
Apparent U.S. consumption of tool chests and cabinets, measured in units, decreased between 2014 and 2016, but was higher in January-September 2017 than in January-September 2016. Apparent U.S. consumption increased from 2014 to 2015 (*** percent by quantity and *** percent by value) but decreased between 2015 and 2016 (*** percent by quantity and *** percent by value), and was markedly higher (*** percent by quantity and *** percent by value) in January-September 2017 than in January-September 2016.
U.S. PURCHASERS3 The Commission received usable purchaser’s questionnaire responses from 23 firms
including 3 that only purchased out-of-scope industrial tool chests.4 5 Thirteen responding purchasers are retailers, 8 are distributors, and 2 are importers. Responding U.S. purchasers were headquartered in all U.S. continental regions except the Mountain region, although the retailers may have branches across the country. The largest purchasers of tool chests and cabinets are retail home improvement and chain stores, the largest of which were *** and
1 Petition, Vol. I, pp. 1, 4. 2 Petition, Vol. I, p. 14. 3 Importers that imported for retail sales were asked to fill out the purchaser questionnaire.
Information in this section includes both the quantity these retailers purchased from producers and other importers as well as the quantity they imported.
Almost all of the responding purchasers (18 of 20) reported purchasing some U.S. product in 2014 through 2016. The *** firms that did not report U.S. purchases were ***.
4 Firms that purchased only industrial tool chests were also asked to fill out the purchaser questionnaire in order to compare subject tool chests with industrial tool chests. These purchasers’ (***) responses to the questionnaire questions other than the comparison of subject and industrial tool chests and cabinets have been removed.
5 Of the 20 responding purchasers, 14 purchased domestic tool chests and cabinets, 12 purchased or imported (and 14 directly imported) subject merchandise from China, 0 purchased imports (and 2 directly imported) subject merchandise from Vietnam, and 5 purchased imports (and 2 directly imported) tool chests and cabinets from other sources.
II-2
***.6 These *** purchasers combined accounted for *** percent of purchases and imports reported by purchasers between 2014 and 2016.
Fifteen purchasers reported purchasing relatively small volumes of out-of-scope tool chests and cabinets as well as in-scope tool chests and cabinets.7 *** accounted for nearly *** of the reported purchases of out-of-scope tool chests and cabinets.8 Since January 1, 2014 virtually all subject merchandise from Vietnam and the large majority of subject merchandise from China has been imported for retail sale to consumers rather than wholesalers, primarily by major big-box retailers.
CHANNELS OF DISTRIBUTION
As noted above, tool chests and cabinets are prepackaged for sale directly to
consumers, primarily through home improvement stores (e.g., Home Depot), club stores (e.g., Costco), hardware stores (e.g., Ace Hardware), other retail outlets (e.g., Sears), and online stores (e.g., Amazon).9 U.S. producers and importers of tool chest and cabinets from China and Vietnam sold mainly to retailers, or were themselves retailers (table II-1). Six large retailers (Costco, Harbor Freight, Home Depot, Lowe’s, Sears, and Walmart) accounted for approximately *** percent of imports reported by purchasers of product from China and Vietnam in 2016. Table II-1 Tool chests and cabinets: U.S. producers’ and importers’ U.S. commercial shipments, by sources and channels of distribution, 2014-16, January-September 2016, and January-September 2017
* * * * * * *
GEOGRAPHIC DISTRIBUTION U.S. producers and importers of tool chests and cabinets from China and Vietnam
reported selling to all regions in the United States (table II-2). For U.S. producers, *** percent of sales were within 100 miles of their production facility, *** percent were between 101 and 1,000 miles, and *** percent were over 1,000 miles. Importers sold 26 percent within 100 miles of their U.S. point of shipment, 28 percent between 101 and 1,000 miles, and 46 percent over 1,000 miles.
6 *** between 2014 and 2016. *** between 2014 and 2016. 7 This includes three firms that did not purchase subject tool chests and cabinets. The quantity of out-
of-scope product reported by purchasers was extremely small, accounting for only about *** percent of the combined in-scope and out-of-scope purchases.
8 Out-of-scope tool chests and cabinets represented *** total purchases and imports in 2014 through 2016.
9 Petition, Vol. I, p. 15.
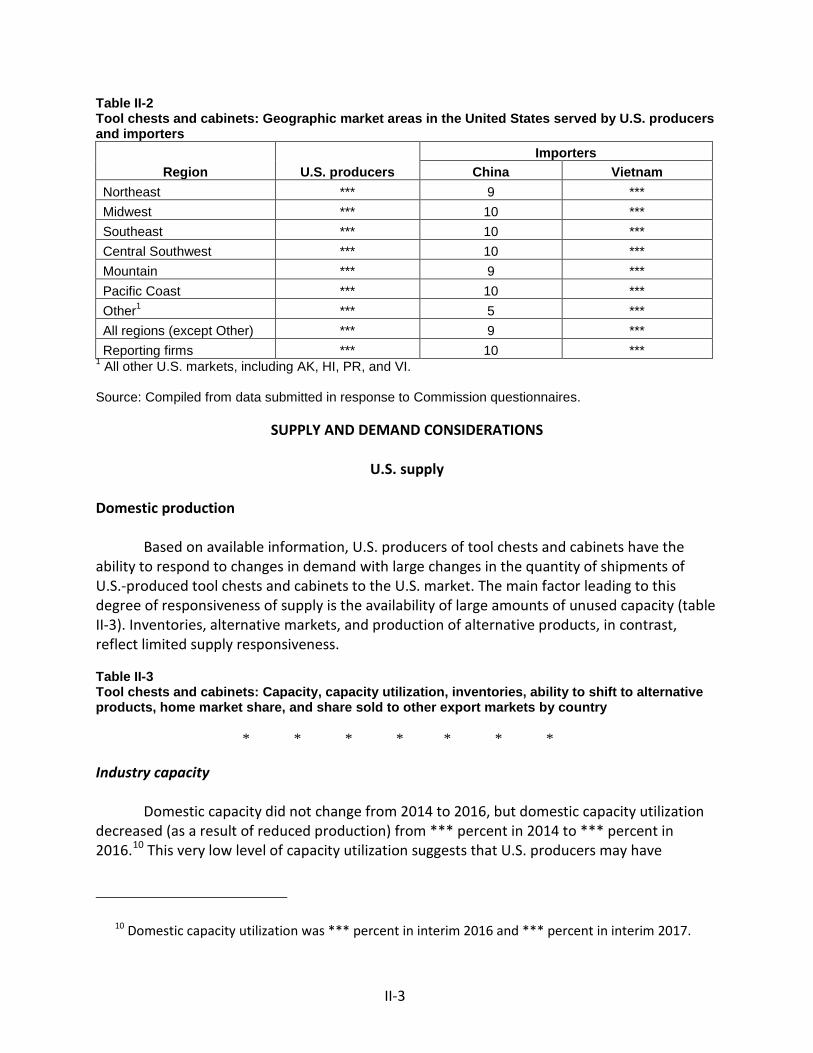
II-3
Table II-2 Tool chests and cabinets: Geographic market areas in the United States served by U.S. producers and importers
Region U.S. producers Importers
China Vietnam Northeast *** 9 *** Midwest *** 10 *** Southeast *** 10 *** Central Southwest *** 10 *** Mountain *** 9 *** Pacific Coast *** 10 *** Other1 *** 5 *** All regions (except Other) *** 9 *** Reporting firms *** 10 ***
1 All other U.S. markets, including AK, HI, PR, and VI. Source: Compiled from data submitted in response to Commission questionnaires.
SUPPLY AND DEMAND CONSIDERATIONS
U.S. supply Domestic production
Based on available information, U.S. producers of tool chests and cabinets have the
ability to respond to changes in demand with large changes in the quantity of shipments of U.S.-produced tool chests and cabinets to the U.S. market. The main factor leading to this degree of responsiveness of supply is the availability of large amounts of unused capacity (table II-3). Inventories, alternative markets, and production of alternative products, in contrast, reflect limited supply responsiveness. Table II-3 Tool chests and cabinets: Capacity, capacity utilization, inventories, ability to shift to alternative products, home market share, and share sold to other export markets by country
* * * * * * * Industry capacity
Domestic capacity did not change from 2014 to 2016, but domestic capacity utilization
decreased (as a result of reduced production) from *** percent in 2014 to *** percent in 2016.10 This very low level of capacity utilization suggests that U.S. producers may have
10 Domestic capacity utilization was *** percent in interim 2016 and *** percent in interim 2017.

II-4
substantial ability to increase production of tool chests and cabinets in response to an increase in prices. Alternative markets
U.S. producers reported *** exports.
Inventory levels
Relative to total shipments, U.S. producers’ inventory levels decreased from *** percent
in 2014 to *** percent in 2016. These inventory levels suggest that U.S. producers may have limited ability to respond to changes in demand with changes in the quantity shipped from inventories. Production alternatives
*** responding U.S. producers reported the ability to switch production from tool
chests and cabinets to other products. Other products that reportedly can be produced on the same equipment as tool chests and cabinets are ***. Factors affecting the ability to shift production include relatively limited demand for these other products, and equipment that is designed to produce tool chests and cabinets. Subject imports from China11
Based on available information, producers of tool chests and cabinets from China have
the ability to respond to changes in demand with large changes in the quantity of shipments of tool chests and cabinets to the U.S. market. The main contributing factors to this degree of responsiveness of supply are the availability of large amounts of unused capacity, the ability to shift shipments from alternate markets, and the ability to shift production to or from alternate products (table II-3). Factors mitigating responsiveness of supply include limited inventories and limited home market shipments. Production alternatives
Responding foreign producers stated that they could switch production from tool chests
and cabinets to other products. Other products that responding foreign producers reportedly can produce on the same equipment as tool chests and cabinets are other storage cabinets (safety cabinets, job site box, safes, racks, garage storage cabinets); work benches (work table without drawer and saw horse); low voltage lighting; grills; office furniture; trash cans; trailer
11 For data on the number of responding foreign firms and their share of U.S. imports from China, please refer to Part I, “Summary Data and Data Sources.”
II-5
dollies; saw stands; sheet metal products; and various machines (including motors, saws, drill press, cement mixers, dust collectors, chipper shredders, tillers, edgers, and chicken pluckers). Factors limiting foreign producers’ ability to shift production include the down time and retooling required when changing products. Subject imports from Vietnam12
Based on available information, the producer of tool chests and cabinets from Vietnam
has the ability to respond to changes in demand with moderate-to-large changes in the quantity of shipments of tool chests and cabinets to the U.S. market. The main contributing factors to this degree of responsiveness of supply are the availability of unused capacity and growing capacity (table II-3). Factors mitigating responsiveness of supply include low inventories, and a relatively small share sold in other markets. Production alternatives
Responding Vietnamese producers stated that they could switch production from tool
chests and cabinets to other products. Other products that responding foreign producers reportedly can produce on the same equipment as tool chests and cabinets are ***. Nonsubject imports
Nonsubject imports accounted for less than 1 percent of total U.S. imports in 2016. The
largest source of nonsubject imports during 2014-16 was Canada.13 New suppliers
Only one of 19 responding purchasers indicated that new suppliers entered the U.S.
market since January 1, 2014. It listed Waterloo and Metal Box as new suppliers.
U.S. demand Based on available information, the overall demand for tool chests and cabinets is likely
to experience small-to-moderate changes in response to changes in price. The main contributing factors are the somewhat limited range of substitute products, the discretionary nature of the purchase, and moderate cost share of a consumer’s budget. Because of the long useful life of most tool boxes consumers may delay purchases of new tool boxes. Purchasers may also elect to purchase less expensive add-on units to attach to existing tool chests and
12 For data on the number of responding foreign firms and their share of U.S. imports from Vietnam, please refer to Part I, “Summary Data and Data Sources.”
13 Conference transcript, p. 166 (Enger).

II-6
cabinets rather than purchasing a new larger basic unit. Finally, purchasers may adjust to increased prices by purchasing smaller tool chests and cabinets or by purchasing tool chests and cabinets products with less expensive features. End uses
Tool chests and cabinets are final goods typically used for tool storage in homes
(including workshops and garages); although they may also be used in industrial applications (such as mechanics, technicians, offices, salons, light commercial, farms, and restaurants); and in institutions (such as schools and hospitals). Tool chests and cabinets are used to hold tools such as those used for household repair, construction projects, and automobile repairs. They are also used in non-traditional settings, in shops, in retail store fronts, for storage, for cash registers, in hospitals, in doctors' offices, and in tattoo parlors.14 Tool chests and cabinets also are used to hold parts or components for working with the tools, as well as for storage of other household items, as a work surface or space, a charging station, and to hold other small products such as jewelry or collections.
Tool chests typically are used for a number of years. Inexpensive tool chests may break and need replacement within a few years, while better quality tool chests are more likely to be replaced when the number of tools becomes too large for the original box, or when a family moves to a larger home.15 Tool chests may rust and purchasers may also replace tool chests if the purchaser wants features that are not included in the old tool chest.16 Business cycles and conditions of competition
*** responding U.S. producers, 12 of 18 importers, and 7 of 20 purchasers indicated
that the market was subject to business cycles or distinct conditions of competition. Purchases were reported to vary over the course of the year, with increased purchases for Father’s Day and during the Christmas holiday season.17 Firms were asked if there had been changes in the business cycles or conditions of competition since January 2014. *** U.S. producers, 9 of 14 importers, and 3 of 10 purchasers reported changes in the conditions including: the growth of “dumped” imports; reduced number of Sears stores and Sears’ selling off its Craftsman18 brand;
14 Hearing transcript, p. 238 (Lebell). 15 Conference transcript, pp. 60, 149-151 (Nictakis, Enger, Lebell, and Grela). 16 Hearing transcript, pp. 236-237 (Fiscus). 17 Conference transcript, pp. 57-58 (Nictakis). 18 Sears and Stanley Black & Decker announced Sears’ sale of the Craftsman brand to Stanley Black &
Decker on January 5, 2017. Under this agreement Stanley Black & Decker, has “the rights to develop, manufacture and sell Craftsman-branded products in non-Sears Holdings retail, industrial and online sales channels across the U.S. and in other countries.” “Sears Holdings will continue to offer Craftsman-branded products, sourced from existing suppliers, through its current retail channels via a perpetual license from Stanley Black & Decker,” royalty free for 15 years. http://swkcraftsman.transactionannouncement.com/wp-content/uploads/2017/01/Stanley-Black-
(continued...)
II-7
increased price and feature shopping due to Amazon’s presence; and increasing demand due to the expanding U.S. economy.
Sears
Purchasers were asked if competition from Sears had changed since January 1, 2014 and how this had affected competition in the tool chests and cabinets market. Producers and importers were asked if the financial difficulties of any particular large retailer had affected their tool chest and cabinets business. *** responding producers reported that the financial difficulties of any specific retailer had not affected the market.19 In contrast, 9 of 15 responding importers, and 5 of 10 responding purchasers, reported that they had. ***. Other responses included: the closing of Sears locations has caused consumers to shift purchase to other retailers; Sears’ difficulties make it difficult for its suppliers to get accounts receivable insurance; Sears’ decline has led to declines in Waterloo’s business because Waterloo had not adjusted to the changing market; and the catalogue and mail order business through Sears has declined and has been replaced by increased direct sales by other firms.
Petitioner claims that the decline in Sears’ tool chest sales does not explain the difficulties faced by the U.S. producers since they were “actively trying to sell to multiple buyers during the period.”20 In addition, it asserts that Sears’ sales of tool chests fell more than sales of other products because other retailers had lower priced imported tool chests and cabinets.21 Petitioner calculates that Sears’ purchases ***.22 In addition, petitioner claims that the reduction in Sears’ sales of tool chests and cabinets was at least in part due to the lower price for similar products offered by retailers that import tool chests and cabinets,23 consumer purchases are driven by price,24 and Waterloo has had to cut its prices to Sears on average *** between 2014 and 2016 because of this competition.25
Respondents claim that the decline in purchases by Sears is directly related to the decline in Waterloo’s production because Sears purchased the majority of the tool chests and cabinets that Waterloo produced.26 27 They assert that Waterloo has a history of “foregoing
(…continued) Decker-Reaches-Agreement-To-Purchase-Craftsman-Brand-From-Sears-Holdings.pdf, retrieved November 13, 2017.
19 Between 2014 and 2016, ***’s purchases of ***. During this same period, ***’s production ***, while purchases by *** as a share of all ***’s production ***.
20 Hearing transcript, p. 17 (Cannon). 21 Hearing transcript, pp. 52-53 (Cannon). 22 Petitioner’s posthearing brief, p. 5. 23 Petitioner’s posthearing brief, p. 5. 24 Petitioner’s posthearing brief, p. 9. 25 Petitioner’s posthearing brief, p. 12. 26 Hearing transcript, p. 144 (Enger). “A more compelling alternative explanation to the alleged
deterioration in the financial performance of the domestic industry is declining U.S. purchases by Sears.” Sears’ posthearing brief, p. 2.
27 Sears’ sales in tool storage ***. Sears’ posthearing brief, p. 3.
II-8
opportunities to partner with other customers.”28 In addition, they allege that Waterloo failed to bid on certain lines for Sears, which caused Sears purchase these lines elsewhere.29 Respondents also stated that innovation is a key factor in sales of tool chests and cabinets, and waterloo’s failure to innovate drove declining sales.30 Sears reports that its purchases of imports were not driven by price but by Waterloo’s unwillingness to provide the product specifications that it wanted.31 Online sales
*** producers and 8 of 14 responding importers reported that the shift to increased
online retail sales has not affected their tool chest and cabinets business. The remaining importers reported the following effects of online sales: the burden of warehousing, distribution, and service has shifted to importers and distributors; increased packaging strength; increased innovation, quality, and brand building; and increases in *** overall sales.
While Waterloo stated that online sales of tool chest and cabinets play an insignificant place in the tool chests and cabinets business,32 respondents respond that online sales have had an impact. Respondents claim that consumers research tool chests on line, online sales allow firms to expand the assortment of tool chests without requiring additional floor space in stores, and online purchases have been growing by 15 to 30 percent in some tool chests and cabinets categories.33 Geelong reports both increasing the number of products it produces and numerous improvements in packaging in response to the growth of online sales.34 Demand trends
A plurality of firms reported an increase in U.S. demand for tool chests and cabinets
since January 1, 2014 (table II-4). Demand increases were reportedly driven by more home improvement projects, the economic recovery, increased product selection from imports, increased availability of lower price tool chests and cabinets, a trend toward “man caves”, increased advertising by more retailers, and increases in home building and sales. Demand was also reported to have increased for larger sized tool chests and cabinets. Firms reporting decreased demand cited economic stagnation; the increased availability of substitute storage units; declining demand from the farming, mechanical, and industrial sectors; and homeowners no longer able or wanting to do their own repairs.
28 Hearing transcript, pp. 145-146 (Enger, Fiscus). 29 Sears reports that ***. Sears’ posthearing brief, p. 2. 30 Hearing transcript, p. 147 (Enger). 31 Sears’ posthearing brief, p. 4. 32 Hearing transcript, p. 79 (Liss). 33 Hearing transcript, pp. 182-185 (Enger, Spooner, Moyer). 34 Joint respondents’ posthearing brief, Attachment A, pp. 17-21.
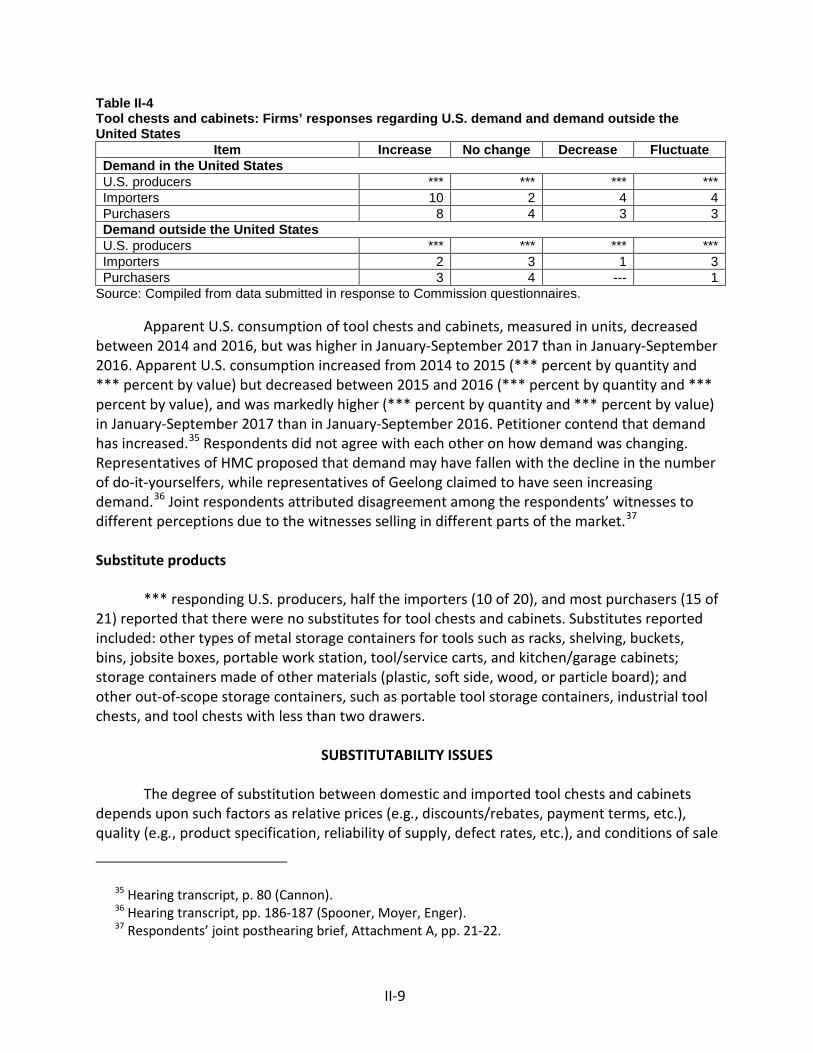
II-9
Table II-4 Tool chests and cabinets: Firms’ responses regarding U.S. demand and demand outside the United States
Item Increase No change Decrease Fluctuate Demand in the United States U.S. producers *** *** *** *** Importers 10 2 4 4 Purchasers 8 4 3 3 Demand outside the United States U.S. producers *** *** *** *** Importers 2 3 1 3 Purchasers 3 4 --- 1
Source: Compiled from data submitted in response to Commission questionnaires.
Apparent U.S. consumption of tool chests and cabinets, measured in units, decreased between 2014 and 2016, but was higher in January-September 2017 than in January-September 2016. Apparent U.S. consumption increased from 2014 to 2015 (*** percent by quantity and *** percent by value) but decreased between 2015 and 2016 (*** percent by quantity and *** percent by value), and was markedly higher (*** percent by quantity and *** percent by value) in January-September 2017 than in January-September 2016. Petitioner contend that demand has increased.35 Respondents did not agree with each other on how demand was changing. Representatives of HMC proposed that demand may have fallen with the decline in the number of do-it-yourselfers, while representatives of Geelong claimed to have seen increasing demand.36 Joint respondents attributed disagreement among the respondents’ witnesses to different perceptions due to the witnesses selling in different parts of the market.37 Substitute products
*** responding U.S. producers, half the importers (10 of 20), and most purchasers (15 of
21) reported that there were no substitutes for tool chests and cabinets. Substitutes reported included: other types of metal storage containers for tools such as racks, shelving, buckets, bins, jobsite boxes, portable work station, tool/service carts, and kitchen/garage cabinets; storage containers made of other materials (plastic, soft side, wood, or particle board); and other out-of-scope storage containers, such as portable tool storage containers, industrial tool chests, and tool chests with less than two drawers.
SUBSTITUTABILITY ISSUES
The degree of substitution between domestic and imported tool chests and cabinets
depends upon such factors as relative prices (e.g., discounts/rebates, payment terms, etc.), quality (e.g., product specification, reliability of supply, defect rates, etc.), and conditions of sale
35 Hearing transcript, p. 80 (Cannon). 36 Hearing transcript, pp. 186-187 (Spooner, Moyer, Enger). 37 Respondents’ joint posthearing brief, Attachment A, pp. 21-22.
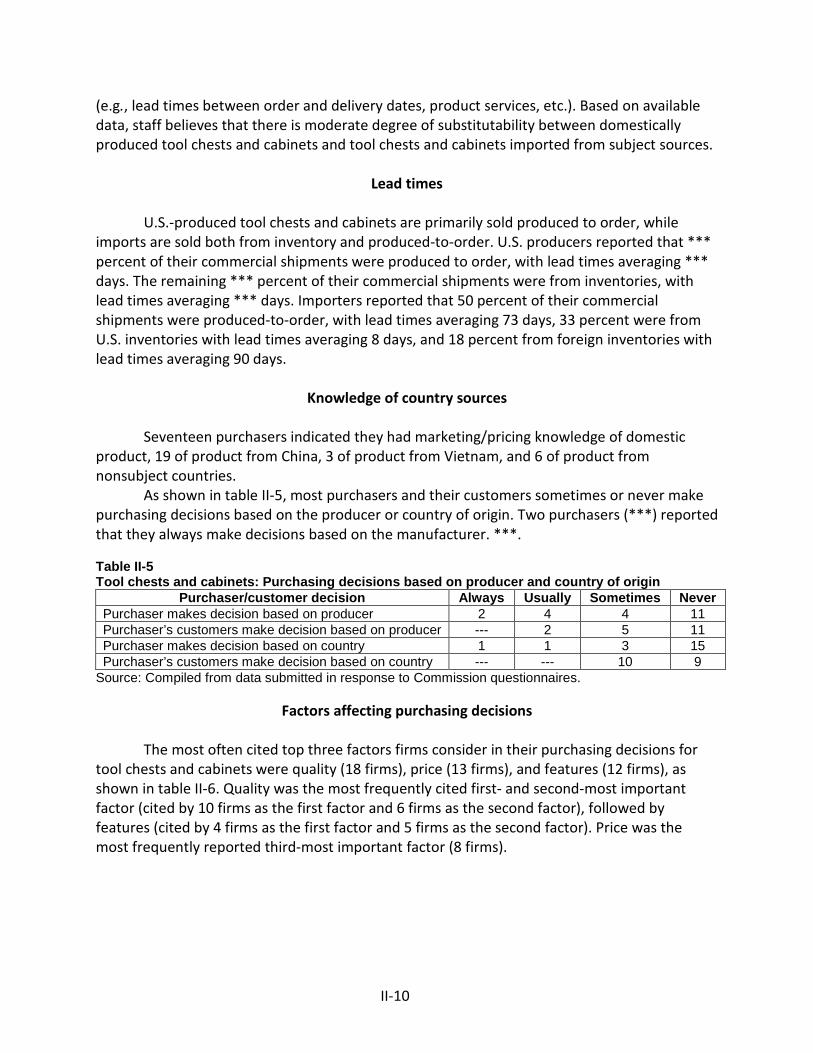
II-10
(e.g., lead times between order and delivery dates, product services, etc.). Based on available data, staff believes that there is moderate degree of substitutability between domestically produced tool chests and cabinets and tool chests and cabinets imported from subject sources.
Lead times
U.S.-produced tool chests and cabinets are primarily sold produced to order, while
imports are sold both from inventory and produced-to-order. U.S. producers reported that *** percent of their commercial shipments were produced to order, with lead times averaging *** days. The remaining *** percent of their commercial shipments were from inventories, with lead times averaging *** days. Importers reported that 50 percent of their commercial shipments were produced-to-order, with lead times averaging 73 days, 33 percent were from U.S. inventories with lead times averaging 8 days, and 18 percent from foreign inventories with lead times averaging 90 days.
Knowledge of country sources
Seventeen purchasers indicated they had marketing/pricing knowledge of domestic
product, 19 of product from China, 3 of product from Vietnam, and 6 of product from nonsubject countries.
As shown in table II-5, most purchasers and their customers sometimes or never make purchasing decisions based on the producer or country of origin. Two purchasers (***) reported that they always make decisions based on the manufacturer. ***. Table II-5 Tool chests and cabinets: Purchasing decisions based on producer and country of origin
Purchaser/customer decision Always Usually Sometimes Never Purchaser makes decision based on producer 2 4 4 11 Purchaser’s customers make decision based on producer --- 2 5 11 Purchaser makes decision based on country 1 1 3 15 Purchaser’s customers make decision based on country --- --- 10 9
Source: Compiled from data submitted in response to Commission questionnaires.
Factors affecting purchasing decisions The most often cited top three factors firms consider in their purchasing decisions for
tool chests and cabinets were quality (18 firms), price (13 firms), and features (12 firms), as shown in table II-6. Quality was the most frequently cited first- and second-most important factor (cited by 10 firms as the first factor and 6 firms as the second factor), followed by features (cited by 4 firms as the first factor and 5 firms as the second factor). Price was the most frequently reported third-most important factor (8 firms).
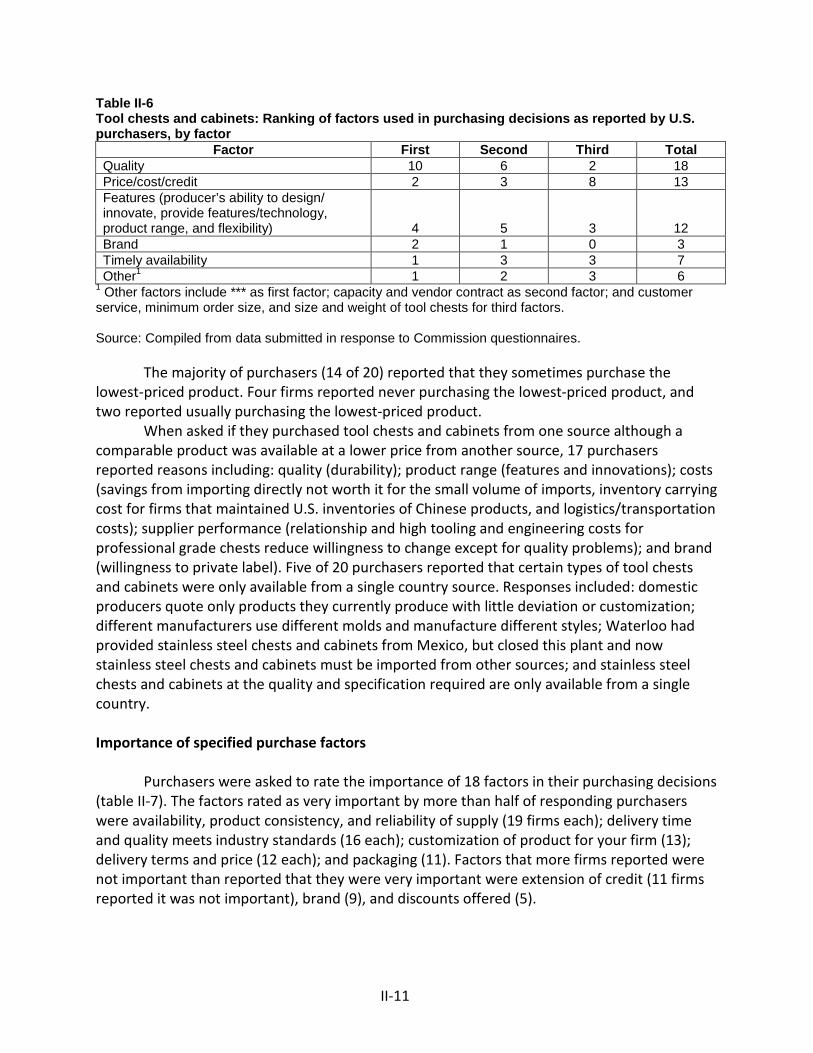
II-11
Table II-6 Tool chests and cabinets: Ranking of factors used in purchasing decisions as reported by U.S. purchasers, by factor
Factor First Second Third Total Quality 10 6 2 18 Price/cost/credit 2 3 8 13 Features (producer’s ability to design/ innovate, provide features/technology, product range, and flexibility) 4 5 3 12 Brand 2 1 0 3 Timely availability 1 3 3 7 Other1 1 2 3 6
1 Other factors include *** as first factor; capacity and vendor contract as second factor; and customer service, minimum order size, and size and weight of tool chests for third factors. Source: Compiled from data submitted in response to Commission questionnaires.
The majority of purchasers (14 of 20) reported that they sometimes purchase the lowest-priced product. Four firms reported never purchasing the lowest-priced product, and two reported usually purchasing the lowest-priced product.
When asked if they purchased tool chests and cabinets from one source although a comparable product was available at a lower price from another source, 17 purchasers reported reasons including: quality (durability); product range (features and innovations); costs (savings from importing directly not worth it for the small volume of imports, inventory carrying cost for firms that maintained U.S. inventories of Chinese products, and logistics/transportation costs); supplier performance (relationship and high tooling and engineering costs for professional grade chests reduce willingness to change except for quality problems); and brand (willingness to private label). Five of 20 purchasers reported that certain types of tool chests and cabinets were only available from a single country source. Responses included: domestic producers quote only products they currently produce with little deviation or customization; different manufacturers use different molds and manufacture different styles; Waterloo had provided stainless steel chests and cabinets from Mexico, but closed this plant and now stainless steel chests and cabinets must be imported from other sources; and stainless steel chests and cabinets at the quality and specification required are only available from a single country. Importance of specified purchase factors
Purchasers were asked to rate the importance of 18 factors in their purchasing decisions
(table II-7). The factors rated as very important by more than half of responding purchasers were availability, product consistency, and reliability of supply (19 firms each); delivery time and quality meets industry standards (16 each); customization of product for your firm (13); delivery terms and price (12 each); and packaging (11). Factors that more firms reported were not important than reported that they were very important were extension of credit (11 firms reported it was not important), brand (9), and discounts offered (5).
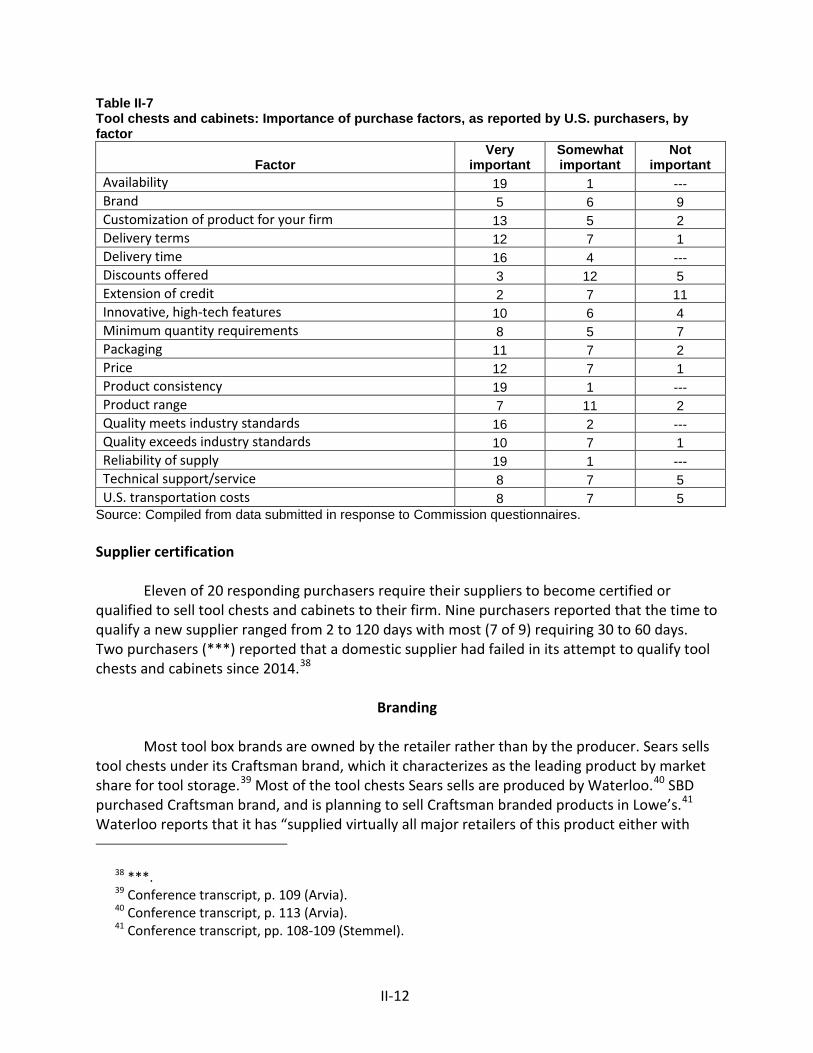
II-12
Table II-7 Tool chests and cabinets: Importance of purchase factors, as reported by U.S. purchasers, by factor
Factor Very
important Somewhat important
Not important
Availability 19 1 --- Brand 5 6 9 Customization of product for your firm 13 5 2 Delivery terms 12 7 1 Delivery time 16 4 --- Discounts offered 3 12 5 Extension of credit 2 7 11 Innovative, high-tech features 10 6 4 Minimum quantity requirements 8 5 7 Packaging 11 7 2 Price 12 7 1 Product consistency 19 1 --- Product range 7 11 2 Quality meets industry standards 16 2 --- Quality exceeds industry standards 10 7 1 Reliability of supply 19 1 --- Technical support/service 8 7 5 U.S. transportation costs 8 7 5
Source: Compiled from data submitted in response to Commission questionnaires. Supplier certification
Eleven of 20 responding purchasers require their suppliers to become certified or
qualified to sell tool chests and cabinets to their firm. Nine purchasers reported that the time to qualify a new supplier ranged from 2 to 120 days with most (7 of 9) requiring 30 to 60 days. Two purchasers (***) reported that a domestic supplier had failed in its attempt to qualify tool chests and cabinets since 2014.38
Branding
Most tool box brands are owned by the retailer rather than by the producer. Sears sells
tool chests under its Craftsman brand, which it characterizes as the leading product by market share for tool storage.39 Most of the tool chests Sears sells are produced by Waterloo.40 SBD purchased Craftsman brand, and is planning to sell Craftsman branded products in Lowe’s.41 Waterloo reports that it has “supplied virtually all major retailers of this product either with
38 ***. 39 Conference transcript, p. 109 (Arvia). 40 Conference transcript, p. 113 (Arvia). 41 Conference transcript, pp. 108-109 (Stemmel).
II-13
{its} own brands or with house-branded products.”42 Purchasers were asked which brands they purchased (table II-8).
Purchasers were asked how long it took for a producer to qualify to produce its brand; time required ranged from 1 day for *** to 120 days for ***.43 Seven of the 13 responding purchasers required 60 to 90 days to qualify a new producer to produce branded product. Table II-8 Tool chests and cabinets: Brands purchased by purchasers
* * * * * * *
Within brands or series there are lines based on quality distinctions, such as
good/better/best. For example, Sears sells lines designated as “basic, heavy duty, premium heavy duty, and professional tool chests.”44
Producers and importers were also asked to report the top five brands they produced or imported, their purchasers’ requirements for branding, and the minimum and maximum number of days required to qualify for a brand. U.S. producers reported producing *** brands. Nine importers were not purchasers and thus are not listed in table II-8. These firms listed importing *** brands. A number of importers that were not retailers reported that in order to sell to a retail brand, the product must differ from that offered by competing brands. The time required to qualify to produce a brand ranged from one day to a year, with most responding producers and importers (8 of 11) reporting the minimum time ranged from 30 to 90 days and most responding producers and importers (8 of 12) reporting a maximum time of 120 to 365 days.
Producers, importers, and purchasers were asked what producers or importers were required to do to become eligible to produce a new brand or the purchaser’s brand(s). Requirements reported included: quality standards; ISO 9001 certified; producer factors (no child labor, product testing abilities, track record, pre-purchase testing, pre-shipping inspection, factory audit, reliability delivery schedules, and defect and vendor compliance policies); meet specifications (differentiation, compliance with engineering drawings and specifications, produce samples to meet standards); environmental safety; low cost; compliance with federal and state regulations; and agreement on terms (signed terms and condition agreement, sign vendor agreement, and agree on payment terms).
Purchasers’ responses regarding the importance of branding for their customers varied. Some purchasers, including retailers ***, reported that brand was important but other retailers (***) reported that brand was not important. Reasons branding was important included: quality is critical in the professional market; franchise; brand reflects innovation; ***; brand indicates quality; branding is important in marketing; brand boosts customer loyalty; and brand coordinates with tools.
42 Conference transcript, p. 25 (Sallee). 43 ***. 44 Conference transcript, p. 16 (Spooner).
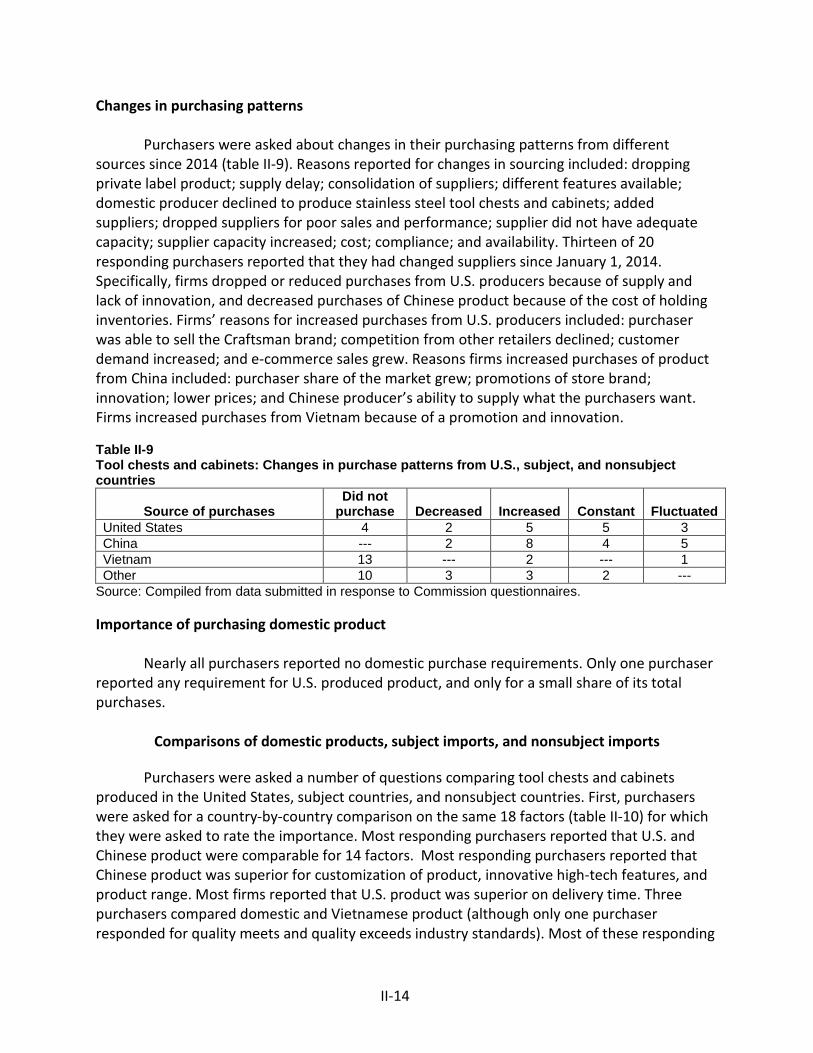
II-14
Changes in purchasing patterns Purchasers were asked about changes in their purchasing patterns from different
sources since 2014 (table II-9). Reasons reported for changes in sourcing included: dropping private label product; supply delay; consolidation of suppliers; different features available; domestic producer declined to produce stainless steel tool chests and cabinets; added suppliers; dropped suppliers for poor sales and performance; supplier did not have adequate capacity; supplier capacity increased; cost; compliance; and availability. Thirteen of 20 responding purchasers reported that they had changed suppliers since January 1, 2014. Specifically, firms dropped or reduced purchases from U.S. producers because of supply and lack of innovation, and decreased purchases of Chinese product because of the cost of holding inventories. Firms’ reasons for increased purchases from U.S. producers included: purchaser was able to sell the Craftsman brand; competition from other retailers declined; customer demand increased; and e-commerce sales grew. Reasons firms increased purchases of product from China included: purchaser share of the market grew; promotions of store brand; innovation; lower prices; and Chinese producer’s ability to supply what the purchasers want. Firms increased purchases from Vietnam because of a promotion and innovation. Table II-9 Tool chests and cabinets: Changes in purchase patterns from U.S., subject, and nonsubject countries
Source of purchases Did not
purchase Decreased Increased Constant Fluctuated United States 4 2 5 5 3 China --- 2 8 4 5 Vietnam 13 --- 2 --- 1 Other 10 3 3 2 ---
Source: Compiled from data submitted in response to Commission questionnaires. Importance of purchasing domestic product
Nearly all purchasers reported no domestic purchase requirements. Only one purchaser
reported any requirement for U.S. produced product, and only for a small share of its total purchases.
Comparisons of domestic products, subject imports, and nonsubject imports
Purchasers were asked a number of questions comparing tool chests and cabinets
produced in the United States, subject countries, and nonsubject countries. First, purchasers were asked for a country-by-country comparison on the same 18 factors (table II-10) for which they were asked to rate the importance. Most responding purchasers reported that U.S. and Chinese product were comparable for 14 factors. Most responding purchasers reported that Chinese product was superior for customization of product, innovative high-tech features, and product range. Most firms reported that U.S. product was superior on delivery time. Three purchasers compared domestic and Vietnamese product (although only one purchaser responded for quality meets and quality exceeds industry standards). Most of these responding
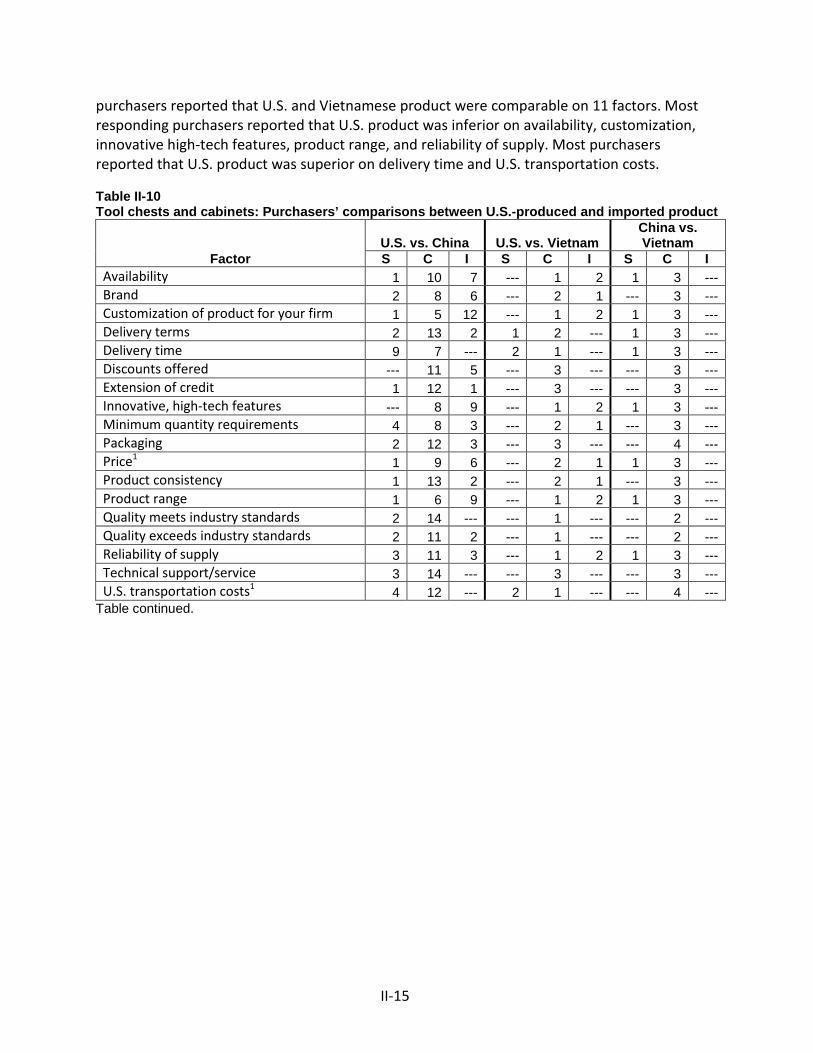
II-15
purchasers reported that U.S. and Vietnamese product were comparable on 11 factors. Most responding purchasers reported that U.S. product was inferior on availability, customization, innovative high-tech features, product range, and reliability of supply. Most purchasers reported that U.S. product was superior on delivery time and U.S. transportation costs. Table II-10 Tool chests and cabinets: Purchasers’ comparisons between U.S.-produced and imported product
Factor U.S. vs. China U.S. vs. Vietnam
China vs. Vietnam
S C I S C I S C I Availability 1 10 7 --- 1 2 1 3 --- Brand 2 8 6 --- 2 1 --- 3 --- Customization of product for your firm 1 5 12 --- 1 2 1 3 --- Delivery terms 2 13 2 1 2 --- 1 3 --- Delivery time 9 7 --- 2 1 --- 1 3 --- Discounts offered --- 11 5 --- 3 --- --- 3 --- Extension of credit 1 12 1 --- 3 --- --- 3 --- Innovative, high-tech features --- 8 9 --- 1 2 1 3 --- Minimum quantity requirements 4 8 3 --- 2 1 --- 3 --- Packaging 2 12 3 --- 3 --- --- 4 --- Price1 1 9 6 --- 2 1 1 3 --- Product consistency 1 13 2 --- 2 1 --- 3 --- Product range 1 6 9 --- 1 2 1 3 --- Quality meets industry standards 2 14 --- --- 1 --- --- 2 --- Quality exceeds industry standards 2 11 2 --- 1 --- --- 2 --- Reliability of supply 3 11 3 --- 1 2 1 3 --- Technical support/service 3 14 --- --- 3 --- --- 3 --- U.S. transportation costs1 4 12 --- 2 1 --- --- 4 ---
Table continued.
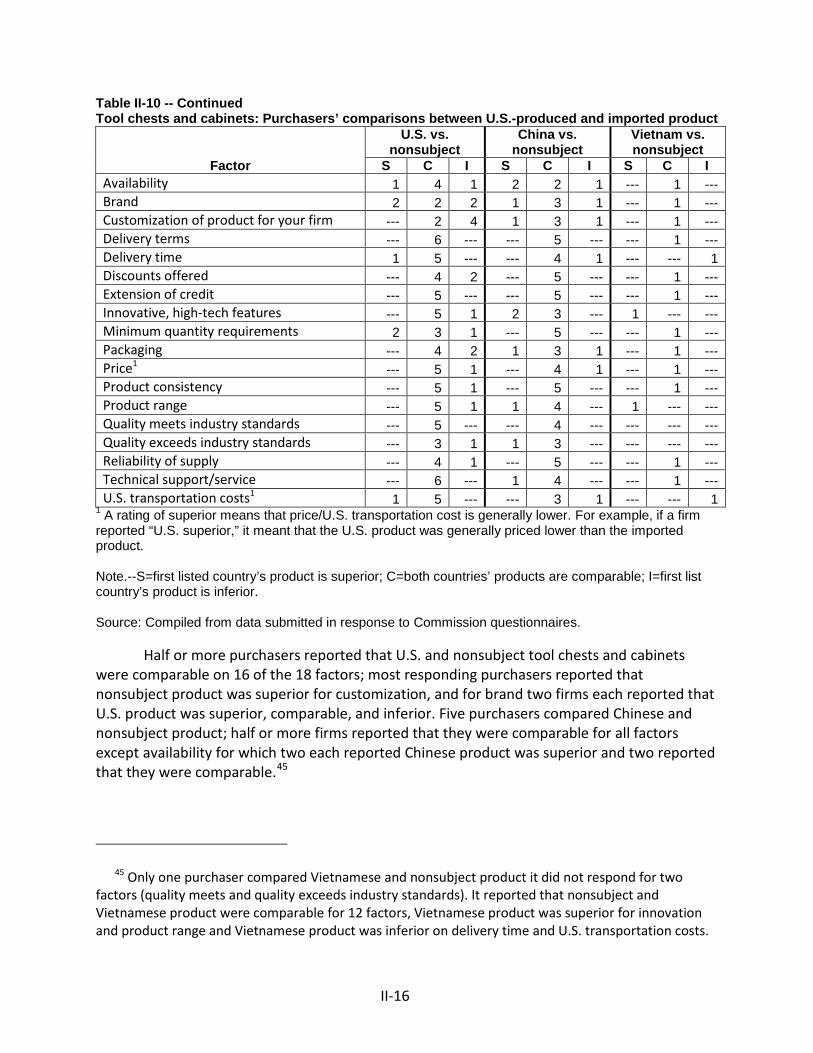
II-16
Table II-10 -- Continued Tool chests and cabinets: Purchasers’ comparisons between U.S.-produced and imported product
Factor
U.S. vs. nonsubject
China vs. nonsubject
Vietnam vs. nonsubject
S C I S C I S C I Availability 1 4 1 2 2 1 --- 1 --- Brand 2 2 2 1 3 1 --- 1 --- Customization of product for your firm --- 2 4 1 3 1 --- 1 --- Delivery terms --- 6 --- --- 5 --- --- 1 --- Delivery time 1 5 --- --- 4 1 --- --- 1 Discounts offered --- 4 2 --- 5 --- --- 1 --- Extension of credit --- 5 --- --- 5 --- --- 1 --- Innovative, high-tech features --- 5 1 2 3 --- 1 --- --- Minimum quantity requirements 2 3 1 --- 5 --- --- 1 --- Packaging --- 4 2 1 3 1 --- 1 --- Price1 --- 5 1 --- 4 1 --- 1 --- Product consistency --- 5 1 --- 5 --- --- 1 --- Product range --- 5 1 1 4 --- 1 --- --- Quality meets industry standards --- 5 --- --- 4 --- --- --- --- Quality exceeds industry standards --- 3 1 1 3 --- --- --- --- Reliability of supply --- 4 1 --- 5 --- --- 1 --- Technical support/service --- 6 --- 1 4 --- --- 1 --- U.S. transportation costs1 1 5 --- --- 3 1 --- --- 1
1 A rating of superior means that price/U.S. transportation cost is generally lower. For example, if a firm reported “U.S. superior,” it meant that the U.S. product was generally priced lower than the imported product. Note.--S=first listed country’s product is superior; C=both countries’ products are comparable; I=first list country’s product is inferior. Source: Compiled from data submitted in response to Commission questionnaires.
Half or more purchasers reported that U.S. and nonsubject tool chests and cabinets were comparable on 16 of the 18 factors; most responding purchasers reported that nonsubject product was superior for customization, and for brand two firms each reported that U.S. product was superior, comparable, and inferior. Five purchasers compared Chinese and nonsubject product; half or more firms reported that they were comparable for all factors except availability for which two each reported Chinese product was superior and two reported that they were comparable.45
45 Only one purchaser compared Vietnamese and nonsubject product it did not respond for two factors (quality meets and quality exceeds industry standards). It reported that nonsubject and Vietnamese product were comparable for 12 factors, Vietnamese product was superior for innovation and product range and Vietnamese product was inferior on delivery time and U.S. transportation costs.
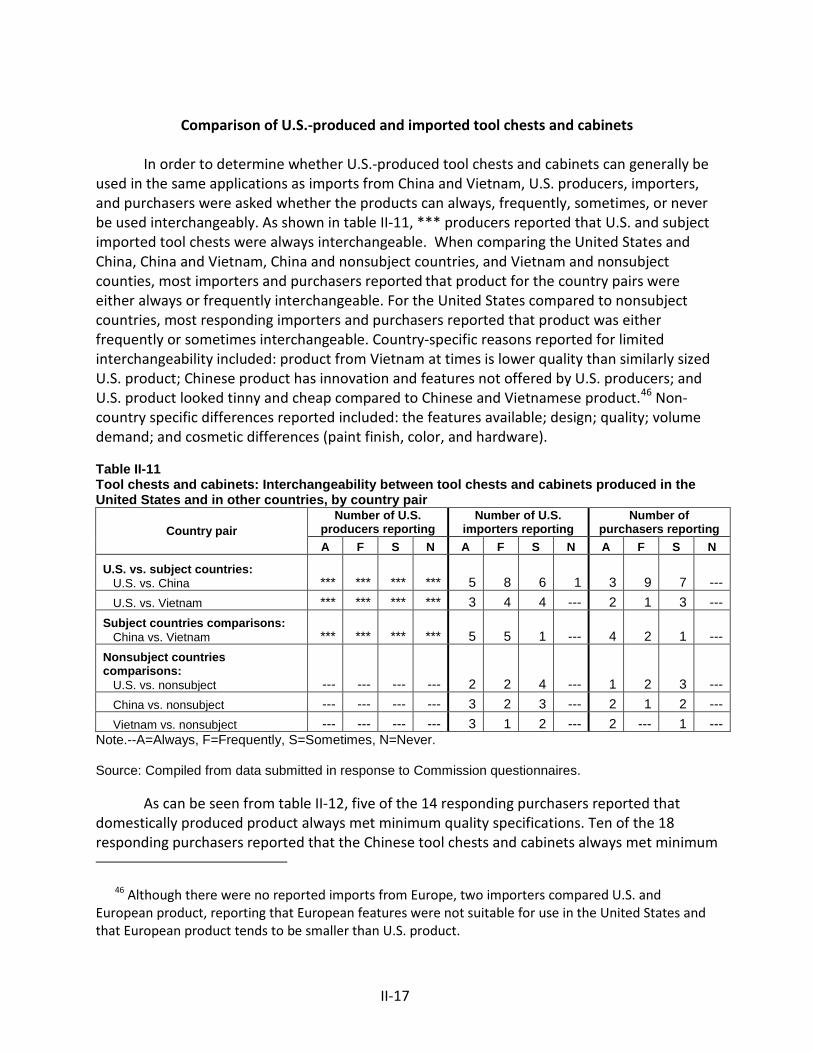
II-17
Comparison of U.S.-produced and imported tool chests and cabinets
In order to determine whether U.S.-produced tool chests and cabinets can generally be
used in the same applications as imports from China and Vietnam, U.S. producers, importers, and purchasers were asked whether the products can always, frequently, sometimes, or never be used interchangeably. As shown in table II-11, *** producers reported that U.S. and subject imported tool chests were always interchangeable. When comparing the United States and China, China and Vietnam, China and nonsubject countries, and Vietnam and nonsubject counties, most importers and purchasers reported that product for the country pairs were either always or frequently interchangeable. For the United States compared to nonsubject countries, most responding importers and purchasers reported that product was either frequently or sometimes interchangeable. Country-specific reasons reported for limited interchangeability included: product from Vietnam at times is lower quality than similarly sized U.S. product; Chinese product has innovation and features not offered by U.S. producers; and U.S. product looked tinny and cheap compared to Chinese and Vietnamese product.46 Non-country specific differences reported included: the features available; design; quality; volume demand; and cosmetic differences (paint finish, color, and hardware). Table II-11 Tool chests and cabinets: Interchangeability between tool chests and cabinets produced in the United States and in other countries, by country pair
Country pair Number of U.S.
producers reporting Number of U.S.
importers reporting Number of
purchasers reporting A F S N A F S N A F S N
U.S. vs. subject countries: U.S. vs. China *** *** *** *** 5 8 6 1 3 9 7 --- U.S. vs. Vietnam *** *** *** *** 3 4 4 --- 2 1 3 --- Subject countries comparisons: China vs. Vietnam *** *** *** *** 5 5 1 --- 4 2 1 --- Nonsubject countries comparisons: U.S. vs. nonsubject --- --- --- --- 2 2 4 --- 1 2 3 --- China vs. nonsubject --- --- --- --- 3 2 3 --- 2 1 2 --- Vietnam vs. nonsubject --- --- --- --- 3 1 2 --- 2 --- 1 ---
Note.--A=Always, F=Frequently, S=Sometimes, N=Never. Source: Compiled from data submitted in response to Commission questionnaires.
As can be seen from table II-12, five of the 14 responding purchasers reported that domestically produced product always met minimum quality specifications. Ten of the 18 responding purchasers reported that the Chinese tool chests and cabinets always met minimum
46 Although there were no reported imports from Europe, two importers compared U.S. and European product, reporting that European features were not suitable for use in the United States and that European product tends to be smaller than U.S. product.

II-18
quality specifications. All three responding purchasers reported that the Vietnamese tool chests and cabinets always met minimum quality specifications. Table II-12 Tool chests and cabinets: Ability to meet minimum quality specifications, by source1
Source Always Usually Sometimes Rarely or never United States 5 5 3 1 China 10 7 1 --- Vietnam 3 --- --- --- Other 2 1 1 ---
1 Purchasers were asked how often domestically produced or imported tool chests and cabinets meets minimum quality specifications for their own or their customers’ uses. Source: Compiled from data submitted in response to Commission questionnaires.
In addition, producers, importers, and purchasers were asked to assess how often differences other than price were significant in sales of tool chests and cabinets from the United States, subject, or nonsubject countries. As seen in table II-13, *** U.S. producers reported that there were never differences other than price between U.S. and subject countries and between Chinese and Vietnamese product. Most responding importers and purchasers reported that there were always differences other than price between U.S. and Chinese product. Most responding purchasers reported that there were always differences other than price between U.S. and Vietnamese product. In contrast, importer responses were split with three of eight responses reporting that were always differences other than price between U.S. and Vietnamese product and three reporting that there were never differences other than price between U.S. and Vietnamese product. Most responding importers and purchasers reported that there were never differences other than price between Chinese and Vietnamese product. Importers and purchasers responses were split when comparing the United States and nonsubject country sources, with half reporting that there were always or frequently differences other than price and the other half reported there were sometimes or never differences other than price. Most responding importers and purchasers reported there were either sometimes or never differences other than price between product from China and that from nonsubject countries. Most importers reported there were never differences other than price between Vietnamese and nonsubject product. In contrast, purchaser responses were equally divided between there always and never being differences other than prices between Vietnamese and nonsubject product. Differences in factors other than price not reported under interchangeability include: foreign producers have more sophisticated automation to handle volume and create unique features; China has faster speed to market of new designs and greater product range; flexibility to meet larger customers; quality control; U.S. factories tend to be slow and do not invest in innovative features, are not flexible with new customers, and rely or their legacy rather than quality and innovation; and U.S. producers do not offer larger sizes.
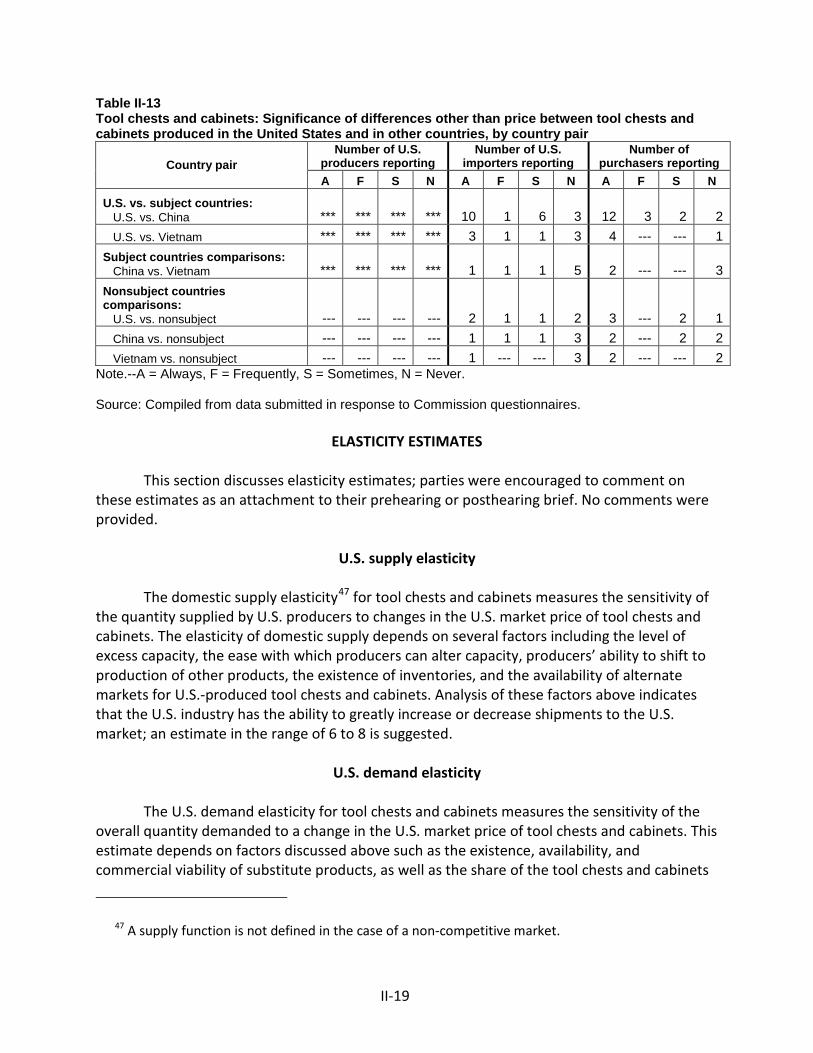
II-19
Table II-13 Tool chests and cabinets: Significance of differences other than price between tool chests and cabinets produced in the United States and in other countries, by country pair
Country pair Number of U.S.
producers reporting Number of U.S.
importers reporting Number of
purchasers reporting A F S N A F S N A F S N
U.S. vs. subject countries: U.S. vs. China *** *** *** *** 10 1 6 3 12 3 2 2 U.S. vs. Vietnam *** *** *** *** 3 1 1 3 4 --- --- 1 Subject countries comparisons: China vs. Vietnam *** *** *** *** 1 1 1 5 2 --- --- 3 Nonsubject countries comparisons: U.S. vs. nonsubject --- --- --- --- 2 1 1 2 3 --- 2 1 China vs. nonsubject --- --- --- --- 1 1 1 3 2 --- 2 2 Vietnam vs. nonsubject --- --- --- --- 1 --- --- 3 2 --- --- 2
Note.--A = Always, F = Frequently, S = Sometimes, N = Never. Source: Compiled from data submitted in response to Commission questionnaires.
ELASTICITY ESTIMATES This section discusses elasticity estimates; parties were encouraged to comment on
these estimates as an attachment to their prehearing or posthearing brief. No comments were provided.
U.S. supply elasticity
The domestic supply elasticity47 for tool chests and cabinets measures the sensitivity of
the quantity supplied by U.S. producers to changes in the U.S. market price of tool chests and cabinets. The elasticity of domestic supply depends on several factors including the level of excess capacity, the ease with which producers can alter capacity, producers’ ability to shift to production of other products, the existence of inventories, and the availability of alternate markets for U.S.-produced tool chests and cabinets. Analysis of these factors above indicates that the U.S. industry has the ability to greatly increase or decrease shipments to the U.S. market; an estimate in the range of 6 to 8 is suggested.
U.S. demand elasticity
The U.S. demand elasticity for tool chests and cabinets measures the sensitivity of the
overall quantity demanded to a change in the U.S. market price of tool chests and cabinets. This estimate depends on factors discussed above such as the existence, availability, and commercial viability of substitute products, as well as the share of the tool chests and cabinets
47 A supply function is not defined in the case of a non-competitive market.
II-20
in a household’s budget. Based on the available information, the aggregate demand for tool chests and cabinets is likely to be relatively inelastic; a range of -0.5 to -1.1 is suggested.
Substitution elasticity
The elasticity of substitution depends upon the extent of product differentiation
between the domestic and imported products.48 Product differentiation, in turn, depends upon such factors as quality (e.g., product features, innovation, appearance, etc.) and conditions of sale (e.g., availability, sales terms/ discounts/ promotions, etc.). Based on available information, the elasticity of substitution between U.S.-produced tool chests and cabinets and imported tool chests and cabinets is likely to be in the range of 2 to 4.
48 The substitution elasticity measures the responsiveness of the relative U.S. consumption levels of the subject imports and the domestic like products to changes in their relative prices. This reflects how easily purchasers switch from the U.S. product to the subject products (or vice versa) when prices change.

III-1
PART III: U.S. PRODUCERS’ PRODUCTION, SHIPMENTS, AND EMPLOYMENT
The Commission analyzes a number of factors in making injury determinations (see 19 U.S.C. §§ 1677(7)(B) and 1677(7)(C)). Information on the subsidies and dumping margins was presented in Part I of this report and information on the volume and pricing of imports of the subject merchandise is presented in Part IV and Part V. Information on the other factors specified is presented in this section and/or Part VI and (except as noted) is based on the questionnaire responses of two firms that accounted for all known U.S. production of tool chest and cabinets during 2016.
U.S. PRODUCERS
The Commission issued a U.S. producer questionnaire to fourteen firms based on
information contained in the petition, information provided by the respondents, and staff research. Two firms provided usable data on their productive operations.1 Staff believes that these responses represent all known U.S. production of tool chests and cabinets.
Table III-1 lists U.S. producers of tool chests and cabinets, their production locations, positions on the petition, and shares of total production.
Table III-1 Tool chests and cabinets: U.S. producers, their positions on the petition, production locations, and shares of reported production in 2016
Firm Position on petition Production location(s) Share of production
(percent)
MBI Support Franklin Park, IL ***
Waterloo Support Sedalia, MO ***
Total ***
Source: Compiled from data submitted in response to Commission questionnaires.
1 Two firms (MBI and Waterloo) reported producing tool chests and cabinets as defined in Part I of this report. Waterloo also reported producing industrial / other (non-retail) tool chests and cabinets. Four additional firms (Cornwell, Matco, SBD, and Snap-on) reported producing industrial / other (non-retail) tool chests and cabinets, but not tool chests and cabinets as defined in Part I of this report. However, only Matco and SBD provided complete data series. These data are included in Appendix C, table C-2. Cornwell provided extremely limited data for 2016 and 2017, reporting production of *** units of industrial / other (non-retail) tool chests and cabinets during that period. Snap-on provided a producer questionnaire with comments, but no data. Staff surveyed the remaining firms, whose sales appear to consist largely, if not exclusively, of industrial / other (non-retail) tool chests and cabinets. See Appendix C.
III-2
Petitioner Waterloo asserts that only two U.S. companies, Waterloo2 and MBI, represent the entire domestic production of retail tool chests and cabinets. The other responding U.S. firms produce other tool chests and cabinets that are considered out-of-scope products. ***, SBD acquired petitioner (Waterloo)3 and ***. Data submitted by Waterloo and SBD are presented separately in this report.
Table III-2 presents information on U.S. producers’ ownership, and related/affiliated firms.
Table III-2 Tool chests and cabinets: U.S. producers’ ownership, related and/or affiliated firms
* * * * * * *
The Commission also asked U.S. producers to report changes in ownerships since
January 1, 2014. MBI reported no changes. Waterloo reported the following changes: ***.4 In additon, the Commission asked U.S. producers what is the impact of the change in
ownership since January 1, 2014. Waterloo responded that ***.5 Table III-3 presents U.S. producers’ reported changes in operations since January 1,
2014. There were no reported plant closures. ***.
Table III-3 Tool chests and cabinets: U.S. producers’ reported changes in operations, since January 1, 2014
* * * * * * *
U.S. PRODUCTION, CAPACITY, AND CAPACITY UTILIZATION
Table III-4 and figure III-1 present U.S. producers’ production, capacity, and capacity utilization. Allocated capacity for all domestic producers remained constant. However, total production decreased from 2014 to 2016, by *** in 2015 and by *** in 2016. This resulted to an overall decrease in capacity utilization from *** in 2014 to *** in 2016. Specifically, *** production decreased by ***, leading to a decline in its capacity utilization of *** from 2014 to 2016. *** production declined by *** over the same period. *** capacity utilization declined from *** in 2014 to *** in 2016.
Compared to January-September 2016, domestic capacity was unchanged in January-September 2017. During January-September 2017, total production was increased by *** leading capacity utilization to increase by *** percentage point.
2 ***. See EDIS Doc. ID 630504. 3 Hearing transcript, 109 (Stemmel). 4 *** U.S. producer questionnaire, I-4b. 5 Ibid, I-4c.
III-3
Table III-4 Tool chests and cabinets: U.S. producers’ production, capacity, and capacity utilization, 2014-16, January-September 2016, and January-September 2017
* * * * * * * Figure III-1 Tool chests and cabinets: U.S. producers’ production, capacity, and capacity utilization, 2014-16, January-September 2016, and January-September 2017
* * * * * * *
Alternative products
Table III‐5 presents data on U.S. producers’ capacity and production of other products using the same equipment and machinery as tool chests and cabinets. Waterloo reported that it produces industrial grade tool chests and cabinets, as well as ***, and that its employees are cross-trained to work on multiple types of machinery.6 The vast majority of the product produced during the period examined was tool chests and cabinets. The two firms reported producing approximately *** units of out-of-scope products on shared equipment in 2016.7
Table III-5 Tool chests and cabinets: U.S. producers’ overall plant capacity and production on the same equipment as subject production, 2014-16, January-September 2016, and January-September 2017
* * * * * * *
U.S. PRODUCERS’ U.S. SHIPMENTS AND EXPORTS
Table III-6 presents U.S. producers’ U.S. shipments, export shipments, and total shipments. With regards to quantity, U.S. shipments decreased by *** from 2014 to 2016, and *** export shipments were reported. With regards to value, U.S. shipments decreased by *** from 2014 to 2016. Average unit values for U.S. shipments ranged from *** per unit to *** per unit during 2014 to 2016. U.S. shipment quantity, value, and average unit value were each higher in January to September 2017 than in January to September 2016.8
Table III-6 Tool chests and cabinets: U.S. producers’ U.S. shipments, exports shipments, and total shipments, 2014-16, January-September 2016, and January-September 2017
* * * * * * *
6 Waterloo, which represented ***percent of total reported capacity in 2016, based its capacity calculations on actual achievable levels of production. It stated that its reported production capacity ***. Petitioner’s postconference brief, exh. 1, p. 4.
7 ***. See EDIS Doc. ID 627601. 8 At Staff’s request, Waterloo provided ***. See EDIS Doc ID 631546.
III-4
U.S. PRODUCERS’ INVENTORIES
Table III-7 presents U.S. producers’ end-of-period inventories and the ratio of these inventories to U.S. producers’ production, U.S. shipments, and total shipments. From 2014 to 2016, end-of-period inventories decreased by *** percent, while the ratio of inventories to U.S. production, U.S. shipments, and total shipments each decreased by more than *** percentage points. ***.
Table III-7 Tool chests and cabinets: U.S. producers’ inventories, 2014-16, January to September 2016, and January to September 2017
* * * * * * *
U.S. PRODUCERS’ IMPORTS AND PURCHASES
U.S. producers’ imports and purchases of tool chests and cabinets are presented in table III-8. No U.S. producers reported directly importing tool chests and cabinets from China or Vietnam. Imports of tool chests and cabinets from nonsubject sources ceased in 2016 because ***.
Table III-8 Tool chests and cabinets: U.S. producers’ U.S. production, imports and purchases, 2014-16, January-September 2016, and January-September 2017
* * * * * * *
U.S. EMPLOYMENT, WAGES, AND PRODUCTIVITY
Table III-9 shows U.S. producers’ employment-related data. The number of production and related workers (“PRWs”) decreased by *** percent from 2014 to 2015 before increasing by *** percent from 2015 to 2016. Both the number of workers and hours worked were higher in January to September 2017 than in January to September in 2016. Total hours worked increased by *** percent, from *** in 2014 to *** in 2016. From 2014 to 2016, the hours worked per PRW increased by *** percent and the wages paid increased by *** percent. The hourly wages also increased by *** percent or ***dollars per hour. However, from 2014 to 2016, productivity decreased by *** percent or *** units per hour, and unit labor costs increased by *** percent or *** per unit from 2014 to 2016.
Table III-9 Tool chests and cabinets: Average number of production and related workers, hours worked, wages paid to such employees, hourly wages, productivity, and unit labor costs, 2014-2016, January-September 2016, and January-September 2017
* * * * * * *
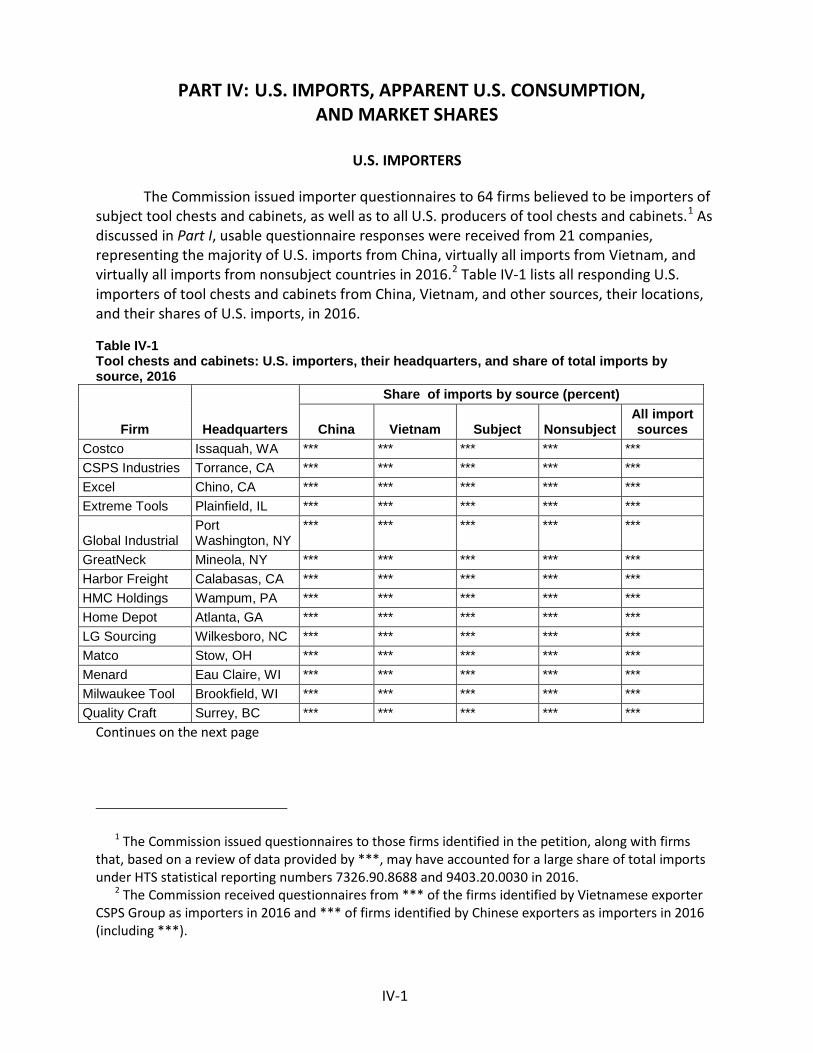
IV-1
PART IV: U.S. IMPORTS, APPARENT U.S. CONSUMPTION, AND MARKET SHARES
U.S. IMPORTERS
The Commission issued importer questionnaires to 64 firms believed to be importers of subject tool chests and cabinets, as well as to all U.S. producers of tool chests and cabinets.1 As discussed in Part I, usable questionnaire responses were received from 21 companies, representing the majority of U.S. imports from China, virtually all imports from Vietnam, and virtually all imports from nonsubject countries in 2016.2 Table IV-1 lists all responding U.S. importers of tool chests and cabinets from China, Vietnam, and other sources, their locations, and their shares of U.S. imports, in 2016. Table IV-1 Tool chests and cabinets: U.S. importers, their headquarters, and share of total imports by source, 2016
Firm Headquarters
Share of imports by source (percent)
China Vietnam Subject Nonsubject All import sources
Costco Issaquah, WA *** *** *** *** *** CSPS Industries Torrance, CA *** *** *** *** *** Excel Chino, CA *** *** *** *** *** Extreme Tools Plainfield, IL *** *** *** *** ***
Global Industrial Port Washington, NY
*** *** *** *** ***
GreatNeck Mineola, NY *** *** *** *** *** Harbor Freight Calabasas, CA *** *** *** *** *** HMC Holdings Wampum, PA *** *** *** *** *** Home Depot Atlanta, GA *** *** *** *** *** LG Sourcing Wilkesboro, NC *** *** *** *** *** Matco Stow, OH *** *** *** *** *** Menard Eau Claire, WI *** *** *** *** *** Milwaukee Tool Brookfield, WI *** *** *** *** *** Quality Craft Surrey, BC *** *** *** *** ***
Continues on the next page
1 The Commission issued questionnaires to those firms identified in the petition, along with firms that, based on a review of data provided by ***, may have accounted for a large share of total imports under HTS statistical reporting numbers 7326.90.8688 and 9403.20.0030 in 2016.
2 The Commission received questionnaires from *** of the firms identified by Vietnamese exporter CSPS Group as importers in 2016 and *** of firms identified by Chinese exporters as importers in 2016 (including ***).
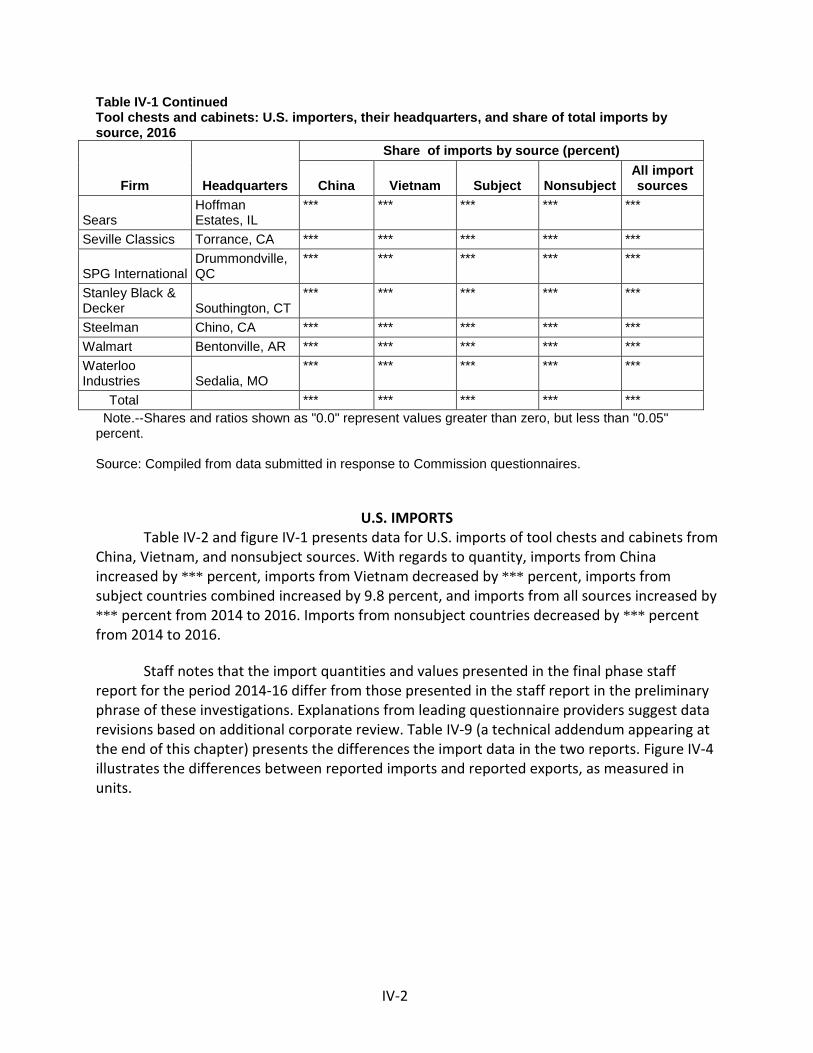
IV-2
Table IV-1 Continued Tool chests and cabinets: U.S. importers, their headquarters, and share of total imports by source, 2016
Firm Headquarters
Share of imports by source (percent)
China Vietnam Subject Nonsubject All import sources
Sears Hoffman Estates, IL
*** *** *** *** ***
Seville Classics Torrance, CA *** *** *** *** ***
SPG International Drummondville, QC
*** *** *** *** ***
Stanley Black & Decker Southington, CT
*** *** *** *** ***
Steelman Chino, CA *** *** *** *** *** Walmart Bentonville, AR *** *** *** *** *** Waterloo Industries Sedalia, MO
*** *** *** *** ***
Total *** *** *** *** *** Note.--Shares and ratios shown as "0.0" represent values greater than zero, but less than "0.05" percent. Source: Compiled from data submitted in response to Commission questionnaires.
U.S. IMPORTS Table IV-2 and figure IV-1 presents data for U.S. imports of tool chests and cabinets from
China, Vietnam, and nonsubject sources. With regards to quantity, imports from China increased by *** percent, imports from Vietnam decreased by *** percent, imports from subject countries combined increased by 9.8 percent, and imports from all sources increased by *** percent from 2014 to 2016. Imports from nonsubject countries decreased by *** percent from 2014 to 2016.
Staff notes that the import quantities and values presented in the final phase staff report for the period 2014-16 differ from those presented in the staff report in the preliminary phrase of these investigations. Explanations from leading questionnaire providers suggest data revisions based on additional corporate review. Table IV-9 (a technical addendum appearing at the end of this chapter) presents the differences the import data in the two reports. Figure IV-4 illustrates the differences between reported imports and reported exports, as measured in units.
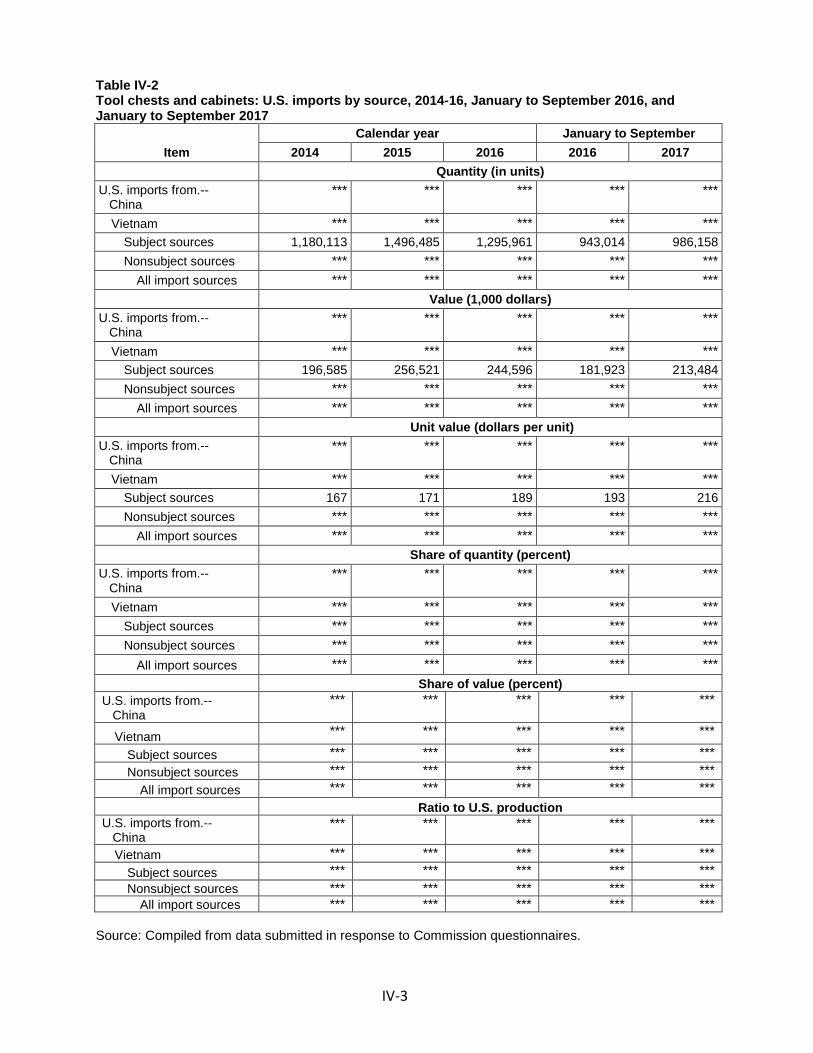
IV-3
Table IV-2 Tool chests and cabinets: U.S. imports by source, 2014-16, January to September 2016, and January to September 2017
Item Calendar year January to September
2014 2015 2016 2016 2017 Quantity (in units) U.S. imports from.-- China
*** *** *** *** ***
Vietnam *** *** *** *** *** Subject sources 1,180,113 1,496,485 1,295,961 943,014 986,158 Nonsubject sources *** *** *** *** ***
All import sources *** *** *** *** *** Value (1,000 dollars) U.S. imports from.-- China
*** *** *** *** ***
Vietnam *** *** *** *** *** Subject sources 196,585 256,521 244,596 181,923 213,484 Nonsubject sources *** *** *** *** ***
All import sources *** *** *** *** *** Unit value (dollars per unit) U.S. imports from.-- China
*** *** *** *** ***
Vietnam *** *** *** *** *** Subject sources 167 171 189 193 216 Nonsubject sources *** *** *** *** ***
All import sources *** *** *** *** *** Share of quantity (percent) U.S. imports from.-- China
*** *** *** *** ***
Vietnam *** *** *** *** *** Subject sources *** *** *** *** *** Nonsubject sources *** *** *** *** ***
All import sources *** *** *** *** *** Share of value (percent)
U.S. imports from.-- China
*** *** *** *** ***
Vietnam *** *** *** *** *** Subject sources *** *** *** *** *** Nonsubject sources *** *** *** *** ***
All import sources *** *** *** *** *** Ratio to U.S. production
U.S. imports from.-- China
*** *** *** *** ***
Vietnam *** *** *** *** *** Subject sources *** *** *** *** *** Nonsubject sources *** *** *** *** ***
All import sources *** *** *** *** *** Source: Compiled from data submitted in response to Commission questionnaires.
IV-4
Figure IV-1 Tool chests and cabinets: U.S. imports by source, 2014-16, January to September 2016, and January to September 2017
* * * * * * *
NEGLIGIBILITY
The statute requires that an investigation be terminated without an injury determination if imports of the subject merchandise are found to be negligible.3 Negligible imports are generally defined in the Tariff Act of 1930, as amended, as imports from a country of merchandise corresponding to a domestic like product where such imports account for less than 3 percent of the volume of all such merchandise imported into the United States in the most recent 12-month period for which data are available that precedes the filing of the petition or the initiation of the investigation. However, if there are imports of such merchandise from a number of countries subject to investigations initiated on the same day that individually account for less than 3 percent of the total volume of the subject merchandise, and if the imports from those countries collectively account for more than 7 percent of the volume of all such merchandise imported into the United States during the applicable 12-month period, then imports from such countries are deemed not to be negligible.4 Imports from China accounted for *** percent of U.S. imports of tool chests and cabinets during the twelve-month period of April 2016 through March 2017, while imports from Vietnam accounted for *** percent.
Table IV-3 Tool chests and cabinets: U.S. imports in the twelve month period preceding the filing of the petition, April 2016 through March 2017
Item April 2016 through March 2017
Quantity (units) Share of quantity (percent) U.S. imports from.-- China
*** ***
Vietnam *** *** Subject sources 1,215,551 *** Nonsubject sources *** ***
All sources *** ***
CUMULATION CONSIDERATIONS
In assessing whether imports should be cumulated, the Commission determines whether U.S. imports from the subject countries compete with each other and with the domestic like product and has generally considered four factors: (1) fungibility, (2) presence of sales or offers to sell in the same geographical markets, (3) common or similar channels of
3 Sections 703(a)(1), 705(b)(1), 733(a)(1), and 735(b)(1) of the Act (19 U.S.C. §§ 1671b(a)(1), 1671d(b)(1), 1673b(a)(1), and 1673d(b)(1)).
4 Section 771 (24) of the Act (19 U.S.C § 1677(24)).
IV-5
distribution, and (4) simultaneous presence in the market. Information regarding channels of distribution, market areas, and interchangeability appear in Part II. Additional information concerning fungibility, geographical markets, and simultaneous presence in the market is presented below.
Fungibility
U.S. producers and importers were asked to report their U.S. shipments by product
type. Their responses are presented in figure IV-2 and table IV-4. U.S. producers reported U.S. shipments of each type of product in 2016. Importers reported importing of each type of product from China in 2016. Importers reported importing prepackaged sets, top chests, tool cabinets, and all other in-scope products from Vietnam in 2016. Importers reported importing prepacked sets, top chests, intermediate chests, tool cabinets, and all other in-scope products from nonsubject countries in 2016. The largest shares of product type for U.S. shipments, imports from China, and imports from nonsubject countries were for ***, while the largest share of product type for imports from Vietnam was for ***.
Table IV-5 and figure IV-3 present U.S. shipments in 2017 by type of steel. The large majority of U.S. shipments, by source and collectively, were carbon steel tool chests and cabinets. Table IV-4 Tool chests and cabinets: U.S. producers’ and importers’ U.S. shipments, by product type, 2016
* * * * * * *
Figure IV-2 Tool chests and cabinets: U.S. producers’ and U.S. imports’ U.S. shipments by product type, 2014-16, January to September 2016, and January to September 2017
* * * * * * * Table IV-5 Tool chests and cabinets: U.S. producers’ and importers’ U.S. shipments, by type of steel, 2016
* * * * * * *
Figure IV-3 Tool chests and cabinets: U.S. producers’ and importers’ U.S. shipments, by type of steel, 2016
* * * * * * * .
Geographical markets
As discussed in Part II, U.S. producers and importers of tool chests and cabinets from China and Vietnam reported U.S. shipments throughout the United States.
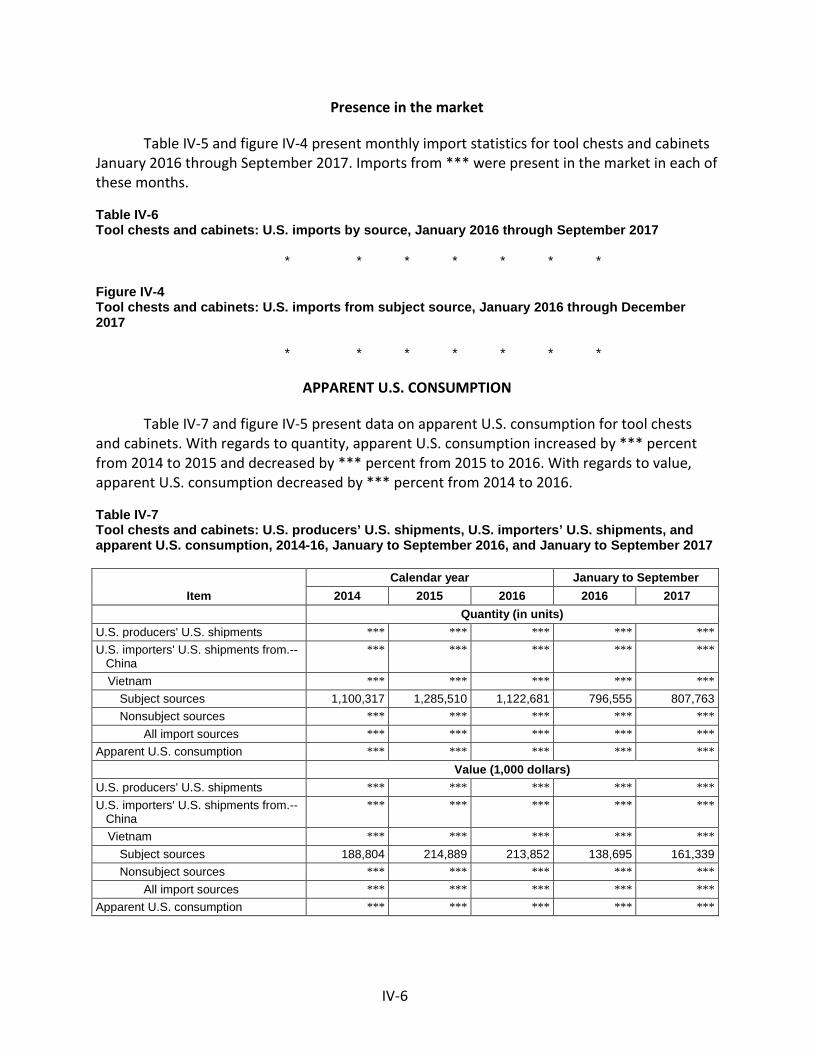
IV-6
Presence in the market
Table IV-5 and figure IV-4 present monthly import statistics for tool chests and cabinets
January 2016 through September 2017. Imports from *** were present in the market in each of these months. Table IV-6 Tool chests and cabinets: U.S. imports by source, January 2016 through September 2017
* * * * * * *
Figure IV-4 Tool chests and cabinets: U.S. imports from subject source, January 2016 through December 2017
* * * * * * *
APPARENT U.S. CONSUMPTION
Table IV-7 and figure IV-5 present data on apparent U.S. consumption for tool chests
and cabinets. With regards to quantity, apparent U.S. consumption increased by *** percent from 2014 to 2015 and decreased by *** percent from 2015 to 2016. With regards to value, apparent U.S. consumption decreased by *** percent from 2014 to 2016. Table IV-7 Tool chests and cabinets: U.S. producers’ U.S. shipments, U.S. importers’ U.S. shipments, and apparent U.S. consumption, 2014-16, January to September 2016, and January to September 2017
Item Calendar year January to September
2014 2015 2016 2016 2017 Quantity (in units) U.S. producers' U.S. shipments *** *** *** *** *** U.S. importers' U.S. shipments from.-- China
*** *** *** *** ***
Vietnam *** *** *** *** *** Subject sources 1,100,317 1,285,510 1,122,681 796,555 807,763 Nonsubject sources *** *** *** *** ***
All import sources *** *** *** *** *** Apparent U.S. consumption *** *** *** *** *** Value (1,000 dollars) U.S. producers' U.S. shipments *** *** *** *** *** U.S. importers' U.S. shipments from.-- China
*** *** *** *** ***
Vietnam *** *** *** *** *** Subject sources 188,804 214,889 213,852 138,695 161,339 Nonsubject sources *** *** *** *** ***
All import sources *** *** *** *** *** Apparent U.S. consumption *** *** *** *** ***

IV-7
Figure IV-5 Tool chests and cabinets: U.S. imports and U.S. shipments of domestic product, 2014-16, January to September 2016, and January to September 2017
* * * * * * *
U.S. MARKET SHARES
U.S. market share data are presented in table IV-8. With regards to quantity, the share of U.S. producers’ U.S. shipments decreased by *** percentage points from 2014 to 2016; the share of U.S. shipments of imports from China increased by *** percentage points from 2014 to 2015 and increased by *** percentage points from 2015 to 2016; the share of U.S. shipments of imports from Vietnam increased by *** percentage points from 2014 to 2015 but then decreased by *** percentage points from 2015 to 2016; the share of U.S. shipments of imports from the subject countries combined increased by *** percentage points from 2014 to 2016; the share of U.S. shipments of imports from nonsubject sources decreased by *** from 2014 to 2016. Table IV-8 Tool chests and cabinets: U.S. consumption and market shares, 2014-16, January to September 2016, and January to September 2017
* * * * * * * Table IV-9 Tool chests and cabinets: Differences between the preliminary and final phase reported subject import volumes, 2014-16
* * * * * * *
In response to staff inquire about the discrepancy in import data report in the preliminary and final phase of these investigations, *** provided the following response:
• “*** • *** • *** • ***.”5
Figure IV-6 Tool chests and cabinets: Comparative levels of U.S. importers’ subject U.S. imports vs. foreign producers’ exports to United States, 2014-16, January to September 2016, and January to September 2017
* * * * * * *
5 Email from ***. EDIS Doc ID #630651.

V-1
PART V: PRICING DATA
FACTORS AFFECTING PRICES
Raw material costs
Tool chests and cabinets generally are manufactured from cold-rolled steel.1 U.S. producers reported that raw materials as a share of cost of goods sold (“COGS”) decreased from *** percent in 2014 to *** percent in 2016. In January to September 2017, raw materials as a share of COGS was *** percent.
Figure V-1 shows the prices of cold-rolled carbon steel and stainless steel grade 430. Between January 2014 and September 2017, cold-rolled steel prices increased by *** percent while stainless steel prices decreased by *** percent. Both cold-rolled steel and stainless steel prices fluctuated over the period. Cold-rolled steel prices decreased by *** percent between January 2014 and December 2015, increased by *** percent between December 2015 and December 2016, and increased by *** percent between December 2016 and September 2017. Stainless steel prices decreased by *** percent between January 2014 and November 2015, increased by *** percent between November 2015 and February 2017, and increased by *** percent between February 2017 and September 2017. Figure V-1 Steel prices: Average prices of cold-rolled carbon steel and grade 430 stainless steel, monthly, January 2014 to September 2017
* * * * * * *
U.S. inland transportation costs *** reported that their customers typically arrange transportation. Petitioner stated
that big-box retailers are better than factories at negotiating freight.2 Most importers (9 of 11) reported that they arrange transportation to their customers. U.S. producers reported that their U.S. inland transportation costs were ***. Importers reported costs of 3 to 40 percent, five of nine responding importers (including ***3) reported costs of 15 percent or less and the remaining four reported costs ranging from 22 to 40 percent. Five importers that imported for retail sales reported that the cost of U.S. inland transportation for product from China ranged from 3 to 12 percent and one importer reported that the cost for product from Vietnam was 10 percent.4
1 Petition, Vol. I, pp. 6-7. Tool chests and cabinets typically are produced from carbon or, less commonly, alloy (stainless) steel, but can be manufactured from other metals.
2 Hearing transcript p. 106 (Kruger). 3 ***. 4 In addition, several firms seemingly misunderstood the question and reported U.S. transportation
costs of 100 percent.

V-2
PRICING PRACTICES5
Pricing methods *** and 7 of 12 responding importers reported using transaction-by-transaction
negotiations. Importers also reported using contracts and price lists (5 firms each) (table V-1). Table V-1 Tool chests and cabinets: U.S. producers’ and importers’ reported price setting methods, by number of responding firms1
Method U.S. producers Importers Transaction-by-transaction *** 7 Contract *** 5 Set price list *** 5 Other *** --- Responding firms 2 12
1 The sum of responses down may not add up to the total number of responding firms as each firm was instructed to check all applicable price setting methods employed. Source: Compiled from data submitted in response to Commission questionnaires.
*** reported selling *** of their tool chests and cabinets using short-term contracts. Importers reported that about half of their sales were via annual contracts and most of the remainder were via short-term contracts or on a spot basis (table V-2). Table V-2 Tool chests and cabinets: U.S. producers’ and importers’ shares of U.S. commercial shipments by type of sale, 2016
* * * * * * *
Sales terms and discounts *** U.S. producers and 8 of 12 responding importers typically quote prices on an f.o.b.
basis.6 ***. Half the responding importers (6 of 12 responding) offered no discounts, four offered volume discounts, three offered quantity discounts, and three offered other discounts. One importer each reported marketing co-op funds, discounts by agreement or because of shipment delay, and discounts by item with additional promotional discounts. ***. Six of 12
5 Importers that are also retailers were asked to skip questions on their pricing practices (i.e., price
setting, discounts, terms, contracts, lead times, shipping, and geographic shipments) because these would reflect sales to consumers. Importer retailers include ***.
6 One importer reported that it typically sold using both f.o.b. and delivered methods. It is included in the eight responses. Most of the importers reporting f.o.b. sales reported these shipments were from overseas.
V-3
responding importers reported sales terms of net 30, three reported net 60, one reported 2/10 net 30, and six reported “other” terms.7
Three of the 20 responding purchasers reported that they purchase product daily, 6 purchase weekly, 7 purchase monthly, and 3 purchase quarterly.8 Fifteen of 19 responding purchasers reported that their purchasing frequency had not changed since 2014.9 Most (15 of 17) responding purchasers contact 1 to 5 suppliers before making a purchase.10 11
Price leadership
Nine purchasers reported that there were price leaders. Price leaders listed by more
than one firm included Home Depot (reported by 4), Sears (3), and Harbor Freight and Snap On (2 each).12 Large retailers were typically reported to determine the selling price of tool chests and cabinets.
PRICE DATA
The Commission requested U.S. producers and importers to provide quarterly data for
the total quantity and f.o.b. value of the following tool chest and cabinet products shipped to unrelated U.S. customers during January 2014 and September 2017.13 Product 1.-- 26-27 inch wide top chest sold in combination with a 26-27 inch wide rolling cabinet, each
with a body of cold-rolled carbon steel, having 9 to 10 total drawers (across both units) with ball bearing drawer slides, a minimum chest depth (front to back) of 15 inches, a minimum cabinet depth of 18 inches and a combined unit weight (not shipping weight) of 150 to 180 lbs.
Product 2.-- 40-46 inch wide top chest sold in combination with a 40-46 inch wide rolling cabinet, each
with a body of cold-rolled carbon steel, having 16 to 21 drawers (across both units) with ball bearing slides, a chest depth of and cabinet depth of 16 to 19 inches; and combined unit weight (not shipping weight) of less than 420 lbs.
7 Other terms included net 105 days, net 10 days, 2/10 net 60, net 90 days, and 8 equal payments for
items over $1,000. 8 One purchaser reported purchasing as needed. 9 The four purchasers that reported changes in purchase patterns (***) attributed the change to their
firms’ overall growth or increased handling of tool chests and cabinets. 10 Among the largest purchasers, ***. ***. 11 Two purchasers contacted more suppliers; *** contacted 2 to 6 suppliers and *** contacted ***
suppliers. ***. 12 Snap On is a U.S. producer of industrial tool chests and cabinets. 13 Questionnaire recipients were directed not to include tool chests or cabinets sold with tools,
stereos, or refrigerators.

V-4
Product 3.-- 50 to 56 inch wide top chest sold in combination with a 50-56 inch wide rolling cabinet, each with a body of cold-rolled carbon steel, having 15 to 18 drawers (across both units) with ball bearing slides, a chest depth of and cabinet depth of 16 to 21 inches; and combined unit weight (not shipping weight) of less than 500 lbs.
Product 4.-- 45 to 56 inch wide workstation or mobile workbench, with a body of cold-rolled carbon
steel, having 8 to 11 drawers or doors with ball bearing slides, a top work surface, a unit depth of 17-24 inches, and a unit weight (not shipping weight) of less than 175 lbs. This category specifically excludes work stations or mobile workbenches in which the body is made of stainless steel but includes tool chests and cabinets in which the drawers or door fronts are made of stainless steel.
Two U.S. producers and six importers provided usable pricing data for sales of the
requested products, although not all firms reported pricing for all products for all quarters.14 15 Pricing data reported by these firms in 2016 accounted for approximately *** percent of U.S. producers’ commercial shipments of tool chests and cabinets, *** percent of U.S. commercial shipments of subject imports from China (*** percent of imports from China) and *** percent of U.S. commercial shipments of subject imports from Vietnam (*** percent of imports from Vietnam).
Price data for products 1-4 are presented in tables V-3 to V-6 and figures V-2 to V-5. In the following pricing and landed duty purchase cost tables a unit is either a top chest and rolling cabinet combination (for products 1-3) or an individual workstation or mobile workbench (for product 4). Table V-3 Tool chests and cabinets: Weighted-average f.o.b. prices and quantities of domestic and imported product 1 and margins of underselling/(overselling), by quarters, January 2014 to September 2017
* * * * * * * Table V-4 Tool chests and cabinets: Weighted-average f.o.b. prices and quantities of domestic and imported product 2 and margins of underselling/(overselling), by quarters, January 2014 to September 2017
* * * * * * *
14 Per-unit pricing data are calculated from total quantity and total value data provided by U.S.
producers and importers. The precision and variation of these figures may be affected by rounding, limited quantities, and producer or importer estimates.
15 A number of firms provided pricing information for products that did not match pricing product definitions. These data have not been included in this section.

V-5
Table V-5 Tool chests and cabinets: Weighted-average f.o.b. prices and quantities of domestic and imported product 3 and margins of underselling/(overselling), by quarters, January 2014 to September 2017
* * * * * * * Table V-6 Tool chests and cabinets: Weighted-average f.o.b. prices and quantities of domestic and imported product 4 and margins of underselling/(overselling), by quarters, January 2014 to September 2017
* * * * * * * Figure V-2 Tool chests and cabinets: Weighted-average prices and quantities of domestic and imported product 1, by quarters, January 2014 to September 2017
* * * * * * * Figure V-3 Tool chests and cabinets: Weighted-average prices and quantities of domestic and imported product 2, by quarters, January 2014 and September 2017
* * * * * * * Figure V-4 Tool chests and cabinets: Weighted-average prices and quantities of domestic and imported product 3, by quarters, January 2014 to September 2017
* * * * * * * Figure V-5 Tool chests and cabinets: Weighted-average prices and quantities of domestic and imported product 4, by quarters, January 2014 to September 2017
* * * * * * *
Import purchase cost data Import purchase cost data accounted for *** percent of imports from China and ***
percent of imports from Vietnam. Ten importers provided usable import purchase cost data for retail sales. Eight of these imported from China and two from Vietnam. The largest direct retail importers in 2016 were ***,16 ***, and ***. Purchase costs data from *** of these large retailers (***) accounted for *** percent of the units of total imports from China in 2016. Import purchase cost data from Vietnam were provided by two firms (***). *** purchase cost data alone accounted for *** percent of the units of total imports from Vietnam in 2016.
Import purchase cost data for products 1-4 are presented in tables V-7 to V-10 and figures V-6 to V-9. For product 1, the price of the U.S. product was higher than the import
16 ***.
V-6
purchase costs in all 15 comparisons. The U.S. price of product 2 was higher than import purchase costs of product 2 from China for 11 of the 13 comparisons and higher than Vietnamese purchase cost for 7 of 13 comparisons. The U.S. price of product 3 was higher than import purchase costs of product from China for 7 of the 8 comparisons and higher than Vietnamese purchase cost in all 12 comparisons. The U.S. price of product 4 was lower than import purchase costs imports from China in all 12 comparisons. Table V-7 Tool chests and cabinets: Weighted-average price and quantities of domestic and LDP value and quantities of imported product 1, by quarters, January 2014 to September 2017
* * * * * * * Table V-8 Tool chests and cabinets: Weighted-average price and quantities of domestic and LDP value and quantities of imported product 2, by quarters, January 2014 to September 2017
* * * * * * * Table V-9 Tool chests and cabinets: Weighted-average price and quantities of domestic and LDP value and quantities of imported product 3, by quarters, January 2014 to September 2017
* * * * * * * Table V-10 Tool chests and cabinets: Weighted-average price and quantities of domestic and LDP value and quantities of imported product 4, by quarters, January 2014 to September 2017
* * * * * * * Figure V-6 Tool chests and cabinets: Weighted-average prices and quantities of domestic and LDP value and quantities of imported product 1, by quarters, January 2014 to September 2017
* * * * * * * Figure V-7 Tool chests and cabinets: Weighted-average prices and quantities of domestic and LDP value and quantities of imported product 2, by quarters, January 2014 and September 2017
* * * * * * * Figure V-8 Tool chests and cabinets: Weighted-average prices and quantities of domestic and LDP value and quantities of imported product 3, by quarters, January 2014 to September 2017
* * * * * * *
V-7
Figure V-9 Tool chests and cabinets: Weighted-average prices and quantities of domestic and LDP value and quantities of imported product 4, by quarters, January 2014 to September 2017
* * * * * * *
Petitioner argues that it is “critical” that the Commission rely on the direct imports costs in this case because direct imports represent the “vast majority” of sales in the tool chest and cabinets market.17 It contends that the big box stores, which are direct importers, compare foreign producer prices to U.S. producer prices in their purchasing decisions.18 Petitioner concedes that there may be additional costs when firms import directly, however petitioner claims that respondents have not provided any examples of costs beyond the LDP costs to justify any adjustment of these LDP costs when these are compared to U.S. producer prices.19
Respondents argue that the Commission should rely on the price data rather than on the direct import purchase costs in this case.20 They added that direct import purchase costs do not include “the purchasing quality control and logistical function” that are critical elements of direct imports, and that these cost are more than the cost of shipping and duties.21 Respondents explain that in order to compare purchase costs data directly with price data as the petitioner advocates, the Commission would need to rely on constructed values. They further state that the Commission does not have the information needed to create such a constructed value and would probably be unable to create a meaningful constructed value if it tried to collect the information needed.22 Respondents also develop estimated “spreads” to argue that these data are not at the same level of trade and that there are additional costs beyond LDP values.23
Importers/retailers reporting import purchase cost data were asked to provide additional information related to this activity. Seven importers reported that the share of import purchase costs for logistical or supply chain ranged from 3 to 15 percent. Four importers reported warehouse costs of 2 to 7 percent and one reported 30 percent. No importers reported currency conversion costs or “other costs”; one importer explained that transactions are in dollars.
Three importers reported they compared the costs of imports to U.S. producer costs, four reported comparing import costs to prices from importers and U.S. producers, and six reported that they did not compare costs to either U.S. importers or producers. Ten importers reported benefits of direct importing including: wider selection (more specifications, greater customization, and features not available from domestic producers); quality; supplier
17 Petitioner’s posthearing brief, pp. 17-18. 18 Conference transcript, p. 35 (Cannon). 19 Petitioner’s posthearing brief, pp. 18-19. 20 Joint respondents’ brief, pp. 6-7. 21 Joint respondents’ brief, p. 7. and Attachment A. p. 36. “These include inventory carrying costs,
inventory overhead, supplier identification, supplier vetting, and other on-boarding vendors”. 22 Joint respondents’ brief, Attachment A. pp. 34-41. 23 Joint respondents’ brief, attachment A, pp. 39-40.
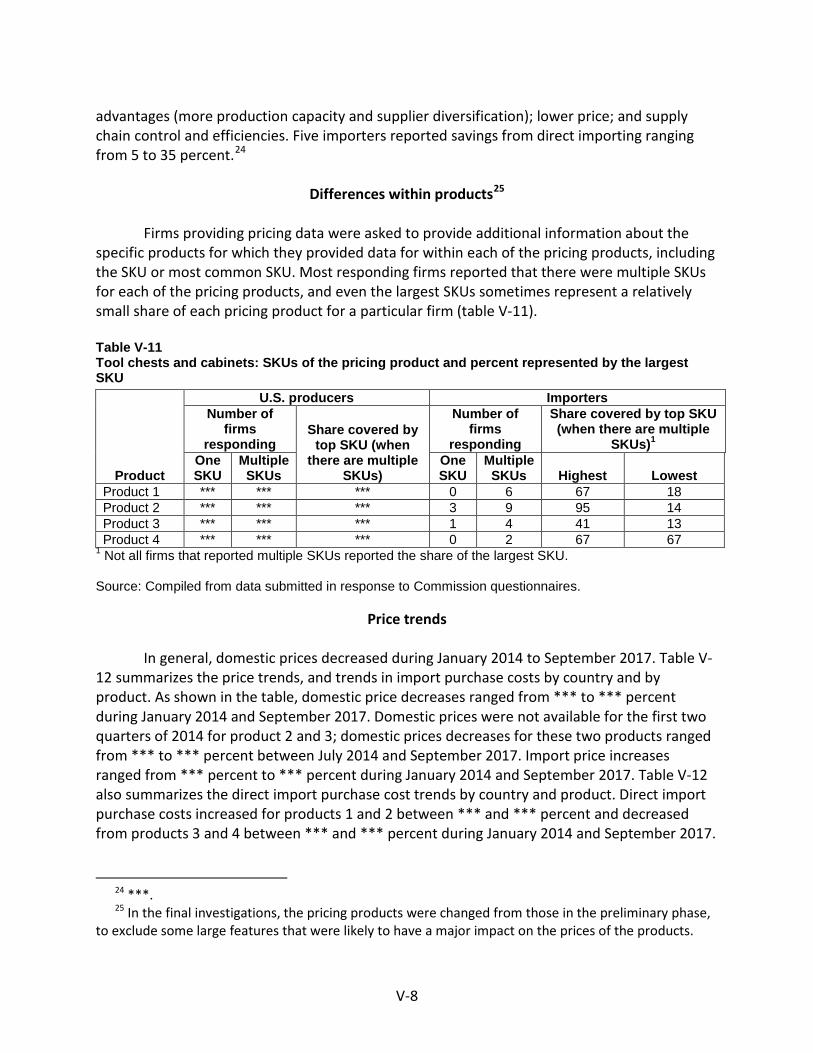
V-8
advantages (more production capacity and supplier diversification); lower price; and supply chain control and efficiencies. Five importers reported savings from direct importing ranging from 5 to 35 percent.24
Differences within products25
Firms providing pricing data were asked to provide additional information about the
specific products for which they provided data for within each of the pricing products, including the SKU or most common SKU. Most responding firms reported that there were multiple SKUs for each of the pricing products, and even the largest SKUs sometimes represent a relatively small share of each pricing product for a particular firm (table V-11). Table V-11 Tool chests and cabinets: SKUs of the pricing product and percent represented by the largest SKU
Product
U.S. producers Importers Number of
firms responding
Share covered by top SKU (when
there are multiple SKUs)
Number of firms
responding
Share covered by top SKU (when there are multiple
SKUs)1 One SKU
Multiple SKUs
One SKU
Multiple SKUs Highest Lowest
Product 1 *** *** *** 0 6 67 18 Product 2 *** *** *** 3 9 95 14 Product 3 *** *** *** 1 4 41 13 Product 4 *** *** *** 0 2 67 67
1 Not all firms that reported multiple SKUs reported the share of the largest SKU. Source: Compiled from data submitted in response to Commission questionnaires.
Price trends In general, domestic prices decreased during January 2014 to September 2017. Table V-
12 summarizes the price trends, and trends in import purchase costs by country and by product. As shown in the table, domestic price decreases ranged from *** to *** percent during January 2014 and September 2017. Domestic prices were not available for the first two quarters of 2014 for product 2 and 3; domestic prices decreases for these two products ranged from *** to *** percent between July 2014 and September 2017. Import price increases ranged from *** percent to *** percent during January 2014 and September 2017. Table V-12 also summarizes the direct import purchase cost trends by country and product. Direct import purchase costs increased for products 1 and 2 between *** and *** percent and decreased from products 3 and 4 between *** and *** percent during January 2014 and September 2017.
24 ***. 25 In the final investigations, the pricing products were changed from those in the preliminary phase,
to exclude some large features that were likely to have a major impact on the prices of the products.

V-9
Table V-12 Tool chests and cabinets: Summary of weighted-average f.o.b. prices and import purchase costs for products 1-4 from the United States, China, and Vietnam
* * * * * * *
Price comparisons As shown in table V-13, prices for product imported from China were below those for
U.S.-produced product in 11 of 41 instances (17,448 units); margins of underselling ranged from 0.3 to 42.5 percent and prices for product imported from Vietnam were below those for U.S.-produced product in 7 of 10 instances (*** units). Prices for product imported from China were above those for U.S.-produced product in 30 instances (16,667 units), by 0.4 to 100.2 percent, and prices for product imported from Vietnam were above those for U.S.-produced product in 2 instances (*** units), by 4.4 to 6.0 percent. Table V-13 Tool chests and cabinets: Instances of underselling/overselling and the range and average of margins, January 2014 and September 2017
Source
Underselling
Number of quarters
Quantity1 (units)
Average margin
(percent)
Margin range (percent)
Min Max
Product 1 1 *** *** *** *** Product 2 10 *** *** *** *** Product 3 6 *** *** *** *** Product 4 1 *** *** *** ***
Total, underselling 18 *** *** *** *** China 11 17,448 15.8 0.3 42.5 Vietnam 7 *** *** *** ***
Total, underselling 18 *** *** *** ***
Source
(Overselling)
Number of quarters
Quantity1 (units)
Average margin
(percent)
Margin Range (percent) Min Max
Product 1 14 *** *** *** *** Product 2 7 *** *** *** *** Product 3 9 *** *** *** *** Product 4 2 *** *** *** ***
Total, overselling 32 *** *** *** *** China 30 16,667 (39.1) (0.4) (100.2) Vietnam 2 *** *** *** ***
Total, overselling 32 *** *** *** *** 1 These data include only quarters in which there is a comparison between the U.S. and subject product. Source: Compiled from data submitted in response to Commission questionnaires.

V-10
Variation in product may in part be reflected in the different firms reporting pricing data. Product 1 pricing data were provided by *** and two importers of product from China (***). ***.26 Product 2 pricing data were provided by ***, three importers from China (***), and one importer from Vietnam ***. ***. ***.27 ***. Product 3 pricing data were provided by ***, two importers from China ***, and one importer from Vietnam ***. Product 4 pricing data were provided by *** and one importer from Vietnam ***.
LOST SALES AND LOST REVENUE
In the preliminary phase of these investigations, the Commission requested that U.S.
producers of tool chests and cabinets report purchasers where they experienced instances of lost sales or revenue due to competition from imports of tool chests and cabinets from China and Vietnam during 2014-16. *** submitted lost sales and lost revenue allegations. *** identified eight firms where they lost sales or revenue (six consisting lost sales allegations and two consisting of both types of allegations), consisting of approximately 648,800 units for both combined. U.S. producers identified China as the subject source for six of the eight identified purchasers and Vietnam for two purchasers. The timing for the allegations was 2014 through 2016 and the identified method of sale was “individual sale”.
In the final phase of these investigations, *** reported that they had to reduce prices and roll back announced price increases, and both firms reported that they had lost sales.
Staff contacted 44 purchasers28 and received responses from 2029 purchasers.30 Responding purchasers reported purchasing and importing 7.3 million tool chests and cabinets during January 2014 and September 2017 (table V-14). Table V-14 Tool chests and cabinets: Purchasers’ responses to purchasing patterns
* * * * * * *
Of the 20 responding purchasers, 11 reported that, since 2014, they had purchased imported tool chests and cabinets from China instead of U.S.-produced product and two reported that they had purchased tool chests from Vietnam instead of U.S.-produced product. Eight of these purchasers reported that Chinese import prices were lower than U.S.-produced product and two that Vietnamese import prices were lower than U.S.-produced product. None of these purchasers reported that price was a primary reason for the decision to purchase imported product rather than U.S.-produced product (table V-15). Purchasers identified the
26 Conference transcript, pp. 120-121. 27 ***. 28 Staff contacted purchasers of subject tool chests and cabinets as well as purchasers of industrial
tool chests and cabinets. It is unclear what products non-responding purchasers purchased. 29 Purchasers that only purchased industrial tool chests are not included in this section. 30 One purchaser submitted a lost sales lost revenue survey response in the preliminary phase, but
did not submit a purchaser questionnaire response in the final phase.
V-11
following non-price reasons for purchasing imported product rather than U.S.-produced product: customers demand specific product; quality; innovation and customization (able to produce small production runs, high quality and high automation allow for frequent model changes, able to provide stainless steel products); and availability. Some of these firms also reported that price also played a role in their decision to purchase imported product. Table V-15 Tool chests and cabinets: Purchasers’ responses to purchasing subject imports instead of domestic product
* * * * * * *
Of the 20 responding purchasers, one reported that U.S. producers had reduced prices in order to compete with lower-priced imports from China (table V-16); (12 reported that they did not know). The reported estimated price reduction was *** percent. In describing the price reductions, ***.
Table V-16 Tool chests and cabinets: Purchasers’ responses to U.S. producer price reductions
* * * * * * *

VI-1
PART VI: FINANCIAL EXPERIENCE OF U.S. PRODUCERS
BACKGROUND
U.S. producers Waterloo and MBI reported their financial results on tool chests and cabinets.1 *** accounted for the majority of total net sales value in 2016 (*** percent), followed by *** (*** percent).2 In July 2017, ***.3 4
Staff verified the financial data reported in ***’s U.S. producers’ questionnaire with its accounting records. The verification adjustments were incorporated into this report. ***.
OPERATIONS ON TOOL CHESTS AND CABINETS
Table VI-1 presents aggregated data on U.S. producers’ operations in relation to tool chests and cabinets. Table VI-2 shows the changes in average unit values of select financial indicators. Table VI-3 presents selected company-specific financial data.
Net sales
All reported sales were commercial sales sold *** in the United States. Based on table VI-1, the quantity and value of net sales decreased from 2014 to 2016 but were higher in January-September 2017 compared to January-September 2016. As shown in table VI-3, ***.5 6 7 Petitioner and respondents disagreed at the hearing regarding the causes of declining sales volumes from 2014 to 2016 by Waterloo and MBI. According to the respondents, Waterloo’s declining sales volume may be attributed to its dependence on its sales to Sears, by
1 Data for *** are included in table C-2. *** provided an incomplete U.S. producer questionnaire with no financial data in the preliminary phase of these investigations, while *** provided trade and financial information. Following the revision in the scope language, neither firm reported production of “tool chests and cabinets,” as defined. *** provided no financial data in the final phase of these investigations. Based on ***’s non-retail product shipment data, it reported *** units valued at $*** in 2016 and *** units valued at $*** in January-September 2017.
2 Both U.S. producers have fiscal years that end December 31, and reported their financial results on the basis of Generally Accepted Accounting Principles.
3 Commission staff interview with ***. In March 2017, Stanley Black & Decker completed the acquisition of the Craftsman brand from Sears Holdings Corp. The acquisition gave the right to develop, manufacture, and sell Craftsman-branded products outside Sears Holdings and Sears Hometown & Outlet Stores distribution channels. Stanley Black & Decker’s webpage, http://ir.stanleyblackanddecker.com/phoenix.zhtml?c=114416&p=irol-newsArticle&ID=2252727, retrieved on November 7, 2017.
4 At Staff’s request, Waterloo provided ***. See EDIS Doc. ID 629270. 5 ***. Email from ***, November 2, 2017. 6 ***. Email from ***, November 1, 2017. 7 Waterloo stated that ***. Email from ***, December 7, 2017.
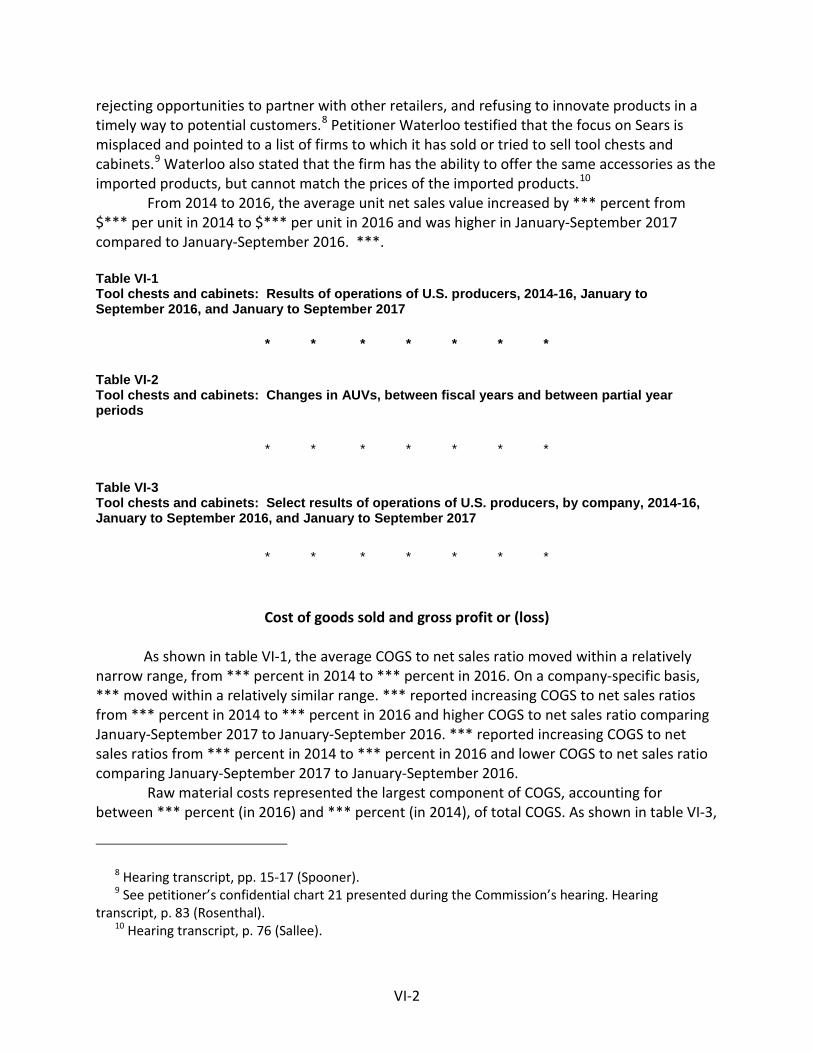
VI-2
rejecting opportunities to partner with other retailers, and refusing to innovate products in a timely way to potential customers.8 Petitioner Waterloo testified that the focus on Sears is misplaced and pointed to a list of firms to which it has sold or tried to sell tool chests and cabinets.9 Waterloo also stated that the firm has the ability to offer the same accessories as the imported products, but cannot match the prices of the imported products.10
From 2014 to 2016, the average unit net sales value increased by *** percent from $*** per unit in 2014 to $*** per unit in 2016 and was higher in January-September 2017 compared to January-September 2016. ***.
Table VI-1 Tool chests and cabinets: Results of operations of U.S. producers, 2014-16, January to September 2016, and January to September 2017
* * * * * * *
Table VI-2 Tool chests and cabinets: Changes in AUVs, between fiscal years and between partial year periods
* * * * * * *
Table VI-3 Tool chests and cabinets: Select results of operations of U.S. producers, by company, 2014-16, January to September 2016, and January to September 2017
* * * * * * *
Cost of goods sold and gross profit or (loss)
As shown in table VI-1, the average COGS to net sales ratio moved within a relatively narrow range, from *** percent in 2014 to *** percent in 2016. On a company-specific basis, *** moved within a relatively similar range. *** reported increasing COGS to net sales ratios from *** percent in 2014 to *** percent in 2016 and higher COGS to net sales ratio comparing January-September 2017 to January-September 2016. *** reported increasing COGS to net sales ratios from *** percent in 2014 to *** percent in 2016 and lower COGS to net sales ratio comparing January-September 2017 to January-September 2016.
Raw material costs represented the largest component of COGS, accounting for between *** percent (in 2016) and *** percent (in 2014), of total COGS. As shown in table VI-3,
8 Hearing transcript, pp. 15-17 (Spooner). 9 See petitioner’s confidential chart 21 presented during the Commission’s hearing. Hearing
transcript, p. 83 (Rosenthal). 10 Hearing transcript, p. 76 (Sallee).
VI-3
the average unit raw material cost increased by *** percent from $*** in 2014 to $*** in 2016 and was higher in January-September 2017 compared to January-September 2016. ***.
Other factory costs (“OFC”) were the second largest component of COGS, accounting for between *** percent (in 2014) and *** percent (in 2015), while direct labor accounted for between *** percent (in 2014) and *** percent (in January-September 2017).11 As shown in table VI-3, the average unit OFC increased by *** percent from $*** in 2014 to $*** in 2016 and was higher in January-September 2017 compared to January-September 2016. ***.12
The industry’s gross profit decreased from $*** in 2014 to $*** in 2016 as the decline in total net sales value was greater than the decline in COGS. The gross profit was higher in January-September 2017 compared to January-September 2016 as the increase in total net sales value was greater than the increase in COGS.
On a company-specific basis, ***.
SG&A expenses and operating income or (loss)
As shown in table VI-1, the industry’s SG&A expense ratio (i.e., total SG&A expenses divided by total net sales value) ranged from *** percent in 2014 to *** percent in January-September 2017. The SG&A ratio was higher in each successive period.
Operating income followed the same trend as gross profit, decreasing from $*** in 2014 to $*** in 2016 and was higher in January-September 2017 compared to January-September 2016. On a company-specific basis, ***.
Other expenses net income or (loss)
Classified below the operating income level are interest expense, other expense, and other income. U.S. producers did not report any other expenses, therefore net income or (loss) is the same as operating income or (loss).
Variance analysis
Due to large variations in per-unit data among the reporting U.S. producers, a variance analysis is not presented in this report.
11 Waterloo stated that ***. Email from ***, December 7, 2017. 12 ***. Email from ***, May 8, 2017.
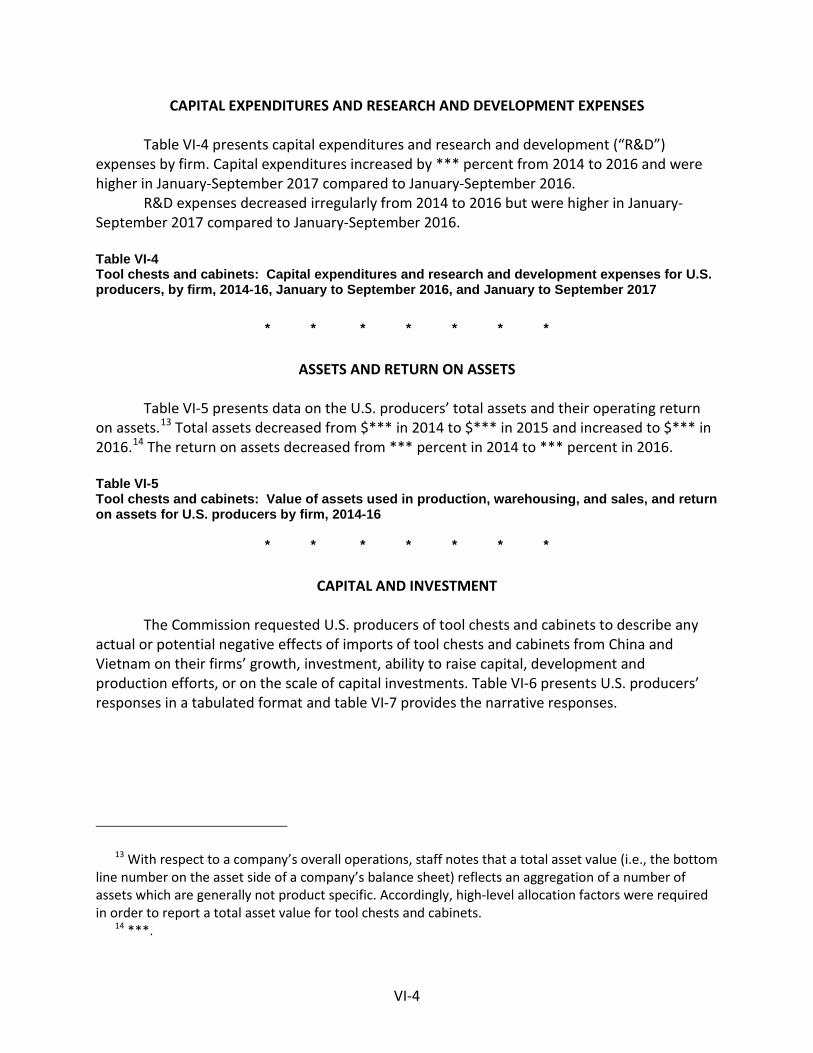
VI-4
CAPITAL EXPENDITURES AND RESEARCH AND DEVELOPMENT EXPENSES
Table VI-4 presents capital expenditures and research and development (“R&D”) expenses by firm. Capital expenditures increased by *** percent from 2014 to 2016 and were higher in January-September 2017 compared to January-September 2016.
R&D expenses decreased irregularly from 2014 to 2016 but were higher in January-September 2017 compared to January-September 2016.
Table VI-4 Tool chests and cabinets: Capital expenditures and research and development expenses for U.S. producers, by firm, 2014-16, January to September 2016, and January to September 2017
* * * * * * *
ASSETS AND RETURN ON ASSETS
Table VI-5 presents data on the U.S. producers’ total assets and their operating return on assets.13 Total assets decreased from $*** in 2014 to $*** in 2015 and increased to $*** in 2016.14 The return on assets decreased from *** percent in 2014 to *** percent in 2016.
Table VI-5 Tool chests and cabinets: Value of assets used in production, warehousing, and sales, and return on assets for U.S. producers by firm, 2014-16
* * * * * * *
CAPITAL AND INVESTMENT
The Commission requested U.S. producers of tool chests and cabinets to describe any actual or potential negative effects of imports of tool chests and cabinets from China and Vietnam on their firms’ growth, investment, ability to raise capital, development and production efforts, or on the scale of capital investments. Table VI-6 presents U.S. producers’ responses in a tabulated format and table VI-7 provides the narrative responses.
13 With respect to a company’s overall operations, staff notes that a total asset value (i.e., the bottom line number on the asset side of a company’s balance sheet) reflects an aggregation of a number of assets which are generally not product specific. Accordingly, high-level allocation factors were required in order to report a total asset value for tool chests and cabinets.
14 ***.

VI-5
Table VI-6 Tool chests and cabinets: Actual and anticipated negative effects of imports on investment and growth and development
* * * * * * * Table VI-7 Tool chests and cabinets: Narratives relating to actual and anticipated negative effects of imports on investment and growth and development, since January 1, 2014
* * * * * * *

VII-1
PART VII: THREAT CONSIDERATIONS AND INFORMATION ON NONSUBJECT COUNTRIES
Section 771(7)(F)(i) of the Act (19 U.S.C. § 1677(7)(F)(i)) provides that—
In determining whether an industry in the United States is threatened with material injury by reason of imports (or sales for importation) of the subject merchandise, the Commission shall consider, among other relevant economic factors1--
(I) if a countervailable subsidy is involved, such information as may be presented to it by the administering authority as to the nature of the subsidy (particularly as to whether the countervailable subsidy is a subsidy described in Article 3 or 6.1 of the Subsidies Agreement), and whether imports of the subject merchandise are likely to increase,
(II) any existing unused production capacity or imminent, substantial increase in production capacity in the exporting country indicating the likelihood of substantially increased imports of the subject merchandise into the United States, taking into account the availability of other export markets to absorb any additional exports,
(III) a significant rate of increase of the volume or market penetration of imports of the subject merchandise indicating the likelihood of substantially increased imports,
(IV) whether imports of the subject merchandise are entering at prices that are likely to have a significant depressing or suppressing effect on domestic prices, and are likely to increase demand for further imports,
(V) inventories of the subject merchandise, (VI) the potential for product-shifting if production facilities in the
foreign country, which can be used to produce the subject merchandise, are currently being used to produce other products,
1 Section 771(7)(F)(ii) of the Act (19 U.S.C. § 1677(7)(F)(ii)) provides that “The Commission shall consider {these factors} . . . as a whole in making a determination of whether further dumped or subsidized imports are imminent and whether material injury by reason of imports would occur unless an order is issued or a suspension agreement is accepted under this title. The presence or absence of any factor which the Commission is required to consider . . . shall not necessarily give decisive guidance with respect to the determination. Such a determination may not be made on the basis of mere conjecture or supposition.”
VII-2
(VII) in any investigation under this title which involves imports of both a raw agricultural product (within the meaning of paragraph (4)(E)(iv)) and any product processed from such raw agricultural product, the likelihood that there will be increased imports, by reason of product shifting, if there is an affirmative determination by the Commission under section 705(b)(1) or 735(b)(1) with respect to either the raw agricultural product or the processed agricultural product (but not both),
(VIII) the actual and potential negative effects on the existing development and production efforts of the domestic industry, including efforts to develop a derivative or more advanced version of the domestic like product, and
(IX) any other demonstrable adverse trends that indicate the probability that there is likely to be material injury by reason of imports (or sale for importation) of the subject merchandise (whether or not it is actually being imported at the time).2
Information on the nature of the subsidies was presented in Part I earlier in this report; information on the volume and pricing of imports of the subject merchandise is presented in Parts IV and V; and information on the effects of imports of the subject merchandise on U.S. producers’ existing development and production efforts is presented in Part VI. Information on inventories of the subject merchandise; foreign producers’ operations, including the potential for “product-shifting;” any other threat indicators, if applicable; and any dumping in third-country markets, follows. Also presented in this section of the report is information obtained for consideration by the Commission on nonsubject countries.
THE INDUSTRY IN CHINA
The Commission issued foreign producers’ or exporters’ questionnaires to 44 firms
believed to produce and/or resell tool chests and cabinets from China.3 Usable responses to the Commission’s questionnaire were received from 14 firms. These firms’ exports to the United States accounted for the majority of U.S. imports of tool chests and cabinets from China in 2016. According to the estimate of production of tool chests and cabinets in China, the responding Chinese producers represent the majority of tool chests and cabinets production in
2 Section 771(7)(F)(iii) of the Act (19 U.S.C. § 1677(7)(F)(iii)) further provides that, in antidumping investigations, “. . . the Commission shall consider whether dumping in the markets of foreign countries (as evidenced by dumping findings or antidumping remedies in other WTO member markets against the same class or kind of merchandise manufactured or exported by the same party as under investigation) suggests a threat of material injury to the domestic industry.”
3 These firms were identified through a review of information submitted in the petition and contained in *** records.

VII-3
China. Table VII-1 presents information on the tool chest and cabinet operations of the responding producers in China, and table IV-2 presents information on responding resellers. Table VII-1 Tool chests and cabinets: Summary data for producers in China, 2016
Firm Production (in units)
Share of reported
production (percent)
Exports to the United States (in
units)
Share of reported
exports to the United
States (percent)
Total shipments (in units)
Share of firm's total shipments exported
to the United States
(percent) Changzhou City *** *** *** *** *** *** Changshu Zhongcheng *** *** *** *** *** *** Homesteel Industry *** *** *** *** *** *** Hutchin *** *** *** *** *** *** Jiangsu Tongrun *** *** *** *** *** *** Jin Rong *** *** *** *** *** *** Jinhua JG *** *** *** *** *** *** Meridian (China) *** *** *** *** *** *** Suzhou Xindadi *** *** *** *** *** *** Trantex *** *** *** *** *** *** Yangzhou Triple Harvest *** *** *** *** *** *** Zhongshan Geelong *** *** *** *** *** ***
Total *** *** *** *** *** *** Source: Compiled from data submitted in response to Commission questionnaires. Table VII-2 Tool chests and cabinets: Summary data for reseller in China, 2016
Firm Resales exported to the United States
(in units) Share of reported resales exported to
the United States (percent) Shanghai ITPC *** ***
Total *** *** Source: Compiled from data submitted in response to Commission questionnaires.
Changes in operations
Table VII-3 presents Chinese producers’ reported organizational changes since January 1, 2014. There was one reported plant opening ***, one relocation of a plant *** to meet growing business needs, three reported expansions ***, one reported acquisitions ***, one prolonged shutdown or curtailment, and three revised labor agreements ***. Table VII-3 Tool chests and cabinets: Chinese producers' reported changes in operations, since January 1, 2014
* * * * * * *
VII-4
Operations on tool chests and cabinets
Table VII-4 presents information on the tool chest and cabinet operations of the responding producers and exporters in China. Reported capacity increased by *** percent from 2014 to 2015, increased by *** percent from 2015 to 2016, and is projected to increase by *** percent from 2016 to 2017 and increase by *** percent from 2017 to 2018. Reported production increased by *** percent from 2014 to 2015, decreased by *** percent from 2015 to 2016, and is projected to increase by *** from 2016 to 2017 but then decrease by *** percent from 2017 to 2018. Capacity utilization decreased by *** percentage points from 2014 to 2016, and is projected to increase in 2017 and is expected to have its largest decline in 2018. Reported exports to the United States increased by *** percent from 2014 to 2015, decreased by *** percent from 2015 to 2016, and are projected to increase by *** percent from 2016 to 2017 before decreasing by *** percent from 2017 to 2018.
Table VII-4 Tool chest and cabinets: Data for producers in China, 2014-16, January to September 2016, January to September 2016, and projection calendar years 2017 and 2018
* * * * * * *
Alternative products
*** of the responding Chinese firms (including ***) reported production of other products on the same machinery as tool chests and cabinets as well as the ability to switch production between tool chests and cabinets and other products, using the same equipment and/or labor. Firms reported being able to switch production to charcoal and gas grills and accessories, custom coolers, storage cabinets, workbenches without drawers, shelving, job site boxes, creeper and roller cabinet seats, service carts, saws and saw stands, motors, drill presses, cement mixers, dust collectors, wood chippers, tillers, edgers, chicken pluckers, and other metal sheet products. Firms reported downtime due to changing colors, time, machine, and labor capacity, common tooling and machinery, order size and lead time, designing, and efficiency standards as factors impacting their ability to switch production.
Table VII-5 presents data on Chinese producers’ capacity and production of other products using the same equipment and machinery as tool chests and cabinets. Tool chests and cabinets, as a share of total production on this equipment and machinery, ranged from *** percent to *** percent during the period for which data were collected. Table VII-5 Tool chests and cabinets: Chinese producers' overall capacity and production on the same equipment as subject production, 2014-16, January to September 2016, and January to September 2017
* * * * * * *

VII-5
Exports
According to GTA,4 the leading export markets for metal furniture and articles of iron or steel from China are presented in table VII-6. During 2016, the United States was the top export market for metal furniture and articles of iron or steel from China (30.5 percent), followed by Japan (6.7 percent), the United Kingdom (4.3 percent), and Germany (4.2 percent). Table VII-6 Metal furniture and articles of iron or steel: Exports from China, 2014-16
Destination market Calendar year
2014 2015 2016 Value ($1,000) China exports to the United States 3,388,157 3,836,901 3,506,353 China exports to other major destination markets.-- Japan 894,655 807,212 771,246
United Kingdom 501,503 553,498 491,126 Germany 504,229 514,956 482,361 Australia 437,402 453,558 424,663
Korea 326,519 344,654 342,892 Canada 349,752 358,319 313,382 Hong Kong 315,021 357,887 305,319 Netherlands 367,477 340,263 284,188 France 273,518 288,481 269,723 India 144,588 172,098 252,271 All other destination markets 5,289,903 4,806,780 4,047,568
Total China exports 12,792,722 12,834,606 11,491,093 Continues on the next page
4 HS subheading 9403.20 specifies “metal furniture, nesoi,” and HS subheading 7326.90 specifies “articles of iron or steel, nesoi.”
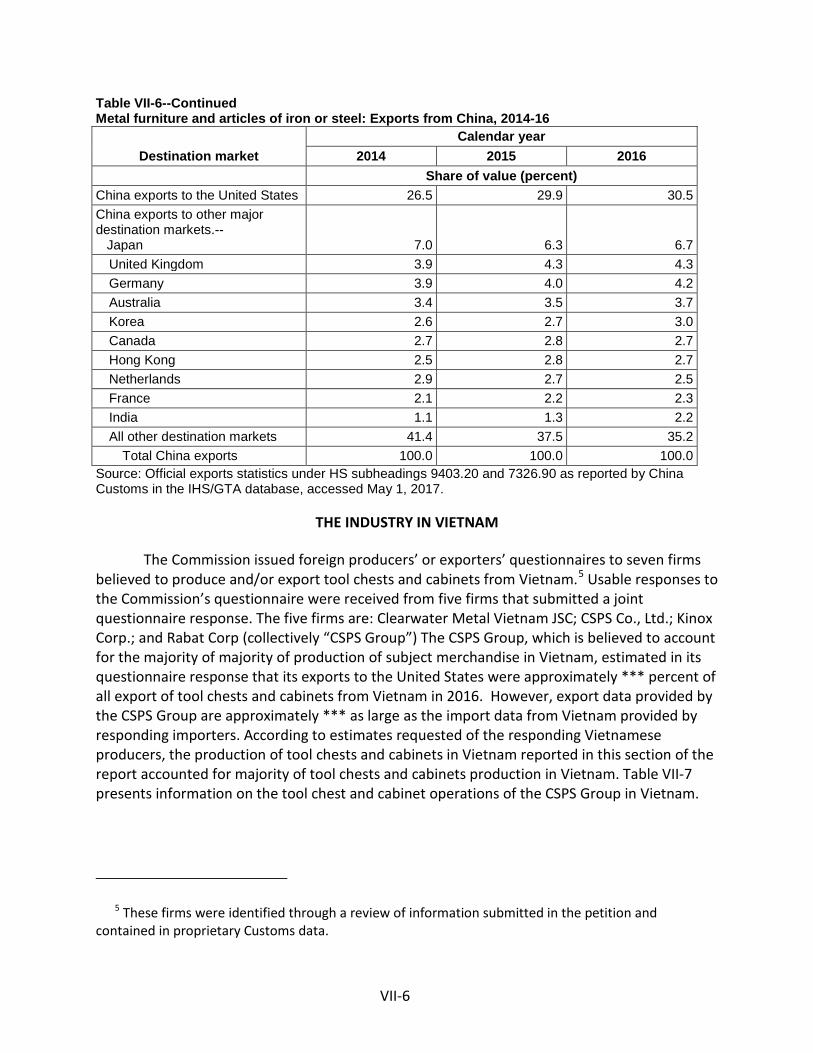
VII-6
Table VII-6--Continued Metal furniture and articles of iron or steel: Exports from China, 2014-16
Destination market Calendar year
2014 2015 2016 Share of value (percent) China exports to the United States 26.5 29.9 30.5 China exports to other major destination markets.-- Japan 7.0 6.3 6.7
United Kingdom 3.9 4.3 4.3 Germany 3.9 4.0 4.2 Australia 3.4 3.5 3.7 Korea 2.6 2.7 3.0 Canada 2.7 2.8 2.7 Hong Kong 2.5 2.8 2.7 Netherlands 2.9 2.7 2.5 France 2.1 2.2 2.3 India 1.1 1.3 2.2 All other destination markets 41.4 37.5 35.2
Total China exports 100.0 100.0 100.0 Source: Official exports statistics under HS subheadings 9403.20 and 7326.90 as reported by China Customs in the IHS/GTA database, accessed May 1, 2017.
THE INDUSTRY IN VIETNAM
The Commission issued foreign producers’ or exporters’ questionnaires to seven firms believed to produce and/or export tool chests and cabinets from Vietnam.5 Usable responses to the Commission’s questionnaire were received from five firms that submitted a joint questionnaire response. The five firms are: Clearwater Metal Vietnam JSC; CSPS Co., Ltd.; Kinox Corp.; and Rabat Corp (collectively “CSPS Group”) The CSPS Group, which is believed to account for the majority of majority of production of subject merchandise in Vietnam, estimated in its questionnaire response that its exports to the United States were approximately *** percent of all export of tool chests and cabinets from Vietnam in 2016. However, export data provided by the CSPS Group are approximately *** as large as the import data from Vietnam provided by responding importers. According to estimates requested of the responding Vietnamese producers, the production of tool chests and cabinets in Vietnam reported in this section of the report accounted for majority of tool chests and cabinets production in Vietnam. Table VII-7 presents information on the tool chest and cabinet operations of the CSPS Group in Vietnam.
5 These firms were identified through a review of information submitted in the petition and contained in proprietary Customs data.
VII-7
Table VII-7 Tool chests and cabinets: Summary data for producers in Vietnam, 2016
Firm Production (in units)
Share of reported
production (percent)
Exports to the United States (in
units)
Share of reported
exports to the United
States (percent)
Total shipments (in units)
Share of firm's total shipments exported to the United
States (percent)
CSPS Group *** *** *** *** *** *** Total *** *** *** *** *** ***
Source: Compiled from data submitted in response to Commission questionnaires.
Changes in operations
As presented in table VII-8, the CSPS Group reported ***, since January 1, 2014.
Table VII-8 Tool chests and cabinets: Vietnamese producers' reported changes in operations, since January 1, 2014
* * * * * * *
Operations on tool chests and cabinets
Table VII-9 presents information on the tool chest and cabinet operations of the CSPS Group in Vietnam. From 2014 to 2016, reported capacity increased by *** percent and is projected to remain at 2016 levels in 2017 and 2018. Reported production increased by ***percent from 2014 to 2015 before decreasing by *** percent from 2015 to 2016, and is projected to decrease by an additional *** percent in 2017. Capacity utilization decreased by *** percentage points from 2014 to 2016, and is projected to decreased by an additional *** percentage points in 2017. Reported exports to the United States increased by*** percent from 2014 to 2015, decreased by ***percent from 2015 to 2016, and are projected to decrease by an additional *** in 2017. Exports to the United States as a share of total shipments ranged between *** and ***percent from 2014 to 2016, and are projected to decrease to *** in 2017. Table VII-9 Tool chests and cabinets: Data for producers in Vietnam, 2014-16, January to September 2016, and January to September 2017 and projection calendar years 2017 and 2018
* * * * * * *
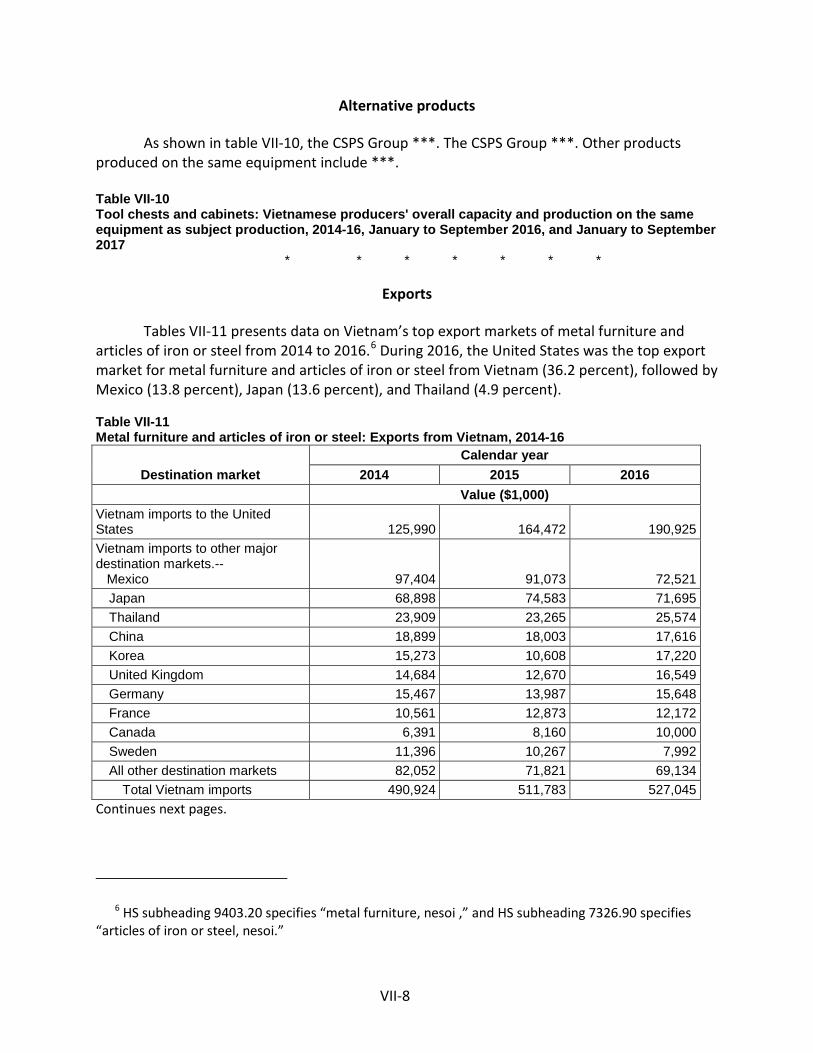
VII-8
Alternative products
As shown in table VII-10, the CSPS Group ***. The CSPS Group ***. Other products produced on the same equipment include ***.
Table VII-10 Tool chests and cabinets: Vietnamese producers' overall capacity and production on the same equipment as subject production, 2014-16, January to September 2016, and January to September 2017
* * * * * * *
Exports
Tables VII-11 presents data on Vietnam’s top export markets of metal furniture and articles of iron or steel from 2014 to 2016.6 During 2016, the United States was the top export market for metal furniture and articles of iron or steel from Vietnam (36.2 percent), followed by Mexico (13.8 percent), Japan (13.6 percent), and Thailand (4.9 percent). Table VII-11 Metal furniture and articles of iron or steel: Exports from Vietnam, 2014-16
Destination market Calendar year
2014 2015 2016 Value ($1,000) Vietnam imports to the United States 125,990 164,472 190,925 Vietnam imports to other major destination markets.-- Mexico 97,404 91,073 72,521
Japan 68,898 74,583 71,695 Thailand 23,909 23,265 25,574 China 18,899 18,003 17,616 Korea 15,273 10,608 17,220 United Kingdom 14,684 12,670 16,549 Germany 15,467 13,987 15,648 France 10,561 12,873 12,172 Canada 6,391 8,160 10,000 Sweden 11,396 10,267 7,992 All other destination markets 82,052 71,821 69,134
Total Vietnam imports 490,924 511,783 527,045 Continues next pages.
6 HS subheading 9403.20 specifies “metal furniture, nesoi ,” and HS subheading 7326.90 specifies “articles of iron or steel, nesoi.”

VII-9
Table VII-11--Continued Metal furniture and articles of iron or steel: Exports from Vietnam, 2014-16
Destination market Calendar year
2014 2015 2016 Share of value (percent) Vietnam imports to the United States 25.7 32.1 36.2 Vietnam imports to other major destination markets.-- Mexico 19.8 17.8 13.8
Japan 14.0 14.6 13.6 Thailand 4.9 4.5 4.9 China 3.8 3.5 3.3 Korea 3.1 2.1 3.3 United Kingdom 3.0 2.5 3.1 Germany 3.2 2.7 3.0 France 2.2 2.5 2.3 Canada 1.3 1.6 1.9 Sweden 2.3 2.0 1.5 All other destination markets 16.7 14.0 13.1
Total Vietnam imports 100.0 100.0 100.0 Source: Official imports statistics of imports from Vietnam under HS subheadings 9403.20 and 7326.90 as reported by various countries’ statistical authorities in the IHS/GTA database, accessed May 1, 2017.
THE INDUSTRIES IN THE SUBJECT COUNTRIES
Table VII-12 presents information on the tool chest and cabinet operations of the responding producers and exporters in China and Vietnam combined. Responding Chinese firms accounted for *** of the combined subject country data. The combined capacity in the subject countries increased by 44.1 percent from 2014 to 2016, and is projected to increase slightly in 2017 and 2018. Combined production increased by 16.6 percent from 2014 to 2015, decreased by 4.7 percent from 2015 to 2016, and are projected to increase slightly in 2017 and decrease slightly in 2018. Combined capacity utilization decreased by 17.0 percentage points from 2014 to 2016 settling at 56.7 percent, and is expected to increase in 2017 but decrease in 2018. Combined exports to the United States increased by 29.0 percent from 2014 to 2015, decreased by 7.0 percent from 2015 to 2016, and are projected to increase by 5.5 in 2017 before decreasing by 39.0 percent from 2017 to 2018. Combined exports to the United States as a share of total combined shipments ranged from 61.2 percent to 65.0 percent from 2014 to 2016, and are projected to decrease to 48.3 percent by 2018.
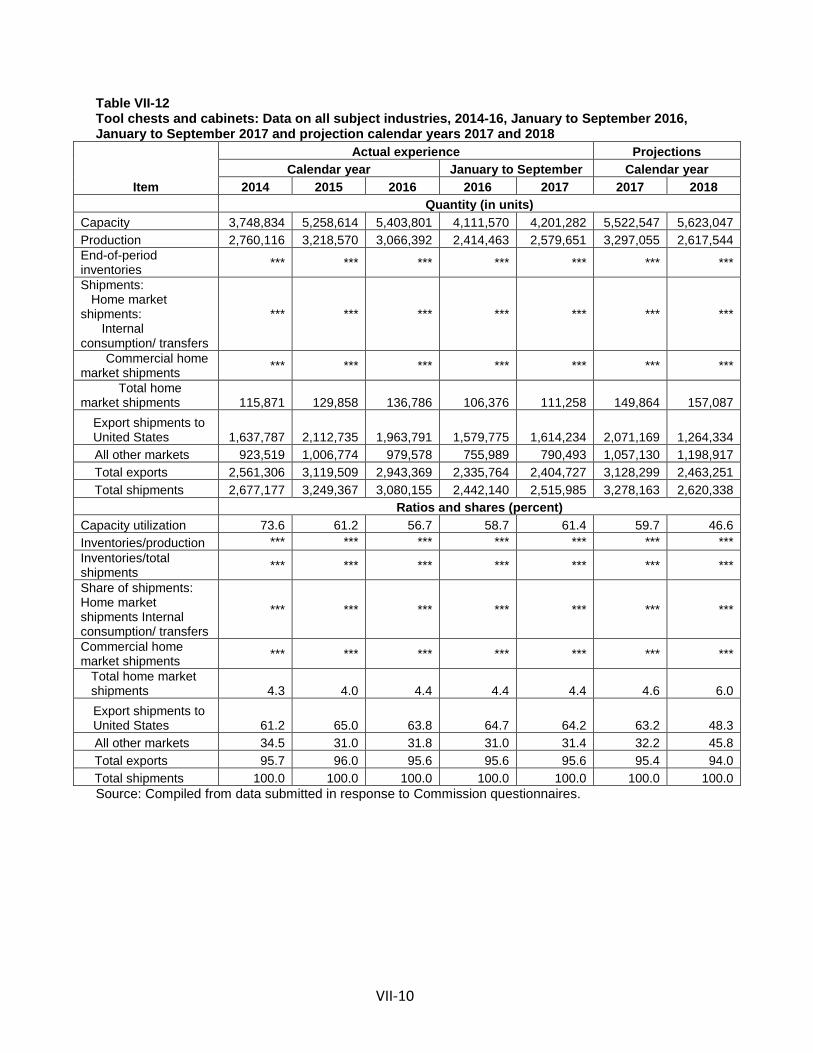
VII-10
Table VII-12 Tool chests and cabinets: Data on all subject industries, 2014-16, January to September 2016, January to September 2017 and projection calendar years 2017 and 2018
Item
Actual experience Projections Calendar year January to September Calendar year
2014 2015 2016 2016 2017 2017 2018 Quantity (in units) Capacity 3,748,834 5,258,614 5,403,801 4,111,570 4,201,282 5,522,547 5,623,047 Production 2,760,116 3,218,570 3,066,392 2,414,463 2,579,651 3,297,055 2,617,544 End-of-period inventories *** *** *** *** *** *** ***
Shipments: Home market shipments: Internal consumption/ transfers
*** *** *** *** *** *** ***
Commercial home market shipments *** *** *** *** *** *** ***
Total home market shipments 115,871 129,858 136,786 106,376 111,258 149,864 157,087
Export shipments to United States 1,637,787 2,112,735 1,963,791 1,579,775 1,614,234 2,071,169 1,264,334
All other markets 923,519 1,006,774 979,578 755,989 790,493 1,057,130 1,198,917 Total exports 2,561,306 3,119,509 2,943,369 2,335,764 2,404,727 3,128,299 2,463,251 Total shipments 2,677,177 3,249,367 3,080,155 2,442,140 2,515,985 3,278,163 2,620,338 Ratios and shares (percent) Capacity utilization 73.6 61.2 56.7 58.7 61.4 59.7 46.6 Inventories/production *** *** *** *** *** *** *** Inventories/total shipments *** *** *** *** *** *** ***
Share of shipments: Home market shipments Internal consumption/ transfers
*** *** *** *** *** *** ***
Commercial home market shipments *** *** *** *** *** *** ***
Total home market shipments 4.3 4.0 4.4 4.4 4.4 4.6 6.0
Export shipments to United States 61.2 65.0 63.8 64.7 64.2 63.2 48.3
All other markets 34.5 31.0 31.8 31.0 31.4 32.2 45.8 Total exports 95.7 96.0 95.6 95.6 95.6 95.4 94.0 Total shipments 100.0 100.0 100.0 100.0 100.0 100.0 100.0
Source: Compiled from data submitted in response to Commission questionnaires.

VII-11
Table VII-13 presents data on combined subject producers’ capacity and production of other tool chests and cabinets and other products, using the same equipment and machinery as tool chests and cabinets. Tool chests and cabinets, as a share of total production on this equipment and machinery, ranged from 27.5 percent to 28.1 percent from 2014 to 2016. Table VII-13 Tool chests and cabinets: Overall capacity and production on the same equipment as in-scope production for producers in subject industries, 2014-16, January to September 2016, January to September 2017
Item Calendar year January to September
2014 2015 2016 2016 2017 Quantity (in units) Overall capacity 12,652,026 12,898,786 13,243,566 9,904,904 11,121,649 Production: Tool chests and cabinets 2,760,116 3,218,570 3,066,392 2,414,463 2,579,651
Other tool chest and cabinets 623,682 581,222 747,810 571,203 480,716 Other products 6,455,132 7,785,231 7,330,097 5,575,924 5,828,509 Out-of-scope production 7,078,814 8,366,453 8,077,907 6,147,127 6,309,225
Total production on same machinery 9,838,930 11,585,023 11,144,299 8,561,590 8,888,876 Ratios and shares (percent) Overall capacity utilization 77.8 89.8 84.1 86.4 79.9 Share of production: Tool chests and cabinets 28.1 27.8 27.5 28.2 29.0
Other tool chest and cabinets 6.3 5.0 6.7 6.7 5.4 Other products 65.6 67.2 65.8 65.1 65.6 Out-of-scope production 71.9 72.2 72.5 71.8 71.0
Total production on same machinery 100.0 100.0 100.0 100.0 100.0 Source: Compiled from data submitted in response to Commission questionnaires.
U.S. INVENTORIES OF IMPORTED MERCHANDISE
Table VII-14 presents data on U.S. importers’ reported inventories of tool chests and cabinets. Inventories of imports from China increased by *** percent from 2014 to 2016, while inventories of imports from Vietnam increased by *** percent. Over the same period, inventories from the subject sources combined increased by 79.4 percent.
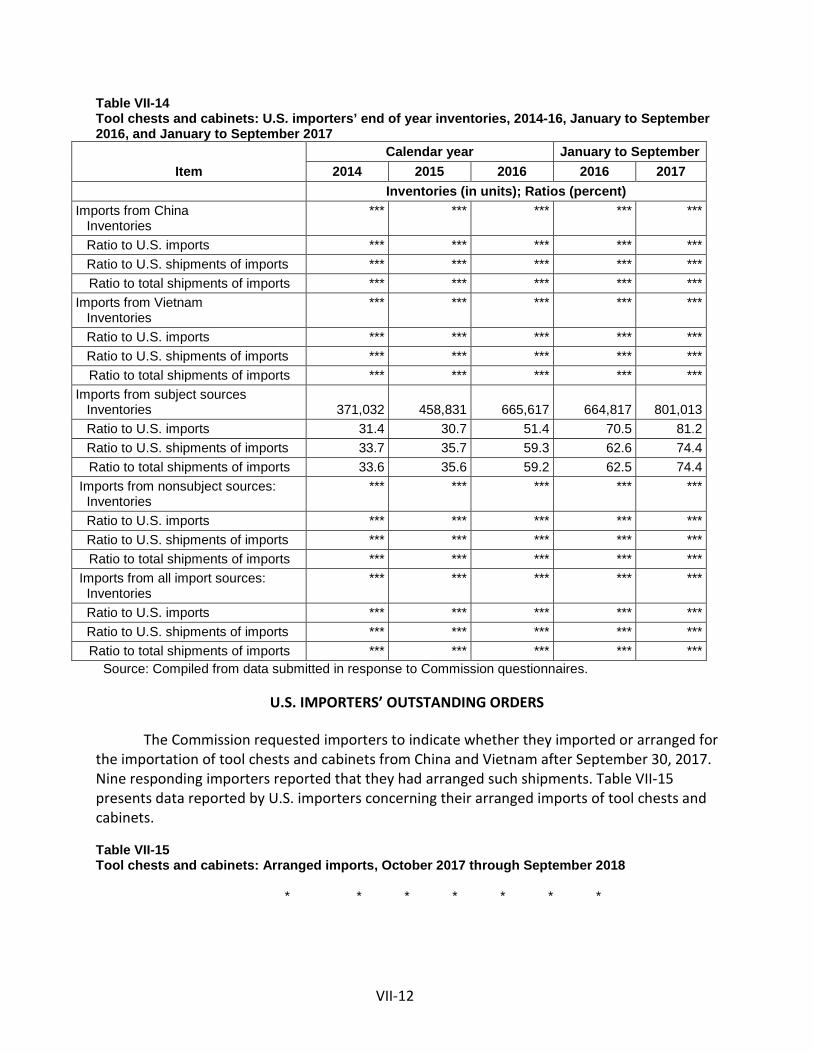
VII-12
Table VII-14 Tool chests and cabinets: U.S. importers’ end of year inventories, 2014-16, January to September 2016, and January to September 2017
Item Calendar year January to September
2014 2015 2016 2016 2017 Inventories (in units); Ratios (percent)
Imports from China Inventories
*** *** *** *** ***
Ratio to U.S. imports *** *** *** *** *** Ratio to U.S. shipments of imports *** *** *** *** ***
Ratio to total shipments of imports *** *** *** *** *** Imports from Vietnam Inventories
*** *** *** *** ***
Ratio to U.S. imports *** *** *** *** *** Ratio to U.S. shipments of imports *** *** *** *** ***
Ratio to total shipments of imports *** *** *** *** *** Imports from subject sources Inventories 371,032 458,831 665,617 664,817 801,013 Ratio to U.S. imports 31.4 30.7 51.4 70.5 81.2 Ratio to U.S. shipments of imports 33.7 35.7 59.3 62.6 74.4
Ratio to total shipments of imports 33.6 35.6 59.2 62.5 74.4 Imports from nonsubject sources: Inventories
*** *** *** *** ***
Ratio to U.S. imports *** *** *** *** *** Ratio to U.S. shipments of imports *** *** *** *** ***
Ratio to total shipments of imports *** *** *** *** *** Imports from all import sources: Inventories
*** *** *** *** ***
Ratio to U.S. imports *** *** *** *** *** Ratio to U.S. shipments of imports *** *** *** *** ***
Ratio to total shipments of imports *** *** *** *** *** Source: Compiled from data submitted in response to Commission questionnaires.
U.S. IMPORTERS’ OUTSTANDING ORDERS
The Commission requested importers to indicate whether they imported or arranged for the importation of tool chests and cabinets from China and Vietnam after September 30, 2017. Nine responding importers reported that they had arranged such shipments. Table VII-15 presents data reported by U.S. importers concerning their arranged imports of tool chests and cabinets. Table VII-15 Tool chests and cabinets: Arranged imports, October 2017 through September 2018
* * * * * * *
VII-13
ANTIDUMPING OR COUNTERVAILING DUTY ORDERS IN THIRD-COUNTRY MARKETS
There are no known trade remedy actions on tool chests and cabinets in third-country markets.
INFORMATION ON NONSUBJECT COUNTRIES
China was the world’s largest exporter (by value) of metal furniture and certain other articles of iron or steel during 2014 to 2016.7 Its exports of these broad categories of merchandise were more than twice those of the next closest source, Germany. Meanwhile, Canada was identified as a nonsubject country that supplied tool chests and cabinets to the United States. One producer in Canada, SPG International Ltd., manufactures a wide range of metal toolboxes and industrial storage systems designed for home and professional use at its production facility in Quebec. It exports some of those products to the United States. The company began operating in 1960 and merged with the Geelong Sales Company in 2007,8 giving Geelong manufacturing capabilities in North America and Asia.9 10 11
7 HS subheading 9403.20 specifies “metal Furniture, nesoi,” and HS subheading 7326.90 specifies “articles of iron or steel, nesoi.”
8 Beginning in 2000, SPG reportedly had increases in costs of its raw materials and it started to face greater competition from producers in emerging global markets, including Geelong in China. These factors partially led to the decision to merge with Geelong in 2007. SPG International Ltd. website: An industry pro at bouncing back, http://www.spginternational.com/logiciel/gestion_securite/telechargement/?id=731, p. 3, retrieved May 16, 2017.
9 SPG International Ltd. webpage, http://www.spginternational.com/en/Company.aspx, retrieved May 8, 2017.
10 Conference transcript, p. 166 (Enger). 11 SPG International Ltd., 2015 Product Guide,
http://www.spginternational.com/client/uploads/Librairies/Fichiers/International%20Catalogue%202015%20ANG.pdf, p. 2, retrieved May 16, 2017.


A-1
APPENDIX A
FEDERAL REGISTER NOTICES

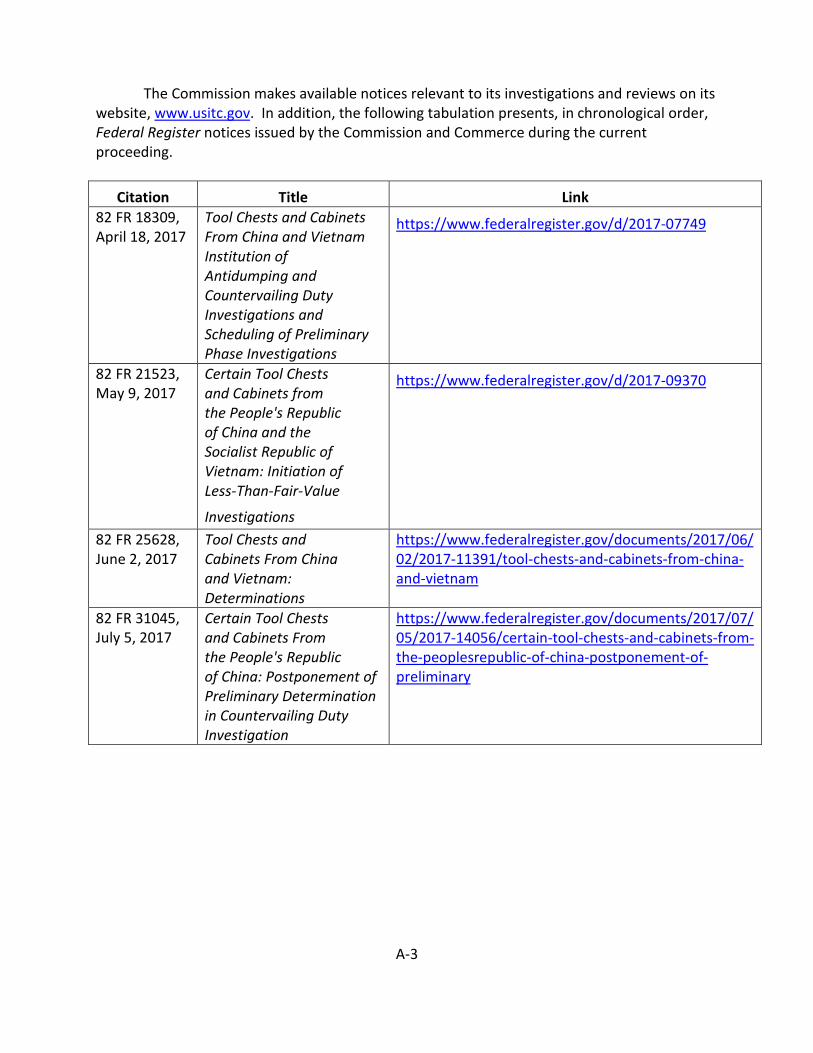
A-3
The Commission makes available notices relevant to its investigations and reviews on its website, www.usitc.gov. In addition, the following tabulation presents, in chronological order, Federal Register notices issued by the Commission and Commerce during the current proceeding.
Citation Title Link 82 FR 18309, April 18, 2017
Tool Chests and Cabinets From China and Vietnam Institution of Antidumping and Countervailing Duty Investigations and Scheduling of Preliminary Phase Investigations
https://www.federalregister.gov/d/2017-07749
82 FR 21523, May 9, 2017
Certain Tool Chests and Cabinets from the People's Republic of China and the Socialist Republic of Vietnam: Initiation of Less‐Than‐Fair‐Value
Investigations
https://www.federalregister.gov/d/2017-09370
82 FR 25628, June 2, 2017
Tool Chests and Cabinets From China and Vietnam: Determinations
https://www.federalregister.gov/documents/2017/06/02/2017-11391/tool-chests-and-cabinets-from-china-and-vietnam
82 FR 31045, July 5, 2017
Certain Tool Chests and Cabinets From the People's Republic of China: Postponement of Preliminary Determination in Countervailing Duty Investigation
https://www.federalregister.gov/documents/2017/07/05/2017-14056/certain-tool-chests-and-cabinets-from-the-peoplesrepublic-of-china-postponement-of-preliminary

A-4
Citation Title Link
82 FR 39563, August 21, 2017
Certain Tool Chests and Cabinets From the People's Republic of China and the Socialist Republic of Vietnam: Postponements of Preliminary Determinations of Antidumping Duty Investigations
https://www.federalregister.gov/documents/2017/08/21/2017-17628/certain-tool-chests-and-cabinets-from-the-peoplesrepublic-of-china-and-the-socialist-republic-of
82 FR 43331, September 15, 2017
Certain Tool Chests and Cabinets From the People's Republic of China: Preliminary Affirmative Countervailing Duty Determination
https://www.federalregister.gov/documents/2017/09/15/2017-19633/certain-tool-chests-and-cabinets-from-the-peoplesrepublic-of-china-preliminary-affirmative
82 FR 44657, September 25, 2017
Tool Chests and Cabinets From China and Vietnam; Scheduling of the Final Phase of Countervailing Duty and Antidumping Duty Investigations
https://www.federalregister.gov/documents/2017/09/25/2017-20371/tool-chests-and-cabinets-from-china-and-vietnamscheduling-of-the-final-phase-of-countervailing-duty
82 FR 56582, November 29, 2017
Certain Tool Chests and Cabinets From the People's Republic of China: Final Affirmative Countervailing Duty Determination
https://www.federalregister.gov/documents/2017/11/29/2017-25768/certain-tool-chests-and-cabinets-from-the-peoples-republic-of-china-final-affirmative-countervailing

B‐1
APPENDIX B
Hearing Witnesses

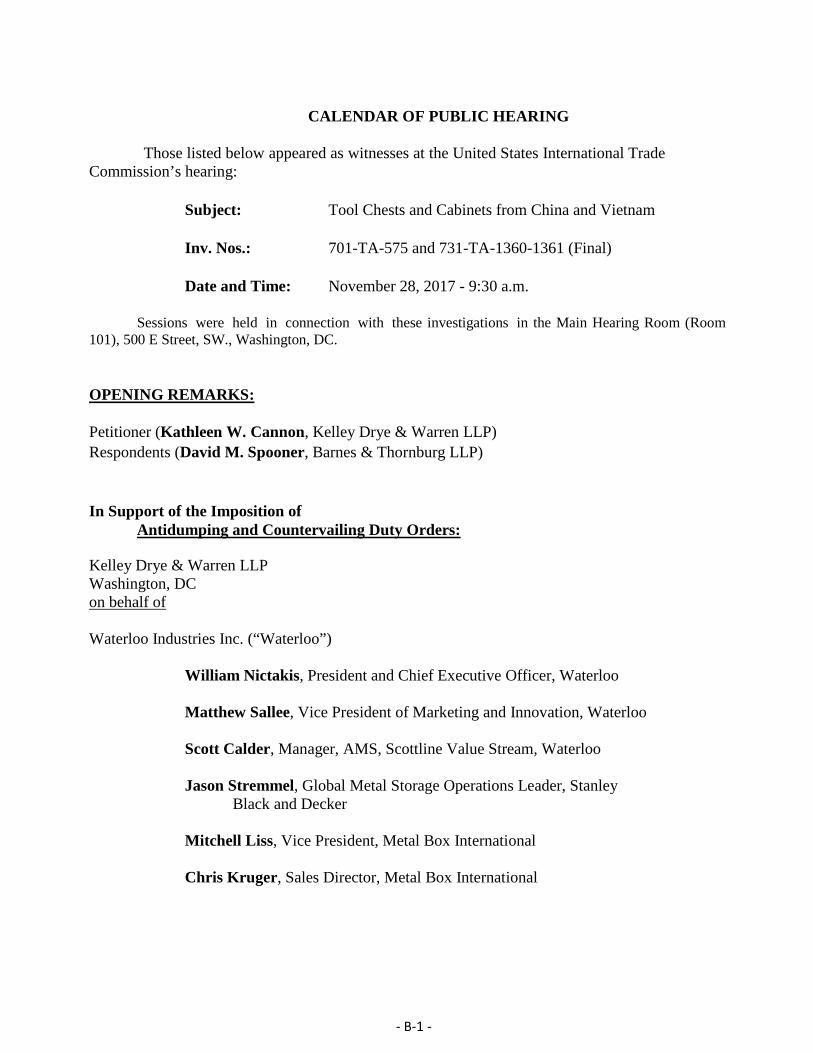
- B-1 -
CALENDAR OF PUBLIC HEARING
Those listed below appeared as witnesses at the United States International Trade Commission’s hearing:
Subject: Tool Chests and Cabinets from China and Vietnam
Inv. Nos.: 701-TA-575 and 731-TA-1360-1361 (Final)
Date and Time: November 28, 2017 - 9:30 a.m.
Sessions were held in connection with these investigations in the Main Hearing Room (Room 101), 500 E Street, SW., Washington, DC.
OPENING REMARKS:
Petitioner (Kathleen W. Cannon, Kelley Drye & Warren LLP) Respondents (David M. Spooner, Barnes & Thornburg LLP)
In Support of the Imposition of Antidumping and Countervailing Duty Orders:
Kelley Drye & Warren LLP Washington, DC on behalf of
Waterloo Industries Inc. (“Waterloo”)
William Nictakis, President and Chief Executive Officer, Waterloo
Matthew Sallee, Vice President of Marketing and Innovation, Waterloo
Scott Calder, Manager, AMS, Scottline Value Stream, Waterloo
Jason Stremmel, Global Metal Storage Operations Leader, Stanley Black and Decker
Mitchell Liss, Vice President, Metal Box International
Chris Kruger, Sales Director, Metal Box International
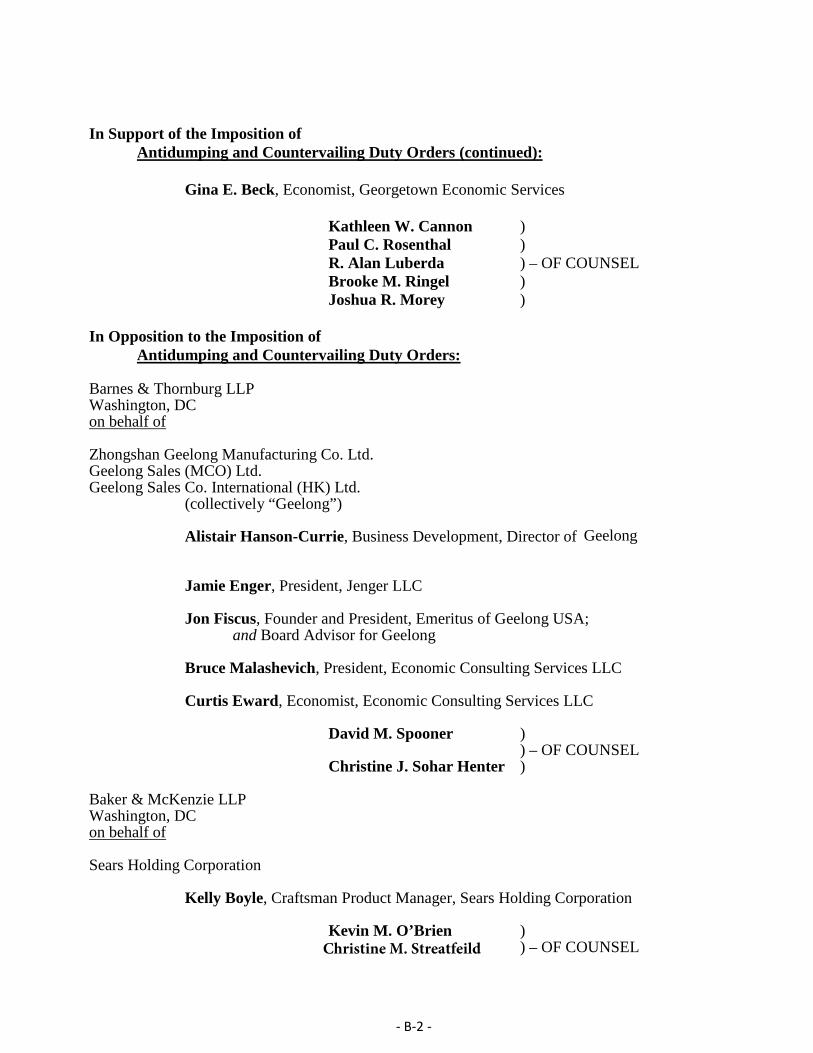
- B-2 -
In Support of the Imposition of Antidumping and Countervailing Duty Orders (continued):
Gina E. Beck, Economist, Georgetown Economic Services
Kathleen W. Cannon ) Paul C. Rosenthal ) R. Alan Luberda ) – OF COUNSEL Brooke M. Ringel ) Joshua R. Morey )
In Opposition to the Imposition of Antidumping and Countervailing Duty Orders:
Barnes & Thornburg LLP Washington, DC on behalf of
Zhongshan Geelong Manufacturing Co. Ltd. Geelong Sales (MCO) Ltd. Geelong Sales Co. International (HK) Ltd.
(collectively “Geelong”)
Alistair Hanson-Currie, Business Development, Director of Geelong
Jamie Enger, President, Jenger LLC
Jon Fiscus, Founder and President, Emeritus of Geelong USA; and Board Advisor for Geelong
Bruce Malashevich, President, Economic Consulting Services LLC
Curtis Eward, Economist, Economic Consulting Services LLC
David M. Spooner ) ) – OF COUNSEL
Christine J. Sohar Henter )
Baker & McKenzie LLP Washington, DC on behalf of
Sears Holding Corporation
Kelly Boyle, Craftsman Product Manager, Sears Holding Corporation
Kevin M. O’Brien )) – OF COUNSELChristine M. Streatfeild
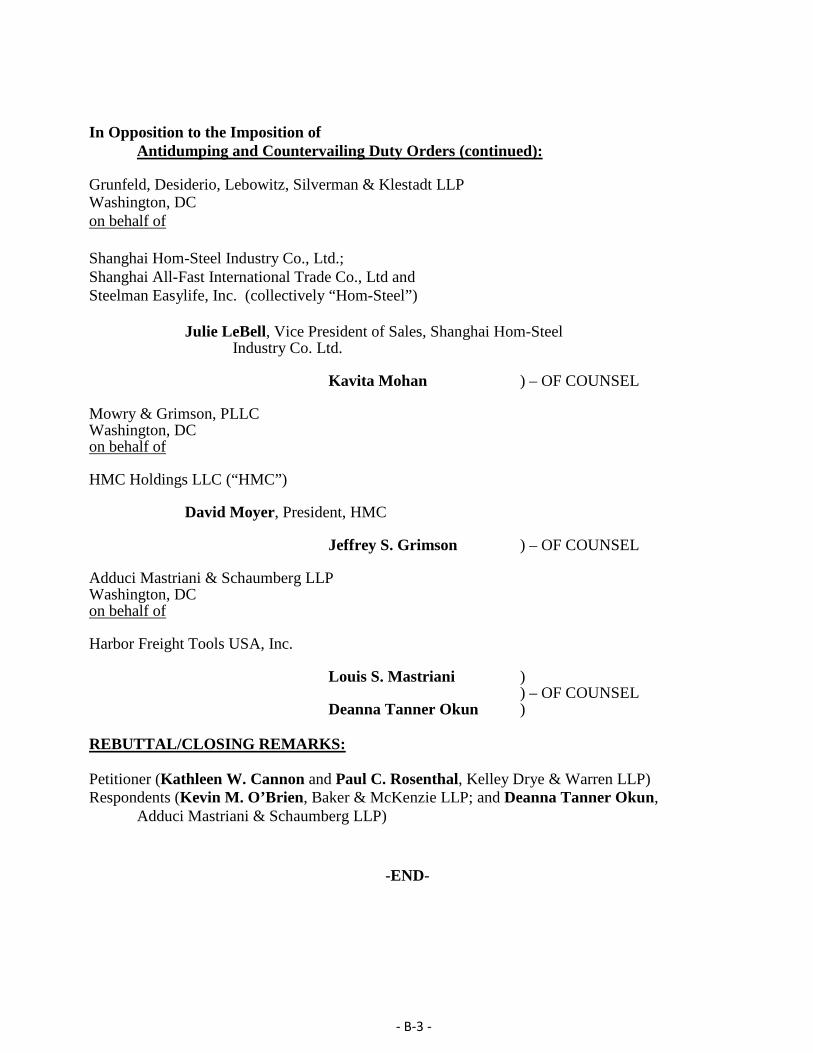
- B-3 -
In Opposition to the Imposition of Antidumping and Countervailing Duty Orders (continued):
Grunfeld, Desiderio, Lebowitz, Silverman & Klestadt LLP Washington, DC on behalf of
Shanghai Hom-Steel Industry Co., Ltd.; Shanghai All-Fast International Trade Co., Ltd and Steelman Easylife, Inc. (collectively “Hom-Steel”)
Julie LeBell, Vice President of Sales, Shanghai Hom-Steel Industry Co. Ltd.
Kavita Mohan ) – OF COUNSEL
Mowry & Grimson, PLLC Washington, DC on behalf of
HMC Holdings LLC (“HMC”)
David Moyer, President, HMC
Jeffrey S. Grimson ) – OF COUNSEL
Adduci Mastriani & Schaumberg LLP Washington, DC on behalf of
Harbor Freight Tools USA, Inc.
Louis S. Mastriani ) ) – OF COUNSEL
Deanna Tanner Okun )
REBUTTAL/CLOSING REMARKS:
Petitioner (Kathleen W. Cannon and Paul C. Rosenthal, Kelley Drye & Warren LLP) Respondents (Kevin M. O’Brien, Baker & McKenzie LLP; and Deanna Tanner Okun,
Adduci Mastriani & Schaumberg LLP)
-END-

C-1
APPENDIX C
SUMMARY DATA

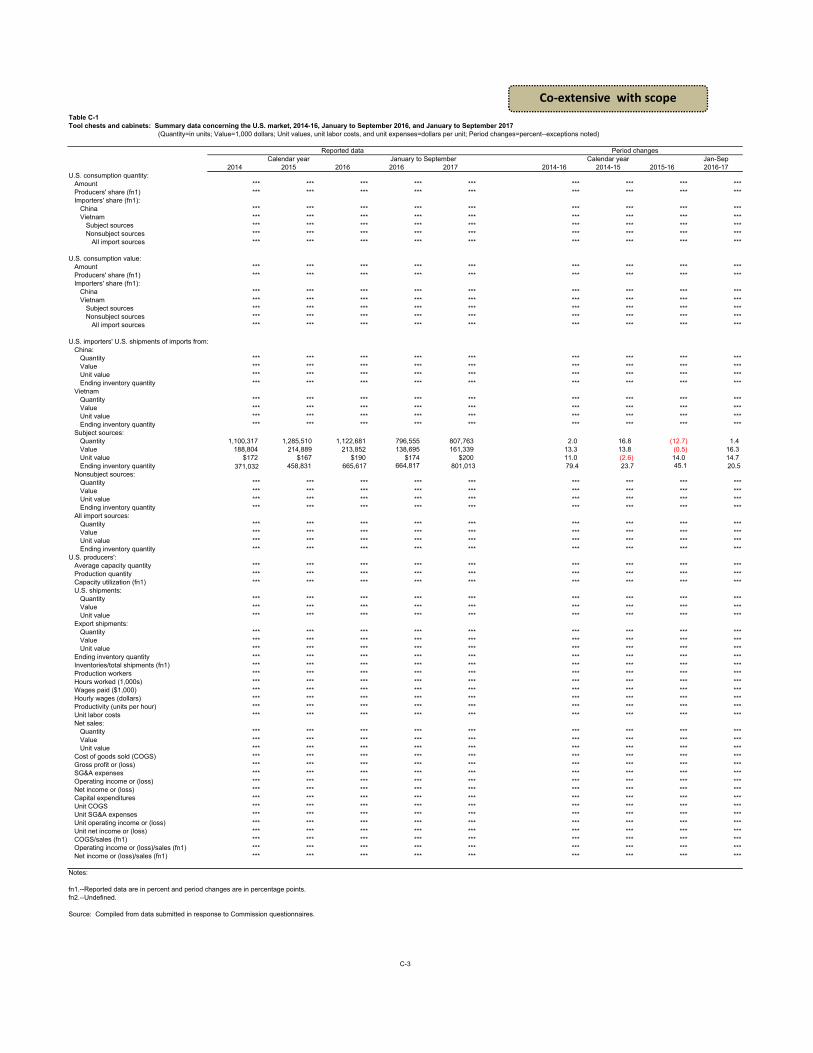
Table C-1Tool chests and cabinets: Summary data concerning the U.S. market, 2014-16, January to September 2016, and January to September 2017
Jan-Sep2014 2015 2016 2016 2017 2014-16 2014-15 2015-16 2016-17
U.S. consumption quantity:Amount *** *** *** *** *** *** *** *** ***Producers' share (fn1) *** *** *** *** *** *** *** *** ***Importers' share (fn1):
China *** *** *** *** *** *** *** *** ***Vietnam *** *** *** *** *** *** *** *** ***
Subject sources *** *** *** *** *** *** *** *** ***Nonsubject sources *** *** *** *** *** *** *** *** ***
All import sources *** *** *** *** *** *** *** *** ***
U.S. consumption value:Amount *** *** *** *** *** *** *** *** ***Producers' share (fn1) *** *** *** *** *** *** *** *** ***Importers' share (fn1):
China *** *** *** *** *** *** *** *** ***Vietnam *** *** *** *** *** *** *** *** ***
Subject sources *** *** *** *** *** *** *** *** ***Nonsubject sources *** *** *** *** *** *** *** *** ***
All import sources *** *** *** *** *** *** *** *** ***
U.S. importers' U.S. shipments of imports from:China:
Quantity *** *** *** *** *** *** *** *** ***Value *** *** *** *** *** *** *** *** ***Unit value *** *** *** *** *** *** *** *** ***Ending inventory quantity *** *** *** *** *** *** *** *** ***
VietnamQuantity *** *** *** *** *** *** *** *** ***Value *** *** *** *** *** *** *** *** ***Unit value *** *** *** *** *** *** *** *** ***Ending inventory quantity *** *** *** *** *** *** *** *** ***
Subject sources:Quantity 1,100,317 1,285,510 1,122,681 796,555 807,763 2.0 16.8 (12.7) 1.4Value 188,804 214,889 213,852 138,695 161,339 13.3 13.8 (0.5) 16.3Unit value $172 $167 $190 $174 $200 11.0 (2.6) 14.0 14.7Ending inventory quantity 371,032 458,831 665,617 664,817 801,013 79.4 23.7 45.1 20.5
Nonsubject sources:Quantity *** *** *** *** *** *** *** *** ***Value *** *** *** *** *** *** *** *** ***Unit value *** *** *** *** *** *** *** *** ***Ending inventory quantity *** *** *** *** *** *** *** *** ***
All import sources:Quantity *** *** *** *** *** *** *** *** ***Value *** *** *** *** *** *** *** *** ***Unit value *** *** *** *** *** *** *** *** ***Ending inventory quantity *** *** *** *** *** *** *** *** ***
U.S. producers':Average capacity quantity *** *** *** *** *** *** *** *** ***Production quantity *** *** *** *** *** *** *** *** ***Capacity utilization (fn1) *** *** *** *** *** *** *** *** ***U.S. shipments:
Quantity *** *** *** *** *** *** *** *** ***Value *** *** *** *** *** *** *** *** ***Unit value *** *** *** *** *** *** *** *** ***
Export shipments:Quantity *** *** *** *** *** *** *** *** ***Value *** *** *** *** *** *** *** *** ***Unit value *** *** *** *** *** *** *** *** ***
Ending inventory quantity *** *** *** *** *** *** *** *** ***Inventories/total shipments (fn1) *** *** *** *** *** *** *** *** ***Production workers *** *** *** *** *** *** *** *** ***Hours worked (1,000s) *** *** *** *** *** *** *** *** ***Wages paid ($1,000) *** *** *** *** *** *** *** *** ***Hourly wages (dollars) *** *** *** *** *** *** *** *** ***Productivity (units per hour) *** *** *** *** *** *** *** *** ***Unit labor costs *** *** *** *** *** *** *** *** ***Net sales:
Quantity *** *** *** *** *** *** *** *** ***Value *** *** *** *** *** *** *** *** ***Unit value *** *** *** *** *** *** *** *** ***
Cost of goods sold (COGS) *** *** *** *** *** *** *** *** ***Gross profit or (loss) *** *** *** *** *** *** *** *** ***SG&A expenses *** *** *** *** *** *** *** *** ***Operating income or (loss) *** *** *** *** *** *** *** *** ***Net income or (loss) *** *** *** *** *** *** *** *** ***Capital expenditures *** *** *** *** *** *** *** *** ***Unit COGS *** *** *** *** *** *** *** *** ***Unit SG&A expenses *** *** *** *** *** *** *** *** ***Unit operating income or (loss) *** *** *** *** *** *** *** *** ***Unit net income or (loss) *** *** *** *** *** *** *** *** ***COGS/sales (fn1) *** *** *** *** *** *** *** *** ***Operating income or (loss)/sales (fn1) *** *** *** *** *** *** *** *** ***Net income or (loss)/sales (fn1) *** *** *** *** *** *** *** *** ***
Notes:
fn1.--Reported data are in percent and period changes are in percentage points.fn2.--Undefined.
Source: Compiled from data submitted in response to Commission questionnaires.
C-3
Period changes
(Quantity=in units; Value=1,000 dollars; Unit values, unit labor costs, and unit expenses=dollars per unit; Period changes=percent--exceptions noted)
Calendar year Calendar yearReported data
January to September
Co‐extensive with scope
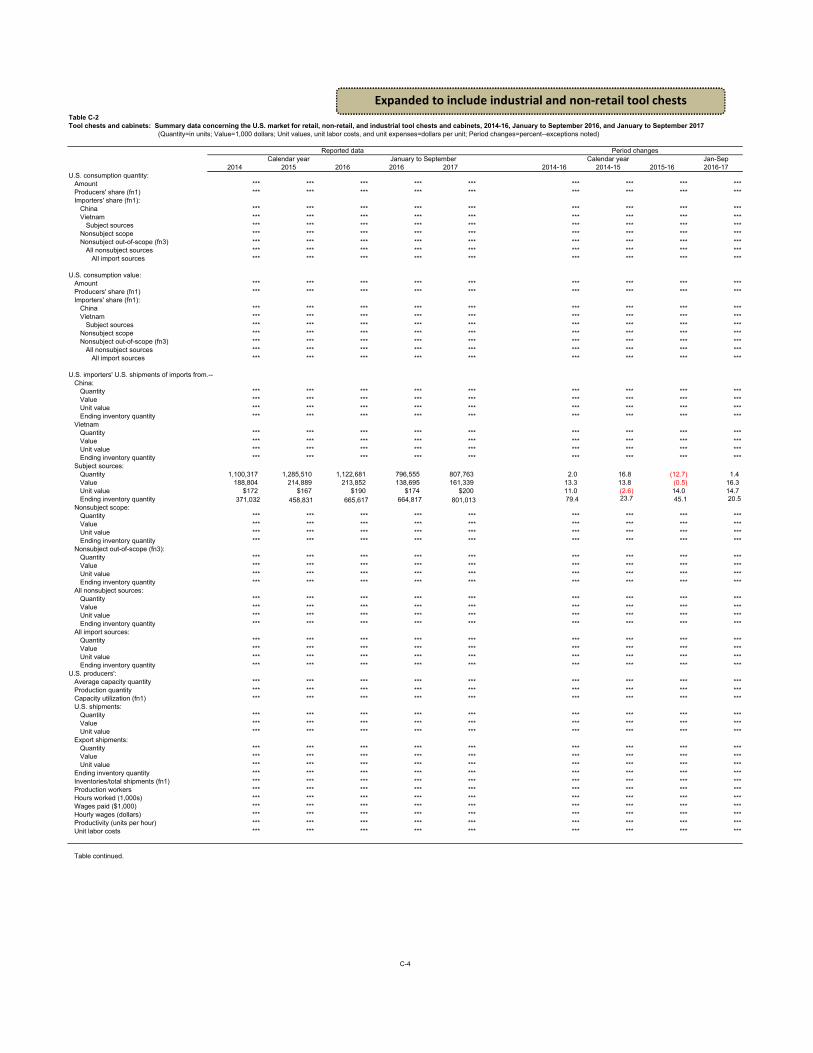
Table C-2Tool chests and cabinets: Summary data concerning the U.S. market for retail, non-retail, and industrial tool chests and cabinets, 2014-16, January to September 2016, and January to September 2017
Jan-Sep2014 2015 2016 2016 2017 2014-16 2014-15 2015-16 2016-17
U.S. consumption quantity:Amount *** *** *** *** *** *** *** *** ***Producers' share (fn1) *** *** *** *** *** *** *** *** ***Importers' share (fn1):
China *** *** *** *** *** *** *** *** ***Vietnam *** *** *** *** *** *** *** *** ***
Subject sources *** *** *** *** *** *** *** *** ***Nonsubject scope *** *** *** *** *** *** *** *** ***Nonsubject out-of-scope (fn3) *** *** *** *** *** *** *** *** ***
All nonsubject sources *** *** *** *** *** *** *** *** ***All import sources *** *** *** *** *** *** *** *** ***
U.S. consumption value:Amount *** *** *** *** *** *** *** *** ***Producers' share (fn1) *** *** *** *** *** *** *** *** ***Importers' share (fn1):
China *** *** *** *** *** *** *** *** ***Vietnam *** *** *** *** *** *** *** *** ***
Subject sources *** *** *** *** *** *** *** *** ***Nonsubject scope *** *** *** *** *** *** *** *** ***Nonsubject out-of-scope (fn3) *** *** *** *** *** *** *** *** ***
All nonsubject sources *** *** *** *** *** *** *** *** ***All import sources *** *** *** *** *** *** *** *** ***
U.S. importers' U.S. shipments of imports from.--China:
Quantity *** *** *** *** *** *** *** *** ***Value *** *** *** *** *** *** *** *** ***Unit value *** *** *** *** *** *** *** *** ***Ending inventory quantity *** *** *** *** *** *** *** *** ***
VietnamQuantity *** *** *** *** *** *** *** *** ***Value *** *** *** *** *** *** *** *** ***Unit value *** *** *** *** *** *** *** *** ***Ending inventory quantity *** *** *** *** *** *** *** *** ***
Subject sources:Quantity 1,100,317 1,285,510 1,122,681 796,555 807,763 2.0 16.8 (12.7) 1.4Value 188,804 214,889 213,852 138,695 161,339 13.3 13.8 (0.5) 16.3Unit value $172 $167 $190 $174 $200 11.0 (2.6) 14.0 14.7Ending inventory quantity 371,032 458,831 665,617 664,817 801,013 79.4 23.7 45.1 20.5
Nonsubject scope:Quantity *** *** *** *** *** *** *** *** ***Value *** *** *** *** *** *** *** *** ***Unit value *** *** *** *** *** *** *** *** ***Ending inventory quantity *** *** *** *** *** *** *** *** ***
Nonsubject out-of-scope (fn3):Quantity *** *** *** *** *** *** *** *** ***Value *** *** *** *** *** *** *** *** ***Unit value *** *** *** *** *** *** *** *** ***Ending inventory quantity *** *** *** *** *** *** *** *** ***
All nonsubject sources:Quantity *** *** *** *** *** *** *** *** ***Value *** *** *** *** *** *** *** *** ***Unit value *** *** *** *** *** *** *** *** ***Ending inventory quantity *** *** *** *** *** *** *** *** ***
All import sources:Quantity *** *** *** *** *** *** *** *** ***Value *** *** *** *** *** *** *** *** ***Unit value *** *** *** *** *** *** *** *** ***Ending inventory quantity *** *** *** *** *** *** *** *** ***
U.S. producers':Average capacity quantity *** *** *** *** *** *** *** *** ***Production quantity *** *** *** *** *** *** *** *** ***Capacity utilization (fn1) *** *** *** *** *** *** *** *** ***U.S. shipments:
Quantity *** *** *** *** *** *** *** *** ***Value *** *** *** *** *** *** *** *** ***Unit value *** *** *** *** *** *** *** *** ***
Export shipments:Quantity *** *** *** *** *** *** *** *** ***Value *** *** *** *** *** *** *** *** ***Unit value *** *** *** *** *** *** *** *** ***
Ending inventory quantity *** *** *** *** *** *** *** *** ***Inventories/total shipments (fn1) *** *** *** *** *** *** *** *** ***Production workers *** *** *** *** *** *** *** *** ***Hours worked (1,000s) *** *** *** *** *** *** *** *** ***Wages paid ($1,000) *** *** *** *** *** *** *** *** ***Hourly wages (dollars) *** *** *** *** *** *** *** *** ***Productivity (units per hour) *** *** *** *** *** *** *** *** ***Unit labor costs *** *** *** *** *** *** *** *** ***
Table continued.
(Quantity=in units; Value=1,000 dollars; Unit values, unit labor costs, and unit expenses=dollars per unit; Period changes=percent--exceptions noted)
Reported data Period changesCalendar year January to September Calendar year
C-4
Expanded to include industrial and non‐retail tool chests
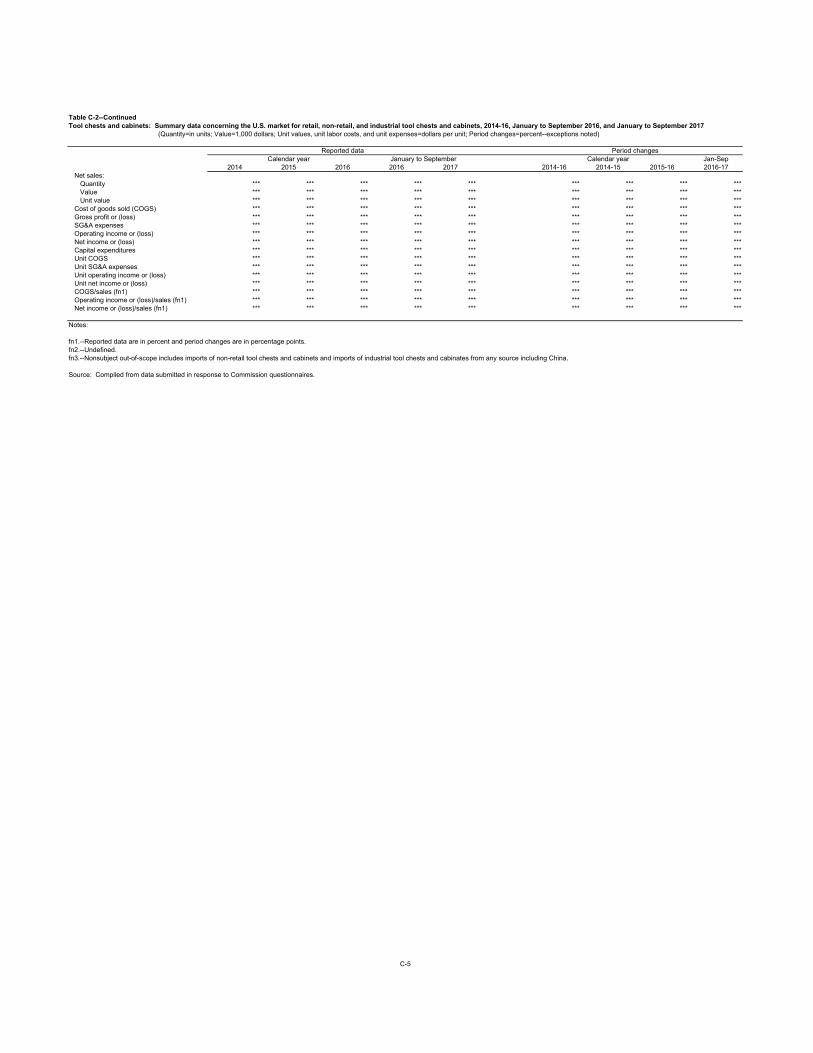
Table C-2--ContinuedTool chests and cabinets: Summary data concerning the U.S. market for retail, non-retail, and industrial tool chests and cabinets, 2014-16, January to September 2016, and January to September 2017
Jan-Sep2014 2015 2016 2016 2017 2014-16 2014-15 2015-16 2016-17
Net sales:Quantity *** *** *** *** *** *** *** *** ***Value *** *** *** *** *** *** *** *** ***Unit value *** *** *** *** *** *** *** *** ***
Cost of goods sold (COGS) *** *** *** *** *** *** *** *** ***Gross profit or (loss) *** *** *** *** *** *** *** *** ***SG&A expenses *** *** *** *** *** *** *** *** ***Operating income or (loss) *** *** *** *** *** *** *** *** ***Net income or (loss) *** *** *** *** *** *** *** *** ***Capital expenditures *** *** *** *** *** *** *** *** ***Unit COGS *** *** *** *** *** *** *** *** ***Unit SG&A expenses *** *** *** *** *** *** *** *** ***Unit operating income or (loss) *** *** *** *** *** *** *** *** ***Unit net income or (loss) *** *** *** *** *** *** *** *** ***COGS/sales (fn1) *** *** *** *** *** *** *** *** ***Operating income or (loss)/sales (fn1) *** *** *** *** *** *** *** *** ***Net income or (loss)/sales (fn1) *** *** *** *** *** *** *** *** ***
Notes:
fn1.--Reported data are in percent and period changes are in percentage points.fn2.--Undefined. fn3.--Nonsubject out-of-scope includes imports of non-retail tool chests and cabinets and imports of industrial tool chests and cabinates from any source including China.
Source: Compiled from data submitted in response to Commission questionnaires.
C-5
Calendar year January to September Calendar year
(Quantity=in units; Value=1,000 dollars; Unit values, unit labor costs, and unit expenses=dollars per unit; Period changes=percent--exceptions noted)
Reported data Period changes


D-1
APPENDIX D
COMMENTS CONCERNING THE DOMESTIC LIKE PRODUCT

Table D-1 Tool chests and cabinets: Comparability of in-scope tool chests and cabinets to out-of-scope other tool chests and cabinets--Physical characteristics and uses
* * * * * * * Table D-2 Tool chests and cabinets: Comparability of in-scope tool chests and cabinets to out-of-scope other tool chests and cabinets--Interchangeability
* * * * * * *
Table D-3 Tool chests and cabinets: Comparability of in-scope tool chests and cabinets to out-of-scope other tool chests and cabinets--Channels of distribution
* * * * * * * Table D-4 Tool chests and cabinets: Comparability of in-scope tool chests and cabinets to out-of-scope other tool chests and cabinets--Consumer and producer perceptions
* * * * * * * Table D-5 Tool chests and cabinets: Comparability of in-scope tool chests and cabinets to out-of-scope other tool chests and cabinets--Manufacturing facilities, production processes, and production employees
* * * * * * * Table D-6 Tool chests and cabinets: Comparability of in-scope tool chests and cabinets to out-of-scope other tool chests and cabinets—Price
* * * * * * *

E-1
APPENDIX E
PETITIONER’S RESPONSES TO THE COMMISSION’S QUESTIONS


* * * * * * *
