tongue image matching using color content
TRANSCRIPT
*Corresponding author. Tel.: #852-2339-7811; fax: #852-2339-7892.E-mail addresses: [email protected] (C.H. Li),
[email protected] (P.C. Yuen).
Pattern Recognition 35 (2002) 407}419
Tongue image matching using color content
C.H. Li, Pong C. Yuen*
Department of Computer Science, The Hong Kong Baptist University, 224 Waterloo Road, Kowloon, Hong Kong
Received 15 May 2000; received in revised form 22 November 2000; accepted 22 November 2000
Abstract
This paper addresses the problem of color image matching in medical diagnosis. The color matching of tongue imagesin di!erent color spaces with di!erent metrics have been investigated and is reported in this article. Two new metricsnamely, sorted metric and probabilistic combined metric, are proposed. Existing distance measurements in coordinatespace do not satisfy the re#exivity axiom. That means, they are not the valid metrics. To overcome this limitation, thesorted metric in coordinate space is proposed in coordinate space. To improve the matching performance, a probabilisticcombined metric is proposed based on the theory of combining classi"er. These metrics are applied for the matching oftongue color images and the results are encouraging. � 2001 Pattern Recognition Society. Published by ElsevierScience Ltd. All rights reserved.
Keywords: Tongue diagnosis; Traditional Chinese medicine; Medical image matching; Color images
1. Introduction
One application of content based matching is thematching of color tissues of patients for the purpose ofmedical diagnosis. A related application of the contentbased matching is the image database retrieval fromcolor content.In the area of medical diagnosis, color image analysis
can be a useful aid in standardization and automation.Color image analysis has been applied to assess thepower of new drugs on the spreading of skin erythema[1], assessment and tracking of wound severity [2] andto the identi"cation of skin tumor border [3].In this paper, the color image analysis technique is
applied to tongue diagnosis. Tongue diagnosis is animportant part of the Four Diagnoses in TraditionalChinese Medicine (TCM) [4] where physician visuallyexamines the color and properties of both the coating ofthe tongue and the tongue proper. The advantage of thetongue diagnosis is that it is a simple and non-invasive
technique and is well suited for remote diagnosis. Thetongue image analysis system is composed of a colormatching module and a color texture module [5}7]. Thecolor matching module is responsible for matching thecolor content in a particular tongue region. The colortexture module will be responsible for analyzing thespatial arrangement of the color pixels in the tonguesection. As TCM theories on the tongue color and tex-ture are mostly qualitative, the goal of this project is to"nd out a set of objective and standard measurements oncolor and texture for tongue diagnosis. This paper fo-cuses on the tongue image color matching.Color image matching can be performed using color
coordinates or based on color histograms of images [8,9]in di!erent color spaces. Sections 2 and 3 will give a re-view on color spaces and existing metrics for color imagematching, respectively. Two new metrics are proposedin this paper. First, a sorted metric is proposed using thecolor coordinates. As some common cluster metrics oncolor coordinates violate the basic assumptions in metric.The sorted metric circumvents such problem in colorcoordinates and is discussed in Section 4. Second, basedon the theory of combined classi"ers [10], a probabilisticcombined (PC) metric is developed and reported in Sec-tion 5. We developed a probabilistic framework to com-bine di!erent metric to form the PCmetric. Experimental
0031-3203/01/$20.00 � 2001 Pattern Recognition Society. Published by Elsevier Science Ltd. All rights reserved.PII: S 0 0 3 1 - 3 2 0 3 ( 0 1 ) 0 0 0 2 1 - 8
results will be discussed in Section 6. Section 7 gives theconclusions of this paper.
2. Color spaces
The RGB color space is a common representation ofcolor image in digital image. The popularity lies in itssimple representation of color as three primary compo-nents of red, blue and green. The RGB color space is astraightforward representation in video display devices,but there are some drawbacks of the RBG color space.First, the RGB components are highly correlated fornatural image. Second, the RGB space is not perceptuallyuniform.Variants of the RGB color space have been employed
to improve upon the drawbacks of the RGB space. Thenormalized RGB space was used by Duchnowski [11]for color segmentation in automatic lip-reading. Theopponent color space is also a derivative of the RGBspace [12]. This is a color space of interest in colorprocessing as it models the opponent-color responses ofhuman visual system. However, neither of these spaces isperceptually uniform.The HSV space is an intuitive system where a speci"c
color is described by its hue, saturation and brightnessvalue. This color space is often used in software systemto aid interactive color selection and manipulation. TheHSV space and its variants have been successfully em-ployed in di!erent applications of skin segmentation[13,14].The CIE LHuHvH (LUV) and CIE LHaHbH (LAB) color
spaces are designed experimentally to be perceptuallyuniform. This provides ease in the design of metric forcomparing color. The LAB space has been used for colorsegmentation of human #esh [15]. The LUV space hasbeen employed in general color image segmentation [16].
3. A review on color image matching metrics
Color image matching can be performed in color co-ordinates or based on color histograms of images. Theadvantage of using color coordinates in color space isthat distance can be directly calculated from the colorimage and is independent of the design of the bin size ofthe color histogram. However, this method is computa-tionally expensive and is not a valid metric because thedistance measurement does not satisfy the re#exivityaxiom. The advantage of histogram-based methods iscomputational e$ciency. However, we have to de"ne thebin size of the histogram. The number of bins (also binsize) chosen for the color histogram a!ects both theaccuracy and the computational requirement. Usinga larger number of bins may increase the accuracy inrepresenting the color distribution in the image. How-
ever, using a histogram with a large bin size, pixels withsimilar color are distributed into di!erent bins, whichcomplicate the matching of color.
3.1. Color coordinate metric
In image matching by color content, we can devisemetrics that compare two images using the color coordi-nate space or the color histogram space. For simplicity innotation, pixels in the image x can be referenced by aninteger index i where i"1, 2,2,N and N is the totalnumber of pixels in the image. The color of each pixelx�is represented by three color attributes, denoted by x
��,
where c"1, 2, 3. To describe how close two color imagesx and y match, a color metric that relates the colorattributes in x and y has to be designed. An intuitivemetric is the point-to-point distance from image x toimage y
D2�(x, y)"
�����
�����
�����
(x��
!y��)�. (1)
However, the above distance measurement is of com-putational complexity O(N�) which is demanding formost image sizes. Alternatively, the point-to-cluster-center distance from image x to image y can also be used,
D2�(x, y)"
�����
�����
((x��
!m�(y))�#(y
��!m
�(x))�), (2)
wherem�(x) andm
�(y) are the mean values of the cth color
attribute in images x and y, respectively. The abovemetric de"nes the distance between two color images asthe sum of the distances between the cluster center of the"rst image and the individual pixels in the second imageand vice versa. This metric has computational complex-ity of O(N) and is thus less computational demandingthan Eq. (1). It can be shown that Eq. (2) is equal to
D2�(x, y)"
�����
(2(m�(x)!m
�(y))�#�
�(x)�#�
�(y)�), (3)
where ��(x) and �
�(y) are the standard deviations of the
cth color attribute in images x and y. Thus, the use of thismetric measures the distance between two clusters as thesquared distance between two clusters' means and thevariance of the clusters. The main problem of Eqs. (1) and(2) as cluster metric is that both distance measurementsdo not satisfy the re#exivity axiom. That means, given animage x, the distance between two identical image doesnot give a zero value, D(x,x)O0. Therefore, it is not avalid metric. Moreover, images with large variance incolor always result in a larger distance.
3.2. Color histogram metric
The color histogram of a color image is a three-dimensional array of integers storing the frequency of
408 C.H. Li, P.C. Yuen / Pattern Recognition 35 (2002) 407}419
occurrence of the color pixels having the three colorattributes as speci"ed by the histogram bins. Let P andQ be the color histograms of image x and y, the colorhistogram L2 distance is
D2(P,Q)"�����
�����
�����
(P���
!Q���)�, (4)
where ¸ is the number of bins in a color dimension. Forsimplicity, we assume that all the three color spaces arequantized into equal number of bins.Similarly, the color histogram L1 distance is
D1(P,Q)"�����
�����
�����
�P���
!Q���
�, (5)
where the quadratic distance is replaced by the absolutedistance.Although the color histogram captures the color distri-
bution information of the image, it has the disadvantageof being three dimensional in space and thus requiresconsiderable computation when the number of bins ineach dimension is large.Another simpler histogram representation, the one-
dimensional projected histogram, is often used instead ofthe three-dimensional color histogram. The complexityof the color histogram is reduced by assuming that thecolor is independently distributed and the one-dimen-sional histograms of each color attribute are used fordescribing an image. Thus an image x is described by theprojected histogram, denoted by, p�, where c"1, 2, 3,represents the histograms of the three color attributes.The relation of the projected histogram p� with the colorhistogram P is given by
p��"
�����
�����
P���, p�
�"
�����
�����
P���, p�
�"
�����
�����
P���,
(6)
where i, j and k are index to the bins and ranges from[1..¸].The projected histogram of L2 distance between two
projected histograms p and q is given by
D2(p, q)"�����
�����
(p��!q�
�)�. (7)
Similarly, the projected histogram of L1 distance be-tween two projected histograms p and q is given by
D1(p, q)"�����
�����
�p��!q�
��. (8)
4. Sorted metric
To overcome the above problem, a sorted metric isproposed in this paper. The basic idea of the sorted
metric is that, instead of comparing each pixel in animage with all pixels in the other image, we sort the pixelsin each image by a color attribute. The comparison isperformed on the sorted pixel lists. In this way, besidesthe advantage of computational e$cient, the proposedsorted metric o!ers additional advantage that it obeysthe re#exivity axiom in distance measure, i.e. it is a validmetric.Let x
��be the sorted pixels of image x and y
��be the
sorted pixels of image y in an increasing order of thecolor coordinates. The sorting can be performed on anyone of the three color attributes but the same attributeshave to be chosen as the criteria for sorting the pixels inthe two images to be compared. The sorted metric usingthe squared norm is
D2(x, y)"
��
����
�����
(x���
!y���)�. (9)
Similarly, the sort metric using the L1 norm is
D1(x, y)"
��
����
�����
�x���
!y���
�, (10)
where the squared distance is replaced by the absolutedistance. It can be easily seen that both D1
and D2
satisfy the re#exivity axiom in distance measure. That is,D1
(x, x)"0 and D2
(x,x)"0 for any image x. More-
over, the computational complexity of the above metricis a function of the sorting of the color attributes, which isof the order O(N log(N)).
5. Probabilistic combined metric
A number of articles [10,17] have reported that com-bining di!erent classi"ers to reach a conclusion can in-crease the performance and accuracy. As mentioned inRef. [10], the way of combining di!erent classi"ers de-pends on applications. In this section, based on the con-cept of combined classi"ers, we develop a probabilisticcombined (PC) metric. Kittler et al. [10] have proposedtwo combination schemes and four combination strat-egies. In particular, we adopt the concept of majorityvoting rule*to each a conclusion by consensus. How-ever, as each metric has its own scale, we cannot directlyapply the hardening function to get a vote. Instead, byconsidering a metric as a classi"er for matching, we canconstruct its probability distribution. We will report ourprobabilistic framework in combining di!erent metrics.In the matching problem of color images, the probabil-
ity of a match p between two images has to obey thefollowing assumptions:
p"1 if D"0,
pP1 if DP0,
pP0 if DPR, (11)
C.H. Li, P.C. Yuen / Pattern Recognition 35 (2002) 407}419 409
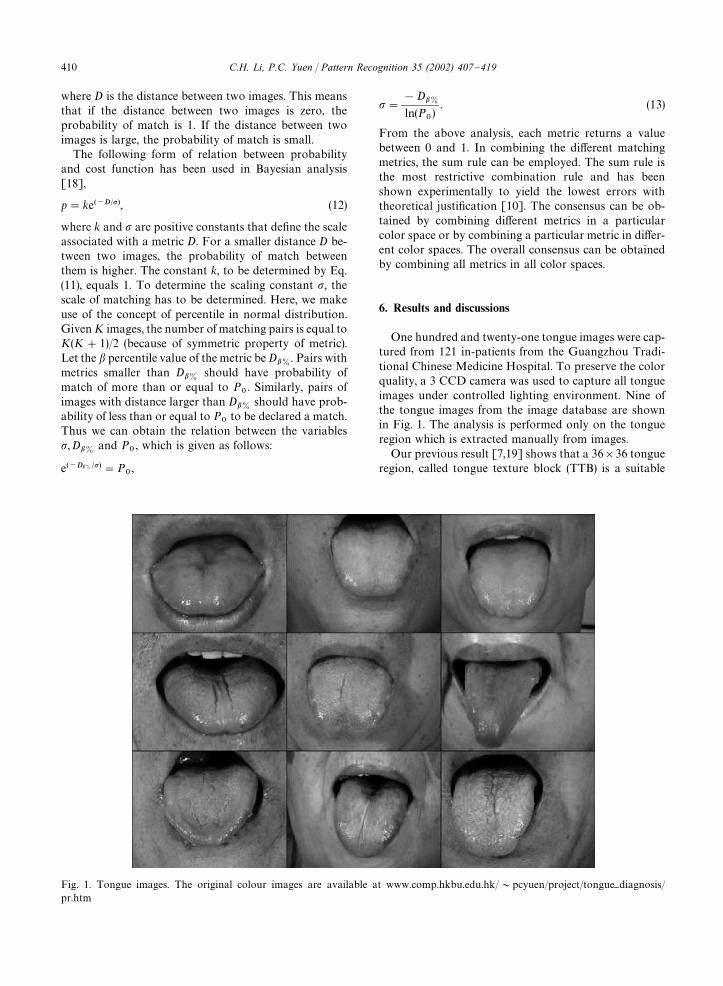
Fig. 1. Tongue images. The original colour images are available at www.comp.hkbu.edu.hk/&pcyuen/project/tongue}diagnosis/pr.htm
where D is the distance between two images. This meansthat if the distance between two images is zero, theprobability of match is 1. If the distance between twoimages is large, the probability of match is small.The following form of relation between probability
and cost function has been used in Bayesian analysis[18],
p"ke�����, (12)
where k and � are positive constants that de"ne the scaleassociated with a metric D. For a smaller distance D be-tween two images, the probability of match betweenthem is higher. The constant k, to be determined by Eq.(11), equals 1. To determine the scaling constant �, thescale of matching has to be determined. Here, we makeuse of the concept of percentile in normal distribution.GivenK images, the number of matching pairs is equal toK(K#1)/2 (because of symmetric property of metric).Let the � percentile value of the metric beD�{ . Pairs withmetrics smaller than D�{ should have probability ofmatch of more than or equal to P
. Similarly, pairs of
images with distance larger than D�{ should have prob-ability of less than or equal to P
to be declared a match.
Thus we can obtain the relation between the variables�,D�{ and P
, which is given as follows:
e���{ ���"P,
�"
!D�{ln(P
). (13)
From the above analysis, each metric returns a valuebetween 0 and 1. In combining the di!erent matchingmetrics, the sum rule can be employed. The sum rule isthe most restrictive combination rule and has beenshown experimentally to yield the lowest errors withtheoretical justi"cation [10]. The consensus can be ob-tained by combining di!erent metrics in a particularcolor space or by combining a particular metric in di!er-ent color spaces. The overall consensus can be obtainedby combining all metrics in all color spaces.
6. Results and discussions
One hundred and twenty-one tongue images were cap-tured from 121 in-patients from the Guangzhou Tradi-tional Chinese Medicine Hospital. To preserve the colorquality, a 3 CCD camera was used to capture all tongueimages under controlled lighting environment. Nine ofthe tongue images from the image database are shownin Fig. 1. The analysis is performed only on the tongueregion which is extracted manually from images.Our previous result [7,19] shows that a 36�36 tongue
region, called tongue texture block (TTB) is a suitable
410 C.H. Li, P.C. Yuen / Pattern Recognition 35 (2002) 407}419
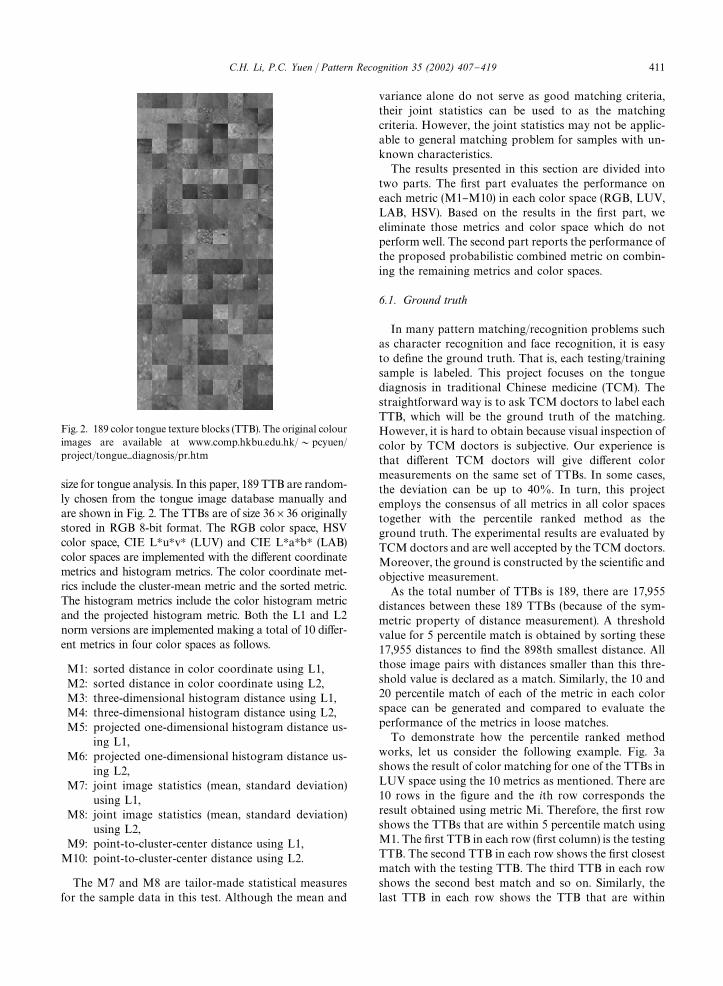
Fig. 2. 189 color tongue texture blocks (TTB). The original colourimages are available at www.comp.hkbu.edu.hk/&pcyuen/project/tongue}diagnosis/pr.htm
size for tongue analysis. In this paper, 189 TTB are random-ly chosen from the tongue image database manually andare shown in Fig. 2. The TTBs are of size 36�36 originallystored in RGB 8-bit format. The RGB color space, HSVcolor space, CIE LHuHvH (LUV) and CIE LHaHbH (LAB)color spaces are implemented with the di!erent coordinatemetrics and histogram metrics. The color coordinate met-rics include the cluster-mean metric and the sorted metric.The histogram metrics include the color histogram metricand the projected histogram metric. Both the L1 and L2norm versions are implemented making a total of 10 di!er-ent metrics in four color spaces as follows.
M1: sorted distance in color coordinate using L1,M2: sorted distance in color coordinate using L2,M3: three-dimensional histogram distance using L1,M4: three-dimensional histogram distance using L2,M5: projected one-dimensional histogram distance us-
ing L1,M6: projected one-dimensional histogram distance us-
ing L2,M7: joint image statistics (mean, standard deviation)
using L1,M8: joint image statistics (mean, standard deviation)
using L2,M9: point-to-cluster-center distance using L1,M10: point-to-cluster-center distance using L2.
The M7 and M8 are tailor-made statistical measuresfor the sample data in this test. Although the mean and
variance alone do not serve as good matching criteria,their joint statistics can be used to as the matchingcriteria. However, the joint statistics may not be applic-able to general matching problem for samples with un-known characteristics.The results presented in this section are divided into
two parts. The "rst part evaluates the performance oneach metric (M1}M10) in each color space (RGB, LUV,LAB, HSV). Based on the results in the "rst part, weeliminate those metrics and color space which do notperform well. The second part reports the performance ofthe proposed probabilistic combined metric on combin-ing the remaining metrics and color spaces.
6.1. Ground truth
In many pattern matching/recognition problems suchas character recognition and face recognition, it is easyto de"ne the ground truth. That is, each testing/trainingsample is labeled. This project focuses on the tonguediagnosis in traditional Chinese medicine (TCM). Thestraightforward way is to ask TCM doctors to label eachTTB, which will be the ground truth of the matching.However, it is hard to obtain because visual inspection ofcolor by TCM doctors is subjective. Our experience isthat di!erent TCM doctors will give di!erent colormeasurements on the same set of TTBs. In some cases,the deviation can be up to 40%. In turn, this projectemploys the consensus of all metrics in all color spacestogether with the percentile ranked method as theground truth. The experimental results are evaluated byTCMdoctors and are well accepted by the TCM doctors.Moreover, the ground is constructed by the scienti"c andobjective measurement.As the total number of TTBs is 189, there are 17,955
distances between these 189 TTBs (because of the sym-metric property of distance measurement). A thresholdvalue for 5 percentile match is obtained by sorting these17,955 distances to "nd the 898th smallest distance. Allthose image pairs with distances smaller than this thre-shold value is declared as a match. Similarly, the 10 and20 percentile match of each of the metric in each colorspace can be generated and compared to evaluate theperformance of the metrics in loose matches.To demonstrate how the percentile ranked method
works, let us consider the following example. Fig. 3ashows the result of color matching for one of the TTBs inLUV space using the 10 metrics as mentioned. There are10 rows in the "gure and the ith row corresponds theresult obtained using metric Mi. Therefore, the "rst rowshows the TTBs that are within 5 percentile match usingM1. The "rst TTB in each row ("rst column) is the testingTTB. The second TTB in each row shows the "rst closestmatch with the testing TTB. The third TTB in each rowshows the second best match and so on. Similarly, thelast TTB in each row shows the TTB that are within
C.H. Li, P.C. Yuen / Pattern Recognition 35 (2002) 407}419 411

Fig. 3. (a) Matched TTBs in the CIELHuHvH color space. (b) Matched TTBs in the HSV color space. (c) Matched TTBs in the RGB colorspace. (d) Matched TTBs in the CIE LHaHbH color space. The original colour images are available at www.comp.hkbu.edu.hk/&pcyuen/project/tongue}diagnosis/pr.htm
5 percentile match. Figs. 3b, 3c and 3d, give the results ofcolor matching for the "rst color block in the HSV, RGBand LAB, respectively.
6.2. Performance on diwerent metrics on diwerent colorspaces
Using the consensus of all metrics in all color spaces asthe ground truth, this section evaluates (1) the perfor-mance of each metric in each color space, (2) the perfor-mance on each color space by combining all metrics and
(3) the performance of each metric by combining all colorspaces. The objective of this section is to "nd out whichmetric(s) or color space(s) which do not perform well onTTB color matching. An objective criterion of the num-ber of mismatches of the metrics in di!erent color spacescompared with the overall consensus.
6.2.1. Performance of each metric on each color spaceAfter de"ning the matches on individual metric, their
consensus is computed based on the probabilistic com-bined metric as described in Section 5, and used as the
412 C.H. Li, P.C. Yuen / Pattern Recognition 35 (2002) 407}419
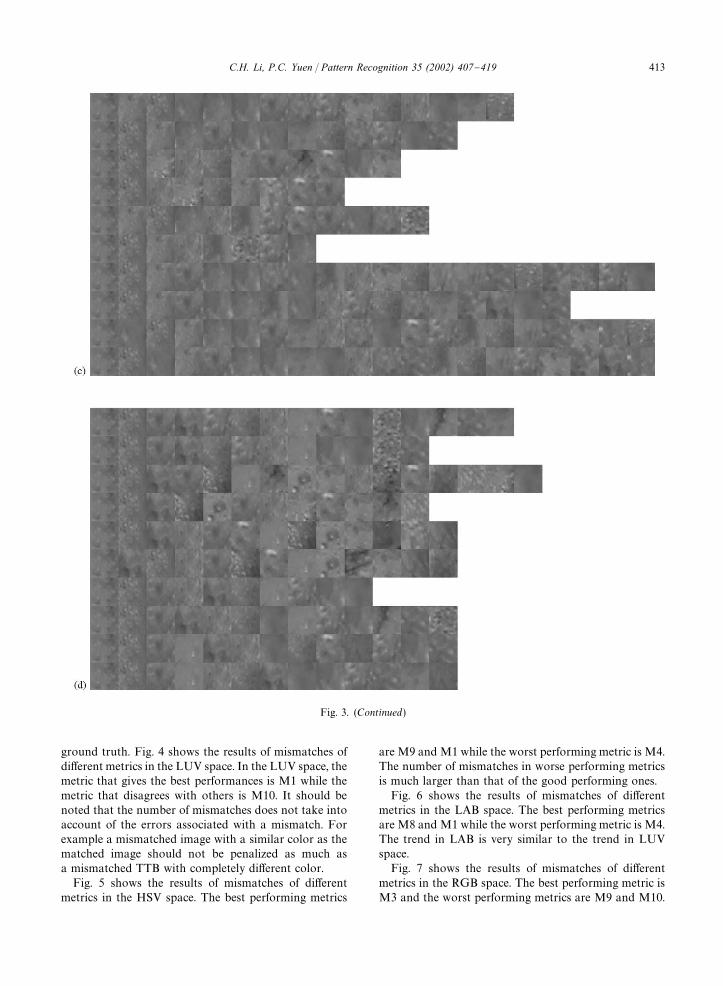
Fig. 3. (Continued)
ground truth. Fig. 4 shows the results of mismatches ofdi!erent metrics in the LUV space. In the LUV space, themetric that gives the best performances is M1 while themetric that disagrees with others is M10. It should benoted that the number of mismatches does not take intoaccount of the errors associated with a mismatch. Forexample a mismatched image with a similar color as thematched image should not be penalized as much asa mismatched TTB with completely di!erent color.Fig. 5 shows the results of mismatches of di!erent
metrics in the HSV space. The best performing metrics
are M9 and M1 while the worst performing metric is M4.The number of mismatches in worse performing metricsis much larger than that of the good performing ones.Fig. 6 shows the results of mismatches of di!erent
metrics in the LAB space. The best performing metricsare M8 and M1 while the worst performing metric is M4.The trend in LAB is very similar to the trend in LUVspace.Fig. 7 shows the results of mismatches of di!erent
metrics in the RGB space. The best performing metric isM3 and the worst performing metrics are M9 and M10.
C.H. Li, P.C. Yuen / Pattern Recognition 35 (2002) 407}419 413
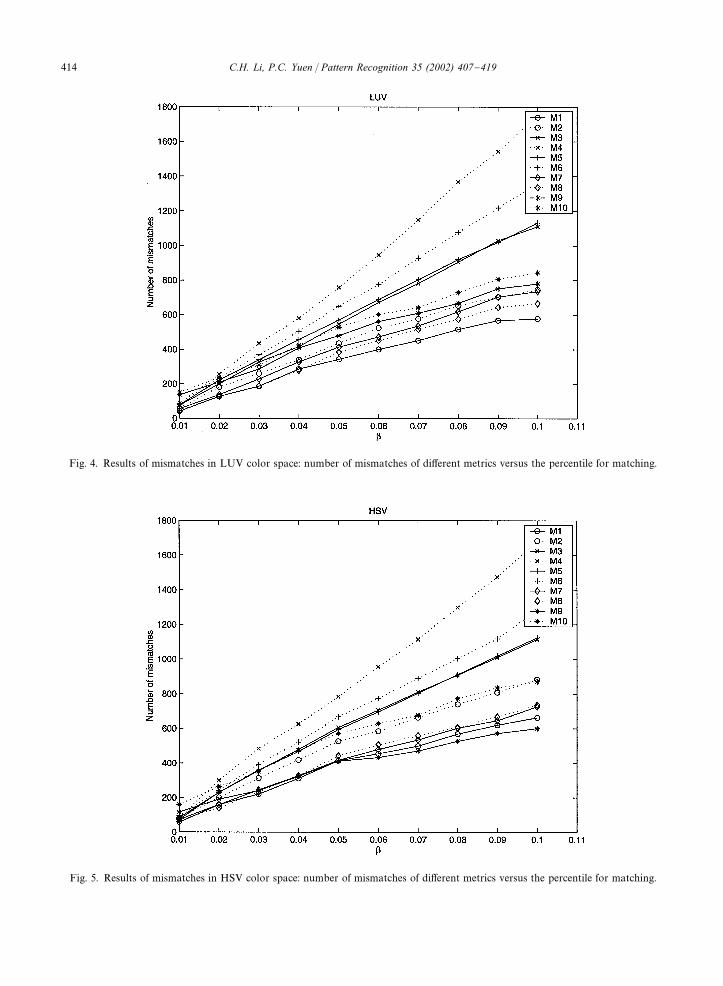
Fig. 4. Results of mismatches in LUV color space: number of mismatches of di!erent metrics versus the percentile for matching.
Fig. 5. Results of mismatches in HSV color space: number of mismatches of di!erent metrics versus the percentile for matching.
414 C.H. Li, P.C. Yuen / Pattern Recognition 35 (2002) 407}419

Fig. 6. Results of mismatches in LAB color space: number of mismatches of di!erent metrics versus the percentile for matching.
Fig. 7. Results of mismatches in RGB color space: number of mismatches of di!erent metrics versus the percentile for matching.
C.H. Li, P.C. Yuen / Pattern Recognition 35 (2002) 407}419 415
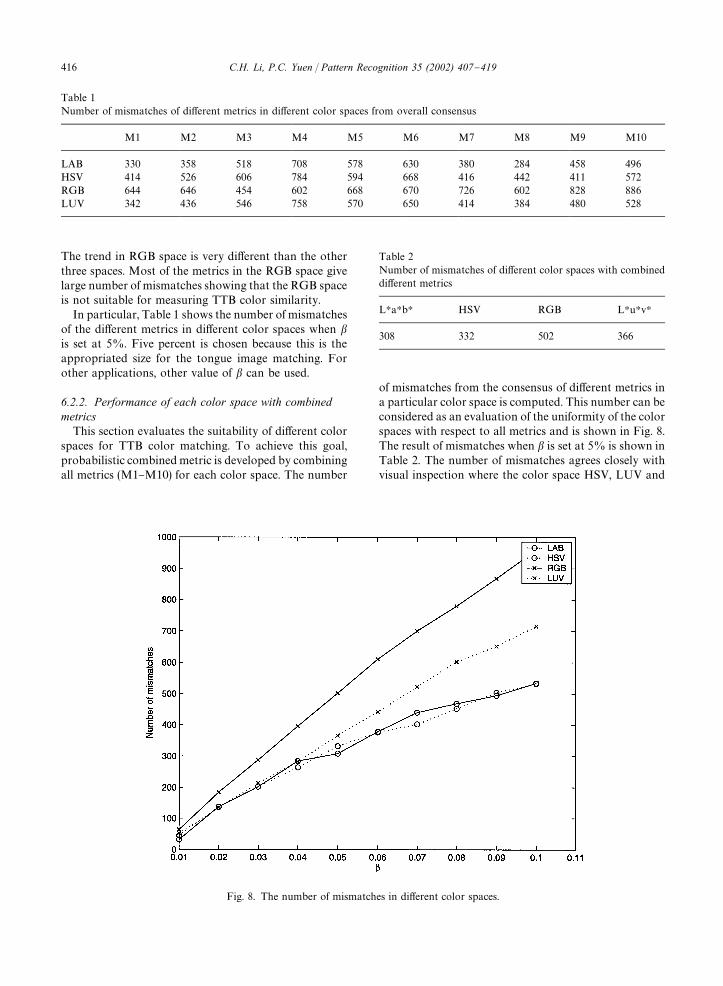
Table 1Number of mismatches of di!erent metrics in di!erent color spaces from overall consensus
M1 M2 M3 M4 M5 M6 M7 M8 M9 M10
LAB 330 358 518 708 578 630 380 284 458 496HSV 414 526 606 784 594 668 416 442 411 572RGB 644 646 454 602 668 670 726 602 828 886LUV 342 436 546 758 570 650 414 384 480 528
Fig. 8. The number of mismatches in di!erent color spaces.
Table 2Number of mismatches of di!erent color spaces with combineddi!erent metrics
LHaHbH HSV RGB LHuHvH
308 332 502 366
The trend in RGB space is very di!erent than the otherthree spaces. Most of the metrics in the RGB space givelarge number of mismatches showing that the RGB spaceis not suitable for measuring TTB color similarity.In particular, Table 1 shows the number of mismatches
of the di!erent metrics in di!erent color spaces when �is set at 5%. Five percent is chosen because this is theappropriated size for the tongue image matching. Forother applications, other value of � can be used.
6.2.2. Performance of each color space with combinedmetricsThis section evaluates the suitability of di!erent color
spaces for TTB color matching. To achieve this goal,probabilistic combinedmetric is developed by combiningall metrics (M1}M10) for each color space. The number
of mismatches from the consensus of di!erent metrics ina particular color space is computed. This number can beconsidered as an evaluation of the uniformity of the colorspaces with respect to all metrics and is shown in Fig. 8.The result of mismatches when � is set at 5% is shown inTable 2. The number of mismatches agrees closely withvisual inspection where the color space HSV, LUV and
416 C.H. Li, P.C. Yuen / Pattern Recognition 35 (2002) 407}419
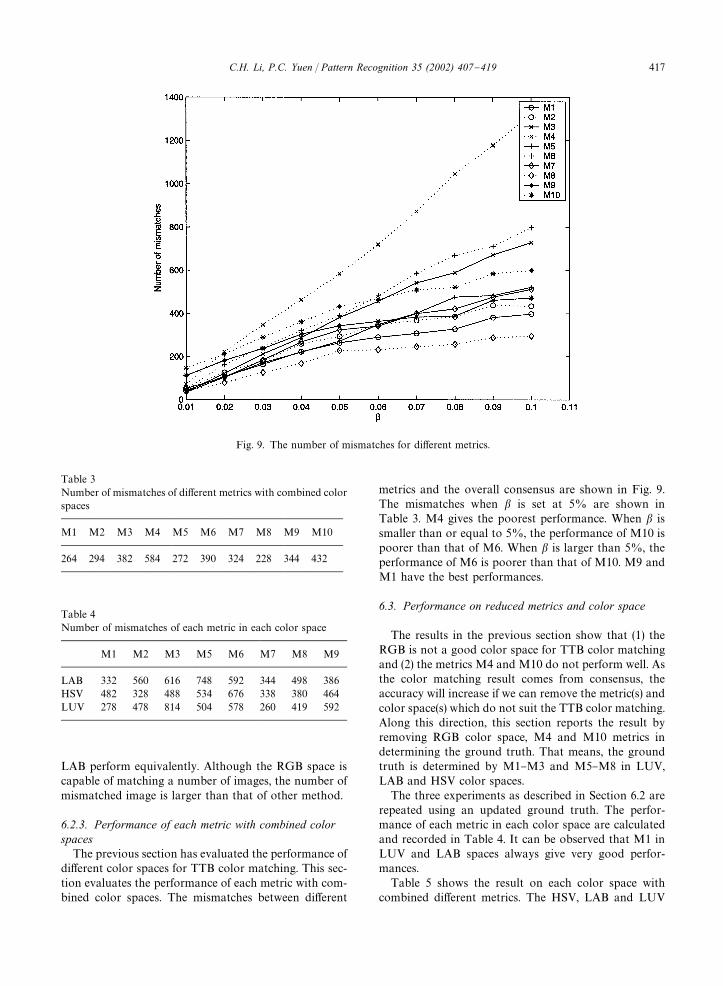
Fig. 9. The number of mismatches for di!erent metrics.
Table 3Number of mismatches of di!erent metrics with combined colorspaces
M1 M2 M3 M4 M5 M6 M7 M8 M9 M10
264 294 382 584 272 390 324 228 344 432
Table 4Number of mismatches of each metric in each color space
M1 M2 M3 M5 M6 M7 M8 M9
LAB 332 560 616 748 592 344 498 386HSV 482 328 488 534 676 338 380 464LUV 278 478 814 504 578 260 419 592
LAB perform equivalently. Although the RGB space iscapable of matching a number of images, the number ofmismatched image is larger than that of other method.
6.2.3. Performance of each metric with combined colorspacesThe previous section has evaluated the performance of
di!erent color spaces for TTB color matching. This sec-tion evaluates the performance of each metric with com-bined color spaces. The mismatches between di!erent
metrics and the overall consensus are shown in Fig. 9.The mismatches when � is set at 5% are shown inTable 3. M4 gives the poorest performance. When � issmaller than or equal to 5%, the performance of M10 ispoorer than that of M6. When � is larger than 5%, theperformance of M6 is poorer than that of M10. M9 andM1 have the best performances.
6.3. Performance on reduced metrics and color space
The results in the previous section show that (1) theRGB is not a good color space for TTB color matchingand (2) the metrics M4 and M10 do not perform well. Asthe color matching result comes from consensus, theaccuracy will increase if we can remove the metric(s) andcolor space(s) which do not suit the TTB color matching.Along this direction, this section reports the result byremoving RGB color space, M4 and M10 metrics indetermining the ground truth. That means, the groundtruth is determined by M1}M3 and M5}M8 in LUV,LAB and HSV color spaces.The three experiments as described in Section 6.2 are
repeated using an updated ground truth. The perfor-mance of each metric in each color space are calculatedand recorded in Table 4. It can be observed that M1 inLUV and LAB spaces always give very good perfor-mances.Table 5 shows the result on each color space with
combined di!erent metrics. The HSV, LAB and LUV
C.H. Li, P.C. Yuen / Pattern Recognition 35 (2002) 407}419 417

Table 5Number of mismatches of each color space with combineddi!erent metrics
LAB HSV LUV
264 348 246
Table 6Number of mismatches of each metric with combined di!erentcolor spaces
M1 M2 M3 M5 M6 M7 M8 M9
256 296 388 334 464 290 210 314
space have less consistent matches at di!erent rows whileTable 6 shows that results on each metric with combineddi!erent color spaces. From these two tables, it can beconcluded that M1, M2 and M8 in LUV and LAB colorspaces are suitable for TTB color matching. Moreover,M6 can also be removed as candidate for forming con-sensus as it does has a signi"cantly larger number ofmismatches. Furthermore, a visual examination of theimage matched shows that the matches using M6 hasmore variation than other metrics and is less consistent.However, a quantitative measurement of such errorswould inevitably include a choice of metrics.
7. Conclusion
The color matching of images in di!erent color spaceswith di!erent metrics have been investigated and re-ported in this paper. The metric in color coordinate spaceis analyzed and a sorted metric is proposed for matchingcolor images directly in coordinate space. A scheme forcombining metrics using a probability framework is alsoillustrated.The following conclusions can be deduced:
� After removing the metrics with poor performance andinappropriate color space, combined di!erent metricson di!erent color space is a good metric for color TTBmatching. The matching results are accepted by theTCM doctors.
� If a single metric on a single color space is used, theproposed sorted metric on LUV or LAB color space issuggested. This combination always gives a very goodresult.
� In comparing the L2 norms and L1 norms, L1 normsbased metric has better performances than L2 normsbased metrics.
� The point-to-cluster-centermetrics gives worse match-es and fails to match any images that have high vari-ations in color. This is in agreement with the theorythat the cluster-mean does not satisfy the identityproperty of a metric.
� The HSV color space gives very good performances inmatching as the average, despite the fact that it doesnot have the perceptual linearity of the CIE colorspaces. A possible explanation for this is that the imagesamples from patients lie in a subset of the colorspaces. In a color subset de"ned by our samples, thelinearity of the HSV space can be as good as thelinearity of the CIE spaces. The RGB color space givesmore mismatches especially in images with similarintensity but di!erent hues.
The future work of this project will integrate the colorimage matching result of this paper with our previousdeveloped tongue texture analysis method to builda complete vision-based tongue diagnosis system. Thesystem will be tested in the hospital of the GuangshowUniversity of Traditional Chinese Medicine. The "nalgoal is to develop a set of standard and objectivemeasurement for tongue diagnosis.
Acknowledgements
This project was supported by the Faculty ResearchGrant, Hong Kong Baptist University. The authorswould like to thank Dr. W. Wu and Ms. Z.Y. Kuang ofGuangzhow University of Traditional Chinese Medicinefor helpful discussions andMs. Joan Yuen for proofread-ing this manuscript.
References
[1] M. Nischik, C. Forster, Analysis of skin erythema usingtrue color images, IEEE Trans. Med. Imaging 16 (6) (1997)711}716.
[2] G.L. Hansen, E.M. Sparrow, J.Y. Kokate, K.Y. Leland,P.A. Iaizzo, Wounf status using color image processing,IEEE Trans. Med. Imaging 16 (1) (1997) 78}86.
[3] G.A. Hance, S.E. Umbaugh, R.H. Moss, W.V. Stoecker,Unsupervised color image segmentation: with applicationto skin tumor borders, IEEE EngngMed. Biol. Mag. 15 (1)(1996) 104}111.
[4] X. Shuai, Fundamentals of Traditional Chinese Medicine,Foreign Languages Press, Beijing, 1992.
[5] C.C. Chiu, H.S. Lin, S.L. Lin, A structural texture recogni-tion approach for medical diagnosis through tongue, Bio-med. Engng Appl. Basis Commun. 7 (2) (1995) 143}148.
[6] C.C. Chiu, The development of a computerized tonguediagnosis system, Biomed. Engng Appl. Basis Commun.8 (4) (1996) 342}350.
[7] P.C. Yuen, Z.Y. Kuang, W. Wu, Y.T. Wu, Tongue textureanalysis using opponent color features for tongue
418 C.H. Li, P.C. Yuen / Pattern Recognition 35 (2002) 407}419

diagnosis in traditional Chinese medicine, Proceeding ofInternational Workshop on Texture Analysis in MachineVision, pp. 21}27, June 1999.
[8] M. Flickner, H. Sawhney, W. Niblack, J. Ashley, Q.Huang, B. Dom, M. Gorkani, J. Hanfner, D. Lee, D.Petkovic, D. Steele, P. Yanker, Query by image and videocontent: the QBIC system, IEEE Trans. Comput. 28 (9)(1995) 23}32.
[9] J.R. Smith, S.F. Chuang, Query by color regions using thevisual seek content-based visual query system, in: M.T.Maybury (Ed.), Intelligent Multimedia InformationRetrieval, AAA Press/MIT Press, Cambridge, 1997.
[10] J. Kittler, M. Hatef, R.P.W. Duin, J. Matas, On combiningclassi"ers, IEEE Trans. Pattern Anal. Mach. Intell. 20 (3)(1998) 226}239.
[11] P. Duchnowski, M. Hunke, D. Busching, M. Meier, A.Waibel, Toward movement-invariant automatic lip-read-ing and speech recognition, Proceedings of ICASSP 95,Vol. 1, 1995, pp. 109}112.
[12] D.H. Ballard, C.M. Brown, Computer Vision, Prentice-Hall, Englewood Cli!s, NJ, 1982.
[13] K. Sobottka, I. Pitas, Extraction of facial regions andfeatures using color and shape information Proceedings
of International Conference on Image Processing, Vol. 3,1996, pp. 483}486.
[14] C.H. Lee, J.S. Kim, K.H. Park, Automatic human facelocation in a complex background using motion and colorinformation, Pattern Recognition 29 (1996) 1877}1889.
[15] R. Schumeyer, E. Heredia, K. Barner, Region of interestpriority coding for sign language video conferencing, Pro-ceedings of IEEE First Workshop on Multimedia SignalProcessing (1997) 531}536.
[16] L. Shafarenko, H. Petrou, J. Kittler, Histogram-based seg-mentation in a perceptually uniform color space, IEEETrans. Image Process. 7 (9) (1998) 1354}1358.
[17] I.S. Oh, J.S. Lee, C.Y. Suen, Analysis of class separationand combination of class-dependent features for hand-writing recognition, IEEE Trans. Pattern Anal. Mach.Intell. 21 (10) (1999) 1089}1094.
[18] D. Geiger, F. Girosi, Parallel and deterministicalgorithms for MRF's: surface reconstruction and integra-tion, IEEE Trans. Pattern Anal. Mach. Intell. 12 (1991)401}412.
[19] C.H. Li, P.C. Yuen, Regularized color clustering in medicalimage database, IEEE Trans. Med. Imaging 19 (11) (2000)1150}1155.
About the Author*C.H. LI received his Ph.D. in Electronic Engineering from the Hong Kong Polytechnic University in 1996. He iscurrently working as a post-doctoral fellow at the Department of Computer Science in the Hong Kong Baptist University. His researchinterests include stochastic image models, clustering methods and multimedia systems.
About the Author*P.C. YUEN received his B.Sc. degree in Electronic Engineering with "rst class honours in 1989 from CityPolytechnic of Hong Kong, and his Ph.D. degree in Electrical and Electronic Engineering in 1993 from The University of Hong Kong.Currently, he is an Associate Professor in the Department of Computer Science, Hong Kong Baptist University. Dr. Yuen wasa recipient of the University Fellowship to visit The University of Sydney in 1996. He was associated with the Laboratory of ImagingScience and Engineering, Department of Electrical Engineering. In 1998, Dr. Yuen spent a 6-month sabbatical leave in The University ofMaryland Institute for Advanced Computer Studies (UMIACS), University of Maryland at college park. He was associated with theComputer Vision Laboratory, CFAR. His major research interests include human face recognition, signature recognition and medicalimage processing.
C.H. Li, P.C. Yuen / Pattern Recognition 35 (2002) 407}419 419