tonga power reliability indicators review results and recommendations pauline muscat consultant...
TRANSCRIPT
Tonga Power Reliability Indicators
Review Results and Recommendations
Pauline Muscat
Consultant
October 2013
Objective
Review historical outage data and
develop suitable reliability indicator targets
MethodologyReview last 12 months outage data Investigate and evaluate data measurement, collection and
analysis processes, to identify any issuesWide consultation with staff at all levels Review reporting calculations and functionsData set refinement as requiredConduct training for Fault Operator, Fault Repair and
Generation staff, in accurate data collection and purpose in company performance
Analysed dataDeveloped targetsRecommendations

Issues - Technical
Calculation for indicators was using LVNumber of customers in network has grown, needed updateDate/time anomaly in FileMaker resulting in escalated resultsIncomplete outage records; no finish time, customers affectedIncorrect outage records; HV outage, no of customers = 0 etc,
incorrect Fault type selectedDiscrepancies between Generation and Distribution recordsIncomplete table of number of customers on each transformer
Issues – Non-technical
Lack of team work across departments;
Departments focused only on their own functions Lack of understanding of importance of accurate
data collection amongst staffImprovement observed in Fault Operator entries
over past months, not recognised or rewardedDespondent fault entry staff due to feeling they
had been kept as trainees for too long (over 18 mths)
Lack of training for Fault Response staff
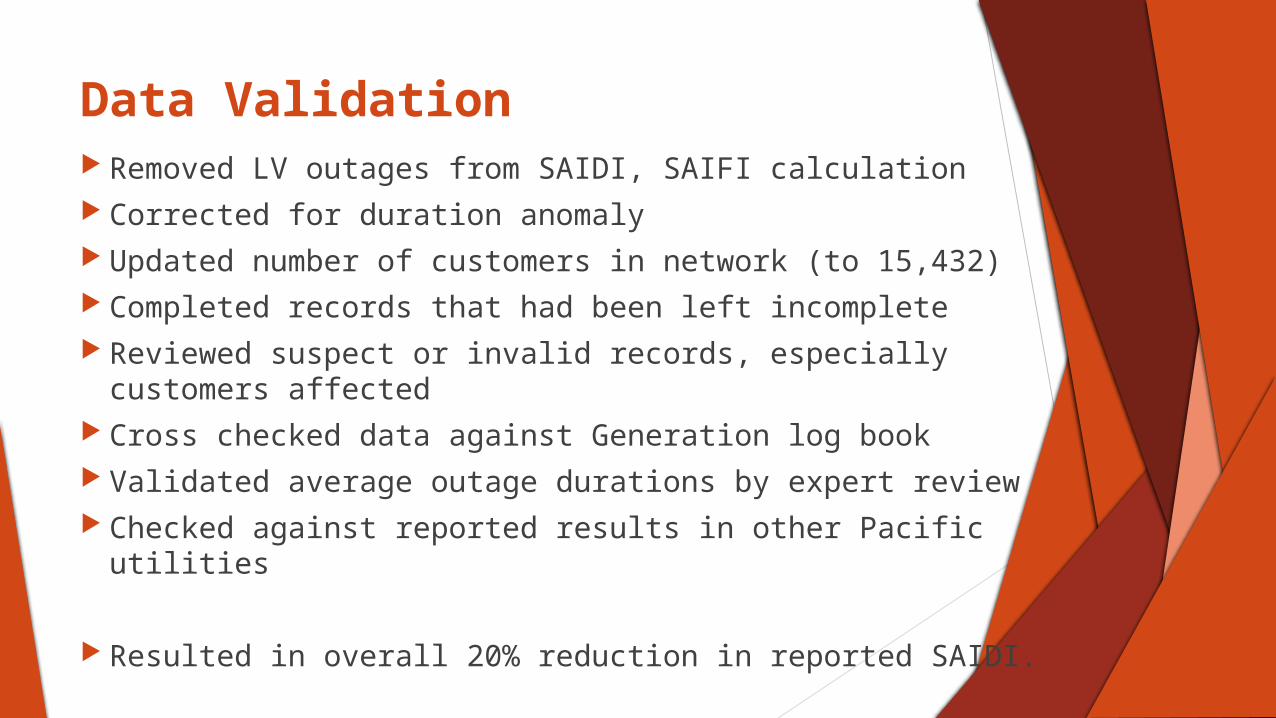
Data Validation Removed LV outages from SAIDI, SAIFI calculation Corrected for duration anomaly Updated number of customers in network (to 15,432) Completed records that had been left incomplete Reviewed suspect or invalid records, especially
customers affected Cross checked data against Generation log book Validated average outage durations by expert review Checked against reported results in other Pacific utilities
Resulted in overall 20% reduction in reported SAIDI.
Data Analysis
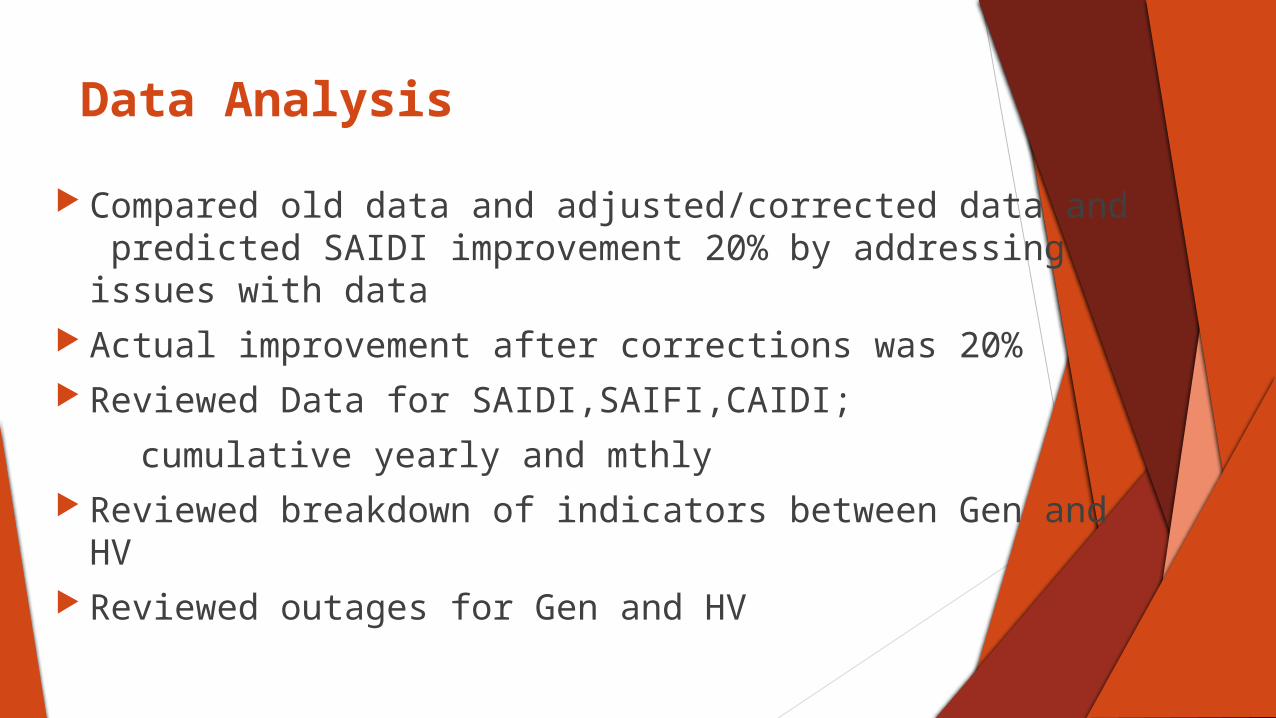
Compared old data and adjusted/corrected data and predicted SAIDI improvement 20% by addressing issues with data
Actual improvement after corrections was 20% Reviewed Data for SAIDI,SAIFI,CAIDI;
cumulative yearly and mthly Reviewed breakdown of indicators between Gen and HV Reviewed outages for Gen and HV

Results
SAIDI Outages SAIFI CAIDI

Data Correction
Jul-12 Aug-12 Sep-12 Oct-12 Nov-12 Dec-12 Jan-13 Feb-13 Mar-13 Apr-13 May-13 Jun-13 Jul-13 Aug-13 Sep-13 Total Last 12 mths
0
200
400
600
800
1000
1200
1400
1600
Cumulative SAIDI Old versus New; FY 2012/13
SAIDI Cumulative Old Data SAIDI Cumulative New Data
1138 min/cust/yr
1423 min/cust/yr
SAIDI
May-12 Jul-12 Aug-12 Oct-12 Dec-12 Jan-13 Mar-13 May-13 Jun-13 Aug-13 Oct-130
50
100
150
200
250
300
350
400
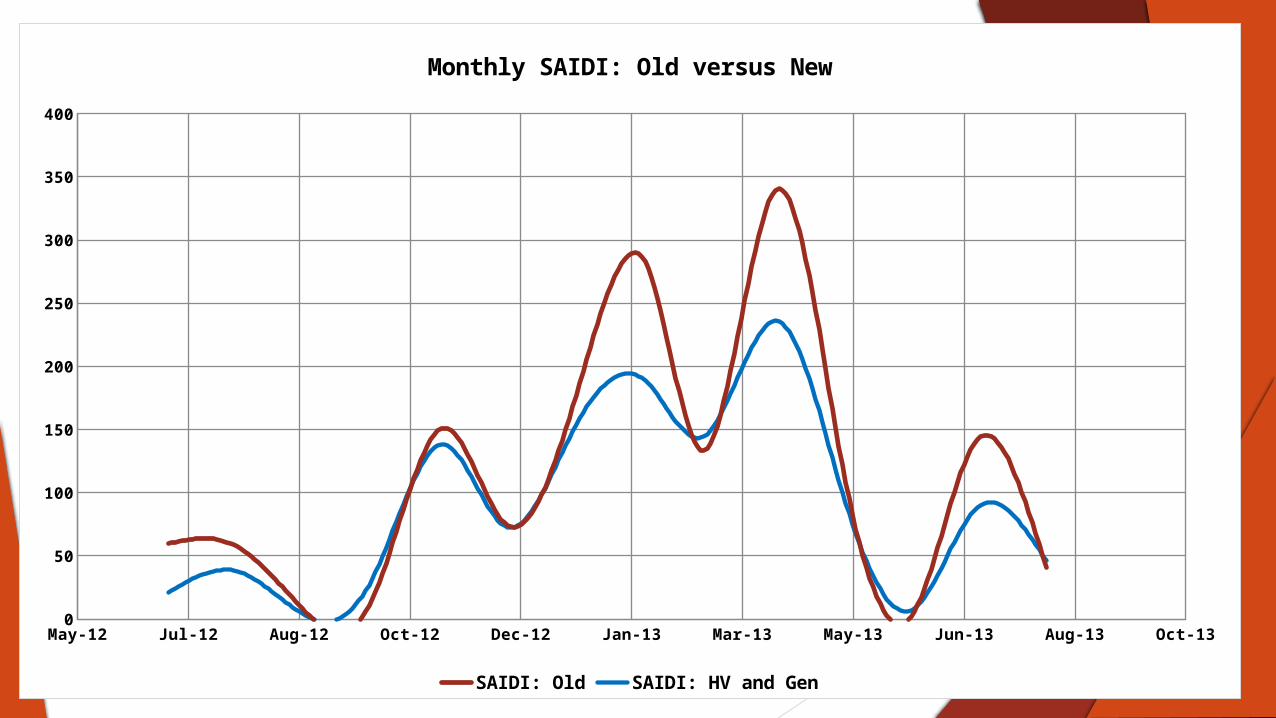
Monthly SAIDI: Old versus New
SAIDI: Old SAIDI: HV and Gen

Jul-12 Aug-12 Sep-12 Oct-12 Nov-12 Dec-12 Jan-13 Feb-13 Mar-13 Apr-13 May-13 Jun-13 Jul-13 Aug-13 Sep-130
50
100
150
200
250
Total Monthly SAIDI: Generation and HV
Gen Total HV Total

Jul-12 Sep-12 Nov-12 Jan-13 Mar-13 May-13 Jul-13 Sep-130
50
100
150
200
250
Total Monthly SAIDI: Generation and HV
Gen Total HV Total New Av per Mth
Av: 91.0 min/cust/mth
Jul-12 Aug-12 Sep-12 Oct-12 Nov-12 Dec-12 Jan-13 Feb-13 Mar-13 Apr-13 May-13 Jun-13 Jul-13 Aug-13 Sep-130
20
40
60
80
100
120
140
160
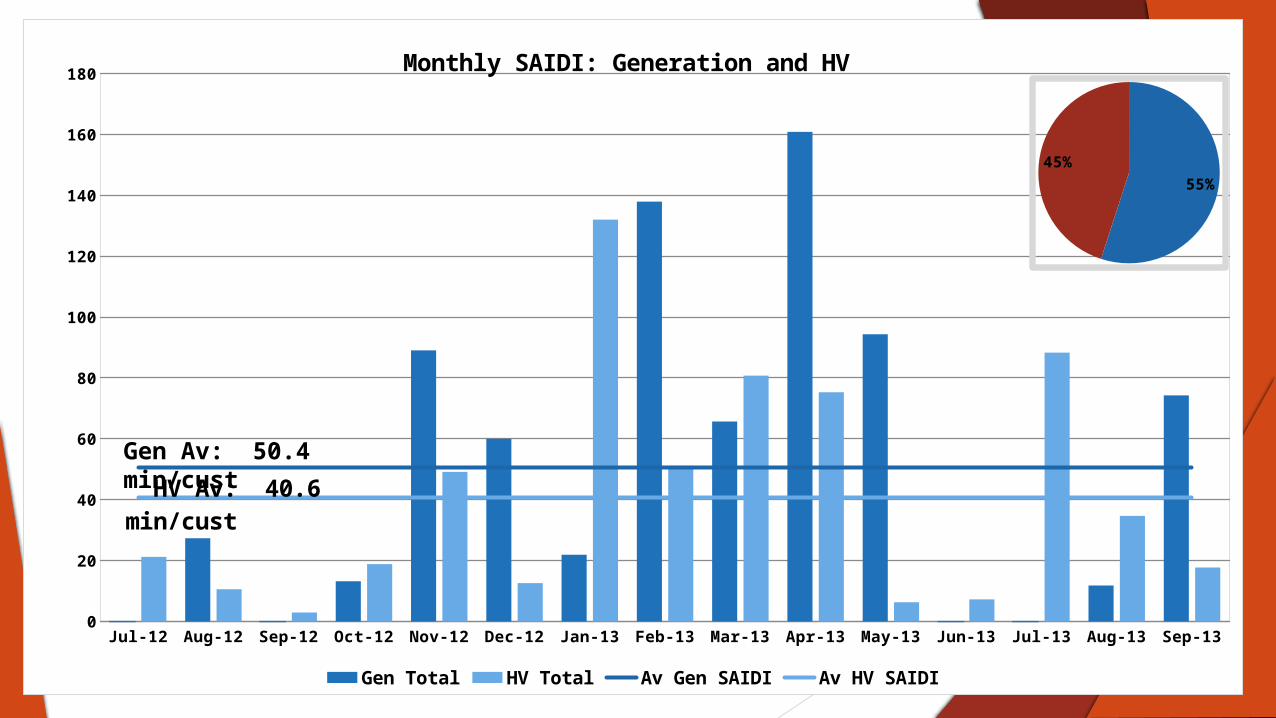
180Monthly SAIDI: Generation and HV
Gen Total HV Total Av Gen SAIDI Av HV SAIDI
HV Av: 40.6 min/cust
Gen Av: 50.4 min/cust
55%45%

1 2 3 4 5 6 7 8 9 10 11 12 13 14 150
10
20
30
40
50
60
70
Average Outages per Month: Gen and HV
Gen outages HV outages Total Av OutagesHV Av Outages Gen Av Outages
Total Av: 27.4 outages / mth
Gen Av: 2.9 outages / mth
HV Av: 22.6 outages / mth
12%
88%
Gen
HV
Jul-12 Aug-12 Sep-12 Oct-12 Nov-12 Dec-12 Jan-13 Feb-13 Mar-13 Apr-13 May-13 Jun-130
5
10
15
20
25
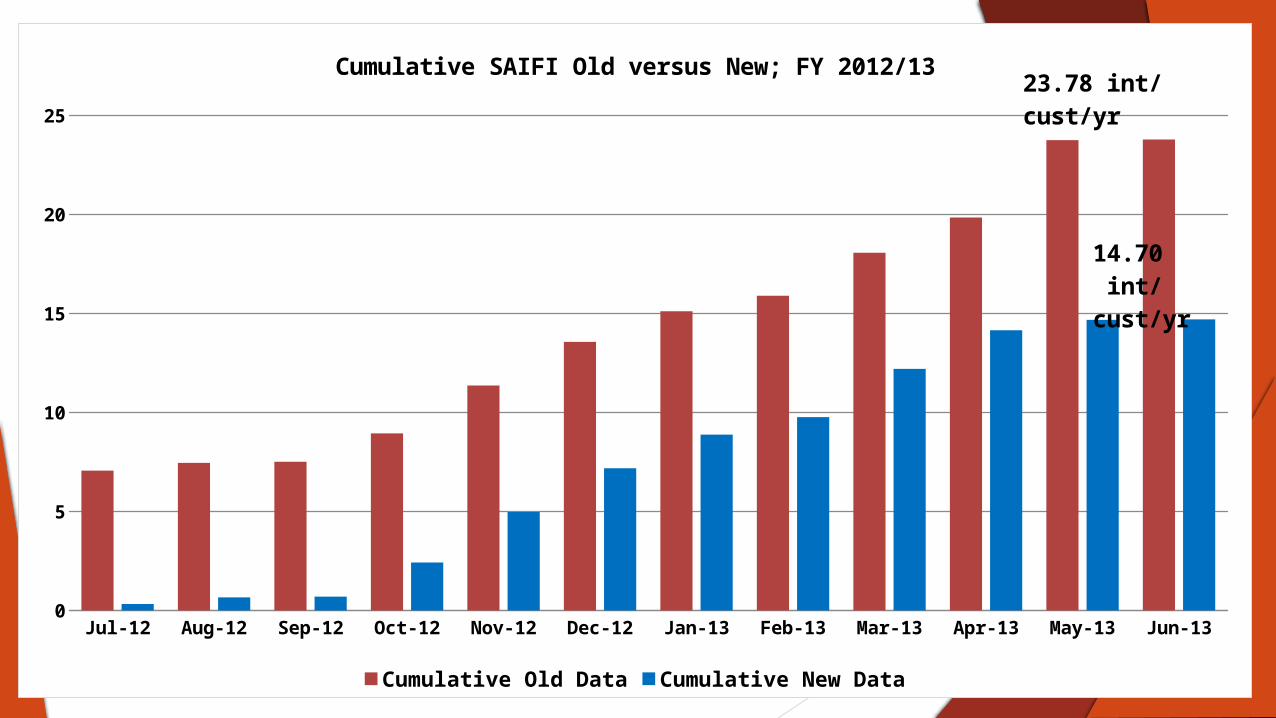
Cumulative SAIFI Old versus New; FY 2012/13
Cumulative Old Data Cumulative New Data
23.78 int/cust/yr
14.70 int/cust/yr

May-12 Jul-12 Aug-12 Oct-12 Dec-12 Jan-13 Mar-13 May-13 Jun-13 Aug-13 Oct-130
1
2
3
4
5
6
7
8
Monthly SAIFI: Old versus New
SAIFI: Old

Jul-1
2
Aug-12
Sep-1
2
Oct
-12
Nov
-12
Dec
-12
Jan-1
3
Feb-1
3
Mar
-13
Apr-13
May
-13
Jun-1
3
Jul-1
3
Aug-13
Sep-1
30.0
0.5
1.0
1.5
2.0
2.5
3.0
Total Monthly SAIFI: Generation and HV
Gen Total HV Total
61%
39%
HV Gen
61%
39%
HV Gen
Jul-12 Aug-12 Sep-12 Oct-12 Nov-12 Dec-12 Jan-13 Feb-13 Mar-13 Apr-13 May-13 Jun-13 Jul-13 Aug-13 Sep-130.0
0.5
1.0
1.5
2.0
2.5
3.0
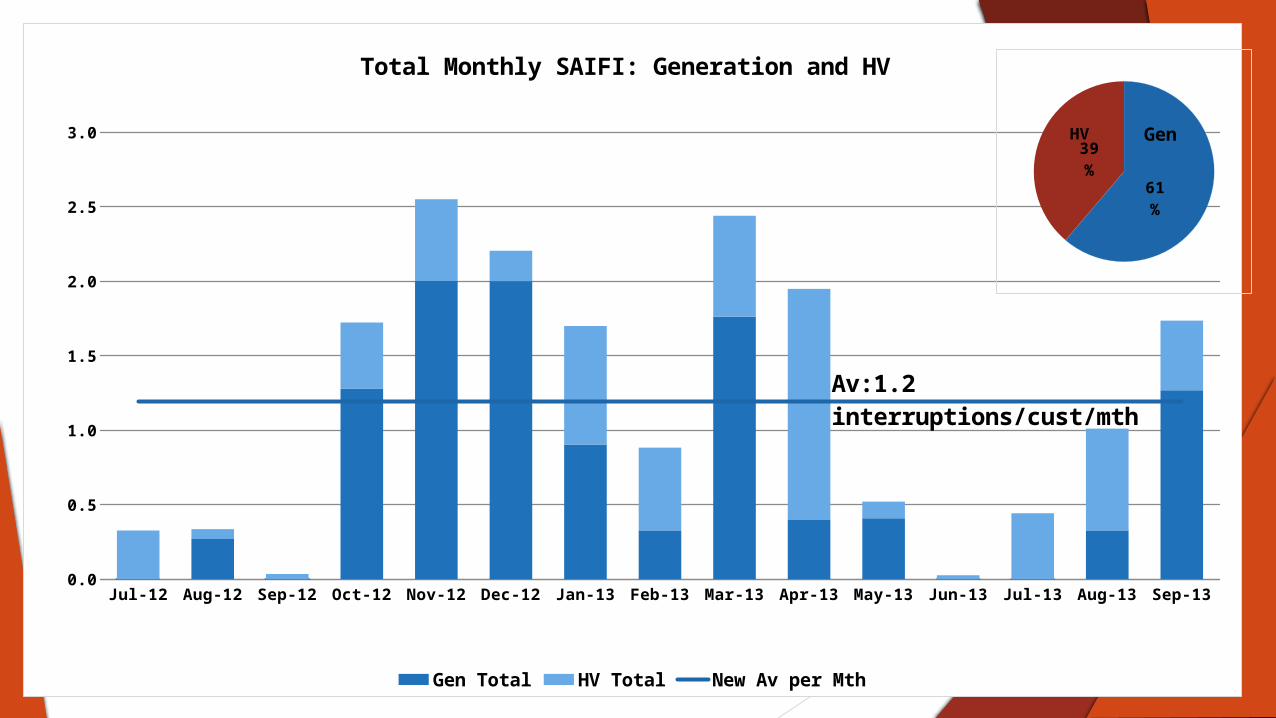
Total Monthly SAIFI: Generation and HV
Gen Total HV Total New Av per Mth
Av:1.2 interruptions/cust/mth
61%
39%
HV Gen
HV Gen
61%
39%
HV Gen
Jul-12 Aug-12 Sep-12 Oct-12 Nov-12 Dec-12 Jan-13 Feb-13 Mar-13 Apr-13 May-13 Jun-13 Jul-13 Aug-13 Sep-130.00
0.50
1.00
1.50
2.00
2.50
3.00
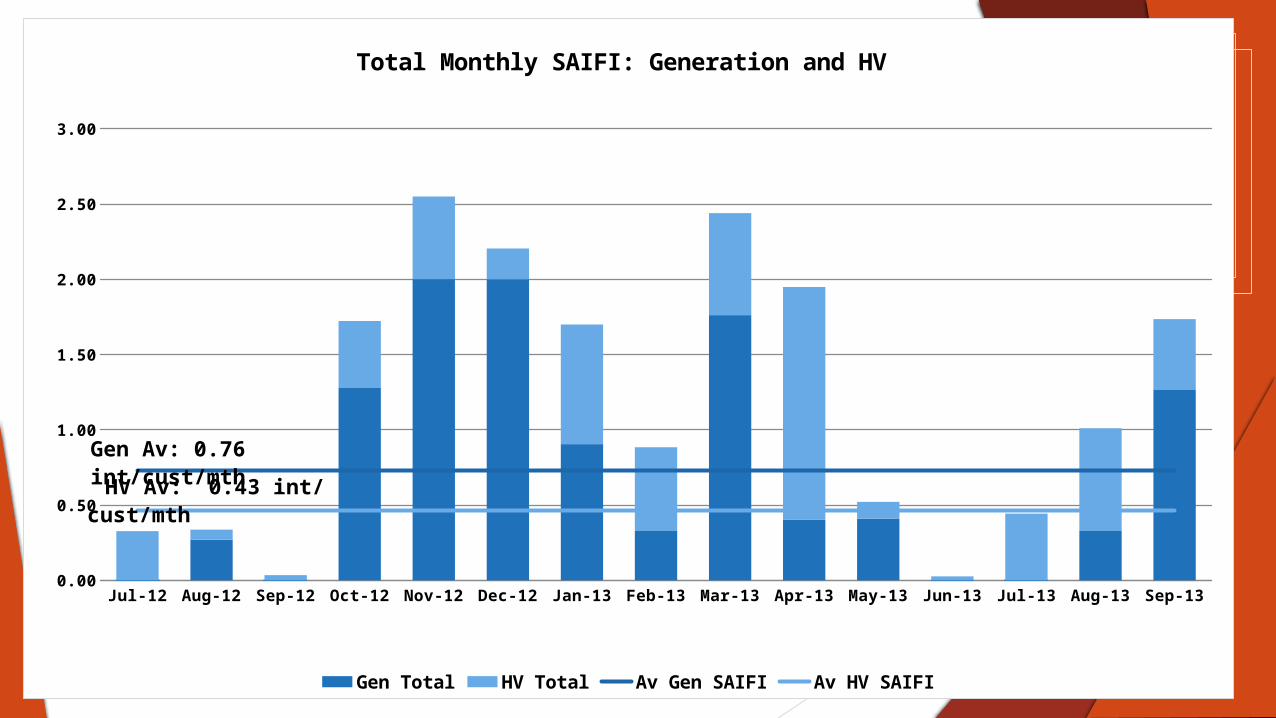
Total Monthly SAIFI: Generation and HV
Gen Total HV Total Av Gen SAIFI Av HV SAIFI
Gen Av: 0.76 int/cust/mth HV Av: 0.43 int/cust/mth

Jul-12 Aug-12 Sep-12 Oct-12 Nov-12 Dec-12 Jan-13 Feb-13 Mar-13 Apr-13 May-13 Jun-130
200
400
600
800
1000
1200
1400
Cumulative CAIDI Old versus New; FY 2012/13
Cumulative Old Data Cumulative New Data
918min
1273 min
Jul-12 Sep-12 Nov-12 Jan-13 Mar-13 May-13 Jul-13 Sep-130
50
100
150
200
250
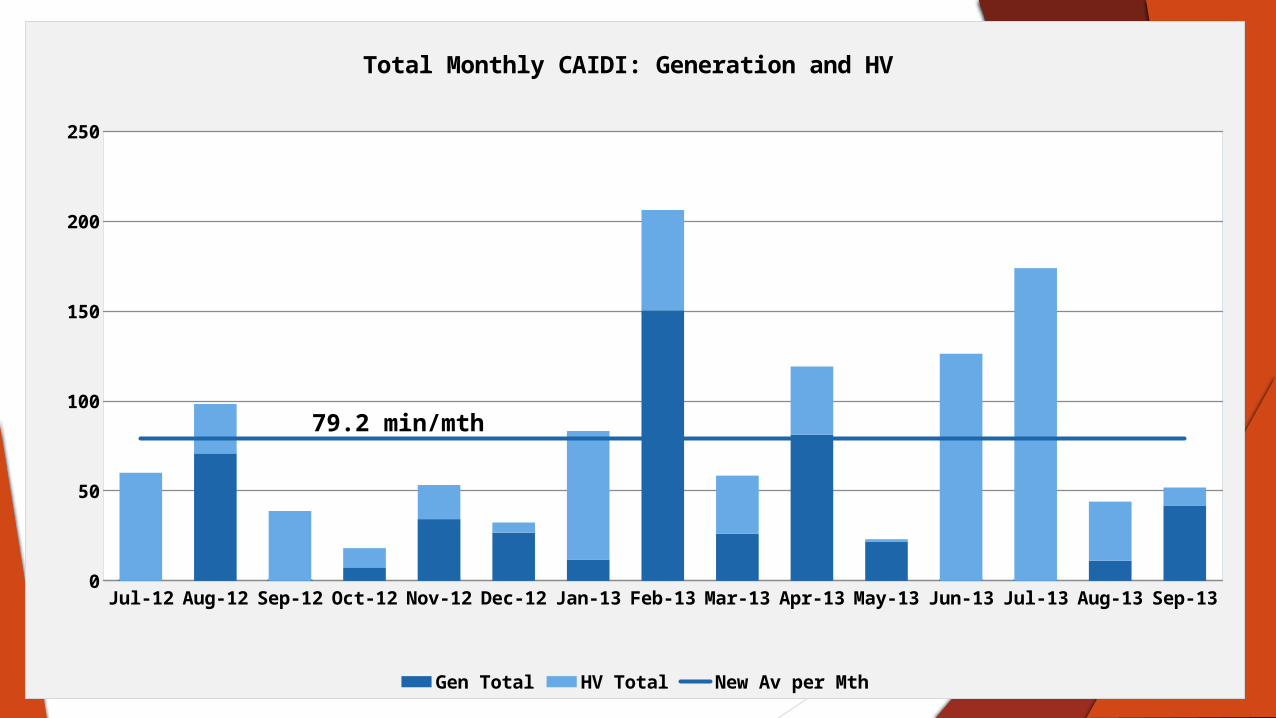
Total Monthly CAIDI: Generation and HV
Gen Total HV Total New Av per Mth
79.2 min/mth

Targets
1 Common KPI Target for all to work together to achieve Target: 5% Improvement on SAIDI, SAIFI, CAIDI Company wide communication and involvement and
reward Yearly Goal, Reported and Calculated Monthly Excludes extreme weather events Continued improved data recording and reporting
Jul-12 Oct-12 Jan-13 Apr-13 Jul-130
50
100
150
200
250
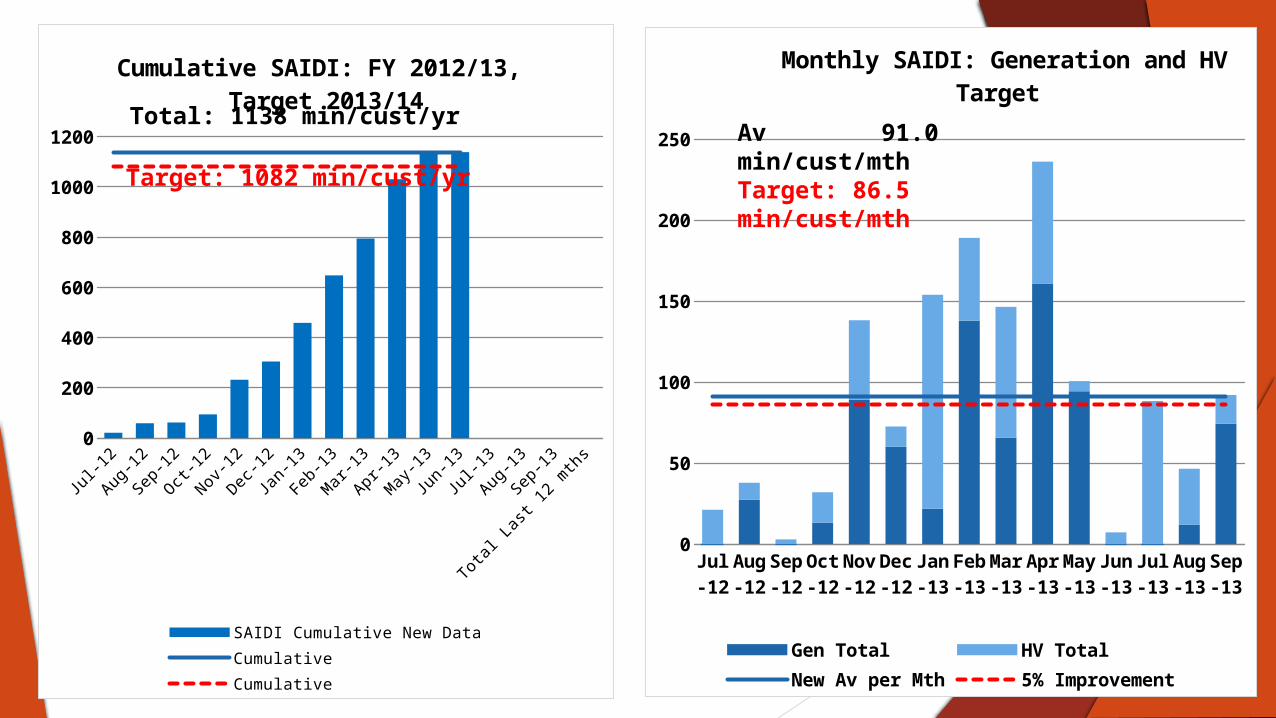
Monthly SAIDI: Generation and HVTarget
Gen Total HV TotalNew Av per Mth 5% Improvement
Av 91.0 min/cust/mthTarget: 86.5 min/cust/mth
Jul-1
2
Aug-1
2
Sep-
12
Oct-1
2
Nov-1
2
Dec-1
2
Jan-
13
Feb-
13
Mar
-13
Apr-1
3
May
-13
Jun-
13
Jul-1
3
Aug-1
3
Sep-
13
Tota
l Las
t 12
mth
s0
200
400
600
800
1000
1200
Cumulative SAIDI: FY 2012/13, Target 2013/14
SAIDI Cumulative New DataCumulativeCumulative
Target: 1082 min/cust/yr
Total: 1138 min/cust/yr

Target: 1082 m/cust/yrTotal: 1138 m/cust/yr
Jul-1
2
Aug-1
2
Sep-
12
Oct-1
2
Nov-1
2
Dec-1
2
Jan-
13
Feb-
13
Mar
-13
Apr-1
3
May
-13
Jun-
130
2
4
6
8
10
12
14
16
Cumulative SAIFI: FY 2012/13, Target 2013/14
Cumulative New Data CumulativeTarget
Jul-12 Sep-12 Nov-12 Jan-13 Mar-13 May-13 Jul-13 Sep-130.0
0.5
1.0
1.5
2.0
2.5
3.0
Monthly SAIFI: Generation and HVTarget
Gen Total HV TotalNew Av per Mth 5% Improvement
Av 1.2 int/cust/mthTarget: 1.1 int/cust/mth
Total 15 interruptions/cust/mth
Target: 14 int/cust/mth
Jul-12 Sep-12 Nov-12 Jan-13 Mar-13 May-13 Jul-13 Sep-130
50
100
150
200
250
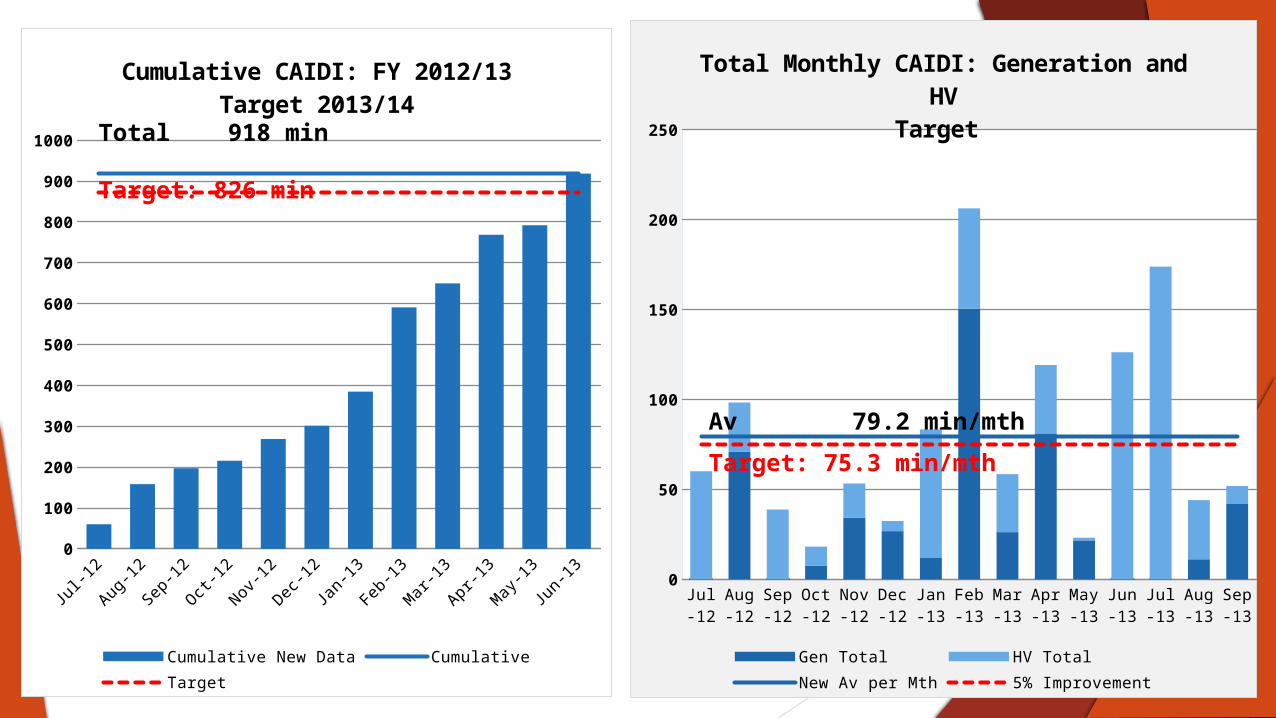
Total Monthly CAIDI: Generation and HV
Target
Gen Total HV TotalNew Av per Mth 5% Improvement
Av 79.2 min/mth
Target: 75.3 min/mth
Jul-1
2
Aug-1
2
Sep-
12
Oct-1
2
Nov-1
2
Dec-1
2
Jan-
13
Feb-
13
Mar
-13
Apr-1
3
May
-13
Jun-
130
100
200
300
400
500
600
700
800
900
1000
Cumulative CAIDI: FY 2012/13Target 2013/14
Cumulative New Data CumulativeTarget
Total 918 min
Target: 826 min

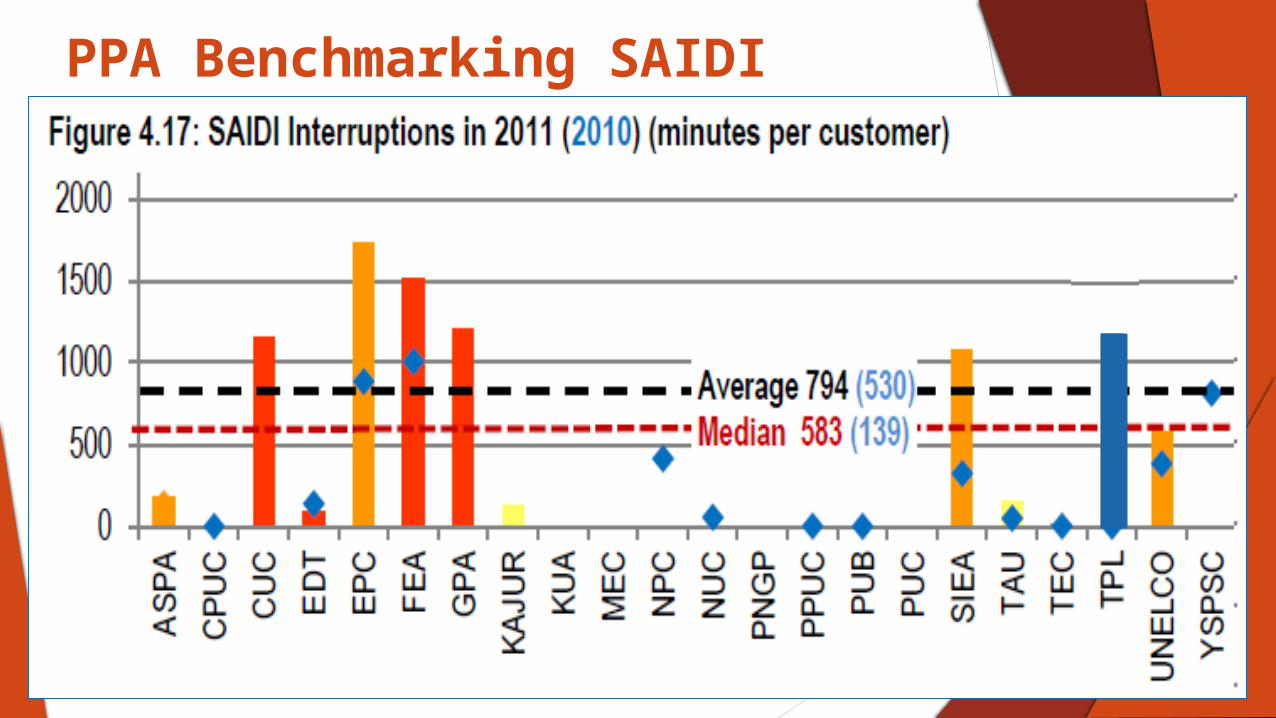
PPA Benchmarking SAIDI
Any Questions?
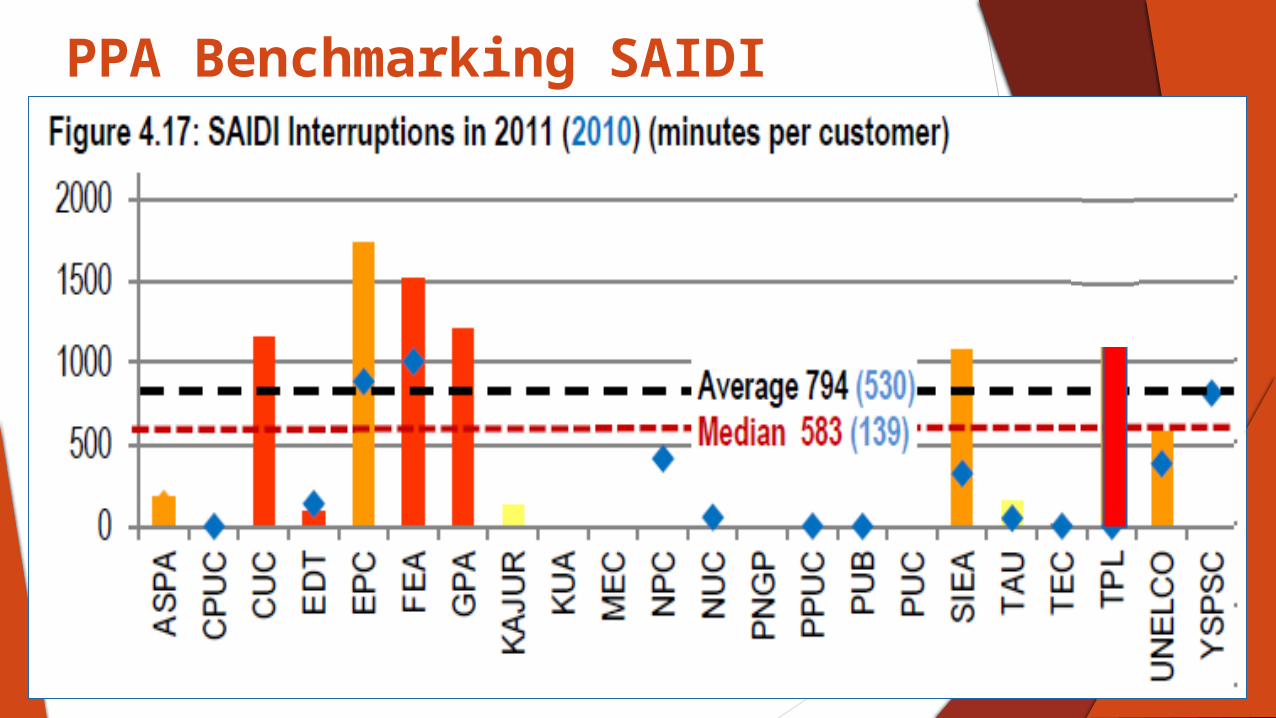
PPA Benchmarking SAIDI
Any Questions?
PPA Benchmarking SAIDI

PPA Benchmarking SAIFI

PPA Benchmarking SAIFI
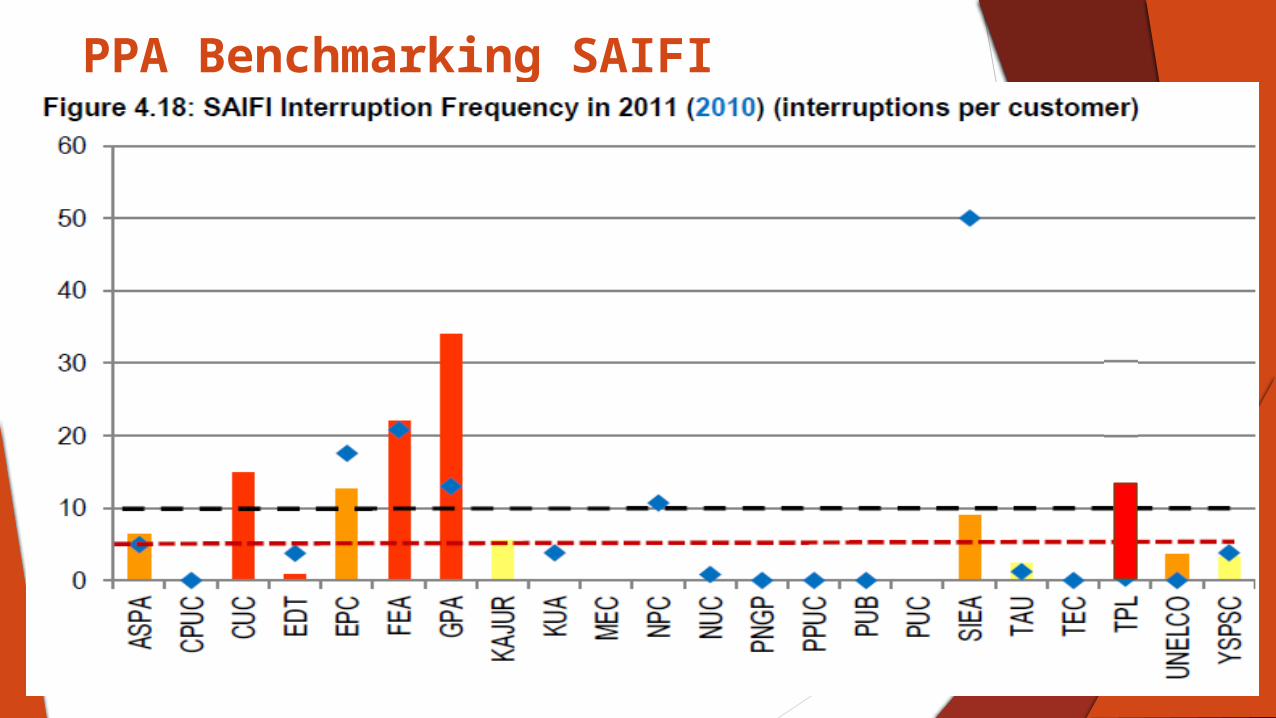
PPA Benchmarking SAIFI
Recommendations
Extend work to cover outer islands. Reliability indicators will likely improve by incorporating more customers.
Analyse fault response times and LV outages and develop targets
Unify all Tonga Power workers by setting a common set of KPI targets (eg SAIDI, SAIFI, CAIDI), with bonus payments for achieving targets.
Company wide communication and involvement and reward will instill ownership and encourage co-operation and support across department.
Continued improvement in data measurement, collection and analysis
Reinforce and continue training