tokkder operational leasing sector report
TRANSCRIPT

2020 End Year
TOKKDEROPERATIONAL LEASING SECTOR REPORT
2
CONTENT
03 Aim and Scope
06Methodology & Participating Companies
10 Summary
15 Vehicle Park
20 Contract Structure
23Vehicle Investments (Purchases, Sales and Paid Taxes)
31 Number of Customers

3
1- AIM AND SCOPE
4
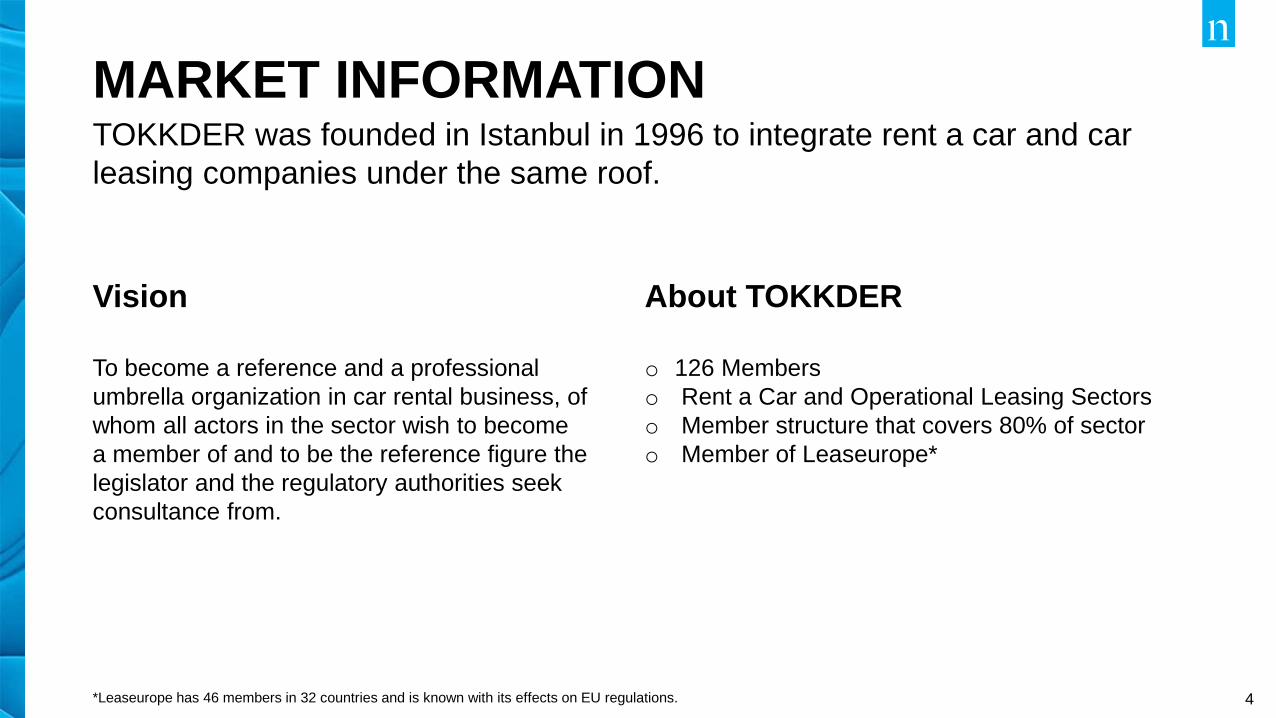
MARKET INFORMATION
*Leaseurope has 46 members in 32 countries and is known with its effects on EU regulations.
TOKKDER was founded in Istanbul in 1996 to integrate rent a car and car
leasing companies under the same roof.
Vision
To become a reference and a professional
umbrella organization in car rental business, of
whom all actors in the sector wish to become
a member of and to be the reference figure the
legislator and the regulatory authorities seek
consultance from.
About TOKKDER
o 126 Members
o Rent a Car and Operational Leasing Sectors
o Member structure that covers 80% of sector
o Member of Leaseurope*
5
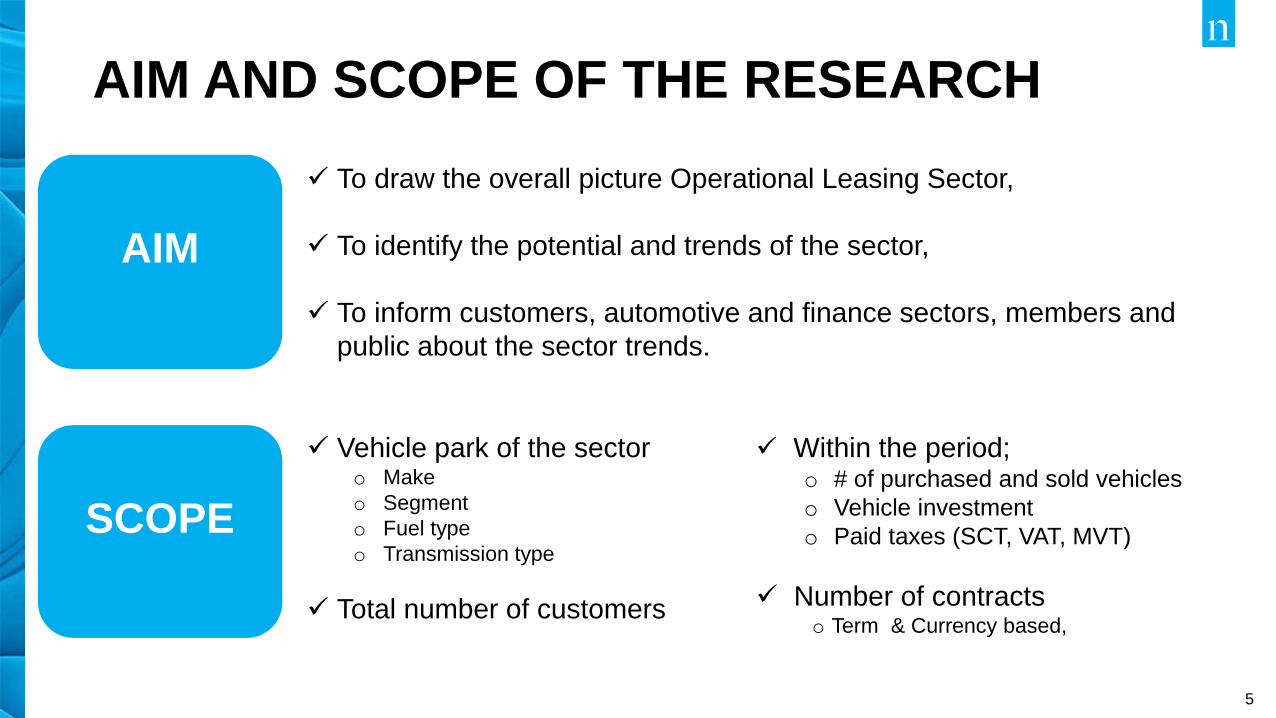
AIM AND SCOPE OF THE RESEARCH
To draw the overall picture Operational Leasing Sector,
To identify the potential and trends of the sector,
To inform customers, automotive and finance sectors, members and
public about the sector trends.
AIM
SCOPE
Vehicle park of the sectoro Make
o Segment
o Fuel type
o Transmission type
Total number of customers
Within the period;o # of purchased and sold vehicles
o Vehicle investment
o Paid taxes (SCT, VAT, MVT)
Number of contracts o Term & Currency based,

6
2- METHODOLOGY AND
PARTICIPATING
COMPANIES
7
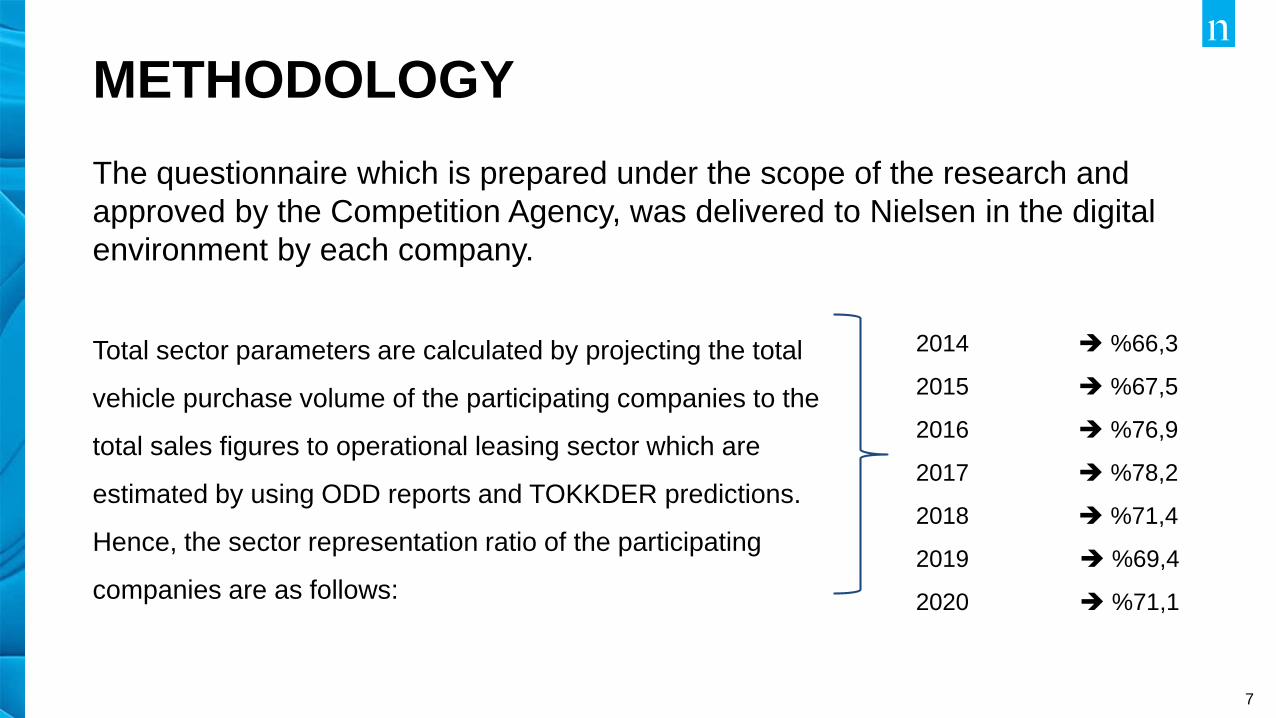
METHODOLOGY
The questionnaire which is prepared under the scope of the research and
approved by the Competition Agency, was delivered to Nielsen in the digital
environment by each company.
Total sector parameters are calculated by projecting the total
vehicle purchase volume of the participating companies to the
total sales figures to operational leasing sector which are
estimated by using ODD reports and TOKKDER predictions.
Hence, the sector representation ratio of the participating
companies are as follows:
2014 %66,3
2015 %67,5
2016 %76,9
2017 %78,2
2018 %71,4
2019 %69,4
2020 %71,1
8
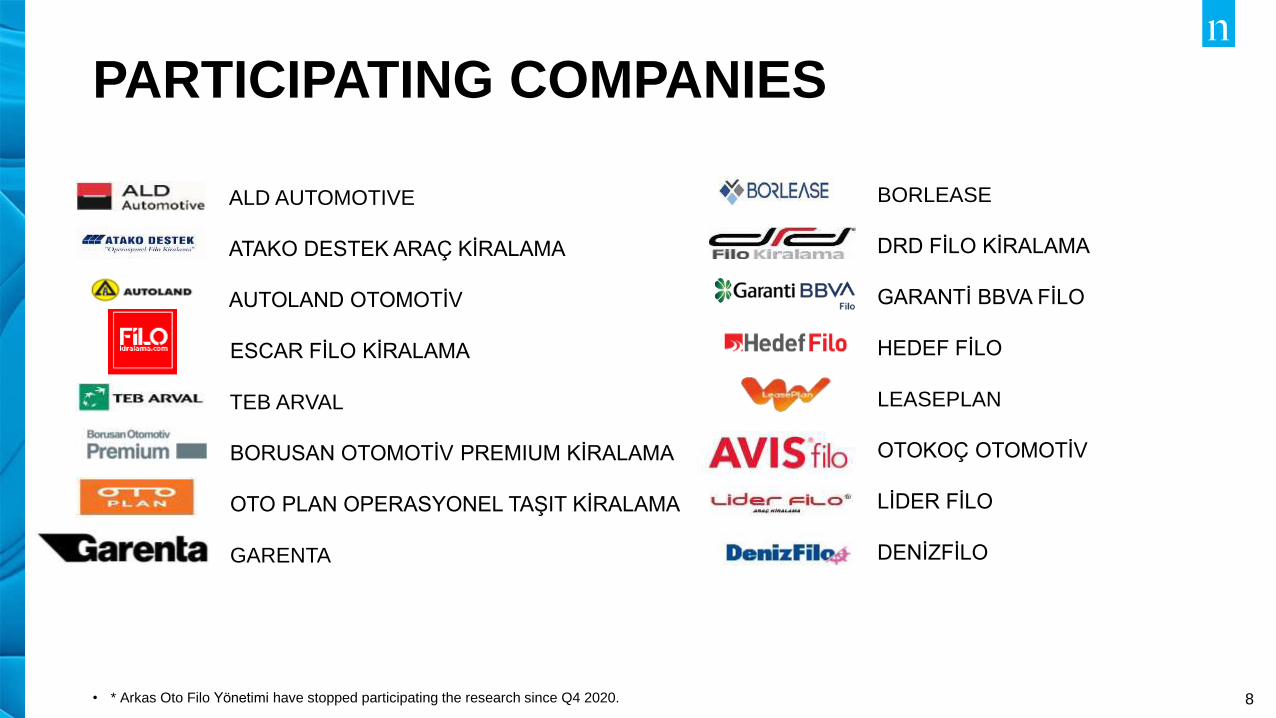
PARTICIPATING COMPANIES
• * Arkas Oto Filo Yönetimi have stopped participating the research since Q4 2020.
ALD AUTOMOTIVE
ATAKO DESTEK ARAÇ KİRALAMA
AUTOLAND OTOMOTİV
ESCAR FİLO KİRALAMA
TEB ARVAL
BORUSAN OTOMOTİV PREMIUM KİRALAMA
OTO PLAN OPERASYONEL TAŞIT KİRALAMA
GARENTA
BORLEASE
DRD FİLO KİRALAMA
GARANTİ BBVA FİLO
HEDEF FİLO
LEASEPLAN
OTOKOÇ OTOMOTİV
LİDER FİLO
DENİZFİLO
9
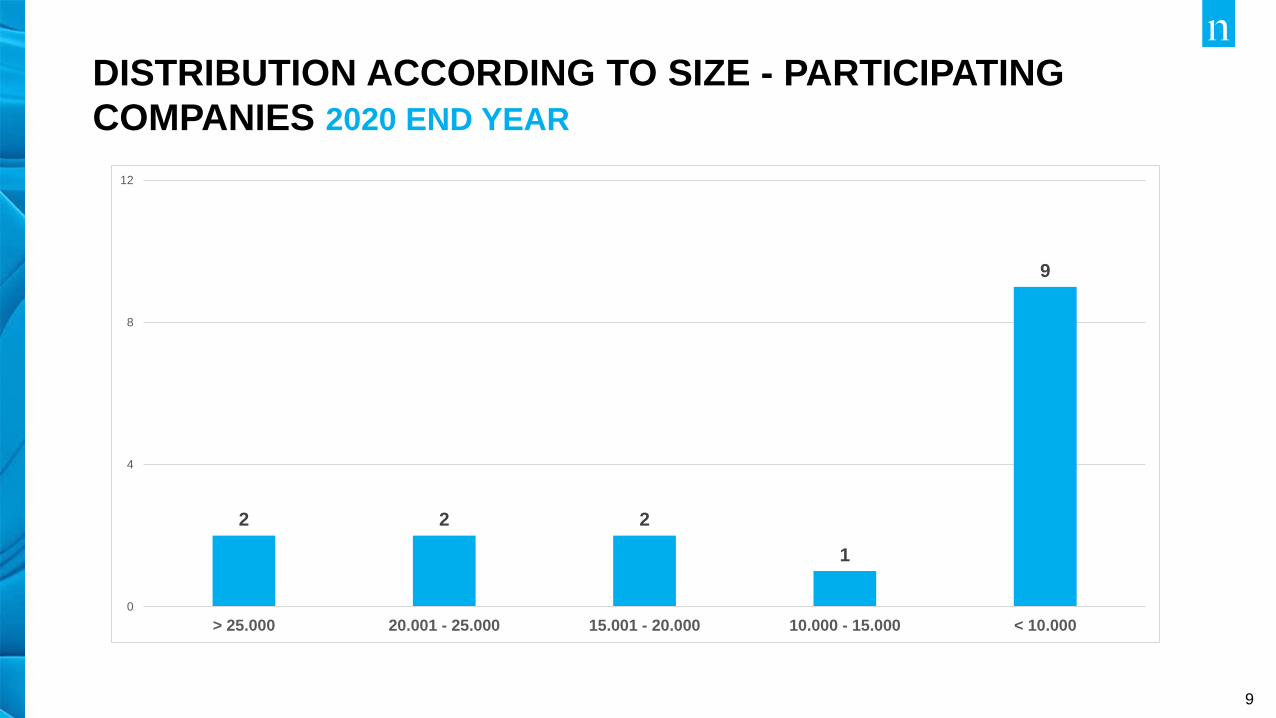
DISTRIBUTION ACCORDING TO SIZE - PARTICIPATING
COMPANIES 2020 END YEAR
2 2 2
1
9
0
4
8
12
> 25.000 20.001 - 25.000 15.001 - 20.000 10.000 - 15.000 < 10.000

10
3- SUMMARY
11
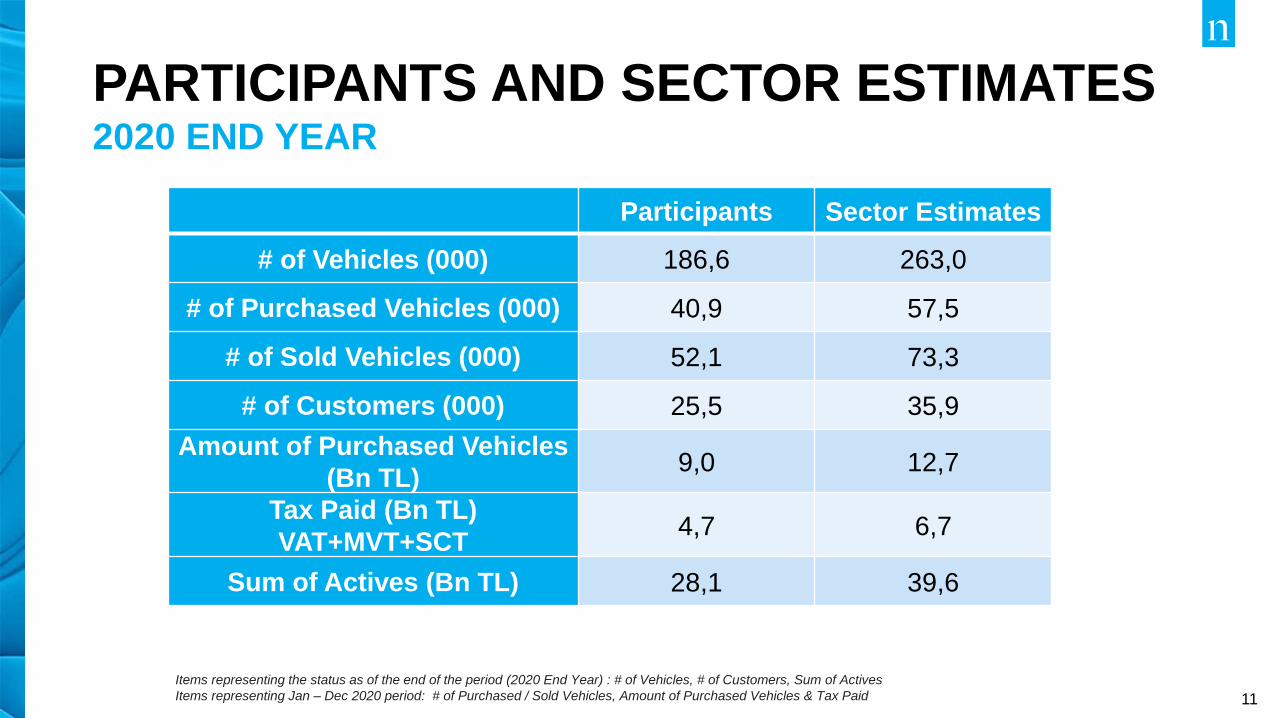
PARTICIPANTS AND SECTOR ESTIMATES2020 END YEAR
Participants Sector Estimates
# of Vehicles (000) 186,6 263,0
# of Purchased Vehicles (000) 40,9 57,5
# of Sold Vehicles (000) 52,1 73,3
# of Customers (000) 25,5 35,9
Amount of Purchased Vehicles
(Bn TL)9,0 12,7
Tax Paid (Bn TL)
VAT+MVT+SCT4,7 6,7
Sum of Actives (Bn TL) 28,1 39,6
Items representing the status as of the end of the period (2020 End Year) : # of Vehicles, # of Customers, Sum of Actives
Items representing Jan – Dec 2020 period: # of Purchased / Sold Vehicles, Amount of Purchased Vehicles & Tax Paid
12
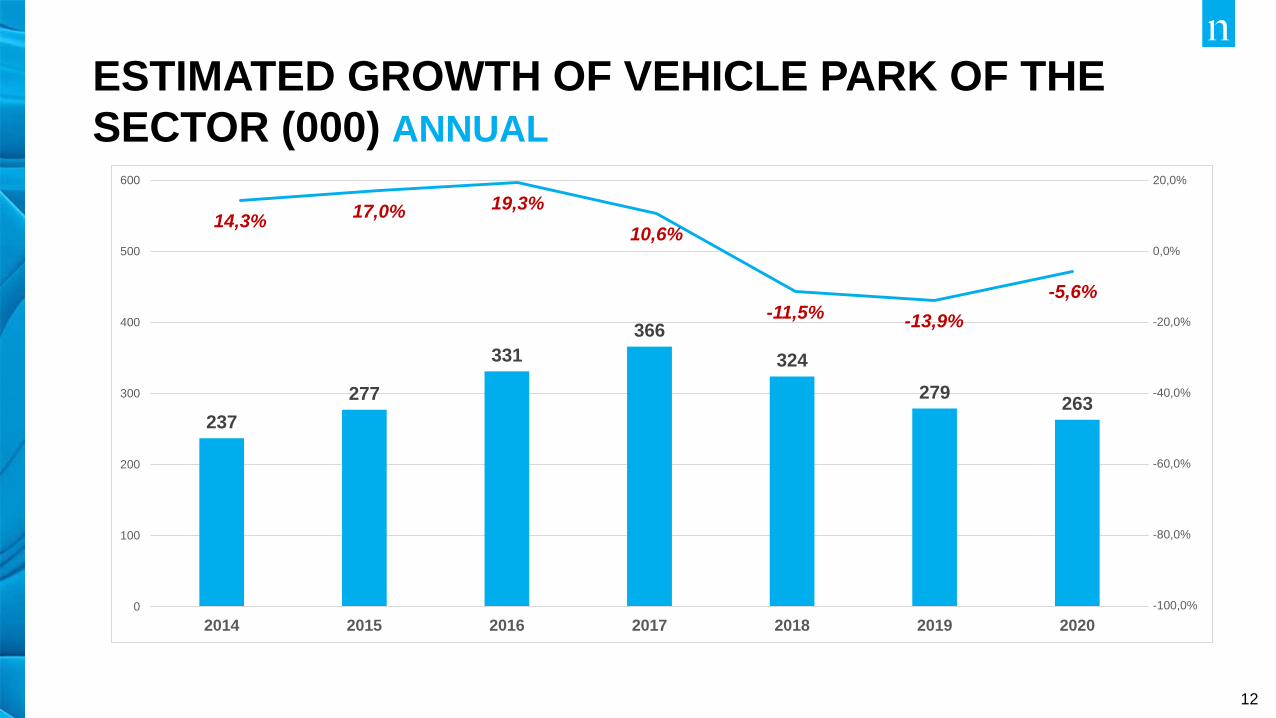
ESTIMATED GROWTH OF VEHICLE PARK OF THE
SECTOR (000) ANNUAL
237
277
331
366
324
279263
0
100
200
300
400
500
600
2014 2015 2016 2017 2018 2019 2020
-5,6%
-13,9%-11,5%
10,6%
19,3%17,0%14,3%
-100,0%
-80,0%
-60,0%
-40,0%
-20,0%
0,0%
20,0%
13
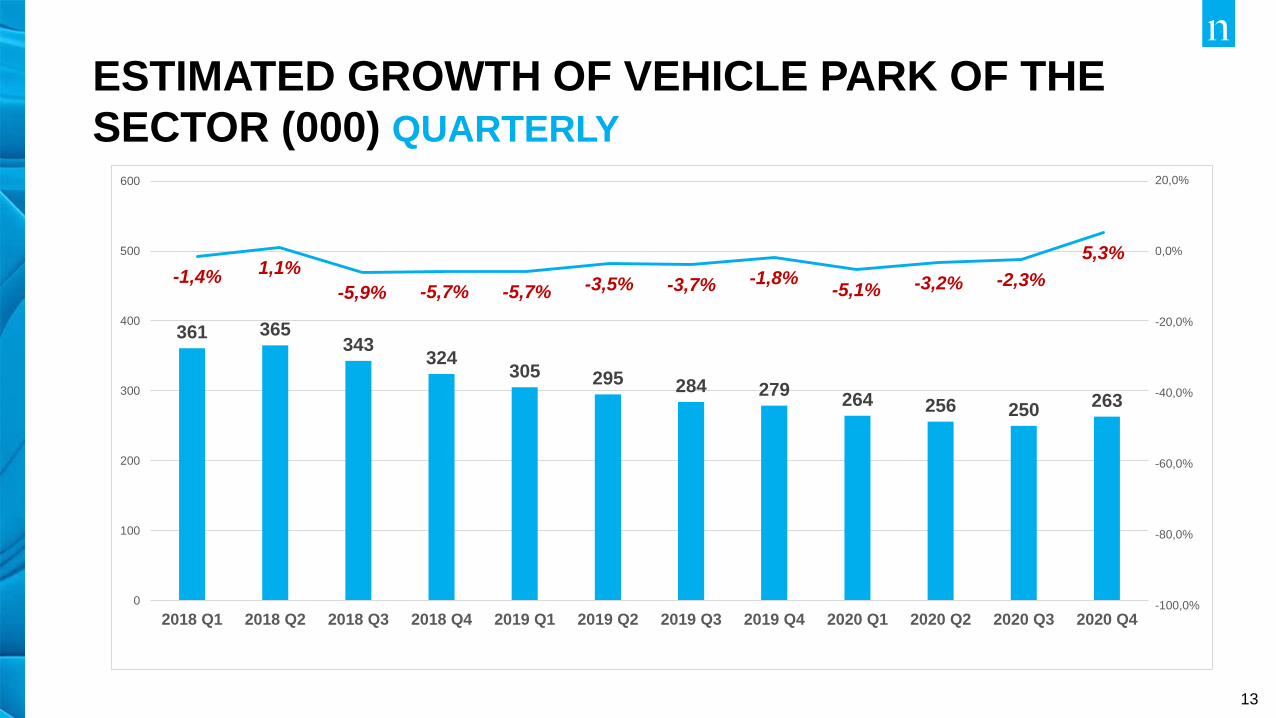
ESTIMATED GROWTH OF VEHICLE PARK OF THE
SECTOR (000) QUARTERLY
361 365343
324305 295 284 279
264 256 250263
0
100
200
300
400
500
600
2018 Q1 2018 Q2 2018 Q3 2018 Q4 2019 Q1 2019 Q2 2019 Q3 2019 Q4 2020 Q1 2020 Q2 2020 Q3 2020 Q4
5,3%
-2,3%-3,2%-5,1%-1,8%-3,7%-3,5%-5,7%-5,7%-5,9%
1,1%-1,4%
-100,0%
-80,0%
-60,0%
-40,0%
-20,0%
0,0%
20,0%
14
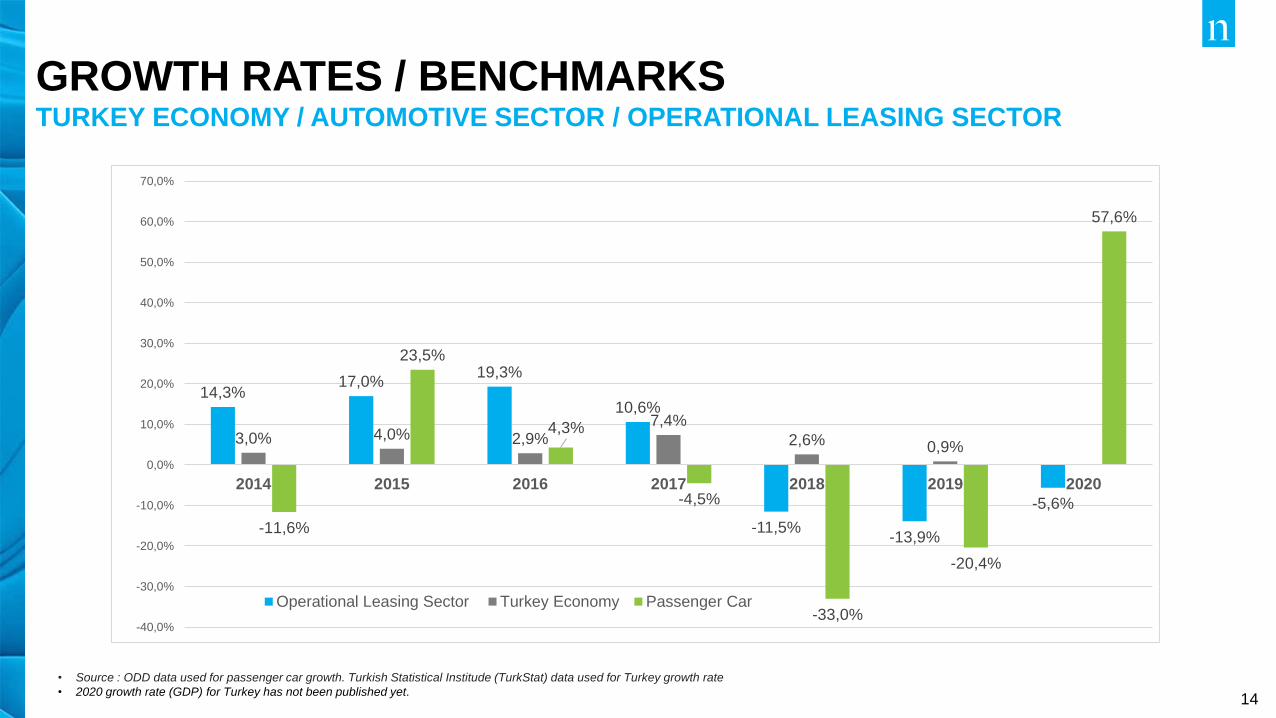
GROWTH RATES / BENCHMARKSTURKEY ECONOMY / AUTOMOTIVE SECTOR / OPERATIONAL LEASING SECTOR
• Source : ODD data used for passenger car growth. Turkish Statistical Institude (TurkStat) data used for Turkey growth rate
• 2020 growth rate (GDP) for Turkey has not been published yet.
14,3%17,0%
19,3%
10,6%
-11,5%-13,9%
-5,6%
3,0% 4,0% 2,9%7,4%
2,6% 0,9%
-11,6%
23,5%
4,3%
-4,5%
-33,0%
-20,4%
57,6%
-40,0%
-30,0%
-20,0%
-10,0%
0,0%
10,0%
20,0%
30,0%
40,0%
50,0%
60,0%
70,0%
2014 2015 2016 2017 2018 2019 2020
Operational Leasing Sector Turkey Economy Passenger Car

15
4- VEHICLE PARK

16
MAKE BASED DISTRIBUTION2020 END YEAR
24,4%
15,2%
11,7% 11,6%
4,6% 4,6% 4,4% 4,3%3,2% 3,0% 2,7%
10,3%
0,0%
5,0%
10,0%
15,0%
20,0%
25,0%
30,0%
RENAULT FIAT FORD VW PEUGEOT SKODA TOYOTA AUDI OPEL HYUNDAI BMW OTHER

17
VEHICLE SEGMENTS2020 END YEAR
50,8%
26,7%
12,9%
5,3% 4,3%
0%
10%
20%
30%
40%
50%
60%
C B D E-F (SUV) LCV

18
FUEL TYPE2020 END YEAR
86,4%
11,4%
2,2%
39,5%
52,4%
8,1%
0,0%
10,0%
20,0%
30,0%
40,0%
50,0%
60,0%
70,0%
80,0%
90,0%
100,0%
DIESEL BENZINE OTHER
Operational Leasing Sector
Automotive Sector
19
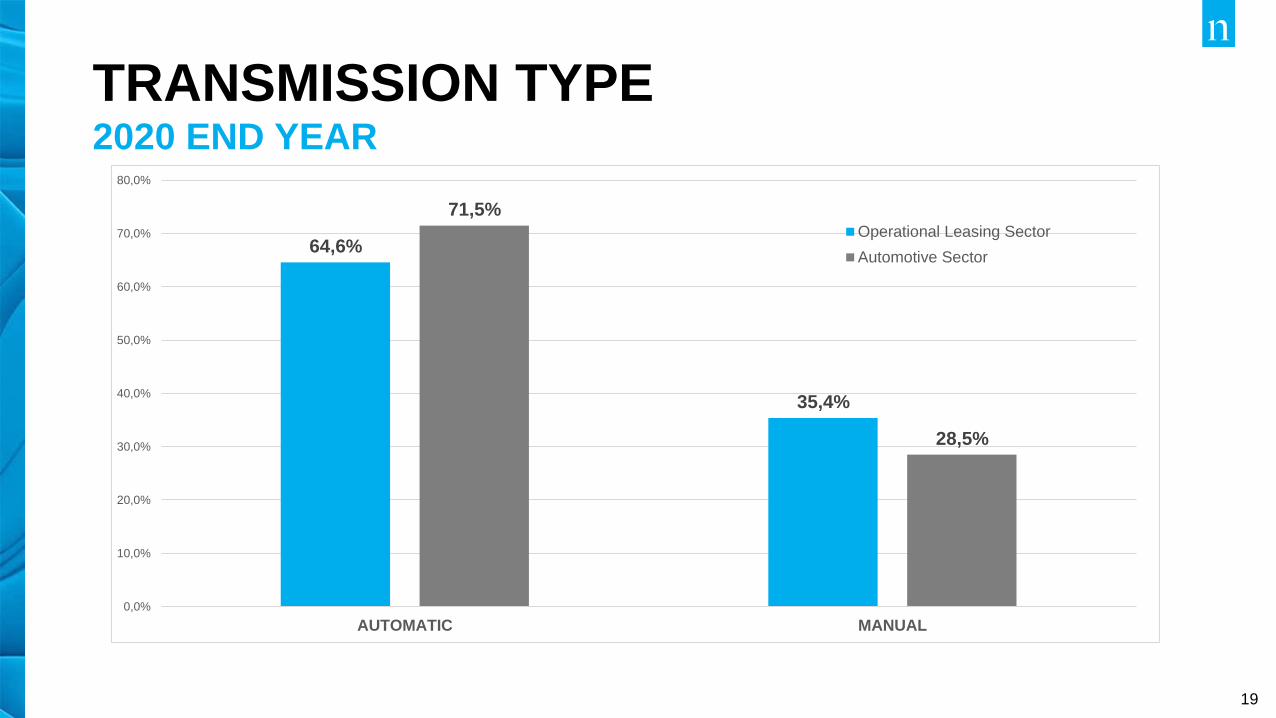
TRANSMISSION TYPE2020 END YEAR
64,6%
35,4%
71,5%
28,5%
0,0%
10,0%
20,0%
30,0%
40,0%
50,0%
60,0%
70,0%
80,0%
AUTOMATIC MANUAL
Operational Leasing Sector
Automotive Sector

20
5- CONTRACT STRUCTURE
21
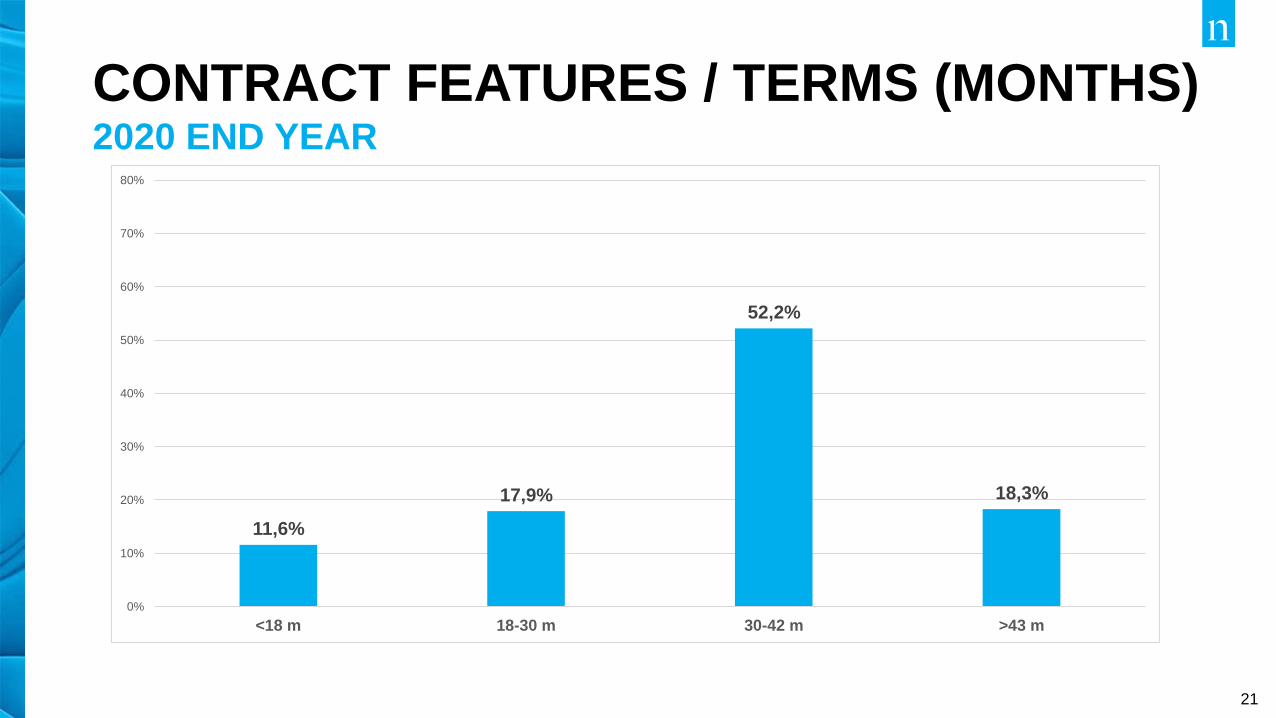
CONTRACT FEATURES / TERMS (MONTHS)2020 END YEAR
11,6%
17,9%
52,2%
18,3%
0%
10%
20%
30%
40%
50%
60%
70%
80%
<18 m 18-30 m 30-42 m >43 m
22
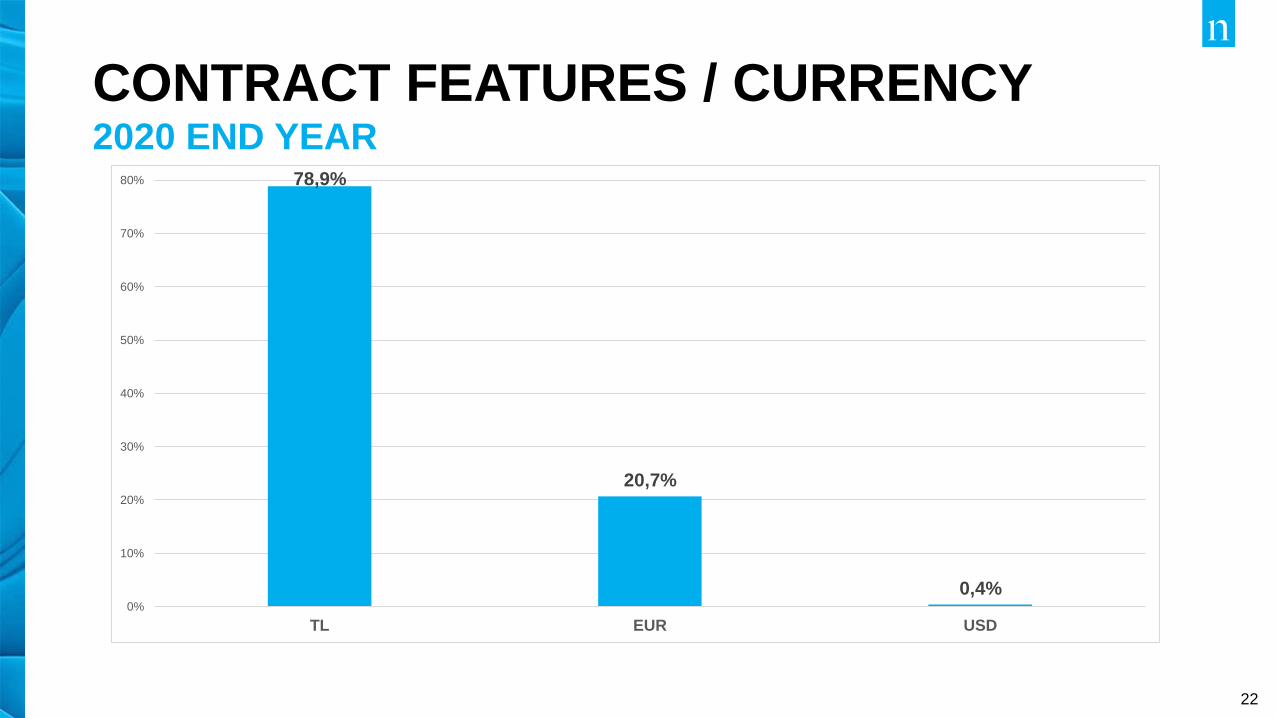
CONTRACT FEATURES / CURRENCY2020 END YEAR
78,9%
20,7%
0,4%0%
10%
20%
30%
40%
50%
60%
70%
80%
TL EUR USD

23
6- VEHICLE INVESTMENTS,
PURCHASES,
SALES AND PAID TAXES
24
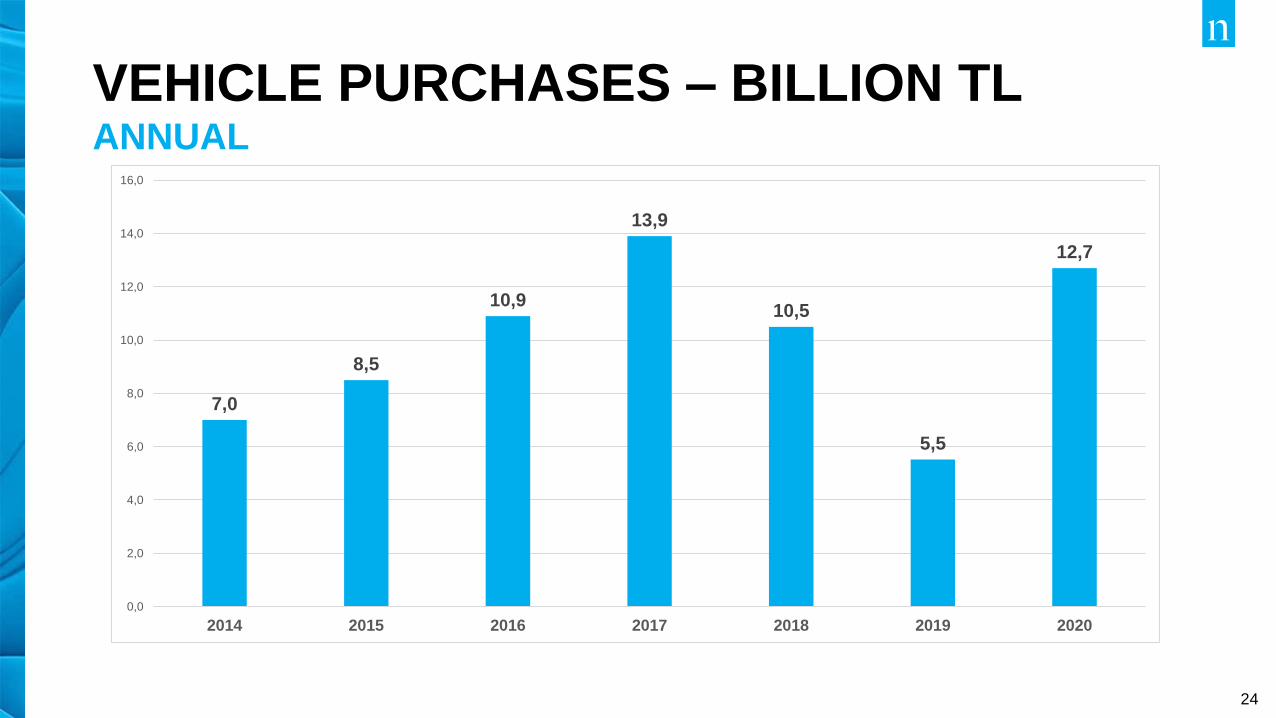
VEHICLE PURCHASES – BILLION TLANNUAL
7,0
8,5
10,9
13,9
10,5
5,5
12,7
0,0
2,0
4,0
6,0
8,0
10,0
12,0
14,0
16,0
2014 2015 2016 2017 2018 2019 2020
25
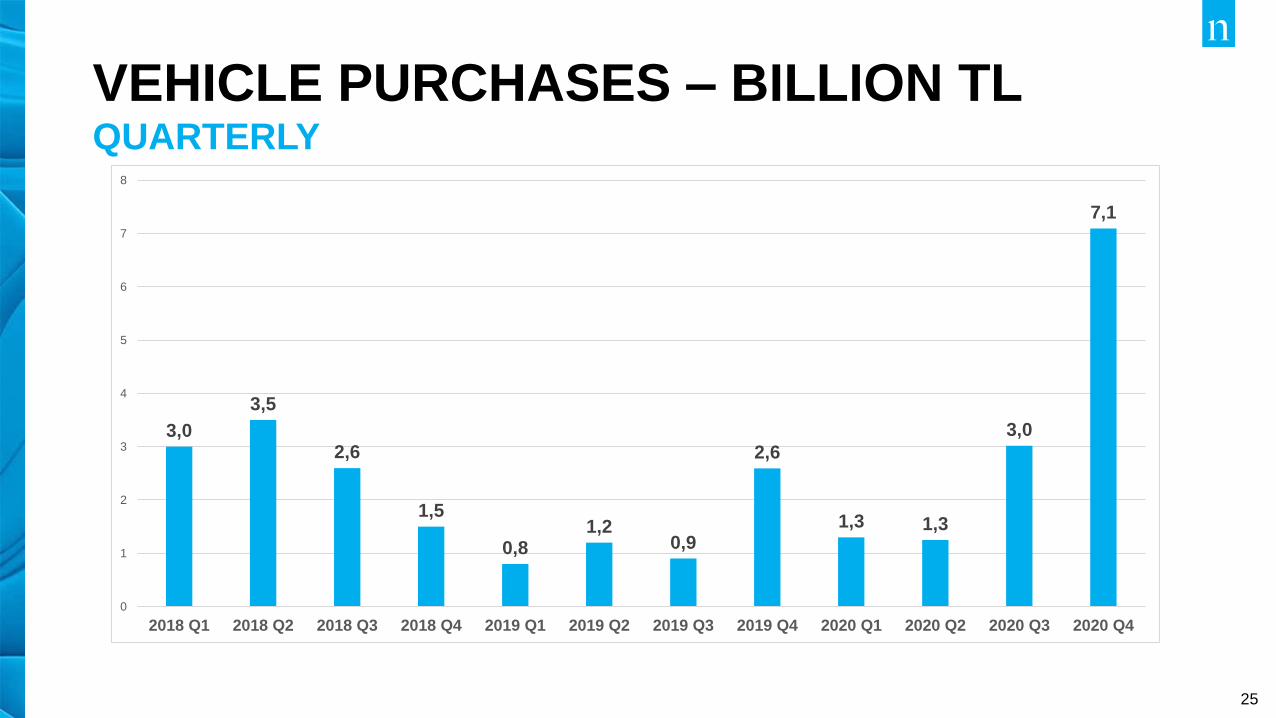
VEHICLE PURCHASES – BILLION TLQUARTERLY
3,0
3,5
2,6
1,5
0,81,2
0,9
2,6
1,3 1,3
3,0
7,1
0
1
2
3
4
5
6
7
8
2018 Q1 2018 Q2 2018 Q3 2018 Q4 2019 Q1 2019 Q2 2019 Q3 2019 Q4 2020 Q1 2020 Q2 2020 Q3 2020 Q4

26
NUMBER OF PURCHASED VEHICLES (000)ANNUAL
103
123
147 148
89
44
58
0
20
40
60
80
100
120
140
160
180
2014 2015 2016 2017 2018 2019 2020
27
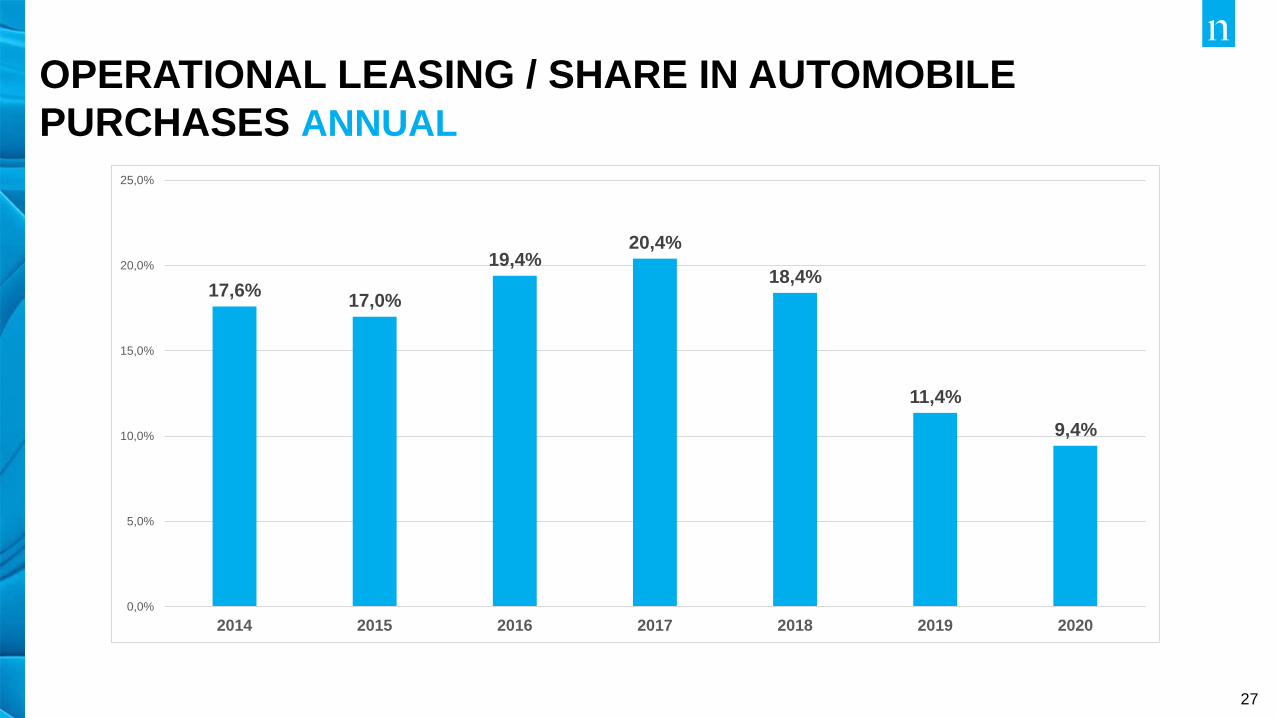
OPERATIONAL LEASING / SHARE IN AUTOMOBILE
PURCHASES ANNUAL
17,6%17,0%
19,4%20,4%
18,4%
11,4%
9,4%
0,0%
5,0%
10,0%
15,0%
20,0%
25,0%
2014 2015 2016 2017 2018 2019 2020
28
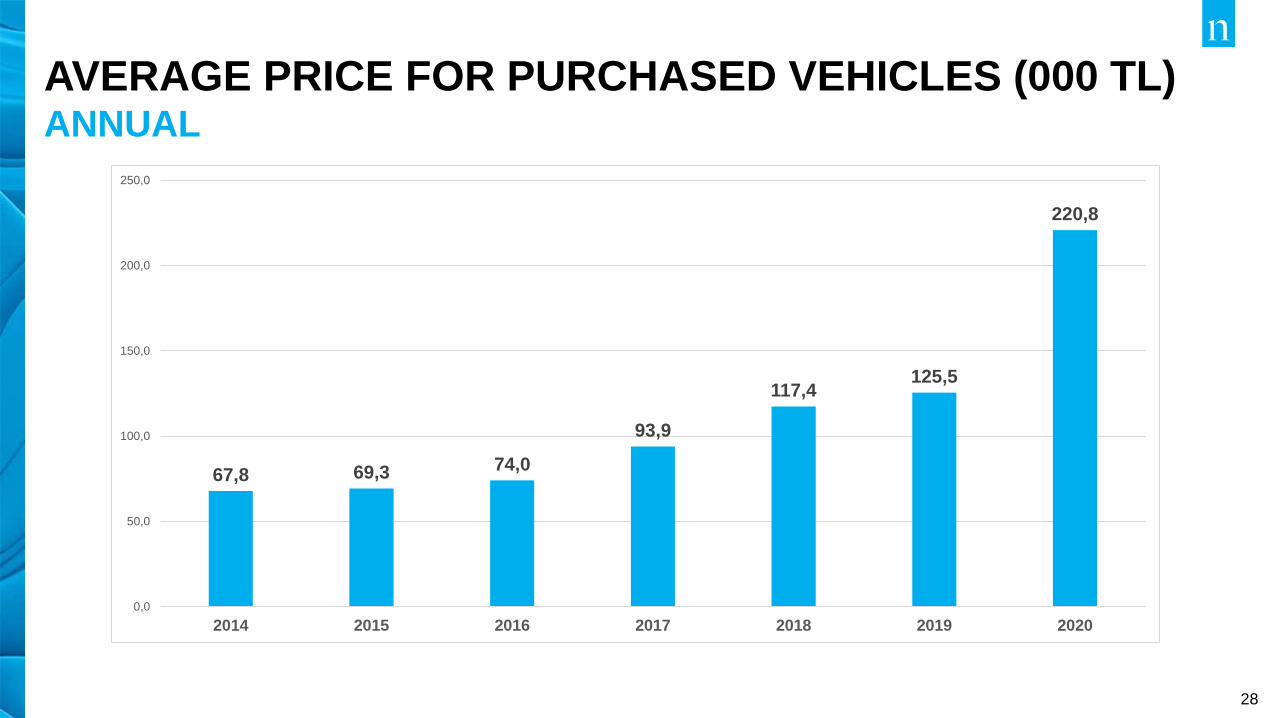
AVERAGE PRICE FOR PURCHASED VEHICLES (000 TL)ANNUAL
67,8 69,3 74,0
93,9
117,4125,5
220,8
0,0
50,0
100,0
150,0
200,0
250,0
2014 2015 2016 2017 2018 2019 2020

29
ESTIMATED # OF VEHICLES SOLD FOR THE SECTOR (000)ANNUAL
74,0
83,0
94,0
112,0
131,0
89,1
73,3
0,0
20,0
40,0
60,0
80,0
100,0
120,0
140,0
160,0
2014 2015 2016 2017 2018 2019 2020
30
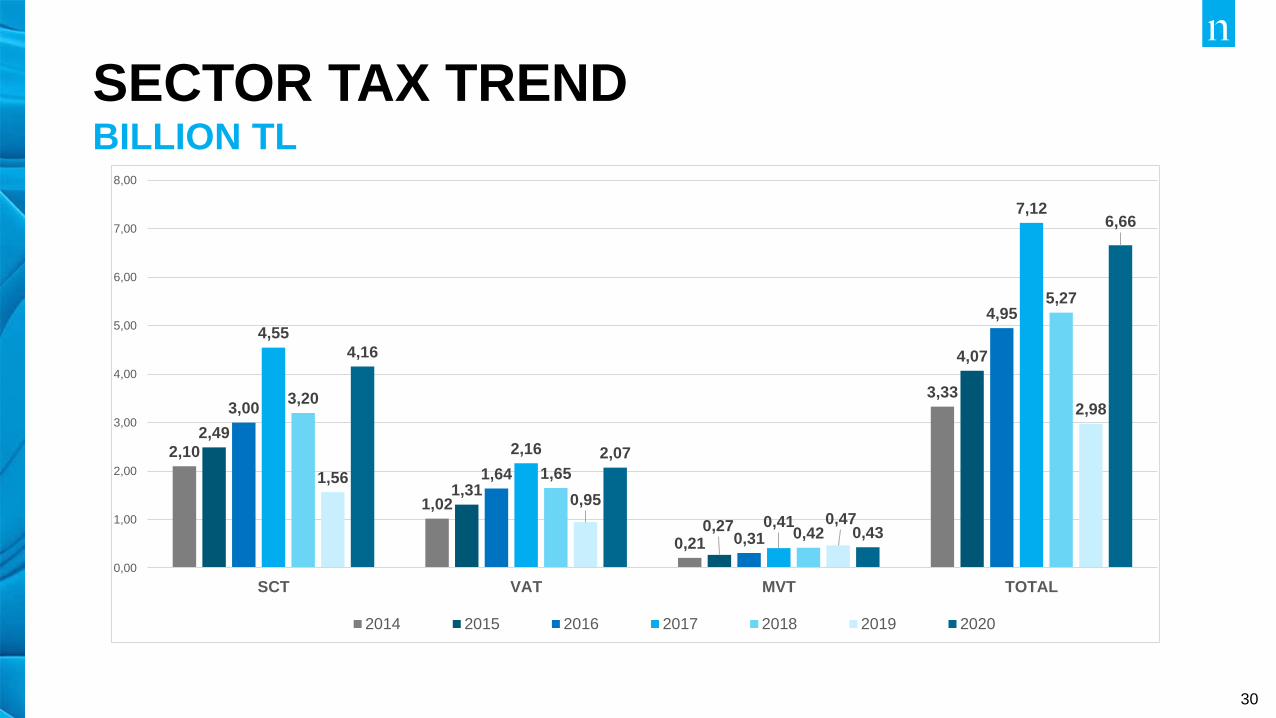
SECTOR TAX TRENDBILLION TL
2,10
1,02
0,21
3,33
2,49
1,31
0,27
4,07
3,00
1,64
0,31
4,95
4,55
2,16
0,41
7,12
3,20
1,65
0,42
5,27
1,56
0,95
0,47
2,98
4,16
2,07
0,43
6,66
0,00
1,00
2,00
3,00
4,00
5,00
6,00
7,00
8,00
SCT VAT MVT TOTAL
2014 2015 2016 2017 2018 2019 2020

31
7- NUMBER OF
CUSTOMERS

32
TOTAL NUMBER OF SECTOR’S CUSTOMERS (000)ANNUAL
33,1
42,6
56,7
64,2
56,0
40,5
35,9
0,0
10,0
20,0
30,0
40,0
50,0
60,0
70,0
80,0
2014 2015 2016 2017 2018 2019 2020
33
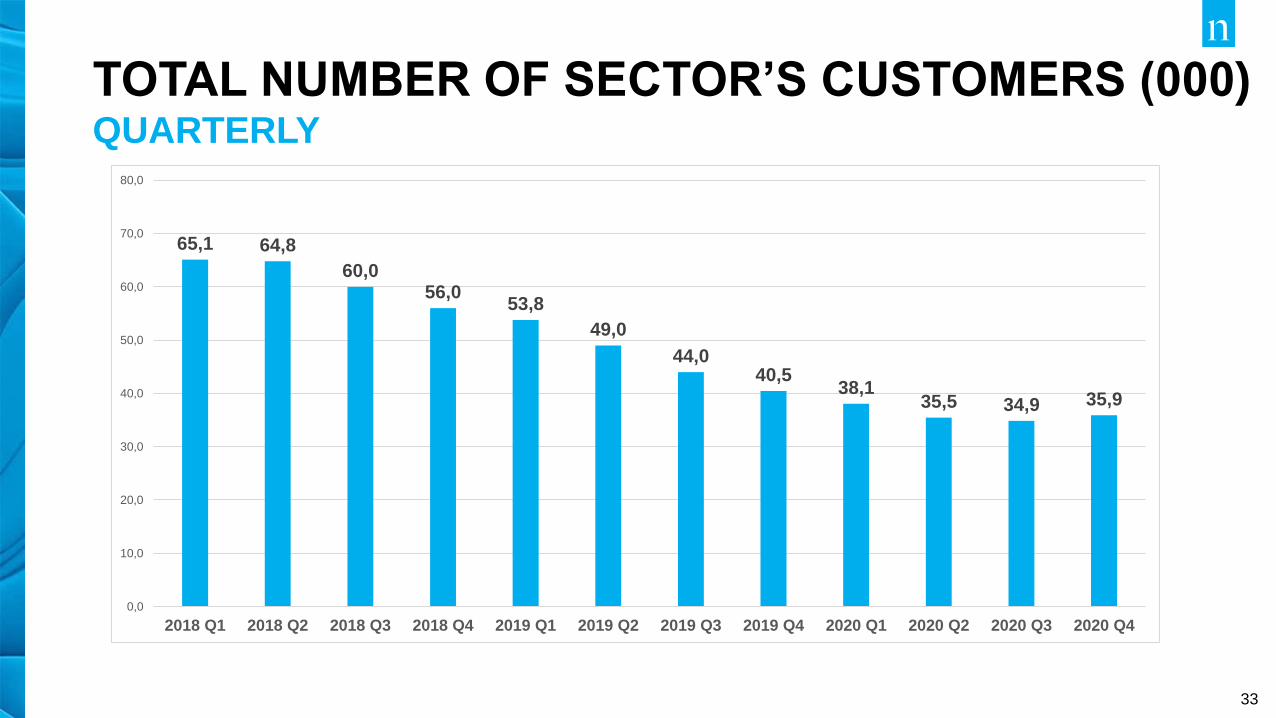
TOTAL NUMBER OF SECTOR’S CUSTOMERS (000)QUARTERLY
65,1 64,8
60,056,0
53,8
49,0
44,040,5
38,135,5 34,9 35,9
0,0
10,0
20,0
30,0
40,0
50,0
60,0
70,0
80,0
2018 Q1 2018 Q2 2018 Q3 2018 Q4 2019 Q1 2019 Q2 2019 Q3 2019 Q4 2020 Q1 2020 Q2 2020 Q3 2020 Q4

34
COMPARISON OF THE CUSTOMER NUMBER GROWTH
• 2020 growth rate (GDP) for Turkey has not been published yet.
14,3%
3,0%
-11,6%
26,5%
17,0%
4,0%
23,5%
28,7%
19,3%
2,9% 4,3%
33,0%
10,6%7,4%
-4,5%
13,2%
-11,5%
2,6%
-33,0%
-12,7%-13,9%
0,9%
-20,4%
-27,8%
-5,6%
57,6%
-11,2%
-40,0%
-30,0%
-20,0%
-10,0%
0,0%
10,0%
20,0%
30,0%
40,0%
50,0%
60,0%
70,0%
Opeational Leasing Sector Turkey Economy Passenger Car # of Customers
2014 2015 2016 2017 2018 2019 2020
35
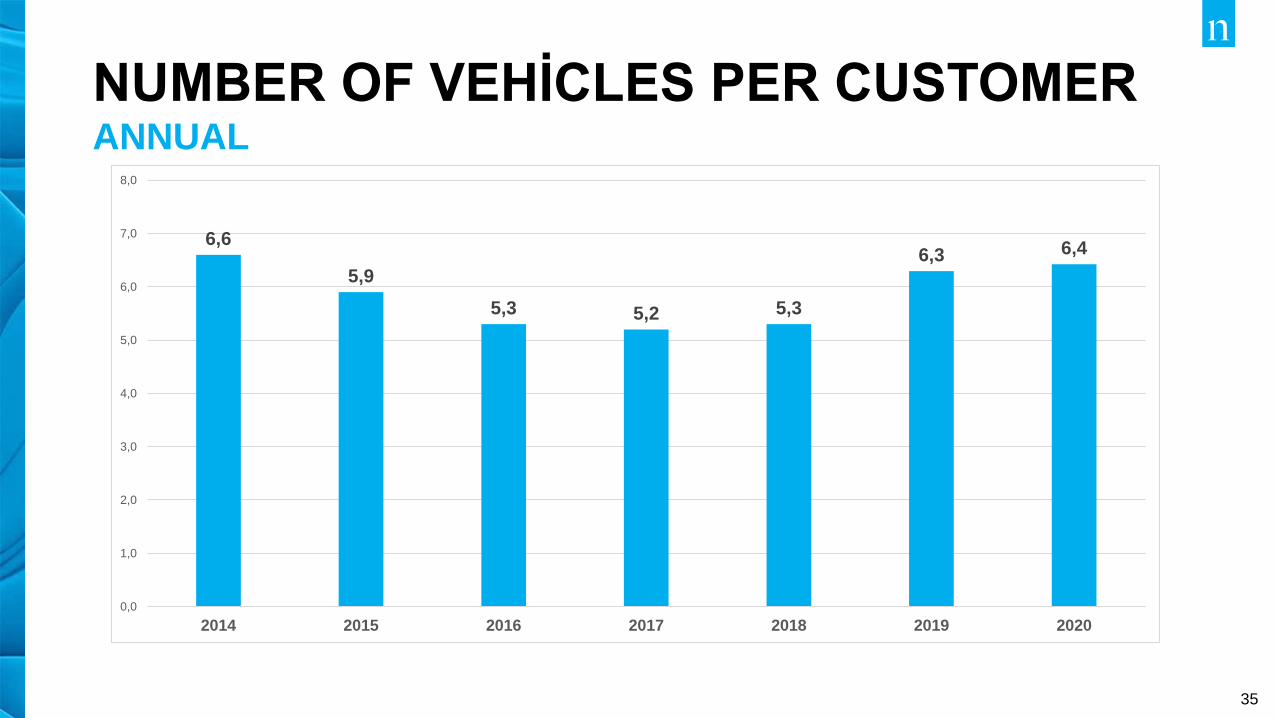
NUMBER OF VEHİCLES PER CUSTOMERANNUAL
6,6
5,9
5,3 5,2 5,3
6,3 6,4
0,0
1,0
2,0
3,0
4,0
5,0
6,0
7,0
8,0
2014 2015 2016 2017 2018 2019 2020