operational leasing sector report -...
TRANSCRIPT

©TNS 2017
TOKKDEROperational Leasing Sector Report
End Year 2017
TOKKDER Operational Leasing Sector Report

©TNS 2017
Index
1Aim and Scope 03
2Methodology and Participating Companies
06
3Summary 10
4Vehicle Park and Its Features 15
5Contract Structure 20
6Vehicle Investments, Vehicle Purchases, Vehicle Sales and Paid Taxes
23
7Number of Customers 31
TOKKDER Operational Leasing Sector Report

©TNS 2017
Aim and Scope
1
3
TOKKDER Operational Leasing Sector Report

©TNS 2017
Market Information
4
TOKKDER was founded in Istanbul in 1996 to integrete rent a car and car leasing
companies under the same roof.
Vision
To be the only protector and the reference of the operational leasing and rent a
car industries acting in perfect harmony with the laws and state policies, with
high level of professionalism and ethical values, in order to provide better
services to customers.
About TOKKDER
TOKKDER Operational Leasing Sector Report
123 Members,
Rent a Car and Operational Leasing Sectors,
Member structure that covers 82% of sector,
Member of Leaseurope,
(Leaseeurope which has 46 members in 33 countries is known with its effects on EU regulations)

©TNS 2017
Aim
5
TOKKDER Operational Leasing Sector Report
Vehicle park of the sector
Make based,
Segment based,
Fuel type based,
Transmission type based,
Total number of customers
Within the period;
Number of sold and purchased vehicles,
Amount of vehicle purchases,
Amount of the paid taxes (SCT, VAT, MVT)
Number of contracts
Term based,
Currency based,
To draw the overall picture Operational Leasing Sector,
To identify the potential and trends of the sector,
To inform customers, automotive and finance sectors, members and public about the sector trends.
Aim and Scope of the Research
Scope
©TNS 2017
Methodology and Participating Companies
2
6
TOKKDER Operational Leasing Sector Report

©TNS 2017
Methodology
7
The questionnaire which is prepared under the scope of the research and
approved by the Competition Agency, was delivered to TNS in the digital
environment by each company.
Total sector parameters are calculated by projecting the total vehicle purchase
volume of the participating companies to the total sales figures to operational
leasing sector which are estimated by using ODD reports and TOKKDER
predictions. Hence, the sector representation ratio of the participating companies
are as follows:
Year 2013 %68,21
Year 2014 %66,29
Year 2015 %67,46
Year 2016 %76,90
Year 2017 %78,23
TOKKDER Operational Leasing Sector Report

©TNS 2017
Participating Companies
8
ALD AUTOMOTIVE
ARKAS OTO FİLO YÖNETİMİ
ATAKO DESTEK ARAÇ KİRALAMA
AUTOLAND OTOMOTİV
CENTRAL FLEET SERVICES
TEB ARVAL
BORUSAN OTOMOTİV PREMIUM KİRALAMA*
OTOPLAN OPERASYONEL TAŞIT KİRALAMA*
BORLEASE OTOMOTİV A.Ş.
DRD FİLO KİRALAMA
FLEETCORP
GARANTİ FİLO
HEDEF FİLO
LEASEPLAN
OTOKOÇ OTOMOTİV
TAN OTO MOTORLU ARAÇLAR
ÇELİK MOTOR TİCARET AŞ
LİDER FİLO
DENİZFİLO
*Borusan Otomotiv Premium Kiralama, has been participating the research since Q3 2013.*Otoplan Operasyonel Taşıt Kiralama, has been participating the research since Q2 2015.*Beyaz Filo, has not participated the research since Q2 2014*Çelik Motor Ticaret AŞ, has been participating the research since Q1 2016.*Lider Filo, has been participating the research since Q2 2016.*Borlease, has been participating the research since Q4 2016.*DenizFilo, has been participating the research since Q1 2017.

©TNS 2017 9
10
22
5
0
2
4
6
8
10
12
<1000010000-1500015001-2000020001-25000>25000
Participating CompaniesDistribution according to the size of companies / 2017 End Year
TOKKDER Operational Leasing Sector Report

©TNS 2017
Summary
3
10
TOKKDER Operational Leasing Sector Report

©TNS 2017
Participants and Sector Estimates Summary/ 2017 End Year
11
TOKKDER Operational Leasing Sector Report
Number of Vehicles
Number of PurchasedVehicles
Number of Sold Vehicles(2nd Hand)
Number of Customers
Amount of PurchasedVehicles (TL)
Amount of The Paid Taxes(TL)
VAT+ MVT+ SCT
Participants Sector Estimates
Sum of Actives (TL)
285.784
115.465
87.977
50.145
10.836.833.853
365.782
147.589
112.428
64.181
13.854.393.384
7.117.523.8265.567.004.165
22.758.622.625 29.129.323.199

©TNS 2017 12
Estimated Growth of Vehicle Park of the Sector– Year Based
TOKKDER Operational Leasing Sector Report
%14,3
%18,3
%19,7
105.000117.500
142.000
170.000
207.000
236.900
277.200
330.600
365.782
0
50000
100000
150000
200000
250000
300000
350000
400000
2009 2010 2011 2012 2013 2014 2015 2016 2017
%11,9
%20,9
%19,7
%21,9
%14,3%17,0
%19,3
%10,6

©TNS 2017 13
Estimated Growth of Vehicle Park of the Sector –Quarter Based
TOKKDER Operational Leasing Sector Report
276.400293.800
306.400330.600 327.300
337.500 346.600365.782
0
50000
100000
150000
200000
250000
300000
350000
400000
2016
1.Quarter
2016
2.Quarter
2016
3.Quarter
2016
4.Quarter
2017
1.Quarter
2017
2.Quarter
2017
3.Quarter
2017
4.Quarter
%6,3 %4,3%7,9
%-1,0 %3,1%2,7
%5,5
©TNS 2017 14
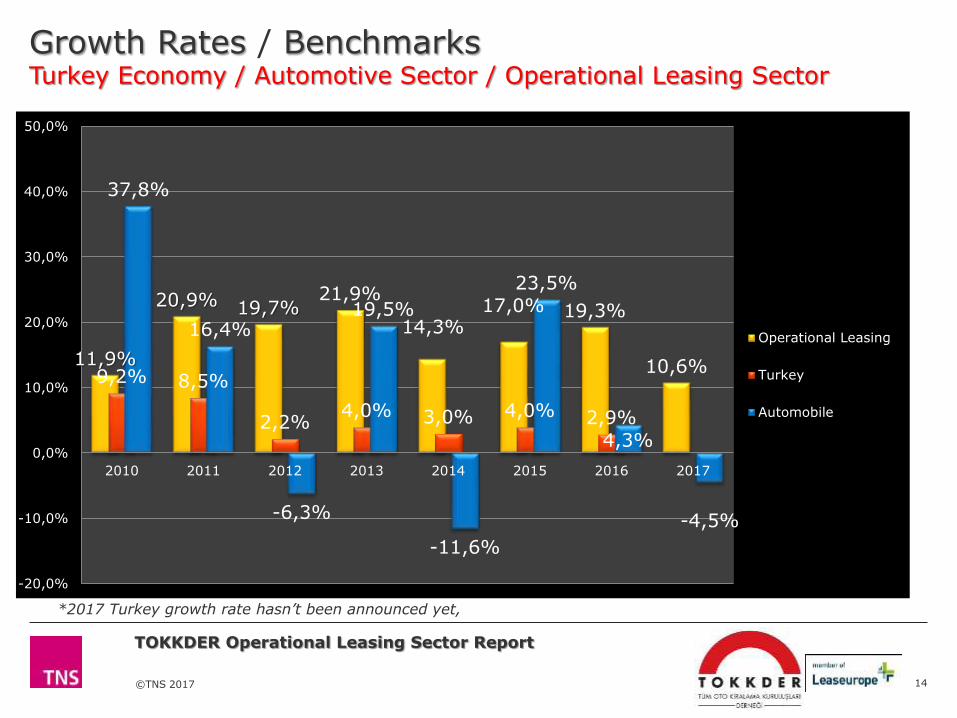
11,9%
20,9% 19,7%21,9%
14,3%17,0% 19,3%
10,6%9,2% 8,5%
2,2%4,0% 3,0% 4,0% 2,9%
37,8%
16,4%
-6,3%
19,5%
-11,6%
23,5%
4,3%
-4,5%
-20,0%
-10,0%
0,0%
10,0%
20,0%
30,0%
40,0%
50,0%
2010 2011 2012 2013 2014 2015 2016 2017
Operational Leasing
Turkey
Automobile
*2017 Turkey growth rate hasn’t been announced yet,
TOKKDER Operational Leasing Sector Report
Growth Rates / BenchmarksTurkey Economy / Automotive Sector / Operational Leasing Sector

©TNS 2017
Vehicle Park and Its Features
4
15
TOKKDER Operational Leasing Sector Report

©TNS 2017 16
TOKKDER Operational Leasing Sector Report
Vehicle Park of Sector / Make Based Distribution2017 End Year
28,5%
14,2%
10,4% 10,0%
4,2% 4,1% 3,3% 3,3%
22,0%
0%
5%
10%
15%
20%
25%
30%
RENAULT VW FIAT FORD AUDI OPEL SKODA CITROEN OTHER

©TNS 2017 17
TOKKDER Operational Leasing Sector Report
Vehicle Features of Sector / Vehicle Segments2017 End Year
51,4%
27,0%
13,4%
5,1% 3,1%0%
10%
20%
30%
40%
50%
60%
C B D E-F (SUV) LCV

©TNS 2017 18
TOKKDER Operational Leasing Sector Report
Vehicle Features of Sector / Fuel Type2017 End Year
94,5%
5,4% 0,1%0%
10%
20%
30%
40%
50%
60%
70%
80%
90%
100%
DIESEL BENZINE OTHER
61,0%
39,0%
0%
10%
20%
30%
40%
50%
60%
70%
DIESEL BENZINE+OTHER
Automobile Market

©TNS 2017 19
TOKKDER Operational Leasing Sector Report
Vehicle Features of Sector / Transmission Type2017 End Year
51,9%
48,1%
0%
10%
20%
30%
40%
50%
60%
70%
80%
90%
MANUAL AUTOMATIC
39,5%
60,5%
0%
10%
20%
30%
40%
50%
60%
70%
80%
90%
MANUAL AUTOMATIC
Automobile Market

©TNS 2017
Contract Structure
5
20
TOKKDER Operational Leasing Sector Report

©TNS 2017 21
TOKKDER Operational Leasing Sector Report
Contract Features of Sector / Term Based2017 End Year
5,3%
26,1%
59,0%
9,7%
0%
10%
20%
30%
40%
50%
60%
70%
<18 Months 18-30 Months 30-42 Months >43 Months

©TNS 2017 22
TOKKDER Operational Leasing Sector Report
Contract Features of Sector / Currency Based2017 End Year
79,0%
1,9%
19,1%
0%
10%
20%
30%
40%
50%
60%
70%
80%
90%
EUR USD TL

©TNS 2017
Vehicle Investments, Vehicle Purchases, Vehicle Sales and Paid Taxes
6
23
TOKKDER Operational Leasing Sector Report

©TNS 2017 24
TOKKDER Operational Leasing Sector Report
Sector Growth – Year Based
1.8022.390
3.049
5.015
7.012
8.526
10.885
13.854
0
2000
4000
6000
8000
10000
12000
14000
16000
2010 2011 2012 2013 2014 2015 2016 2017
Total Amount of Vehicle Purchases/ Million TL

©TNS 2017 25
TOKKDER Operational Leasing Sector Report
Sector Growth – Quarter Based
1.703
3.116
2.181
3.886
2.210
2.8763.332
5.436
0
1000
2000
3000
4000
5000
6000
2016
1.Quarter
2016
2.Quarter
2016
3.Quarter
2016
4.Quarter
2017
1.Quarter
2017
2.Quarter
2017
3.Quarter
2017
4.Quarter
Amount of Vehicle Purchases/ Million TL

©TNS 2017
53.54159.986
67.728
89.941
103.444
123.073
147.065147.589
0
20000
40000
60000
80000
100000
120000
140000
160000
2010 2011 2012 2013 2014 2015 2016 2017
Number of Purchased Vehicles
26
TOKKDER Operational Leasing Sector Report
Sector Growth – Year Based

©TNS 2017 27
TOKKDER Operational Leasing Sector Report
Operational Leasing / Share in Automobile Purchases
10,5% 10,1%
12,2%13,5%
17,6% 17,0%
19,4%20,4%
0%
5%
10%
15%
20%
25%
2010 2011 2012 2013 2014 2015 2016 2017

©TNS 2017 28
TOKKDER Operational Leasing Sector Report
Average Per Unit Vehicle Purchase Amount of The Sector / TL
33.66139.839
45.016
55.754
67.789 69.27774.018
93.871
0
10.000
20.000
30.000
40.000
50.000
60.000
70.000
80.000
90.000
100.000
2010 2011 2012 2013 2014 2015 2016 2017

©TNS 2017 29
TOKKDER Operational Leasing Sector Report
Estimated Total Vehicle Sales Volume of The Sector–Year Based
41.330 39.76742.990
55.050
73.735
82.777
93.669
112.428
0
20.000
40.000
60.000
80.000
100.000
120.000
2010 2011 2012 2013 2014 2015 2016 2017

©TNS 2017
Sector Tax Trend
30
290.235433.926
676.936
1.462.569
2.100.833
2.493.238
2.997.890
4.548.719
0
500.000
1.000.000
1.500.000
2.000.000
2.500.000
3.000.000
3.500.000
4.000.000
4.500.000
5.000.000
2010 2011 2012 2013 2014 2015 2016 2017
69.50890.829
134.846
205.024
209.731
265.576
310.749
411.470
0
50.000
100.000
150.000
200.000
250.000
300.000
350.000
400.000
450.000
2010 2011 2012 2013 2014 2015 2016 2017
593.557852.604
1.278.969
2.443.171
3.334.365
4.069.752
4.950.631
7.117.524
0
1.000.000
2.000.000
3.000.000
4.000.000
5.000.000
6.000.000
7.000.000
8.000.000
2010 2011 2012 2013 2014 2015 2016 2017
233.814327.849
467.186775.578
1.023.801
1.310.938
1.641.993
2.157.334
0
500.000
1.000.000
1.500.000
2.000.000
2.500.000
2010 2011 2012 2013 2014 2015 2016 2017
TOKKDER Operational Leasing Sector Report
SCT (THOUSAND TL) VAT (THOUSAND TL)
TOTAL TAX (THOUSAND TL)MVT (THOUSAND TL)

©TNS 2017
Number of Customers
7
31
TOKKDER Operational Leasing Sector Report

©TNS 2017 32
TOKKDER Operational Leasing Sector Report
9.67511.990
17.285
26.189
33.116
42.634
56.701
64.181
0
10.000
20.000
30.000
40.000
50.000
60.000
70.000
2010 2011 2012 2013 2014 2015 2016 2017
Total Number of Sector’s Customers – Year Based

©TNS 2017
44.78248.147
52.862
56.70158.476 59.828
62.847 64.181
0
10.000
20.000
30.000
40.000
50.000
60.000
70.000
20161.Quarter
20162.Quarter
20163.Quarter
20164.Quarter
20171.Quarter
20172.Quarter
20173.Quarter
20174.Quarter
33
TOKKDER Operational Leasing Sector Report
Total Number of Sector’s Customers – Quarter Based
©TNS 2017 34
TOKKDER Operational Leasing Sector Report
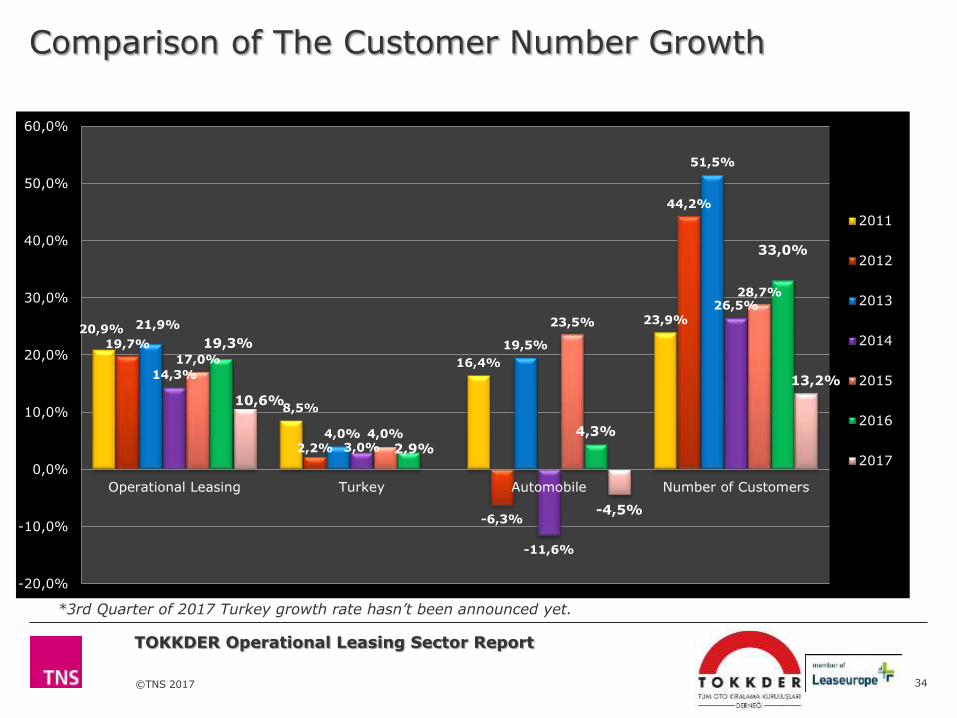
Comparison of The Customer Number Growth
*3rd Quarter of 2017 Turkey growth rate hasn’t been announced yet.
20,9%
8,5%
16,4%
23,9%
19,7%
2,2%
-6,3%
44,2%
21,9%
4,0%
19,5%
51,5%
14,3%
3,0%
-11,6%
26,5%
17,0%
4,0%
23,5%
28,7%
19,3%
2,9%
4,3%
33,0%
10,6%
-4,5%
13,2%
-20,0%
-10,0%
0,0%
10,0%
20,0%
30,0%
40,0%
50,0%
60,0%
Operational Leasing Turkey Automobile Number of Customers
2011
2012
2013
2014
2015
2016
2017

©TNS 2017 35
TOKKDER Operational Leasing Sector Report
Sector – Number of Vehicles per Customer
11,110,7
9,3
7,36,6
5,95,3 5,2
0
2
4
6
8
10
12
2010 2011 2012 2013 2014 2015 2016 2017