together, we prepare our students for their future
TRANSCRIPT
Together, we prepare our students for their future.
February 8, 2016 Fredericksburg, VA
www.spotsylvania.k12.va.us

EXECUTIVE SUMMARY Organizational Information
SCPS FY2017 School Board Approved Budget Page 1
Executive Summary Table of Contents
Executive Summary Section Table of Contents ......................................................................................... 1 Organizational Information Highlights Letter from School Board Chair .............................................................................................................. 2 Acknowledgements ................................................................................................................................. 3 School Board ........................................................................................................................................... 4 Budget Awards ........................................................................................................................................ 5 FY 2017 School Board Approved Budget Layout ................................................................................... 7 Strategic Management Components ...................................................................................................... 8 FY 2017 Management Structure ........................................................................................................... 11 FY 2017 Organizational Chart .............................................................................................................. 11 Budget Process and Timeline ............................................................................................................... 12 Budget Calendar ................................................................................................................................... 13 Executive Summary .............................................................................................................................. 14 Significant Process, Policy, & Practice Changes .................................................................................. 15 Financial Policies and Practices ........................................................................................................... 20 Financial Information Revenue Highlights ............................................................................................................................... 22 Budget Oveview by Revenue Source – All Funds ................................................................................ 23 Major Budget Changes in Expenditures for All Funds .......................................................................... 24 Combined Fund Statements ................................................................................................................. 25 Expenditure Highlights .......................................................................................................................... 35 FY 2017 Expenditure Summary by Object for All Funds ...................................................................... 67 Allocation of Positions ........................................................................................................................... 71 Retiree Health Insurance ...................................................................................................................... 74 Supplemental Information Cost Per Pupil ....................................................................................................................................... 75 Student Enrollment Trends and Forecast ............................................................................................. 76 Student Demographics.......................................................................................................................... 77 Spotsylvania County Demographics ..................................................................................................... 78 Three-Year Budget Forecast ................................................................................................................ 79 Division-Wide Accomplishments (To be included in the Adopted Book) Local Tax Base & Trend Information (To be included in the Adopted Book)

EXECUTIVE SUMMARY Organizational Information
SCPS FY2017 School Board Approved Budget Page 2

EXECUTIVE SUMMARY Organizational Information
SCPS FY2017 School Board Approved Budget Page 3
Acknowledgements
The Finance Department staff extends its thanks and appreciation to the staff, parents, and citizens who contributed to the production of the FY 2017 School Board Approved Budget. This process takes an extensive amount of time and effort. Your hard work and cooperation allows us to present an informative budget developed through a transparent and collaborative process.
Budget Team
LaShahn Gaines, CPA, CPM Chief Financial Officer
Marcia Stevens, CPA Director of Budget and Payroll
Barbara Stombock Director of Finance
Bridgette Smith-Hurd Senior Financial Analyst
Leah Underwood Program Analyst
Melissa Webster Administrative Assistant
Doreen Flint Accounting Technician

EXECUTIVE SUMMARY Organizational Information
SCPS FY2017 School Board Approved Budget Page 4
School Board
Spotsylvania County Public Schools (SCPS) is governed by seven elected School Board members. Members are elected on staggered four-year terms and one member represents each of the county’s seven districts. Board members elect a Chair and Vice Chair at the organizational meeting at the beginning of every calendar year. The School Board is charged by Virginia Law and the regulations of the Virginia Board of Education to establish policies, guidelines, and rules that will ensure the proper administration of the school division. In addition, all board members subscribe to and sign a Code of Ethics.
Back Row from left to right: Mr. William M. Blaine, Jr., Salem District; Dr. James Meyer, Courtland District; Chair; Mr. Baron Braswell, Battlefield District; Mr. Kurt Twigg, Livingston District; Front Row from left to right: ; Ms. Dawn Shelley, Chancellor District; Mrs. Amanda Blalock, Lee Hill District; Vice Chair, Ms. Erin K. Grampp, Berkeley District
FY 2017 Senior Executive Staff Dr. S. Scott Baker, Superintendent Mrs. LaShahn Gaines, Chief Financial Officer Mrs. Carol Flenard, Assistant Superintendent of Instruction Mrs. Michelle Colbert, Executive Director of Human Resources Mr. Keith Wolfe, Executive Director of Secondary Education and Leadership Mr. Don Upperco, Executive Director of Operations Ms. Tedra Richardson, Executive Director of Student Support Services Dr. Dennis Martin, Director of Administrative Services Mrs. René Daniels, Director of Communications and Community Engagement

EXECUTIVE SUMMARY Organizational Information
SCPS FY2017 School Board Approved Budget Page 5
Budget Awards
Government Finance Officers Association Award The Government Finance Officers Association of the United States and Canada (GFOA) presented a Distinguished Budget Presentation Award to Spotsylvania County Public Schools for its annual budget for the fiscal year beginning July, 1, 2015. In order to receive this award, a governmental unit must publish a budget document that meets program criteria as a policy document, as an operations guide, as a financial plan, and as a communications device. This award is valid for a period of one year only. We believe our current budget continues to conform to program requirements, and we are submitting it to GFOA to determine its eligibility for another award.

EXECUTIVE SUMMARY Organizational Information
SCPS FY2017 School Board Approved Budget Page 6
Association of School Business Officials International The Association of School Business Officials International (ASBO) presented a Meritorious Budget Award to Spotsylvania County Public Schools for its annual budget for the fiscal year beginning July, 1, 2015. In order to receive this award, a school division must publish a budget document that meets program criteria as a policy document, as an operations guide, as a financial plan, and as a communications device. This award is valid for a period of one year only. We believe our current budget continues to conform to program requirements, and we are submitting it to ASBO to determine its eligibility for another award.

EXECUTIVE SUMMARY Organizational Information
SCPS FY2017 School Board Approved Budget Page 7
Layout of the School Board’s Approved FY 2017 Budget Document
The format of the budget book continues to present the school division’s budget information in an organized and comprehensive document. This facilitates the reader’s knowledge of the school division’s budget development, management, and processes along with prior year budget information. The document’s format conforms to the standards set forth by the Association of School Business Officials Meritorious Budget Award Program and the Government Finance Officers Association’s Distinguished Budget Presentation Award Program. The document contains the four major sections listed and defined below: The Introductory Section contains a comprehensive summary of the three main sections (i.e., organizational, financial, and supplemental information). The Organizational Information Section includes the school division’s organizational and management structure, organization chart, strategic plan (vision, mission, core values, goal and strategies), budget development process, and significant policy/practice changes. The Financial Information Section includes summary and detailed budget data for all school division funds (to be included in the Adopted Book). This section is subdivided into the Commonwealth Governor’s School Fund, the Rappahannock Regional Detention Center Fund, the Food Service Fund, the Regional Adult Education Funds, the Operating Fund (which includes Debt Service), the Capital Project Fund, and the Fleet Service-Internal Service Fund. Included in the Debt Service data is summary and individual bond amortization schedules for all current indebtedness. The Capital Project Fund section includes a summary of the Capital Improvement Plan (CIP), which is the school division’s five-year long-range plan for capital projects. The Supplemental Information Section includes the following information of interest to school division employees and the community-at-large:
Cost Per Pupil
Student Enrollment Trends and Forecast
County and Student Demographics
Division Accomplishments (to be included in the Adopted Budget Book)
Local Tax Base and Trend Information (to be included in the Adopted Budget Book)

EXECUTIVE SUMMARY Strategic Management
SCPS FY2017 School Board Approved Budget Page 8
Strategic Management Components
In June 2013, the School Board approved the revised strategic plan for FY 2014 through FY 2019. The key components are as follows:
Together - we prepare our students for their future.
Spotsylvania County Public Schools is a leading school division that inspires and empowers all students to become creative thinkers, problem solvers, and effective communicators by:
Ensuring an engaging and supportive learning environment. Providing a broad spectrum of innovative opportunities. Building lasting partnerships with the community to educate our students.
STUDENT CENTERED We provide all students with the essential learning experiences that enable them to optimize their success with postsecondary experiences. LEADERSHIP We commit to building visionary leaders who embrace change and new possibilities . ACCOUNTABILITY We provide quality services to students, use resources efficiently, and engage the community as viable partners. CULTURAL PROFICIENCY We exhibit attitudes, skills, behaviors, and organizational practices that support the interests of a diverse population. EXCELLENCE We pursue the highest standards of organizational performance and academic achievement through innovative, research based practices. EFFECTIVE COMMUNICATION We support and utilize a variety of communication methods to connect parents, staff, and the entire community. TEAMWORK We depend upon and are accountable to one another to achieve our common purpose. CITIZENSHIP We believe in honor, integrity, and our responsibility to serve the community.
MISSION
VISION
CORE VALUE STATEMENTS

EXECUTIVE SUMMARY Strategic Management
SCPS FY2017 School Board Approved Budget Page 9
The strategic plan is comprised of three broad overarching goals to be achieved by the end of FY2019 (June 30, 2019): GOAL 1.0 TEACHING & LEARNING Prepare all students to be college and career ready. GOAL 2.0 COMMUNITY ENGAGEMENT & PARTNERSHIPS Family, students, staff and the entire community actively engage to seek resources and develop opportunities that meet future educational challenges and workforce needs. GOAL 3.0 ORGANIZATIONAL CLIMATES & SCHOOL SAFETY The learning and working environment is safe, caring, healthy, and values diversity.
STRATEGIC GOALS & OBJECTIVES
GOAL 1.0 TEACHING & LEARNING Prepare all students to be college and career ready. Rationale Statement: The economic vitality, democratic health and future of our communities, state, and nation depend upon the capacity of today’s students to become tomorrow’s extraordinary leaders, high performance workforce, and contributing citizens. SCPS’ focus is on optimizing the individualized potential of ALL students. High performing organizations, likewise, values diversity and support a framework for inclusivity of all individuals. As a whole, these practices give way to a favorable culture (i.e., the way people feel about the culture). OBJECTIVES: 1.1 Students will demonstrate the skills and standards necessary to be college and career ready.
1.2 Provide support services that optimize the physical and mental well being of all students, staff and
families.
1.3 Provide human resources services that support a diverse and talented work force that is aligned to ensure maximum performance in all areas.
1.4 Execute exemplary financial practices that maximize the organization’s return in investment in all areas.
1.5 Enhance the food services program by providing exceptional nutrition and healthy meal alternatives in an enjoyable atmosphere with satisfaction by all consumers.
1.6 Provide school based health care services that optimize the physical wellbeing of students.
1.7 Enhance maintenance of the division’s investment in buildings and grounds to ensure alignment with future educational needs.
STRATEGIC GOALS

EXECUTIVE SUMMARY Strategic Management
SCPS FY2017 School Board Approved Budget Page 10
STRATEGIC GOALS & OBJECTIVES (CONTINUED)
GOAL 2.0 COMMUNITY ENGAGEMENT & PARTNERSHIPS Family, students, staff, and the entire community actively engage to seek resources and to develop opportunities that meet future educational challenges and workforce needs.
Rationale Statement: The academic and postsecondary success of our students requires the collective effort of the entire Spotsylvania County community. It is imperative that we not only work harmoniously together to support students, but that we also share the accountability for their success.
OBJECTIVES: 2.1 Implement a comprehensive communications plan and strategy. 2.2 Strengthen productive partnerships for education and workforce needs. 2.3 Enhance outreach and communication tools for student families. 2.4 Increase visibility of school programs and needs with all stakeholders. GOAL 3.0 ORGANIZATIONAL CLIMATE & SCHOOL SAFETY This learning and working environment is safe, caring, healthy, and values diversity.
Rationale Statement: A safe and caring educational environment is a prerequisite to establishing and maintaining a conducive environment for learning and working. Supporting and advancing healthy lifestyles is also critical to the students’ and the staff’s wellbeing and success.
OBJECTIVES: 3.1 Maximize safety and security in the educational environment for all. 3.2 Foster/build a positive climate that is conducive for learning. 3.3 Exemplify physical and mental wellness for students and staff. 3.4 Optimize the safety and efficiency of transportation and fleet services.

EXECUTIVE SUMMARY Organizational Information
SCPS FY2017 School Board Approved Budget Page 11
FY 2017 Management Structure Spotsylvania County Public Schools (SCPS) division was created in 1922 and is located in the County of Spotsylvania, approximately 50 miles south of Washington, D.C. and 50 miles north of Richmond, Virginia. SCPS serves students from preschool to grade twelve and is comprised of 31 schools and centers: 17 elementary schools, 7 middle schools, 5 high schools, and 2 auxiliary centers. The Superintendent reports to the School Board and works closely with the senior executive leadership team to oversee the day-to-day operations of the division. The Assistant Superintendent of Instruction oversees the overall instructional operations, division-wide professional development and technology. The Chief Financial Officer oversees the budget, procurement, accounts payable, payroll, and the accounting functions. The Director of Administrative Services oversees the division-wide strategic plan, as well as assists Human Resources with various administrative functions. The Executive Director of Operations oversees school food service, pupil transportation, fleet services, maintenance, and capital improvement projects (CIP). The Executive Director of Human Resources oversees recruiting and personnel management. The Executive Director of Secondary Education and Leadership provides oversight to the secondary schools and the school safety department. The Executive Director of Student Support Services provides oversight for special education, counseling, social services, and gifted programs. The Director of Elementary Education directly oversees the instructional operations of the elementary schools. The Director of Communications and Community Engagement provides support for media relations, community relations, and business partnerships, as well as promotes the Division through social media, traditional media, community ties
and oversees the division’s Print Shop.
FY 2017 Organizational Chart
Spotsylvania County
Residents
Instruction
Assistant Superintendent
Executive Director of Secondary
Education & Leadership
Director of Elementary Education
Executive Director of
Student Support Services
Finance
Chief Financial Officer
Director of
Administrative Services
Operations
Executive Director
Human Resources
Executive Director
Communications & Community Engagement
Director
Clerk of the Board
Deputy Clerk of the Board
Executive Administrative
Assistant
School Board
Superintendent
EXECUTIVE SUMMARY Organizational Information
SCPS FY2017 School Board Approved Budget Page 12
Budget Process and Timeline The Code of Virginia requires that school divisions prepare annual budgets. Spotsylvania County Public Schools’ FY 2017 budget planning process began in September 2015. The FY 2017 School Board Approved Budget was developed based on revenues and expenditures noted in the Governor’s Proposed Budget for fiscal year 2017. Moreover, the FY 2017 School Board Approved Budget was compiled with input and feedback from a variety of stakeholders and key source documents, including, but limited to:
Principals, teachers, and staff;
Budget Advisory Committee members;
Parent Advisory Committee members;
Teacher Advisory Committee members;
Spotsylvania Education Association (SEA) officers and members;
Citizen input at public hearings;
Public comments in regular School Board meetings;
The school division’s 2014-2019 Strategic Plan; and
The 2017-2021 Capital Improvement Plan.
The next critical budget dates are as follows:
February 9 – County Administrator Presents FY17 Recommended Budget to Board of Supervisors
February 11-14 – General Assembly Crossover
February 16 – School Board Presents FY17 Approved Budget to Board of Supervisors
February 23 – County Approves Tax Rate Advertisement Decision
March 12 – (Tentative) General Assembly Approves State FY17 Budget
March 22 – Board of Supervisor and School Board Joint Budget Work Session
April 5 – Board of Supervisor Hosts Budget Public Hearing at Courtland High
April 12 – Board of Supervisors Adopt FY17 Budget and Tax Rates
May 9 – School Board Adopts FY17 Budget While engaging various stakeholders, the primary focus was discussing what resources are needed to ensure our students are prepared to compete successfully locally, nationally, and globally. Our mission statement is, “Together, we prepare our students for their future”.

BUDGET SUMMARY Organizational Information
SCPS FY2017 School Board Approved Budget Page 13
Budget Calendar Spotsylvania County Public Schools fiscal year is July 1 to June 30, which corresponds to the fiscal year of both the County of Spotsylvania and the Commonwealth of Virginia. SCPS is a fiscally dependent entity. Therefore, the school division’s budget cycle is driven by statutory deadlines from the Commonwealth of Virginia and the County of Spotsylvania. The school division’s FY 2017 budget timeline is below.
Activity
Timeframe
Budget Planning – The budget planning process starts when the School Board adopts the budget calendar. The calendar includes the dates, times, and location of activities related to the budget development process.
September 2015 -
October 2015
Budget Formulation – The preparation of the budget is the process of projecting student enrollment; estimating expenditure needs to support schools, programs, and services; and projecting revenues as well as estimating capital project improvement needs and its impact on the operating budget.
November 2015 - January 2016
Budget Engagement – During the budget development process, approximately three to four Budget Advisory Committee meetings are held with teachers, parents, business leaders, school administrators, and central office staff collectively. Several budget work sessions are held with the School Board to set goals and these goals are reaffirmed throughout the budget process.
December 2015 -
March 2016
Budget Preparation – Based on input from various sources, including the Budget Advisory Committee, the Superintendent’s Proposed Budget is prepared.
December 2015 - March 2016
Budget Approval – Based on recommendations made by the Superintendent, input from the community and information shared at School Board budget work sessions, the School Board’s Approved Budget is prepared.
February/March 2016
Budget Adoption – Prior to adopting the final budget, the School Board participates in a joint work session with the local governing board. The governing board adopts the tax rate and the County’s budget prior to May and the School Board adopts its budget in May.
April 2016 - May 2016
Principals & Department managers amend budgets based on revised needs
October 2016
Budget Evaluation –The results of operations for the fiscal year are set forth annually in the County’s and school division’s combined Comprehensive Annual Financial Report (CAFR).
November 2016

EXECUTIVE SUMMARY Organizational Information
SCPS FY2017 School Board Approved Budget Page 14
Executive Summary The FY 2017 School Board Approved budget represents a needs-based budget, which is aligned with the division’s strategic plan. The development of the budget is a collaborative process that involves the input of many stakeholders. The valuable input provided by business and community leaders, parents, teachers, and administrative staff, all of whom are committed to identifying the instructional programs and the human resources that are necessary to prepare all students for their futures. The major influences of the FY 2017 budget include:
o Maintaining competitiveness in attracting and retaining highly skilled, dedicated, and essential employees by increasing compensation;
o Addressing the increasing levels of mandated and required services for the rising student populations in
Special Education and English Speakers of other Languages;
o Increasing, sustaining, and restoring classroom and school positions to support curriculum rigor and intervention in math and literacy for an increasingly diverse population;
o Providing for the increasing need for timely technology support;
o Managing significant mandatory cost increases in health insurance and VRS; decreased enrollment; and
an increased Local Composite Index. Specific budget highlights include a step and 1% pay increase for all eligible employees; adjusting frozen pay scales by 1%; restoring academic and athletic stipends by 7%; reducing the athletic fee from $75 to $50; and the restoring of hourly Cafeteria monitors at the elementary level. In addition, the budget provides for increased and targeted human resources to support students and staff in the delivery of high quality instruction through: 12 general education teachers—10 middle school and two ESOL teachers; 11 Instructional Technology Assistants (ITAs); 24 special education personnel that include teachers, paraeducators, one social worker, one psychologist, one occupational therapist; one speech therapist; one autism coordinator, and one transportation dispatcher. Further, the budget responds to mandatory increases in employee benefits such as health insurance, VRS, and GLI. With mandatory costs and other student needs continuing to outpace the increase in revenues, this budget has a $12.6 million revenue gap. Potential gap closing measures for the FY 2017 budget include additional local, state, and federal revenues, continued reallocations, and lower health insurance, Virginia Retirement System (VRS), and Group Life Insurance (GLI) rates. The 2017-2021 CIP includes capital maintenance, capital technology, and capital transportation projects based on educational program requirements. In summary, the fiscal year 2017 School Board Approved Budget for all funds less CIP totals $287,195,630, which is a net increase of $17,297,967 or 6.4% more than the fiscal year 2016 Adopted Budget.

EXECUTIVE SUMMARY Organizational Information
SCPS FY2017 School Board Approved Budget Page 15
Significant Process, Policy, and Practice Changes This is the tenth consecutive year that the school division has faced a budget shortfall (meaning the net increase in costs outweigh the net increase in revenues). Increased costs include salary increases, special education costs, and services and personnel needed to meet instructional accountability requirements. To strategically address the budget shortfalls, the School Board utilized a tiered reduction approach for past budget cycles. Tier One through Tier Six reductions were executed as a part of the FY 2010 and FY 2011 budgets, some of which included eliminating vacant positions, eliminating categories of positions, aligning staffing standards to reflect the decline in student enrollment, reducing debt service expenditures by eliminating the issuance of bonds, eliminating programs (elementary Spanish, etc.), eliminating after-school activity buses, and instituting athletic fees. The FY 2012 budget included the reduction of 41 positions and the FY 2013 budget included a net decrease of 3.5 positions. To better utilize staff resources, restructuring was done to greater impact student instruction and needs. The FY 2015 budget included a net decrease of 16.5 positions. The FY 2016 budget included deferment of capital projects and reductions in various school and department non-compensation accounts. The FY 2017 approved budget includes a salary increase, increases to health insurance and VRS rates, a net increase of approximately 58 positions over the FY 2016 Adopted Budget, and a reduction in the athletic fee from $75 to $50. A detailed list of the FY 2017 Approved Budget assumptions are contained in the Financial Information section of this document. In addition, the Budget Advisory Committee (BAC), a valuable tool in the budget development process, continues to expand as public interest heightens due to the budget shortfalls. The budget development process has always incorporated the contributions of the community-at-large as essential stakeholders in the success of all students. The Budget Advisory Committee was originally established in 2002. The framework of the BAC was revamped in FY 2011 with a direct emphasis on focus groups to elicit dialogue and promote a higher level of thinking to problem solve the financial constraints facing the division. The new format included utilizing specific informational areas of the division’s website, as well as other technological tools, with all meeting materials and handouts accessed and stored electronically. Through paperless budget meetings, the school division gained efficiencies, saved on paper and printing costs. These practices were continued for the FY 2017 BAC process. During the FY 2017 budget development process, several Budget Advisory Committee meetings were held with approximately 40 teachers, parents, staff, school administrators, and central office staff. The budget advisory committee meetings were reformatted to better identify the current and future needs of the organization, focusing on mental health needs as well as core curriculum needs. Additionally, Finance and Instruction personnel co-facilitated the budget advisory meetings in order to better raise awareness of the educational needs of our students. The goal in developing the adopted budget was to maintain the overall strength of Spotsylvania County Public Schools as a high-performing school division while restoring services valued by students, parents, staff, and the community. Maintaining student achievement is the top priority and continuing to find strategic ways to support our goal is necessary to ensure that we are meeting the needs of all students.

EXECUTIVE SUMMARY Organizational Information
SCPS FY2017 School Board Approved Budget Page 16
Significant Process, Policy, and Practice Changes (continued) Fiscal Year 2012 Budget Process
Embedding of the Career Teacher Incentive Stipends into the Pay Scale Several years ago, the School Board implemented career incentive stipends for teachers on steps 0 to 5 in order to strengthen the lower end of the teacher pay scale and improve recruiting efforts. This stipend was routinely paid in August. Since FY 2009, the School Board has been unable to award step increases due to the downturn in the economy. Thus, each year the career incentive stipends were reduced to ensure a brand new teacher hired would not be compensated at a higher pay than a teacher with one year of experience. Also, incentives remained with those teachers who were on steps 0 to 5 to ensure that they received the same salary as in previous years when steps were frozen. Therefore, in FY 2011, teachers with up to eight years of experience received a career incentive (in August 2010).
After much deliberation, the School Board Adopted revised teacher pay scales for FY 2012, which included
embedding the career incentives into the teacher pay scale and converting from steps to years of experience. As
a result of this change, teachers on step 0-8 receive a higher Virginia Retirement System (VRS) contribution
because the former career incentive pay was not considered VRS creditable.
Fiscal Year 2013 Budget Process Legislation Changed Requiring Employees to Pay the 5% Employee VRS Share with an Offsetting 5% Pay Raise The 2011 Appropriations Act, passed by the Virginia General Assembly for the 2012 - 2015 Biennial budget
required state employees to contribute, on a pre-tax basis, 5% of their salary to the Virginia Retirement System
(VRS). VRS administers retirement plans, life insurance plans, and related services for its active members.
Eligible members include full-time salaried, permanent employees of the Commonwealth of Virginia, participating
local cities, towns, political subdivisions, and all Virginia school boards. These contributions could be phased-in
over a five-year period or the entire 5% could be implemented in one year. On July 1, 2012, the School Board
elected to have its employees pay the 5% employee share instead of implementing the phased-in approach. A
full implementation for FY 2013 was the preferred approach for recruiting purposes and maintaining equity among
existing and new staff. As such, employees below the director level received a 5.8% offsetting pay raise and
employees at the director level and above received a 5% offsetting pay raise.
Fiscal Year 2014 Budget Process Addition of a Third Health Insurance Plan to Address Rising Costs For many years the school division offered two health insurance plans to employees, which were KeyCare Expanded (high option plan) and KeyCare 500 (low option plan). By 2020, all large employers that continue to offer robust benefit plan designs will be accessed a 40% tax rate under the Affordable Care Act. Also, coupled with the continuous rise in health care costs, many school divisions are being forced to identify creative ways to reduce costs. Thus, as a part of the division’s strategy to address rising costs and forthcoming federal requirements, a mid option health insurance plan was implemented entitled KeyCare 200. The employee premium for the KeyCare 200 plan remained the same as the previous KeyCare Expanded contribution rates, to assist employees in avoiding an increase in their health insurance payroll reduction. The KeyCare 200 plan design is not as robust as the KeyCare Expanded plan, which means when employees access medical services their out-of-pocket expenses, such as co-pays and deductibles are higher. The employee KeyCare Expanded plan (most robust option) is still offered to employees but at a higher premium. Based on employee survey results, employees stated they are willing to pay higher premiums to keep the robust coverage. The premiums for the KeyCare 200 plan were significantly reduced based on actuarial guidelines. Also, to address costs, the school division is paying the same premium for both the KeyCare Expanded plan and the KeyCare 500 plan. The original employer premium to the KeyCare 200 plan is higher to avoid health insurance payroll reductions for those who were previously on the KeyCare expanded plan and opted to transfer into the KeyCare 200. The division will continue to identify ways to provide quality benefits to employees at a reasonable costs.

EXECUTIVE SUMMARY Organizational Information
SCPS FY2017 School Board Approved Budget Page 17
Significant Process, Policy, and Practice Changes (continued) Fiscal Year 2015 Budget Process
Changes Related to the Virginia Retirement System Hybrid Retirement Plan and Virginia Local Disability Program (or Comparable Employer Sponsored Plan) The General Assembly established a third retirement plan under the Virginia Retirement System called the Hybrid
Retirement Plan. The new Hybrid Retirement Plan will apply to new members hired on or after January 1, 2014.
Because the new Hybrid Retirement Plan does not provide a disability retirement provision, VRS created a
program entitled Virginia Local Disability Program (VLDP). VRS Plan 1 and Plan 2 members were able to make
an irrevocable decision to opt into the new Hybrid Retirement Plan during the election window of January 1, 2014
to April 30, 2014. The division opted out of the Virginia Local Disability Program (VLDP) due to fiscal and
contractual reasons; therefore, was required to provide a comparable employer-paid disability plan for employees.
To capture the employer share of contributions for Hybrid Plan employees versus the employer share of contributions for VRS Plan 1 and Plan 2 employees, the revised chart of accounts includes the following modifications:
1. Object Code 2210, VRS (Virginia Retirement System) Benefits, comprises VRS payments for Plan 1 and Plan 2 employees. Payments represent only the employer share into the Virginia Retirement System. 2. Object Code 2220, VRS Benefits for Hybrid Plan Employees, consist of payments for the Hybrid Retirement
Plan. This includes all employees hired as of January 1, 2014, with no prior VRS service and any employees
hired before this date who opt-in to the new Hybrid Retirement Plan. Payments represent only the employer
share into the Virginia Retirement System (both the defined benefit and defined contribution amounts).
Furthermore, to align with the VDOE account code structure and reporting guidelines, the chart of accounts was
updated to capture payments into the VLDP (or comparable plan) separately versus payment into disability
insurance plans for employees covered under VRS Plan 1 and Plan 2. The modifications are as follows:
1. Object Code 2500 Disability Insurance includes payments into disability insurance plan for employees covered
under Virginia Retirement System Plan 1 and Plan 2.
2. Object Code 2510 VLDP (Virginia Local Disability Program) or Comparable Plan include payments into the
division’s comparable plan (for division’s that opted out of VLDP) for employees covered under the new Hybrid
Retirement Plan.
In FY15 this disability program was implemented to provide equitable disability benefits for hybrid employees and legacy employees, the division’s budget included an expenditure of $466,534 for FY15 and $386,409 in FY16. In FY17, the revised expenditure amount is $320,181. Providing a Step Increase for Employees Through the reallocation of funds and additional state funds, the fiscal year 2015 budget included a step and 1% COLA increase for employees. Healthcare Reform Act Employers employing at least 50 full-time employees will be subject to the Employer Shared Responsibility provisions under section 4980H of the Internal Revenue Code, which relates to the Affordable Care Act. As defined by the statute, a full-time employee is an individual employed on average at least 30 hours per week. Specifically, in 2015, large employers were required to offer coverage to at least 70% of its full-time employees (and their dependents) that is affordable and the coverage must equal a minimum value of 60%. SCPS exceeded this requirement for 2015 by almost 13%. No additional action was required by the school division for fiscal year 2015.

EXECUTIVE SUMMARY Organizational Information
SCPS FY2017 School Board Approved Budget Page 18
Significant Process, Policy, and Practice Changes (continued) Fiscal Year 2016 Budget Process Health Reform Act – Establishment of a Fourth Health Plan The original employer premium to the KeyCare 200 plan is higher to avoid health insurance payroll reductions for those who were previously on the KeyCare expanded plan and opted to transfer into the KeyCare 200. The division will continue to identify ways to provide affordable healthcare insurance to employees. Employers employing at least 50 full-time employees will be subject to the Employer Shared Responsibility provisions under section 4980H of the Internal Revenue Code, which relates to the Affordable Care Act. As defined by the statute, a full-time employee is an individual employed on average at least 30 hours per week. In 2016, large employers were required to offer coverage to at least 95% of its full-time employees (and their dependents) that is affordable and the coverage must equal a minimum value of 60%. If an employer does not offer coverage of minimum value (60% plan) for at least 95% of its full-time (30 hours or more per week) employees it will be subject to a penalty of $2,000 per full-time employee. SCPS has approximately 3,600 full-time employees as defined by the Healthcare Reform Act (includes employees who work on average 30 hours per week), the annual penalty fee would be over $7 million (based on 3,600 employees at $2,000). In an effort to reduce the amount of the potential penalty, SCPS can offer a plan of minimum value to 95% of its full-time employees and charge employees who work on average 30 hours per week the full cost of the plan (not paying for health coverage but offering coverage). SCPS would then be subject to a penalty of $3,000 per eligible participant (employees and dependent children) who goes to the Exchange and receive a subsidy. Therefore, the penalty would be considerably less since subsidies are only available to households that have income below the 400% of the poverty level. The estimated annual penalty would be $225,000 ($3,000 per person – with a total of approximately 75 employees meeting this criterion. To comply with the Health Reform Act requirements, SCPS offered a fourth health (bronze) insurance plan to all hourly employees. These employees are responsible for paying the full premium. Early Retirement Incentive Program (ERIP) Spotsylvania County Public Schools’ employees who retired at the end of their contract period during the month of June 2015 and with the Virginia Retirement System (VRS) effective July 1, 2015 who elected to participate in the Early Retirement Incentive Program had to meet the eligibility criterion at the time of retirement.
Participants in the Early Retirement Incentive Program were paid 30% of their last VRS reported creditable compensation earned prior to retirement. The division disbursed the non-elective employer contribution to the approved Spotsylvania County Public School 403(b) tax-shelter provider as designated by each retiree towards the end of the 2015 fiscal year.
The gross program savings was approximately $2,500,000 in fiscal year 2016.
Providing a Compensation Increase for Employees Through the reallocation of funds and savings gained from the ERIP, the fiscal year 2016 budget included a 3% cost-of-living adjustment for all eligible employees. Parking Permit Fees Currently, high school students are assessed an eighty ($80) dollar fee for parking permits for a full school year. At the end of the school year, twenty ($20) dollars of the fee is remitted to the central office to assist with school-wide maintenance repairs. Due to the increase in VHSL requirements effective for school year 2015-2016, high schools will retain all parking permit fees collected. The division-wide amount is approximately $30,000.

EXECUTIVE SUMMARY Organizational Information
SCPS FY2017 School Board Approved Budget Page 19
Significant Process, Policy, and Practice Changes (continued) Fiscal Year 2017 Budget Process Employee Pay Raise The primary budget priority for FY 2017 is to build budgetary capacity in order to provide a step increase and a 1% cost-of-living-adjustment to all of our contracted employees. Being able to provide three consecutive pay raises, one in FY 2015, one in FY16 and another in FY 2017, would be a significant achievement because of the current budget challenges at the local, state, and federal levels. Athletic Fee In FY 2010, the school division implemented a $100 athletic fee per sport per student. The goal is to sunset this fee over time as the economy recovers. This budget entails reducing the fee from $75 in FY 2016 to $50 in FY 2017. Employee and Employer Health Insurance Rate Increases This budget includes an employer rate increase of 11.8% and and employee premium rate increase of 5%. The increase is attributable primarily to medical trends and prior year experience. First, Medical & Drug Trend - 8.5% Health and prescription costs vary from one year to the next but are clearly increasing over time. The State in their recent review of Public Employee Health programs (statewide) projected costs using 5% medical and 10% for prescription (6.25% combined). So the State actuaries expect 6.5% increases per year over time. Finally, as it pertains to prior year experience, division claims from last year are higher than expected and therefore projections using those claims are higher than expected. Further, there was a significant rise in the number of large claimants over $75,000 (these large claims can vary widely from one year to the next) and prescription drugs cost has increased faster than projected). The FY2017 approved premiums are noted below.
Employee Employer Total Premium
Employee Only $131.63 $674.97 $806.60
Employee + 1 $367.86 $1,101.43 $1,469.29
Family (SHARED) $206.39 $867.01 $1,073.40
Family $628.29 $1,518.51 $2,146.80
Employee Employer Total Premium
Employee Only $94.77 $690.90 $785.67
Employee + 1 $299.58 $1,131.74 $1,431.32
Family (SHARED) $173.13 $872.56 $1,045.69
Family $527.09 $1,564.29 $2,091.38
Employee Employer Total Premium
Employee Only $21.42 $674.97 $696.39
Employee + 1 $164.34 $1,101.43 $1,265.77
Family (SHARED) $47.40 $867.01 $914.41
Family $310.31 $1,518.51 $1,828.82
KeyCare Expanded Benefits (to include dental and vision)
KeyCare 200 Benefits (to include dental and vision)
KeyCare 500 Benefits (to include dental and vision)

EXECUTIVE SUMMARY Organizational Information
SCPS FY2017 School Board Approved Budget Page 20
Financial Policies and Practices Accounting Policies and Practices
All funds are accounted for using the modified accrual basis of accounting except for the Joint Fleet Maintenance
- Internal Service Fund, which uses full accrual basis of accounting. Revenues are generally recognized for all
other funds when they are both measurable and available. SCPS considers all revenues available if they are
collectible within 60 days after year end. However, intergovernmental revenues, consisting primarily of Federal,
State and other grants, for the purpose of specific funding, are recognized when earned or at the time of the
specific reimbursable expenditure. Expenditures are generally recognized under the modified accrual basis of
accounting when the related fund liability is incurred, except for certain compensated absences and principal and
interest payments on general long-term debt, both of which are recognized when paid.
Budgetary Policies and Practices
According to the Code of Virginia, the Commonwealth, in conjunction with the Auditor of Public Accounts, shall
establish and require of each school division a modern system of accounting for all school funds. Consequently,
SCPS maintains a chart of accounts that fulfills the requirements of the Virginia Department of Education and the
annual school report as prescribed by the auditor of public accounts. The chart of accounts is composed of the
following elements: funds, functions, cost centers, objects, programs, and projects. In order to maintain the
integrity of the account structure, SCPS maintains distinct funds to account for financial transactions that remain
separate from other transactions. SCPS maintains the following six (6) funds: 1 – The Commonwealth Governor’s School
2 – Juvenile Detention Center
3 – School Food Service Program
4 – Regional Adult Education Program
5 – Regular Education Operating Fund
7 – Joint Fleet Maintenance – Internal Service Fund The revenue accounts are charted according to the sources below. Revenues for the various funds are included
on the fund statement sheets and the operating sheets of this budget document. 200 – State Sales Tax
300 – State Funds
400 – Federal Funds
500 – County Funds
700 – Other Funds
800 – Loans, Bonds, and Interest
The expenditure accounts are divided according to function/sub-function as prescribed by the Auditor of Public
Accounts. In order to record transactions, expenditures are charted according to cost center, object, program,
and project. The functions (categories) of expenditures listed below define the type of activity.
1000 – Instruction
2000 – Administration, Attendance, and Health
3000 – Pupil Transportation Services
4000 – Operation and Maintenance Services
5000 – School Food Services
6000 – Facilities and Technology
7000 – Debt Service and Fund Transfers

EXECUTIVE SUMMARY Organizational Information
SCPS FY2017 School Board Approved Budget Page 21
Financial Policies and Practices
SCPS code structure is based on the Commonwealth of Virginia’s chart of accounts. The details are below.
The function code is the category that defines the type of expenditure activity.
The cost center code identifies the location of the activity. These codes include all distinct physical locations in the school division, including schools and administrative sites.
The object code identifies the actual good or service purchased. Object codes are grouped into two main categories, compensation and non-compensation.
The program code identifies the revenue or expenditure as an elementary, secondary, or administrative activity.
The project code identifies the source of funds for the activity.
Overall, SCPS operates under a quasi site-based management philosophy where schools and departments have
full authority to plan and expend their non-compensation budgets, while the compensation budgets are controlled
and monitored by the central office.
Compensation budgets, which are salaries and benefits, include the expenditures listed below:
Object 1000 – Compensation - Contracted pay, overtime pay, non-contracted pay, substitute pay, and supplemental pay.
Object 2000 – Benefits - FICA, health/dental insurance, retirement benefits, group life insurance, disability insurance, and annual and sick leave payoff.
Non-compensation budgets include the expenditures listed below:
Object 3000 – Purchased Services - Services, professional development, lease/rental contracts, etc.
Object 5000 – Other Charges - Utilities, memberships, travel, dues and licenses, etc.
Object 6000 – Materials and Supplies - Office supplies, medical and dental supplies, commodities that are consumed, and minor equipment that is not capitalized, etc.
Object 7000 – Payment to Joint Operations – Not used by SCPS.
Object 8000 – Capital Outlay – New/replacement equipment and furnishings with unit price of $5,000 or higher.
Object 9000 – Other Uses of Funds – This series of codes is used for debt service and accounting control purposes (e.g., holdback accounts). The school division, as a part of the county audit process, assists with the preparation of a Comprehensive Annual Financial Report (CAFR) to report results of all funds under School Board authorization. The school division prepares the Annual School Report for the Virginia Department of Education. Summary listings of individual school and department critical functions and activities as well as a discussion of their budgeted major changes for the coming year are presented for each department in the Financial Section of this budget document.

EXECUTIVE SUMMARY Financial Information
SCPS FY2017 School Board Approved Budget Page 22
Revenue Highlights The FY 2017 School Board’s Adopted Revenue Budget is $302,164,678. However, less CIP the revenue budget is $274,553,654 representing a net increase of 2% more than fiscal year 2016 Adopted Revenue Budget. The total revenue budget consists of six revenue sources: state sales tax, other state funds, federal funds, city-county funds, other funds, and loans and bonds funds. The primary sources of revenue for SCPS are State Funds and City-County Appropriations. State Revenues The combined State Sales Tax and other State Funds equates to $131,333,300, which represents approximately 47.8% of SCPS’s FY 2017 revenues less CIP. Also, the chart on the following page shows State funds increased by a net total of $3,994,075. Federal Revenues Federal funds total $14,601,500, an increase of $322,913 or 2.3% from FY 2016 to FY 2017. This net increase is primarily due to a projected increase in Title federal funds. Federal revenues represent 5.3% of SCPS FY 2017 revenues less CIP. City-County (Local) Revenues This budget includes a City-County Appropriation of $116,432,747, which excludes the Bridges Grant of $122,960. Other Revenues The Other revenues total is $12,186,107 or $339,003 or 2.9% more than FY2016. Other revenues represent 4.1% of SCPS total budget in FY 2017 less CIP. Loans and Bonds Revenue Loans and bonds revenue total $27,611,024, an increase of $8,981,499 or 48.2% in FY 2017. Loans and bonds revenues are projected to increase based on the approved 2017-2021 CIP plan.

EXECUTIVE SUMMARY Financial Information
SCPS FY2017 School Board Approved Budget Page 23
FY13 FY14 FY15 FY16 FY17 $ %
Actual Actual Actual Adopted
Budget
Approved
Budget
Variance Change
Revenue
STATE SALES TAX $ 22,980,748 $ 22,937,498 $ 23,784,356 $ 24,600,677 $ 25,587,202 $ 986,525 4.0%
STATE FUNDS TOTAL 98,331,685 98,406,515 101,785,966 102,738,548 105,746,098 3,007,550 2.9%
Subtotal $ 121,312,433 $ 121,344,013 $ 125,570,322 $ 127,339,225 $ 131,333,300 $ 3,994,075 3.1%
FEDERAL FUNDS 17,072,530 13,383,260 14,183,588 14,278,587 14,601,500 322,913 2.3%
CITY-COUNTY FUNDS 161,115,155 129,749,151 162,367,871 116,432,747 116,432,747 - 0.0%
OTHER FUNDS 10,360,159 11,492,219 11,642,153 11,847,104 12,186,107 339,003 2.9%
LOANS, BONDS, ETC 9,312,412 11,440,176 7,646,604 18,629,525 27,611,024 8,981,499 48.2%
Subtotal $ 197,860,256 $ 166,064,807 $ 195,840,216 $ 161,187,963 $ 170,831,378 $ 9,643,415 6.0%
Grand Total $ 319,172,690 $ 287,408,820 $ 321,410,539 $ 288,527,188 $ 302,164,678 $ 13,637,490 4.7%
Budget Overview by Revenue Source - All Funds
$131,333,300
$116,432,747
$27,611,024
$14,601,500 $12,186,107
$-
$20,000,000
$40,000,000
$60,000,000
$80,000,000
$100,000,000
$120,000,000
$140,000,000
SALES TAX & STATE FUNDS
CITY-COUNTY FUNDS
LOANS, BONDS, ETC FEDERAL FUNDS OTHER FUNDS
43.5%
38.5%
9.2%4.8% 4.0%

EXECUTIVE SUMMARY Financial Information
SCPS FY2017 School Board Approved Budget Page 24
Major Budget Changes in Expenditures for All Funds To effectively remain focused and poised to meet the total needs of all students, it is critical that the school division routinely reflects on the past, look into the future, and analyze the horizons to make sure they are providing the best instructional practices and programs. The adjustments included in the School Board Adopted Budget exemplify this belief by providing a funded pay raise for all contracted employees, recommending restoration of services that are valued by students, parents, staff and the community, and addressing accountability and compliance requirements. The FY 2017 School Board Approved Budget includes the major budget adjustments below:
Description Amount
Medical and Dental Rate Increases 4,045,803$
VRS Professional and Non-professional Rate Adjustments 684,585$
Group Life Insurance Rate Increase 165,725$
Step Increase for all Staff 3,209,669$
1% COLA for all Eligible Employees 1,730,503$
Frozen Scales adjusted at 1% increase 191,411$
7% Academic and Athletic Stipend Restoration 78,905$
Lower Athletic Fee from $75 to $50 (93,092)$
Adjust Debt Service to $27.6M of New Borrowing 2,706,628$
Add 10.0 FTEs General Education Middle School Teachers 638,658$
Add 2.0 ESOL Teachers 127,732$
Add 24.0 Special Education Personnel 1,195,656$
Add 11.0 FTE Instructional Technology Assistants to have 1 per school 393,190$
Increase Food Services Revenues and Equipment Repair Parts 250,000$
Increase Local purchase services for special education speech needs 199,872$
Add Café Monitors (2 per elementary school x 3 hours per day x $9.50 per hour) 187,763$
Increase DP Software Support (New Finance/Human Resources system) 160,000$
Balance Grants & Funds ($56,200 Local support towards grants) (200,504)$
Impact of Using the Division's Health Insurance Reserve 1,046,654$

EXECUTIVE SUMMARY Financial Information
SCPS FY2017 School Board Approved Budget Page 25
Combined Fund Statements The FY 2017 School Board Approved Budget for all funds less CIP totals $287,195,631. The total budget consists of six funds for which operating and capital expenditures are accounted in the same fund by differentiating budget codes.

EXECUTIVE SUMMARY Financial Information
SCPS FY2017 School Board Approved Budget Page 26
Fund 1 – Commonwealth Governor’s School (CGS) - accounts for a regional program that serves gifted students from the school divisions of Caroline, King George, Spotsylvania, and Stafford. Non-compensation lines were reduced to match the projected revenue budget. The FY 2017 adopted budget of $2,166,085 includes the following adjustments:
Description Amount
· Step Increase for all Staff $20,870.15
· VRS Rate Increase - Professional Group from 14.06% to 14.66% $5,278.92
· Retiree Health Credit Rate Increase - Professional Group from 1.06% to 1.11% $439.92
· Group Life Rate Increase from 1.19% to 1.31% $1,055.77
· Increase Dental Rates by 15% $949.43
· Increase Health Insurance Rate by 5% for employees and by 11.8% for the employer $12,504.11
· 1% Cost of Living Adjustment (COLA) for all Staff $10,907.43
· Balance Fund to Projected Revenues $85,760.00Fund 1 - Governor's School - Instruction Total $137,765.73
· Frozen Steps Adjusted by a 1% Increase $1,065.37
· Step Increase for all Staff $1,076.55
· VRS Rate Increase - Professional Group from 14.06% to 14.66% $525.25
· Retiree Health Credit Rate Increase - Professional Group from 1.06% to 1.11% $43.77
· Group Life Rate Increase from 1.19% to 1.31% $105.05
· Increase Dental Rates by 15% $73.94
· Increase Health Insurance Rate by 5% for employees and by 11.8% for the employer $954.33
· 1% Cost of Living Adjustment (COLA) for all Staff $1,094.49
Fund 1 - Governor's School - Technology Total $4,938.75
· Adjustments after the FY 2016 Budget Adoption ($1,513.48)
Fund 1 - Governor's School - Technology Total $141,191.00

EXECUTIVE SUMMARY Financial Information
SCPS FY2017 School Board Approved Budget Page 27
FY13 FY14 FY15 FY16 FY17 $
Function/Object Actual Actual Actual Adopted
Budget
Approved
Budget
Variance
1100 CLASSROOM INSTRUCTION Actual Actual Actual Adopted Recommended Variance1110 COMP OF DIRECTORS $ 105,910 $ 105,910 $ 107,719 $ 110,951 $ 109,558 $ (1,393)
1121 COMP OF TEACHERS 651,102 634,699 680,705 701,131 724,191 23,060
1140 COMP-TECHNICAL PERSONNEL 82,493 82,493 - - - -
1150 COMP OF CLERICAL STAFF 50,930 50,930 52,167 53,510 54,803 1,293
1520 COMP OF SUB TEACHERS 2,235 1,046 2,370 - - -
1611 SUPP PAY/SUMMER ENRICHMT 1,875 2,275 2,800 3,000 3,000 -
2100 FICA 64,951 63,897 61,633 64,041 65,567 1,526
2210 VRS (PLAN 1 & 2) 111,593 111,614 121,886 121,789 130,262 8,473
2300 HOSPITALIZATION 98,892 114,295 106,181 106,331 121,081 14,750
2310 DENTAL INSURANCE 8,180 6,864 6,165 6,165 7,279 1,114
2400 GROUP LIFE INSURANCE 10,399 10,401 10,003 10,301 11,640 1,339
2500 DISABILITY INS (PLAN 1&2) - - 2,130 2,211 1,891 (320)
2750 RETIREE HEALTH CREDIT - - 8,910 9,175 9,863 688
3000 PURCHASED SERVICES 41,743 51,478 66,649 55,000 65,000 10,000
3002 PRINTING/BINDING 4,500 2,234 2,250 4,000 4,000 -
3014 VERIZON MAINTENANCE 37,400 25,283 11,216 30,000 30,000 -
3101 INSTRUCTIONAL DEVELOPMENT 831 6,246 4,167 8,000 8,000 -
3104 FIELD TRIPS 46,005 49,009 61,863 55,000 60,000 5,000
3322 XEROX MAINTENANCE 3,712 3,685 2,689 4,000 3,000 (1,000)
3612 ROBOTICS/TEAM COACHING 5,000 5,000 5,000 5,000 5,500 500
5201 POSTAGE 270 230 1,000 1,000 1,000 -
5203 TELEPHONE 2,368 2,623 2,702 6,463 6,463 -
5205 SITE CONNECTIONS 85,677 94,405 93,236 160,000 160,000 -
5300 FIRE & LIABILITY INS 1,903 1,911 2,135 2,135 2,029 (106)
5401 LEASE/RENTALS 6,955 9,655 8,175 9,344 9,344 -
5500 TRAVEL 7,910 4,498 4,356 8,410 8,410 -
5820 LATE FEES/SERVICE CHARGES - 192 - 200 - (200)
6000 MATERIALS & SUPPLIES 37,711 33,240 30,786 173,415 193,913 20,498
6047 ASST TO PART. DIVISIONS 19,806 - - 3,684 - (3,684)
6300 INSTR. SUPPLEMENTAL MAT. 43,892 30,967 31,477 49,653 49,653 -
6301 TECH MAINT/UPGRADES 204,968 247,718 250,239 107,301 162,053 54,752
6302 SUM/NEW STUDENT ORIENT 832 1,335 823 1,200 1,200 -
6303 SUMMER ENRICHMENT 3,400 5,800 7,327 7,000 7,000 -
Total $ 1,743,445 $ 1,759,935 $ 1,748,759 $ 1,879,410 $ 2,015,698 $ 136,288
3400 VEHICLE MAINTENANCE SVCS Actual Actual Actual Adopted Recommended Variance 3308 VEHICLE REPAIRS - $ 123 $ 418 $ 1,200 $ 1,200 $ -
6008 GASOLINE/OIL/LUBRICANTS 1,600 2,491 2,424 2,500 2,500 -
Total $ 1,600 $ 2,614 $ 2,842 $ 3,700 $ 3,700 $ -
6810 TECHNOLOGY - CLASSROOM Actual Actual Actual Adopted Recommended Variance 6015 COMPUTER SUPPL/SOFTWARE $ 26,030 $ 26,000 $ 26,000 $ 26,000 $ 26,000 $ -
Total $ 26,030 $ 26,000 $ 26,000 $ 26,000 $ 26,000 $ -
6820 TECHNOLOGY -INSTRUCT. SUP Actual Actual Actual Adopted Recommended Variance 1140 COMP-TECHNICAL PERSONNEL - - $ 83,318 $ 85,818 $ 88,419 $ 2,601
2100 FICA - - 6,194 6,384 6,575 191
2210 VRS (PLAN 1 & 2) - - 12,081 12,075 12,962 887
2300 HOSPITALIZATION - - 8,847 8,874 9,837 963
2310 DENTAL INSURANCE - - 493 493 567 74
2400 GROUP LIFE INSURANCE - - 991 1,021 1,158 137
2500 DISABILITY INS (PLAN 1&2) - - 204 209 187 (22)
2750 RETIREE HEALTH CREDIT - - 883 910 981 71
Total $ - $ - $ 113,011 $ 115,784 $ 120,687 $ 4,903
Grand Total $ 1,771,075 $ 1,788,550 $ 1,890,613 $ 2,024,894 $ 2,166,085 $ 141,191
Commonwealth Governor's School (Fund 1)
Expenditure Trends by Function and Object
%
Change
Change(1.3%)
3.3%
0.0%
2.4%
0.0%
0.0%
2.4%
7.0%
13.9%
18.1%
13.0%
(14.5%)
7.5%
18.2%
0.0%
0.0%
0.0%
9.1%
(25.0%)
10.0%
0.0%
0.0%
0.0%
(5.0%)
0.0%
0.0%
(100.0%)
11.8%
(100.0%)
0.0%
51.0%
0.0%
0.0%
7.3%
Change0.0%
0.0%
0.0%
Change0.0%
0.0%
Change3.0%
3.0%
7.3%
7.0%
10.9%
15.0%
13.4%
(10.4%)
7.9%
4.2%

EXECUTIVE SUMMARY Financial Information
SCPS FY2017 School Board Approved Budget Page 28
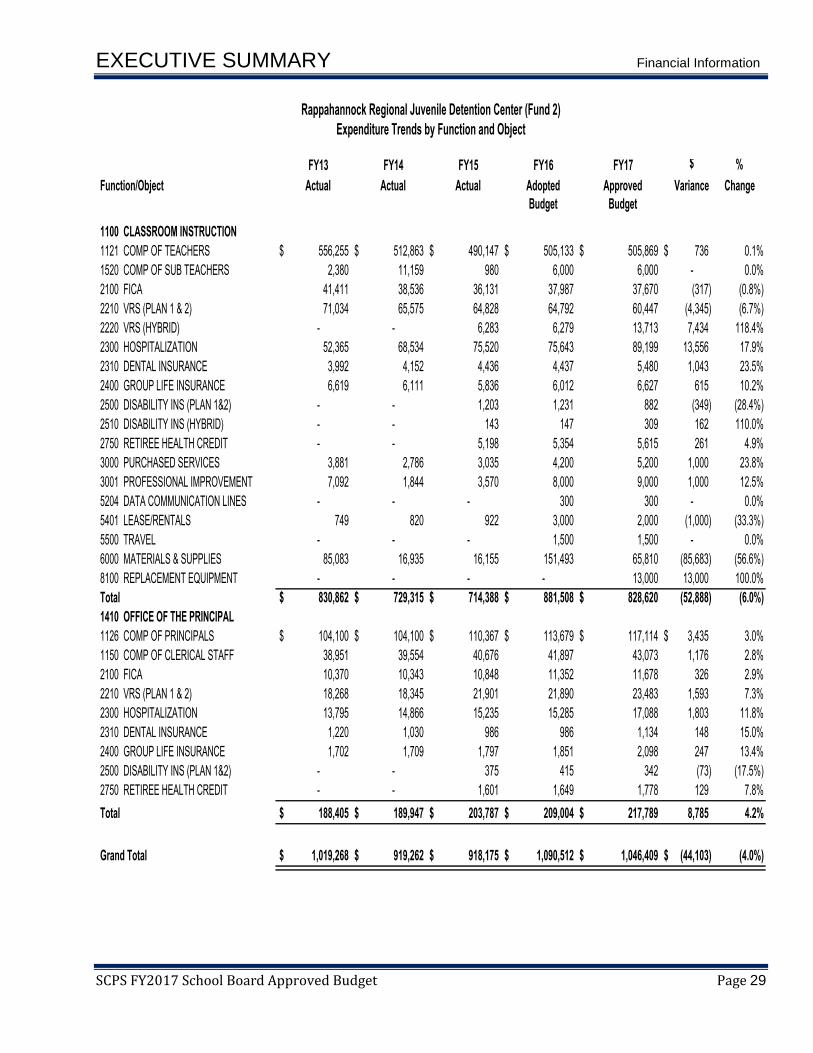
Fund 2 – Rappahannock Regional Juvenile Detention Center (RRJDC) - accounts for activity associated with providing detained youth a quality education and the skills necessary to transition from the program into their regular school. The FY 2017 Board Approved budget of $1,046,409, includes the following adjustments:
Description Amount
· Step Increase for all Staff $13,218.33
· VRS Rate Increase - Professional Group from 14.06% to 14.66% $3,956.72
· Retiree Health Credit Rate Increase - Professional Group from 1.06% to 1.11% $329.72
· Group Life Rate Increase from 1.19% to 1.31% $791.34
· Increase Dental Rates by 15% $862.63
· Increase Health Insurance Rates by 5% for employees and by 11.8% for the employer $11,021.76
· 1% Cost of Living Adjustment (COLA) for all Staff $8,247.11
· Balance Funds and Grants to projected revenues ($100,579.71)
· Adjustments after the FY 2016 Budget Adoption $18,049.10
Fund 2 - Detention Center Total ($44,103.00)
EXECUTIVE SUMMARY Financial Information
SCPS FY2017 School Board Approved Budget Page 29
FY13 FY14 FY15 FY16 FY17 $
Function/Object Actual Actual Actual Adopted
Budget
Approved
Budget
Variance
1100 CLASSROOM INSTRUCTION Actual Actual Actual Adopted
Budget
Recommended
Budget
Variance
1121 COMP OF TEACHERS $ 556,255 $ 512,863 $ 490,147 $ 505,133 $ 505,869 $ 736
1520 COMP OF SUB TEACHERS 2,380 11,159 980 6,000 6,000 -
2100 FICA 41,411 38,536 36,131 37,987 37,670 (317)
2210 VRS (PLAN 1 & 2) 71,034 65,575 64,828 64,792 60,447 (4,345)
2220 VRS (HYBRID) - - 6,283 6,279 13,713 7,434
2300 HOSPITALIZATION 52,365 68,534 75,520 75,643 89,199 13,556
2310 DENTAL INSURANCE 3,992 4,152 4,436 4,437 5,480 1,043
2400 GROUP LIFE INSURANCE 6,619 6,111 5,836 6,012 6,627 615
2500 DISABILITY INS (PLAN 1&2) - - 1,203 1,231 882 (349)
2510 DISABILITY INS (HYBRID) - - 143 147 309 162
2750 RETIREE HEALTH CREDIT - - 5,198 5,354 5,615 261
3000 PURCHASED SERVICES 3,881 2,786 3,035 4,200 5,200 1,000
3001 PROFESSIONAL IMPROVEMENT 7,092 1,844 3,570 8,000 9,000 1,000
5204 DATA COMMUNICATION LINES - - - 300 300 -
5401 LEASE/RENTALS 749 820 922 3,000 2,000 (1,000)
5500 TRAVEL - - - 1,500 1,500 -
6000 MATERIALS & SUPPLIES 85,083 16,935 16,155 151,493 65,810 (85,683)
8100 REPLACEMENT EQUIPMENT - - - - 13,000 13,000
Total $ 830,862 $ 729,315 $ 714,388 $ 881,508 $ 828,620 (52,888)
Actual Actual Actual Adopted
Budget
Recommended
Budget
Variance
1126 COMP OF PRINCIPALS $ 104,100 $ 104,100 $ 110,367 $ 113,679 $ 117,114 $ 3,435
1150 COMP OF CLERICAL STAFF 38,951 39,554 40,676 41,897 43,073 1,176
2100 FICA 10,370 10,343 10,848 11,352 11,678 326
2210 VRS (PLAN 1 & 2) 18,268 18,345 21,901 21,890 23,483 1,593
2300 HOSPITALIZATION 13,795 14,866 15,235 15,285 17,088 1,803
2310 DENTAL INSURANCE 1,220 1,030 986 986 1,134 148
2400 GROUP LIFE INSURANCE 1,702 1,709 1,797 1,851 2,098 247
2500 DISABILITY INS (PLAN 1&2) - - 375 415 342 (73)
2750 RETIREE HEALTH CREDIT - - 1,601 1,649 1,778 129
Total $ 188,405 $ 189,947 $ 203,787 $ 209,004 $ 217,789 8,785
Grand Total $ 1,019,268 $ 919,262 $ 918,175 $ 1,090,512 $ 1,046,409 $ (44,103) (4.0%)
7.3%
11.8%
15.0%
13.4%
(17.5%)
7.8%
1410 OFFICE OF THE PRINCIPAL Change
3.0%
2.8%
2.9%
4.2%
0.0%
(33.3%)
0.0%
(56.6%)
100.0%
(6.0%)
10.2%
(28.4%)
110.0%
4.9%
23.8%
12.5%
0.0%
(0.8%)
(6.7%)
118.4%
17.9%
23.5%
%
Change
Change
0.1%
Rappahannock Regional Juvenile Detention Center (Fund 2)
Expenditure Trends by Function and Object
EXECUTIVE SUMMARY Financial Information
SCPS FY2017 School Board Approved Budget Page 30
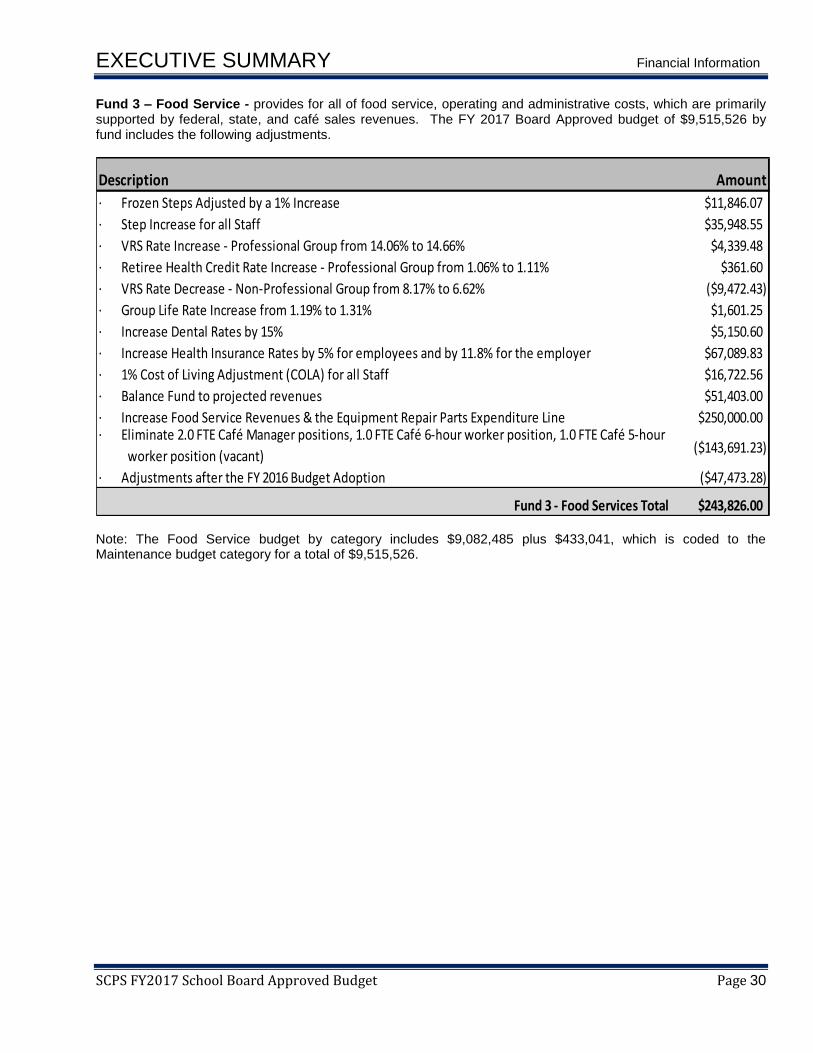
Fund 3 – Food Service - provides for all of food service, operating and administrative costs, which are primarily supported by federal, state, and café sales revenues. The FY 2017 Board Approved budget of $9,515,526 by fund includes the following adjustments.
Description Amount
· Frozen Steps Adjusted by a 1% Increase $11,846.07
· Step Increase for all Staff $35,948.55
· VRS Rate Increase - Professional Group from 14.06% to 14.66% $4,339.48
· Retiree Health Credit Rate Increase - Professional Group from 1.06% to 1.11% $361.60
· VRS Rate Decrease - Non-Professional Group from 8.17% to 6.62% ($9,472.43)
· Group Life Rate Increase from 1.19% to 1.31% $1,601.25
· Increase Dental Rates by 15% $5,150.60
· Increase Health Insurance Rates by 5% for employees and by 11.8% for the employer $67,089.83
· 1% Cost of Living Adjustment (COLA) for all Staff $16,722.56
· Balance Fund to projected revenues $51,403.00
· Increase Food Service Revenues & the Equipment Repair Parts Expenditure Line $250,000.00· Eliminate 2.0 FTE Café Manager positions, 1.0 FTE Café 6-hour worker position, 1.0 FTE Café 5-hour
iiiiiiiiworker position (vacant)($143,691.23)
· Adjustments after the FY 2016 Budget Adoption ($47,473.28)
Fund 3 - Food Services Total $243,826.00 Note: The Food Service budget by category includes $9,082,485 plus $433,041, which is coded to the Maintenance budget category for a total of $9,515,526.

EXECUTIVE SUMMARY Financial Information
SCPS FY2017 School Board Approved Budget Page 31
FY13 FY14 FY15 FY16 FY17 $ %
Function/Object Actual Actual Actual Adopted
Budget
Approved
Budget
Variance Change
Actual Actual Actual Adopted Recommended Variance Change1161 COMP OF MAINT EMPLOYEES $ 35,178 $ 36,903 $ 37,514 $ 38,640 $ 39,761 $ 1,121 2.9%
2100 FICA 2,675 2,807 2,854 2,956 3,042 86 2.9%
2210 VRS (PLAN 1 & 2) 2,930 3,760 3,065 3,157 2,632 (525) (16.6%)
2400 GROUP LIFE INSURANCE 419 439 446 460 521 61 13.2%
2500 DISABILITY INS (PLAN 1&2) - - 101 103 85 (18) (17.5%)
Total $ 41,202 $ 43,910 $ 43,981 $ 45,316 $ 46,040 $ 724 1.6%
Actual Actual Actual Adopted Recommended Variance Change3310 REPAIRS TO EQUIPMENT - $ 8,130 $ 1,950 $ 18,000 $ 18,000 $ - 0.0%
6000 MATERIALS & SUPPLIES - - - 70,000 70,000 - 0.0%
6009 REPAIR PARTS/SUPPLIES - 63,618 61,489 49,000 299,000 250,000 510.2%
Total $ - $ 71,747 $ 63,439 $ 137,000 $ 387,000 $ 250,000 182.5%
Actual Actual Actual Adopted Recommended Variance Change1130 COMP-PROF SUPV PERSONNEL $ 722,840 $ 687,906 $ 638,229 $ 700,976 $ 637,239 $ (63,737) (9.1%)
1145 COMP OF CAFETERIA WORKERS 663,256 565,531 582,715 605,621 607,901 2,280 0.4%
1150 COMP OF CLERICAL STAFF 38,115 38,115 35,467 40,399 40,803 404 1.0%
1610 SUPPLEMENTAL PAY 17,987 19,699 19,648 38,000 38,000 - 0.0%
1630 FACILITY USE - OVERTIME - 60 - 1,000 1,000 - 0.0%
1998 BONUS - ONE TIME - 54,000 - - - - 0.0%
2100 FICA 95,568 88,421 81,552 90,540 86,909 (3,631) (4.0%)
2210 VRS (PLAN 1 & 2) 148,489 145,688 142,560 149,657 130,127 (19,530) (13.0%)
2220 VRS (HYBRID) - - - - 5,982 5,982 100.0%
2300 HOSPITALIZATION 541,155 542,446 554,067 572,537 591,229 18,692 3.3%
2301 RETIREE HEALTH INSURANCE 111,211 105,187 107,069 141,615 119,965 (21,650) (15.3%)
2303 RETIREE PRESCRI DRUG PROG 45,493 56,194 62,772 62,073 63,466 1,393 2.2%
2310 DENTAL INSURANCE 42,892 32,674 32,689 33,847 36,465 2,618 7.7%
2311 RETIREE DENTAL INSURANCE 4,868 3,420 3,313 6,297 3,647 (2,650) (42.1%)
2400 GROUP LIFE INSURANCE 16,386 14,825 14,497 15,428 16,146 718 4.7%
2500 DISABILITY INS (PLAN 1&2) - - 4,395 4,640 2,742 (1,898) (40.9%)
2510 DISABILITY INS (HYBRID) - - - - 135 135 100.0%
2750 RETIREE HEALTH CREDIT - - 7,222 7,859 7,526 (333) (4.2%)
2800 RETIREE SICK LEAVE PAY 9,510 7,890 150 14,355 14,355 - 0.0%
2812 ERIP INCENTIVE 6,429 - 10,717 - - - 0.0%
3000 PURCHASED SERVICES 8,958 32,467 24,317 81,524 81,524 - 0.0%
3001 PROFESSIONAL IMPROVEMENT - - 149 - - - 0.0%
3006 WORKER'S COMPENSATION 41,348 38,590 36,711 49,254 49,254 - 0.0%
3015 FEES & RELATED SERVICES 6,327,555 6,125,817 6,119,869 6,407,321 6,481,631 74,310 1.2%
5201 POSTAGE 3,030 - 4,562 6,000 6,000 - 0.0%
5203 TELEPHONE - 324 761 870 870 - 0.0%
5401 LEASE/RENTALS 918 1,477 1,683 2,000 2,000 - 0.0%
5500 TRAVEL 10,163 8,083 9,333 19,400 19,400 - 0.0%
5801 DUES/LICENSES 144 158 119 350 350 - 0.0%
6000 MATERIALS & SUPPLIES 2,655 4,274 1,916 7,320 7,320 - 0.0%
6001 OFFICE SUPPLIES 19,921 15,406 21,231 30,000 30,000 - 0.0%
6008 GASOLINE/OIL/LUBRICANTS - 411 435 500 500 - 0.0%Total $ 8,878,892 $ 8,589,061 $ 8,518,146 $ 9,089,383 $ 9,082,485 $ (6,898) (0.1%)
Grand Total $ 8,920,094 $ 8,704,718 $ 8,625,566 $ 9,271,699 $ 9,515,526 $ 243,826 2.6%
Food Service (Fund 3)
Expenditure Trends by Function and Object
4200 BUILDING SERVICES
4400 EQUIPMENT SERVICES
5100 SCHOOL FOOD SERVICES

EXECUTIVE SUMMARY Financial Information
SCPS FY2017 School Board Approved Budget Page 32
Fund 4 – Regional Adult Education - accounts for the two adult education programs, which are the Rappahannock Area Regional Adult Education (RARAE) Program and the Apprenticeship Education (AE) Program. The FY 2017 Board Approved budget of $775,574 includes the following adjustments:
Description Amount
· Step Increase for all Staff $1,056.69
· VRS Rate Increase - Professional Group from 14.06% to 14.66% $1,058.22
· Retiree Health Credit Rate Increase - Professional Group from 1.06% to 1.11% $88.18
· Group Life Rate Increase from 1.19% to 1.31% $211.66
· Increase Dental Rates by 15% $197.14
· Increase Health Insurance Rates by 5% (employees) and by 11.8% (employer) $2,598.33
· 1% Cost of Living Adjustment (COLA) for all Staff $2,206.43
· Balance Funds and Grants to projected revenues ($78,917.60)
· Adjustments after the FY 2016 Budget Adoption $77,064.95
Fund 4 - Regional Adult Education Total $5,564.00
FY13 FY14 FY15 FY16 FY17 $
Function/Object Actual Actual Actual Adopted
Budget
Approved
Budget
Variance
1100 CLASSROOM INSTRUCTION Actual Actual Actual Adopted
Budget
Recommended
Budget
Variance
1121 COMP OF TEACHERS $ 439,860 $ 474,270 $ 435,482 $ 528,180 $ 541,911 $ 13,7311141 COMP OF TEACHER ASS'TS 5,974 5,709 10,173 10,000 12,042 2,0421150 COMP OF CLERICAL STAFF 43,294 43,290 43,403 61,829 72,388 10,5591350 CLERICAL - PART-TIME 6,111 1,175 4,426 - - -1610 SUPPLEMENTAL PAY - 1,500 1,500 1,500 1,475 (25)2100 FICA 37,355 39,818 37,330 45,256 47,353 2,0972210 VRS (PLAN 1 & 2) 16,390 16,390 17,973 24,056 26,115 2,0592300 HOSPITALIZATION 18,981 17,909 17,459 29,199 24,923 (4,276)2310 DENTAL INSURANCE 1,523 1,039 958 1,642 1,511 (131)2400 GROUP LIFE INSURANCE 1,527 1,527 1,475 2,035 2,334 2992500 DISABILITY INS (PLAN 1&2) - - 317 477 382 (95)2750 RETIREE HEALTH CREDIT - - 1,314 1,812 1,977 1653000 PURCHASED SERVICES 11,505 7,721 7,480 17,724 2,689 (15,035)3001 PROFESSIONAL IMPROVEMENT 6,618 4,523 5,541 6,000 5,130 (870)3013 PEM PPURCHASED SERVICES 5,834 7,065 - - - -3320 MAINTENANCE CONTRACTS 1,881 2,101 1,094 1,448 1,390 (58)5201 POSTAGE 2,121 - - - - -5203 TELEPHONE 768 814 779 960 780 (180)5401 LEASE/RENTALS 2,170 389 396 389 396 75500 TRAVEL 2,719 440 2,001 4,542 4,750 2086000 MATERIALS & SUPPLIES 37,692 45,648 49,859 32,961 28,028 (4,933)8100 REPLACEMENT EQUIPMENT - 7,586 - - - -Total $ 642,323 $ 678,916 $ 638,961 $ 770,010 $ 775,574 5,564
Actual Actual Actual Adopted Recommended Variance5500 TRAVEL - $ 1,868 - - - $ -
Total $ - $ 1,868 $ - $ - $ - -
Grand Total $ 642,323 $ 680,784 $ 638,961 $ 770,010 $ 775,574 $ 5,564
1.8%4.6%
(15.0%)0.0%0.7%
(4.0%)0.0%
(18.8%)
0.0%
0.0%
0.7%
(14.6%)(8.0%)14.7%
(19.9%)9.1%
1410 OFFICE OF THE PRINCIPAL Change
(84.8%)(14.5%)
0.0%
20.4%17.1%
0.0%(1.7%)
4.6%8.6%
%
Change
Change
2.6%

EXECUTIVE SUMMARY Financial Information
SCPS FY2017 School Board Approved Budget Page 33
Fund 7 – Fleet Service - provides for the day-to-day operations of the Joint Fleet Maintenance Facility with the County. The FY 2017 Board Approved budget of $2,618,067 includes various adjustments, as illustrated below.
Description Amount
· Frozen Steps Adjusted by a 1% Increase $1,648.10
· Step Increase for all Staff $19,249.22
· VRS Rate Increase - Professional Group from 14.06% to 14.66% $1,312.78
· Retiree Health Credit Rate Increase - Professional Group from 1.06% to 1.11% $109.40
· VRS Rate Decrease - Non-Professional Group from 8.17% to 6.62% ($10,945.77)
· Group Life Rate Increase from 1.19% to 1.31% $1,109.97
· Increase Dental Rates by 15% $1,774.51
· Increase Health Insurance Rates by 5% for employees and by 11.8% for the employer $2,842.72
· Balance Fund to Projected Revenues ($71,520.00)
· 1% Cost of Living Adjustment (COLA) for all Staff $10,932.13
· Increase Fleet Service Revenues by 1.32% for a $1/hour increase in labor rates, increase respective
……..expense lines for the Scjhool maintenance, School transportation departments and County depts $6,986.00
· Increase Fleet Service Expenditure Repair Parts account line to balance to new revenues from the
……..maintenance and transportation departments$26,926.00
· Adjustments after the FY 2016 Budget Adoption $43,486.94
Fund 7 - Fleet Service Total $33,912.00

EXECUTIVE SUMMARY Financial Information
SCPS FY2017 School Board Approved Budget Page 34
FY13 FY14 FY15 FY16 FY17 $
Function/Object Actual Actual Actual Adopted
Budget
Approved
Budget
Variance
3400 VEHICLE MAINTENANCE SVCS Actual Actual Actual Adopted Recommended Variance1110 COMP OF DIRECTORS $ 107,004 $ 107,222 $ 109,052 $ 112,324 $ 114,244 $ 1,920
1150 COMP OF CLERICAL STAFF 73,251 62,073 60,640 70,273 84,942 14,669
1165 COMP OF MECHANICS 620,658 640,653 662,431 701,582 735,792 34,210
1260 COMP OF MECHANICS - O/T 49 939 568 3,500 3,500 -
1600 COMP - SUPPLEMENTS - - - 6,200 6,200 -
1998 BONUS - ONE TIME - 16,200 - - - -
2100 FICA 56,821 58,667 59,635 64,146 67,433 3,287
2210 VRS (PLAN 1 & 2) 75,800 86,576 74,171 78,672 68,334 (10,338)
2220 VRS (HYBRID) - 2,298 7,583 6,241 11,280 5,039
2300 HOSPITALIZATION 168,891 183,984 173,937 181,668 220,026 38,358
2301 RETIREE HEALTH INSURANCE 21,284 24,295 28,364 21,615 29,120 7,505
2310 DENTAL INSURANCE 14,003 11,974 10,406 10,844 13,605 2,761
2311 RETIREE DENTAL INSURANCE 1,532 1,373 1,396 1,826 1,826 -
2400 GROUP LIFE INSURANCE 9,531 9,820 9,969 10,513 12,239 1,726
2500 DISABILITY INS (PLAN 1&2) - - 2,024 2,224 1,636 (588)
2510 DISABILITY INS (HYBRID) - 97 306 252 562 310
2750 RETIREE HEALTH CREDIT - - 2,228 2,288 2,453 165
2800 RETIREE SICK LEAVE PAY - - 7,140 - - -
2810 ANNUAL LEAVE PAYOFF 4,690 4,626 18,443 4,690 4,690 -
2812 ERIP INCENTIVE - - 14,438 - - -
3000 PURCHASED SERVICES 18,350 23,239 51,686 24,500 54,500 30,000
3001 PROFESSIONAL IMPROVEMENT 2,138 202 50 2,804 2,804 -
3002 PRINTING/BINDING 292 - - - - -
3017 UNIFORM RENTALS 3,426 3,694 3,610 4,500 4,500 -
3310 REPAIRS TO EQUIPMENT 10,622 9,093 1,338 3,500 3,500 -
3320 MAINTENANCE CONTRACTS 12,614 12,992 13,382 13,000 13,000 -
5101 ELECTRICITY 66,308 67,340 74,178 70,000 80,500 10,500
5102 FUEL OIL/GAS 14,140 26,720 8,921 15,000 15,000 -
5103 WATER/SEWAGE FEES 3,569 3,741 4,383 4,389 4,389 -
5203 TELEPHONE 702 980 1,030 893 1,043 150
5309 FLEET INSURANCE 1,550 1,366 1,127 1,500 1,500 -
5401 LEASE/RENTALS 41,631 742 749 22,300 2,300 (20,000)
5500 TRAVEL - - 69 100 100 -
5801 DUES/LICENSES - 475 479 479 489 10
6001 OFFICE SUPPLIES 1,285 1,561 1,476 1,500 1,500 -
6008 GASOLINE/OIL/LUBRICANTS 8,852 8,770 7,227 10,000 10,000 -
6009 REPAIR PARTS/SUPPLIES 611,439 653,086 656,414 762,801 697,688 (65,113)
6012 OTHER OPERATING SUPPLIES 10,387 11,438 7,901 9,996 9,996 -
6015 COMPUTER SUPPL/SOFTWARE 975 1,025 2,745 3,742 3,742 -
6017 UNIFORMS 1,556 978 1,448 1,000 1,000 -
6028 TIRES & TUBES - NEW 143,632 180,113 184,295 160,000 160,000 -
6029 TIRES - RECAPPED 56,305 49,930 75,858 60,000 60,000 -
6030 CLEANING SUPPLIES 1,363 1,900 1,824 1,500 1,500 -
6049 FLUIDS/LUBRICANTS 60,868 71,341 63,691 70,000 60,000 (10,000)
6500 DONATIONS-SPECIAL PROGRAM 497 - 233 264 264 -
8100 REPLACEMENT EQUIPMENT - 924 - 37,271 38,225 954
8200 NEW EQUIPMENT - - - 24,258 12,644 (11,614)
Grand Total $ 2,226,016 $ 2,342,447 $ 2,406,847 $ 2,584,155 $ 2,618,067 $ 33,912
%
Change
Change1.7%
20.9%
4.9%
0.0%
0.0%
0.0%
5.1%
(13.1%)
80.7%
21.1%
34.7%
25.5%
0.0%
0.0%
16.4%
(26.4%)
123.1%
7.2%
0.0%
0.0%
15.0%
0.0%
0.0%
16.8%
0.0%
0.0%
122.4%
0.0%
0.0%
0.0%
0.0%
(14.3%)
0.0%
2.6%
(89.7%)
0.0%
2.1%
0.0%
0.0%
(47.9%)
1.3%
Joint Fleet Maintenance Services (Fund 7)
Expenditure Trends by Function and Object
0.0%
0.0%
0.0%
0.0%
0.0%
(8.5%)
0.0%

EXECUTIVE SUMMARY Financial Information
SCPS FY2017 School Board Approved Budget Page 35
Expenditure Highlights The FY 2017 School Board Approved Expenditure Budget is $314,806,654. Expenditure Adjustments by Category This Approved budget includes nine major expenditure categories: instruction, administration (which includes administrative personnel as well as attendance and health services personnel), transportation services, fleet services, maintenance services, capital projects, technology, debt service, and food services. Instruction The approved instruction expenditure budget by category is $190,955,120 or 60.7% of the budget. The net increase is $12,053,711 or 6.7%. The total instruction budget includes: Fund 1 ($2,015,692), Fund 2 ($1,046,409), Fund 4 ($775,574), and Fund 5 ($187,117,445). Administrative Services/Attendance/Health and Psychological Services The approved administration expenditure budget by category is $10,437,696, which reflects a net increase of $641,831 or 6.6%. Transportation Services The approved transportation/fleet combined expenditure budget by category is $20,324,383, which includes an increase of $515,124 or 2.6%. The total transportation budget includes: Fund 1 ($3,700), Fund 5 ($17,702,617) and Fund 7 ($2,618,067). Maintenance Services The approved maintenance expenditure budget by category is $21,866,796 which reflects an increase of $380,105 or 1.8%. The total transportation budget includes: Fund 5 ($21,764,027) and Other Funds of ($102,769).
Food Services The approved food service expenditure budget by category is $9,082,485, which includes a decrease of ($6,898) or (0.1%). The total Food Service budget includes $9,082,485 plus $433,041, which is coded to the Maintenance budget category for a total of $9,515,526. Capital Projects The approved capital projects budget is $27,611,024, which includes a $8,981,499 increase or 48.2%. This increase is due to the division’s planning to address deferred capital maintenance, transportation, and technology purchases as well as purchasing needed items in alignment with the school division’s capital improvement plan and division-wide strategic plan. Technology Services The approved FY 2017 technology services expenditure budget by category is $8,606,220, which reflects a $1,007,466 net increase or 13.3%. The total technology budget includes: Fund 1 ($146,687) and Fund 5 ($8,459,532). Debt Service The approved budget for debt service is $25,922,930, which includes a $2,706,628 increase or 11.7%, due primarily to the issuance of new debt on bonds to fund the approved CIP.

EXECUTIVE SUMMARY Financial Information
SCPS FY2017 School Board Approved Budget Page 36
Expenditure Highlights (continued)

EXECUTIVE SUMMARY Financial Information
SCPS FY2017 School Board Approved Budget Page 37
Fund 5 – Operating – Instruction - provides for the day-to-day teaching and learning of the school division. The FY17 Approved Budget of $187,117,445 (Fund 5 Only) includes the adjustments seen below:
Description Amount
· Frozen Steps Adjusted by a 1% Increase $102,528.45
· Step Increase for all Staff $2,633,070.97
· VRS Rate Increase Professional Group from 14.06% to 14.66% $685,300.92
· Retiree Health Credit Rate Increase Professional Group from 1.06% to 1.11% $57,108.57
· Group Life Rate Increase from 1.19% to 1.31% $137,060.98
· Add Café Monitors (2 per elementary school x 3 hours per day x $9.50 per hour) $187,763.13
· Remove Bridges Grant and FTE Until Funded by the BOS ($113,137.42)
· Increase Dental Rates by 15% $163,619.09
· Increase Health Rates 5% for employees and 11.8% for employer $2,171,329.87
· 1% COLA $1,429,987.93
· Fully restore Supplements to previous level $78,905.21
· Adjustments to Retiree Prescription, Health, and Dental due to Increase in FY16 Budget and FY17
……..Projected Increase$742,381.00
· 10 FTEs Middle School Teachers $638,658.00
· Elementary Library Liaison Supplement $3,748.17
· 2.0 FTE ESOL Teachers $127,731.60
· Increase ESOL Purchased Service line for language services to fill interpretative gap in case of emergency $25,000.00
· Increase expense for Virtual Summer School Program by $25,000 and increase Summer School
……..revenue by $25,000 (net zero)$25,000.00
· EMS Support at HS Football games $15,000.00
· 1.0 FTE Social Worker $67,434.07
· 1.0 FTE Speech Therapist $70,738.68
· 1.0 FTE Autism Coordinator $72,888.88
· 1.0 FTE ID/Mild Teachers and 2.0 FTE ID Mild Paraeducators – Middle School $133,008.50
· 1.0 FTE Autism Teacher and 2.0 FTE Autism Paraeducator $133,008.50
· 4.0 FTE ECSE Teachers and 8.0 ECSE Paraeducators $532,034.00
· Increase Assistive Technology line due to increase in students requiring assistive technology $50,000.00
· Increase Travel in SPED area due to increase of staff $20,000.00
· Increase SPED Materials & Supplies $100,000.00
· Increase local Purchased Services for Speech due to not being able to fund in VI-B grant $199,872.00
· Eliminate Vacant Title II Math Specialist ($75,602.57)
· Balance Grants to projected revenues $53,839.48
· Adjustments after the FY 2016 Budget Adoption $1,487,685.99
Fund 5 - Instruction Total $11,955,964.00

EXECUTIVE SUMMARY Financial Information
SCPS FY2017 School Board Approved Budget Page 38
FY13 FY14 FY15 FY16 FY17 $ %
Function/Object Actual Actual Actual Adopted
Budget
Approved
Budget
Variance Change
Actual Actual Actual Adopted Recommended Variance Change1121 COMP OF TEACHERS $ 80,805,657 $ 80,344,034 $ 81,964,583 $ 84,843,641 $ 87,667,570 $ 2,823,929 3.3%1123 COORDINATOR 244,681 200,392 214,801 162,355 162,736 381 0.2%1139 COMP OF THERAPISTS 45,801 45,801 3,627 - - - 0.0%1141 COMP OF TEACHER ASS'TS 6,622,169 6,977,562 7,595,877 7,661,428 7,698,613 37,185 0.5%1142 COMP-HEALTH/SAFETY OFFICE 245,638 253,270 269,332 276,477 271,656 (4,821) (1.7%)1147 EDUCATIONAL DIAGNOSTICIAN 138,934 139,483 89,371 64,393 66,664 2,271 3.5%1150 COMP OF CLERICAL STAFF 20,783 2,580 2,667 5,297 2,550 (2,747) (51.9%)1520 COMP OF SUB TEACHERS 1,665,434 1,518,975 1,644,462 1,947,063 1,946,563 (500) 0.0%1535 CAFETERIA MONITORS - - - - 174,420 174,420 100.0%1600 COMP - SUPPLEMENTS 1,256,073 1,271,378 1,102,278 1,157,905 1,241,688 83,783 7.2%1610 SUPPLEMENTAL PAY 413,134 316,010 311,211 355,038 381,714 26,676 7.5%1620 NON-CONTRACTED COMP - 175 - - - - 0.0%1650 NATIONAL BOARD TCHR BONUS - - 270,821 254,203 204,505 (49,698) (19.6%)1998 BONUS - ONE TIME - 1,686,645 - - - - 0.0%2100 FICA 6,643,364 6,701,042 6,784,141 7,125,269 7,230,074 104,805 1.5%2210 VRS (PLAN 1 & 2) 11,210,119 11,101,218 12,319,305 12,675,162 12,550,875 (124,287) (1.0%)2220 VRS (HYBRID) - 1,302 462,483 433,941 1,353,789 919,848 212.0%2300 HOSPITALIZATION 16,472,652 16,662,783 15,392,256 12,796,034 18,055,415 5,259,381 41.1%2301 RETIREE HEALTH INSURANCE 1,750,318 1,811,570 2,847,953 1,830,953 1,835,071 4,118 0.2%2310 DENTAL INSURANCE 1,091,398 876,444 881,494 922,577 1,082,763 160,186 17.4%2311 RETIREE DENTAL INSURANCE 111,132 91,436 83,320 105,279 80,024 (25,255) (24.0%)2400 GROUP LIFE INSURANCE 1,043,517 1,031,313 1,049,074 1,108,946 1,242,503 133,557 12.0%2402 OPTIONAL GROUP LIFE 549 - - - - - 0.0%2500 DISABILITY INS (PLAN 1&2) - - 230,498 243,900 183,997 (59,903) (24.6%)2510 DISABILITY INS (HYBRID) - 35 10,535 10,042 30,474 20,432 203.5%2750 RETIREE HEALTH CREDIT - - 934,394 987,798 1,052,808 65,010 6.6%2800 RETIREE SICK LEAVE PAY 73,875 81,690 212,613 69,957 69,957 - 0.0%2811 MAKE WHOLE PROVISION 492 262 - - - - 0.0%2812 ERIP INCENTIVE 657,045 - 1,434,883 - - - 0.0%3000 PURCHASED SERVICES 1,023,682 1,276,926 1,351,485 1,304,793 1,298,759 (6,034) (0.5%)3001 PROFESSIONAL IMPROVEMENT 69,735 76,441 69,350 67,261 95,828 28,567 42.5%3002 PRINTING/BINDING 1,332 1,257 493 1,000 1,000 - 0.0%3006 WORKER'S COMPENSATION 263,642 246,060 191,592 257,055 257,055 - 0.0%3008 STAFF TRAINING 231 - - 612 612 - 0.0%3320 MAINTENANCE CONTRACTS 761 1,166 698 - 652 652 100.0%5203 TELEPHONE 1,278 821 1,465 2,432 1,936 (496) (20.4%)5401 LEASE/RENTALS 11,831 12,253 9,548 9,059 9,059 - 0.0%5500 TRAVEL 46,775 40,123 40,133 70,274 94,972 24,698 35.1%5807 MISC. FEES/CHARGES - - - 225,000 225,000 - 0.0%6000 MATERIALS & SUPPLIES 2,119,169 2,133,720 2,111,437 1,935,652 2,090,041 154,389 8.0%6001 OFFICE SUPPLIES 3,285 2,926 4,241 1,106 1,106 - 0.0%6002 TEXTBOOKS 164,641 112,358 149,613 184,106 184,106 - 0.0%6004 MEDICAL & DENTAL SUPPLIES 18,010 18,482 18,280 18,535 18,453 (82) (0.4%)6014 ATHLETIC SUPPLIES 68,435 65,134 49,108 44,692 44,767 75 0.2%6034 ASSISTIVE TECHNOLOGY 4,199 5,163 7,189 7,300 57,300 50,000 684.9%6036 COMPUTER SUPPLIES 152,954 135,125 143,670 111,801 114,751 2,950 2.6%6042 PARENT EDUCATION SUPPLIES 21,708 6,687 10,335 - - - 0.0%6045 BAND SUPPLIES 58,280 51,981 50,020 49,102 49,595 493 1.0%6046 ACADEMIC ACTIVITIES SUPP 20,297 25,660 30,256 20,599 30,793 10,194 49.5%6060 FOOD 7,704 6,565 8,381 - 1,000 1,000 100.0%6100 STRINGS PROGRAM SUPPLIES 39,640 36,168 34,223 34,006 34,444 438 1.3%6102 SUPPLEMENTAL MATERIALS 50,366 43,791 35,083 55,744 51,711 (4,033) (7.2%)6104 CHORUS PROGRAM 16,877 14,491 14,170 13,926 13,691 (235) (1.7%)6151 ATHLETIC TRAINER SUPPLIES 7,905 13,889 8,473 8,466 8,466 - 0.0%8100 REPLACEMENT EQUIPMENT 24,334 23,606 - 13,258 13,258 - 0.0%8200 NEW EQUIPMENT 13,995 28,005 37,966 18,675 18,675 - 0.0%Total $ 134,723,831 $ 135,494,198 $ 140,489,188 $ 139,492,112 $ 149,303,459 $ 9,811,347 7.0%
Operating Fund (5) - Instruction
Expenditure Trends by Function and Object (1100)
1100 CLASSROOM INSTRUCTION

EXECUTIVE SUMMARY Financial Information
SCPS FY2017 School Board Approved Budget Page 39
FY13 FY14 FY15 FY16 FY17 $ %
Function/Object Actual Actual Actual Adopted
Budget
Approved
Budget
Variance Change
Actual Actual Actual Adopted Recommended Variance Change1121 COMP OF TEACHERS $ 3,486,696 $ 3,332,431 $ 3,388,758 $ 3,511,306 $ 3,547,327 $ 36,021 1.0%1123 COORDINATOR 78,306 78,306 81,068 83,501 86,444 2,943 3.5%1124 COMP OF INST SUPERVISORS 89,222 89,222 90,906 93,634 95,391 1,757 1.9%1150 COMP OF CLERICAL STAFF 499,984 500,124 510,675 526,908 544,183 17,275 3.3%1520 COMP OF SUB TEACHERS 16,913 20,679 13,350 - - - 0.0%1998 BONUS - ONE TIME - 84,600 - - - - 0.0%2100 FICA 303,973 297,052 295,483 307,930 311,845 3,915 1.3%2210 VRS (PLAN 1 & 2) 530,492 512,613 579,033 586,380 588,687 2,307 0.4%2220 VRS (HYBRID) - - 12,407 6,719 37,785 31,066 462.4%2300 HOSPITALIZATION 534,741 582,803 611,767 606,327 684,271 77,944 12.9%2301 RETIREE HEALTH INSURANCE 80,874 68,930 68,736 86,173 58,885 (27,288) (31.7%)2310 DENTAL INSURANCE 41,797 35,231 35,544 34,997 40,624 5,627 16.1%2311 RETIREE DENTAL INSURANCE 4,427 2,719 2,656 6,652 1,824 (4,828) (72.6%)2400 GROUP LIFE INSURANCE 49,435 47,769 48,538 50,162 55,981 5,819 11.6%2500 DISABILITY INS (PLAN 1&2) - - 10,582 10,981 8,574 (2,407) (21.9%)2510 DISABILITY INS (HYBRID) - - 282 158 851 693 438.3%2750 RETIREE HEALTH CREDIT - - 43,237 44,684 47,434 2,750 6.2%2800 RETIREE SICK LEAVE PAY - 3,848 12,045 - - - 0.0%2812 ERIP INCENTIVE - - 95,861 - - - 0.0%6016 TESTING MATERIALS 31,460 27,748 29,525 25,141 25,141 - 0.0%Total $ 5,748,320 $ 5,684,075 $ 5,930,453 $ 5,981,653 $ 6,135,247 $ 153,594 2.6%
Actual Actual Actual Adopted Recommended Variance Change1110 COMP OF DIRECTORS - - - $ 105,490 $ 107,289 $ 1,799 1.7%1124 COMP OF INST SUPERVISORS 87,657 87,657 89,324 - - - 0.0%1134 COMP OF SOCIAL WORKERS 801,965 774,830 842,162 933,735 1,175,595 241,860 25.9%1600 COMP - SUPPLEMENTS 2,116 2,116 2,116 2,116 2,116 - 0.0%1610 SUPPLEMENTAL PAY 2,949 2,913 7,427 6,582 6,582 - 0.0%2100 FICA 64,572 62,405 67,438 75,915 93,493 17,578 23.2%2210 VRS (PLAN 1 & 2) 113,875 109,338 126,314 140,226 160,852 20,626 14.7%2220 VRS (HYBRID) - - 8,758 6,290 27,529 21,239 337.7%2300 HOSPITALIZATION 138,961 139,095 158,109 171,323 228,728 57,405 33.5%2310 DENTAL INSURANCE 11,060 8,435 9,338 10,024 13,793 3,769 37.6%2400 GROUP LIFE INSURANCE 10,612 10,199 11,085 12,392 16,833 4,441 35.8%2500 DISABILITY INS (PLAN 1&2) - - 2,318 2,680 2,343 (337) (12.6%)2510 DISABILITY INS (HYBRID) - - 207 148 620 472 318.7%2750 RETIREE HEALTH CREDIT - - 9,874 11,038 14,264 3,225 29.2%2810 ANNUAL LEAVE PAYOFF 1,069 1,060 1,085 - - - 0.0%3000 PURCHASED SERVICES 103,624 82,612 158,316 164,807 170,034 5,227 3.2%3001 PROFESSIONAL IMPROVEMENT 2,705 510 1,820 2,305 2,306 1 0.0%3600 ADVERTISING - 252 - 648 500 (148) (22.8%)5203 TELEPHONE 747 - - 908 500 (408) (44.9%)5500 TRAVEL 5,524 9,927 10,642 8,668 8,568 (100) (1.2%)5801 DUES/LICENSES 53 - - 347 200 (147) (42.4%)6000 MATERIALS & SUPPLIES 17,692 32,996 17,254 28,803 24,479 (4,324) (15.0%)Total $ 1,365,181 $ 1,324,345 $ 1,523,587 $ 1,684,445 $ 2,056,624 $ 372,178 22.1%
Actual Actual Actual Adopted Recommended Variance Change1121 COMP OF TEACHERS $ 75,059 - - - - $ - 0.0%1321 COMP OF HOMEBOUND TCHRS 142,769 161,875 194,289 117,348 117,348 - 0.0%2100 FICA 16,466 12,336 14,805 8,977 8,977 - 0.0%2210 VRS (PLAN 1 & 2) 9,585 - - - - - 0.0%2300 HOSPITALIZATION 6,494 - - - - - 0.0%2310 DENTAL INSURANCE 417 - - - - - 0.0%2400 GROUP LIFE INSURANCE 893 - - - - - 0.0%5500 TRAVEL 5,090 4,048 5,930 8,703 8,703 - 0.0%6000 MATERIALS & SUPPLIES 749 - - 754 754 - 0.0%Total $ 257,522 $ 178,259 $ 215,024 $ 135,782 $ 135,782 $ 0 0.0%
Operating Fund (5) - Instruction
Expenditure Trends by Function and Object (1210-1230)
1210 GUIDANCE SERVICES
1220 SCHOOL SOCIAL WORKERS SVC
1230 HOMEBOUND INSTRUCTION

EXECUTIVE SUMMARY Financial Information
SCPS FY2017 School Board Approved Budget Page 40
FY13 FY14 FY15 FY16 FY17 $ %
Function/Object Actual Actual Actual Adopted
Budget
Approved
Budget
Variance Change
Actual Actual Actual Adopted Recommended Variance Change1110 COMP OF DIRECTORS $ 464,155 $ 450,883 $ 538,060 $ 607,649 $ 630,218 $ 22,569 3.7%1113 COMP OF ASST SUPTS 132,718 132,718 134,985 139,036 143,050 4,014 2.9%1115 TRAVEL ALLOWANCE 4,200 4,200 4,200 4,200 4,200 - 0.0%1117 SPECIALISTS 52,820 52,820 53,907 55,525 57,484 1,959 3.5%1121 COMP OF TEACHERS 311,520 561,229 655,472 783,268 768,020 (15,249) (1.9%)1123 COORDINATOR 419,790 227,972 250,007 257,419 407,948 150,529 58.5%1124 COMP OF INST SUPERVISORS 524,509 70,965 90,115 92,819 94,571 1,752 1.9%1141 COMP OF TEACHER ASS'TS 25,275 25,275 4,827 27,053 - (27,053) (100.0%)1150 COMP OF CLERICAL STAFF 532,001 547,282 577,878 581,299 615,627 34,328 5.9%1520 COMP OF SUB TEACHERS 8,967 7,041 893 32,385 17,545 (14,840) (45.8%)1600 COMP - SUPPLEMENTS 19,809 13,253 11,638 11,638 11,638 - 0.0%1610 SUPPLEMENTAL PAY 298,868 259,824 363,264 429,680 429,680 - 0.0%1998 BONUS - ONE TIME - 87,750 - - - - 0.0%2100 FICA 205,190 176,673 193,624 222,658 234,404 11,746 5.3%2210 VRS (PLAN 1 & 2) 315,286 257,507 325,360 357,761 390,035 32,274 9.0%2220 VRS (HYBRID) - - - - 7,998 7,998 100.0%2300 HOSPITALIZATION 246,816 257,345 278,310 318,671 364,940 46,269 14.5%2301 RETIREE HEALTH INSURANCE 159,762 176,836 222,119 141,693 768,033 626,340 442.0%2303 RETIREE PRESCRI DRUG PROG 320,192 426,521 526,703 448,383 604,607 156,224 34.8%2310 DENTAL INSURANCE 19,983 15,990 16,433 18,715 21,823 3,108 16.6%2311 RETIREE DENTAL INSURANCE 9,620 8,706 10,528 10,721 38,448 27,727 258.6%2400 GROUP LIFE INSURANCE 29,469 24,003 26,702 30,258 35,568 5,310 17.5%2500 DISABILITY INS (PLAN 1&2) - - 5,761 6,661 5,713 (948) (14.2%)2510 DISABILITY INS (HYBRID) - - - 57 180 123 215.9%2750 RETIREE HEALTH CREDIT - - 23,785 26,956 30,138 3,182 11.8%2800 RETIREE SICK LEAVE PAY 18,030 7,650 22,208 2,880 2,880 - 0.0%2810 ANNUAL LEAVE PAYOFF 110,872 3,364 1,974 111,941 111,941 - 0.0%2812 ERIP INCENTIVE 122,009 - 69,860 - - - 0.0%3000 PURCHASED SERVICES 804,998 887,764 842,542 703,078 758,478 55,400 7.9%3001 PROFESSIONAL IMPROVEMENT 228,791 185,451 329,066 284,137 329,862 45,725 16.1%3002 PRINTING/BINDING 942 4,659 576 6,500 6,800 300 4.6%3009 STUDENT TRAINING - - - 101 101 - 0.0%3015 FEES & RELATED SERVICES 13,000 8,000 11,581 19,605 19,605 - 0.0%3130 PROFESSIONAL SERVICES 700 - - - - - 0.0%3180 LEGAL FEES 49,321 26,570 25,768 44,514 44,514 - 0.0%3320 MAINTENANCE CONTRACTS 11,250 11,190 11,373 12,045 12,045 - 0.0%3420 IN-LIEU-OF TRANSPORTATION 9,126 12,850 - 17,883 17,883 - 0.0%3600 ADVERTISING - - - 244 244 - 0.0%3840 REGIONAL TUITION 930,522 1,367,131 1,461,523 1,947,794 1,947,794 - 0.0%5201 POSTAGE 4,597 4,880 5,586 - - - 0.0%5203 TELEPHONE 1,215 25 - 425 425 - 0.0%5302 UNEMPLOYMENT COMP INS 20,227 7,280 155 18,208 18,208 - 0.0%5401 LEASE/RENTALS 3,398 3,294 3,641 6,221 6,221 - 0.0%5500 TRAVEL 17,943 8,288 9,811 33,121 31,621 (1,500) (4.5%)5801 DUES/LICENSES - - 763 536 2,210 1,674 312.3%5810 MEMBERSHIPS (PROGRAMS) 1,988 245 814 12,124 13,124 1,000 8.2%5811 MEMBERSHIPS (DIVISION) 44,064 25,415 46,015 41,000 59,500 18,500 45.1%6000 MATERIALS & SUPPLIES 76,062 126,814 131,740 121,786 102,397 (19,389) (15.9%)6001 OFFICE SUPPLIES 18,102 19,703 15,665 21,741 21,741 - 0.0%6011 LIBRARY BOOKS & SUPPLIES 174,053 76,997 79,033 84,454 86,217 1,763 2.1%6042 PARENT EDUCATION SUPPLIES 2,477 1,384 1,228 1,500 1,500 - 0.0%6082 INSTRUCTIONAL SUPERVISION 74,556 - - - - - 0.0%6093 INSTRUCT PROGRAM SUPPLIES 101,572 935,692 868,573 19,000 17,000 (2,000) (10.5%)6094 ELEM PROGRAM SUPPLIES 45,471 - - - - - 0.0%6095 GUIDANCE SUPPLIES 263 - - - - - 0.0%6098 PROGRAM EVAL SUPPLIES 60 - - - - - 0.0%6101 TESTING SUPPLIES 18,271 12,329 12,109 15,436 15,436 - 0.0%6153 SOCIAL STUDIES SUPPLIES 8,266 - - - - - 0.0%6155 HEALTH & PE SUPPLIES 56 - - - - - 0.0%6500 DONATIONS-SPECIAL PROGRAM 694 - - 11,178 12,178 1,000 8.9%Total $ 7,013,846 $ 7,521,768 $ 8,266,175 $ 8,141,957 $ 9,321,793 $ 1,179,835 14.5%
1310 IMPROVEMT OF INSTRUCTION
Operating Fund (5) - Instruction
Expenditure Trends by Function and Object (1310)
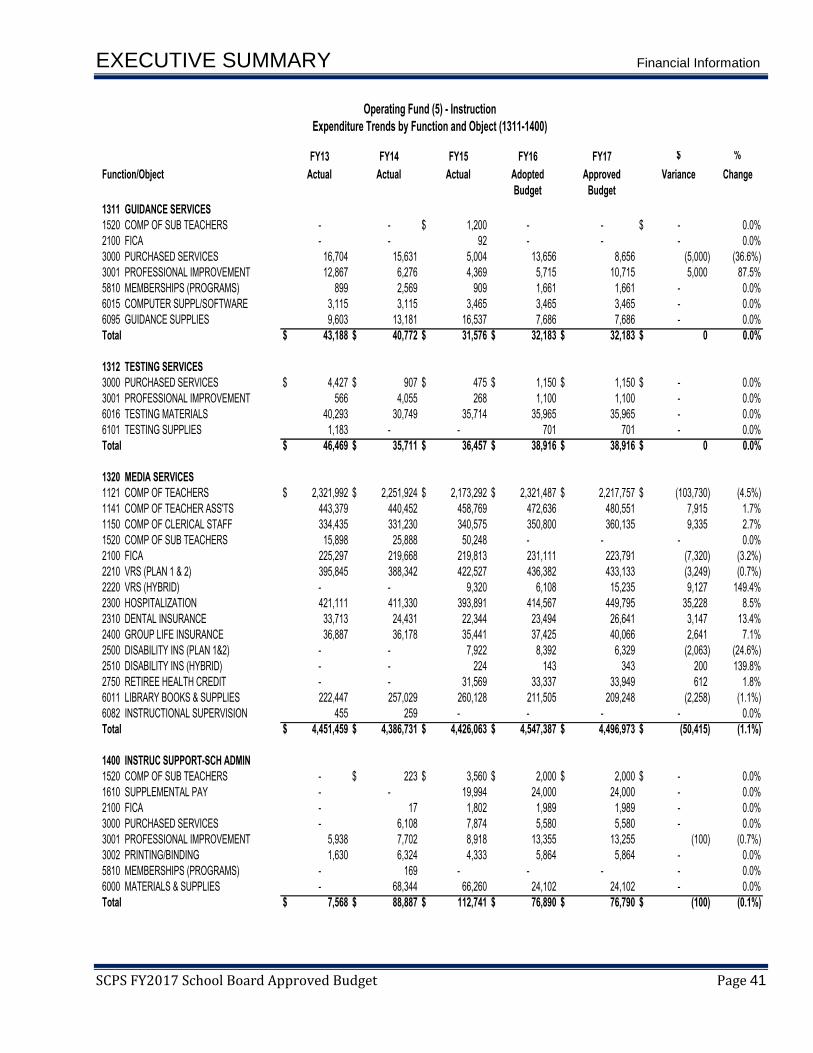
EXECUTIVE SUMMARY Financial Information
SCPS FY2017 School Board Approved Budget Page 41
FY13 FY14 FY15 FY16 FY17 $ %
Function/Object Actual Actual Actual Adopted
Budget
Approved
Budget
Variance Change
Actual Actual Actual Adopted Recommended Variance Change1520 COMP OF SUB TEACHERS - - $ 1,200 - - $ - 0.0%
2100 FICA - - 92 - - - 0.0%
3000 PURCHASED SERVICES 16,704 15,631 5,004 13,656 8,656 (5,000) (36.6%)
3001 PROFESSIONAL IMPROVEMENT 12,867 6,276 4,369 5,715 10,715 5,000 87.5%
5810 MEMBERSHIPS (PROGRAMS) 899 2,569 909 1,661 1,661 - 0.0%
6015 COMPUTER SUPPL/SOFTWARE 3,115 3,115 3,465 3,465 3,465 - 0.0%
6095 GUIDANCE SUPPLIES 9,603 13,181 16,537 7,686 7,686 - 0.0%
Total $ 43,188 $ 40,772 $ 31,576 $ 32,183 $ 32,183 $ 0 0.0%
Actual Actual Actual Adopted Recommended Variance Change3000 PURCHASED SERVICES $ 4,427 $ 907 $ 475 $ 1,150 $ 1,150 $ - 0.0%
3001 PROFESSIONAL IMPROVEMENT 566 4,055 268 1,100 1,100 - 0.0%
6016 TESTING MATERIALS 40,293 30,749 35,714 35,965 35,965 - 0.0%
6101 TESTING SUPPLIES 1,183 - - 701 701 - 0.0%
Total $ 46,469 $ 35,711 $ 36,457 $ 38,916 $ 38,916 $ 0 0.0%
Actual Actual Actual Adopted Recommended Variance Change1121 COMP OF TEACHERS $ 2,321,992 $ 2,251,924 $ 2,173,292 $ 2,321,487 $ 2,217,757 $ (103,730) (4.5%)
1141 COMP OF TEACHER ASS'TS 443,379 440,452 458,769 472,636 480,551 7,915 1.7%
1150 COMP OF CLERICAL STAFF 334,435 331,230 340,575 350,800 360,135 9,335 2.7%
1520 COMP OF SUB TEACHERS 15,898 25,888 50,248 - - - 0.0%
2100 FICA 225,297 219,668 219,813 231,111 223,791 (7,320) (3.2%)
2210 VRS (PLAN 1 & 2) 395,845 388,342 422,527 436,382 433,133 (3,249) (0.7%)
2220 VRS (HYBRID) - - 9,320 6,108 15,235 9,127 149.4%
2300 HOSPITALIZATION 421,111 411,330 393,891 414,567 449,795 35,228 8.5%
2310 DENTAL INSURANCE 33,713 24,431 22,344 23,494 26,641 3,147 13.4%
2400 GROUP LIFE INSURANCE 36,887 36,178 35,441 37,425 40,066 2,641 7.1%
2500 DISABILITY INS (PLAN 1&2) - - 7,922 8,392 6,329 (2,063) (24.6%)
2510 DISABILITY INS (HYBRID) - - 224 143 343 200 139.8%
2750 RETIREE HEALTH CREDIT - - 31,569 33,337 33,949 612 1.8%
6011 LIBRARY BOOKS & SUPPLIES 222,447 257,029 260,128 211,505 209,248 (2,258) (1.1%)
6082 INSTRUCTIONAL SUPERVISION 455 259 - - - - 0.0%
Total $ 4,451,459 $ 4,386,731 $ 4,426,063 $ 4,547,387 $ 4,496,973 $ (50,415) (1.1%)
Actual Actual Actual Adopted Recommended Variance Change1520 COMP OF SUB TEACHERS - $ 223 $ 3,560 $ 2,000 $ 2,000 $ - 0.0%
1610 SUPPLEMENTAL PAY - - 19,994 24,000 24,000 - 0.0%
2100 FICA - 17 1,802 1,989 1,989 - 0.0%
3000 PURCHASED SERVICES - 6,108 7,874 5,580 5,580 - 0.0%
3001 PROFESSIONAL IMPROVEMENT 5,938 7,702 8,918 13,355 13,255 (100) (0.7%)
3002 PRINTING/BINDING 1,630 6,324 4,333 5,864 5,864 - 0.0%
5810 MEMBERSHIPS (PROGRAMS) - 169 - - - - 0.0%
6000 MATERIALS & SUPPLIES - 68,344 66,260 24,102 24,102 - 0.0%
Total $ 7,568 $ 88,887 $ 112,741 $ 76,890 $ 76,790 $ (100) (0.1%)
Operating Fund (5) - Instruction
Expenditure Trends by Function and Object (1311-1400)
1311 GUIDANCE SERVICES
1312 TESTING SERVICES
1320 MEDIA SERVICES
1400 INSTRUC SUPPORT-SCH ADMIN
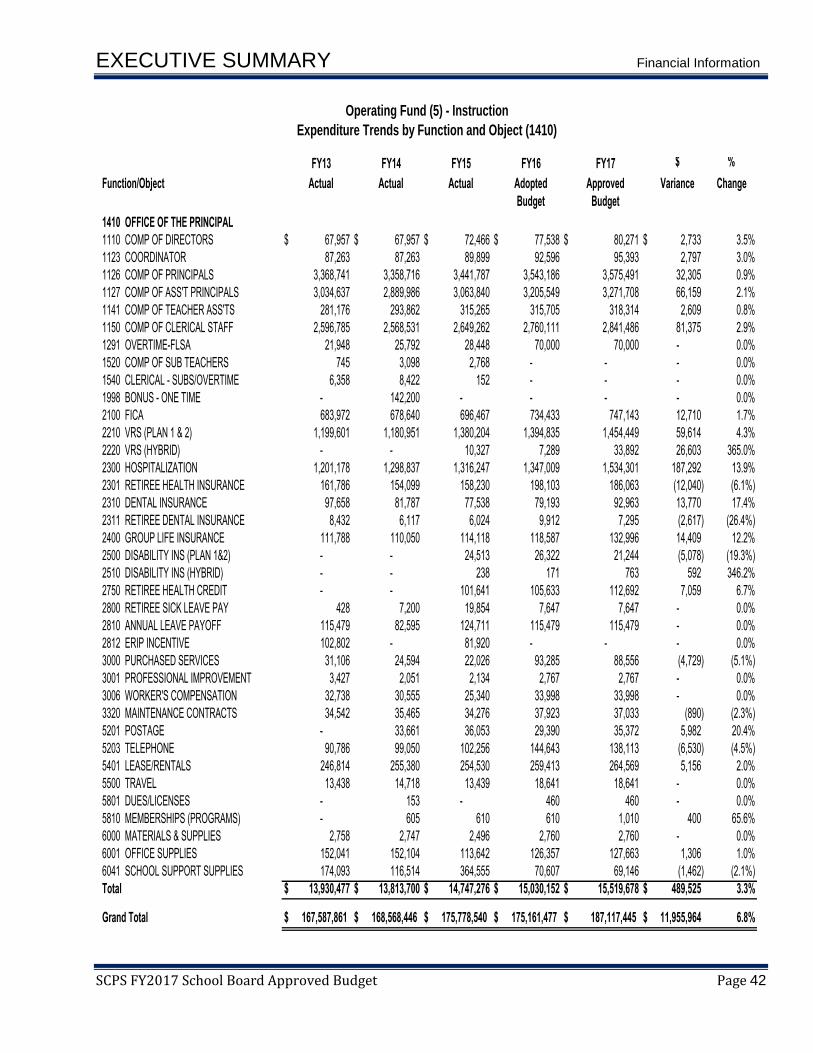
EXECUTIVE SUMMARY Financial Information
SCPS FY2017 School Board Approved Budget Page 42
FY13 FY14 FY15 FY16 FY17 $ %
Function/Object Actual Actual Actual Adopted
Budget
Approved
Budget
Variance Change
Actual Actual Actual Adopted Recommended Variance Change1110 COMP OF DIRECTORS $ 67,957 $ 67,957 $ 72,466 $ 77,538 $ 80,271 $ 2,733 3.5%
1123 COORDINATOR 87,263 87,263 89,899 92,596 95,393 2,797 3.0%
1126 COMP OF PRINCIPALS 3,368,741 3,358,716 3,441,787 3,543,186 3,575,491 32,305 0.9%
1127 COMP OF ASS'T PRINCIPALS 3,034,637 2,889,986 3,063,840 3,205,549 3,271,708 66,159 2.1%
1141 COMP OF TEACHER ASS'TS 281,176 293,862 315,265 315,705 318,314 2,609 0.8%
1150 COMP OF CLERICAL STAFF 2,596,785 2,568,531 2,649,262 2,760,111 2,841,486 81,375 2.9%
1291 OVERTIME-FLSA 21,948 25,792 28,448 70,000 70,000 - 0.0%
1520 COMP OF SUB TEACHERS 745 3,098 2,768 - - - 0.0%
1540 CLERICAL - SUBS/OVERTIME 6,358 8,422 152 - - - 0.0%
1998 BONUS - ONE TIME - 142,200 - - - - 0.0%
2100 FICA 683,972 678,640 696,467 734,433 747,143 12,710 1.7%
2210 VRS (PLAN 1 & 2) 1,199,601 1,180,951 1,380,204 1,394,835 1,454,449 59,614 4.3%
2220 VRS (HYBRID) - - 10,327 7,289 33,892 26,603 365.0%
2300 HOSPITALIZATION 1,201,178 1,298,837 1,316,247 1,347,009 1,534,301 187,292 13.9%
2301 RETIREE HEALTH INSURANCE 161,786 154,099 158,230 198,103 186,063 (12,040) (6.1%)
2310 DENTAL INSURANCE 97,658 81,787 77,538 79,193 92,963 13,770 17.4%
2311 RETIREE DENTAL INSURANCE 8,432 6,117 6,024 9,912 7,295 (2,617) (26.4%)
2400 GROUP LIFE INSURANCE 111,788 110,050 114,118 118,587 132,996 14,409 12.2%
2500 DISABILITY INS (PLAN 1&2) - - 24,513 26,322 21,244 (5,078) (19.3%)
2510 DISABILITY INS (HYBRID) - - 238 171 763 592 346.2%
2750 RETIREE HEALTH CREDIT - - 101,641 105,633 112,692 7,059 6.7%
2800 RETIREE SICK LEAVE PAY 428 7,200 19,854 7,647 7,647 - 0.0%
2810 ANNUAL LEAVE PAYOFF 115,479 82,595 124,711 115,479 115,479 - 0.0%
2812 ERIP INCENTIVE 102,802 - 81,920 - - - 0.0%
3000 PURCHASED SERVICES 31,106 24,594 22,026 93,285 88,556 (4,729) (5.1%)
3001 PROFESSIONAL IMPROVEMENT 3,427 2,051 2,134 2,767 2,767 - 0.0%
3006 WORKER'S COMPENSATION 32,738 30,555 25,340 33,998 33,998 - 0.0%
3320 MAINTENANCE CONTRACTS 34,542 35,465 34,276 37,923 37,033 (890) (2.3%)
5201 POSTAGE - 33,661 36,053 29,390 35,372 5,982 20.4%
5203 TELEPHONE 90,786 99,050 102,256 144,643 138,113 (6,530) (4.5%)
5401 LEASE/RENTALS 246,814 255,380 254,530 259,413 264,569 5,156 2.0%
5500 TRAVEL 13,438 14,718 13,439 18,641 18,641 - 0.0%
5801 DUES/LICENSES - 153 - 460 460 - 0.0%
5810 MEMBERSHIPS (PROGRAMS) - 605 610 610 1,010 400 65.6%
6000 MATERIALS & SUPPLIES 2,758 2,747 2,496 2,760 2,760 - 0.0%
6001 OFFICE SUPPLIES 152,041 152,104 113,642 126,357 127,663 1,306 1.0%
6041 SCHOOL SUPPORT SUPPLIES 174,093 116,514 364,555 70,607 69,146 (1,462) (2.1%)
Total $ 13,930,477 $ 13,813,700 $ 14,747,276 $ 15,030,152 $ 15,519,678 $ 489,525 3.3%
Grand Total $ 167,587,861 $ 168,568,446 $ 175,778,540 $ 175,161,477 $ 187,117,445 $ 11,955,964 6.8%
1410 OFFICE OF THE PRINCIPAL
Operating Fund (5) - Instruction
Expenditure Trends by Function and Object (1410)
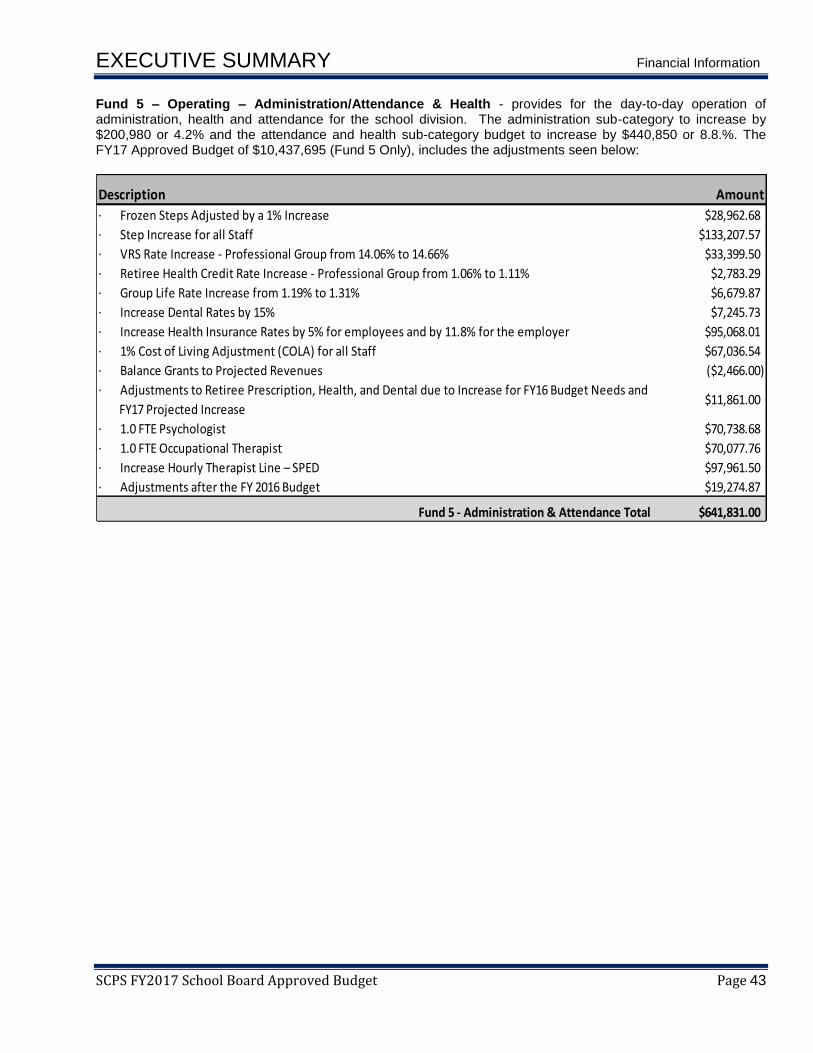
EXECUTIVE SUMMARY Financial Information
SCPS FY2017 School Board Approved Budget Page 43
Fund 5 – Operating – Administration/Attendance & Health - provides for the day-to-day operation of administration, health and attendance for the school division. The administration sub-category to increase by $200,980 or 4.2% and the attendance and health sub-category budget to increase by $440,850 or 8.8.%. The FY17 Approved Budget of $10,437,695 (Fund 5 Only), includes the adjustments seen below:
Description Amount
· Frozen Steps Adjusted by a 1% Increase $28,962.68
· Step Increase for all Staff $133,207.57
· VRS Rate Increase - Professional Group from 14.06% to 14.66% $33,399.50
· Retiree Health Credit Rate Increase - Professional Group from 1.06% to 1.11% $2,783.29
· Group Life Rate Increase from 1.19% to 1.31% $6,679.87
· Increase Dental Rates by 15% $7,245.73
· Increase Health Insurance Rates by 5% for employees and by 11.8% for the employer $95,068.01
· 1% Cost of Living Adjustment (COLA) for all Staff $67,036.54
· Balance Grants to Projected Revenues ($2,466.00)
· Adjustments to Retiree Prescription, Health, and Dental due to Increase for FY16 Budget Needs and
…….FY17 Projected Increase$11,861.00
· 1.0 FTE Psychologist $70,738.68
· 1.0 FTE Occupational Therapist $70,077.76
· Increase Hourly Therapist Line – SPED $97,961.50
· Adjustments after the FY 2016 Budget $19,274.87
Fund 5 - Administration & Attendance Total $641,831.00
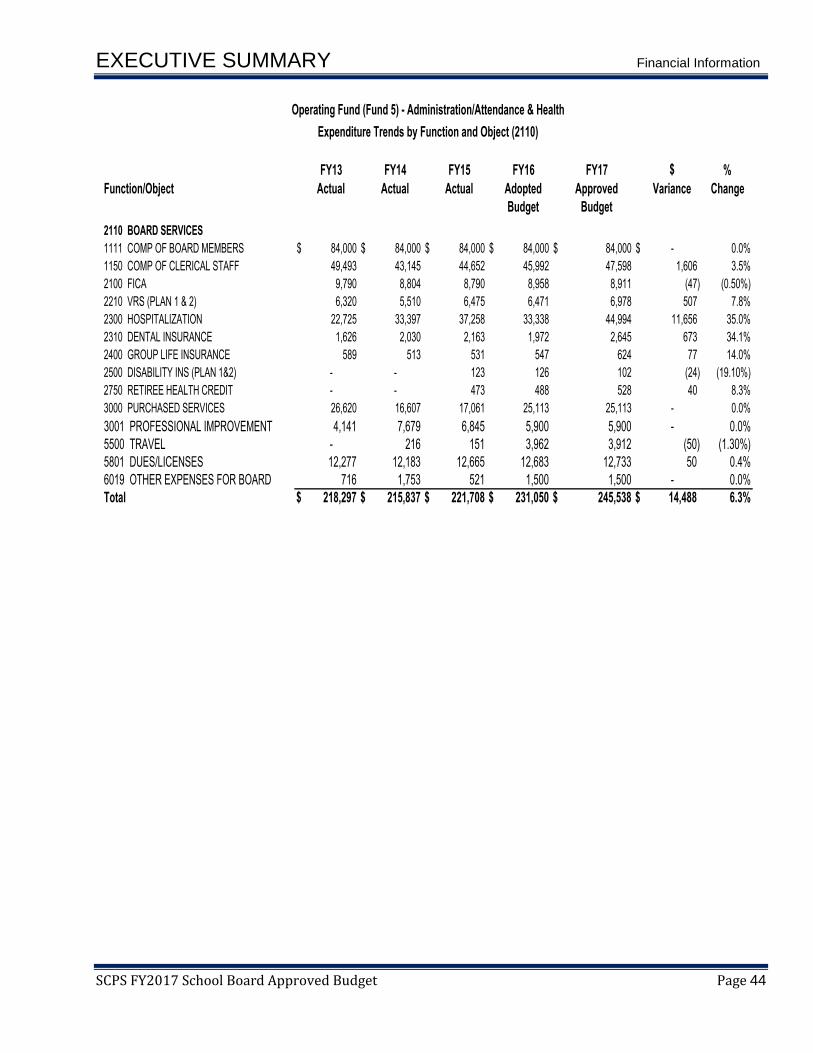
EXECUTIVE SUMMARY Financial Information
SCPS FY2017 School Board Approved Budget Page 44
FY13 FY14 FY15 FY16 FY17 $
Function/Object Actual Actual Actual Adopted
Budget
Approved
Budget
Variance
Actual Actual Actual Adopted
Budget
Recommended
Budget
Variance
1111 COMP OF BOARD MEMBERS $ 84,000 $ 84,000 $ 84,000 $ 84,000 $ 84,000 $ -
1150 COMP OF CLERICAL STAFF 49,493 43,145 44,652 45,992 47,598 1,606
2100 FICA 9,790 8,804 8,790 8,958 8,911 (47)
2210 VRS (PLAN 1 & 2) 6,320 5,510 6,475 6,471 6,978 507
2300 HOSPITALIZATION 22,725 33,397 37,258 33,338 44,994 11,656
2310 DENTAL INSURANCE 1,626 2,030 2,163 1,972 2,645 673
2400 GROUP LIFE INSURANCE 589 513 531 547 624 77
2500 DISABILITY INS (PLAN 1&2) - - 123 126 102 (24)
2750 RETIREE HEALTH CREDIT - - 473 488 528 40
3000 PURCHASED SERVICES 26,620 16,607 17,061 25,113 25,113 -
3001 PROFESSIONAL IMPROVEMENT 4,141 7,679 6,845 5,900 5,900 -
5500 TRAVEL - 216 151 3,962 3,912 (50)
5801 DUES/LICENSES 12,277 12,183 12,665 12,683 12,733 50
6019 OTHER EXPENSES FOR BOARD 716 1,753 521 1,500 1,500 -
Total $ 218,297 $ 215,837 $ 221,708 $ 231,050 $ 245,538 $ 14,488
3.5%
0.4%
0.0%
(1.30%)
%
Change
2110 BOARD SERVICES Change
14.0%
(19.10%)
0.0%
(0.50%)
7.8%
35.0%
34.1%
8.3%
0.0%
0.0%
6.3%
Operating Fund (Fund 5) - Administration/Attendance & Health
Expenditure Trends by Function and Object (2110)

EXECUTIVE SUMMARY Financial Information
SCPS FY2017 School Board Approved Budget Page 45
FY13 FY14 FY15 FY16 FY17 $
Function/Object Actual Actual Actual Adopted
Budget
Approved
Budget
Variance
Actual Actual Actual Adopted
Budget
Recommended
Budget
Variance
1110 COMP OF DIRECTORS $ 120,350 $ 128,165 $ 130,311 $ 134,221 $ 136,460 $ 2,239
1112 COMP OF SUPERINTENDENT 170,000 170,000 190,000 190,000 190,000 -
1115 TRAVEL ALLOWANCE 6,000 6,000 7,000 7,000 7,000 -
1150 COMP OF CLERICAL STAFF 134,887 134,815 124,052 128,422 136,636 8,214
1350 CLERICAL - PART-TIME 1,311 1,687 5,484 22,397 22,397 -
1540 CLERICAL - SUBS/OVERTIME 17,378 10,048 11,331 26,000 26,000 -
2100 FICA 30,487 28,841 29,965 38,369 39,083 714
2210 VRS (PLAN 1 & 2) 55,828 56,950 66,779 65,682 69,969 4,287
2300 HOSPITALIZATION 63,036 66,156 60,335 60,837 65,780 4,943
2301 RETIREE HEALTH INSURANCE 50,038 59,430 66,594 59,383 71,602 12,219
2310 DENTAL INSURANCE 4,900 3,962 3,426 3,418 3,817 399
2311 RETIREE DENTAL INSURANCE 2,474 2,567 2,820 4,016 2,918 (1,098)
2400 GROUP LIFE INSURANCE 5,202 5,307 5,480 5,555 6,252 697
2500 DISABILITY INS (PLAN 1&2) - - 1,099 1,206 1,017 (189)
2705 SUPERINTENDENT'S ANNUITY 10,000 10,000 10,000 10,000 10,000 -
2750 RETIREE HEALTH CREDIT - - 4,876 4,948 5,298 350
3000 PURCHASED SERVICES 3,022 1,957 37,731 31,009 31,009 -
3001 PROFESSIONAL IMPROVEMENT 2,477 3,269 2,828 4,000 4,000 -
3002 PRINTING/BINDING - 517 24 550 550 -
3006 WORKER'S COMPENSATION 8,783 6,882 7,798 10,463 10,463 -
3180 LEGAL FEES 87,156 51,592 65,079 72,740 72,740 -
3320 MAINTENANCE CONTRACTS 6,494 6,744 7,148 7,878 7,878 -
3321 LEASE/RENTAL CONTRACTS 512 805 1,167 1,599 1,599 -
3600 ADVERTISING 6,443 4,030 3,525 4,423 4,423 -
5201 POSTAGE 53,467 617 20,967 25,000 25,000 -
5202 UPS SERVICE 1,348 1,337 1,490 1,769 1,769 -
5203 TELEPHONE 25,815 24,411 26,354 45,880 45,300 (580)
5302 UNEMPLOYMENT COMP INS - - - 1,512 1,512 -
5401 LEASE/RENTALS 23,528 22,987 11,970 23,789 23,789 -
5500 TRAVEL - - 40 1,798 1,798 -
5801 DUES/LICENSES 6,701 6,752 6,125 5,759 6,339 580
6000 MATERIALS & SUPPLIES - - - 5,000 5,000 -
6001 OFFICE SUPPLIES 7,325 9,224 5,348 5,032 5,032 -
6011 LIBRARY BOOKS & SUPPLIES 234 60 1,331 275 275 -
8100 REPLACEMENT EQUIPMENT - - 2,086 2,090 2,090 -
Total $ 905,196 $ 825,112 $ 920,563 $ 1,012,020 $ 1,044,795 $ 32,775
0.0%
0.0%
0.0%
0.0%
3.2%
0.0%
(1.3%)
0.0%
0.0%
0.0%
10.1%
0.0%
0.0%
0.0%
0.0%
0.0%
0.0%
(15.7%)
0.0%
7.1%
0.0%
0.0%
0.0%
6.5%
8.1%
20.6%
11.7%
(27.3%)
12.6%
0.0%
0.0%
6.4%
0.0%
0.0%
1.9%
2120 EXECUTIVE ADMIN SERVICES Change
1.7%
Operating Fund (Fund 5) - Administration/Attendance & Health
Expenditure Trends by Function and Object (2120)
%
Change

EXECUTIVE SUMMARY Financial Information
SCPS FY2017 School Board Approved Budget Page 46
FY13 FY14 FY15 FY16 FY17 $
Function/Object Actual Actual Actual Adopted
Budget
Approved
Budget
Variance
Actual Actual Actual Adopted
Budget
Recommended
Budget
Variance
1110 COMP OF DIRECTORS $ 95,277 $ 95,553 $ 98,440 $ 101,394 $ 104,456 $ 3,062
1123 COORDINATOR - - - 70,611 91,292 20,681
1140 COMP-TECHNICAL PERSONNEL 52,361 52,361 52,885 54,472 55,017 545
1150 COMP OF CLERICAL STAFF 10,212 10,181 8,088 8,582 10,318 1,736
1350 CLERICAL - PART-TIME 3,425 11,099 16,959 17,500 17,500 -
1610 SUPPLEMENTAL PAY 30,924 26,764 29,984 41,000 41,000 -
2100 FICA 14,357 14,631 15,338 21,717 23,748 2,031
2210 VRS (PLAN 1 & 2) 20,157 20,193 23,236 33,073 38,275 5,202
2300 HOSPITALIZATION 12,912 12,863 14,308 25,636 27,425 1,789
2310 DENTAL INSURANCE 1,035 789 858 1,511 1,663 152
2400 GROUP LIFE INSURANCE 1,878 1,882 1,907 2,797 3,420 623
2500 DISABILITY INS (PLAN 1&2) - - 402 620 556 (64)
2750 RETIREE HEALTH CREDIT - - 1,696 2,491 2,898 407
3000 PURCHASED SERVICES 33,486 123,787 33,932 41,798 41,798 -
3001 PROFESSIONAL IMPROVEMENT 1,559 2,900 1,811 2,523 3,123 600
3002 PRINTING/BINDING 1,317 5,876 2,440 7,696 7,696 -
3005 PARTNERSHIPS 613 - 811 1,500 1,500 -
3310 REPAIRS TO EQUIPMENT 416 1,054 9,825 5,000 5,000 -
3320 MAINTENANCE CONTRACTS 16,879 4,146 6,469 10,000 10,000 -
3600 ADVERTISING 1,629 1,210 1,315 2,629 2,629 -
5201 POSTAGE 11 1,349 - 1,595 1,595 -
5401 LEASE/RENTALS 38,570 41,881 65,558 48,331 48,331 -
5500 TRAVEL - - 250 680 680 -
5801 DUES/LICENSES 1,378 774 895 1,130 1,130 -
5806 SUBSCRIPTIONS/JOURNALS - - - 1,098 1,098 -
6000 MATERIALS & SUPPLIES 56,813 64,234 43,819 56,461 53,995 (2,466)
6001 OFFICE SUPPLIES 981 2,208 4,386 3,097 3,097 -
6011 LIBRARY BOOKS & SUPPLIES - 234 272 302 302 -
6035 COMPUTER SOFTWARE 222 - 1,986 1,029 1,029 -
6152 TRAINING MATERIALS - - 3,225 3,225 2,625 (600)
6500 DONATIONS-SPECIAL PROGRAM - 305 1,668 2,000 2,000 -
Total $ 396,412 $ 496,274 $ 442,763 $ 571,498 $ 605,196 $ 33,698
Operating Fund (Fund 5) - Administration/Attendance & Health
Expenditure Trends by Function and Object (2130)
%
Change
2130 PUBLIC INFORMATION Change
3.0%
29.3%
1.0%
20.2%
0.0%
0.0%
9.4%
15.7%
7.0%
10.0%
22.3%
(10.3%)
16.3%
0.0%
23.8%
0.0%
0.0%
0.0%
0.0%
0.0%
0.0%
0.0%
0.0%
0.0%
0.0%
(4.4%)
0.0%
0.0%
0.0%
(18.6%)
0.0%
5.9%

EXECUTIVE SUMMARY Financial Information
SCPS FY2017 School Board Approved Budget Page 47
FY13 FY14 FY15 FY16 FY17 $
Function/Object Actual Actual Actual Adopted
Budget
Approved
Budget
Variance
Actual Actual Actual Adopted
Budget
Recommended
Budget
Variance
1110 COMP OF DIRECTORS $ 224,885 $ 229,602 $ 233,606 $ 306,540 $ 311,869 $ 5,329
1116 RECERTIFICATION SPCLST 80,265 80,265 83,095 85,588 88,606 3,018
1117 SPECIALISTS 132,927 196,687 140,291 144,501 149,595 5,094
1150 COMP OF CLERICAL STAFF 270,582 277,626 285,552 294,010 305,759 11,749
1350 CLERICAL - PART-TIME - 11,160 12,426 14,384 14,384 -
1610 SUPPLEMENTAL PAY 1,435 1,175 1,029 - - -
1998 BONUS - ONE TIME - 30,600 - - - -
2100 FICA 50,302 59,438 55,685 61,759 63,324 1,565
2210 VRS (PLAN 1 & 2) 90,489 100,154 107,669 116,871 125,464 8,593
2300 HOSPITALIZATION 139,214 99,409 103,903 111,794 129,726 17,932
2303 RETIREE PRESCRI DRUG PROG 23,746 25,982 29,164 30,165 30,321 156
2310 DENTAL INSURANCE 5,681 6,314 6,244 6,737 8,125 1,388
2400 GROUP LIFE INSURANCE 8,432 9,333 8,836 9,885 11,211 1,326
2500 DISABILITY INS (PLAN 1&2) - - 1,879 2,153 1,823 (330)
2750 RETIREE HEALTH CREDIT - - 7,871 8,805 9,500 695
2800 RETIREE SICK LEAVE PAY 341 10,699 23,102 2,138 2,138 -
2810 ANNUAL LEAVE PAYOFF 69,114 84,532 17,601 69,114 69,114 -
2812 ERIP INCENTIVE 171,151 3,051 - - - -
3000 PURCHASED SERVICES 40,322 52,471 49,695 63,677 63,677 -
3001 PROFESSIONAL IMPROVEMENT 3,568 3,223 3,657 2,229 5,151 2,922
3007 RECRUITING EXPENSES 13,493 14,371 10,418 12,010 12,010 -
3320 MAINTENANCE CONTRACTS 31,909 32,322 31,976 33,793 32,360 (1,433)
3600 ADVERTISING 3,013 997 2,164 2,227 2,227 -
5203 TELEPHONE - - - 366 366 -
5302 UNEMPLOYMENT COMP INS - - 1,130 - - -
5401 LEASE/RENTALS 4,057 3,719 4,057 5,569 4,080 (1,489)
5500 TRAVEL 13 - - - - -
6000 MATERIALS & SUPPLIES 9,852 17,065 10,693 4,739 4,739 -
6092 EMPLOYEE RECOGNITION PROG 13,260 6,614 8,647 6,000 6,000 -
6500 DONATIONS-SPECIAL PROGRAM 2,833 5,015 3,564 3,500 3,500 -
Total $ 1,390,884 $ 1,361,824 $ 1,243,954 $ 1,398,554 $ 1,455,069 $ 56,515
Actual Actual Actual Adopted
Budget
Recommended
Budget
Variance
1110 COMP OF DIRECTORS $ 62,981 $ 62,981 $ 64,004 $ 65,925 $ 67,193 $ 1,268
2100 FICA 4,350 4,334 4,493 4,769 4,852 83
2210 VRS (PLAN 1 & 2) 8,043 8,043 9,281 9,276 9,850 574
2300 HOSPITALIZATION 6,897 7,433 7,617 7,642 8,544 902
2310 DENTAL INSURANCE 610 515 493 493 567 74
2400 GROUP LIFE INSURANCE 749 749 762 785 880 95
2500 DISABILITY INS (PLAN 1&2) - - 149 168 143 (25)
2750 RETIREE HEALTH CREDIT - - 678 699 746 47
Total $ 83,630 $ 84,055 $ 87,477 $ 89,757 $ 92,775 $ 3,018
(14.9%)
6.7%
3.4%
1.9%
1.7%
6.2%
11.8%
15.0%
12.1%
0.0%
0.0%
0.0%
0.0%
4.0%
2150 PLANNING SERVICES Change
0.0%
(4.2%)
0.0%
0.0%
0.0%
(26.7%)
7.9%
0.0%
0.0%
0.0%
0.0%
131.1%
7.4%
16.0%
0.5%
20.6%
13.4%
(15.3%)
3.5%
4.0%
0.0%
0.0%
0.0%
2.5%
2140 HUMAN RESOURCES Change
1.7%
3.5%
Operating Fund (Fund 5) - Administration/Attendance & Health
Expenditure Trends by Function and Object (2140-2150)
%
Change
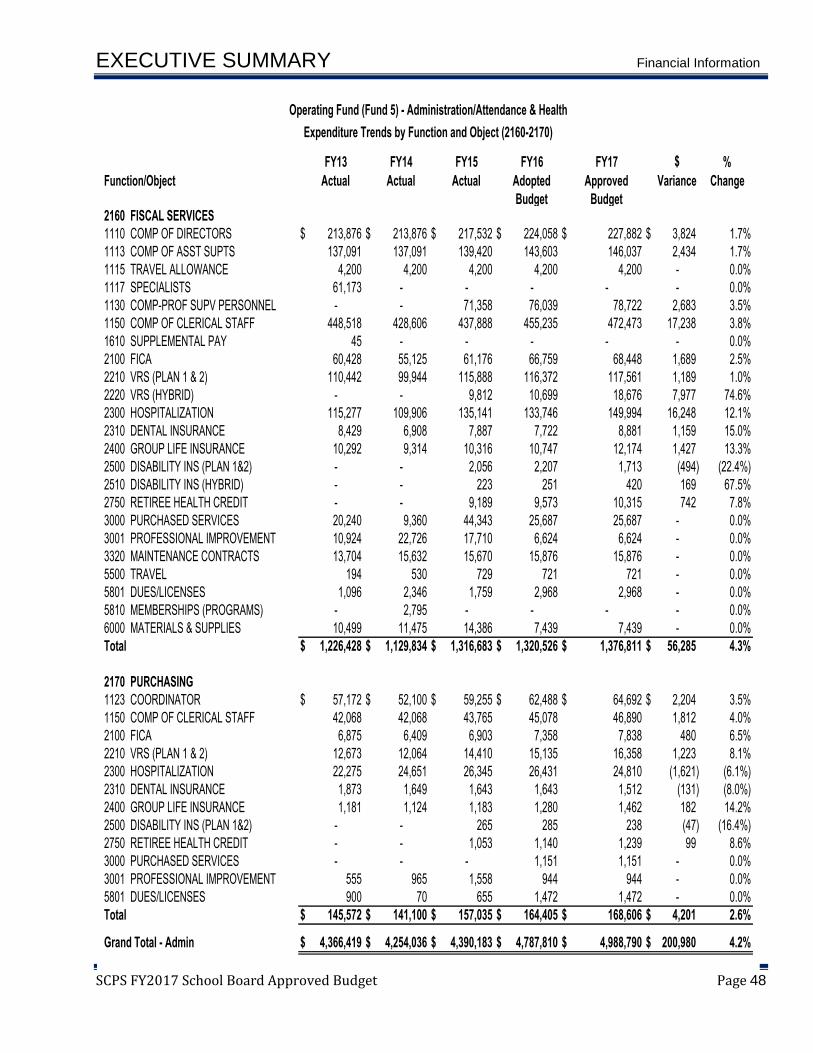
EXECUTIVE SUMMARY Financial Information
SCPS FY2017 School Board Approved Budget Page 48
FY13 FY14 FY15 FY16 FY17 $
Function/Object Actual Actual Actual Adopted
Budget
Approved
Budget
Variance
Actual Actual Actual Adopted Recommended Variance1110 COMP OF DIRECTORS $ 213,876 $ 213,876 $ 217,532 $ 224,058 $ 227,882 $ 3,824
1113 COMP OF ASST SUPTS 137,091 137,091 139,420 143,603 146,037 2,434
1115 TRAVEL ALLOWANCE 4,200 4,200 4,200 4,200 4,200 -
1117 SPECIALISTS 61,173 - - - - -
1130 COMP-PROF SUPV PERSONNEL - - 71,358 76,039 78,722 2,683
1150 COMP OF CLERICAL STAFF 448,518 428,606 437,888 455,235 472,473 17,238
1610 SUPPLEMENTAL PAY 45 - - - - -
2100 FICA 60,428 55,125 61,176 66,759 68,448 1,689
2210 VRS (PLAN 1 & 2) 110,442 99,944 115,888 116,372 117,561 1,189
2220 VRS (HYBRID) - - 9,812 10,699 18,676 7,977
2300 HOSPITALIZATION 115,277 109,906 135,141 133,746 149,994 16,248
2310 DENTAL INSURANCE 8,429 6,908 7,887 7,722 8,881 1,159
2400 GROUP LIFE INSURANCE 10,292 9,314 10,316 10,747 12,174 1,427
2500 DISABILITY INS (PLAN 1&2) - - 2,056 2,207 1,713 (494)
2510 DISABILITY INS (HYBRID) - - 223 251 420 169
2750 RETIREE HEALTH CREDIT - - 9,189 9,573 10,315 742
3000 PURCHASED SERVICES 20,240 9,360 44,343 25,687 25,687 -
3001 PROFESSIONAL IMPROVEMENT 10,924 22,726 17,710 6,624 6,624 -
3320 MAINTENANCE CONTRACTS 13,704 15,632 15,670 15,876 15,876 -
5500 TRAVEL 194 530 729 721 721 -
5801 DUES/LICENSES 1,096 2,346 1,759 2,968 2,968 -
5810 MEMBERSHIPS (PROGRAMS) - 2,795 - - - -
6000 MATERIALS & SUPPLIES 10,499 11,475 14,386 7,439 7,439 -
Total $ 1,226,428 $ 1,129,834 $ 1,316,683 $ 1,320,526 $ 1,376,811 $ 56,285
Actual Actual Actual Adopted Recommended Variance1123 COORDINATOR $ 57,172 $ 52,100 $ 59,255 $ 62,488 $ 64,692 $ 2,204
1150 COMP OF CLERICAL STAFF 42,068 42,068 43,765 45,078 46,890 1,812
2100 FICA 6,875 6,409 6,903 7,358 7,838 480
2210 VRS (PLAN 1 & 2) 12,673 12,064 14,410 15,135 16,358 1,223
2300 HOSPITALIZATION 22,275 24,651 26,345 26,431 24,810 (1,621)
2310 DENTAL INSURANCE 1,873 1,649 1,643 1,643 1,512 (131)
2400 GROUP LIFE INSURANCE 1,181 1,124 1,183 1,280 1,462 182
2500 DISABILITY INS (PLAN 1&2) - - 265 285 238 (47)
2750 RETIREE HEALTH CREDIT - - 1,053 1,140 1,239 99
3000 PURCHASED SERVICES - - - 1,151 1,151 -
3001 PROFESSIONAL IMPROVEMENT 555 965 1,558 944 944 -
5801 DUES/LICENSES 900 70 655 1,472 1,472 -
Total $ 145,572 $ 141,100 $ 157,035 $ 164,405 $ 168,606 $ 4,201
Grand Total - Admin $ 4,366,419 $ 4,254,036 $ 4,390,183 $ 4,787,810 $ 4,988,790 $ 200,980 4.2%
Operating Fund (Fund 5) - Administration/Attendance & Health
Expenditure Trends by Function and Object (2160-2170)
%
Change
2160 FISCAL SERVICES Change1.7%
1.7%
0.0%
0.0%
3.5%
3.8%
0.0%
2.5%
1.0%
74.6%
12.1%
15.0%
13.3%
(22.4%)
67.5%
7.8%
0.0%
0.0%
0.0%
0.0%
0.0%
0.0%
0.0%
4.3%
2170 PURCHASING Change3.5%
4.0%
6.5%
8.1%
(6.1%)
(8.0%)
14.2%
(16.4%)
8.6%
0.0%
0.0%
0.0%
2.6%

EXECUTIVE SUMMARY Financial Information
SCPS FY2017 School Board Approved Budget Page 49
FY13 FY14 FY15 FY16 FY17 $
Function/Object Actual Actual Actual Adopted
Budget
Approved
Budget
Variance
$ 4,366,419 Actual Actual Adopted
Budget
Recommended
Budget
Variance
1131 COMP OF SCHOOL NURSES $ 1,362,990 $ 1,324,433 $ 1,369,264 $ 1,459,693 $ 1,442,003 $ (17,690)
1135 SUPERVISOR - - - - 95,391 95,391
1139 COMP OF THERAPISTS 495,214 406,165 401,381 476,934 537,826 60,892
1146 NURSE PRACTITIONER 105,910 105,910 110,856 93,634 - (93,634)
1150 COMP OF CLERICAL STAFF 28,765 28,765 29,782 30,676 31,737 1,061
1339 THERAPISTS - PART-TIME 39,310 121,173 87,978 45,600 136,600 91,000
1520 COMP OF SUB TEACHERS 6,569 - - 2,000 2,000 -
1521 COMP-NURSING SUBSTITUTE 55,449 83,252 59,510 60,438 60,438 -
1600 COMP - SUPPLEMENTS 9,310 6,969 8,432 8,464 6,348 (2,116)
1610 SUPPLEMENTAL PAY 64,200 62,972 89,048 69,534 69,534 -
1620 NON-CONTRACTED COMP 2,029 4,684 917 6,128 6,128 -
1998 BONUS - ONE TIME - 42,660 - - - -
2100 FICA 158,717 159,619 157,247 164,492 174,330 9,838
2210 VRS (PLAN 1 & 2) 236,832 229,658 258,597 274,610 211,619 (62,991)
2220 VRS (HYBRID) - 1,785 17,216 13,693 95,185 81,492
2300 HOSPITALIZATION 253,996 255,633 257,692 293,742 385,562 91,820
2301 RETIREE HEALTH INSURANCE 64,227 68,398 70,153 70,317 70,317 -
2310 DENTAL INSURANCE 19,401 15,538 15,362 17,581 23,618 6,037
2311 RETIREE DENTAL INSURANCE 4,306 3,626 3,450 2,698 3,282 584
2400 GROUP LIFE INSURANCE 22,070 21,626 22,636 24,384 27,416 3,032
2500 DISABILITY INS (PLAN 1&2) - - 4,761 5,311 3,089 (2,222)
2510 DISABILITY INS (HYBRID) - 66 414 321 2,143 1,822
2750 RETIREE HEALTH CREDIT - - 20,163 21,720 23,230 1,510
2800 RETIREE SICK LEAVE PAY - - 7,673 - - -
2810 ANNUAL LEAVE PAYOFF - - 5,136 - - -
2812 ERIP INCENTIVE 29,785 - 122,250 - - -
3000 PURCHASED SERVICES 481,749 605,884 726,495 662,969 662,969 -
3001 PROFESSIONAL IMPROVEMENT 6,397 5,020 3,090 7,274 7,274 -
3110 MEDICAL SERVICES - 928 1,143 3,702 3,702 -
3320 MAINTENANCE CONTRACTS 9,250 9,250 9,250 9,250 9,250 -
5401 LEASE/RENTALS 565 515 516 1,555 1,555 -
5500 TRAVEL 9,719 9,155 6,724 12,403 12,403 -
5810 MEMBERSHIPS (PROGRAMS) 1,859 4,104 3,805 2,516 2,516 -
6001 OFFICE SUPPLIES 1,371 3,383 3,153 1,153 1,153 -
6004 MEDICAL & DENTAL SUPPLIES 83,953 116,188 54,045 46,685 46,685 -
6035 COMPUTER SOFTWARE - 350 375 375 375 -
Total $ 3,553,943 $ 3,697,709 $ 3,928,514 $ 3,889,852 $ 4,155,678 $ 265,826
Operating Fund (Fund 5) - Administration/Attendance & Health
Expenditure Trends by Function and Object (2220)
%
Change
2220 HEALTH SERVICES Change
(1.20%)
100.0%
12.8%
(100.0%)
3.5%
199.6%
0.0%
0.0%
(25.0%)
0.0%
0.0%
0.0%
6.0%
(22.9%)
595.1%
31.3%
0.0%
34.3%
21.6%
12.4%
(41.8%)
567.5%
7.0%
0.0%
0.0%
0.0%
0.0%
0.0%
0.0%
0.0%
0.0%
0.0%
0.0%
0.0%
0.0%
0.0%
6.8%

EXECUTIVE SUMMARY Financial Information
SCPS FY2017 School Board Approved Budget Page 50
FY13 FY14 FY15 FY16 FY17 $
Function/Object Actual Actual Actual Adopted
Budget
Approved
Budget
Variance
Actual Actual Actual Adopted
Budget
Recommended
Budget
Variance
1132 COMP OF PSYCHOLOGISTS $ 582,675 $ 640,772 $ 703,061 $ 824,632 $ 916,120 $ 91,488
1600 COMP - SUPPLEMENTS 15,328 15,341 9,309 2,645 2,645 -
2100 FICA 44,378 47,879 52,138 53,578 67,786 14,208
2210 VRS (PLAN 1 & 2) 76,308 76,340 88,629 88,104 109,878 21,774
2220 VRS (HYBRID) - - 6,717 7,374 17,531 10,157
2300 HOSPITALIZATION 48,006 57,092 62,293 85,225 107,659 22,434
2310 DENTAL INSURANCE 3,512 3,394 3,423 4,764 6,235 1,471
2400 GROUP LIFE INSURANCE 7,111 7,114 7,835 8,075 11,385 3,310
2500 DISABILITY INS (PLAN 1&2) - - 1,691 1,799 1,705 (94)
2510 DISABILITY INS (HYBRID) - - 154 173 395 222
2750 RETIREE HEALTH CREDIT - - 6,970 7,193 9,647 2,454
3000 PURCHASED SERVICES - - 61,218 1,460 9,060 7,600
5500 TRAVEL 7,156 7,538 7,141 10,681 10,681 -
6000 MATERIALS & SUPPLIES 21,888 5,650 40,355 22,000 22,000 -
6500 DONATIONS-SPECIAL PROGRAM - 490 - 500 500 -
Total $ 806,362 $ 861,610 $ 1,050,934 $ 1,118,203 $ 1,293,227 $ 175,024
Grand Total - Attendance and Health $ 4,360,305 $ 4,559,319 $ 4,979,448 $ 5,008,055 $ 5,448,905 $ 440,850 8.8%
Grand Total - Admin & Attendance/Health $ 8,726,724 $ 8,813,355 $ 9,369,631 $ 9,795,865 $ 10,437,695 $ 641,830
0.0%
0.0%
0.0%
15.7%
6.6%
30.9%
41.0%
(5.2%)
128.1%
34.1%
520.5%
11.1%
0.0%
26.5%
24.7%
137.7%
26.3%
2230 PSYCHOLOGICAL SERVICES Change
Operating Fund (Fund 5) - Administration/Attendance & Health
Expenditure Trends by Function and Object (2230)
%
Change

EXECUTIVE SUMMARY Financial Information
SCPS FY2017 School Board Approved Budget Page 51
Fund 5 – Operating – Transportation - provides for the day-to-day operation of transportation services for the school division. The FY17 Approved Budget of $17,702,617 (Fund 5 only excluding Fund 7 - Fleet Services), includes the adjustments seen below:
Description Amount
· Frozen Steps Adjusted by a 1% Increase $28,855.22
· Step Increase for all Staff $144,734.16
· VRS Rate Increase - Professional Group from 14.06% to 14.66% $4,142.23
· Retiree Health Credit Rate Increase - Professional Group from 1.06% to 1.11% $345.19
· VRS Rate Decrease - Non-Professional Group from 8.17% to 6.62% ($74,974.63)
· Group Life Rate Increase from 1.19% to 1.31% $6,633.10
· Increase Dental Rates by 15% $26,395.91
· Increase Health Insurance Rates by 5% for employees and by 11.8% for the employer $355,155.23
· 1% Cost of Living Adjustment (COLA) for all Staff $75,760.10
· Adjustments to Retiree Prescription, Health, and Dental due to increase for Fy16 budget needs and
……..FY17 Projected Increase$77,022.00
· Increase Fleet Service Revenues by 1.32% for a $1/hour increase in labor rates, increase respective
……..expense lines for the transportation department$25,528.00
· Reclass Routing Coordinator position to Supervisor of Transportation on the Supervisor scale $43,328.60
· Reclass the Transportation Secretary on to the Technology Analyst I scale $14,328.20
· Add 1.0 FTE SPED Transportation Dispatcher $45,724.65
· Reduce the Gasoline expenditure account line ($103,438.00)
· Reclass the Equipment Line to the Purchase Services line for outsourcing annual physical exams Net Zero
· Adjustments after the FY 2016 Budget Adoption ($188,327.07)
Fund 5 - Operating - Transportation Total $481,212.89

EXECUTIVE SUMMARY Financial Information
SCPS FY2017 School Board Approved Budget Page 52
FY13 FY14 FY15 FY16 FY17 $
Function/Object Actual Actual Actual Adopted
Budget
Approved
Budget
Variance
Actual Actual Actual Adopted Recommended Variance1110 COMP OF DIRECTORS $ 109,200 $ 109,200 $ 111,064 $ 114,396 $ 115,540 $ 1,144
1123 COORDINATOR 142,172 142,265 191,735 198,641 144,982 (53,659)
1135 SUPERVISOR 63,632 63,632 65,636 67,606 156,050 88,444
1140 COMP-TECHNICAL PERSONNEL 120,111 120,111 122,941 127,024 174,722 47,698
1150 COMP OF CLERICAL STAFF 224,574 218,901 185,738 191,578 193,735 2,157
1540 CLERICAL - SUBS/OVERTIME 21,880 15,299 10,671 8,359 8,359 -
1610 SUPPLEMENTAL PAY - - - 8,760 8,760 -
2100 FICA 49,734 48,593 49,606 52,248 57,757 5,509
2210 VRS (PLAN 1 & 2) 82,800 82,172 96,758 96,294 112,851 16,557
2300 HOSPITALIZATION 101,576 106,886 117,858 121,109 161,967 40,858
2301 RETIREE HEALTH INSURANCE 116,335 134,328 140,881 130,457 195,143 64,686
2303 RETIREE PRESCRI DRUG PROG 62,831 76,564 89,041 85,874 97,314 11,440
2310 DENTAL INSURANCE 7,528 6,339 6,597 6,752 9,655 2,903
2311 RETIREE DENTAL INSURANCE 4,318 4,422 4,545 5,851 6,747 896
2400 GROUP LIFE INSURANCE 7,716 7,657 7,941 8,144 10,084 1,940
2500 DISABILITY INS (PLAN 1&2) - - 1,814 1,883 1,673 (210)
2750 RETIREE HEALTH CREDIT - - 7,074 7,254 8,545 1,291
2800 RETIREE SICK LEAVE PAY 2,055 705 6,165 7,705 7,705 -
2810 ANNUAL LEAVE PAYOFF 3,540 5,278 23,149 3,540 3,540 -
2812 ERIP INCENTIVE 10,745 - 48,217 - - -
3000 PURCHASED SERVICES - - 696 8,235 98,570 90,335
3001 PROFESSIONAL IMPROVEMENT 5,057 9,424 16,025 2,309 12,309 10,000
3310 REPAIRS TO EQUIPMENT - - 192 794 794 -
3320 MAINTENANCE CONTRACTS 64,269 41,334 41,334 44,985 44,985 -
5101 ELECTRICITY 22,103 22,447 24,726 25,815 25,815 -
5103 WATER/SEWAGE FEES 1,190 1,247 1,461 1,256 1,256 -
5203 TELEPHONE 9,699 9,587 10,834 9,072 9,072 -
5302 UNEMPLOYMENT COMP INS 4,964 2,254 1,106 2,964 2,964 -
5401 LEASE/RENTALS 1,599 1,755 2,459 1,680 1,680 -
5500 TRAVEL 4,451 3,039 1,463 1,694 1,694 -
6001 OFFICE SUPPLIES 17,055 10,774 9,695 7,084 7,084 -
6015 COMPUTER SUPPL/SOFTWARE - 32,294 795 - 365 365
8100 REPLACEMENT EQUIPMENT - 97 - 476 476 -
Total $ 1,261,134 $ 1,276,604 $ 1,398,217 $ 1,349,839 $ 1,682,193 $ 332,354 24.6%
100.0%
0.0%
0.0%
0.0%
0.0%
0.0%
0.0%
0.0%
0.0%
1097.0%
433.1%
0.0%
0.0%
0.0%
15.3%
23.8%
(11.2%)
17.8%
0.0%
0.0%
10.5%
17.2%
33.7%
49.6%
13.3%
43.0%
(27.0%)
130.8%
37.6%
1.1%
0.0%
0.0%
Operating Fund (Fund 5) - Transportation Department
3100 TRANSP - MGMT & DIRECTION Change1.0%
%
Change
Expenditure Trends by Function and Object (3100)

EXECUTIVE SUMMARY Financial Information
SCPS FY2017 School Board Approved Budget Page 53
FY13 FY14 FY15 FY16 FY17 $
Function/Object Actual Actual Actual Adopted
Budget
Approved Budget Variance
Actual Actual Actual Adopted Recommended Variance1170 DRIVER PAY $ 4,604,715 $ 4,695,400 $ 4,790,212 $ 5,271,426 $ 5,369,669 $ 98,243
1282 DRIVER OVER 20 HOURS 879,398 956,202 1,056,821 824,632 824,632 -
1284 DRIVER OVER 40 HOURS 26,846 61,854 123,928 10,000 10,000 -
1285 AIDES OVER 20 HOURS 134,002 149,476 174,934 173,778 173,778 -
1286 AIDES OVER 40 HOURS 1,404 10,015 24,220 3,000 3,000 -
1287 NON-CONTRACT DRIVER > 20 742 - - - - -
1288 NON-CONTRACT DRIVER > 40 380 2,164 7,696 - - -
1292 DRIVER TRAINING - - 14,781 - - -
1293 NON-CONTRACT AIDES > 20 1,250 - - - - -
1294 NON-CONTRACT AIDES > 40 901 2,029 2,511 - - -
1296 BUS AIDE TRAINING - - 1,163 - - -
1340 DRIVER AIDE 439,034 425,825 476,299 634,575 651,453 16,878
1544 NON-CONTRACTED DRIVER 472,438 311,402 249,410 92,400 92,400 -
1545 NON-CONTRACTED BUS AIDE 166,692 138,493 142,435 25,256 25,256 -
1610 SUPPLEMENTAL PAY 396,494 364,655 445,978 463,104 463,104 -
1997 ATTENDANCE BONUS - - 7,567 - - -
1998 BONUS - ONE TIME - 308,700 - - - -
2100 FICA 485,743 501,790 511,070 477,362 488,867 11,505
2210 VRS (PLAN 1 & 2) 365,277 442,389 332,692 380,054 284,091 (95,963)
2220 VRS (HYBRID) - 1,114 28,719 16,301 39,340 23,039
2300 HOSPITALIZATION 2,401,523 2,520,506 2,519,917 2,947,799 3,204,262 256,463
2310 DENTAL INSURANCE 178,643 142,909 144,469 172,835 193,471 20,636
2400 GROUP LIFE INSURANCE 53,296 51,964 52,662 57,731 64,002 6,271
2500 DISABILITY INS (PLAN 1&2) - - 19,166 22,821 11,915 (10,906)
2510 DISABILITY INS (HYBRID) - 54 1,172 658 1,961 1,303
2710 ANNUITY FOR NON-VRS EMP. 12,550 8,560 10,400 36,000 36,000 -
2800 RETIREE SICK LEAVE PAY 5,490 8,085 15,579 - - -
2812 ERIP INCENTIVE - - 9,821 - - -
3000 PURCHASED SERVICES 12,036 13,797 13,350 18,451 18,451 -
3006 WORKER'S COMPENSATION 141,377 131,949 125,523 168,411 168,411 -
3008 STAFF TRAINING 1,885 4,451 1,251 1,842 1,842 -
3009 STUDENT TRAINING - - - 3,263 3,263 -
3110 MEDICAL SERVICES 10,151 6,359 7,183 10,318 10,318 -
3308 VEHICLE REPAIRS 4,065 8,574 11,237 9,933 9,933 -
3310 REPAIRS TO EQUIPMENT 1,346 4,762 4,880 7,771 7,771 -
3430 TRANS SERVICE BY CONTRACT - - 46,843 - - -
3600 ADVERTISING 70 - - 1,323 1,323 -
5201 POSTAGE 5,585 5,678 5,958 7,316 7,316 -
5203 TELEPHONE - - - 2,000 2,000 -
5309 FLEET INSURANCE 103,822 91,522 86,773 115,494 115,494 -
5801 DUES/LICENSES - - - 118 118 -
6008 GASOLINE/OIL/LUBRICANTS 1,820,642 1,813,996 1,405,638 1,787,467 1,669,029 (118,438)
6012 OTHER OPERATING SUPPLIES 11,232 4,448 15,569 7,662 12,662 5,000
6152 TRAINING MATERIALS 628 172 2,631 588 588 -
8100 REPLACEMENT EQUIPMENT - - - 90,700 - (90,700)
8101 REPLACEMENT OF BUSES - - 427,623 95,200 95,200 -
8201 BUSES - ADDITIONAL - 188,482 209,922 - - -
Total $ 12,739,657 $ 13,377,776 $ 13,528,003 $ 13,937,589 $ 14,060,920 $ 123,331 0.9%
Actual Actual Actual Adopted Recommended Variance3309 BUS REPAIRS $ 1,683,817 $ 1,785,116 $ 1,887,927 $ 1,923,976 $ 1,901,079 $ (22,897)
3310 REPAIRS TO EQUIPMENT - - - - 48,425 48,425
3314 OTHER BUS REPAIRS - 34,978 6,080 10,000 10,000 -
6009 REPAIR PARTS/SUPPLIES 3,789 - - - - -
8100 REPLACEMENT EQUIPMENT 78,091 - - - - -
Total $ 1,765,697 $ 1,820,094 $ 1,894,007 $ 1,933,976 $ 1,959,504 $ 25,528 1.3%
Grand Total $ 15,766,488 $ 16,474,474 $ 16,820,227 $ 17,221,404 $ 17,702,617 $ 481,213 2.8%
Operating Fund (Fund 5) - Transportation Department Expenditure Trends by Function and Object (3200-3400)
%
Change
3200 VEHICLE OPERATION SVCS Change1.9%
0.0%
0.0%
0.0%
0.0%
0.0%
0.0%
0.0%
0.0%
0.0%
0.0%
2.7%
0.0%
0.0%
0.0%
0.0%
0.0%
2.4%
(25.2%)
141.3%
8.7%
11.9%
10.9%
(47.8%)
198.0%
0.0%
0.0%
0.0%
0.0%
0.0%
0.0%
0.0%
0.0%
0.0%
0.0%
0.0%
0.0%
0.0%
0.0%
0.0%
3400 VEHICLE MAINTENANCE SVCS Change(1.2%)
100.0%
0.0%
(6.6%)
65.3%
0.0%
(100.0%)
0.0%
0.0%
0.0%
0.0%
0.0%

EXECUTIVE SUMMARY Financial Information
SCPS FY2017 School Board Approved Budget Page 54
Fund 5 – Operating – Maintenance - provides for the day-to-day maintenance services for the school division. The FY17 Approved Budget of $21,764,027 (Fund 5 only excluding Fund 3), includes the adjustments seen below:
Description Amount
· Frozen Steps Adjusted by a 1% Increase $12,497.90
· Step Increase for all Staff $122,366.50
· VRS Rate Increase - Professional Group from 14.06% to 14.66% $9,316.08
· Retiree Health Credit Rate Increase - Professional Group from 1.06% to 1.11% $776.35
· VRS Rate Decrease - Non-Professional Group from 8.17% to 6.62% ($53,477.78)
· Group Life Rate Increase from 1.19% to 1.31% $6,003.36
· Increase Dental Rates by 15% $10,005.41
· Increase Health Insurance Rates by 5% for employees and by 11.8% for the employer $138,082.82
· 1% Cost of Living Adjustment (COLA) for all Staff $61,137.32
· Adjustments to Retiree Prescription, Health, and Dental due to Increase for FY16 Budget Needs and
……..FY17 Projected Increase $33,214.00
· Increase Fleet Revenues by 1.32% for a $1/hour increase in labor rates, increase respective expense
……..lines for the maintenance and transportation departments $1,398.00
· Adjustments after the FY 2016 Budget Adoption ($211,937.96)
Fund 5 - Maintenance Total $129,382.00
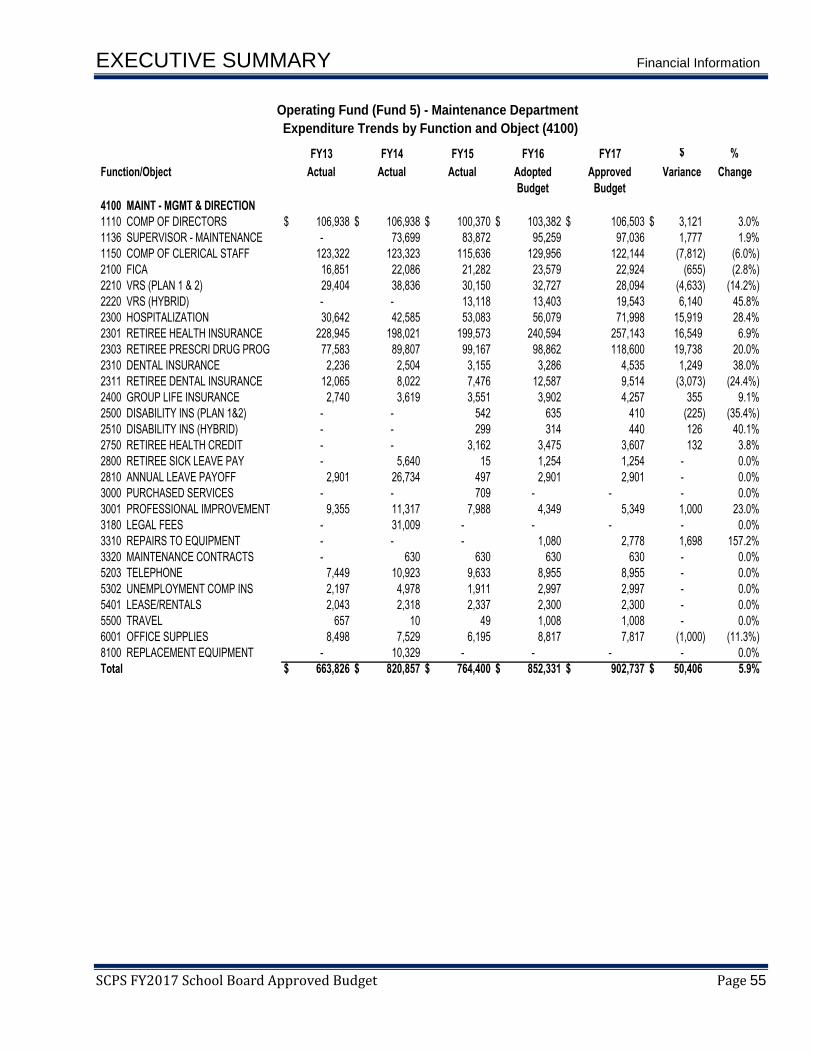
EXECUTIVE SUMMARY Financial Information
SCPS FY2017 School Board Approved Budget Page 55
FY13 FY14 FY15 FY16 FY17 $
Function/Object Actual Actual Actual Adopted
Budget
Approved
Budget
Variance
Actual Actual Actual Adopted Recommended Variance1110 COMP OF DIRECTORS $ 106,938 $ 106,938 $ 100,370 $ 103,382 $ 106,503 $ 3,121
1136 SUPERVISOR - MAINTENANCE - 73,699 83,872 95,259 97,036 1,777
1150 COMP OF CLERICAL STAFF 123,322 123,323 115,636 129,956 122,144 (7,812)
2100 FICA 16,851 22,086 21,282 23,579 22,924 (655)
2210 VRS (PLAN 1 & 2) 29,404 38,836 30,150 32,727 28,094 (4,633)
2220 VRS (HYBRID) - - 13,118 13,403 19,543 6,140
2300 HOSPITALIZATION 30,642 42,585 53,083 56,079 71,998 15,919
2301 RETIREE HEALTH INSURANCE 228,945 198,021 199,573 240,594 257,143 16,549
2303 RETIREE PRESCRI DRUG PROG 77,583 89,807 99,167 98,862 118,600 19,738
2310 DENTAL INSURANCE 2,236 2,504 3,155 3,286 4,535 1,249
2311 RETIREE DENTAL INSURANCE 12,065 8,022 7,476 12,587 9,514 (3,073)
2400 GROUP LIFE INSURANCE 2,740 3,619 3,551 3,902 4,257 355
2500 DISABILITY INS (PLAN 1&2) - - 542 635 410 (225)
2510 DISABILITY INS (HYBRID) - - 299 314 440 126
2750 RETIREE HEALTH CREDIT - - 3,162 3,475 3,607 132
2800 RETIREE SICK LEAVE PAY - 5,640 15 1,254 1,254 -
2810 ANNUAL LEAVE PAYOFF 2,901 26,734 497 2,901 2,901 -
3000 PURCHASED SERVICES - - 709 - - -
3001 PROFESSIONAL IMPROVEMENT 9,355 11,317 7,988 4,349 5,349 1,000
3180 LEGAL FEES - 31,009 - - - -
3310 REPAIRS TO EQUIPMENT - - - 1,080 2,778 1,698
3320 MAINTENANCE CONTRACTS - 630 630 630 630 -
5203 TELEPHONE 7,449 10,923 9,633 8,955 8,955 -
5302 UNEMPLOYMENT COMP INS 2,197 4,978 1,911 2,997 2,997 -
5401 LEASE/RENTALS 2,043 2,318 2,337 2,300 2,300 -
5500 TRAVEL 657 10 49 1,008 1,008 -
6001 OFFICE SUPPLIES 8,498 7,529 6,195 8,817 7,817 (1,000)
8100 REPLACEMENT EQUIPMENT - 10,329 - - - -
Total $ 663,826 $ 820,857 $ 764,400 $ 852,331 $ 902,737 $ 50,406
0.0%
0.0%
0.0%
0.0%
(11.3%)
0.0%
0.0%
0.0%
23.0%
0.0%
157.2%
0.0%
(24.4%)
9.1%
(35.4%)
40.1%
3.8%
0.0%
(14.2%)
45.8%
28.4%
6.9%
20.0%
38.0%
4100 MAINT - MGMT & DIRECTION Change
5.9%
3.0%
1.9%
(6.0%)
(2.8%)
%
Change
Operating Fund (Fund 5) - Maintenance Department
Expenditure Trends by Function and Object (4100)
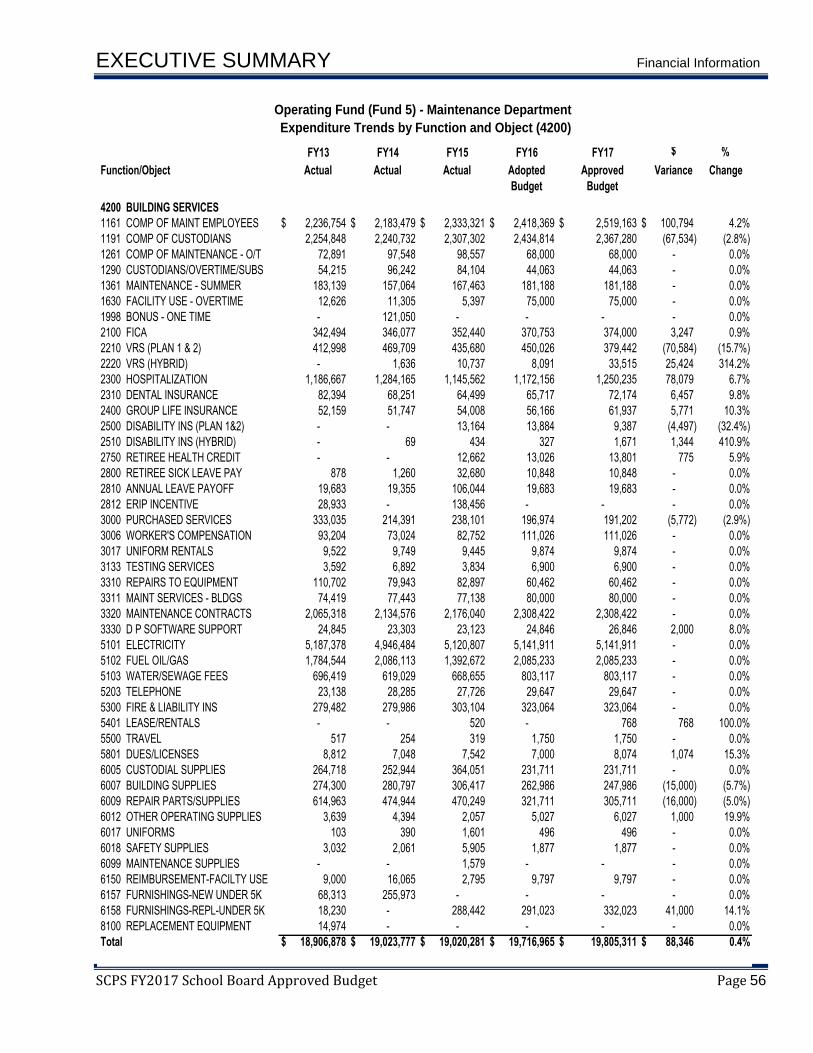
EXECUTIVE SUMMARY Financial Information
SCPS FY2017 School Board Approved Budget Page 56
FY13 FY14 FY15 FY16 FY17 $
Function/Object Actual Actual Actual Adopted
Budget
Approved
Budget
Variance
Actual Actual Actual Adopted Recommended Variance1161 COMP OF MAINT EMPLOYEES $ 2,236,754 $ 2,183,479 $ 2,333,321 $ 2,418,369 $ 2,519,163 $ 100,794
1191 COMP OF CUSTODIANS 2,254,848 2,240,732 2,307,302 2,434,814 2,367,280 (67,534)
1261 COMP OF MAINTENANCE - O/T 72,891 97,548 98,557 68,000 68,000 -
1290 CUSTODIANS/OVERTIME/SUBS 54,215 96,242 84,104 44,063 44,063 -
1361 MAINTENANCE - SUMMER 183,139 157,064 167,463 181,188 181,188 -
1630 FACILITY USE - OVERTIME 12,626 11,305 5,397 75,000 75,000 -
1998 BONUS - ONE TIME - 121,050 - - - -
2100 FICA 342,494 346,077 352,440 370,753 374,000 3,247
2210 VRS (PLAN 1 & 2) 412,998 469,709 435,680 450,026 379,442 (70,584)
2220 VRS (HYBRID) - 1,636 10,737 8,091 33,515 25,424
2300 HOSPITALIZATION 1,186,667 1,284,165 1,145,562 1,172,156 1,250,235 78,079
2310 DENTAL INSURANCE 82,394 68,251 64,499 65,717 72,174 6,457
2400 GROUP LIFE INSURANCE 52,159 51,747 54,008 56,166 61,937 5,771
2500 DISABILITY INS (PLAN 1&2) - - 13,164 13,884 9,387 (4,497)
2510 DISABILITY INS (HYBRID) - 69 434 327 1,671 1,344
2750 RETIREE HEALTH CREDIT - - 12,662 13,026 13,801 775
2800 RETIREE SICK LEAVE PAY 878 1,260 32,680 10,848 10,848 -
2810 ANNUAL LEAVE PAYOFF 19,683 19,355 106,044 19,683 19,683 -
2812 ERIP INCENTIVE 28,933 - 138,456 - - -
3000 PURCHASED SERVICES 333,035 214,391 238,101 196,974 191,202 (5,772)
3006 WORKER'S COMPENSATION 93,204 73,024 82,752 111,026 111,026 -
3017 UNIFORM RENTALS 9,522 9,749 9,445 9,874 9,874 -
3133 TESTING SERVICES 3,592 6,892 3,834 6,900 6,900 -
3310 REPAIRS TO EQUIPMENT 110,702 79,943 82,897 60,462 60,462 -
3311 MAINT SERVICES - BLDGS 74,419 77,443 77,138 80,000 80,000 -
3320 MAINTENANCE CONTRACTS 2,065,318 2,134,576 2,176,040 2,308,422 2,308,422 -
3330 D P SOFTWARE SUPPORT 24,845 23,303 23,123 24,846 26,846 2,000
5101 ELECTRICITY 5,187,378 4,946,484 5,120,807 5,141,911 5,141,911 -
5102 FUEL OIL/GAS 1,784,544 2,086,113 1,392,672 2,085,233 2,085,233 -
5103 WATER/SEWAGE FEES 696,419 619,029 668,655 803,117 803,117 -
5203 TELEPHONE 23,138 28,285 27,726 29,647 29,647 -
5300 FIRE & LIABILITY INS 279,482 279,986 303,104 323,064 323,064 -
5401 LEASE/RENTALS - - 520 - 768 768
5500 TRAVEL 517 254 319 1,750 1,750 -
5801 DUES/LICENSES 8,812 7,048 7,542 7,000 8,074 1,074
6005 CUSTODIAL SUPPLIES 264,718 252,944 364,051 231,711 231,711 -
6007 BUILDING SUPPLIES 274,300 280,797 306,417 262,986 247,986 (15,000)
6009 REPAIR PARTS/SUPPLIES 614,963 474,944 470,249 321,711 305,711 (16,000)
6012 OTHER OPERATING SUPPLIES 3,639 4,394 2,057 5,027 6,027 1,000
6017 UNIFORMS 103 390 1,601 496 496 -
6018 SAFETY SUPPLIES 3,032 2,061 5,905 1,877 1,877 -
6099 MAINTENANCE SUPPLIES - - 1,579 - - -
6150 REIMBURSEMENT-FACILTY USE 9,000 16,065 2,795 9,797 9,797 -
6157 FURNISHINGS-NEW UNDER 5K 68,313 255,973 - - - -
6158 FURNISHINGS-REPL-UNDER 5K 18,230 - 288,442 291,023 332,023 41,000
8100 REPLACEMENT EQUIPMENT 14,974 - - - - -
Total $ 18,906,878 $ 19,023,777 $ 19,020,281 $ 19,716,965 $ 19,805,311 $ 88,346
Operating Fund (Fund 5) - Maintenance Department
Expenditure Trends by Function and Object (4200)
%
Change
4200 BUILDING SERVICES Change4.2%
(2.8%)
0.0%
0.0%
0.0%
0.0%
0.0%
0.9%
(15.7%)
314.2%
6.7%
9.8%
10.3%
(32.4%)
410.9%
5.9%
0.0%
0.0%
0.0%
(2.9%)
0.0%
0.0%
0.0%
0.0%
0.0%
0.0%
8.0%
0.0%
0.0%
0.0%
0.0%
0.0%
100.0%
0.0%
15.3%
0.0%
(5.7%)
(5.0%)
19.9%
0.0%
0.0%
0.0%
0.0%
0.0%
14.1%
0.0%
0.4%

EXECUTIVE SUMMARY Financial Information
SCPS FY2017 School Board Approved Budget Page 57
FY13 FY14 FY15 FY16 FY17 $
Function/Object Actual Actual Actual Adopted
Budget
Approved
Budget
Variance
Actual Actual Actual Adopted Recommended Variance3000 PURCHASED SERVICES $ 194,513 $ 161,199 $ 195,571 $ 84,280 $ 74,280 $ (10,000)
3310 REPAIRS TO EQUIPMENT 5,385 4,738 6,900 14,373 14,373 -
3320 MAINTENANCE CONTRACTS 4,794 4,794 3,908 5,000 5,000 -
5401 LEASE/RENTALS 12,491 6,014 8,436 6,816 6,048 (768)
6006 AGRICULTURAL SUPPLIES 27,064 39,044 20,668 23,914 23,914 -
6008 GASOLINE/OIL/LUBRICANTS 8,811 24,405 14,021 11,150 11,150 -
6009 REPAIR PARTS/SUPPLIES 31,021 25,845 54,364 19,777 19,777 -
Total $ 284,079 $ 266,039 $ 303,868 $ 165,310 $ 154,542 $ (10,768)
Actual Actual Actual Adopted Recommended Variance3310 REPAIRS TO EQUIPMENT $ 59,504 $ 66,486 $ 48,933 $ 60,549 $ 60,549 $ -
3320 MAINTENANCE CONTRACTS 275,861 269,428 218,752 237,304 237,304 -
6008 GASOLINE/OIL/LUBRICANTS 1,839 510 135 1,575 1,575 -
6009 REPAIR PARTS/SUPPLIES 38,679 86,586 63,317 30,842 30,842 -
6099 MAINTENANCE SUPPLIES - - 3,045 - - -
8100 REPLACEMENT EQUIPMENT - 2,434 - - - -
8200 NEW EQUIPMENT - 23,168 25,882 - - -
Total $ 375,883 $ 448,612 $ 360,064 $ 330,270 $ 330,270 $ 0
Actual Actual Actual Adopted Recommended Variance3000 PURCHASED SERVICES - $ 1,143 $ 813 - - $ -
3308 VEHICLE REPAIRS 82,470 88,024 99,354 105,908 107,306 1,398
5309 FLEET INSURANCE 12,317 10,858 10,518 14,000 14,000 -
6008 GASOLINE/OIL/LUBRICANTS 165,544 146,697 121,985 118,000 118,000 -
6009 REPAIR PARTS/SUPPLIES 2,963 3,239 2,008 1,591 1,591 -
Total $ 639,177 $ 698,573 $ 594,742 $ 569,769 $ 571,167 $ 1,398
Maintenance Grand Total $ 20,869,843 $ 21,257,858 $ 21,043,355 $ 21,634,645 $ 21,764,027 $ 129,382 0.6%
0.0%
1.3%
0.0%
0.0%
0.0%
0.2%
0.0%
0.0%
0.0%
0.0%
4500 VEHICLE SERVICES Change
4400 EQUIPMENT SERVICES Change0.0%
0.0%
0.0%
0.0%
0.0%
(11.3%)
0.0%
0.0%
0.0%
(6.5%)
4300 GROUNDS SERVICES Change(11.9%)
0.0%
Operating Fund (Fund 5) - Maintenance Department
Expenditure Trends by Function and Object (4300-4500)
%
Change

EXECUTIVE SUMMARY Financial Information
SCPS FY2017 School Board Approved Budget Page 58
Fund 5 – Operating – Technology - provides for the day-to-day operation of technological services for the school division. The FY17 Approved Budget of $8,459,532, include the adjustment seen below:
Description Amount
· Frozen Steps Adjusted by a 1% Increase $4,006.92
· Step Increase for all Staff $84,869.89
· VRS Rate Increase - Professional Group from 14.06% to 14.66% $21,877.35
· Retiree Health Credit Rate Increase - Professional Group from 1.06% to 1.11% $1,823.14
· VRS Rate Decrease - Non-Professional Group from 8.17% to 6.62% ($1,260.81)
· Group Life Rate Increase from 1.19% to 1.31% $4,473.04
· Increase Dental Rates by 15% $5,333.17
· Increase Health Insurance Rates by 5% for employees and by 11.8% for the employer $70,567.76
· Balance Grants to Projected Revenues ($40,129.00)
· 1% Cost of Living Adjustment (COLA) for all Staff $46,471.44· Adjustments to Retiree Prescription, Health, and Dental due to Increase for FY16 Budget Needs and
……. FY17 Projected Increase$32,502.00
· 1.0 FTE increase to baseline for ITA position approved on 1/11/16 $35,744.52
· Increase Data Communication line for technology due to increased bandwidth needs $80,000.00· Increase Data Processing Software/Information Support for Operational needs of the Student
……..Information System $100,000.00
· Increase Technical Maintenance for maintenance on new network equipment $30,000.00
· 11.0 FTEs - Instructional Technology Assistants to have 1 per school $393,189.72
· Increase DP Software Support due to new Finance/HR System $160,000.00
· Adjustments after the FY 2016 Budget ($26,907.14)
Fund 5 - Technology Total $1,002,562.00
FY13 FY14 FY15 FY16 FY17 $
FunctionFunction/Object Actual Actual Actual Adopted
Budget
Approved
Budget
Variance
Actual Actual Actual Adopted
Budget
Variance
6
8
5204 DATA COMMUNICATION LINES - $ 37,867 $ 65,418 $ 61,254 $ 61,254 $ -
6015 COMPUTER SUPPL/SOFTWARE 919,866 935,326 814,400 922,746 882,617 (40,129)
6035 COMPUTER SOFTWARE 19,887 - - - - -
Total $ 939,753 $ 973,193 $ 879,818 $ 984,000 $ 943,871 $ (40,129)
0.0%
(4.3%)
0.0%
%
Change
Operating Fund (Fund 5) -Technology Department
Expenditure Trends by Function and Object (6810)
(4.1%)
6810 TECHNOLOGY - CLASSROOM Change

EXECUTIVE SUMMARY Financial Information
SCPS FY2017 School Board Approved Budget Page 59
FY13 FY14 FY15 FY16 FY17 $
FunctionFunction/Object Actual Actual Actual Adopted
Budget
Approved
Budget
Variance
Actual Actual Actual Adopted
Budget
Recommended
Budget
Variance
6
8
1110 COMP OF DIRECTORS $ 67,719 $ 67,719 $ 68,875 $ 70,941 $ 72,152 $ 1,211
1121 COMP OF TEACHERS 1,245,744 1,169,731 1,235,501 1,241,946 1,259,592 17,646
1123 COORDINATOR 49,735 49,735 56,637 58,337 60,391 2,054
1130 COMP-PROF SUPV PERSONNEL 170,879 128,124 88,910 91,422 93,574 2,152
1140 COMP-TECHNICAL PERSONNEL 852,926 864,714 992,463 1,073,989 1,187,645 113,656
1141 COMP OF TEACHER ASS'TS 607,445 330,850 357,580 421,039 640,962 219,923
1150 COMP OF CLERICAL STAFF 19,418 13,076 26,954 27,763 28,474 711
1291 OVERTIME-FLSA 2,860 559 - - - -
1520 COMP OF SUB TEACHERS - 35 35 - - -
1600 COMP - SUPPLEMENTS 2,645 - - 2,645 2,645 -
1610 SUPPLEMENTAL PAY 14,762 20,471 50,701 12,264 12,264 -
1998 BONUS - ONE TIME - 56,700 - - - -
2100 FICA 218,829 195,370 207,801 217,668 239,816 22,148
2210 VRS (PLAN 1 & 2) 385,209 332,880 396,628 413,452 454,071 40,619
2220 VRS (HYBRID) - 1,575 12,668 6,597 35,982 29,385
2300 HOSPITALIZATION 468,271 465,687 474,580 506,617 757,754 251,137
2310 DENTAL INSURANCE 36,797 26,894 27,860 29,639 45,610 15,971
2400 GROUP LIFE INSURANCE 35,896 31,260 33,593 35,527 43,791 8,264
2500 DISABILITY INS (PLAN 1&2) - - 7,178 7,763 6,622 (1,141)
2510 DISABILITY INS (HYBRID) - 66 299 155 810 655
2750 RETIREE HEALTH CREDIT - - 29,876 31,645 37,105 5,460
2800 RETIREE SICK LEAVE PAY 7,065 - 4,208 3,787 3,787 -
2812 ERIP INCENTIVE 43,096 - 24,608 - - -
3000 PURCHASED SERVICES 27,666 93,624 93,772 131,384 131,384 -
3001 PROFESSIONAL IMPROVEMENT 11,565 16,906 15,669 13,414 13,414 -
3313 TECHNICAL MAINTENANCE 357,516 516,407 413,307 551,407 581,407 30,000
5204 DATA COMMUNICATION LINES 145,522 101,181 106,148 111,876 191,876 80,000
5500 TRAVEL 16,167 15,870 19,344 28,280 28,280 -
5806 SUBSCRIPTIONS/JOURNALS - - - 180 180 -
6000 MATERIALS & SUPPLIES 3,964 1,156 1,851 2,653 2,653 -
6015 COMPUTER SUPPL/SOFTWARE 42,722 17,181 217,594 20,022 20,022 -
6024 TECHNOLOGY SUPPLIES 254,941 184,485 101,408 68,000 68,000 -
6035 COMPUTER SOFTWARE 45,575 25,209 47,627 60,000 60,000 -
Total $ 5,134,934 $ 4,727,465 $ 5,113,675 $ 5,240,412 $ 6,080,263 $ 839,851
Operating Fund (Fund 5) -Technology Department
Expenditure Trends by Function and Object (6820)
%
Change
6820 TECHNOLOGY -INSTRUCT. SUP Change
1.7%
1.4%
3.5%
2.4%
10.6%
52.2%
2.6%
0.0%
0.0%
0.0%
0.0%
0.0%
10.2%
9.8%
445.4%
49.6%
53.9%
23.3%
(14.7%)
422.6%
17.3%
0.0%
0.0%
0.0%
0.0%
5.4%
71.5%
0.0%
0.0%
0.0%
0.0%
0.0%
0.0%
16.0%

EXECUTIVE SUMMARY Financial Information
SCPS FY2017 School Board Approved Budget Page 60
FY13 FY14 FY15 FY16 FY17 $
Function/Object Actual Actual Actual Adopted
Budget
Approved
Budget
Variance
Actual Actual Actual Adopted
Budget
Recommended
Budget
Variance
1110 COMP OF DIRECTORS - $ 88,277 $ 90,944 $ 93,673 $ 96,500 $ 2,827
1130 COMP-PROF SUPV PERSONNEL 282,365 238,842 246,941 252,291 258,681 6,390
1140 COMP-TECHNICAL PERSONNEL 124,070 103,141 83,710 86,222 - (86,222)
1150 COMP OF CLERICAL STAFF 39,524 39,554 40,676 41,897 43,073 1,176
1291 OVERTIME-FLSA 1,181 114 - - - -
1610 SUPPLEMENTAL PAY 269 195 415 2,000 2,000 -
2100 FICA 32,482 34,321 33,852 35,594 29,835 (5,759)
2210 VRS (PLAN 1 & 2) 56,949 59,960 66,739 66,703 58,384 (8,319)
2300 HOSPITALIZATION 85,289 50,837 46,891 47,040 44,485 (2,555)
2301 RETIREE HEALTH INSURANCE 61,175 74,090 79,804 66,761 99,263 32,502
2303 RETIREE PRESCRI DRUG PROG 5,110 7,110 8,063 8,611 8,611 -
2310 DENTAL INSURANCE 3,775 3,069 2,629 2,629 2,645 16
2311 RETIREE DENTAL INSURANCE 4,157 3,949 4,135 5,274 5,274 -
2400 GROUP LIFE INSURANCE 5,307 5,588 5,477 5,642 5,217 (425)
2500 DISABILITY INS (PLAN 1&2) - - 1,141 1,170 845 (325)
2750 RETIREE HEALTH CREDIT - - 4,879 5,025 4,421 (604)
2810 ANNUAL LEAVE PAYOFF 35,333 23,970 5,758 35,333 35,333 -
3000 PURCHASED SERVICES 38,084 6,614 31,014 40,800 40,800 -
3001 PROFESSIONAL IMPROVEMENT 32,967 32,531 7,224 15,000 15,000 -
3320 MAINTENANCE CONTRACTS 23,090 - 6,672 7,000 7,000 -
3330 D P SOFTWARE SUPPORT 55,754 64,209 62,190 79,200 332,741 253,541
5203 TELEPHONE 4,471 4,906 5,021 4,968 4,968 -
5500 TRAVEL 533 236 590 814 814 -
6001 OFFICE SUPPLIES 2,341 4,325 2,533 2,576 2,576 -
6035 COMPUTER SOFTWARE 110 13,053 1,090 1,610 1,610 -
6036 COMPUTER SUPPLIES 7,766 4,022 10,915 7,700 7,700 -
Total $ 902,102 $ 862,913 $ 849,303 $ 915,533 $ 1,107,776 $ 192,243
Actual Actual Actual Adopted
Budget
Recommended
Budget
Variance1140 COMP-TECHNICAL PERSONNEL $ 147,977 $ 148,191 $ 149,237 $ 157,176 $ 161,208 $ 4,032
2100 FICA 11,000 10,892 11,019 11,728 12,022 294
2210 VRS (PLAN 1 & 2) 18,897 18,995 22,126 22,115 23,633 1,518
2300 HOSPITALIZATION 14,228 15,345 15,731 15,781 17,559 1,778
2310 DENTAL INSURANCE 1,016 858 822 822 945 123
2400 GROUP LIFE INSURANCE 1,761 1,770 1,816 1,870 2,112 242
2500 DISABILITY INS (PLAN 1&2) - - 409 418 344 (74)
2750 RETIREE HEALTH CREDIT - - 1,617 1,666 1,789 123
Total $ 194,879 $ 196,051 $ 202,777 $ 211,576 $ 219,612 $ 8,036
Actual Actual Actual Adopted
Budget
Recommended
Budget
Variance1161 COMP OF MAINT EMPLOYEES $ 74,953 $ 70,218 $ 77,804 $ 80,139 $ 82,157 $ 2,018
2100 FICA 5,167 4,736 5,487 5,809 5,947 138
2210 VRS (PLAN 1 & 2) 6,244 7,732 6,357 6,547 5,439 (1,108)
2300 HOSPITALIZATION 13,795 14,866 11,786 11,146 12,461 1,315
2310 DENTAL INSURANCE 1,220 1,030 712 657 756 99
2400 GROUP LIFE INSURANCE 892 903 926 954 1,076 122
2500 DISABILITY INS (PLAN 1&2) - - 192 197 174 (23)
Total $ 102,271 $ 99,485 $ 103,264 $ 105,449 $ 108,010 $ 2,561
Grand Total $ 7,273,939 $ 6,859,107 $ 7,148,837 $ 7,456,970 $ 8,459,532 $ 1,002,562 13.4%
Operating Fund (Fund 5) -Technology Department
Expenditure Trends by Function and Object (6830-6860)
%
Change
6830 TECHNOLOGY-ADMINISTRATION Change
3.0%
2.5%
(100.0%)
2.8%
0.0%
0.0%
(16.2%)
(12.5%)
(5.4%)
48.7%
0.0%
0.6%
0.0%
(7.5%)
(27.8%)
(12.0%)
0.0%
0.0%
0.0%
0.0%
320.1%
0.0%
0.0%
0.0%
0.0%
0.0%
21.0%
6850 TECHNOLOGY-TRANSPORTATION Change2.6%
2.5%
6.9%
11.3%
14.9%
12.9%
(17.6%)
7.4%
3.8%
6860 TECHNOLOGY-MAINTENANCE Change2.5%
2.4%
2.4%
(16.9%)
11.8%
15.0%
12.8%
(11.6%)

EXECUTIVE SUMMARY Financial Information
SCPS FY2017 School Board Approved Budget Page 61
Debt Service Cost The projected debt service budget for FY17 is $25,922,930 and includes payments on the principal and interest on bonds issued for capital improvement projects, as well as some administrative fees required by the bank servicing the bonds. This is a net increase of $2,706,628 from the FY16 Adopted Budget. The impact of the FY17 CIP borrowing, which will take place in summer 2016, is estimated to be $2,706,628; the final actual amount is dependent on interest rates at the time of issuance. The schools work closely with County Finance to develop debt service projections and interest rates are updated based on the most recent issuance as well as advice from the County’s bond counsel. The chart below shows the interest rate assumptions currently being used for budgeting purposes.
Description 2016 Out Years
7 years (Technology)
2.00% 3.00%
12 years (Transportation)
2.75% 3.75%
20 years (Maintenance)
3.75% 4.75%
Periodically, the County is able to refinance and take advantage of lower interest rates by refunding existing debt, thereby generating cost savings. The 2007 refunding was estimated to yield interest savings of approximately $6.3 million over the remaining term of the bonds. School debt service in FY13 was $28 million before debt refinancing and decreased to its lowest in FY15 when it was $23 million. Based on the approved 2017-2021 CIP, debt service is estimated to increase by $2,706,628, $157,631 and $1,465,953 in FY17, FY18 and FY19, respectively. Then, due to the retirement of old debt being greater than new debt issued, debt payments are projected to decrease by approximately $712,891 in FY20. In FY21, the debt service is estimate to increase by $302,460. Capital project needs are reviewed annually and both CIP and debt service costs are revised accordingly.
FY13 FY14 FY15 FY16 FY17 $
FunctionFunction/Object Actual Actual Actual Adopted
Budget
Approved
Budget
Variance
Actual Actual Actual Adopted
Budget
Recomme
nded
Variance
75800 MISCELLANEOUS $ 21,350 $ 17,400 $ 20,500 $ 32,000 $ 32,000 $ -
5808 BOND ISSUENCE EXPENSES - - 531,576 - - -
9101 PRINCIPAL - BONDS 19,731,249 17,856,330 15,311,694 16,736,023 19,202,442 2,466,419
9103 BOND REFINANCE DEBT SERV 44,236,694 11,697,014 43,145,636 - - -
9201 INTEREST - BONDS 8,410,066 7,491,047 6,854,616 6,448,279 6,688,488 240,209
9203 VSPA BOND CREDIT - 123,692 6,199 - - -
Total $ 72,399,359 $ 37,185,483 $ 65,870,221 $ 23,216,302 $ 25,922,930 $ 2,706,628 11.7%
%
Change
0.00%
0.00%
14.7%
0.00%
3.7%
0.00%
7100 DEBT SERVICEChange

EXECUTIVE SUMMARY Financial Information
SCPS FY2017 School Board Approved Budget Page 62
Capital Improvement Plan (CIP) Budget Results The CIP provides a forecast by which capital maintenance, capital technology, and capital transportation projects required to support Spotsylvania County Public Schools are planned, financed, and constructed. As a planning tool, the CIP addresses needs for the improvement of the division’s technology infrastructure, replacement of major equipment and vehicles, construction of new facilities as needed (including necessary land acquisition), as well as renovations and/or additions to existing school facilities. The capital projects included in the CIP are based on educational program requirements, School Board approved educational policy standards, and the adequacy of existing facilities and equipment to accommodate present and proposed educational programs. Student enrollment and county population trends influence project recommendations. The Capital Improvement Plan is updated annually enabling adjustments to be made based on the latest information. Residential projects and their potential impact on school enrollments will continue to be monitored and the school division will continue to work with the County Planning Department in this effort. Potential educational programming changes may also initiate changes in future CIP projects. Based on the approved 2017-2021 CIP, the CIP budget for FY17 is $27,611,024, an $8,981,499 or 48.2% increase over the FY16 Adopted Budget.
2013 Budget 2014 Budget 2015 Budget
2016 Adopted
Budget
2017 Approved
Budget $ Variance % Change
CIP 6,724,104 12,186,631 7,739,145 18,629,525 27,611,024 8,981,499 48.2%
Debt Service 28,417,437 25,582,348 22,897,604 23,216,302 25,922,930 2,706,628 11.7%
CIP vs. Debt Service
-
5,000,000
10,000,000
15,000,000
20,000,000
25,000,000
30,000,000
35,000,000
2013 Budget 2014 Budget 2015 Budget 2016 AdoptedBudget
2017 ApprovedBudget
CIP vs Debt Service Analysis
CIP Debt Service
FY13 FY14 FY15 FY16 FY17 $
Function/Generic Object/Description
Actual Actual Actual Adopted
Budget
Approved Budget Variance
CAPITAL PROJECTS Actual Actual Actual Adopted
Budget
Recommended
Budget
Variance
3000 PURCHASED SERVICES Non-Personnel Related$ 2,984,929 $ 4,630,430 $ 3,355,758 $ 8,708,490 $ 13,720,000 $ 5,011,510
5000 OTHER CHARGES - 73,717 43,390 - - -
6000 MATERIALS & SUPPLIES 2,021,668 1,480,527 844,285 5,538,807 9,294,334 3,755,527
8000 CAPITAL OUTLAY 3,268,815 4,233,295 1,961,335 4,382,228 4,596,690 214,462
Total for Function Non-Personnel Related$ 8,275,412 $ 10,417,969 $ 6,204,768 $ 18,629,525 $ 27,611,024 $ 8,981,499
%
Change
Change
57.5%
0.0%
67.8%
4.9%
48.2%

EXECUTIVE SUMMARY Financial Information
SCPS FY2017 School Board Approved Budget Page 63
Expenditure Highlights (continued)

EXECUTIVE SUMMARY Financial Information
SCPS FY2017 School Board Approved Budget Page 64
Expenditure Highlights (continued)
Expenditure Adjustments by Generic Object Salaries/Wages – The recommended salaries/wages expenditure budget is $150,859,142, which reflects a net increase of $4,540,072 or 3.1%. This net increase is attributable to the School Board providing a Step and a 1% COLA, restoring/adding 58 net positions. Based on trend data from FY 2009 and through the FY 2017 budget process, the school division has eliminated approximately 60 net full-time equivalent (FTE) positions, primarily through attrition, as outlined in the chart below due to budget challenges. With increased accountability and compliance requirements, this budget includes restoring/adding positions to meet the needs of the division’s growing diversified student population.
FY 10
Adopted FTEs
FY 11 Adopted
FTEs
FY 12 Adopted
FTEs
FY 13 Adopted
FTEs
FY 14 Adopted
FTEs
FY 15 Adopted
FTEs
FY 16 Adopted
FTEs
FY 17 Approved
FTEs
3,197
3,054
3,026
3,027
3,010
3,018
3,079 3,137
Most of the positions were eliminated through a voluntary Early Retirement Incentive Program (ERIP) with the effective dates of June 30, 2009, June 30, 2010, and June 30, 2011. Also, over the past five years 60 central office and ancillary positions totaling $4.8M have been eliminated through restructuring plans and budget strategies. In addition, in the past five years the school division has provided minimal pay raises as reflected in the chart below due to increases in mandatory expenditures outweighing revenue increases and the division’s priority to minimize the negative impact on classroom instruction. For the last two years, FY2016 and FY 2017, the school division has provided pay increases due to increased revenues at the state level coupled with reallocation of funds and use of the division’s health insurance reserve. An ERIP program was implemented as a part of the FY 2016 budget development process to help build budget capacity to fund the 3% employee pay raise.
Fiscal
Year
2010 2011 2012 2013 2014 2015 2016
2017
Approved
Salary
Adjustment
None
None
(Note: Annual net
deduction for
directors and
above - three
furlugh days)
1% COLA
& Prorated
$600 Bonus
None
(Note: All employees
were required to pick up
the 5% VRS employee
share. Thus a 5.8% pay
raise offset was provided
for employees below the
director level with the
intent of breaking even.
A 5% pay raise offset
was provided for
employees at the
director level & above,
which was a net payroll
check reduction)
Prorated
$900
bonus
Step
Increase
and 1%
COLA
3% COLA
Step
Increase
and 1%
COLA
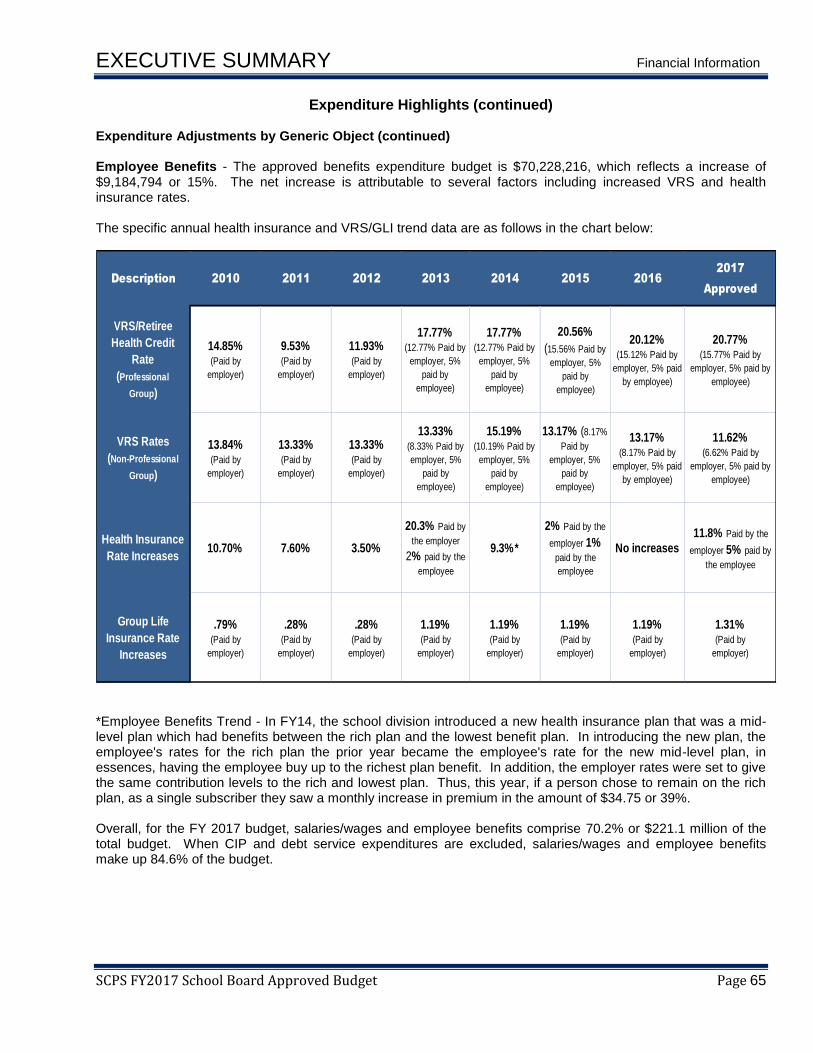
EXECUTIVE SUMMARY Financial Information
SCPS FY2017 School Board Approved Budget Page 65
Expenditure Highlights (continued) Expenditure Adjustments by Generic Object (continued) Employee Benefits - The approved benefits expenditure budget is $70,228,216, which reflects a increase of $9,184,794 or 15%. The net increase is attributable to several factors including increased VRS and health insurance rates. The specific annual health insurance and VRS/GLI trend data are as follows in the chart below:
Description 2010 2011 2012 2013 2014 2015 2016
2017
Approved
VRS/Retiree
Health Credit
Rate
(Professional
Group)
14.85%(Paid by
employer)
9.53%(Paid by
employer)
11.93% (Paid by
employer)
17.77% (12.77% Paid by
employer, 5%
paid by
employee)
17.77% (12.77% Paid by
employer, 5%
paid by
employee)
20.56%
(15.56% Paid by
employer, 5%
paid by
employee)
20.12% (15.12% Paid by
employer, 5% paid
by employee)
20.77% (15.77% Paid by
employer, 5% paid by
employee)
VRS Rates
(Non-Professional
Group)
13.84%(Paid by
employer)
13.33% (Paid by
employer)
13.33% (Paid by
employer)
13.33% (8.33% Paid by
employer, 5%
paid by
employee)
15.19% (10.19% Paid by
employer, 5%
paid by
employee)
13.17% (8.17%
Paid by
employer, 5%
paid by
employee)
13.17% (8.17% Paid by
employer, 5% paid
by employee)
11.62% (6.62% Paid by
employer, 5% paid by
employee)
Health Insurance
Rate Increases10.70% 7.60% 3.50%
20.3% Paid by
the employer
2% paid by the
employee
9.3%*
2% Paid by the
employer 1% paid by the
employee
No increases
11.8% Paid by the
employer 5% paid by
the employee
Group Life
Insurance Rate
Increases
.79%(Paid by
employer)
.28% (Paid by
employer)
.28% (Paid by
employer)
1.19% (Paid by
employer)
1.19% (Paid by
employer)
1.19% (Paid by
employer)
1.19% (Paid by
employer)
1.31% (Paid by
employer)
*Employee Benefits Trend - In FY14, the school division introduced a new health insurance plan that was a mid-level plan which had benefits between the rich plan and the lowest benefit plan. In introducing the new plan, the employee's rates for the rich plan the prior year became the employee's rate for the new mid-level plan, in essences, having the employee buy up to the richest plan benefit. In addition, the employer rates were set to give the same contribution levels to the rich and lowest plan. Thus, this year, if a person chose to remain on the rich plan, as a single subscriber they saw a monthly increase in premium in the amount of $34.75 or 39%. Overall, for the FY 2017 budget, salaries/wages and employee benefits comprise 70.2% or $221.1 million of the total budget. When CIP and debt service expenditures are excluded, salaries/wages and employee benefits make up 84.6% of the budget.

EXECUTIVE SUMMARY Financial Information
SCPS FY2017 School Board Approved Budget Page 66
Expenditure Highlights (continued)
Expenditure Adjustments by Generic Object (continued) Purchased Services – The approved purchased services expenditure budget is $33,656,472, which reflects an increase of $5,649,745 or 20.2%. This object code primarily consists of services acquired from outside sources on a fee basis or fixed income contract basis. The majority of the increase is directly related to the CIP plan. Other Charges – The approved other charges expenditure budget is $10,398,387, which reflects a increase of $117,203 or 1.1%. This object code includes utility, travel, and insurance costs. This line increased primarily due to data communication lines. Materials and Supplies – The approved materials and supplies expenditure budget is $18,983,249 which reflects an increase of $3,954,922 or 26.3%. This object code includes articles or commodities that are consumed or materially altered when used and minor equipment that is not capitalized, including any equipment costing less than $5,000. The majority of the increase is directly related to the CIP plan. Capital Outlay – The approved capital outlay expenditure budget is $4,790,258, which reflects an increase of $126,102 or 2.7%. This object code includes outlays that result in the acquisition of or additions to capitalized assets costing $5,000 or more. This is primarily due to the increase in the CIP pertaining to the purchase of replacement buses and funding capital maintenance projects. Debt Services – The approved debt services expenditure budget is $25,890,930, which reflects an increase of $2,706,628 or 11.7%. This object code includes principal and interest payments to repay bonds issued to fund the adopted CIP. The net increase of $2,706,628 is due to the borrowing of new debt. In summary, revenues have not kept pace with expenditures and balancing each year’s budget on continued reductions is not sustainable while protecting the quality of SCPS’ educational programs. With the need to provide employee pay increases, address diverse student growth needs, and comply with special education mandates in addition to responding to more rigorous accountability standards, expenses were greater than revenues resulting in an anticipated funding gap of $12.6 million.

EXECUTIVE SUMMARY Financial Information
SCPS FY2017 School Board Approved Budget Page 67
Object Description Fund 1 Fund 2 Fund 3 Fund 4 Fund 5 Cip Fund 5 Fund 7 Total
1110 COMP OF DIRECTORS $ 109,558 $ - $ - $ - $ - $ 2,056,332 $ 114,244 $ 2,280,134
1111 COMP OF BOARD MEMBERS - - - - - 84,000 - 84,000
1112 COMP OF SUPERINTENDENT - - - - - 190,000 - 190,000
1113 COMP OF ASST SUPTS - - - - - 289,087 - 289,087
1115 TRAVEL ALLOWANCE - - - - - 15,400 - 15,400
1116 RECERTIFICATION SPCLST - - - - - 88,606 - 88,606
1117 SPECIALISTS - - - - - 207,079 - 207,079
1121 COMP OF TEACHERS 724,191 505,869 - 541,911 - 95,460,265 - 97,232,236
1123 COORDINATOR - - - - - 1,113,878 - 1,113,878
1124 COMP OF INST SUPERVISORS - - - - - 189,962 - 189,962
1126 COMP OF PRINCIPALS - 117,114 - - - 3,575,491 - 3,692,605
1127 COMP OF ASS'T PRINCIPALS - - - - - 3,271,708 - 3,271,708
1130 COMP-PROF SUPV PERSONNEL - - 637,239 - - 430,977 - 1,068,216
1131 COMP OF SCHOOL NURSES - - - - - 1,442,003 - 1,442,003
1132 COMP OF PSYCHOLOGISTS - - - - - 916,120 - 916,120
1134 COMP OF SOCIAL WORKERS - - - - - 1,175,595 - 1,175,595
1135 SUPERVISOR - - - - - 251,441 - 251,441
1136 SUPERVISOR - MAINTENANCE - - - - - 97,036 - 97,036
1139 COMP OF THERAPISTS - - - - - 537,826 - 537,826
1140 COMP-TECHNICAL PERSONNEL 88,419 - - - - 1,578,592 - 1,667,011
1141 COMP OF TEACHER ASS'TS - - - 12,042 - 9,138,440 - 9,150,482
1142 COMP-HEALTH/SAFETY OFFICE - - - - - 271,656 - 271,656
1145 COMP OF CAFETERIA WORKERS - - 607,901 - - - - 607,901
1147 EDUCATIONAL DIAGNOSTICIAN - - - - - 66,664 - 66,664
1150 COMP OF CLERICAL STAFF 54,803 43,073 40,803 72,388 - 5,802,818 84,942 6,098,827
1161 COMP OF MAINT EMPLOYEES - - 39,761 - - 2,601,320 - 2,641,080
1165 COMP OF MECHANICS - - - - - - 735,792 735,792
1170 DRIVER PAY - - - - - 5,369,669 - 5,369,669
1191 COMP OF CUSTODIANS - - - - - 2,367,280 - 2,367,280
1260 COMP OF MECHANICS - O/T - - - - - - 3,500 3,500
1261 COMP OF MAINTENANCE - O/T - - - - - 68,000 - 68,000
1282 DRIVER OVER 20 HOURS - - - - - 824,632 - 824,632
1284 DRIVER OVER 40 HOURS - - - - - 10,000 - 10,000
1285 AIDES OVER 20 HOURS - - - - - 173,778 - 173,778
1286 AIDES OVER 40 HOURS - - - - - 3,000 - 3,000
1290 CUSTODIANS/OVERTIME/SUBS - - - - - 44,063 - 44,063
1291 OVERTIME-FLSA - - - - - 70,000 - 70,000
1321 COMP OF HOMEBOUND TCHRS - - - - - 117,348 - 117,348
1339 THERAPISTS - PART-TIME - - - - - 136,600 - 136,600
1340 DRIVER AIDE - - - - - 651,453 - 651,453
1350 CLERICAL - PART-TIME - - - - - 54,281 - 54,281
1361 MAINTENANCE - SUMMER - - - - - 181,188 - 181,188
Fiscal Year 2017 Expenditure Summary by Object - All Funds (1110 - 1361)

EXECUTIVE SUMMARY Financial Information
SCPS FY2017 School Board Approved Budget Page 68
Object Description Fund 1 Fund 2 Fund 3 Fund 4 Fund 5 Cip Fund 5 Fund 7 Total
1520 COMP OF SUB TEACHERS - 6,000 - - - 1,968,108 - 1,974,108
1521 COMP-NURSING SUBSTITUTE - - - - - 60,438 - 60,438
1535 CAFETERIA MONITORS - - - - - 174,420 - 174,420
1540 CLERICAL - SUBS/OVERTIME - - - - - 34,359 - 34,359
1544 NON-CONTRACTED DRIVER - - - - - 92,400 - 92,400
1545 NON-CONTRACTED BUS AIDE - - - - - 25,256 - 25,256
1600 COMP - SUPPLEMENTS - - - - - 1,267,080 6,200 1,273,280
1610 SUPPLEMENTAL PAY - - 38,000 1,475 - 1,438,638 - 1,478,113
1611 SUPP PAY/SUMMER ENRICHMT 3,000 - - - - - - 3,000
1620 NON-CONTRACTED COMP - - - - - 6,128 - 6,128
1630 FACILITY USE - OVERTIME - - 1,000 - - 75,000 - 76,000
1650 NATIONAL BOARD TCHR BONUS - - - - - 204,505 - 204,505
2100 FICA 72,141 49,347 89,950 47,353 - 10,541,206 67,433 10,867,430
2210 VRS (PLAN 1 & 2) 143,224 83,931 132,759 26,115 - 17,629,988 68,334 18,084,351
2220 VRS (HYBRID) - 13,713 5,982 - - 1,736,001 11,280 1,766,976
2300 HOSPITALIZATION 130,918 106,287 591,229 24,923 - 27,782,662 220,026 28,856,046
2301 RETIREE HEALTH INSURANCE - - 119,965 - - 3,541,520 29,120 3,690,605
2303 RETIREE PRESCRI DRUG PROG - - 63,466 - - 859,453 - 922,919
2310 DENTAL INSURANCE 7,846 6,614 36,465 1,511 - 1,665,460 13,605 1,731,500
2311 RETIREE DENTAL INSURANCE - - 3,647 - - 155,326 1,826 160,799
2400 GROUP LIFE INSURANCE 12,798 8,725 16,667 2,334 - 1,791,248 12,239 1,844,011
2500 DISABILITY INS (PLAN 1&2) 2,078 1,224 2,827 382 - 269,959 1,636 278,106
2510 DISABILITY INS (HYBRID) - 309 135 - - 41,070 562 42,075
2705 SUPERINTENDENT'S ANNUITY - - - - - 10,000 - 10,000
2710 ANNUITY FOR NON-VRS EMP. - - - - - 36,000 - 36,000
2750 RETIREE HEALTH CREDIT 10,844 7,393 7,526 1,977 - 1,423,951 2,453 1,454,146
2800 RETIREE SICK LEAVE PAY - - 14,355 - - 106,216 - 120,571
2810 ANNUAL LEAVE PAYOFF - - - - - 357,991 4,690 362,681
3000 PURCHASED SERVICES 65,000 5,200 81,524 2,689 13,720,000 3,746,364 54,500 17,675,277
3001 PROFESSIONAL IMPROVEMENT - 9,000 - 5,130 - 534,921 2,804 551,855
3002 PRINTING/BINDING 4,000 - - - - 21,910 - 25,910
3005 PARTNERSHIPS - - - - - 1,500 - 1,500
3006 WORKER'S COMPENSATION - - 49,254 - - 580,953 - 630,207
3007 RECRUITING EXPENSES - - - - - 12,010 - 12,010
3008 STAFF TRAINING - - - - - 2,454 - 2,454
3009 STUDENT TRAINING - - - - - 3,364 - 3,364
3014 VERIZON MAINTENANCE 30,000 - - - - - - 30,000
3015 FEES & RELATED SERVICES - - 6,481,631 - - 19,605 - 6,501,236
3017 UNIFORM RENTALS - - - - - 9,874 4,500 14,374
3101 INSTRUCTIONAL DEVELOPMENT 8,000 - - - - - - 8,000
3104 FIELD TRIPS 60,000 - - - - - - 60,000
3110 MEDICAL SERVICES - - - - - 14,020 - 14,020
3133 TESTING SERVICES - - - - - 6,900 - 6,900
3180 LEGAL FEES - - - - - 117,254 - 117,254
Fiscal Year 2017 Expenditure Summary by Object - All Funds (1520 - 3180)
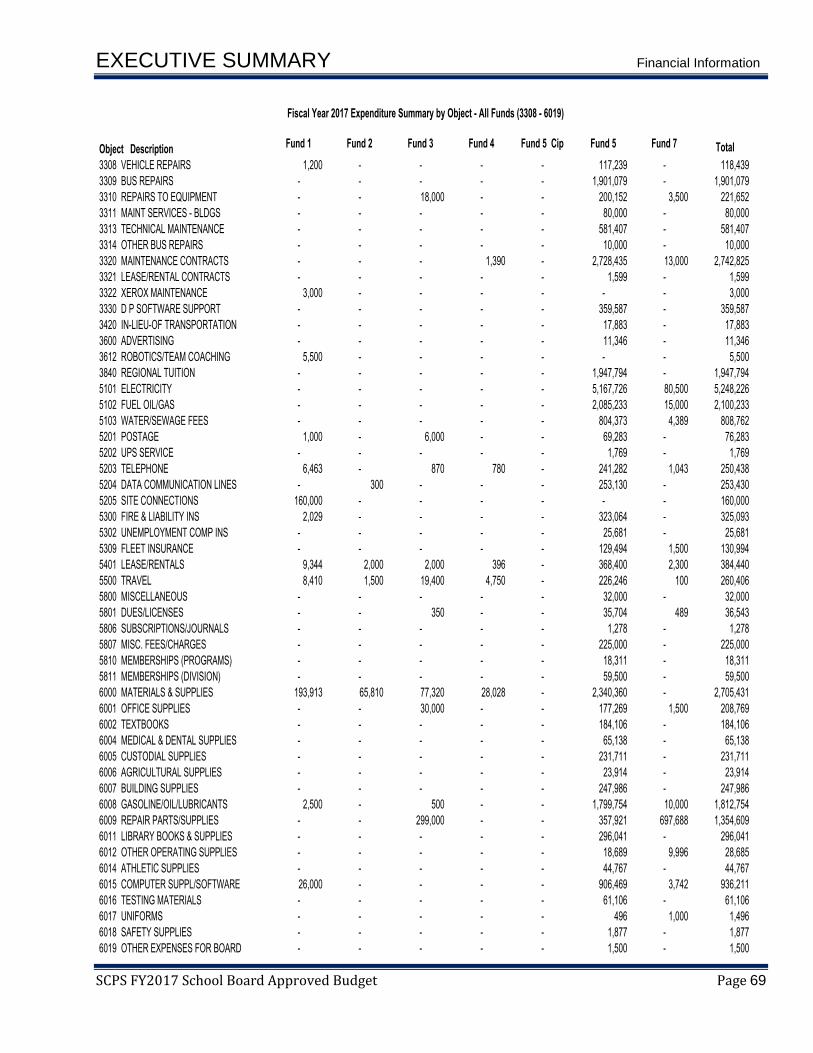
EXECUTIVE SUMMARY Financial Information
SCPS FY2017 School Board Approved Budget Page 69
Object Description Fund 1 Fund 2 Fund 3 Fund 4 Fund 5 Cip Fund 5 Fund 7 Total
3308 VEHICLE REPAIRS 1,200 - - - - 117,239 - 118,439
3309 BUS REPAIRS - - - - - 1,901,079 - 1,901,079
3310 REPAIRS TO EQUIPMENT - - 18,000 - - 200,152 3,500 221,652
3311 MAINT SERVICES - BLDGS - - - - - 80,000 - 80,000
3313 TECHNICAL MAINTENANCE - - - - - 581,407 - 581,407
3314 OTHER BUS REPAIRS - - - - - 10,000 - 10,000
3320 MAINTENANCE CONTRACTS - - - 1,390 - 2,728,435 13,000 2,742,825
3321 LEASE/RENTAL CONTRACTS - - - - - 1,599 - 1,599
3322 XEROX MAINTENANCE 3,000 - - - - - - 3,000
3330 D P SOFTWARE SUPPORT - - - - - 359,587 - 359,587
3420 IN-LIEU-OF TRANSPORTATION - - - - - 17,883 - 17,883
3600 ADVERTISING - - - - - 11,346 - 11,346
3612 ROBOTICS/TEAM COACHING 5,500 - - - - - - 5,500
3840 REGIONAL TUITION - - - - - 1,947,794 - 1,947,794
5101 ELECTRICITY - - - - - 5,167,726 80,500 5,248,226
5102 FUEL OIL/GAS - - - - - 2,085,233 15,000 2,100,233
5103 WATER/SEWAGE FEES - - - - - 804,373 4,389 808,762
5201 POSTAGE 1,000 - 6,000 - - 69,283 - 76,283
5202 UPS SERVICE - - - - - 1,769 - 1,769
5203 TELEPHONE 6,463 - 870 780 - 241,282 1,043 250,438
5204 DATA COMMUNICATION LINES - 300 - - - 253,130 - 253,430
5205 SITE CONNECTIONS 160,000 - - - - - - 160,000
5300 FIRE & LIABILITY INS 2,029 - - - - 323,064 - 325,093
5302 UNEMPLOYMENT COMP INS - - - - - 25,681 - 25,681
5309 FLEET INSURANCE - - - - - 129,494 1,500 130,994
5401 LEASE/RENTALS 9,344 2,000 2,000 396 - 368,400 2,300 384,440
5500 TRAVEL 8,410 1,500 19,400 4,750 - 226,246 100 260,406
5800 MISCELLANEOUS - - - - - 32,000 - 32,000
5801 DUES/LICENSES - - 350 - - 35,704 489 36,543
5806 SUBSCRIPTIONS/JOURNALS - - - - - 1,278 - 1,278
5807 MISC. FEES/CHARGES - - - - - 225,000 - 225,000
5810 MEMBERSHIPS (PROGRAMS) - - - - - 18,311 - 18,311
5811 MEMBERSHIPS (DIVISION) - - - - - 59,500 - 59,500
6000 MATERIALS & SUPPLIES 193,913 65,810 77,320 28,028 - 2,340,360 - 2,705,431
6001 OFFICE SUPPLIES - - 30,000 - - 177,269 1,500 208,769
6002 TEXTBOOKS - - - - - 184,106 - 184,106
6004 MEDICAL & DENTAL SUPPLIES - - - - - 65,138 - 65,138
6005 CUSTODIAL SUPPLIES - - - - - 231,711 - 231,711
6006 AGRICULTURAL SUPPLIES - - - - - 23,914 - 23,914
6007 BUILDING SUPPLIES - - - - - 247,986 - 247,986
6008 GASOLINE/OIL/LUBRICANTS 2,500 - 500 - - 1,799,754 10,000 1,812,754
6009 REPAIR PARTS/SUPPLIES - - 299,000 - - 357,921 697,688 1,354,609
6011 LIBRARY BOOKS & SUPPLIES - - - - - 296,041 - 296,041
6012 OTHER OPERATING SUPPLIES - - - - - 18,689 9,996 28,685
6014 ATHLETIC SUPPLIES - - - - - 44,767 - 44,767
6015 COMPUTER SUPPL/SOFTWARE 26,000 - - - - 906,469 3,742 936,211
6016 TESTING MATERIALS - - - - - 61,106 - 61,106
6017 UNIFORMS - - - - - 496 1,000 1,496
6018 SAFETY SUPPLIES - - - - - 1,877 - 1,877
6019 OTHER EXPENSES FOR BOARD - - - - - 1,500 - 1,500
Fiscal Year 2017 Expenditure Summary by Object - All Funds (3308 - 6019)

EXECUTIVE SUMMARY Financial Information
SCPS FY2017 School Board Approved Budget Page 70
Object Description Fund 1 Fund 2 Fund 3 Fund 4 Fund 5 Cip Fund 5 Fund 7 Total
6024 TECHNOLOGY SUPPLIES - - - - 9,294,334 68,000 - 9,362,334
6028 TIRES & TUBES - NEW - - - - - - 160,000 160,000
6029 TIRES - RECAPPED - - - - - - 60,000 60,000
6030 CLEANING SUPPLIES - - - - - - 1,500 1,500
6034 ASSISTIVE TECHNOLOGY - - - - - 57,300 - 57,300
6035 COMPUTER SOFTWARE - - - - - 63,014 - 63,014
6036 COMPUTER SUPPLIES - - - - - 122,451 - 122,451
6041 SCHOOL SUPPORT SUPPLIES - - - - - 69,146 - 69,146
6042 PARENT EDUCATION SUPPLIES - - - - - 1,500 - 1,500
6045 BAND SUPPLIES - - - - - 49,595 - 49,595
6046 ACADEMIC ACTIVITIES SUPP - - - - - 30,793 - 30,793
6049 FLUIDS/LUBRICANTS - - - - - - 60,000 60,000
6060 FOOD - - - - - 1,000 - 1,000
6092 EMPLOYEE RECOGNITION PROG - - - - - 6,000 - 6,000
6093 INSTRUCT PROGRAM SUPPLIES - - - - - 17,000 - 17,000
6095 GUIDANCE SUPPLIES - - - - - 7,686 - 7,686
6100 STRINGS PROGRAM SUPPLIES - - - - - 34,444 - 34,444
6101 TESTING SUPPLIES - - - - - 16,137 - 16,137
6102 SUPPLEMENTAL MATERIALS - - - - - 51,711 - 51,711
6104 CHORUS PROGRAM - - - - - 13,691 - 13,691
6150 REIMBURSEMENT-FACILTY USE - - - - - 9,797 - 9,797
6151 ATHLETIC TRAINER SUPPLIES - - - - - 8,466 - 8,466
6152 TRAINING MATERIALS - - - - - 3,213 - 3,213
6158 FURNISHINGS-REPL-UNDER 5K - - - - - 332,023 - 332,023
6300 INSTR. SUPPLEMENTAL MAT. 49,653 - - - - - - 49,653
6301 TECH MAINT/UPGRADES 162,053 - - - - - - 162,053
6302 SUM/NEW STUDENT ORIENT 1,200 - - - - - - 1,200
6303 SUMMER ENRICHMENT 7,000 - - - - - - 7,000
6500 DONATIONS-SPECIAL PROGRAM - - - - - 18,178 264 18,442
8100 REPLACEMENT EQUIPMENT - 13,000 - - - 15,824 38,225 67,049
8101 REPLACEMENT OF BUSES - - - - 3,901,268 95,200 - 3,996,468
8200 NEW EQUIPMENT - - - - 459,991 18,675 12,644 491,310
8201 BUSES - ADDITIONAL - - - - 235,431 - - 235,431
9101 PRINCIPAL - BONDS - - - - - 19,202,442 - 19,202,442
9201 INTEREST - BONDS - - - - - 6,688,488 - 6,688,488
Grand Total $ 2,166,085 $ 1,046,409 $ 9,515,526 $ 775,574 $ 27,611,024 $ 271,073,970 $ 2,618,067 $ 314,806,654
Fiscal Year 2017 Expenditure Summary by Object - All Funds (6024- 9201)

EXECUTIVE SUMMARY Financial Information
SCPS FY2017 School Board Approved Budget Page 71
Allocation of Positions Total full-time equivalent (FTE) positions in the SCPS operation have increased by 58 positions from 3,079 FTEs in the FY 2016 Adopted Budget to 3,137 FTEs in the FY 2017 School Board Approved Budget. After the FY 2016 budget was adopted in May 2015, the SB passed a Budget Amendment in August 2015 to add 1 Behavior Specialist, 1 Speech Therapist, 1 Private Day Case Manager and 12 Special Education Teachers, increasing the FTE count from 3,079 to 3,094. In January 2016, a new Instructional Technology Aide position was adopted by the SB increasing the FTE from 3,094 to 3,095. During FY16, the SB also passed a Budget Amendment to re-class two custodian positions to 2 maintenance positions. A Special Education Teacher position was also re-classed to a Social Worker position. A vacant Math Specialist position was eliminated as part of the FY17 School Board Approved Budget as Title II funds were no longer sufficient to fund the position in the grant. In addition, two Café Managers and two Café Worker positions were transitioned over to the 3rd party Food Service vendor due to retirements, thus the reductions decreased the FTE count from 3,095 to 3,090. In addition, as part of the normal FY 2017 budget development process, the Bridges Program Manager grant position was eliminated and will be restored when the actual grant is approved by the Board of Supervisors in the summer of 2016. The 47 positions listed below plus the FTE count of 3,090 equals 3,137 FTEs. • 2 ESOL Teaching Positions • 10 Middle School Math Teaching Positions • 4 ECSE Teacher Positions • 8 ECSE Para-educator Positions • 1 Social Worker • 1 Psychologist • 1 Speech Therapist • 1 Occupational Therapist • 2 Special Education Teaching Positions • 4 Special Education Para-educator Positions • 1 Autism Coordinator • 11 Instructional Technology Aide Positions • 1 Transportation Dispatcher Position
FY13 FY14 FY15 FY16 FY17 %
Actual Actual Actual Adopted
Budget
Approved
Budget
Variance Change
INSTRUCTION 2,243.3800 2,247.7550 2,249.7550 2,290.8800 2,336.88 46.0000 2.0%
TRANSPORTATION 401.3500 401.3500 410.3500 425.3500 426.35 1.0000 0.2%
ADMINISTRATION 97.0000 92.9000 92.9000 97.4000 100.4 3.0000 3.1%
MAINTENANCE 137.2664 137.2664 137.2664 137.2664 137.2664 - 0.0%
TECHNOLOGY 78.0000 66.2000 66.2000 67.2000 79.2 12.0000 17.9%
FOOD SERVICE 70.0000 65.0000 62.0000 61.0000 57 (4.0000) (6.6%)
Grand Total 3,026.9964 3,010.4714 3,018.4714 3,079.0964 3,137.10 58.0000 1.9%
FTE Trend by Category - All Funds

EXECUTIVE SUMMARY Financial Information
SCPS FY2017 School Board Approved Budget Page 72
Allocation of Positions (continued)
FY16 FY17
Function Description Adopted
Budget
Approved
Budget
INSTRUCTION1100 CLASSROOM INSTRUCTION 1,931.5300 1,973.9300 42.4000 2.2%
1210 GUIDANCE SERVICES 77.0000 78.0000 1.0000 1.3%
1220 SCHOOL SOCIAL WORKERS SVC 20.0000 24.0000 4.0000 20.0%
1310 IMPROVEMT OF INSTRUCTION 38.3500 38.9500 0.6000 1.6%
1320 MEDIA SERVICES 64.0000 63.0000 (1.0000) (1.6%)
1410 OFFICE OF THE PRINCIPAL 160.0000 159.0000 (1.0000) (0.6%)
INSTRUCTION - Subtotal 2,290.8800 2,336.8800 46.0000 2.0%
ADM INISTRATION2110 BOARD SERVICES 8.0000 8.0000 - 0.0%
2120 EXECUTIVE ADMIN SERVICES 4.7000 4.7000 - 0.0%
2130 PUBLIC INFORMATION 3.3000 3.3000 - 0.0%
2140 HUMAN RESOURCES 11.5000 11.5000 - 0.0%
2150 PLANNING SERVICES 0.5000 0.5000 - 0.0%
2160 FISCAL SERVICES 14.0000 14.0000 - 0.0%
2170 PURCHASING 2.0000 2.0000 - 0.0%
ADMINISTRATION - Subtotal 44.0000 44.0000 - 0.0%
ATTENDANCE/HEALTH2220 HEALTH SERVICES 40.4000 42.4000 2.0000 5.0%
2230 PSYCHOLOGICAL SERVICES 13.0000 14.0000 1.0000 7.7%
ATTENDANCE/HEALTH - Subtotal 53.4000 56.4000 3.0000 5.6%
TRANSPORTATION3100 TRANSP - MGMT & DIRECTION 13.3500 14.3500 1.0000 7.5%
3200 VEHICLE OPERATION SVCS 393.0000 393.0000 - 0.0%
3400 VEHICLE MAINTENANCE SVCS 19.0000 19.0000 - 0.0%
TRANSPORTATION - Subtotal 425.3500 426.3500 1.0000 0.2%
M AINTENANCE4100 MAINT - MGMT & DIRECTION 5.0000 5.0000 - 0.0%
4200 BUILDING SERVICES 132.2664 132.2664 - 0.0%
MAINTENANCE - Subtotal 137.2664 137.2664 - 0.0%
SCHOOL FOOD5100 SCHOOL FOOD SERVICES 61.0000 57.0000 (4.0000) (6.6%)
SCHOOL FOOD - Subtotal 61.0000 57.0000 (4.0000) (6.6%)
TECHNOLOGY6820 TECHNOLOGY -INSTRUCT. SUP 57.2000 70.2000 13.0000 22.7%
6830 TECHNOLOGY-ADMINISTRATION 6.0000 5.0000 (1.0000) (16.7%)
6850 TECHNOLOGY-TRANSPORTATION 3.0000 3.0000 - 0.0%
6860 TECHNOLOGY-MAINTENANCE 1.0000 1.0000 - 0.0%
TECHNOLOGY - Subtotal 67.2000 79.2000 12.0000 17.9%
Grand Total 3,079.0964 3,137.0964 58.0000 1.9%
FTE Summary by Function - All Funds
Total
Variance% Change
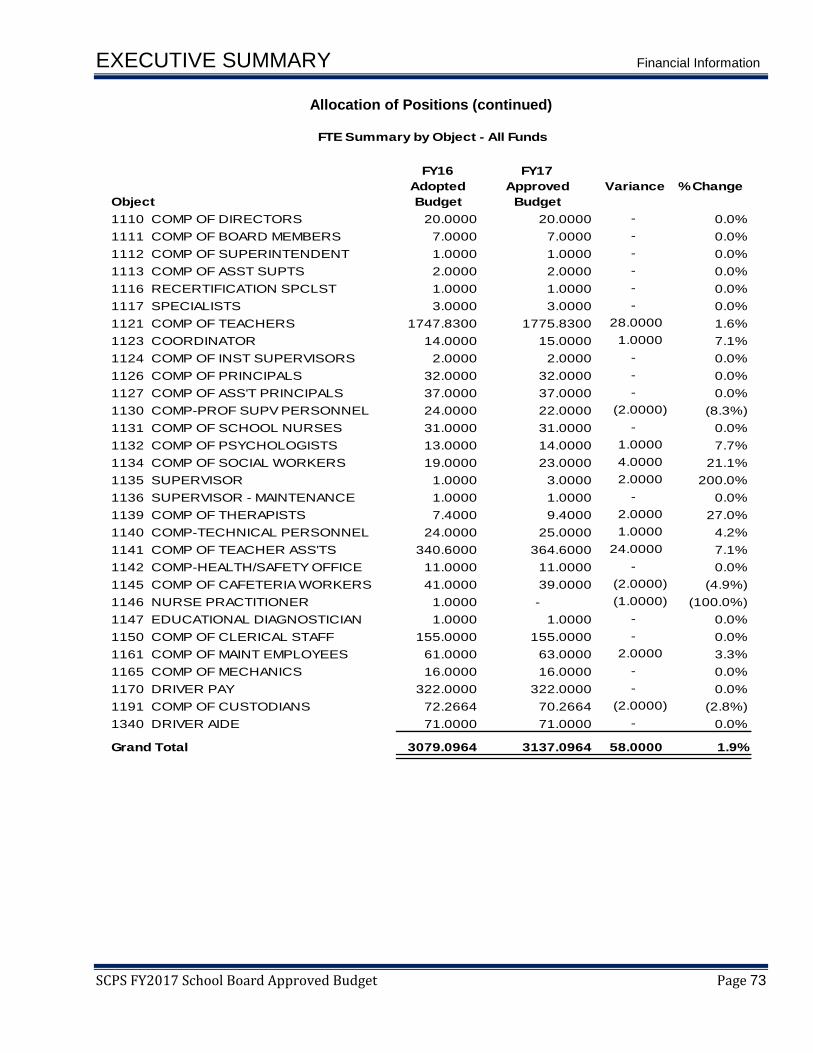
EXECUTIVE SUMMARY Financial Information
SCPS FY2017 School Board Approved Budget Page 73
Allocation of Positions (continued)
FY16 FY17
Object
Adopted
Budget
Approved
Budget
Variance % Change
1110 COMP OF DIRECTORS 20.0000 20.0000 - 0.0%
1111 COMP OF BOARD MEMBERS 7.0000 7.0000 - 0.0%
1112 COMP OF SUPERINTENDENT 1.0000 1.0000 - 0.0%
1113 COMP OF ASST SUPTS 2.0000 2.0000 - 0.0%
1116 RECERTIFICATION SPCLST 1.0000 1.0000 - 0.0%
1117 SPECIALISTS 3.0000 3.0000 - 0.0%
1121 COMP OF TEACHERS 1747.8300 1775.8300 28.0000 1.6%
1123 COORDINATOR 14.0000 15.0000 1.0000 7.1%
1124 COMP OF INST SUPERVISORS 2.0000 2.0000 - 0.0%
1126 COMP OF PRINCIPALS 32.0000 32.0000 - 0.0%
1127 COMP OF ASS'T PRINCIPALS 37.0000 37.0000 - 0.0%
1130 COMP-PROF SUPV PERSONNEL 24.0000 22.0000 (2.0000) (8.3%)
1131 COMP OF SCHOOL NURSES 31.0000 31.0000 - 0.0%
1132 COMP OF PSYCHOLOGISTS 13.0000 14.0000 1.0000 7.7%
1134 COMP OF SOCIAL WORKERS 19.0000 23.0000 4.0000 21.1%
1135 SUPERVISOR 1.0000 3.0000 2.0000 200.0%
1136 SUPERVISOR - MAINTENANCE 1.0000 1.0000 - 0.0%
1139 COMP OF THERAPISTS 7.4000 9.4000 2.0000 27.0%
1140 COMP-TECHNICAL PERSONNEL 24.0000 25.0000 1.0000 4.2%
1141 COMP OF TEACHER ASS'TS 340.6000 364.6000 24.0000 7.1%
1142 COMP-HEALTH/SAFETY OFFICE 11.0000 11.0000 - 0.0%
1145 COMP OF CAFETERIA WORKERS 41.0000 39.0000 (2.0000) (4.9%)
1146 NURSE PRACTITIONER 1.0000 - (1.0000) (100.0%)
1147 EDUCATIONAL DIAGNOSTICIAN 1.0000 1.0000 - 0.0%
1150 COMP OF CLERICAL STAFF 155.0000 155.0000 - 0.0%
1161 COMP OF MAINT EMPLOYEES 61.0000 63.0000 2.0000 3.3%
1165 COMP OF MECHANICS 16.0000 16.0000 - 0.0%
1170 DRIVER PAY 322.0000 322.0000 - 0.0%
1191 COMP OF CUSTODIANS 72.2664 70.2664 (2.0000) (2.8%)
1340 DRIVER AIDE 71.0000 71.0000 - 0.0%
Grand Total 3079.0964 3137.0964 58.0000 1.9%
FTE Summary by Object - All Funds
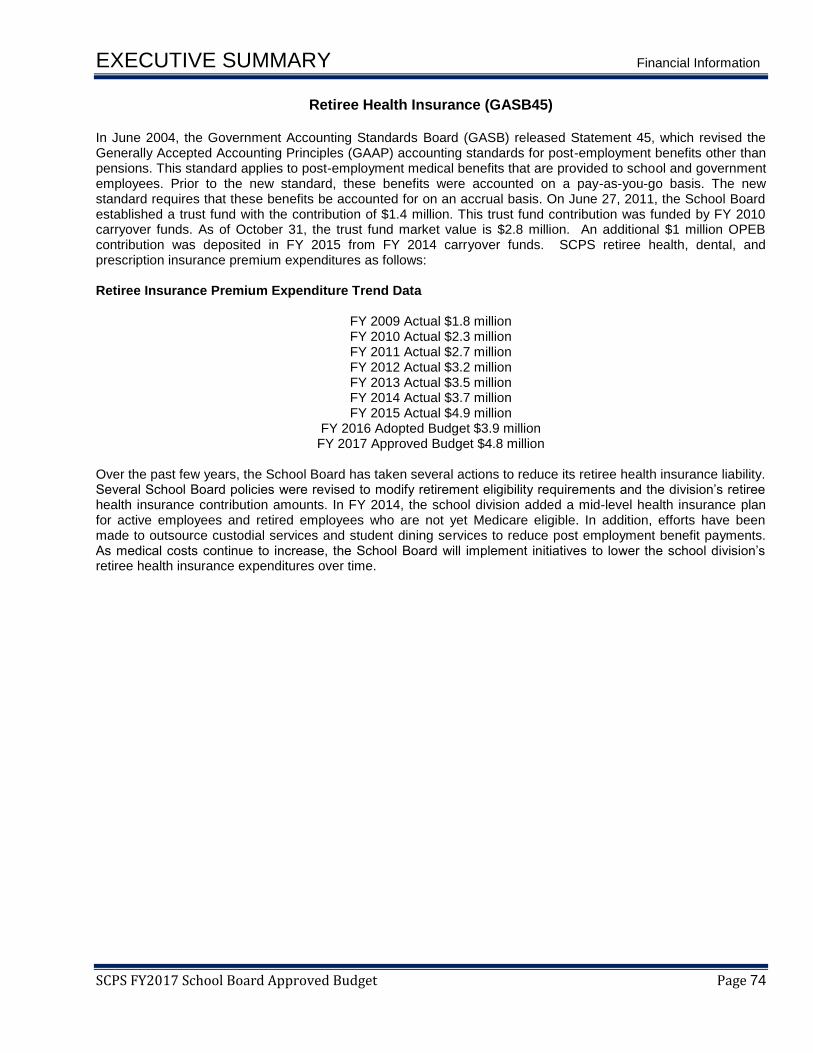
EXECUTIVE SUMMARY Financial Information
SCPS FY2017 School Board Approved Budget Page 74
Retiree Health Insurance (GASB45) In June 2004, the Government Accounting Standards Board (GASB) released Statement 45, which revised the Generally Accepted Accounting Principles (GAAP) accounting standards for post-employment benefits other than pensions. This standard applies to post-employment medical benefits that are provided to school and government employees. Prior to the new standard, these benefits were accounted on a pay-as-you-go basis. The new standard requires that these benefits be accounted for on an accrual basis. On June 27, 2011, the School Board established a trust fund with the contribution of $1.4 million. This trust fund contribution was funded by FY 2010 carryover funds. As of October 31, the trust fund market value is $2.8 million. An additional $1 million OPEB contribution was deposited in FY 2015 from FY 2014 carryover funds. SCPS retiree health, dental, and prescription insurance premium expenditures as follows: Retiree Insurance Premium Expenditure Trend Data
FY 2009 Actual $1.8 million FY 2010 Actual $2.3 million FY 2011 Actual $2.7 million FY 2012 Actual $3.2 million FY 2013 Actual $3.5 million FY 2014 Actual $3.7 million FY 2015 Actual $4.9 million
FY 2016 Adopted Budget $3.9 million FY 2017 Approved Budget $4.8 million
Over the past few years, the School Board has taken several actions to reduce its retiree health insurance liability. Several School Board policies were revised to modify retirement eligibility requirements and the division’s retiree health insurance contribution amounts. In FY 2014, the school division added a mid-level health insurance plan for active employees and retired employees who are not yet Medicare eligible. In addition, efforts have been made to outsource custodial services and student dining services to reduce post employment benefit payments. As medical costs continue to increase, the School Board will implement initiatives to lower the school division’s retiree health insurance expenditures over time.
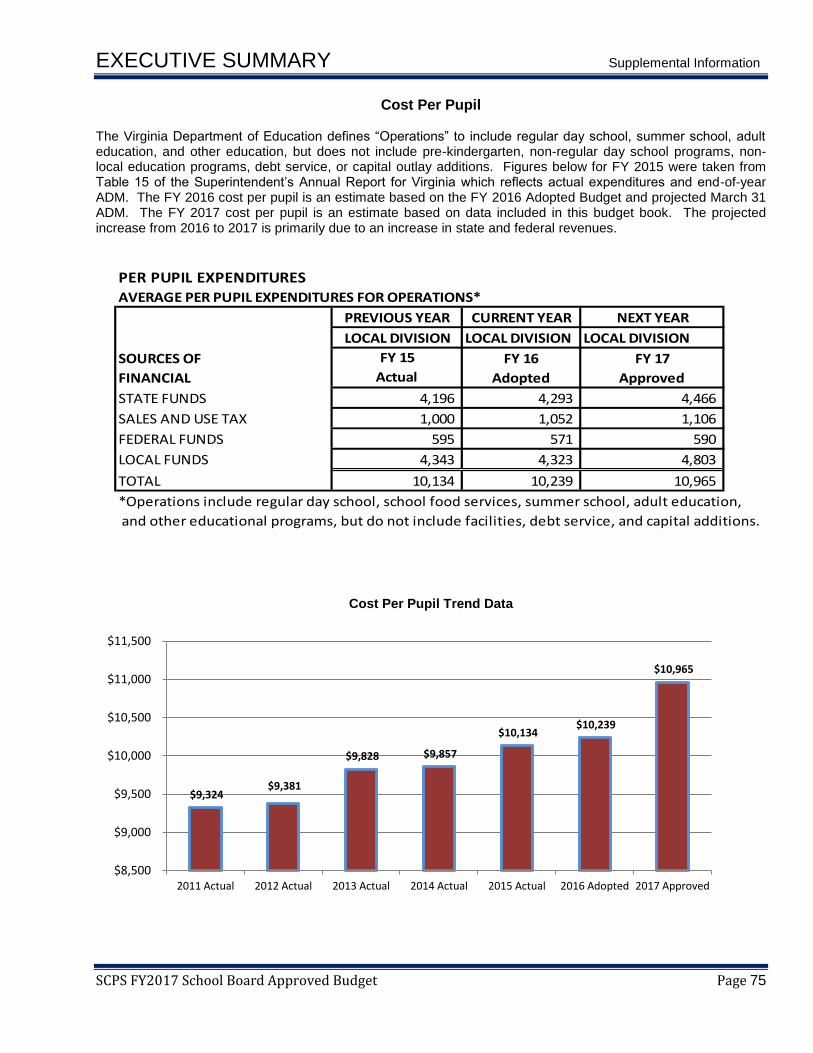
EXECUTIVE SUMMARY Supplemental Information
SCPS FY2017 School Board Approved Budget Page 75
Cost Per Pupil The Virginia Department of Education defines “Operations” to include regular day school, summer school, adult education, and other education, but does not include pre-kindergarten, non-regular day school programs, non-local education programs, debt service, or capital outlay additions. Figures below for FY 2015 were taken from Table 15 of the Superintendent’s Annual Report for Virginia which reflects actual expenditures and end-of-year ADM. The FY 2016 cost per pupil is an estimate based on the FY 2016 Adopted Budget and projected March 31 ADM. The FY 2017 cost per pupil is an estimate based on data included in this budget book. The projected increase from 2016 to 2017 is primarily due to an increase in state and federal revenues.
CURRENT YEAR NEXT YEAR
LOCAL DIVISION LOCAL DIVISION LOCAL DIVISION
FY 15
Actual
FY 16
Adopted
FY 17
Approved
4,196 4,293 4,466
1,000 1,052 1,106
595 571 590
4,343 4,323 4,803
TOTAL 10,134 10,239 10,965
*Operations include regular day school, school food services, summer school, adult education,
and other educational programs, but do not include facilities, debt service, and capital additions.
FEDERAL FUNDS
LOCAL FUNDS
PER PUPIL EXPENDITURESAVERAGE PER PUPIL EXPENDITURES FOR OPERATIONS*
PREVIOUS YEAR
SOURCES OF
FINANCIAL
STATE FUNDS
SALES AND USE TAX
Cost Per Pupil Trend Data
$9,324 $9,381
$9,828 $9,857
$10,134 $10,239
$10,965
$8,500
$9,000
$9,500
$10,000
$10,500
$11,000
$11,500
2011 Actual 2012 Actual 2013 Actual 2014 Actual 2015 Actual 2016 Adopted 2017 Approved
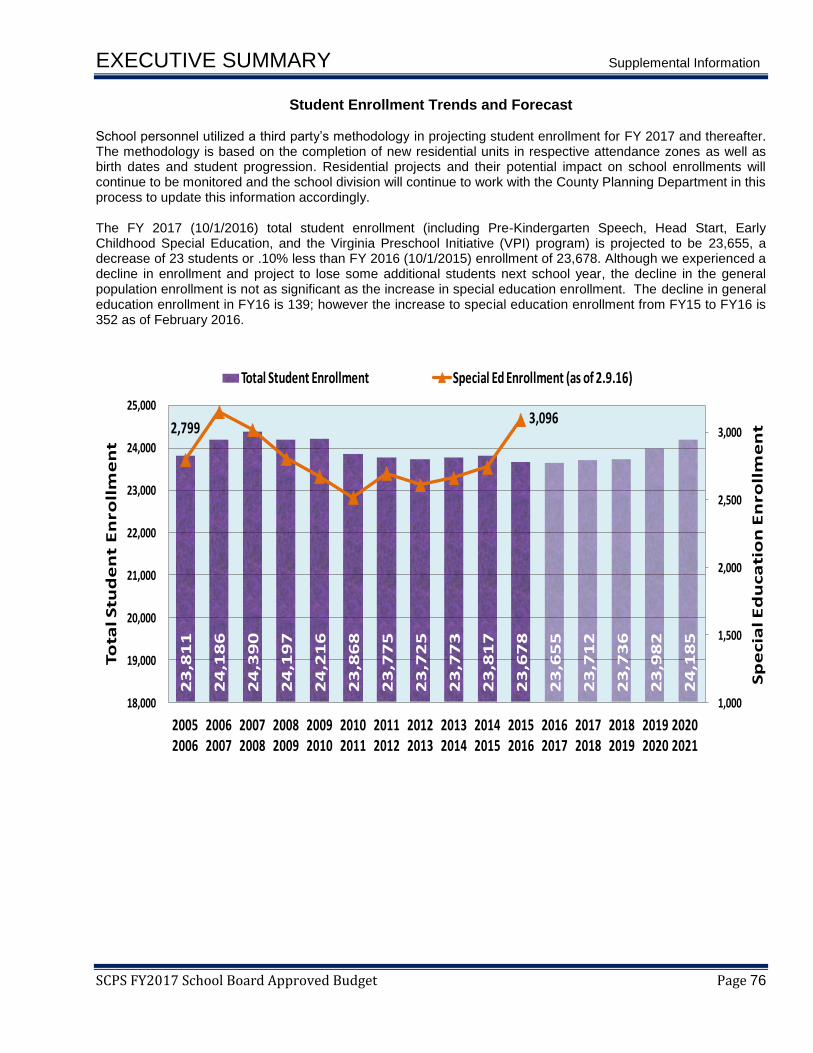
EXECUTIVE SUMMARY Supplemental Information
SCPS FY2017 School Board Approved Budget Page 76
Student Enrollment Trends and Forecast School personnel utilized a third party’s methodology in projecting student enrollment for FY 2017 and thereafter. The methodology is based on the completion of new residential units in respective attendance zones as well as birth dates and student progression. Residential projects and their potential impact on school enrollments will continue to be monitored and the school division will continue to work with the County Planning Department in this process to update this information accordingly. The FY 2017 (10/1/2016) total student enrollment (including Pre-Kindergarten Speech, Head Start, Early Childhood Special Education, and the Virginia Preschool Initiative (VPI) program) is projected to be 23,655, a decrease of 23 students or .10% less than FY 2016 (10/1/2015) enrollment of 23,678. Although we experienced a decline in enrollment and project to lose some additional students next school year, the decline in the general population enrollment is not as significant as the increase in special education enrollment. The decline in general education enrollment in FY16 is 139; however the increase to special education enrollment from FY15 to FY16 is 352 as of February 2016.
23
,81
1
24
,18
6
24
,39
0
24
,19
7
24
,21
6
23
,86
8
23
,77
5
23
,72
5
23
,77
3
23
,81
7
23
,67
8
23
,65
5
23
,71
2
23
,73
6
23
,98
2
24
,18
5
2,799 3,096
1,000
1,500
2,000
2,500
3,000
18,000
19,000
20,000
21,000
22,000
23,000
24,000
25,000
2005 2006
2006 2007
2007 2008
2008 2009
2009 2010
2010 2011
2011 2012
2012 2013
2013 2014
2014 2015
2015 2016
2016 2017
2017 2018
2018 2019
2019 2020
2020 2021
Sp
ecia
l E
du
ca
tio
n E
nro
llm
en
t
To
tal S
tud
en
t E
nro
llm
en
t
Total Student Enrollment Special Ed Enrollment (as of 2.9.16)

EXECUTIVE SUMMARY Supplemental Information
SCPS FY2017 School Board Approved Budget Page 77
Student Demographics SCPS is the 11th largest of 132 school divisions in Virginia. Student demographics are anticipated to remain fairly constant. Special education enrollment has averaged 12% of the total student enrollment for the past several years. Overall, the severity of the disability with regards to needing individualized support has increased significantly. The number of students who are supported by the English for Speakers of Other Languages (ESOL) program has increased significantly since FY 2005. The number of students eligible for free and reduced price lunches has increased from 11% in FY 2002 to 35% in FY 2016. The ethnic composition of Spotsylvania County Public Schools’ student enrollment is shown in the chart below.
0.3
%
5.0
%
26
.6%
58
.8%
0.1
% 7
.5%
0.0
%
1.7
%
0.3
% 6
.7%
22
.9%
50
.5%
0.1
%
14
.4%
5.1
%
0.0
%
0.3
%
2.4
%
18
.8%
70
.9%
0.0
% 6
.5%
0.0
%
1.1
%
0.2
%
2.6
%
17
.9%
59
.2%
0.1
%
14
.0%
6.0
%
0.0
%
0%
10%
20%
30%
40%
50%
60%
70%
American Indian
Asian Black White Hawaiian Hispanic 2 or More Ethnicities
Unspecified
FY 2006 Statewide FY 2016 Statewide FY 2006 Spotsylvania FY 2016 Spotsylvania

EXECUTIVE SUMMARY Supplemental Information
SCPS FY2017 School Board Approved Budget Page 78
Spotsylvania County Demographics Spotsylvania County, which consists of 407 square miles, is located in eastern Virginia, mid-way between the nation’s capital in Washington D.C. and the State capital of Richmond, both of which are about 50 miles in distance. Spotsylvania is one of Virginia's fastest-growing counties, largely because of its location and accessibility to Interstate 95.
Formed as an Independent County..................................................................................................... 1721 Present Form of Government ................................................. Board of Supervisors/County Administrator Area .................................................................................................................................. 407 square miles
Median Household Income (2013) ................................................................................................. $73,112
County Population 2016 (estimated) .............................................................................................. 130,674
Unemployment Rate (2015) ................................................................................................................ 5.1%
Spotsylvania County Tax Rates (2016)
Real Property ....................................................................................................................................... $.86
Personal Property (automobiles, campers, motor homes, motorcycles, and trucks) ........................ $6.73
Personal Property (boats and boat trailers) ....................................................................................... $6.25
Education
Number of Elementary Schools .............................................................................................................. 17
Number of Middle Schools ........................................................................................................................ 7
Number of High Schools ........................................................................................................................... 5
Number of Alternative Schools ................................................................................................................. 1
Number of Technical Education Schools .................................................................................................. 1
K-12 Enrollment (as of 10/1/2015) ................................................................................................... 23,678
Community Facilities
Park Facilities .......................................................................................................................................... 11
Outdoor Amphitheatres ............................................................................................................................. 1
Community Centers .................................................................................................................................. 5
Senior Centers .......................................................................................................................................... 1
County Museums ...................................................................................................................................... 1
Public Safety
Sheriff
Number of part-time and full-time positions (2016) ............................................................................. 254
Fire/EMS
Full-time staff (2016) ........................................................................................................................... 182
Fire/Rescue Stations ............................................................................................................................. 10

EXECUTIVE SUMMARY Supplemental Information
SCPS FY2017 School Board Approved Budget Page 79
Three –Year Budget Forecast Objective of the Three-Year Forecast
To protect all employee groups.
To maintain “core” instructional programs and services.
To provide quality services to approximately 24,000 students.
To complete all critical capital projects identified in the latest Capital Improvement Plan
The three-year cost of meeting these objectives calculated using assumptions for inflation and growth. Long-Range Budget Assumptions
Expand program opportunities to enrich college and career readiness for all students.
Employee compensation is increased by a Step + 1% COLA in FY17, FY18, FY19 and FY20
ADM changes in FY17, FY18, FY19 and FY20 based on division enrollment projections
State funding is not adjusted for changes in composite index for the 2018 - 2020 biennium
Federal funds increase by 2% in FY17, then steady for FY18, FY19 and FY20
Other funds are increased by 1.5% in FY17, then steady in FY18, FY19 and FY20
VRS professional rates increase by 4% for FY17, increase by 11% in FY18, then steady in FY19 and FY20
Sales Tax is increased by 4.0% in FY17 and 3.6% in FY18, then by 3% in FY19 and FY20
Electricity costs remain relatively unchanged in FY17, then increased by 1% in FY18, FY19 and FY20
Non-utility/fuel accounts (object 5000) remain relatively unchanged in FY17, then increase by 1% in FY18, FY19 and FY20
Assumes funding for the approved 2017 - 2021 CIP along with the correlated debt service costs
Health insurance premiums increase by 11.8% in FY17 and 5% increase per year in FY18 and FY19
County transfer remains constant
Overall, the school division engages in long-term planning because the benefits are enormous. The division’s three-year long-term planning strategy allows the division to be proactive, rather than reactive. Long-term planning permits the division to budget over a longer period for new initiatives, incrementally reducing any fees. This systematic approach helps the division maintain a strong financial operation.

EXECUTIVE SUMMARY Supplemental Information
SCPS FY2017 School Board Approved Budget Page 80
Categories FY17 FY18 FY19 FY20
Instruction 190,955,120$ 198,174,741$ 204,035,443$ 210,093,633$
Administration 10,437,696$ 10,832,324$ 11,152,673$ 11,483,816$
Transportation 20,324,383$ 21,092,806$ 21,716,592$ 22,361,398$
Maintenance 21,866,796$ 22,693,535$ 23,364,660$ 24,058,400$
Food Service 9,082,485$ 9,425,875$ 9,704,630$ 9,992,779$
Capital Projects 27,611,024$ 24,818,256$ 26,683,129$ 12,720,486$
Technology 8,606,220$ 8,931,603$ 9,195,741$ 9,468,780$
Debt Service 25,922,930$ 26,080,560$ 27,546,515$ 26,833,624$
Totals 314,806,654$ 322,049,700$ 333,399,384$ 327,012,916$
Objects FY17 FY18 FY19 FY20
1000 Salaries/Wages 150,859,144$ 155,384,918$ 160,046,466$ 164,847,860$
2000 Employee Benefits 70,228,216$ 75,210,043$ 78,193,067$ 81,302,711$
3000 Purchased Services 33,656,472$ 36,317,973$ 39,162,195$ 27,013,067$
5000 Other Charges 10,398,387$ 10,470,777$ 10,543,890$ 10,617,735$
6000 Materials & Supplies 18,983,250$ 14,274,745$ 13,516,247$ 12,509,180$
8000 Capital Outlay 4,790,258$ 4,342,684$ 4,423,004$ 3,920,739$
9000 Debt Service 25,890,930$ 26,048,560$ 27,514,515$ 26,801,624$
Totals 314,806,657$ 322,049,700$ 333,399,384$ 327,012,916$
Three year Revenue Projections FY17 FY18 FY19 FY20
State Sales Tax 25,587,202$ 26,505,425$ 27,300,588$ 28,119,605$
State Funds 105,746,098$ 110,430,576$ 110,430,576$ 110,430,576$
Federal Funds 14,601,500$ 14,601,500$ 14,601,500$ 14,601,500$
City-County Funds 116,432,746$ 116,432,746$ 116,432,746$ 116,432,746$
Other Funds 12,186,107$ 12,186,107$ 12,186,107$ 12,186,107$
Loans, Bonds, Etc. 27,611,024$ 24,818,256$ 26,683,129$ 12,720,486$
Totals 302,164,677$ 304,974,610$ 307,634,646$ 294,491,020$
Cumulative Gap (12,641,980)$ (17,075,090)$ (25,764,738)$ (32,521,896)$
Annual Gap (12,641,980)$ (4,433,110)$ (8,689,648)$ (6,757,157)$
Three Year Expenditure Projections