inventing to prepare for future learning: the hidden...
TRANSCRIPT
Inventing to Prepare for Future Learning: The Hidden Efficiency of Encouraging OriginalStudent Production in Statistics InstructionAuthor(s): Daniel L. Schwartz and Taylor MartinSource: Cognition and Instruction, Vol. 22, No. 2 (2004), pp. 129-184Published by: Taylor & Francis, Ltd.Stable URL: http://www.jstor.org/stable/3233926 .
Accessed: 12/07/2013 11:55
Your use of the JSTOR archive indicates your acceptance of the Terms & Conditions of Use, available at .http://www.jstor.org/page/info/about/policies/terms.jsp
.JSTOR is a not-for-profit service that helps scholars, researchers, and students discover, use, and build upon a wide range ofcontent in a trusted digital archive. We use information technology and tools to increase productivity and facilitate new formsof scholarship. For more information about JSTOR, please contact [email protected].
.
Taylor & Francis, Ltd. is collaborating with JSTOR to digitize, preserve and extend access to Cognition andInstruction.
http://www.jstor.org
This content downloaded from 129.79.193.7 on Fri, 12 Jul 2013 11:55:30 AMAll use subject to JSTOR Terms and Conditions
COGNITION AND INSTRUCTION, 22(2), 129-184 Copyright ? 2004, Lawrence Erlbaum Associates, Inc.
Inventing to Prepare for Future Learning: The Hidden Efficiency of Encouraging
Original Student Production in Statistics Instruction
Daniel L. Schwartz and Taylor Martin School of Education Stanford University
Activities that promote student invention can appear inefficient, because students do not generate canonical solutions, and therefore the students may perform badly on standard assessments. Two studies on teaching descriptive statistics to 9th-grade stu- dents examined whether invention activities may prepare students to learn. Study 1 found that invention activities, when coupled with subsequent learning resources like lectures, led to strong gains in procedural skills, insight into formulas, and abilities to evaluate data from an argument. Additionally, an embedded assessment experiment crossed the factors of instructional method by type of transfer test, with 1 test includ-
ing resources for learning and 1 not. A "tell-and-practice" instructional condition led to the same transfer results as an invention condition when there was no learning re- source, but the invention condition did better than the tell-and-practice condition when there was a learning resource. This demonstrates the value of invention activi- ties for future learning from resources, and the value of assessments that include op- portunities to learn during a test. In Study 2, classroom teachers implemented the in- struction and replicated the results. The studies demonstrate that intuitively compelling student-centered activities can be both pedagogically tractable and effec- tive at preparing students to learn.
The renowned instructional theorist Robert Gagne built his work on the observa- tion that different forms of instruction are suited to different learning outcomes. For example, he proposed repetition for developing motor skills and reinforcement
Requests for reprints should be sent to Dan Schwartz, Stanford University, School of Education, 485 Lasuen Mall, Stanford University, CA 94305-3096. E-mail: [email protected]
This content downloaded from 129.79.193.7 on Fri, 12 Jul 2013 11:55:30 AMAll use subject to JSTOR Terms and Conditions
130 SCHWARTZ AND MARTIN
for attitudes (Gagne & Briggs, 1974). His work predated the cognitive revolution, and emphasized the training and measurement of behavior rather than understand-
ing. Since then, cognitive science has examined instructional models for teaching conceptually grounded procedural skills that students can efficiently retrieve and
apply to solve problems. More recently, researchers have drawn attention to peo- ple's readiness to learn in new situations (e.g., Brown & Kane, 1988; Greeno, 1997; Griffin, Case, & Siegler, 1994; Hatano & Inagaki, 1986; Lehrer, Strom, &
Confrey, 2002; Singley & Anderson, 1989; Wineburg, 1998). Bransford and Schwartz (1999), for example, argued that even the best instruction in prob- lem-solving procedures is unlikely to prepare students for many situations they may encounter. Therefore, instead of focusing exclusively on student problem solving, they suggested that it is also important for instruction to focus on students' abilities to learn from new situations and resources. Preparing for future learning requires the development of new instructional methods and the development of as- sessments that can evaluate whether students have been prepared to learn.
The goals of this article are threefold. One goal is to rethink the value of activi- ties that ask students to invent original solutions to novel problems. These activi- ties are intuitively compelling (e.g., DiSessa, Hammer, Sherin, & Kolpakowski, 1991), yet students typically generate suboptimal solutions, and therefore do
poorly on subsequent assessments of problem solving. This has led many to ques- tion their value and some to advocate correcting student errors as quickly as possi- ble (e.g., Anderson, Conrad, & Corbett, 1989; for discussion see Barron et al., 1998; Vollmeyer, Burns, & Holyoak, 1996). We argue, however, that invention ac- tivities, when designed well, may be particularly useful for preparing students to
learn, which in turn, should help problem solving in the long run. The second goal is to describe a pair of 2-week design experiments with
ninth-grade students who learned about descriptive statistics. We wanted to see if invention activities do indeed have benefits for subsequent learning. We also
thought it was important to determine whether invention activities can lead to ex- cellent outcomes, even within a relatively short time frame and in a school setting that has little history with these types of activities. To be a compelling demonstra- tion, we included assessments of both the procedural fluency emphasized by many standardized tests (Tyack & Cuban, 1995) and the conceptual reasoning empha- sized by many educational researchers (see Boaler, 1997, on the faulty assumption that these outcomes are mutually exclusive).
In the first study, we taught the curriculum, and in the second study, we examined whether it worked for classroom teachers. Our instructional design, called Inventing to Prepare for Learning (IPL), was styled on our arguments for why student produc- tion can prepare students to learn. We were particularly interested in whether invent-
ing activities would help students learn from the direct instruction that is likely to oc- cur at other points in the class. So, rather than making our instruction slavishly follow either a procedurally driven, direct-instruction model or a discovery driven, stu-
This content downloaded from 129.79.193.7 on Fri, 12 Jul 2013 11:55:30 AMAll use subject to JSTOR Terms and Conditions
INVENTING AS PREPARATION 131
dent-products model, we tested whether fostering student invention would prepare students to learn from direct instruction. Practically, this is important for teachers, because it alleviates the burden of carefully guiding students to discover the correct solutions-the teacher can simply explain the solution after the students have been "prepared." Theoretically, this is important because it provides a counterexample to the misconception that direct instruction is against constructivist principles and should therefore be avoided (see Schwartz & Bransford, 1998). Constructivism is a theory of knowledge growth that applies whether one is sitting quietly listening to a lecture or actively inventing representations. The question is not whether one form of instruction is constructivist or not, but rather, what activities best prepare students to construct understanding, for example, from an explicit "telling."
The third goal of this article is to describe the results of a formal experiment that compared the value of problem-solving assessments versus preparation for learn- ing assessments. As is often the case, our design studies could not implement the many control conditions and process measures necessary to isolate the active in- structional ingredients. However, on the last day of each design study, we could conduct controlled "assessment experiments" to examine the potential advantages of measures that probe for students' preparedness to learn. The experiments, which we describe later, try to address a pragmatic and methodological barrier to helping people adopt a preparation for future learning perspective. Most educators assess student knowledge, or the value of an instructional method, by giving students tests of sequestered problem solving (Bransford & Schwartz, 1999). Like mem- bers of ajury, students are shielded from contaminating sources of information that could help them learn to solve problems during the test. Consequently, educators tend to use methods of procedural and mnemonic instruction that support these
types of sequestered tests, and they find evidence that their methods of instruction are effective. At the same time, they do not find evidence that student-driven activi- ties support learning as measured by these tests. For example, service learning is a genre of learning experiences that sends students to the community to help in nurs- ing homes or engage in similar service activities. There is slim evidence that these activities show benefits on standard assessments (Eyler & Giles, 1999). Yet, most people who complete service learning talk about its exceptional value. To break the self-reinforcing cycle of procedural instruction and sequestered assessments, it is necessary to show the value of another form of assessment that can differentiate important forms of knowing that educators should care about. If applied to the ex- ample of service learning, this form of assessment might find that experiences in the community prepare students to learn from formal treatments on theories of community, compared to students who do not have such experiences.
The introduction comes in five sections that explain how we addressed the three goals. In the first section, we describe the types of early knowledge that are insuffi- cient for full-blown problem solving, but which we think are important for being prepared to learn about statistics. The second section describes why we think pro-
This content downloaded from 129.79.193.7 on Fri, 12 Jul 2013 11:55:30 AMAll use subject to JSTOR Terms and Conditions
132 SCHWARTZ AND MARTIN
duction activities, like inventing solutions, can be particularly beneficial for devel- oping early knowledge, and how IPL materials facilitate this process. Notably, not any student production will help-"doing" does not guarantee "doing with under- standing." For example, Barron et al. (1998) found that children, when asked to de- sign a school fun fair as a math project, spent their time excitedly designing attrac- tive fun booths rather than thinking about the quantitative issues of feasibility and expense. Therefore, it is important to design productive experiences that help stu- dents generate the types of early knowledge that are likely to help them learn. We describe how IPL tries to maximize the potential benefits of invention. The third section offers an example of what student invention looks like. The fourth section introduces the larger instructional cycle, including the teacher's role in that cycle. Finally, the fifth section introduces our ideas about assessing preparation for future learning, and we describe the assessment experiment and its logic.
EARLIER FORMS OF KNOWLEDGE THAT PREPARE PEOPLE TO LEARN
To learn from direct instruction, students use prior knowledge to make sense of what is told to them-essentially, this is a transfer process, but one where learners are transferring in rather than out of the observed situation. Transfer is not some- thing that happens only after an experimental or educational intervention (e.g., Lobato, 2003). When researchers assert that new learning builds on previous learn- ing, they are assuming that some sort of transfer is involved. The research on pre- conceptions provides an example of paying attention to what people "transfer in," because it studies how prior knowledge affects learning (e.g., Clement 1993; Hunt & Minstrell, 1994). When preparing students to learn, the instructional challenge is to help students transfer in the right knowledge.
One solution is to design instruction that can connect to students' prior experi- ences (e.g., Moll, 1986). For example, The Adventures of Jasper Woodbury (Cog- nition & Technology Group at Vanderbilt, 1997) includes a visual narrative that helps children transfer in complex real-world knowledge to motivate and anchor the ways they think about and interact with new mathematical content.
A complementary solution, which we focus on here, is to help students develop useful forms of prior knowledge that are likely to help them interpret the meaning of subsequent lessons. Cognitive science, which has largely examined mature forms of knowledge and expertise, suggests the value of procedural schemas that students can efficiently retrieve and apply. For example, to learn statistical formu- las, students need strong arithmetic knowledge. However, there are also earlier forms of knowledge that do not directly support fluent problem solving, but are still extremely important for learning.
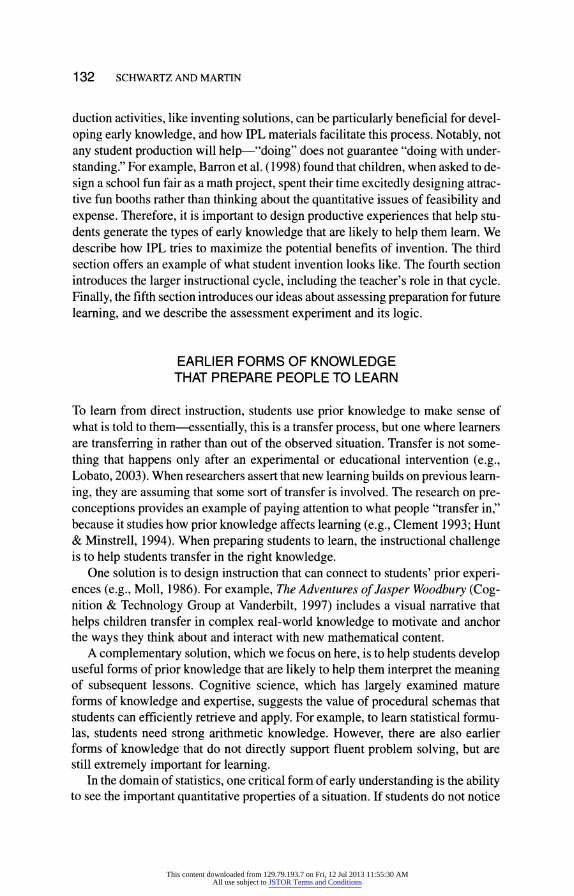
In the domain of statistics, one critical form of early understanding is the ability to see the important quantitative properties of a situation. If students do not notice
This content downloaded from 129.79.193.7 on Fri, 12 Jul 2013 11:55:30 AMAll use subject to JSTOR Terms and Conditions
INVENTING AS PREPARATION 133
relevant features-for example, if they treat probabilistic outcomes as single events rather than distributions (Konold, 1989)-then they will not understand what a statistical explanation is referring to. Furthermore, without an understand-
ing of the relevant features, students may transfer in vague intuitions that do not have sufficient precision to motivate the form or function of a particular statistical formalization (Mokros & Russell, 1995). For example, if students think of data in terms of instances and do not notice sample size as an important feature, they will not be prepared to understand why variability formulas divide by the sample size.
Helping students notice sample size can help them appreciate that dividing by n takes the average and permits comparisons across samples of different sizes.
A second important form of early understanding consists of an awareness of the quantitative work a mathematical procedure or tool needs to accomplish (even though students may not yet know a specific procedure to accomplish this work ef-
ficiently). This knowledge is critical to an eventual understanding of a conven- tional mathematical procedure and how it does its work. Without this prior knowl-
edge, students may transfer in the interpretation that a procedure or formula is
simply something to follow. For example, Moore and Schwartz (1998) asked col-
lege students who had recently learned to compute the standard deviation to evalu- ate the strengths and weakness of unusual procedures for measuring variability. The students did not think about the quantitative work the procedures could ac-
complish, but instead, over 50% of the students said, "That's not how you're sup- posed to do it!" The students had no quantitative insight and rigidly deferred to the
authority of the rule they had been taught. Even though "following the rules" leads to learning, the knowledge is brittle. Students cannot reconstruct the formula if
they forget an element; they cannot adapt the formula to a new situation, and they cannot reason deeply about the appropriateness of the formula for a given situation (Silver, 1986). For example, in the context of learning to use mathematical inscrip- tions, Lehrer, Schauble, Carpenter, and Penner (2000) "observed the rigidity in students' reasoning that occurred when inscriptions were given to children as the solution to a problem they did not yet recognize" (p. 359). For instruction in statis- tics, students should at least appreciate that the value of an inscription will depend on its abilities to usefully characterize data for the task at hand.
INVENTIVE PRODUCTION AND THE DEVELOPMENT OF EARLY KNOWLEDGE
There are two related ways that we believe inventive production can support the development of early knowledge. One is that production can help people let go of old interpretations. The other is that production can help people develop new inter- pretations.
As we mentioned previously, people always transfer in some sort of knowledge to make sense of a situation. This presents a challenge for developing early knowl-
This content downloaded from 129.79.193.7 on Fri, 12 Jul 2013 11:55:30 AMAll use subject to JSTOR Terms and Conditions
134 SCHWARTZ AND MARTIN
edge. The knowledge people bring can interfere with their ability to learn what is new about a situation. They may assimilate the new possibilities to their old ways of thinking. For example, Martin and Schwartz (2004) asked 9- to 10-year-old children to solve fraction equivalence problems like "indicate /4 of 8." In one con- dition, the children saw pictures of pieces, and they had to circle the correct num- ber of pieces to show the answer. Children typically transferred in a whole number
interpretation; they circled one piece or four pieces to indicate /4 of 8. In the other condition, the same children received pieces that they physically manipulated. In this condition, the children managed to reinterpret the pieces. By collecting the
pieces into piles and pushing them around, they began to see the pieces as groups that could be counted in their own right. For example, they came to reinterpret two
pieces as one group, which enabled them to eventually count out four groups and solve the problem of finding /4. When the children moved the pieces physically, they were correct nearly three times as often as when they could not. Interestingly, when the pieces were pregrouped for the children (e.g., four groups of two pieces), they could not interpret the meaning of this grouping by just looking, and they still did better when they could move the pieces around.
Production (which in this case took the form of manipulating pieces) seems to
help people let go of old interpretations and see new structures. We believe this
early appreciation of new structure helps set the stage for understanding the expla- nations of experts and teachers-explanations that often presuppose the learner will transfer in the right interpretations to make sense of what they have to say. Of course, not just any productive experience will achieve this goal. It is important to
shape children's activities to help them discern the relevant mathematical features and to attempt to account for these features. We employ two design features to
shape student activity: contrasting cases and inventing mathematical representa- tions.
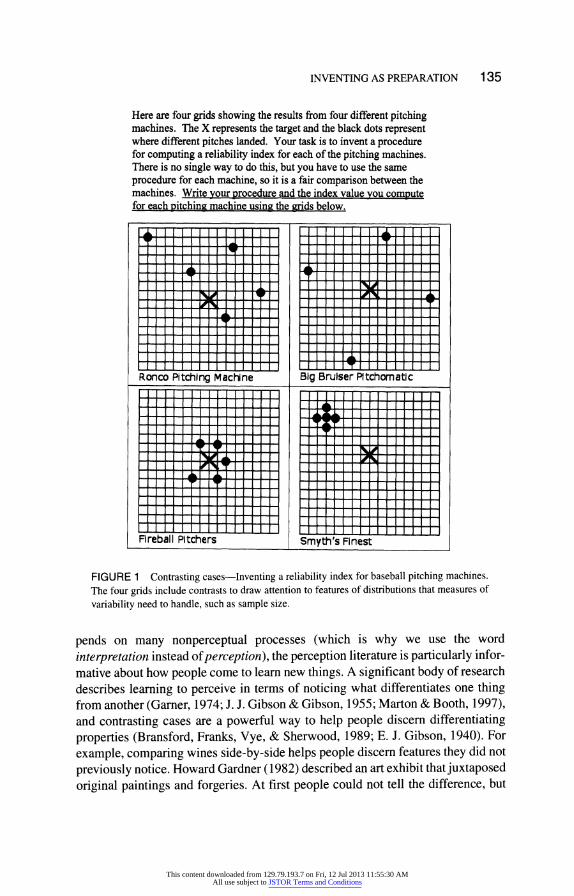
One way to help students learn new quantitative properties (as opposed to see- ing the ones they already know) is to use contrasting cases of small data sets. For
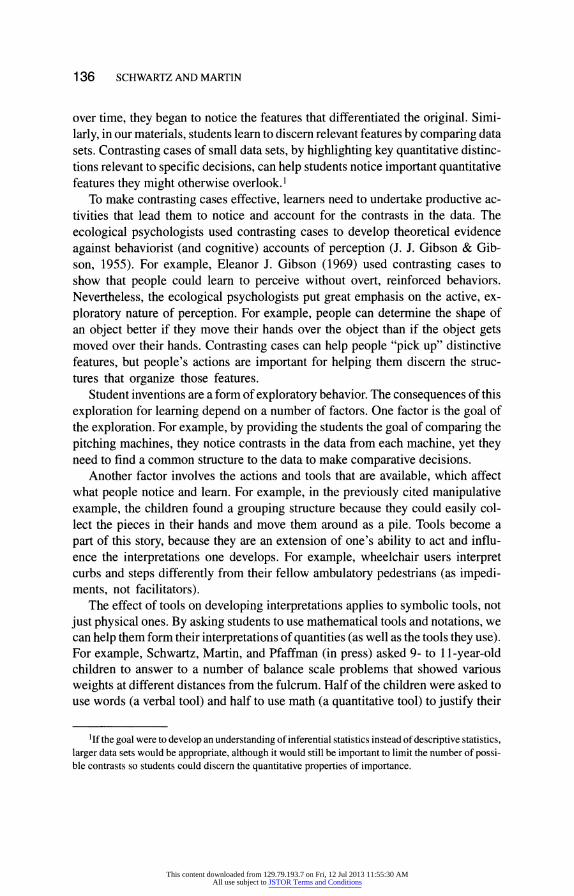
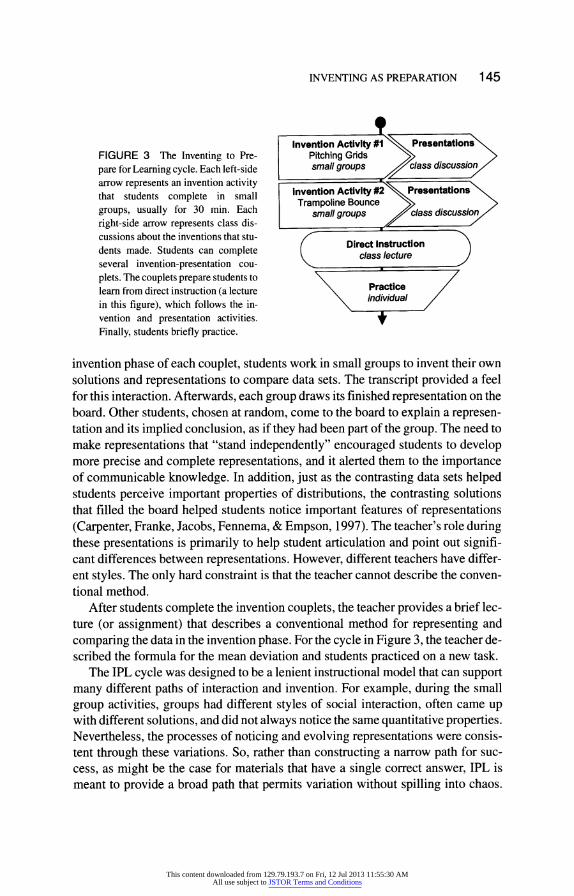
example, Figure 1 provides an activity used to prepare students to learn about the mean deviation formula. Each grid shows the result of a test using a different base- ball-pitching machine. The black circles represent where a pitch landed when aimed at the target X. Students work in small groups to develop a reliability index. Their task is to develop a formula or procedure that computes a single value to help shoppers compare reliability between the machines, much as an appliance receives an efficiency index. The contrasts between the four machines draw attention to is- sues of sample size, outliers, density, and the distinctions between variability, cen- tral tendency, and accuracy.
Contrasting cases are useful for developing early knowledge, because they can help learners notice new features and develop new interpretations. Our use of con- trasting cases as an instructional tool draws on the ecological psychologists' re- search on perceptual learning. Although we believe that learning mathematics de-
This content downloaded from 129.79.193.7 on Fri, 12 Jul 2013 11:55:30 AMAll use subject to JSTOR Terms and Conditions
INVENTING AS PREPARATION 135
Here are four grids showing the results from four different pitching machines. The X represents the target and the black dots represent where different pitches landed. Your task is to invent a procedure for computing a reliability index for each of the pitching machines. There is no single way to do this, but you have to use the same procedure for each machine, so it is a fair comparison between the machines. Write your procedure and the index value you compute for each pitching machine using the grids below.
FIGURE 1 Contrasting cases-Inventing a reliability index for baseball pitching machines. The four grids include contrasts to draw attention to features of distributions that measures of
variability need to handle, such as sample size.
pends on many nonperceptual processes (which is why we use the word
interpretation instead of perception), the perception literature is particularly infor-
mative about how people come to learn new things. A significant body of research
describes learning to perceive in terms of noticing what differentiates one thing from another (Garer, 1974; J. J. Gibson & Gibson, 1955; Marton & Booth, 1997), and contrasting cases are a powerful way to help people discern differentiating
properties (Bransford, Franks, Vye, & Sherwood, 1989; E. J. Gibson, 1940). For
example, comparing wines side-by-side helps people discern features they did not
previously notice. Howard Gardner (1982) described an art exhibit that juxtaposed
original paintings and forgeries. At first people could not tell the difference, but
This content downloaded from 129.79.193.7 on Fri, 12 Jul 2013 11:55:30 AMAll use subject to JSTOR Terms and Conditions
136 SCHWARTZ AND MARTIN
over time, they began to notice the features that differentiated the original. Simi-
larly, in our materials, students learn to discern relevant features by comparing data sets. Contrasting cases of small data sets, by highlighting key quantitative distinc- tions relevant to specific decisions, can help students notice important quantitative features they might otherwise overlook.
To make contrasting cases effective, learners need to undertake productive ac- tivities that lead them to notice and account for the contrasts in the data. The
ecological psychologists used contrasting cases to develop theoretical evidence
against behaviorist (and cognitive) accounts of perception (J. J. Gibson & Gib- son, 1955). For example, Eleanor J. Gibson (1969) used contrasting cases to show that people could learn to perceive without overt, reinforced behaviors. Nevertheless, the ecological psychologists put great emphasis on the active, ex-
ploratory nature of perception. For example, people can determine the shape of an object better if they move their hands over the object than if the object gets moved over their hands. Contrasting cases can help people "pick up" distinctive features, but people's actions are important for helping them discern the struc- tures that organize those features.
Student inventions are a form of exploratory behavior. The consequences of this
exploration for learning depend on a number of factors. One factor is the goal of the exploration. For example, by providing the students the goal of comparing the
pitching machines, they notice contrasts in the data from each machine, yet they need to find a common structure to the data to make comparative decisions.
Another factor involves the actions and tools that are available, which affect what people notice and learn. For example, in the previously cited manipulative example, the children found a grouping structure because they could easily col- lect the pieces in their hands and move them around as a pile. Tools become a part of this story, because they are an extension of one's ability to act and influ- ence the interpretations one develops. For example, wheelchair users interpret curbs and steps differently from their fellow ambulatory pedestrians (as impedi- ments, not facilitators).
The effect of tools on developing interpretations applies to symbolic tools, not just physical ones. By asking students to use mathematical tools and notations, we can help them form their interpretations of quantities (as well as the tools they use). For example, Schwartz, Martin, and Pfaffman (in press) asked 9- to 11-year-old children to answer to a number of balance scale problems that showed various weights at different distances from the fulcrum. Half of the children were asked to use words (a verbal tool) and half to use math (a quantitative tool) to justify their
lIf the goal were to develop an understanding of inferential statistics instead of descriptive statistics, larger data sets would be appropriate, although it would still be important to limit the number of possi- ble contrasts so students could discern the quantitative properties of importance.
This content downloaded from 129.79.193.7 on Fri, 12 Jul 2013 11:55:30 AMAll use subject to JSTOR Terms and Conditions
INVENTING AS PREPARATION 137
answers. Even though no children received feedback on their justifications, the children who used math learned to interpret the balance scale as having two rele- vant dimensions (weight and distance), whereas the children who used words only saw the dimension of weight.
One quality of mathematical tools that we try to emphasize in IPL is their gener- ality. As students invent a representation, we encourage them to make sure the rep- resentation is general, rather than particular. For example, they need to find a single indexing procedure that can handle all the grids, not just one or two. The capacity of mathematical notations and graphs for general representation can help students notice the structure of variability beneath the surface differences between the pitching machines (e.g., it depends on the absolute distances between points re- gardless of their position). Our approach is similar in spirit to Lesh's (2003) model elicitation activities, whereby students solve problems that help them see the value of general models that can handle the most cases possible.
Another quality of mathematical tools is that they encourage precise interpreta- tions. This creates specificity in observation and revision. In IPL, we take advan- tage of mathematical specificity by encouraging students to match their invented solutions against their evolving intuitions. For example, with the pitching grids, students are encouraged to see if their reliability index ranks all four grids at appro- priate intervals from one another (instead of just making pair-wise comparisons). This ranking depends on both the generality of mathematical structure and the pre- cision of an interval scale. If there is a mismatch between intuition and their index, it fuels the search for revised inventions that work in detail.
The third benefit of mathematical tools is that one can reflect on the structure of the tool explicitly and how it accomplishes its work. The early knowledge that prepares students to learn cannot just be about quantitative properties, it also needs to be about symbolic representations. Quantitative perceptions and their symbolic representations have different functions and each needs development (Varelas & Becker, 1997). Brain research, for example, indicates activation in different brain regions when people estimate quantities versus when they sym- bolically compute specific values (Dehaene, 2000). The opportunity to grapple with mathematical representations prepares the students to appreciate the ele- gance of an expert solution; for example, how the standard deviation solves the problem of different sample sizes by diving by n. To help students develop an in- terpretation of the work mathematical procedures need to accomplish, IPL places an emphasis on communicative clarity. Students know that they will have to put their solutions on the boards around the room. They also know that other students will present their solutions (without any coaching) and explain what de- cision they think the group made. This places a premium on representations that transparently carry meaning, and it helps students develop new interpretations about representations themselves.
This content downloaded from 129.79.193.7 on Fri, 12 Jul 2013 11:55:30 AMAll use subject to JSTOR Terms and Conditions
138 SCHWARTZ AND MARTIN
AN EXAMPLE OF INVENTIVE PRODUCTION
In this section, we provide an extended example of how contrasting cases and mathematical invention play out in practice. Teachers ask students to work in small
groups. Their early knowledge and inventions develop through an adaptive process (Chiu, Kessel, Moschkovich, & Munoz-Nunez, 2001; Lesh & Doerr, 2000). Stu- dents evolve their inventions and make revisions when they discover an internal flaw or perceive new quantitative properties that their invention cannot handle.
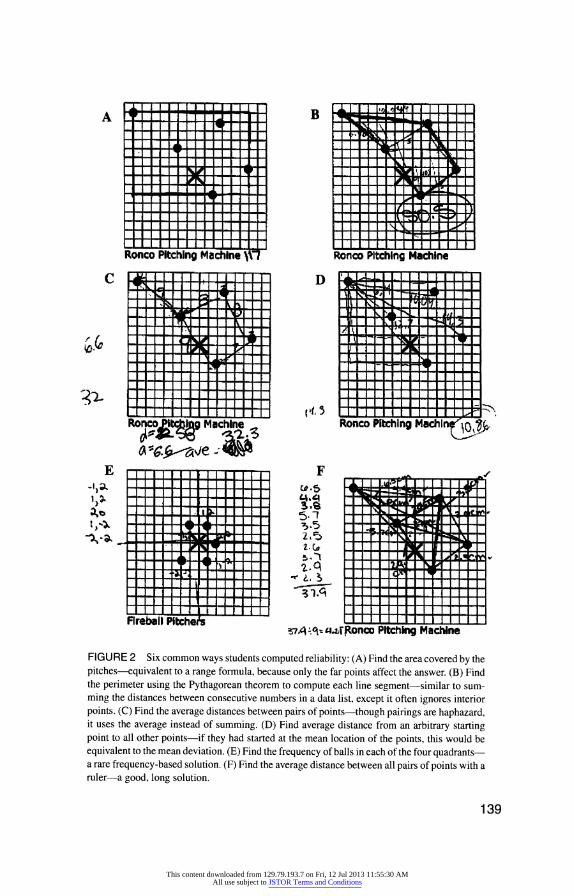
Figure 2 provides a representative sample of the graphical inventions that different students produced on their way to developing a procedure for computing a reliabil-
ity index. As students map between the data, the graphical representations, and their mathematical procedures, they go through a process of invention, noticing, and revision that helps them develop insight into the relation between representa- tions and the quantities they represent.
To help the adaptive process, the teacher walks about the room, occasionally in-
teracting with each group. We do not encourage teachers to guide students to the conventional solution, because this can shortcut the students' opportunity to de-
velop the prior knowledge that will help them understand the conventional solution at a later time. Instead, we suggest three primary moves for the teachers, which am-
plify the three benefits of production previously stated. One move is to ask the stu- dents to explain what they are doing. This places a premium on clarity and consis-
tency. A second move is to ask students whether the results of their mathematical
procedures correspond to their "common sense." This ensures that students pay at- tention to specific symbol-referent mappings, instead of simply computing arbi-
trary values. The third move is to push students towards more general solutions. The teacher encourages the students to find solutions that generalize across differ- ent legitimate configurations of quantity.
Our illustrative example comes from a group of boys working on the pitching machine problem. By this time, the group had already done invention activities in-
volving graphing and central tendency. This was the first time they had worked on a problem that focused on variance, and the first time they had to develop a formula for computing a single value. The three boys were in a ninth-grade algebra class at a high achieving school in a white-collar suburb. For the most part, these boys were like other students in the classes we studied-they wanted to do well in school, and they had been relatively successful within the "traditional" pedagogy employed by the math department. We feature these boys because their cycles of production and noticing are compact and entertaining. The example comes from the second study.
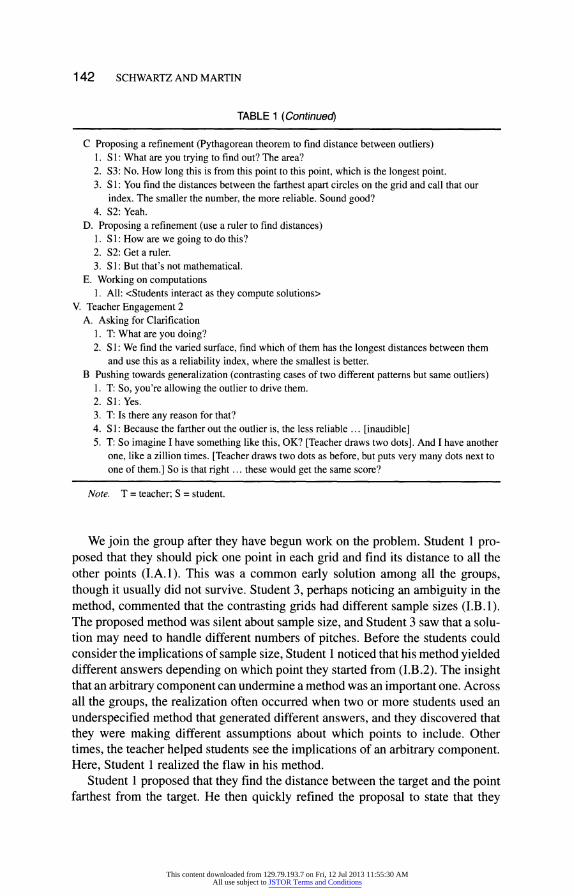
Table 1 provides a transcript of the densest period of their invention activities. Only a few desultory exchanges have been removed for parsimony. We have folded the transcript into an outline that annotates the different types of learning-relevant activities. The outline headings are an overlay on the transcript; we do not mean to imply that interaction takes the hierarchical structure of an outline.
This content downloaded from 129.79.193.7 on Fri, 12 Jul 2013 11:55:30 AMAll use subject to JSTOR Terms and Conditions
A B
C D i -
- , ,- - (t. d -
l~
I ( ,. :
RoncoJ)lM!o MIachlneRonco PiMtching Machlinr '
' ' 1 *At '' ^ , -r _ _ ^
l,. ., -'--'
.=
Ftrebll Pitche 574-- ' ulfonco Pitching Machine
FIGURE 2 Six common ways students computed reliability: (A) Find the area covered by the pitches-equivalent to a range formula, because only the far points affect the answer. (B) Find the perimeter using the Pythagorean theorem to compute each line segment-similar to sum- ming the distances between consecutive numbers in a data list, except it often ignores interior points. (C) Find the average distances between pairs of points-though pairings are haphazard, it uses the average instead of summing. (D) Find average distance from an arbitrary starting point to all other points-if they had started at the mean location of the points, this would be equivalent to the mean deviation. (E) Find the frequency of balls in each of the four quadrants a rare frequency-based solution. (F) Find the average distance between all pairs of points with a ruler-a good, long solution.
139
This content downloaded from 129.79.193.7 on Fri, 12 Jul 2013 11:55:30 AMAll use subject to JSTOR Terms and Conditions
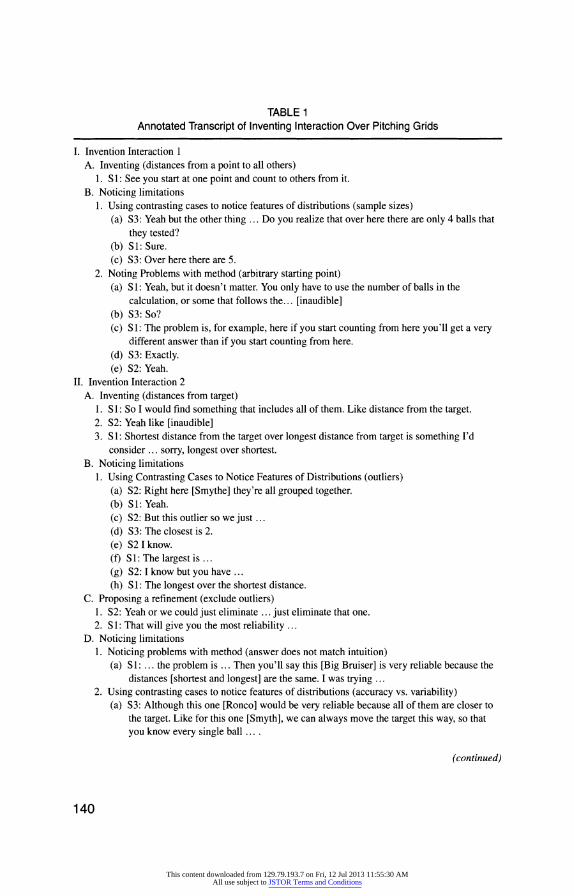
TABLE 1 Annotated Transcript of Inventing Interaction Over Pitching Grids
I. Invention Interaction 1 A. Inventing (distances from a point to all others)
1. S1: See you start at one point and count to others from it. B. Noticing limitations
1. Using contrasting cases to notice features of distributions (sample sizes) (a) S3: Yeah but the other thing ... Do you realize that over here there are only 4 balls that
they tested? (b) SI: Sure. (c) S3: Over here there are 5.
2. Noting Problems with method (arbitrary starting point) (a) S 1: Yeah, but it doesn't matter. You only have to use the number of balls in the
calculation, or some that follows the... [inaudible] (b) S3: So? (c) S 1: The problem is, for example, here if you start counting from here you'll get a very
different answer than if you start counting from here. (d) S3: Exactly. (e) S2: Yeah.
II. Invention Interaction 2 A. Inventing (distances from target)
1. S1: So I would find something that includes all of them. Like distance from the target. 2. S2: Yeah like [inaudible] 3. S 1: Shortest distance from the target over longest distance from target is something I'd
consider ... sorry, longest over shortest. B. Noticing limitations
1. Using Contrasting Cases to Notice Features of Distributions (outliers) (a) S2: Right here [Smythe] they're all grouped together. (b) SI: Yeah. (c) S2: But this outlier so we just ... (d) S3: The closest is 2. (e) S2Iknow. (f) Si: The largest is ...
(g) S2: I know but you have ... (h) S1: The longest over the shortest distance.
C. Proposing a refinement (exclude outliers) 1. S2: Yeah or we could just eliminate ... just eliminate that one. 2. S 1: That will give you the most reliability ...
D. Noticing limitations 1. Noticing problems with method (answer does not match intuition)
(a) S : ... the problem is ... Then you'll say this [Big Bruiser] is very reliable because the distances [shortest and longest] are the same. I was trying ...
2. Using contrasting cases to notice features of distributions (accuracy vs. variability) (a) S3: Although this one [Ronco] would be very reliable because all of them are closer to
the target. Like for this one [Smyth], we can always move the target this way, so that you know every single ball ....
(continued)
140
This content downloaded from 129.79.193.7 on Fri, 12 Jul 2013 11:55:30 AMAll use subject to JSTOR Terms and Conditions
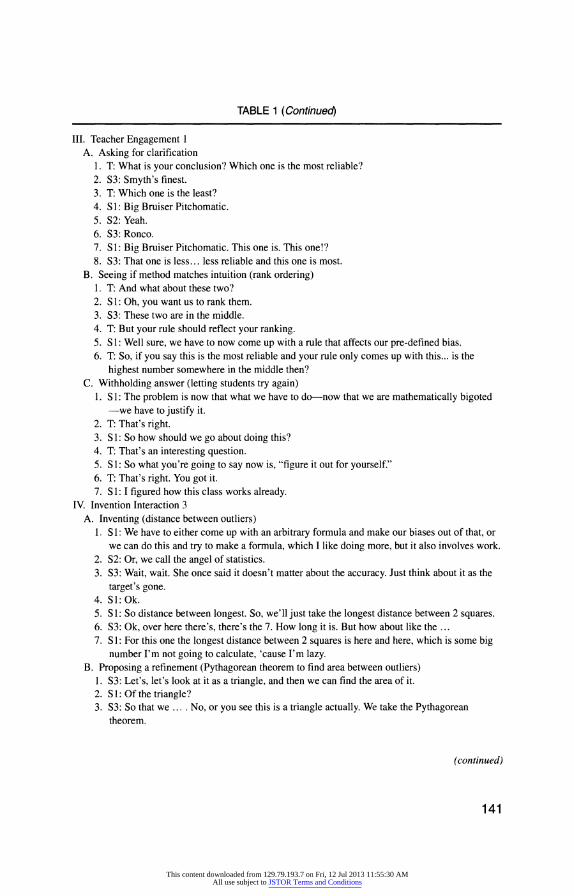
TABLE 1 (Continued)
III. Teacher Engagement I A. Asking for clarification
1. T: What is your conclusion? Which one is the most reliable? 2. S3: Smyth's finest. 3. T: Which one is the least? 4. Si: Big Bruiser Pitchomatic. 5. S2: Yeah. 6. S3: Ronco. 7. SI: Big Bruiser Pitchomatic. This one is. This one!? 8. S3: That one is less... less reliable and this one is most.
B. Seeing if method matches intuition (rank ordering) 1. T: And what about these two? 2. S 1: Oh, you want us to rank them. 3. S3: These two are in the middle. 4. T: But your rule should reflect your ranking. 5. S1: Well sure, we have to now come up with a rule that affects our pre-defined bias. 6. T: So, if you say this is the most reliable and your rule only comes up with this... is the
highest number somewhere in the middle then? C. Withholding answer (letting students try again)
1. S 1: The problem is now that what we have to do-now that we are mathematically bigoted -we have to justify it.
2. T: That's right. 3. S1: So how should we go about doing this? 4. T: That's an interesting question. 5. S 1: So what you're going to say now is, "figure it out for yourself." 6. T: That's right. You got it. 7. S1: I figured how this class works already.
IV. Invention Interaction 3 A. Inventing (distance between outliers)
1. S 1: We have to either come up with an arbitrary formula and make our biases out of that, or we can do this and try to make a formula, which I like doing more, but it also involves work.
2. S2: Or, we call the angel of statistics. 3. S3: Wait, wait. She once said it doesn't matter about the accuracy. Just think about it as the
target's gone. 4. SI: Ok. 5. S1: So distance between longest. So, we'll just take the longest distance between 2 squares. 6. S3: Ok, over here there's, there's the 7. How long it is. But how about like the ... 7. S1: For this one the longest distance between 2 squares is here and here, which is some big
number I'm not going to calculate, 'cause I'm lazy. B. Proposing a refinement (Pythagorean theorem to find area between outliers)
1. S3: Let's, let's look at it as a triangle, and then we can find the area of it. 2. S 1: Of the triangle? 3. S3: So that we .... No, or you see this is a triangle actually. We take the Pythagorean
theorem.
(continued)
141
This content downloaded from 129.79.193.7 on Fri, 12 Jul 2013 11:55:30 AMAll use subject to JSTOR Terms and Conditions
142 SCHWARTZ AND MARTIN
TABLE 1 (Continued)
C Proposing a refinement (Pythagorean theorem to find distance between outliers) 1. S 1: What are you trying to find out? The area? 2. S3: No. How long this is from this point to this point, which is the longest point. 3. S1: You find the distances between the farthest apart circles on the grid and call that our
index. The smaller the number, the more reliable. Sound good? 4. S2: Yeah.
D. Proposing a refinement (use a ruler to find distances) 1. S 1: How are we going to do this? 2. S2: Get a ruler. 3. S1: But that's not mathematical.
E. Working on computations 1. All: <Students interact as they compute solutions>
V. Teacher Engagement 2 A. Asking for Clarification
1. T: What are you doing? 2. S 1: We find the varied surface, find which of them has the longest distances between them
and use this as a reliability index, where the smallest is better. B Pushing towards generalization (contrasting cases of two different patterns but same outliers)
1. T: So, you're allowing the outlier to drive them. 2. Sl:Yes. 3. T: Is there any reason for that? 4. S 1: Because the farther out the outlier is, the less reliable ... [inaudible] 5. T: So imagine I have something like this, OK? [Teacher draws two dots]. And I have another
one, like a zillion times. [Teacher draws two dots as before, but puts very many dots next to one of them.] So is that right ... these would get the same score?
Note. T = teacher; S = student.
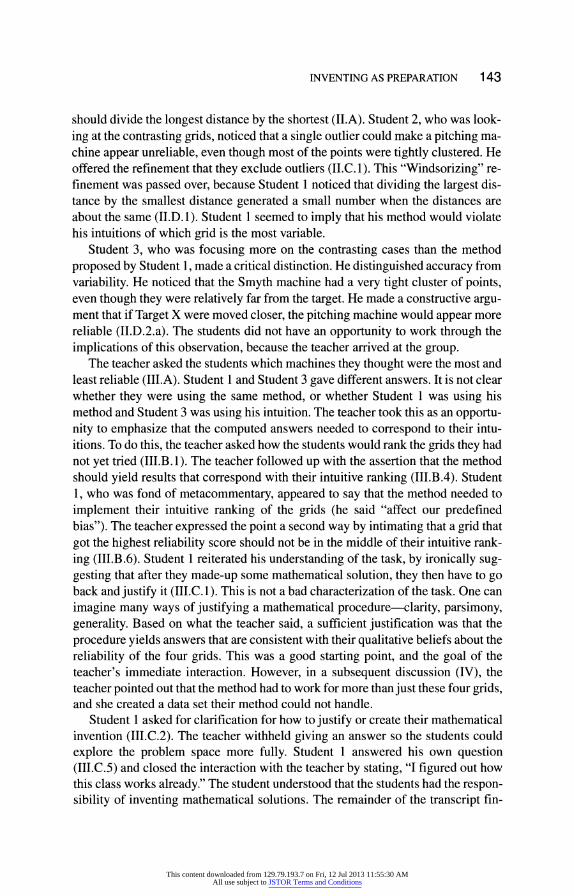
We join the group after they have begun work on the problem. Student 1 pro- posed that they should pick one point in each grid and find its distance to all the other points (I.A.1). This was a common early solution among all the groups, though it usually did not survive. Student 3, perhaps noticing an ambiguity in the method, commented that the contrasting grids had different sample sizes (I.B.1). The proposed method was silent about sample size, and Student 3 saw that a solu- tion may need to handle different numbers of pitches. Before the students could consider the implications of sample size, Student 1 noticed that his method yielded different answers depending on which point they started from (I.B.2). The insight that an arbitrary component can undermine a method was an important one. Across all the groups, the realization often occurred when two or more students used an underspecified method that generated different answers, and they discovered that they were making different assumptions about which points to include. Other times, the teacher helped students see the implications of an arbitrary component. Here, Student 1 realized the flaw in his method.
Student 1 proposed that they find the distance between the target and the point farthest from the target. He then quickly refined the proposal to state that they
This content downloaded from 129.79.193.7 on Fri, 12 Jul 2013 11:55:30 AMAll use subject to JSTOR Terms and Conditions
INVENTING AS PREPARATION 143
should divide the longest distance by the shortest (II.A). Student 2, who was look-
ing at the contrasting grids, noticed that a single outlier could make a pitching ma- chine appear unreliable, even though most of the points were tightly clustered. He offered the refinement that they exclude outliers (II.C. 1). This "Windsorizing" re- finement was passed over, because Student 1 noticed that dividing the largest dis- tance by the smallest distance generated a small number when the distances are about the same (II.D. 1). Student 1 seemed to imply that his method would violate his intuitions of which grid is the most variable.
Student 3, who was focusing more on the contrasting cases than the method proposed by Student 1, made a critical distinction. He distinguished accuracy from
variability. He noticed that the Smyth machine had a very tight cluster of points, even though they were relatively far from the target. He made a constructive argu- ment that if Target X were moved closer, the pitching machine would appear more reliable (II.D.2.a). The students did not have an opportunity to work through the implications of this observation, because the teacher arrived at the group.
The teacher asked the students which machines they thought were the most and least reliable (III.A). Student 1 and Student 3 gave different answers. It is not clear whether they were using the same method, or whether Student 1 was using his method and Student 3 was using his intuition. The teacher took this as an opportu- nity to emphasize that the computed answers needed to correspond to their intu- itions. To do this, the teacher asked how the students would rank the grids they had not yet tried (III.B. 1). The teacher followed up with the assertion that the method should yield results that correspond with their intuitive ranking (III.B.4). Student 1, who was fond of metacommentary, appeared to say that the method needed to implement their intuitive ranking of the grids (he said "affect our predefined bias"). The teacher expressed the point a second way by intimating that a grid that got the highest reliability score should not be in the middle of their intuitive rank- ing (III.B.6). Student 1 reiterated his understanding of the task, by ironically sug- gesting that after they made-up some mathematical solution, they then have to go back and justify it (III.C. 1). This is not a bad characterization of the task. One can imagine many ways of justifying a mathematical procedure-clarity, parsimony, generality. Based on what the teacher said, a sufficient justification was that the procedure yields answers that are consistent with their qualitative beliefs about the reliability of the four grids. This was a good starting point, and the goal of the teacher's immediate interaction. However, in a subsequent discussion (IV), the teacher pointed out that the method had to work for more than just these four grids, and she created a data set their method could not handle.
Student 1 asked for clarification for how to justify or create their mathematical invention (III.C.2). The teacher withheld giving an answer so the students could explore the problem space more fully. Student 1 answered his own question (III.C.5) and closed the interaction with the teacher by stating, "I figured out how this class works already." The student understood that the students had the respon- sibility of inventing mathematical solutions. The remainder of the transcript fin-
This content downloaded from 129.79.193.7 on Fri, 12 Jul 2013 11:55:30 AMAll use subject to JSTOR Terms and Conditions
144 SCHWARTZ AND MARTIN
ishes the interaction (and includes the charming line at IV.A.2 when one student
suggested they "call the angel of statistics," a sentiment many of us have shared). Hopefully, the transcript indicates how invention led students to consider features
of distributions, plus the work a good method must be able to accomplish with re-
spect to those features. For example, the students noticed that their method could not choose points arbitrarily, that it needed to work for all the cases, that it should handle different sample sizes and outliers, and that there is a difference between variability and accuracy. The students were developing their quantitative perceptions about what "counts" in reliability and they used these developing perceptions to evaluate their methods. By hypothesis, the group invention activities and the simple teacher interventions can be sufficient to prepare students to learn and appreciate the signifi- cance of a conventional solution once it becomes available.
THE IPL INSTRUCTIONAL CYCLE
As we mentioned previously, we think the hidden value of invention activities is that they prepare students to learn. A long view of preparation for learning would aim for learning that occurs beyond the class in which instruction occurs. Instructors, for example, can teach general methods for learning that include
study and critical thinking skills, habits of mind, and norms for generating con-
jectures and argumentation. Ideally, such skills and attitudes would help students learn in other classes, college, and everyday life. Our research takes a more modest approach suited to the size of the interventions. It prepared students to learn procedures from traditional instructional methods that are likely to occur at other points within the same instructional unit, and then to use those procedures wisely. Therefore, the effects of our preparation are unlikely to generalize so that students are more prepared to learn, for example, in geometry or history. Thus, we take a "strong knowledge" approach (Newell & Simon, 1972) that develops topic specific preparedness.
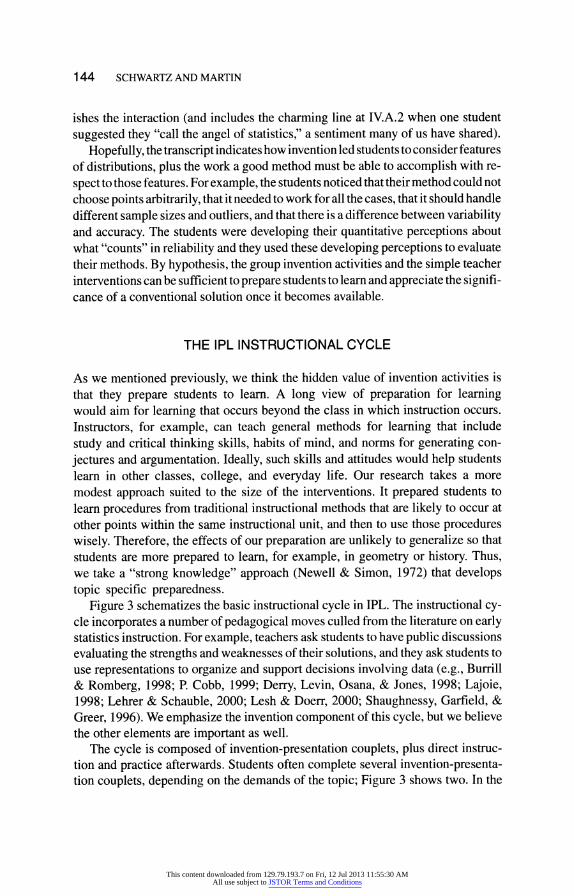
Figure 3 schematizes the basic instructional cycle in IPL. The instructional cy- cle incorporates a number of pedagogical moves culled from the literature on early statistics instruction. For example, teachers ask students to have public discussions
evaluating the strengths and weaknesses of their solutions, and they ask students to use representations to organize and support decisions involving data (e.g., Burrill & Romberg, 1998; P. Cobb, 1999; Derry, Levin, Osana, & Jones, 1998; Lajoie, 1998; Lehrer & Schauble, 2000; Lesh & Doerr, 2000; Shaughnessy, Garfield, & Greer, 1996). We emphasize the invention component of this cycle, but we believe the other elements are important as well.
The cycle is composed of invention-presentation couplets, plus direct instruc- tion and practice afterwards. Students often complete several invention-presenta- tion couplets, depending on the demands of the topic; Figure 3 shows two. In the
This content downloaded from 129.79.193.7 on Fri, 12 Jul 2013 11:55:30 AMAll use subject to JSTOR Terms and Conditions
INVENTING AS PREPARATION 145
FIGURE 3 The Inventing to Pre- Pitching Grids c > pare for Learning cycle. Each left-side small groups class discussion
arrow represents an invention activity that students complete in small Invention Activity 2 Presentations
Trampoline Bounce ''
/ groups, usually for 30 min. Each Trampoline ou assdiscssio small groups class discussion right-side arrow represents class dis- cussions about the inventions that stu- dents made. Students can complete class lecture several invention-presentation cou-
plets. The couplets prepare students to learn from direct instruction (a lecture Practice in this figure), which follows the in- i vention and presentation activities.
Finally, students briefly practice.
invention phase of each couplet, students work in small groups to invent their own solutions and representations to compare data sets. The transcript provided a feel for this interaction. Afterwards, each group draws its finished representation on the board. Other students, chosen at random, come to the board to explain a represen- tation and its implied conclusion, as if they had been part of the group. The need to make representations that "stand independently" encouraged students to develop more precise and complete representations, and it alerted them to the importance of communicable knowledge. In addition, just as the contrasting data sets helped students perceive important properties of distributions, the contrasting solutions that filled the board helped students notice important features of representations (Carpenter, Franke, Jacobs, Fennema, & Empson, 1997). The teacher's role during these presentations is primarily to help student articulation and point out signifi- cant differences between representations. However, different teachers have differ- ent styles. The only hard constraint is that the teacher cannot describe the conven- tional method.
After students complete the invention couplets, the teacher provides a brief lec- ture (or assignment) that describes a conventional method for representing and
comparing the data in the invention phase. For the cycle in Figure 3, the teacher de- scribed the formula for the mean deviation and students practiced on a new task.
The IPL cycle was designed to be a lenient instructional model that can support many different paths of interaction and invention. For example, during the small
group activities, groups had different styles of social interaction, often came up with different solutions, and did not always notice the same quantitative properties. Nevertheless, the processes of noticing and evolving representations were consis- tent through these variations. So, rather than constructing a narrow path for suc- cess, as might be the case for materials that have a single correct answer, IPL is meant to provide a broad path that permits variation without spilling into chaos.
This content downloaded from 129.79.193.7 on Fri, 12 Jul 2013 11:55:30 AMAll use subject to JSTOR Terms and Conditions
146 SCHWARTZ AND MARTIN
The same breadth of useful interaction extends to the role of the teacher. IPL mate- rials are meant to permit flexibility in teaching styles. One design goal for IPL is to
provide a method that is consistent with National Council of Teachers of Mathe- matics (2000) prescriptions, but that does not hinge on the exceptional skills and
supports necessary to conduct much reform-based instruction. A key move in
achieving this goal is freeing the teacher from the rhetorical task of exerting selec- tive pressure towards a canonical solution. This can soften the natural inclination of the teacher to "deliver" during the invention-presentation couplets. It is a precar- ious task to lead a classroom of students, often with different ideas in mind, to the standard solution or to provide just-in-time instruction without "spilling the beans" and destroying the active process of knowledge evolution. Because the purpose of these activities is to prepare students to learn, the teacher does not have to guide classroom discussion and invention towards a conventional solution. It is sufficient to help students notice properties of distributions and the work that their represen- tations are trying to accomplish.2 As we show in the following studies, the pay off can come later, when the teacher provides direct instruction or resources that offer the conventional solution invented by experts.
THE ASSESSMENT EXPERIMENT
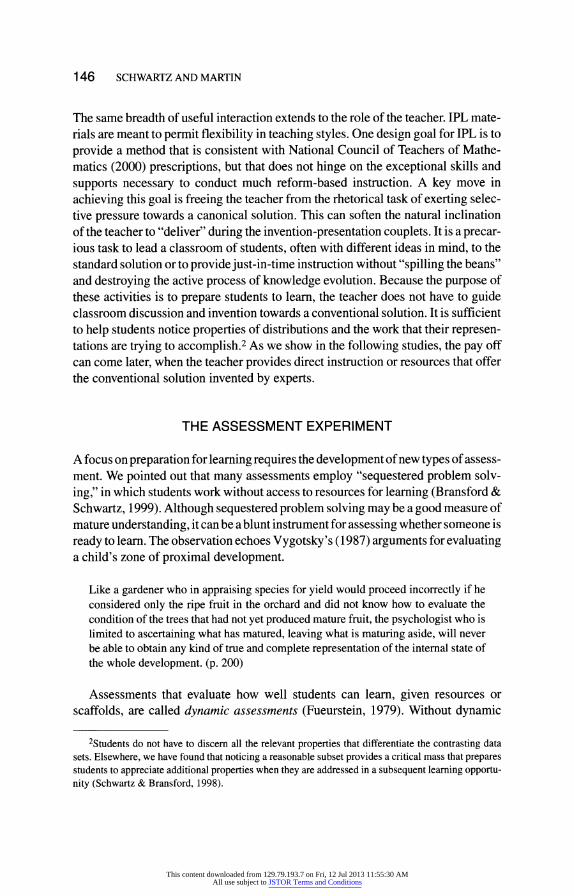
A focus on preparation for learning requires the development of new types of assess- ment. We pointed out that many assessments employ "sequestered problem solv-
ing," in which students work without access to resources for learning (Bransford & Schwartz, 1999). Although sequestered problem solving may be a good measure of mature understanding, it can be a blunt instrument for assessing whether someone is
ready to learn. The observation echoes Vygotsky's (1987) arguments for evaluating a child's zone of proximal development.
Like a gardener who in appraising species for yield would proceed incorrectly if he considered only the ripe fruit in the orchard and did not know how to evaluate the condition of the trees that had not yet produced mature fruit, the psychologist who is limited to ascertaining what has matured, leaving what is maturing aside, will never be able to obtain any kind of true and complete representation of the internal state of the whole development. (p. 200)
Assessments that evaluate how well students can learn, given resources or scaffolds, are called dynamic assessments (Fueurstein, 1979). Without dynamic
2Students do not have to discern all the relevant properties that differentiate the contrasting data sets. Elsewhere, we have found that noticing a reasonable subset provides a critical mass that prepares students to appreciate additional properties when they are addressed in a subsequent learning opportu- nity (Schwartz & Bransford, 1998).
This content downloaded from 129.79.193.7 on Fri, 12 Jul 2013 11:55:30 AMAll use subject to JSTOR Terms and Conditions
INVENTING AS PREPARATION 147
assessments, it is difficult to evaluate whether an instructional method has suc-
cessfully prepared students for future learning. Dynamic assessments can help reveal the hidden value of learning activities that appear inefficient, given tradi- tional assessments of memory and problem solving. For example, Schwartz and Bransford (1998) asked students to analyze simplified data sets from classic memory experiments and to invent their own graphs to show what they discov- ered. After students completed these activities, they did poorly on true-false tests, compared to students who wrote a summary of a chapter on the same memory experiments. However, when students in both conditions received a learning resource in the form of a follow-up lecture, the results reversed them- selves. On a subsequent assessment, the invention students showed that they learned much more deeply from the lecture. The invention students made twice as many correct predictions about a novel experiment than the summarize stu- dents. (We know the gains made by these inventing students were due to learn- ing from the lecture, because another group of inventing students did not hear the lecture and did quite poorly on the prediction task.) Dynamic assessments, in this case, of students' abilities to learn from a lecture, can help identify forms of instruction that support learning.
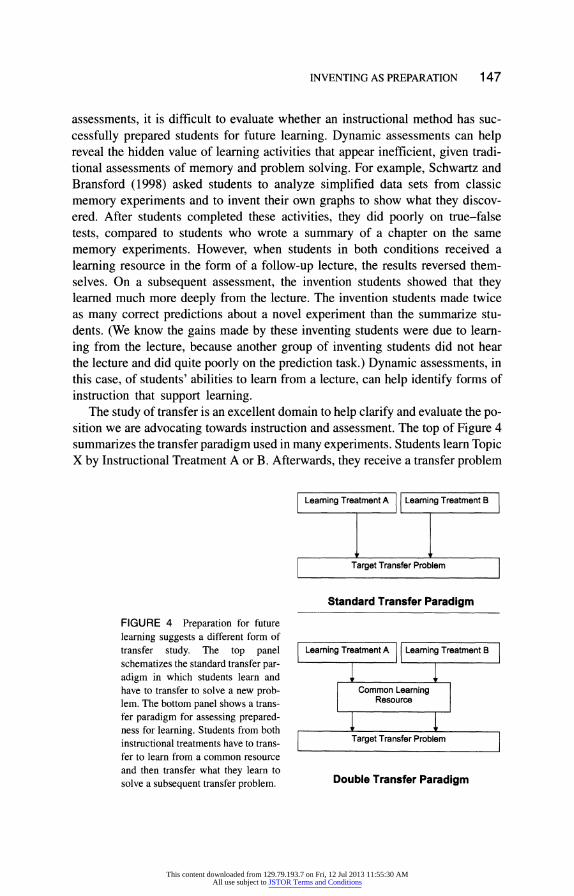
The study of transfer is an excellent domain to help clarify and evaluate the po- sition we are advocating towards instruction and assessment. The top of Figure 4 summarizes the transfer paradigm used in many experiments. Students learn Topic X by Instructional Treatment A or B. Afterwards, they receive a transfer problem
Leaming Treatment A Learning Treatment B
v v
Target Transfer Problem
Standard Transfer Paradigm
FIGURE 4 Preparation for future
learning suggests a different form of transfer study. The top panel Learning Treatment A Learning Treatment B schematizes the standard transfer par- adigm in which students learn and have to transfer to solve a new prob- Common Learning lem. The bottom panel shows a trans- Resource fer paradigm for assessing prepared-
-_- -for-- I ------ - C'- A nt- -r---m h-t-- I ne11 U1 IrU illllllg. OLUUllS I11UIII UULII
instructional treatments have to trans- fer to learn from a common resource and then transfer what they learn to solve a subsequent transfer problem.
Target Transfer Problem
Double Transfer Paradigm
This content downloaded from 129.79.193.7 on Fri, 12 Jul 2013 11:55:30 AMAll use subject to JSTOR Terms and Conditions
148 SCHWARTZ AND MARTIN
that is structurally similar to Topic X, but that has a different surface form. Re- searchers then compare whether A or B leads to better performance on the seques- tered transfer problem to draw conclusions about effective instruction or knowl- edge. This is a useful paradigm, because transfer tasks are often more sensitive to differences in understanding than direct tests of memory (e.g., Michael, Klee, Bransford, & Warren, 1993).
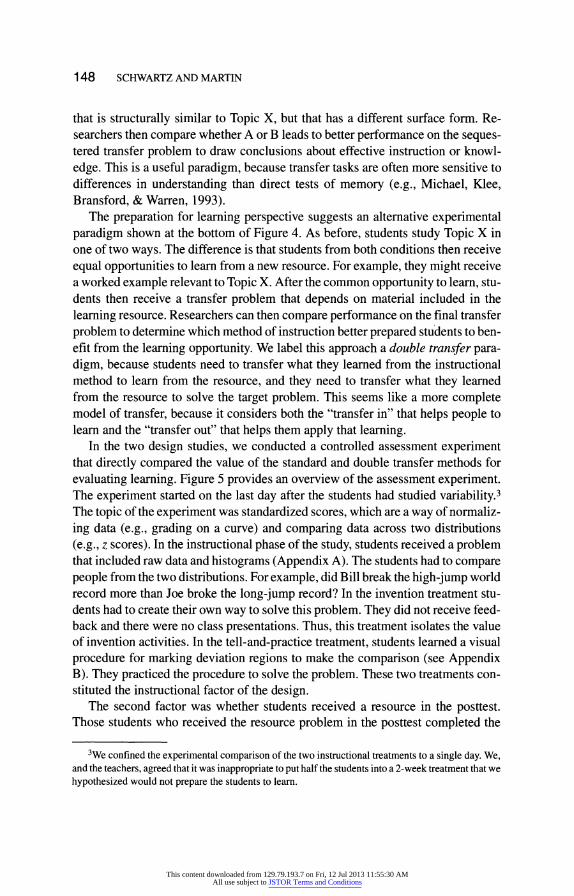
The preparation for learning perspective suggests an alternative experimental paradigm shown at the bottom of Figure 4. As before, students study Topic X in one of two ways. The difference is that students from both conditions then receive equal opportunities to learn from a new resource. For example, they might receive a worked example relevant to Topic X. After the common opportunity to learn, stu- dents then receive a transfer problem that depends on material included in the learning resource. Researchers can then compare performance on the final transfer problem to determine which method of instruction better prepared students to ben- efit from the learning opportunity. We label this approach a double transfer para- digm, because students need to transfer what they learned from the instructional method to learn from the resource, and they need to transfer what they learned from the resource to solve the target problem. This seems like a more complete model of transfer, because it considers both the "transfer in" that helps people to learn and the "transfer out" that helps them apply that learning.
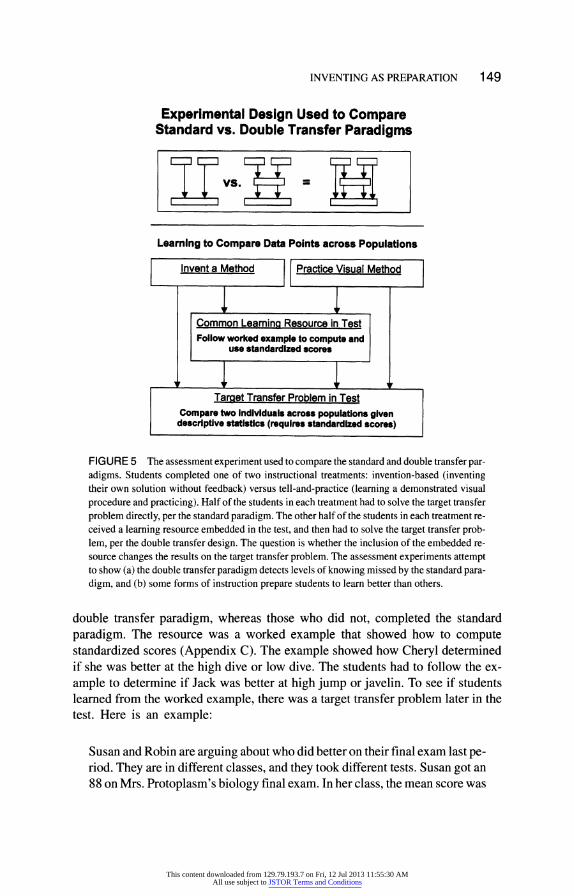
In the two design studies, we conducted a controlled assessment experiment that directly compared the value of the standard and double transfer methods for evaluating learning. Figure 5 provides an overview of the assessment experiment. The experiment started on the last day after the students had studied variability.3 The topic of the experiment was standardized scores, which are a way of normaliz- ing data (e.g., grading on a curve) and comparing data across two distributions (e.g., z scores). In the instructional phase of the study, students received a problem that included raw data and histograms (Appendix A). The students had to compare people from the two distributions. For example, did Bill break the high-jump world record more than Joe broke the long-jump record? In the invention treatment stu- dents had to create their own way to solve this problem. They did not receive feed- back and there were no class presentations. Thus, this treatment isolates the value of invention activities. In the tell-and-practice treatment, students learned a visual procedure for marking deviation regions to make the comparison (see Appendix B). They practiced the procedure to solve the problem. These two treatments con- stituted the instructional factor of the design.
The second factor was whether students received a resource in the posttest. Those students who received the resource problem in the posttest completed the
3We confined the experimental comparison of the two instructional treatments to a single day. We, and the teachers, agreed that it was inappropriate to put half the students into a 2-week treatment that we hypothesized would not prepare the students to learn.
This content downloaded from 129.79.193.7 on Fri, 12 Jul 2013 11:55:30 AMAll use subject to JSTOR Terms and Conditions
INVENTING AS PREPARATION 149
Experimental Design Used to Compare Standard vs. Double Transfer Paradigms
VS. I I IT II= IE l l,'"-,^V l l,
Learning to Compare Data Points across Populations
Invent a Method Practice Visual Method
1 I Common Learning Resource in Test Follow worked example to compute and
use standardized scores
Y 1 1 * Target Transfer Problem in Test
Compare two individuals across populations given descriptive statistics (requires standardized scores)
FIGURE 5 The assessment experiment used to compare the standard and double transfer par- adigms. Students completed one of two instructional treatments: invention-based (inventing their own solution without feedback) versus tell-and-practice (learning a demonstrated visual
procedure and practicing). Half of the students in each treatment had to solve the target transfer
problem directly, per the standard paradigm. The other half of the students in each treatment re- ceived a learning resource embedded in the test, and then had to solve the target transfer prob- lem, per the double transfer design. The question is whether the inclusion of the embedded re- source changes the results on the target transfer problem. The assessment experiments attempt to show (a) the double transfer paradigm detects levels of knowing missed by the standard para- digm, and (b) some forms of instruction prepare students to learn better than others.
double transfer paradigm, whereas those who did not, completed the standard paradigm. The resource was a worked example that showed how to compute standardized scores (Appendix C). The example showed how Cheryl determined if she was better at the high dive or low dive. The students had to follow the ex- ample to determine if Jack was better at high jump or javelin. To see if students learned from the worked example, there was a target transfer problem later in the test. Here is an example:
Susan and Robin are arguing about who did better on their final exam last pe- riod. They are in different classes, and they took different tests. Susan got an 88 on Mrs. Protoplasm's biology final exam. In her class, the mean score was
This content downloaded from 129.79.193.7 on Fri, 12 Jul 2013 11:55:30 AMAll use subject to JSTOR Terms and Conditions
150 SCHWARTZ AND MARTIN
a 74 and the average deviation was 12 points. The average deviation indi- cates how close all the students were to the average. Robin earned an 82 on Mr. Melody's music exam. In that class, the mean score was a 76 and the av- erage deviation was 4 points. Both classes had 100 students. Who do you think scored closer to the top of her class, Susan or Robin? Use math to help back up your opinion.
During instruction, the students received problems with raw data, but this prob- lem only includes descriptive measures. To compare Robin and Susan, one finds the standardized score of each by subtracting the class average from the student's score and dividing by the class variability. The worked example resource in the test showed this method. The question was which instructional treatment would best prepare students to learn from the worked example, and ideally, transfer this learn- ing to solve the target problem. Though worked examples are a common method for teaching procedures, students do not always learn as well from them as they might (e.g., Chi, de Leeuw, Chiu, & Lavancher, 1994; Reder, Charney, & Morgan, 1986). We thought that the students in the invention condition would develop the early knowledge that would help them learn, whereas the tell-and-practice stu- dents would not. Specifically, we predicted the students from the tell-and-practice instructional condition would perform the same on the target transfer problem whether or not they received the embedded resource. They would not be prepared to learn from the worked example, and they would interpret it as a "plug and chug" problem. In contrast, we thought the students in the invention condition would in- terpret the significance of the worked example. The invention students who re- ceived the resource problem would do best on the target transfer problem-better than the invention students who did not receive the resource, and better than the tell-and-practice students who did receive the resource. If true, this would show the value of the double transfer paradigm and the value of activities that encourage stu- dents to invent their own solutions.
EXPERIMENT 1
To examine the value of IPL instruction, the study assessed the extent to which sev- eral classes of ninth-grade algebra students had been prepared to learn about statis- tics. Sometimes, we told the students exactly what they were supposed to learn (e.g., in a lecture), and we determined if they learned from this telling. Other times students had to learn new statistical concepts during the test. The tests did not sig- nal that they included resources from which students could learn; students needed to recognize that, which makes these dynamic assessment items instances of spon- taneously transferring to learn.
This content downloaded from 129.79.193.7 on Fri, 12 Jul 2013 11:55:30 AMAll use subject to JSTOR Terms and Conditions
INVENTING AS PREPARATION 151
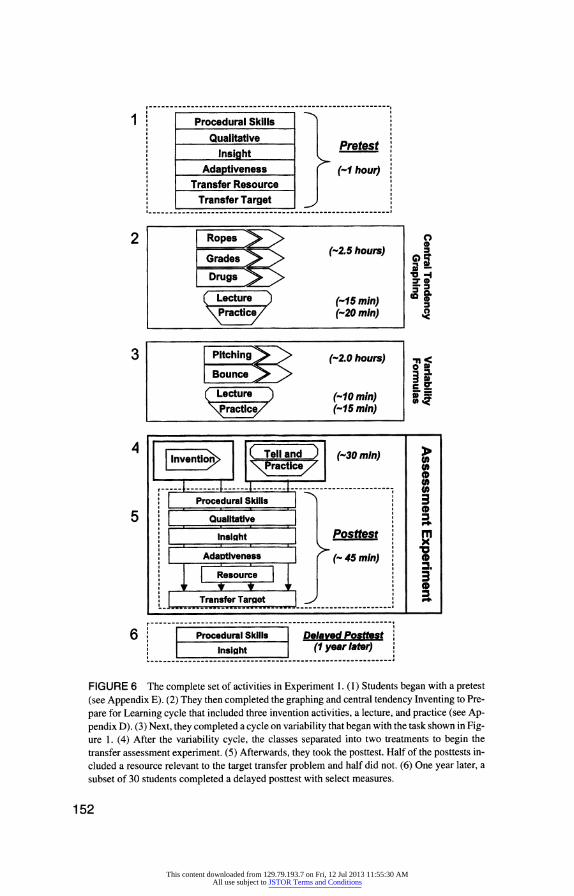
There were two main components to the study. There was the larger design study that all students completed, plus a set of measures to determine its effective- ness. There was also the assessment experiment on transfer appended to the end of the study. Figure 6 shows the overall instructional intervention, including the con- tent of each cycle and the approximate times. Box 1 shows that the study began with a pretest (see Method). Students then completed an IPL cycle on graphing and central tendency (Appendix D), which culminated in a lecture on graphing data (Box 2). They practiced briefly. They then completed an IPL cycle on the topic of variability, which culminated in a short lecture on the mean deviation (Box 3). We were particularly interested to know if students were prepared to learn from this brief lecture. In the final day of instruction, the classes were assigned to different instructional treatments to begin the formal assessment experiment comparing the single and double transfer paradigms (Box 4). Students then took a posttest to as- sess the effects of the overall design study (Box 5). Additionally, half the tests in- cluded the resource item and half did not, thereby completing the assessment ex- periment. Finally, a subset of students took a delayed posttest (Box 6).
We developed a number of new assessments to evaluate the IPL instruction. Some of these assessments were quite difficult. For example, one item required students to invent a way to measure the variability of bivariate data, which we never broached during the lessons. This makes it difficult to interpret the size of gains from pre- to posttest. Therefore, we collected benchmarks. We gave the same test to college students who had taken one semester of college statistics to gauge the difficulty of the items. A limitation of this comparison, however, is that the
ninth-grade students had recently completed statistics instruction but not all the
college students had. Therefore, a subset of the ninth-grade students took a delayed posttest on select items a year later.
Method
Participants. Six classes of ninth-grade algebra students from a highly suc- cessful public school (based on state test scores) participated at the end of the school year. According to their teachers and the school district guidelines, the stu- dents had worked on central tendency in earlier grades, but generally had not worked on graphs or measures of variability, except perhaps the range. One hun- dred students provided informed consent to report their data, of which 95 were present at both pre- and posttest. The students received instruction in their regular classes. Students who missed some instruction were still included in the data anal- ysis to make sure the gains were reflective of what would appear in a normal schooling situation. A random subset of 30 students also took a delayed posttest 1 year later. Additionally, the study recruited 25 undergraduates from a public uni-
versity rated in the top 20 by US News and World Report. The college students had taken one college statistics course within the past 2 years. By luck, the college stu-
This content downloaded from 129.79.193.7 on Fri, 12 Jul 2013 11:55:30 AMAll use subject to JSTOR Terms and Conditions
Procedural Skills i
Qualitative Pr pretest
Insight Adaptiveness (-1 hour)
Transfer Resource Transfer Target >
--- -- -- -- --- -- -- -- -- --- -- -- -- --- -- -- -- --
Ropes
Grades >(-2.5 hours)
Drugs
Lecture (-15 min) \Practice (-20 min)
6 i Procedural Skills Delaved Posttest Inliht (1 year later)
FIGURE 6 The complete set of activities in Experiment 1. (1) Students began with a pretest (see Appendix E). (2) They then completed the graphing and central tendency Inventing to Pre-
pare for Learning cycle that included three invention activities, a lecture, and practice (see Ap- pendix D). (3) Next, they completed a cycle on variability that began with the task shown in Fig- ure 1. (4) After the variability cycle, the classes separated into two treatments to begin the transfer assessment experiment. (5) Afterwards, they took the posttest. Half of the posttests in- cluded a resource relevant to the target transfer problem and half did not. (6) One year later, a subset of 30 students completed a delayed posttest with select measures.
152
0
oif ia =.I
0 "C
2
3
4
5
0 0
3
nr m x
3. 3 a.
This content downloaded from 129.79.193.7 on Fri, 12 Jul 2013 11:55:30 AMAll use subject to JSTOR Terms and Conditions
INVENTING AS PREPARATION 153
dents represented four different introductory statistics courses, which ensured a
good sample of instructional methods that had each covered variance.
Design. The study employed a pre-posttest design, with a subset of students also completing a delayed posttest. For the larger design study, all students com-
pleted the IPL curriculum. For the assessment experiment that began on the final
day of instruction, the six classes were randomly assigned to the two instructional treatments, invention versus tell-and-practice. Within each class, half of the stu- dents were randomly assigned to receive a posttest with the worked example re- source (see Table 2 for sample sizes). (For the pretest, all the students received the resource problem to permit a "level playing field" covariate for evaluating perfor- mance on the posttest transfer problem.) All told, this created a 2 x 2 x 2 design of Instructional Treatment x Presence/Absence of Resource in Posttest x Pre- test/Posttest Performance on the Transfer Problem.
During the instructional phase of the assessment experiment, the invention con- dition worked with a sports problem and the tell-and-practice condition used a grading problem (Appendix A). There were also two forms of the target transfer problem (Appendix E). One transfer problem used a sports context and one used a
grading context. (Students completed one form at pretest and the other at posttest, counter-balanced across conditions.) If the tell-and-practice students performed relatively better on the grade transfer problem, and the invent students performed relatively better on the sports transfer problem, then it would seem probable that the specific problem context led to transfer. However, if students from the two con- ditions did not show superiority for one problem version over another, it suggests that students were not using the surface similarity between the instruction and test problems. In Experiment 2, students received instruction using both contexts to re- move the confound.
Procedure. Students completed pre- and posttests a few days before and af- ter the intervention. The intervention used roughly 6 hr of classroom time spread over 2 weeks. Daniel Schwartz instructed the classes, which were videotaped by Taylor Martin. During small group work, we walked around the room to discuss the problems with the students. The classroom teachers were mostly present throughout, and although they were free to talk with students during group work, they tended to observe rather than participate.
For the invention activities, the students worked in small groups of 2 to 5 stu- dents for each task (composed according to their classroom teacher's judgment, the basis of which varied across teachers). Students worked with three graphing data sets in turn. Afterwards, the instructor provided a lecture on bar charts of means, histograms, box and whisker plots, and stem and leaf graphs. Students de- cided which they preferred for each of the data sets, and they practiced each format on a new problem. Students then worked on two formula activities that emphasized
This content downloaded from 129.79.193.7 on Fri, 12 Jul 2013 11:55:30 AMAll use subject to JSTOR Terms and Conditions
154 SCHWARTZ AND MARTIN
variability. Afterwards, the instructor displayed the mean deviation formula on the board and stated that in just a few minutes they would understand the formula per- fectly. The formula for the mean deviation is4:
Lx- / ln
The lecture included the students' first introduction to an iterative operator (sigma) and a summary symbol like x-bar (the mean). The instructor described the formula and how it operated over small data sets. To support this explanation, the instructor mapped the steps graphically by indicating the position of the mean un- der an ordered list of data and by drawing horizontal lines indicating the distances of each point from the mean. The lecture was intentionally brief to see if students had been prepared to learn: 5 to 10 min (plus 15 min of subsequent practice). The instructor wandered the room helping students as necessary. After the lesson on the mean deviation, the students began the assessment experiment.
For the three tell-and-practice classes, the teacher introduced grading on a curve and then told the students a procedure for marking deviation regions on a histo-
gram to compare scores (Appendix B). Students practiced on a new data set for
comparing grades. For the three invention classes, the students did not receive the introduction to grading on a curve, and the students tried to invent a way to deter- mine whether a long jump or pole vault competitor had broken their sport's prior world record by a greater relative amount. Students worked in small groups. There were no class presentations, no sharing of solutions, and the students did not re- ceive any feedback on their inventions. No students invented a correct solution in the invention condition.
Assessments. Students completed paper and pencil tests (Appendix E). The test had two forms. Several questions appeared with different cover stories or dif- ferent numbers on each form. Students completed one form at pretest and another at posttest (counterbalanced). Question order was randomized for each student with the constraint that the target transfer problem always appeared at least two
problems after the resource item. The delayed posttest included problems that evaluated the students' understanding and memory of the mean deviation.
4The mean deviation procedure first finds the mean of the data, represented by x-bar. It iteratively subtracts the mean from each value; these values indicate the distance or deviation of each point from the mean or center of the data. It uses absolute value of each distance, because variability in this case is about the size of the deviations and not their direction. The formula sums all the distances and divides
by the sample size n. The division by n computes the average deviation and helps handle the problem of
comparing across different sample sizes, plus it makes the measure of variability in the same scale as the mean.
This content downloaded from 129.79.193.7 on Fri, 12 Jul 2013 11:55:30 AMAll use subject to JSTOR Terms and Conditions
INVENTING AS PREPARATION 155
Measures of procedural skills asked students to compute the mean, median, mode, and mean deviation, and to make a graph. For the qualitative reasoning items, students had to reason about the relation between different descriptive sta- tistics of central tendency.
The symbolic insight problems were novel assessments and required students to see through a formula to the quantitative work it does or does not do. There were two types. One type showed a formula and directly asked why it includes a specific operation. For example, the test showed the mean deviation and asked students why the formula divides by n. One problem asked about the mean devi- ation and two problems asked about algebra formulas that the students had al- ready studied (Pythagorean theorem and slope formula). Although very simple and decontextualized, the format may offer a quick way to determine whether students understand how a formula accomplishes its quantitative work.
The second type of insight problem (the IQ problem) provided students with data and a summary statistic, and it tested whether students evaluated the statistic as a good characterization of the data. The problem presents an industrialist's argu- ment about preferring to hire blue people over green people because they have higher IQs. The problem provides the mean IQ of the two groups and the raw data, and asks student to evaluate the argument. The question was whether students would blindly accept the average IQ as a fair statistic, or whether they would exam- ine the data and notice it was bimodal for the green people, which invalidates the use of the mean as a statistic.5 We constructed the item in response to a book that had recently received attention by comparing the IQs of different races. We
thought it was useful to have students think about the conclusions one can draw about individuals from a comparison of group means.
We used a single item to assess whether students were developing an adaptive base of knowledge (cf. Hatano & Inagaki, 1986). Students needed to determine who was the more consistent scorer per number of minutes played, given a scat- ter plot of the data. The instructional activities never introduced instances of covariation. This item is like many tests of sequestered problem solving, because it does not include explicit resources for learning. However, it differs in that it is a dynamic assessment-students need to learn a new concept in the course of the problem solving, and it does include an implicit resource to support learning; namely, a line that shows the predicted scoring. If students have a good under- standing of variability, they might recognize that they can compute the average deviation of each point from the regression line.
The last form of assessment was the target transfer problem and was part of the assessment experiment previously described.
5One could reason that in the long run, the industrialist was right. One would get a higher IQ on av-
erage with blue people, despite the bimodal distribution of green people. Nobody did this.
This content downloaded from 129.79.193.7 on Fri, 12 Jul 2013 11:55:30 AMAll use subject to JSTOR Terms and Conditions
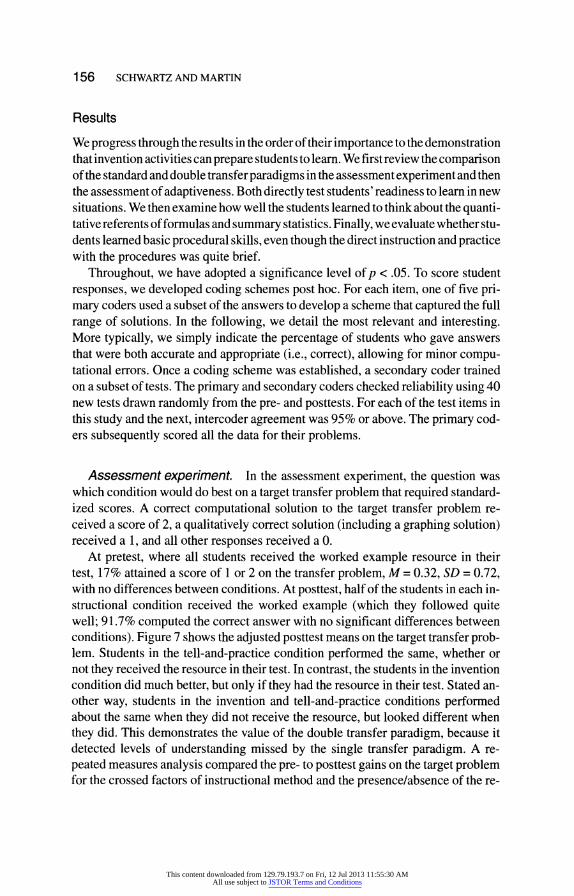
156 SCHWARTZ AND MARTIN
Results
We progress through the results in the order of their importance to the demonstration that invention activities can prepare students to learn. We first review the comparison of the standard and double transfer paradigms in the assessment experiment and then the assessment of adaptiveness. Both directly test students' readiness to learn in new situations. We then examine how well the students learned to think about the quanti- tative referents of formulas and summary statistics. Finally, we evaluate whether stu- dents learned basic procedural skills, even though the direct instruction and practice with the procedures was quite brief.
Throughout, we have adopted a significance level of p < .05. To score student responses, we developed coding schemes post hoc. For each item, one of five pri- mary coders used a subset of the answers to develop a scheme that captured the full range of solutions. In the following, we detail the most relevant and interesting. More typically, we simply indicate the percentage of students who gave answers that were both accurate and appropriate (i.e., correct), allowing for minor compu- tational errors. Once a coding scheme was established, a secondary coder trained on a subset of tests. The primary and secondary coders checked reliability using 40 new tests drawn randomly from the pre- and posttests. For each of the test items in this study and the next, intercoder agreement was 95% or above. The primary cod- ers subsequently scored all the data for their problems.
Assessment experiment. In the assessment experiment, the question was which condition would do best on a target transfer problem that required standard- ized scores. A correct computational solution to the target transfer problem re- ceived a score of 2, a qualitatively correct solution (including a graphing solution) received a 1, and all other responses received a 0.
At pretest, where all students received the worked example resource in their test, 17% attained a score of 1 or 2 on the transfer problem, M = 0.32, SD = 0.72, with no differences between conditions. At posttest, half of the students in each in- structional condition received the worked example (which they followed quite well; 91.7% computed the correct answer with no significant differences between conditions). Figure 7 shows the adjusted posttest means on the target transfer prob- lem. Students in the tell-and-practice condition performed the same, whether or not they received the resource in their test. In contrast, the students in the invention condition did much better, but only if they had the resource in their test. Stated an- other way, students in the invention and tell-and-practice conditions performed about the same when they did not receive the resource, but looked different when they did. This demonstrates the value of the double transfer paradigm, because it detected levels of understanding missed by the single transfer paradigm. A re- peated measures analysis compared the pre- to posttest gains on the target problem for the crossed factors of instructional method and the presence/absence of the re-
This content downloaded from 129.79.193.7 on Fri, 12 Jul 2013 11:55:30 AMAll use subject to JSTOR Terms and Conditions
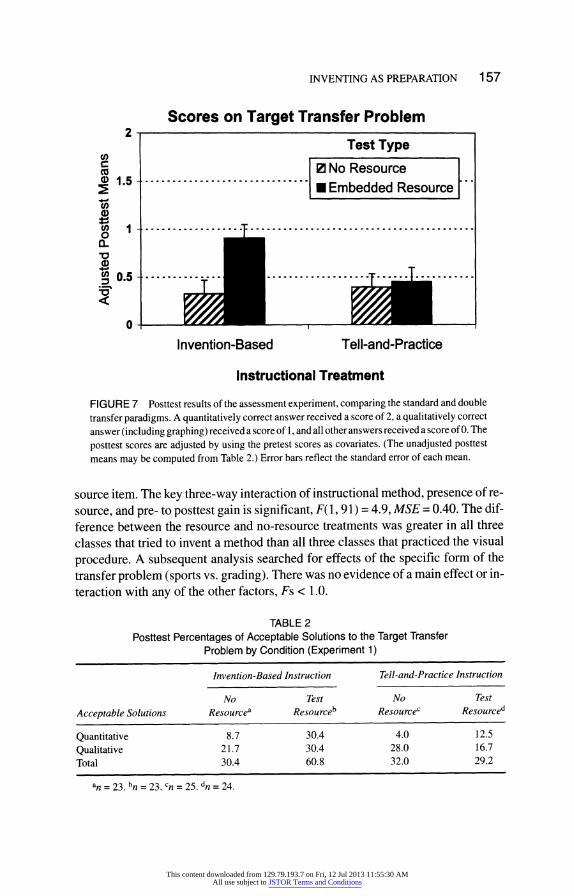
INVENTING AS PREPARATION 157
Scores on Target Transfer Problem
Test Type 0 No Resource
............................. Embedded Resource m Embedded Resource
T
0
Invention-Based
l-ad-
Tell-and-Practice
Instructional Treatment
FIGURE 7 Posttest results of the assessment experiment, comparing the standard and double
transfer paradigms. A quantitatively correct answer received a score of 2, a qualitatively correct
answer (including graphing) received a score of 1, and all other answers received a score of 0. The
posttest scores are adjusted by using the pretest scores as covariates. (The unadjusted posttest means may be computed from Table 2.) Error bars reflect the standard error of each mean.
source item. The key three-way interaction of instructional method, presence of re-
source, and pre- to posttest gain is significant, F(1, 91) = 4.9, MSE = 0.40. The dif- ference between the resource and no-resource treatments was greater in all three classes that tried to invent a method than all three classes that practiced the visual
procedure. A subsequent analysis searched for effects of the specific form of the transfer problem (sports vs. grading). There was no evidence of a main effect or in- teraction with any of the other factors, Fs < 1.0.
TABLE 2 Posttest Percentages of Acceptable Solutions to the Target Transfer
Problem by Condition (Experiment 1)
Invention-Based Instruction Tell-and-Practice Instruction
No Test No Test
Acceptable Solutions Resourcea Resourceb Resourcec Resourced
Quantitative 8.7 30.4 4.0 12.5
Qualitative 21.7 30.4 28.0 16.7
Total 30.4 60.8 32.0 29.2
an = 23. bn = 23. Cn = 25. dn = 24.
2
cn)
a 1.5
o 1-
:n 0.5 '.
-
I
This content downloaded from 129.79.193.7 on Fri, 12 Jul 2013 11:55:30 AMAll use subject to JSTOR Terms and Conditions
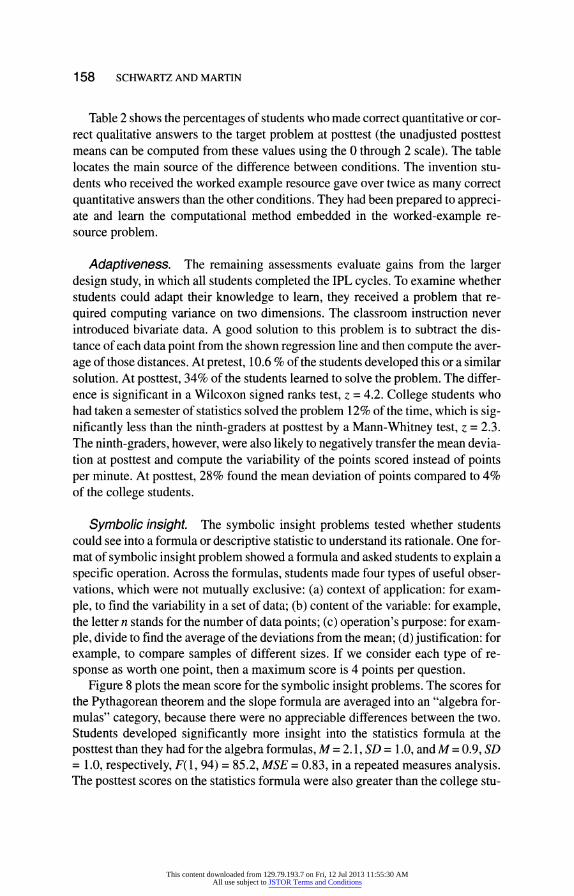
158 SCHWARTZ AND MARTIN
Table 2 shows the percentages of students who made correct quantitative or cor- rect qualitative answers to the target problem at posttest (the unadjusted posttest means can be computed from these values using the 0 through 2 scale). The table locates the main source of the difference between conditions. The invention stu- dents who received the worked example resource gave over twice as many correct quantitative answers than the other conditions. They had been prepared to appreci- ate and learn the computational method embedded in the worked-example re- source problem.
Adaptiveness. The remaining assessments evaluate gains from the larger design study, in which all students completed the IPL cycles. To examine whether students could adapt their knowledge to learn, they received a problem that re- quired computing variance on two dimensions. The classroom instruction never introduced bivariate data. A good solution to this problem is to subtract the dis- tance of each data point from the shown regression line and then compute the aver- age of those distances. At pretest, 10.6 % of the students developed this or a similar solution. At posttest, 34% of the students learned to solve the problem. The differ- ence is significant in a Wilcoxon signed ranks test, z = 4.2. College students who had taken a semester of statistics solved the problem 12% of the time, which is sig- nificantly less than the ninth-graders at posttest by a Mann-Whitney test, z = 2.3. The ninth-graders, however, were also likely to negatively transfer the mean devia- tion at posttest and compute the variability of the points scored instead of points per minute. At posttest, 28% found the mean deviation of points compared to 4% of the college students.
Symbolic insight. The symbolic insight problems tested whether students could see into a formula or descriptive statistic to understand its rationale. One for- mat of symbolic insight problem showed a formula and asked students to explain a specific operation. Across the formulas, students made four types of useful obser- vations, which were not mutually exclusive: (a) context of application: for exam- ple, to find the variability in a set of data; (b) content of the variable: for example, the letter n stands for the number of data points; (c) operation's purpose: for exam- ple, divide to find the average of the deviations from the mean; (d) justification: for example, to compare samples of different sizes. If we consider each type of re- sponse as worth one point, then a maximum score is 4 points per question.
Figure 8 plots the mean score for the symbolic insight problems. The scores for the Pythagorean theorem and the slope formula are averaged into an "algebra for- mulas" category, because there were no appreciable differences between the two. Students developed significantly more insight into the statistics formula at the posttest than they had for the algebra formulas, M = 2.1, SD = 1.0, and M = 0.9, SD = 1.0, respectively, F(1, 94) = 85.2, MSE = 0.83, in a repeated measures analysis. The posttest scores on the statistics formula were also greater than the college stu-
This content downloaded from 129.79.193.7 on Fri, 12 Jul 2013 11:55:30 AMAll use subject to JSTOR Terms and Conditions
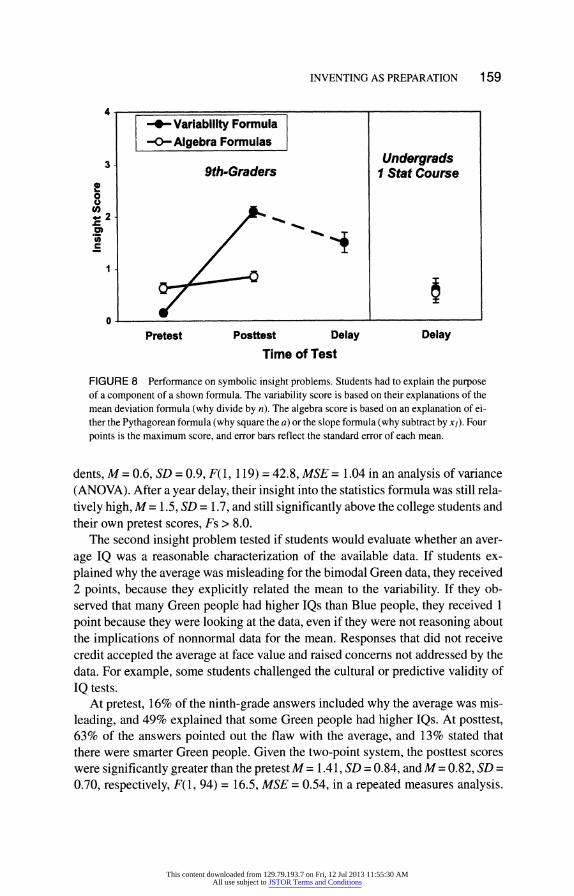
INVENTING AS PREPARATION 159
4
-*Variability Formula -O- Algebra Formulas
3 3.~~~~- ~Undergrads 9th-Graders 1 Stat Course
0 o
2
Prtest Postest Delay Delay
Pretest Posttest Delay Delay
Time of Test
FIGURE 8 Performance on symbolic insight problems. Students had to explain the purpose of a component of a shown formula. The variability score is based on their explanations of the mean deviation formula (why divide by n). The algebra score is based on an explanation of ei- ther the Pythagorean formula (why square the a) or the slope formula (why subtract by xj). Four
points is the maximum score, and error bars reflect the standard error of each mean.
dents, M = 0.6, SD = 0.9, F(1, 119) = 42.8, MSE = 1.04 in an analysis of variance (ANOVA). After a year delay, their insight into the statistics formula was still rela-
tively high, M = 1.5, SD = 1.7, and still significantly above the college students and their own pretest scores, Fs > 8.0.
The second insight problem tested if students would evaluate whether an aver-
age IQ was a reasonable characterization of the available data. If students ex-
plained why the average was misleading for the bimodal Green data, they received 2 points, because they explicitly related the mean to the variability. If they ob- served that many Green people had higher IQs than Blue people, they received 1
point because they were looking at the data, even if they were not reasoning about the implications of nonnormal data for the mean. Responses that did not receive credit accepted the average at face value and raised concerns not addressed by the data. For example, some students challenged the cultural or predictive validity of IQ tests.
At pretest, 16% of the ninth-grade answers included why the average was mis-
leading, and 49% explained that some Green people had higher IQs. At posttest, 63% of the answers pointed out the flaw with the average, and 13% stated that there were smarter Green people. Given the two-point system, the posttest scores were significantly greater than the pretest M = 1.41, SD = 0.84, and M = 0.82, SD =
0.70, respectively, F(1, 94) = 16.5, MSE = 0.54, in a repeated measures analysis.
This content downloaded from 129.79.193.7 on Fri, 12 Jul 2013 11:55:30 AMAll use subject to JSTOR Terms and Conditions
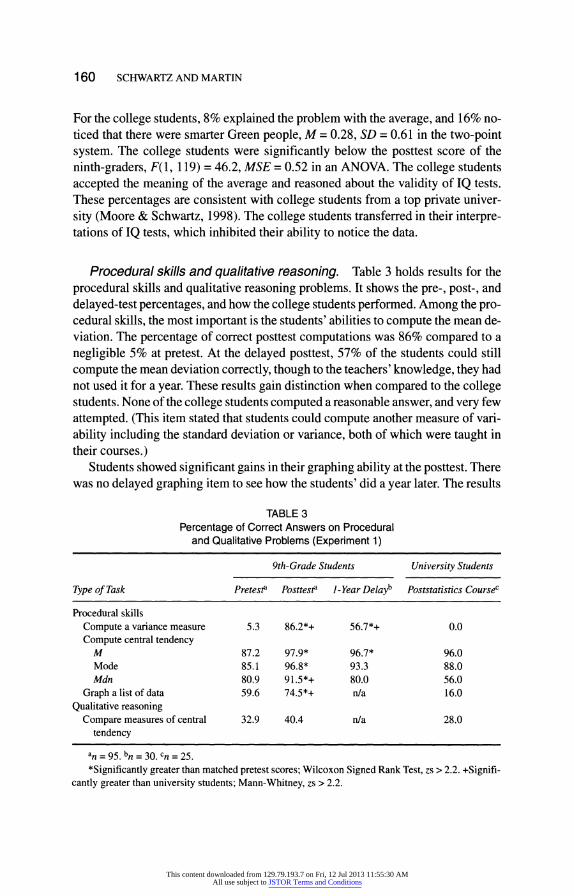
160 SCHWARTZ AND MARTIN
For the college students, 8% explained the problem with the average, and 16% no- ticed that there were smarter Green people, M = 0.28, SD = 0.61 in the two-point system. The college students were significantly below the posttest score of the ninth-graders, F(1, 119) = 46.2, MSE = 0.52 in an ANOVA. The college students accepted the meaning of the average and reasoned about the validity of IQ tests. These percentages are consistent with college students from a top private univer- sity (Moore & Schwartz, 1998). The college students transferred in their interpre- tations of IQ tests, which inhibited their ability to notice the data.
Procedural skills and qualitative reasoning. Table 3 holds results for the procedural skills and qualitative reasoning problems. It shows the pre-, post-, and delayed-test percentages, and how the college students performed. Among the pro- cedural skills, the most important is the students' abilities to compute the mean de- viation. The percentage of correct posttest computations was 86% compared to a negligible 5% at pretest. At the delayed posttest, 57% of the students could still compute the mean deviation correctly, though to the teachers' knowledge, they had not used it for a year. These results gain distinction when compared to the college students. None of the college students computed a reasonable answer, and very few attempted. (This item stated that students could compute another measure of vari- ability including the standard deviation or variance, both of which were taught in their courses.)
Students showed significant gains in their graphing ability at the posttest. There was no delayed graphing item to see how the students' did a year later. The results
TABLE 3 Percentage of Correct Answers on Procedural
and Qualitative Problems (Experiment 1)
9th-Grade Students University Students
Type of Task Pretesta Posttesta 1-Year Delayb Poststatistics Coursec
Procedural skills Compute a variance measure 5.3 86.2*+ 56.7*+ 0.0 Compute central tendency
M 87.2 97.9* 96.7* 96.0 Mode 85.1 96.8* 93.3 88.0 Mdn 80.9 91.5*+ 80.0 56.0
Graph a list of data 59.6 74.5*+ n/a 16.0 Qualitative reasoning
Compare measures of central 32.9 40.4 n/a 28.0 tendency
an = 95. bn = 30. Cn = 25. *Significantly greater than matched pretest scores; Wilcoxon Signed Rank Test, zs > 2.2. +Signifi-
cantly greater than university students; Mann-Whitney, zs > 2.2.
This content downloaded from 129.79.193.7 on Fri, 12 Jul 2013 11:55:30 AMAll use subject to JSTOR Terms and Conditions
INVENTING AS PREPARATION 161
for computing measures of central tendency are less impressive, but also less theo-
retically interesting because the students did not receive organized direct instruc- tion on these. Students were good at computing central tendency measures at pre- test, with gains that approached ceiling at posttest. However, except for computing the mean, these abilities returned to the level of the pretest after a year's delay.
The qualitative reasoning items emphasized making decisions about which measure of central tendency was more appropriate for a given situation. There was little movement on these items from pre- to posttest, and the college students did not perform well either. It is not clear if this lack of gain should be attributed to the instruction or the assessments we constructed. The next experiment used different assessments to address this question.
Discussion
Experiment 1 showed that it is possible to prepare students for future learning and assess that preparation. Students were prepared to learn to compute the mean devi- ation from a brief lecture and practice session. They also learned the purpose of di- viding by n when embedded deep within the short lecture-better than they under- stood the components of the algebra formulas they had studied extensively. They also learned enough about variability that a third of the students could adapt their
knowledge to infer how to compute covariance, though bivariate data had not been raised in class. Finally, in the assessment experiment, the students who invented their own methods for standardizing data learned from a worked example embed- ded in the test and spontaneously transferred this learning to solve a novel prob- lem, even more so than students who had been told and had practiced a specific vi- sual technique for standardizing data. This latter finding is particularly important. It shows that dynamic assessments can be sensitive to levels of understanding that we care about but that can be missed by summative assessments of problem solv- ing. The two forms of instruction would have looked the same had we not included the resource item from which students could learn. The finding also demonstrates that inventing activities can prepare students to learn.
The research design did not isolate the critical ingredients of the inventing in- struction responsible for the effects. The results do show, however, that instruction that allows students to generate imperfect solutions can be effective for future learning. This is important because people may believe it is inefficient to let stu- dents generate incorrect solutions-why not just tell them the correct answer (e.g., Lovett & Greenhouse, 2000). In the assessment experiment, the students in the in- venting condition did not generate a correct standardizing procedure during in- struction, yet they were more prepared to learn the procedure than students who were directly taught and practiced a correct visual method. This finding does not imply that any opportunity to be wrong is good, nor does it mean that teachers should point out failures as such. Rather, we suppose that instruction that provides
This content downloaded from 129.79.193.7 on Fri, 12 Jul 2013 11:55:30 AMAll use subject to JSTOR Terms and Conditions
162 SCHWARTZ AND MARTIN
an opportunity to evolve formal characterizations to handle the significant proper- ties of a domain can prepare students to recognize the value of a solution once it be- comes available.
In addition to gains on assessments of readiness to learn, there were significant gains across the board. Basic computation was not sacrificed to understanding, or vice versa. The size of the improvement acquires measure in comparison to the per- formances of college students who had taken a semester of statistics. Even after a year's delay, the high school students performed better than the college students did.
We primarily used the college students to indicate the difficulty of the assess- ments. We cannot make strong conclusions about why they did comparatively poorly. There are many possibilities. For example, the college students were not taking the test for a grade, so they may not have tried as hard. Even so, the perfor- mances of the college students should cause some concern. It does not take much effort to explain why a variability formula divides by n if one knows the answer. G. Cobb and Moore (1997) suggested that one problem with college instruction is that it emphasizes issues of probability and inference, which are notoriously prone to misconception (Tversky & Kahneman, 1973), and it does not spend sufficient time on descriptive statistics. We suspect some of the problem is also that the college students did not have an opportunity to develop interpretations of statistical data that prepared them to learn from the direct, procedural instruction that dominated their introductory college courses.
In the assessment experiment, we found that the match between the context of instruction (sports or grades) and the transfer problem (sports or grades) did not in- fluence the frequency of transfer. This implies that students did not transfer from instruction to the target transfer problem based on surface features. However, stu- dents who received instruction in the sports context may have had an advantage be- cause the worked example resource problem was also about sports. If so, then it is possible that the advantage of the invention condition had nothing to do with the method of instruction, but instead, derived from using a sports context that matched the sports context of the resource problem. To remove this confound, the following assessment experiment gave both conditions the sports and grading con- texts during instruction.
EXPERIMENT 2
The primary purpose of the second study was to determine whether the results would replicate when classroom teachers managed the instruction. In Experiment 1, we taught the students a curriculum we designed, and we no doubt brought a host of sociomathematical norms that are not explicit in the IPL curriculum (e.g., P. Cobb, McClain, & Gravemeijer, 2003). This raises the question of whether IPL is broadly feasible and adaptable by different types of teachers. We recruited four ninth-grade
This content downloaded from 129.79.193.7 on Fri, 12 Jul 2013 11:55:30 AMAll use subject to JSTOR Terms and Conditions
INVENTING AS PREPARATION 163
algebra teachers and their classes. Based on earlier classroom observations, two of the teachers emphasized procedural lectures and subsequent seatwork. We will call them the lecture-oriented teachers. The other two teachers occasionally employed small projects coupled with mathematical class discussions. We will call them the discussion-orientedteachers, to reflect that they had led discussions, though this was not their normal mode of instruction. One teacher from each pair had watched us teach the curriculum the previous year. The variation among the teachers provided an opportunity to see if any strong differences emerged that would suggest the curric- ulum was not serviceable.
Figure 9 shows the set up for the new study, including modifications. Due to school constraints, we compressed the intervention. The direct instruction for graphing came in a homework assignment. We extended the instructional time for the assessment experiment so students could work with both the grading and sports contexts during the instructional period. We dropped the IQ symbolic insight prob- lem, which had shown up at several feeder middle schools. We replaced the quali- tative reasoning problems (see Appendix E), and students had to construct graphs and explain their answers verbally. We also added explicit prompts to half the sym- bolic insight problems using the categories found in Experiment 1 (see Appendix E). We wanted to determine if the prompting would change the diagnostic value of the question format (cf. Sears, 2002).
Method
Participants. Four teachers taught seven algebra classes. The lecture-ori- ented teacher with prior exposure taught three classes. The discussion-oriented teacher taught two classes. The two teachers who had not seen the previous inter- vention taught one class each. There were 102 ninth-graders who provided signed consent and completed the pre- and posttests.
Design and procedures. The design was similar to Experiment 1, without delayed measures or a college benchmark. In Figure 9, asterisks indicate changes in the implementation. Of critical importance, in the assessment experiment, all the students received both the sports and grading contexts during instruction. For both the invention and tell-and-practice treatments, the teachers set the stage with the issue of grading on a curve, and then students worked with the grading problem and then the sports problem. The resource problem provided in the test had an error in this study; it showed the variance, but it stated it was the mean deviation. The logic of standardized scores works with the variance as well as the mean deviation. Nobody noticed this error, which by one interpretation means the students did not understand the mean deviation. We suspect students were too busy following the procedure to check the accuracy of its computations.
This content downloaded from 129.79.193.7 on Fri, 12 Jul 2013 11:55:30 AMAll use subject to JSTOR Terms and Conditions
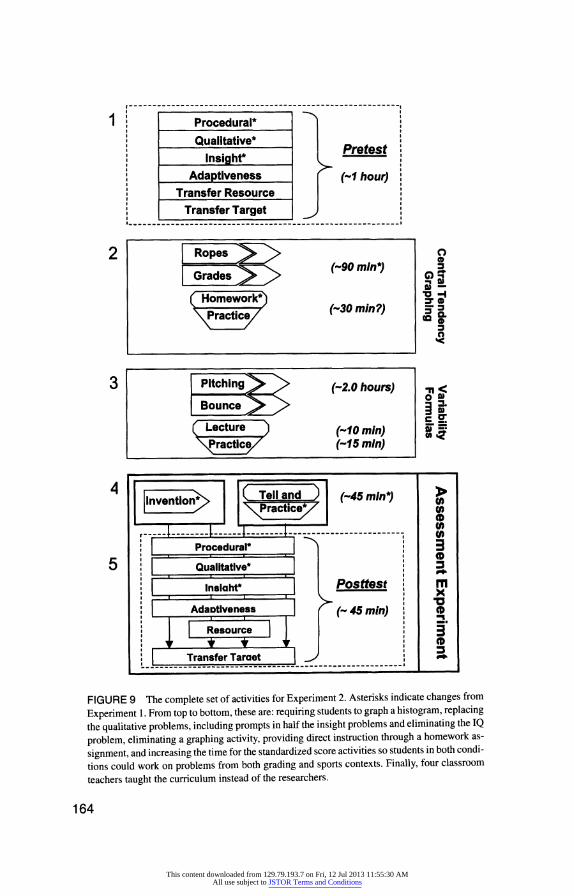
'1 iProcedural*
Qualitative* Pretest
Insight* Adaptiveness (-1 hour)
Transfer Resource
Transfer Target ?,?
2
3
4
5
Ropes
Grades (-90 min*)
Homework Practic (-30 min?)
Pitching > (-2.0 hours) Bounce
Lecture ) (-10 mn) \Practice/ (-15 min)
0 0
IZ1
.I C)
3 V-
5 =
O m
FIGURE 9 The complete set of activities for Experiment 2. Asterisks indicate changes from
Experiment 1. From top to bottom, these are: requiring students to graph a histogram, replacing the qualitative problems, including prompts in half the insight problems and eliminating the IQ
problem, eliminating a graphing activity, providing direct instruction through a homework as-
signment, and increasing the time for the standardized score activities so students in both condi-
tions could work on problems from both grading and sports contexts. Finally, four classroom
teachers taught the curriculum instead of the researchers.
164
This content downloaded from 129.79.193.7 on Fri, 12 Jul 2013 11:55:30 AMAll use subject to JSTOR Terms and Conditions
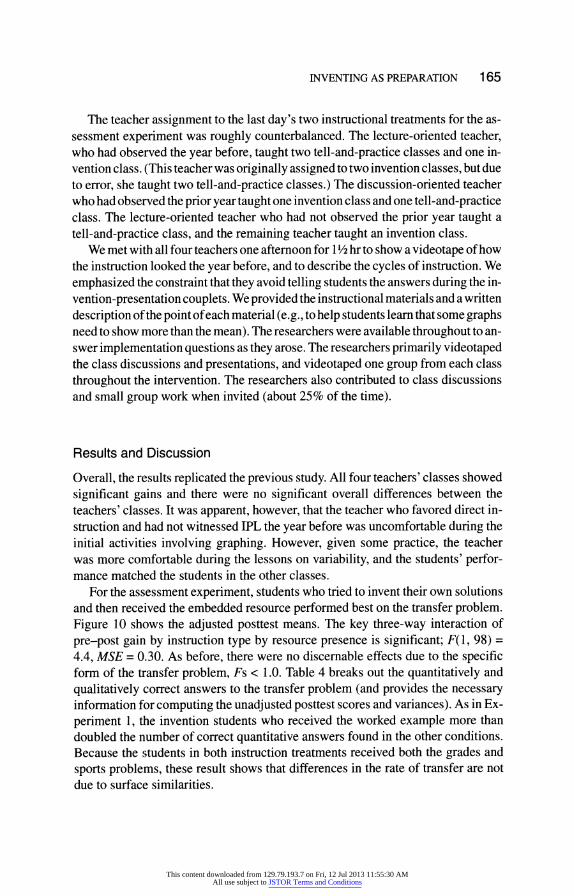
INVENTING AS PREPARATION 165
The teacher assignment to the last day's two instructional treatments for the as- sessment experiment was roughly counterbalanced. The lecture-oriented teacher, who had observed the year before, taught two tell-and-practice classes and one in- vention class. (This teacher was originally assigned to two invention classes, but due to error, she taught two tell-and-practice classes.) The discussion-oriented teacher who had observed the prior year taught one invention class and one tell-and-practice class. The lecture-oriented teacher who had not observed the prior year taught a
tell-and-practice class, and the remaining teacher taught an invention class. We met with all four teachers one afternoon for 1 /2 hr to show a videotape of how
the instruction looked the year before, and to describe the cycles of instruction. We
emphasized the constraint that they avoid telling students the answers during the in-
vention-presentation couplets. We provided the instructional materials and a written
description of the point of each material (e.g., to help students learn that some graphs need to show more than the mean). The researchers were available throughout to an- swer implementation questions as they arose. The researchers primarily videotaped the class discussions and presentations, and videotaped one group from each class
throughout the intervention. The researchers also contributed to class discussions and small group work when invited (about 25% of the time).
Results and Discussion
Overall, the results replicated the previous study. All four teachers' classes showed
significant gains and there were no significant overall differences between the teachers' classes. It was apparent, however, that the teacher who favored direct in- struction and had not witnessed IPL the year before was uncomfortable during the initial activities involving graphing. However, given some practice, the teacher was more comfortable during the lessons on variability, and the students' perfor- mance matched the students in the other classes.
For the assessment experiment, students who tried to invent their own solutions and then received the embedded resource performed best on the transfer problem. Figure 10 shows the adjusted posttest means. The key three-way interaction of
pre-post gain by instruction type by resource presence is significant; F(1, 98) =
4.4, MSE = 0.30. As before, there were no discernable effects due to the specific form of the transfer problem, Fs < 1.0. Table 4 breaks out the quantitatively and
qualitatively correct answers to the transfer problem (and provides the necessary information for computing the unadjusted posttest scores and variances). As in Ex-
periment 1, the invention students who received the worked example more than doubled the number of correct quantitative answers found in the other conditions. Because the students in both instruction treatments received both the grades and
sports problems, these result shows that differences in the rate of transfer are not due to surface similarities.
This content downloaded from 129.79.193.7 on Fri, 12 Jul 2013 11:55:30 AMAll use subject to JSTOR Terms and Conditions
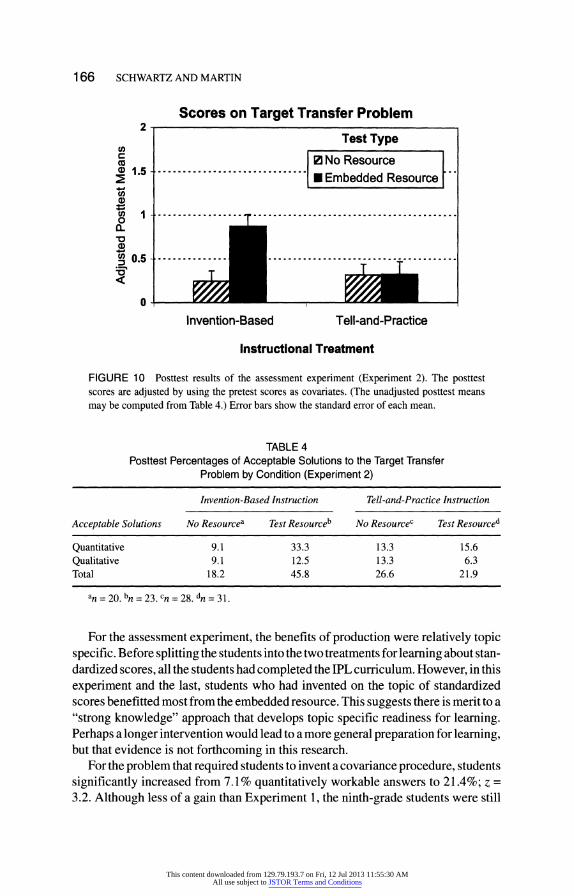
166 SCHWARTZ AND MARTIN
Scores on Target Transfer Problem 2
Test Type 0,
(< =.....~0 No Resource ) 1.5 ...............................
2 * .5 Embedded Resource
-.-- - ....... . .................. .. ........... 0o
\o 0.5 .....--- ......
io Ti Invention-Based Tell-and-Practice
Instructional Treatment
FIGURE 10 Posttest results of the assessment experiment (Experiment 2). The posttest scores are adjusted by using the pretest scores as covariates. (The unadjusted posttest means
may be computed from Table 4.) Error bars show the standard error of each mean.
TABLE 4 Posttest Percentages of Acceptable Solutions to the Target Transfer
Problem by Condition (Experiment 2)
Invention-Based Instruction Tell-and-Practice Instruction
Acceptable Solutions No Resourcea Test Resourceb No Resourcec Test Resourced
Quantitative 9.1 33.3 13.3 15.6 Qualitative 9.1 12.5 13.3 6.3 Total 18.2 45.8 26.6 21.9
an = 20. bn = 23. Cn = 28. dn = 31.
For the assessment experiment, the benefits of production were relatively topic specific. Before splitting the students into the two treatments for learning about stan- dardized scores, all the students had completed the IPL curriculum. However, in this experiment and the last, students who had invented on the topic of standardized scores benefitted most from the embedded resource. This suggests there is merit to a "strong knowledge" approach that develops topic specific readiness for learning. Perhaps a longer intervention would lead to a more general preparation for learning, but that evidence is not forthcoming in this research.
For the problem that required students to invent a covariance procedure, students significantly increased from 7.1% quantitatively workable answers to 21.4%; z = 3.2. Although less of a gain than Experiment 1, the ninth-grade students were still
This content downloaded from 129.79.193.7 on Fri, 12 Jul 2013 11:55:30 AMAll use subject to JSTOR Terms and Conditions
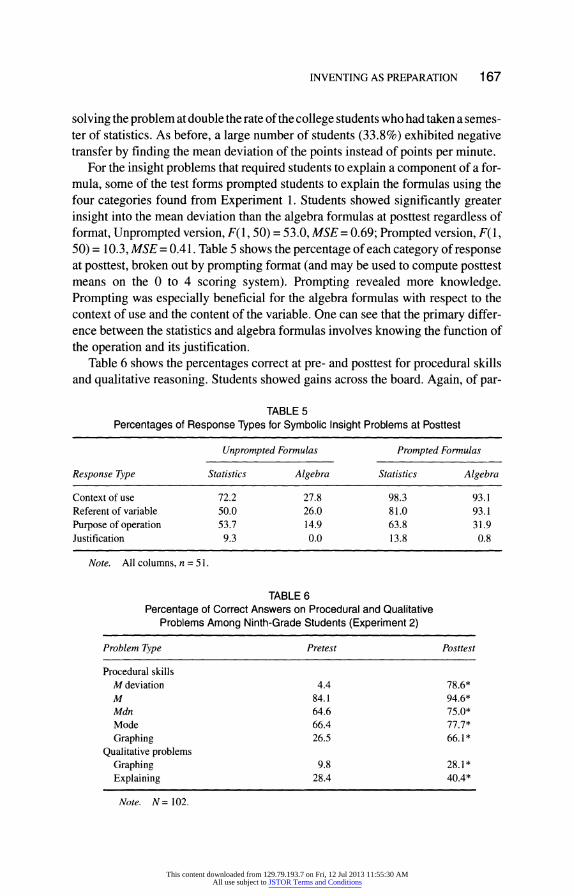
INVENTING AS PREPARATION 167
solving the problem at double the rate of the college students who had taken a semes- ter of statistics. As before, a large number of students (33.8%) exhibited negative transfer by finding the mean deviation of the points instead of points per minute.
For the insight problems that required students to explain a component of a for- mula, some of the test forms prompted students to explain the formulas using the four categories found from Experiment 1. Students showed significantly greater insight into the mean deviation than the algebra formulas at posttest regardless of format, Unprompted version, F(1, 50) = 53.0, MSE = 0.69; Prompted version, F(1, 50) = 10.3, MSE = 0.41. Table 5 shows the percentage of each category of response at posttest, broken out by prompting format (and may be used to compute posttest means on the 0 to 4 scoring system). Prompting revealed more knowledge. Prompting was especially beneficial for the algebra formulas with respect to the context of use and the content of the variable. One can see that the primary differ- ence between the statistics and algebra formulas involves knowing the function of the operation and its justification.
Table 6 shows the percentages correct at pre- and posttest for procedural skills and qualitative reasoning. Students showed gains across the board. Again, of par-
TABLE 5
Percentages of Response Types for Symbolic Insight Problems at Posttest
Unprompted Formulas Prompted Formulas
Response Type Statistics Algebra Statistics Algebra
Context of use 72.2 27.8 98.3 93.1 Referent of variable 50.0 26.0 81.0 93.1
Purpose of operation 53.7 14.9 63.8 31.9 Justification 9.3 0.0 13.8 0.8
Note. All columns, n = 51.
TABLE 6
Percentage of Correct Answers on Procedural and Qualitative Problems Among Ninth-Grade Students (Experiment 2)
Problem Type Pretest Posttest
Procedural skills M deviation 4.4 78.6* M 84.1 94.6* Mdn 64.6 75.0* Mode 66.4 77.7*
Graphing 26.5 66.1* Qualitative problems
Graphing 9.8 28.1*
Explaining 28.4 40.4*
Note. N= 102.
This content downloaded from 129.79.193.7 on Fri, 12 Jul 2013 11:55:30 AMAll use subject to JSTOR Terms and Conditions
168 SCHWARTZ AND MARTIN
ticular interest are the extremely strong gains on the mean deviation. Students also showed reasonably strong gains on graphing a histogram, which indicates that the activities had prepared students to learn from homework (there was no in-class presentation). Unlike the first study, there were significant gains on the qualitative problems. These new problems each had a visualization component and an expla- nation component. Because there is no comparison available, we cannot evaluate the difficulty of achieving these gains.
GENERAL DISCUSSION
Summary of Findings
Two studies examined the prospect of instruction and assessments that target stu- dents' preparation for future learning. With IPL, students evolve their readiness to learn by inventing representations that differentiate contrasting cases of data. Al- though the representations are rarely satisfactory by conventional standards, stu- dents still discern important quantitative properties of variability and the represen- tations that characterize them. This prepares them to see the significance of expert solutions and potential resources for learning. In Experiment 1, students demon- strated that they could learn the components and application of the mean deviation from a brief lecture. Even after a year's delay, their abilities exceeded those of col- lege students who had taken a full semester of statistics. The ninth-graders also evaluated the utility of a descriptive statistic in a charged, data-driven argument better than university students did. The study also showed that a third of the stu- dents were prepared to adapt their knowledge to learn how to compute covariance given a regression line, even though the instruction did not cover bivariate data. Finally, it showed the significance of including dynamic assessments of prepara- tion for learning, because the benefit of the invention approach over a more "effi- cient" tell-and-practice approach only appeared when there was a learning re- source embedded in a problem during the test. One advantage of encouraging original student production is that it prepares students for subsequent learning. How far in the future this learning can still occur is an open question.
The assessment experiments constituted an unusual demonstration of transfer. In most transfer studies, participants learn a procedure and researchers test whether they spontaneously apply it to a new problem. This was a component of our dynamic assessment; we measured whether students transferred the standardization proce- dure from a worked example to the target problem. However, the manipulation of in- terest was not how we presented the standardization procedure (which was constant across conditions), but rather, how we differentially prepared students to learn from the worked example showing the procedure. We propose that this double transfer de- sign is a more ecologically valid approach to the study of transfer, where the transfer
This content downloaded from 129.79.193.7 on Fri, 12 Jul 2013 11:55:30 AMAll use subject to JSTOR Terms and Conditions
INVENTING AS PREPARATION 169
of one's prior knowledge determines what one learns, and what one learns deter- mines what is transferred to solve a subsequent problem.
Experiment 2 replicated the pattern of results from Experiment 1 when four classroom teachers did the instruction instead of us. This is useful because it shows that the IPL instructional model is tractable, at least within the range of variation found among the teachers and students in this school.
Extending the Research
The findings merit further research into the value of invention for preparing stu- dents to learn. One class of research should look into the interactive processes that
prepare students. In our work, we put our efforts into the existence of proof that
original student production can have strong outcomes, especially for subsequent learning. Examining the nature of the classroom interactions and the students' in- vention activities should help specify the critical ingredients (and changes to ingre- dients) needed for successful preparation. Moreover, additional research designs can help isolate suspected causative factors.
A second class of research should investigate issues of generalization. These studies used relatively small sample sizes and narrow demographics, and it is im-
portant to see if the results hold more broadly. A particularly difficult challenge is overcoming the problem of intact classes. For the assessment experiment, we as-
signed classes to instructional treatments. For example, in Experiment 1, there were three classes that completed the invention activities and three that practiced the visualizing procedure. Thus, we cannot claim that the results generalize to other classes without a larger sample of classrooms. This limitation is mitigated by the fact that the invention students who received a resource did better on the target transfer problem than the invention students (in the same class) who did not receive a resource. The concern is also mitigated by the replication in Experiment 2. Nev- ertheless, the use of intact classrooms to implement the experimental design limits the generalization of the claims.
A third class of research should address issues of extension. For example, does invention over contrasting cases work for other topics and demographics, and will students be prepared to learn once they leave the classroom or complete other activities with less expository resources? We have reasons to be hopeful. Martin (2003), for example, found positive "preparation for learning" results for a fraction curriculum in which fourth-grade students from low socioeconomic status backgrounds tried to invent their own notations to differentiate contrasting cases. For learning without explicit resources, the current studies showed that one fourth to one third of the students could adapt their knowledge to find covariance between two variables on the posttest. We suspect the IPL cycle would make a good starter unit for more complex and authentic project-based in- struction, such as the modeling projects that are entering mathematics instruc-
This content downloaded from 129.79.193.7 on Fri, 12 Jul 2013 11:55:30 AMAll use subject to JSTOR Terms and Conditions
170 SCHWARTZ AND MARTIN
tion (Hovarth & Lehrer, 1998; Lesh, 2003). By using relatively confined data sets and a tight representational focus, IPL may prepare students to make sense of larger projects that include more complex data with many more possible inter- esting quantitative patterns and accounts.
Another critical research question is whether students and teachers can or should sustain the IPL model over a full course. We anecdotally observed that the students quickly adapted to the norms of invention and presentation. The students and teach- ers appeared to "click-in" within a lesson or two, even though this form of instruction was not the norm at the school. This may be because the students were relatively high achieving high school students who already had a set of norms that led them to try hard on any school task. Regardless, their ability to adapt so quickly also means they could rebel equally quickly. It seems likely that students could tire of repeatedly adapting their inventions, only to hear the "correct" answer in the end. During the first study, when we lectured on the mean deviation formula, there were audible gasps from students in each class. We believed the students were expressing appreci- ation of the formula's elegance, but a colleague whom we had invited to observe, said, "They were just relieved that you finally told them the answer." Although we
disagree-students appreciated how much they learned when we reported the re- sults of the studies-tiring of IPL seems like a real possibility. We suspect that IPL should be folded in with other activities. Students did not have trouble switching into IPL, so it seems feasible to use it strategically rather than uniformly. Additionally, it seems important for students to receive continued evidence of learning, for example by using pre- and posttests or benchmarks. With support and a larger dose, students might be willing to preserve long enough to develop lasting dispositions towards the challenges of generating mathematical insight.
The remaining two questions involve issues of assessment. This research at- tempted to develop a number of new forms of assessment. Some of these items seem simple and extensible (e.g., explaining the purpose of a component of a for- mula), and it may be worth studying their properties more carefully. More cen- trally, the results of the assessment experiment suggest the value of further re- search into designing dynamic assessments that evaluate how well students have been prepared to learn. Besides measuring something that we should care about, it would make it desirable for teachers to teach to the test. For example, if teachers knew that a standardized test required learning during the test, they would have to prepare students to learn from the resources. This seems like a worthwhile use of time, at least compared to teaching specific techniques for solving the narrow classes of problems that are likely to be sampled by a test.
Finally, there is the question of whether it is possible to evaluate individual stu- dent's readiness to learn from direct instruction. These studies did not employ methods for predicting when individual students or classes were ready to learn. Ideally, a method for assessing a student's readiness to learn would be integral to the instruction, rather than requiring a separate test.
This content downloaded from 129.79.193.7 on Fri, 12 Jul 2013 11:55:30 AMAll use subject to JSTOR Terms and Conditions
INVENTING AS PREPARATION 171
CONCLUSIONS
Two studies showed that it is possible to prepare students for future learning and to assess this preparedness. The most direct way to evaluate whether different in- structional activities prepare students to learn is to assess the students' abilities to learn given resources. It is import to note that the results also indicate that one way to prepare students to learn involves letting them generate original productions that are incorrect by normative standards. Although this production appears inefficient by itself, it has a later payoff when students find resources for learning.
Our overarching goal has been to demonstrate that original student production is a valuable educational approach by several measures, when coupled with oppor- tunities to learn conventional solutions. A way to restate our goal is that we hope to legitimize a discussion of the relation between production and accommodation. Most work in cognitive science and much of education has studied processes of as- similation, rather than accommodation. In Piaget's (1985) notion of assimilation, children interpret a new situation as similar to what they already know. Cognitive science has made excellent headway on the problem of assimilation, which de- pends on the efficiency with which one assimilates a new instance to an old one. It has produced a number of psychological constructs to help explain how people as- similate information, ranging from feature detection to naive theories to schemas to analogical mapping. However, for novel learning, it is important to foster ac- commodation, where people's knowledge adapts to what is different from what they already know. The field has made less headway on the processes of reinterpre- tation and accommodation, which was also a problem for Piaget. For example, Chomsky and Fodor criticized Piaget for not having an account of how fundamen- tally new ideas could develop (Piatelli-Palmarini, 1980). We think some of the lack of progress has been due to the paucity of psychological research on how people's productive interactions with their environment help them to generate new ideas and "let go" of old ones. The field has emphasized ways to make people efficient rather than adaptive. The literatures on efficient reading and sequestered problem solving, for example, are mountainous compared to the literature on how people produce things to learn.
People like to produce things. Pfaffman (2003), for example, found that the top motivation among many types of hobbyists was the opportunity to appreciate the "fruits of their labor." People are also designed for production (e.g., we have hands and make tools). We propose that the opportunity to produce novel structures in the material, symbolic, and social environments is also a powerful mechanism for re- interpreting these environments and developing new ideas. We borrowed some ar- guments from ecological psychology for why production may be useful for learn-
ing, but we do not have a satisfactory account of the mechanisms, and we suspect there are many. These mechanisms are important to understand, lest people believe that any form of original student production is valuable, given a subsequent lec-
This content downloaded from 129.79.193.7 on Fri, 12 Jul 2013 11:55:30 AMAll use subject to JSTOR Terms and Conditions
172 SCHWARTZ AND MARTIN
ture. The key to making headway is to do research that emphasizes production be- fore efficiency and that assesses learning with resources instead of problem solv- ing without. An emphasis on high efficiency is something that becomes important for routinized jobs, but less so for helping people to learn fundamentally new ideas.
ACKNOWLEDGMENTS
Taylor Martin is currently at the University of Texas, Austin. This report is based upon work supported by the National Science Foundation under REC Grant 0196238. We offer our deep gratitude to Arne Lim, Kathy Himmelberger, and Judy Choy. Most of all, we thank Suz Antink for her constant reminder of why we do this research. Any opinions, findings and conclusions or recommendations ex- pressed in this material are those of the authors and do not necessarily reflect the views of the National Science Foundation.
REFERENCES
Anderson, J. R., Conrad, F. G., & Corbett, A. T. (1989). Skill acquisition and the LISP tutor. Cognitive Science, 13, 467-505.
Barron, B. J., Schwartz, D. L., Vye, N. J., Moore, A., Petrosino, A., Zech, L., et al. (1998). Doing with
understanding: Lessons from research on problem- and project-based learning. Journal of the
Learning Sciences, 7, 271-312. Boaler, J. (1997). Experiencing school mathematics: Teaching styles, sex, and setting. Philadelphia:
Open University Press. Bransford, J. D., Franks, J. J., Vye, N. J., & Sherwood, R. D. (1989). New approaches to instruction:
Because wisdom can't be told. In S. Vosniadou & A. Ortony (Eds.), Similarity and analogical rea- soning (pp. 470-497). New York: Cambridge University Press.
Bransford, J. D., & Schwartz, D. L. (1999). Rethinking transfer: A simple proposal with multiple impli- cations. In A. Iran-Nejad & P. D. Pearson (Eds.), Review of research in education, 24 (pp. 61-101). Washington, DC: American Educational Research Association.
Brown, A. L., & Kane, M. J. (1988). Preschool children can learn to transfer: Learning to learn and learning from example. Cognitive Psychology, 20, 493-523.
Burrill, G., & Romberg, T. (1998). Statistics and probability for the middle grades: Examples from mathematics in context. In S. Lajoie (Ed.), Reflection on statistics (pp. 33-62). Mahwah, NJ: Law- rence Erlbaum Associates, Inc.
Carpenter, T., Franke, M., Jacobs, V., Fennema, E., & Empson, S. (1997). A longitudinal study of in- vention and understanding in children's multidigit addition and subtraction. Journalfor Research in Mathematics Education, 29(1), 3-20.
Chi, M. T. H., de Leeuw, N., Chiu, M. -H., & LaVancher, C. (1994). Eliciting self-explanations im- proves understanding. Cognitive Science, 18, 439-477.
Chiu, M. M., Kessel, C., Moschkovich, J., & Munoz-Nunez, A. (2001). Learning to graph linear func- tions: A case study of conceptual change. Cognition & Instruction, 2, 215-252.
This content downloaded from 129.79.193.7 on Fri, 12 Jul 2013 11:55:30 AMAll use subject to JSTOR Terms and Conditions
INVENTING AS PREPARATION 173
Clement, J. (1993). Using bridging analogies and anchoring intuitions to deal with students' preconcep- tions in physics. Journal of Research in Science Teaching, 30, 1241-1257.
Cobb, G., & Moore, D. S. (1997, November). Mathematics, statistics, and teaching. Mathematics, Sta- tistics, & Teaching, 801-823.
Cobb, P. (1999). Individual and collective mathematical development: The case of statistical data anal-
ysis. Mathematical Thinking and Learning, 1, 5-43. Cobb, P., McClain, K., & Gravemeijer, K. (2003). Learning about statistical covariation. Cognition &
Instruction, 21, 1-78.
Cognition and Technology Group at Vanderbilt. (1997). The Jasper Project: Lessons in curriculum, instruc- tion, assessment, and professional development. Mahwah, NJ: Lawrence Erlbaum Associates, Inc.
Dehaene, S. (2000). Cereberal bases of number processing and calculation. In M. S. Gazzaniga (Ed.), The new cognitive neurosciences (2nd ed., pp. 965-1061). Cambridge, MA: MIT Press.
Derry, S. J., Levin, J. R., Osana, H. P., & Jones, M. S. (1998). Developing middle-school students' sta- tistical reasoning abilities through simulation gaming. In S. Lajoie (Ed.), Reflections on statistics
(pp. 175-198). Mahwah, NJ: Lawrence Erlbaum Associates, Inc. DiSessa, A. A., Hammer, D., Sherin, B., & Kolpakowski, T. (1991). Inventing graphing: Meta-repre-
sentational expertise in children. Journal of Mathematical Behavior, 10, 117-160.
Eyler, J., & Giles, D. E., Jr. (1999). Where's the learning in service-learning? San Francisco:
Jossey-Bass. Feuerstein, R. (1979). The dynamic assessment of retarded performers: The learning potential assess-
ment device, theory, instruments, and techniques. Baltimore: University Park Press.
Gagne, R. M., & Briggs, L. J. (1974). Principles of instructional design (2nd ed.). New York: Holt, Rinehart, & Winston.
Gardner, H. (1982). Art, mind, and brain: A cognitive approach to creativity. New York: Basic Books.
Garner, W. R. (1974). The processing of information and structure. Potomac, MD: Lawrence Erlbaum Associates, Inc.
Gibson, E. J. (1940). A systematic application of the concepts of generalization and differentiation to verbal learning. Psychological Review, 47, 196-229.
Gibson, E. J. (1969). Principles of perceptual learning and development. New York: Meredith. Gibson, J. J., & Gibson, E. J. (1955). Perceptual learning: Differentiation or enrichment. Psychological
Review, 62, 32-51. Greeno, J. G. (1997). Response: On claims that answer the wrong questions. Educational Researcher,
26(1), 5-17. Griffin, S., Case, R., & Siegler, R. S. (1994). Rightstart: Providing the central conceptual prerequisites
for first formal learning of arithmetic to students at risk for school failure. In K. McGilly (Ed.), Class- room lessons: Integrating cognitive theory and classroom practice (pp. 25-49). Cambridge, MA: MIT Press.
Hatano, G., & Inagaki, K. (1986). Two courses of expertise. In H. Stevenson, H. Azuma, & K. Hakuta (Eds.), Child development and education in Japan (pp. 262-272). New York: Freeman.
Hovarth, J. K., & Lehrer, R. (1998). A model-based perspective on the development of children's un-
derstanding of chance and uncertainty. In S. Lajoie (Ed.), Reflections on statistics (pp. 121-148). Mahwah, NJ: Lawrence Erlbaum Associates, Inc.
Hunt, E. B., & Minstrell, J. (1994). A cognitive approach to the teaching of physics. In K. McGilly (Ed.), Classroom lessons: Integrating cognitive theory and classroom practice (pp. 51-74). Cam- bridge, MA: MIT Press.
Konold, C. (1989). Informal conceptions of probability. Cognition & Instruction, 6, 59-98.
Lajoie, S. P. (1998). Reflections on statistics. Mahwah, NJ: Lawrence Erlbaum Associates, Inc.
This content downloaded from 129.79.193.7 on Fri, 12 Jul 2013 11:55:30 AMAll use subject to JSTOR Terms and Conditions
174 SCHWARTZ AND MARTIN
Lehrer, R., & Schauble, L. (2000). Inventing data structures for representational purposes: Elementary grade students' classification models. Mathematical Thinking and Learning, 2, 51-74.
Lehrer, R., Schauble, L., Carpenter, S., & Penner, D. (2000). The interrelated development of inscrip- tions and conceptual understanding. In P. Cobb, E. Yackel, & K. McClain (Eds.), Symbolizing and
communicating in mathematics classrooms (pp. 325-360). Mahwah, NJ: Lawrence Erlbaum Associ- ates, Inc.
Lehrer, R., Strom, D., & Confrey, J. (2002). Grounding metaphors and inscriptional resonance: Children's emerging understanding of mathematical similarity. Cognition & Instruction, 20,359-398.
Lesh, R. (Ed.). (2003). Beyond constructivism: Models and modeling perspectives on mathematics, problem solving, learning, and teaching. Mahwah, NJ: Lawrence Erlbaum Associates, Inc.
Lesh, R., & Doerr, H. M. (2000). Symbolizing, communicating, and mathematizing: Key components of models and modeling. In P. Cobb, E. Yackel, & K. McClain (Eds.), Symbolizing and communicat-
ing in mathematics classrooms (pp. 361-383). Mahwah, NJ: Lawrence Erlbaum Associates, Inc. Lobato, J. (2003). How design experiments can inform a rethinking of transfer and vice versa. Educa-
tional Researcher, 32, 17-20. Lovett, M. C., & Greenhouse, J. B. (2000). Applying cognitive theory to statistics instruction. The
American Statistician, 54, 1-11 Martin, T. (2003). Co-evolution of model and symbol: How the process of creating representations pro-
motes understanding of fractions. Unpublished doctoral dissertation, Stanford University, Stanford, CA.
Martin, T, & Schwartz, D. L. (2004). Physically distributed learning: Adapting and reinterpreting physical environments in the development of the ratio concept. Manuscript submitted for publication.
Marton, F., & Booth, S. (1997). Learning and awareness. Mahwah, NJ: Lawrence Erlbaum Associates, Inc.
Michael, A., L., Klee, T., Bransford, J. D., & Warren, S., (1993). The transition from theory to therapy: Test of two instructional methods. Applied Cognitive Psychology, 7, 139-154.
Mokros, J., & Russell, S. J. (1995). Children's concepts of average and representativeness. Journal of Research in Mathematics Education, 26, 20-39.
Moll, L. (1986). Writing as communication: Creating strategic learning environments for students.
Theory into Practice, 25, 102-108. Moore, J. L., & Schwartz, D. L. (1998). On learning the relationship between quantitative properties and
symbolic representations. In A. Bruckman, M. Guzdial, J. Kolodner, & A. Ram (Eds), Proceedings of the International Conference of the Learning Sciences (pp. 209-214). Charolttesville, VA: Associa- tion for the Advancement of Computing in Education.
National Council of Teachers of Mathematics. (2000). Principles and standards for school mathemat- ics. Reston, VA: Author.
Newell, A., & Simon, H. (1972). Human problem solving. Englewood Cliffs, NJ: Prentice-Hall. Pfaffman, J. A. (2003). Manipulating and measuring student engagement in computer-based instruc-
tion. Unpublished doctoral dissertation, Vanderbilt University, Nashville, TN. Piaget, J. (1985). The equilibration of cognitive structures: The centralproblem of intellectual develop-
ment (T. Brown & K. J. Thampy, Trans.). Chicago: University of Chicago Press. Piatelli-Palmarini, M. (Ed.). (1980). Language and learning. The debate between Jean Piaget and
Noam Chomsky. London: Routledge & Kegan Paul. Reder, L. M., Charney, D. H., & Morgan, K. I. (1986). The role of elaborations in learning a skill from
an instructional text. Memory & Cognition, 14, 64-78. Schwartz, D. L., & Bransford, J. D. (1998). A time for telling. Cognition & Instruction, 16, 475-522. Schwartz, D. L., Martin, T., & Pfaffman, J. (in press). How mathematics propels the development of
physical knowledge. Journal of Cognition & Development. Sears, D. (2002, April). A simple methodfor assessing mathematical understanding. Presentation at the
Annual Meeting of the American Educational Research Association, New Orleans.
This content downloaded from 129.79.193.7 on Fri, 12 Jul 2013 11:55:30 AMAll use subject to JSTOR Terms and Conditions
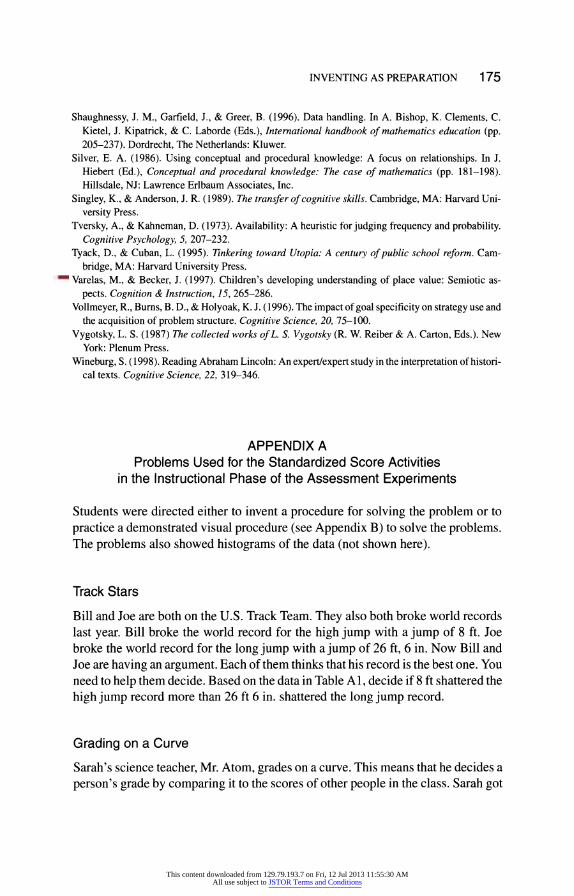
INVENTING AS PREPARATION 175
Shaughnessy, J. M., Garfield, J., & Greer, B. (1996). Data handling. In A. Bishop, K. Clements, C. Kietel, J. Kipatrick, & C. Laborde (Eds.), International handbook of mathematics education (pp. 205-237). Dordrecht, The Netherlands: Kluwer.
Silver, E. A. (1986). Using conceptual and procedural knowledge: A focus on relationships. In J. Hiebert (Ed.), Conceptual and procedural knowledge: The case of mathematics (pp. 181-198). Hillsdale, NJ: Lawrence Erlbaum Associates, Inc.
Singley, K., & Anderson, J. R. (1989). The transfer of cognitive skills. Cambridge, MA: Harvard Uni-
versity Press.
Tversky, A., & Kahneman, D. (1973). Availability: A heuristic for judging frequency and probability. Cognitive Psychology, 5, 207-232.
Tyack, D., & Cuban, L. (1995). Tinkering toward Utopia: A century of public school reform. Cam-
bridge, MA: Harvard University Press. Varelas, M., & Becker, J. (1997). Children's developing understanding of place value: Semiotic as-
pects. Cognition & Instruction, 15, 265-286.
Vollmeyer, R., Bums, B. D., & Holyoak, K. J. (1996). The impact of goal specificity on strategy use and the acquisition of problem structure. Cognitive Science, 20, 75-100.
Vygotsky, L. S. (1987) The collected works ofL. S. Vygotsky (R. W. Reiber & A. Carton, Eds.). New York: Plenum Press.
Wineburg, S. (1998). Reading Abraham Lincoln: An expert/expert study in the interpretation of histori- cal texts. Cognitive Science, 22, 319-346.
APPENDIX A Problems Used for the Standardized Score Activities
in the Instructional Phase of the Assessment Experiments
Students were directed either to invent a procedure for solving the problem or to practice a demonstrated visual procedure (see Appendix B) to solve the problems. The problems also showed histograms of the data (not shown here).
Track Stars
Bill and Joe are both on the U.S. Track Team. They also both broke world records last year. Bill broke the world record for the high jump with a jump of 8 ft. Joe broke the world record for the long jump with a jump of 26 ft, 6 in. Now Bill and Joe are having an argument. Each of them thinks that his record is the best one. You need to help them decide. Based on the data in Table Al, decide if 8 ft shattered the high jump record more than 26 ft 6 in. shattered the long jump record.
Grading on a Curve
Sarah's science teacher, Mr. Atom, grades on a curve. This means that he decides a person's grade by comparing it to the scores of other people in the class. Sarah got
This content downloaded from 129.79.193.7 on Fri, 12 Jul 2013 11:55:30 AMAll use subject to JSTOR Terms and Conditions
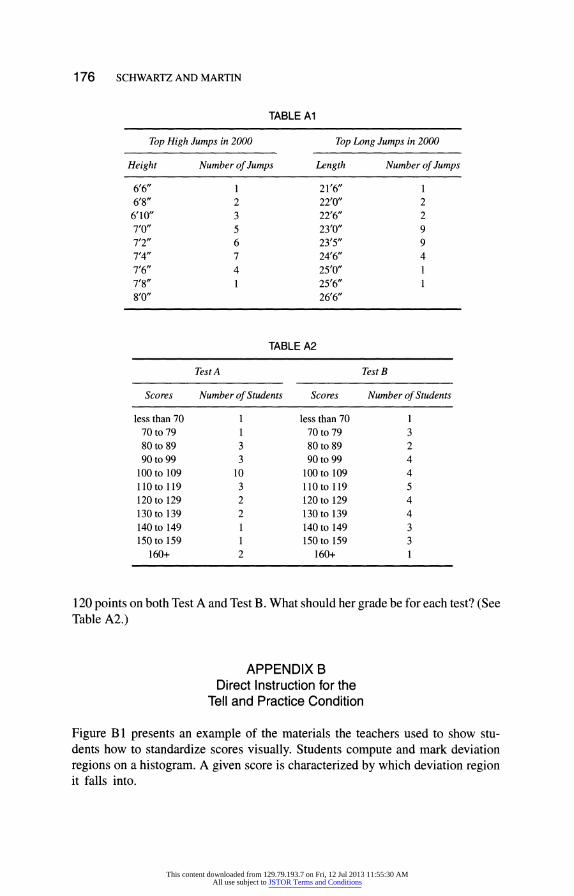
176 SCHWARTZ AND MARTIN
TABLE A1
Top High Jumps in 2000 Top Long Jumps in 2000
Height Number of Jumps Length Number of Jumps
6'6" 1 21'6" 1 6'8" 2 22'0" 2
6'10" 3 22'6" 2 7'0" 5 23'0" 9 7'2" 6 23'5" 9 7'4" 7 24'6" 4 7'6" 4 25'0" 1 7'8" 1 25'6" 1 8'0" 26'6"
TABLE A2
Test A Test B
Scores Number of Students Scores Number of Students
less than 70 1 less than 70 1 70 to 79 1 70 to 79 3 80 to 89 3 80 to 89 2 90 to 99 3 90 to 99 4
100 to 109 10 100 to 109 4 110to 119 3 110to 119 5 120 to 129 2 120 to 129 4 130 to 139 2 130 to 139 4 140 to 149 1 140 to 149 3 150 to 159 1 150 to 159 3
160+ 2 160+ 1
120 points on both Test A and Test B. What should her grade be for each test? (See Table A2.)
APPENDIX B Direct Instruction for the
Tell and Practice Condition
Figure B1 presents an example of the materials the teachers used to show stu- dents how to standardize scores visually. Students compute and mark deviation regions on a histogram. A given score is characterized by which deviation region it falls into.
This content downloaded from 129.79.193.7 on Fri, 12 Jul 2013 11:55:30 AMAll use subject to JSTOR Terms and Conditions
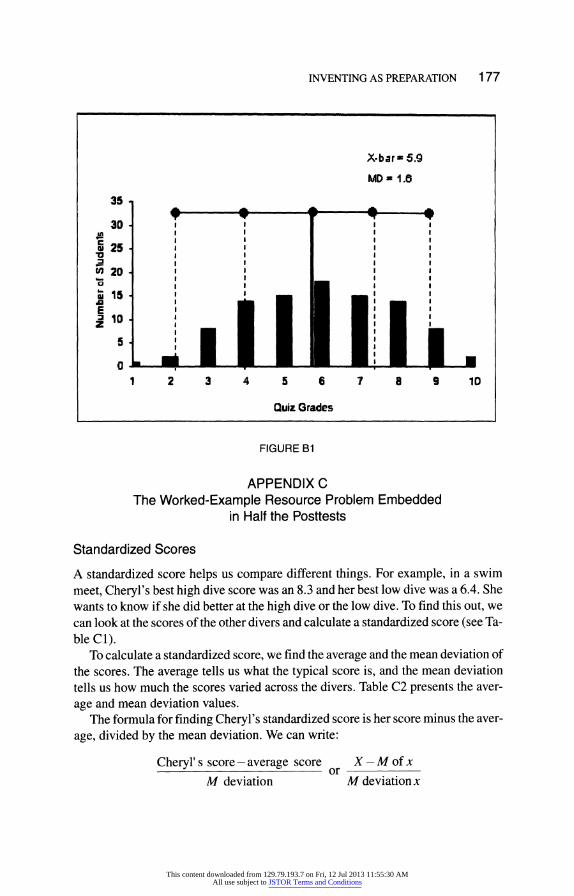
INVENTING AS PREPARATION 177
X-bar 5.9
MD a 1.0
35
?. - -?---+* '4 30- I I
w 25- I I la I I I
20: ' I I . 20 -. I o I I I
a
,
z 5 I I
a . I
1 2 3 4 5 6 7 8 9 10
Quiz Grades
FIGURE B1
APPENDIX C The Worked-Example Resource Problem Embedded
in Half the Posttests
Standardized Scores
A standardized score helps us compare different things. For example, in a swim meet, Cheryl's best high dive score was an 8.3 and her best low dive was a 6.4. She wants to know if she did better at the high dive or the low dive. To find this out, we can look at the scores of the other divers and calculate a standardized score (see Ta- ble C1).
To calculate a standardized score, we find the average and the mean deviation of the scores. The average tells us what the typical score is, and the mean deviation tells us how much the scores varied across the divers. Table C2 presents the aver-
age and mean deviation values. The formula for finding Cheryl's standardized score is her score minus the aver-
age, divided by the mean deviation. We can write:
Cheryl' s score- average score X -M of x
M deviation M deviation x
___ __
This content downloaded from 129.79.193.7 on Fri, 12 Jul 2013 11:55:30 AMAll use subject to JSTOR Terms and Conditions
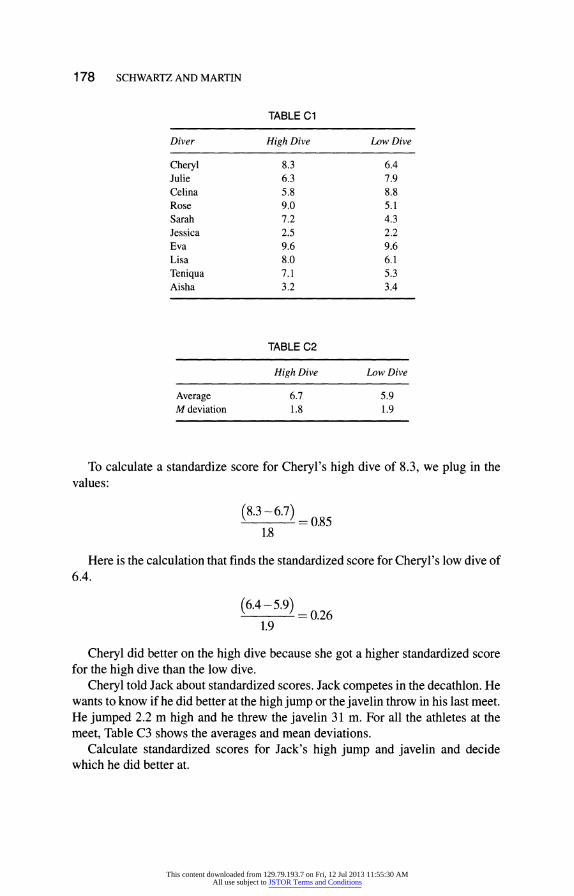
178 SCHWARTZ AND MARTIN
TABLE C1
Diver High Dive Low Dive
Cheryl 8.3 6.4 Julie 6.3 7.9 Celina 5.8 8.8 Rose 9.0 5.1 Sarah 7.2 4.3 Jessica 2.5 2.2 Eva 9.6 9.6 Lisa 8.0 6.1
Teniqua 7.1 5.3 Aisha 3.2 3.4
TABLE C2
High Dive Low Dive
Average 6.7 5.9 M deviation 1.8 1.9
To calculate a standardize score for Cheryl's high dive of 8.3, we plug in the values:
(8.3 -6.7)0.85 = 0.85 1.8
Here is the calculation that finds the standardized score for Cheryl's low dive of 6.4.
(6.4-5.9) = 0.26 1.9
Cheryl did better on the high dive because she got a higher standardized score for the high dive than the low dive.
Cheryl told Jack about standardized scores. Jack competes in the decathlon. He wants to know if he did better at the high jump or the javelin throw in his last meet. He jumped 2.2 m high and he threw the javelin 31 m. For all the athletes at the meet, Table C3 shows the averages and mean deviations.
Calculate standardized scores for Jack's high jump and javelin and decide which he did better at.
This content downloaded from 129.79.193.7 on Fri, 12 Jul 2013 11:55:30 AMAll use subject to JSTOR Terms and Conditions
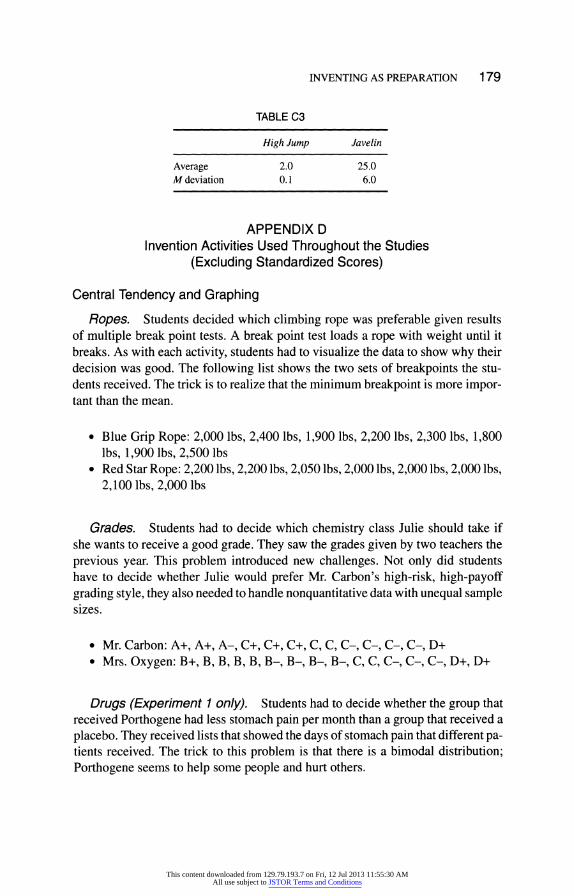
INVENTING AS PREPARATION 179
TABLE C3
High Jump Javelin
Average 2.0 25.0 M deviation 0.1 6.0
APPENDIX D Invention Activities Used Throughout the Studies
(Excluding Standardized Scores)
Central Tendency and Graphing
Ropes. Students decided which climbing rope was preferable given results of multiple break point tests. A break point test loads a rope with weight until it breaks. As with each activity, students had to visualize the data to show why their decision was good. The following list shows the two sets of breakpoints the stu- dents received. The trick is to realize that the minimum breakpoint is more impor- tant than the mean.
* Blue Grip Rope: 2,000 lbs, 2,400 lbs, 1,900 lbs, 2,200 lbs, 2,300 lbs, 1,800 lbs, 1,900 lbs, 2,500 lbs
* Red Star Rope: 2,200 lbs, 2,200 lbs, 2,050 lbs, 2,000 lbs, 2,000 lbs, 2,000 lbs, 2,100 lbs, 2,000 lbs
Grades. Students had to decide which chemistry class Julie should take if she wants to receive a good grade. They saw the grades given by two teachers the
previous year. This problem introduced new challenges. Not only did students have to decide whether Julie would prefer Mr. Carbon's high-risk, high-payoff grading style, they also needed to handle nonquantitative data with unequal sample sizes.
* Mr. Carbon: A+, A+, A-, C+, C+, C+, C, C, C-, C-, C-, C-, D+ * Mrs. Oxygen: B+, B, B, B, B, B-, B-, B-, B-, C, C, C-, C-, C-, D+, D+
Drugs (Experiment 1 only). Students had to decide whether the group that received Porthogene had less stomach pain per month than a group that received a placebo. They received lists that showed the days of stomach pain that different pa- tients received. The trick to this problem is that there is a bimodal distribution; Porthogene seems to help some people and hurt others.
This content downloaded from 129.79.193.7 on Fri, 12 Jul 2013 11:55:30 AMAll use subject to JSTOR Terms and Conditions
180 SCHWARTZ AND MARTIN
* Porthogene: 21, 6, 3, 20, 4, 5, 19, 19, 6, 4, 19, 18 * Placebo: 17, 7, 16, 15, 13,9, 17, 14, 12, 11, 10, 13
Variability and Formulas
Pitching machine reliability These materials may be found in Figure 2.
Trampoline bounce. Students received paired sets of numbers. The num- bers represented the height balls bounced when dropped on two different makes of
trampoline. They had to create an index to measure the consistency of the trampo- lines. They created an index for one pair. They would then receive the next pair, try their prior index, and evolve it if necessary. Set 1 contrasts same mean and different
range. Set 2 contrasts same range and different density. Set 3 contrasts same values and different sample sizes.
* Set 1: {34567} versus {13579} * Set 2: {1022102 10} versus {2841066} * Set 3: {426} versus {264624}
APPENDIX E Assessment Items
For items that have two forms, students solved one at pretest and one at posttest (counterbalanced).
Procedural Fluency
The version for the university students said they could find the standard deviation, variance, or another measure of variability besides the mean deviation. Experiment 2 asked students to make a histogram specifically, instead of a "graph."
Find the mean, median, mode, mean deviation, and create a graph.
* Form A: {610514416310} * FormB: {4381281412}
Qualitative Reasoning
Experiment 1
Form A: Electric company Mr. Lim is arguing over the price of electricity with the power company. Mr. Lim argues that the typical family pays about $35 a
This content downloaded from 129.79.193.7 on Fri, 12 Jul 2013 11:55:30 AMAll use subject to JSTOR Terms and Conditions
INVENTING AS PREPARATION 181
month for electricity. The power company says the typical family pays about $29. The two sides picked out 11 families to see how much they pay per month. Who do you think is right? Here is what they found: {$26, $27, $27, $28, $28, $29, $36, $45, $47, $ 47, $48)
Form B: Stamp collecting. Fernando and Chamiqua have just started to collect stamps. They both have 20 stamps. The average value of Ferando's stamps is 300 each and the mode of his stamps is 300. The average cost of Chamiqua's stamps is also 300 but her mode is 20?. How can they have the same averages but different modes?
Experiment 2
Form A: Football. Each number below represents the number of games a team won in a season. Taken together, the numbers represent the number of games won by two high school football teams in the 13 seasons from 1966 through 1978. The teams played 12 games per season each year. Which school has the better re- cord in football? Which team would you rather have played on? Make a graph and
explain how it supports your choices.
* Caesar Chavez High School: 7, 9, 2, 5, 8, 6, 8, 4, 6, 8, 5, 8, 5 * Andrew Jackson High School: 7, 12, 0, 3, 12, 11, 1, 4, 6, 7, 12, 1, 3
Form B: Drag racing. Janelle is a car enthusiast. She wants to buy a drag- ster. She is deciding between two dragsters that cost the same amount. She learns that the Faster 'n Fire dragster finishes the 1/2 mile in 7 sec on average, with a vari-
ability (mean deviation) of 1 sec. She also finds out that the Greased Hawk finishes the /2 mile in 6.9 sec on average with a variability (mean deviation) of 2 sec. Unfor- tunately, she has no idea what the mean deviation means about how the dragsters will perform in races.
Imagine what the times for each dragster look like over several trials. Make a vi- sual representation that will help Janelle understand the differences between the two dragsters and help her make a decision between them. The visual representa- tion does not have to be exact. It just needs to help Janelle understand. Explain to Janelle which dragster you would recommend and why.
Symbolic Insight
Explain a Component of a Formula
Variability formula. Why does this formula divide by n?
Zx-X n
This content downloaded from 129.79.193.7 on Fri, 12 Jul 2013 11:55:30 AMAll use subject to JSTOR Terms and Conditions
182 SCHWARTZ AND MARTIN
Algebra formulas.
1. Form A: Why does this formula subtract xl ?
Y2 -Yi m=' X2 -X1
2. Form B: Why does this formula square the value of a?
a2 +b2 =c2
Prompts used for half of tests in Experiment 2. Similar prompts were used for all three formulas: (a) When do you use this formula? (b) What does the n stand for? (c) Why do you divide by the n? (d) What problem does dividing by n solve?
Seeing Past a Descriptive Statistic to Evaluate an Empirical Argument
IQ. A wealthy industrialist wrote a book describing how to make a business work. He said the single most important task was to hire the smartest people possi- ble. In particular, he suggested hiring Blue people. To back up his suggestion, he
reported the results of a study in which he compared the intelligence of Blue and Green people. In the study, he randomly selected 40 Blue people and 40 Green
people. He gave each individual in each group an IQ test. Here are the individual scores and the group averages:
* Green people scores: 82, 83, 84, 86, 87, 88, 88, 88, 89, 89, 89, 89, 89,90,90, 90, 90, 91, 91, 92, 95, 95, 97, 101, 106, 108, 108, 109, 109, 109, 110, 110, 110, 110, 111, 111, 111, 112, 113, 115. Green average IQ = 98
* Blue people scores: 85, 93, 96, 97, 97, 98, 98, 99, 99, 99, 99, 100, 100, 100, 100, 100, 100, 101, 101, 101, 101, 101, 102, 102, 102, 102, 102, 102, 103, 103,103,103,104,104,104,105,106,106, 107, 111. Blue average IQ= 101
Based on these data, the industrialist claimed that Blue people are smarter than Green people. One hundred activists across the country were outraged and claimed that the industrialist's results were a fluke. They each conducted their own studies by giving IQ tests to Blue and Green people. To their surprise, the activists came up with results that were nearly identical to the industrialist's-the industrialist's re- sults were reliable. The industrialist published an article in the New York Times re- porting the results. He repeated his suggestion, "If you want the smartest people to work for you, hire Blue people."
This content downloaded from 129.79.193.7 on Fri, 12 Jul 2013 11:55:30 AMAll use subject to JSTOR Terms and Conditions
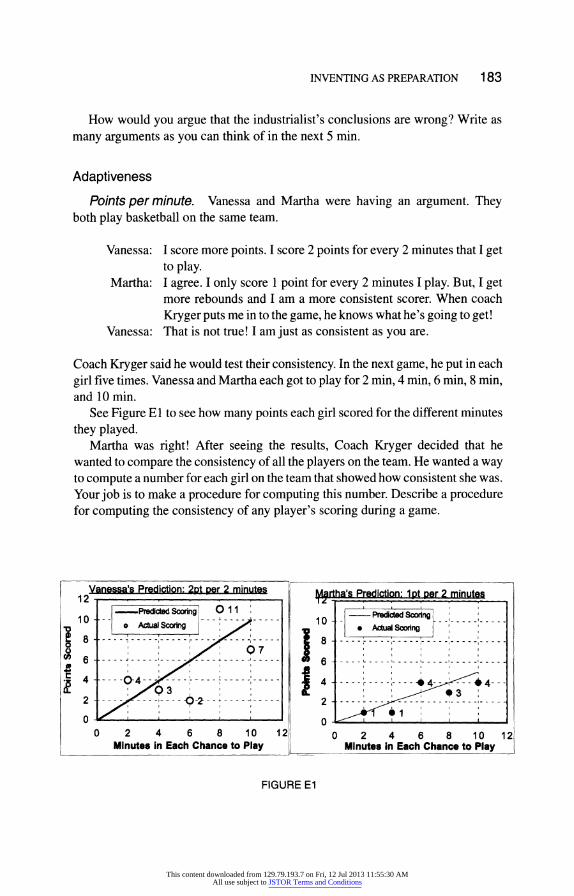
INVENTING AS PREPARATION 183
How would you argue that the industrialist's conclusions are wrong? Write as
many arguments as you can think of in the next 5 min.
Adaptiveness
Points per minute. Vanessa and Martha were having an argument. They both play basketball on the same team.
Vanessa: I score more points. I score 2 points for every 2 minutes that I get to play.
Martha: I agree. I only score 1 point for every 2 minutes I play. But, I get more rebounds and I am a more consistent scorer. When coach Kryger puts me in to the game, he knows what he's going to get!
Vanessa: That is not true! I am just as consistent as you are.
Coach Kryger said he would test their consistency. In the next game, he put in each
girl five times. Vanessa and Martha each got to play for 2 min, 4 min, 6 min, 8 min, and 10 min.
See Figure El to see how many points each girl scored for the different minutes
they played. Martha was right! After seeing the results, Coach Kryger decided that he
wanted to compare the consistency of all the players on the team. He wanted a way to compute a number for each girl on the team that showed how consistent she was. Your job is to make a procedure for computing this number. Describe a procedure for computing the consistency of any player's scoring during a game.
Vanessa's Prediction: 2D per 2 minutes Mrtha's Prediction: 1pt per 2minutes 12 t -.Predicted Soxring 0 11 ____ P,dicted Scoring 11 ---Predicted Scodrng o Acual Scoring /^* Acual Scoring
8 - ------------I-- - - 8 - -- -
6 ------- - ------ 6 .....-- ....- .....L , .....' .....' .....-
4 -0? i 4 -- - - 4-- 4 4- -- ,/ <?3 .... ?--3 2 -1 O - ------- -- 2 --------- --------- --
o 0 0 2 4 6 8 10 12 0 2 4 6 8 10 12
Minutes in Each Chance to Play Minutes in Each Chance to Play
FIGURE E1
This content downloaded from 129.79.193.7 on Fri, 12 Jul 2013 11:55:30 AMAll use subject to JSTOR Terms and Conditions
184 SCHWARTZ AND MARTIN
Target Transfer Problems
Form A: Biology final. Susan and Robin are arguing about who did better on their final exam last period. They are in different classes, and they took different tests. Susan got an 88 on Mrs. Protoplasm's biology final exam. In herclass, the mean score was a 74 and the average deviation was 12 points. The average deviation indi- cates how close all the students were to the average. Robin earned an 82 on Mr. Mel- ody's music exam. In that class, the mean score was a 76 and the average deviation was 4 points. Both classes had 100 students. Who do you think scored closer to the top of her class, Susan or Robin? Use math to help back up your opinion.
Form B: Homerun hitters. People like to compare people from different times in history. For example, did Babe Ruth have more power for hitting home runs than Mark McGuire? It is not fair to just compare who hit the ball the farthest, because baseballs, bats, and stadiums are different. Mark McGuire may have hit the longest homerun, but this is only because people use bouncier baseballs these days.
Two people were arguing whether Joe Smith or Mike Brown had more power. Joe Smith's longest homerun was 540 ft. That year, the mean homerun among all players was 420-ft long, and the average deviation was 70 ft. The average deviation indicates how close all the homeruns were to the average. Mike Brown's longest homerun was 590 ft. That year, the mean homerun was 450 ft, and the average de- viation was 90 ft. Who do you think showed more power for his biggest homerun, Joe Smith or Mike Brown? Use math to help back up your opinion.
This content downloaded from 129.79.193.7 on Fri, 12 Jul 2013 11:55:30 AMAll use subject to JSTOR Terms and Conditions