toad data point · toad family toad data point is a member of the toad product family at quest...
TRANSCRIPT
1
End User Training Toad Data Point
Toad Data Point
End User Training
© 2013 Quest Software, Inc. ALL RIGHTS RESERVED.

2
End User Training Toad Data Point
Table of Contents
The Basics ............................................................................. 3
Getting Started ........................................................................ 5 Workflow ................................................................................. 6 Exercises .............................................................................. 8 Configuration Wizard .............................................................. 9 Configuration Options ........................................................... 12 Exercises ............................................................................ 14 Connecting ............................................................................. 15 Exercises ............................................................................ 19 Navigation Manager .............................................................. 20 Exercises ............................................................................ 22 Project Manager .................................................................... 23 Exercises ............................................................................ 24
Understand Database Diagrams ................................................................ 25 Exercises ............................................................................ 27 Database Explorer ................................................................. 28 Exercises ............................................................................ 30
Query Query Builder ........................................................................ 31 Exercises ............................................................................ 42 SQL Editor .............................................................................. 45 Exercises ............................................................................ 53
Report Toad Data Reports ................................................................. 55 Chart Reports ........................................................................ 63 Pivot Grid Reports ................................................................. 64 Exercises ............................................................................ 65
Automation
Automation Scripts ................................................................ 68 Exercises ............................................................................ 72
Export & Import......................................................................... 75 Exercises ............................................................................... 81 Data Compare and Sync ............................................................ 83 Exercises ............................................................................... 87 Difference Viewers .................................................................... 88 Object Search ............................................................................ 90 Master Detail Browser .............................................................. 91 Exercises ............................................................................... 93 Appendix A—Installation ........................................................... 94 Appendix B—Resources ............................................................ 97
Table of Contents

3
End User Training Toad Data Point
Toad Data Point Understand This first step is often overlooked, yet it may be the most important step in the process of your project. Many times, people will connect to a data source and just start creating queries blindly. While it may feel more productive to “dive right in,” it’s a false sense of accomplishment. The best queries begin with a clear understanding of the data source you’re connected to. This is because if you understand the data, ob-jects and their relationship to each other (if such relationships exist!), then you can build informed queries that are effective and more opti-mized than you could without this understanding. Therefore, Toad Data Point supports two methods of understanding: the ER Diagrammer and the Database Explorer. The ER Diagrammer gives you a high-level, visu-al representation of an object and those objects which may be related to it; the Database Explorer gives you a more in-depth and detailed view into the object so you can see column information, the data itself, relationships and more.
Query This is the heart of Toad Data Point and probably the most time-consuming part of your project. Once you have a clear understanding of the data source you’ll be querying from, you can begin creating your query. Toad Data Point once again supports two methods for doing this: the Query Builder and the SQL Editor. The Query Builder will do just that—using a visual interface, it builds the query for you. Whether you’re new to databases and unfamiliar with the SQL language or a seasoned veteran, the Query Builder will save you time. And regardless of the database you connect to, the Query Builder is the same, mean-ing that you don’t have to remember all of those little nuances of how the SQL language differs between database platforms. For the “coders” out there (you know who you are!), you’ll be happy to know that the SQL Editor in Toad Data Point is the same powerful SQL Editor that’s found in the rest of the Toad family of products. So re-gardless of your skill-level—or level of motivation—you’ll have all the tools you need to create your queries easily and quickly.
Toad Data Point is a query and reporting tool with extensive capabili-ties. Easy enough to be used by someone who’s new to databases, yet powerful enough to be used by many different types of database pro-fessionals. Toad Data Point is designed with broad usability in mind. In this section we’ll talk about how to get started with the tool, some of the basic concepts and the general workflow.
Toad Family Toad Data Point is a member of the Toad product family at Quest Soft-ware. The product family started with Toad for Oracle in the late 1990’s and has grown into a family of products that cover Oracle, SQL Server, DB2, MySQL, Sybase, Teradata and many other databases and is used by well over 1 million people worldwide. Each product in the Toad family is devoted to providing users with powerful, user-friendly tools for working with a variety of databases. Toad Data Point, intro-duced in 2007, is the newest member of the Toad family and distin-guishes itself as a tool for querying and reporting on just about any database. Devoted to meeting the users’ needs and built on top of the proven Toad platform, Toad Data Point is rapidly becoming the tool of choice for many data professionals.
Getting Started One of the best ways to get started with Toad Data Point is to watch a video demo. You can find a complete demo at http://www.quest.com/toad-for-data-analysts/. The video covers the basic concepts of the tool, general workflow and more.
Workflow Toad Data Point is built on the premise that nearly every reporting project goes through a form of the following steps at some point: Un-derstand, Query, Report and Automate. There will be times when you omit one of these steps, but they loosely represent the general flow of a standard reporting project.
Basics—Getting Started
The Basics

4
End User Training Toad Data Point
Report The third step in the process is reporting. Naturally, once you get the information you want with your query, 9 times out of 10 you’ll want to share that information. So whether it’s sharing a statistic in an email or creating a beautiful multi-page PDF, you’re in the “Report” stage of the process. Again, Toad Data Point supports several methods of reporting: One-Click Export to Microsoft Excel, pivot tables, charts and Toad Reports – Toad’s own banded report designer. The One-Click Export feature takes whatever you have in the data grid, whether it’s a query result or the data grid in the Database Ex-plorer, and exports it to a specific Microsoft Excel format in a single click. A handy time-saver, the One-Click Export can even automate the creation of refreshable Microsoft Excel documents. Pivot grids, charts and banded reports are designed with the Toad Reports interface and can be saved to a variety of formats. You can also take a shortcut and create a quick pivot table and chart right in the results grid of a Query Builder or SQL Editor window.
Automate The last piece of this process is automation. With your query written and your report complete, save time and automate the process. Many times we find ourselves doing the same things over and over… Toad Data Point goes beyond standard query and reporting tools to reduce this redundancy. Using an intuitive, task-oriented timeline approach, Toad Data Point will take all of those mindless, repetitive tasks and do them for you. You can create entire workflows that encompass con-necting, importing/exporting, executing scripts, running queries, building reports and distributing those reports—you can even add in conditional logic! With a solid automation workflow built, schedule it to run on any schedule. Now your reporting tasks will take care of themselves, automatically.
Going Beyond the Basics Toad Data Point doesn’t stop here. Packed with more tools for com-paring data, synchronizing databases, connecting to FTP servers, im-porting/exporting data and more, Toad Data Point will help you get the job done. We’ll cover these advanced features later in this guide.
Basics—Getting Started
The Basics

5
End User Training Toad Data Point
To begin, you will need to install Toad Data Point if you or your ad-ministrator have not done this. Details on installation are available in Appendix A. When you first open Toad Data Point, you are presented with the Quick Guide. This screen is designed to help first-time users get start-ed, though it can be used as a time-saver even if you’ve been using Toad Data Point for a long time. The Quick Guide layout follows a typical end-to-end reporting pro-cess, beginning with making a connection and moving all the way through publishing and automation. The best way to use the Quick Guide is to use it as a launch pad. When you open Toad Data Point, click on the activity that best suits your needs and jump straight to that tool. Notice that for the steps of Understand, Query and Report you are given two op-tions. This is to accommodate different preferences. For instance, if you’re more comfortable writing SQL queries by hand, you may prefer to use the SQL Editor to build your query as opposed to the Query Builder. The Quick Guide also has links to video tutorials, to help first-time users get started quickly and easily. In addition to these, there are video links to other tools in the “What Can I Do” sidebar. Take a few minutes to watch one of these vide-os—you may be surprised!
Getting Started Getting Started—First Time
Getting Started

6
End User Training Toad Data Point
Toad Data Point has been designed to assist the basic workflow of Understand the database design, Query the database, Report on the data, and Automate database tasks. To demonstrate the process let’s walk through the workflow. The first step is to understand. From the Quick Guide window you can select the ER Diagram-mer. Here you can quickly discover object rela-
tionships by dragging a table from the Object Explorer. When you are done viewing the database relationships, the “Send to
Query” button on the bottom right of the Wizard Bar sends those ta-bles or views to the Query Builder.
Workflow
The Query builder provides an easy, graphical way to build a query. Select your columns, add filter criteria and you are ready to execute and review your results. When you are satisfied with the results of the data, you are ready to export into a report for-mat for general distribution.
Clicking on the “Send to Report” button on the bottom right of the Wizard Bar sends the data to reporting.
Getting Started—Workflow
Workflow

7
End User Training Toad Data Point
Getting Started—Workflow
For simple, fast reports that everyone can read, use Microsoft Excel for report distri-bution. The wizard will automatically ex-port your result set into Microsoft Excel. Format and add any data to your Microsoft Excel report in the Toad Data Point Report window.
When you are satisfied with your report, the “Automate” button on the bottom right of the Wizard Bar will set up your work for automa-tion.
Many reports are run daily, weekly, or monthly. The steps taken to produce these reports can be automated and scheduled to occur at a desired interval. When sending to the Automation window using the workflow, it automatically loads the connection, SQL query, Microsoft Excel
report path and adds the report to an email for distribution. One more click on the “Schedule” button and you can make this part of your reoccurring automated tasks, freeing up time and resources.
Workflow

8
End User Training Toad Data Point
Getting Started—Exercise
Workflow Exercise
Purpose - To demonstrate the common workflow for Toad Data Point. Note: This exercise assumes you have already installed and entered a license key. Please refer to Appendix A for installation details. Exercise Steps: 1) Start Toad Data Point from the shortcut or Start Menu.
2) When the Quick Guide appears, click on the ER Diagrammer, under Step 1, Understand.
3) You will be prompted to connect. Toad is bundled with a sample database. This connection will be selected. Click “Connect” to continue.
4) The Navigation Manager (docked window on the left) and the ER Diagrammer will open. Click on the CUSTOMER table on the left and drag onto the ER Diagram window. Observe the database relationship and columns.
5) Click the “Send to Query” wizard button. This sends the two tables to the Query Builder. Select a column or two. Notice that when a column is selected a corresponding criteria column is added to the lower panel.
6) To run the query, click the “Run Query” button from the bottom Wizard Bar. When satisfied with the results, save the file and press “Send to Report”.
7) Your data is now displayed in the Microsoft Excel Report win-dow. Change any column formatting or add a title. Save and click on the “Automate” button on the bottom right. (Note: You may be asked to save the Query Builder or Microsoft Excel files if you did not do this in the prior steps.
8) Double click on the Email activi-ty. This is the very last item in the Automation designer. Enter your To, From and Server ad-dress. (This is for SMTP mail.) Click “Test” to run the script. You will be prompted to give the script a name and save. Enter a name or use the default. An out-put window will open and dis-plays the progress.
9) To schedule, click on the button on the bottom right. A task scheduling window will display. Press the “Set Password” button and enter your password. Click on the schedule tab and change the settings to run 2 minutes from now. Click ok.
10) Go to the top of your application and click on the large “4) Auto-mation” button. Notice that when you do this the automation window appears. Documents are associated to one of the 4 steps and by default will only show when that group is requested. Click on the other buttons and observe the windows that show for each of the steps. When you are working on a large project, this organization of windows can be very handy.
11) Check your email to see if you received the automated report.
Workflow—Exercise
9
End User Training Toad Data Point
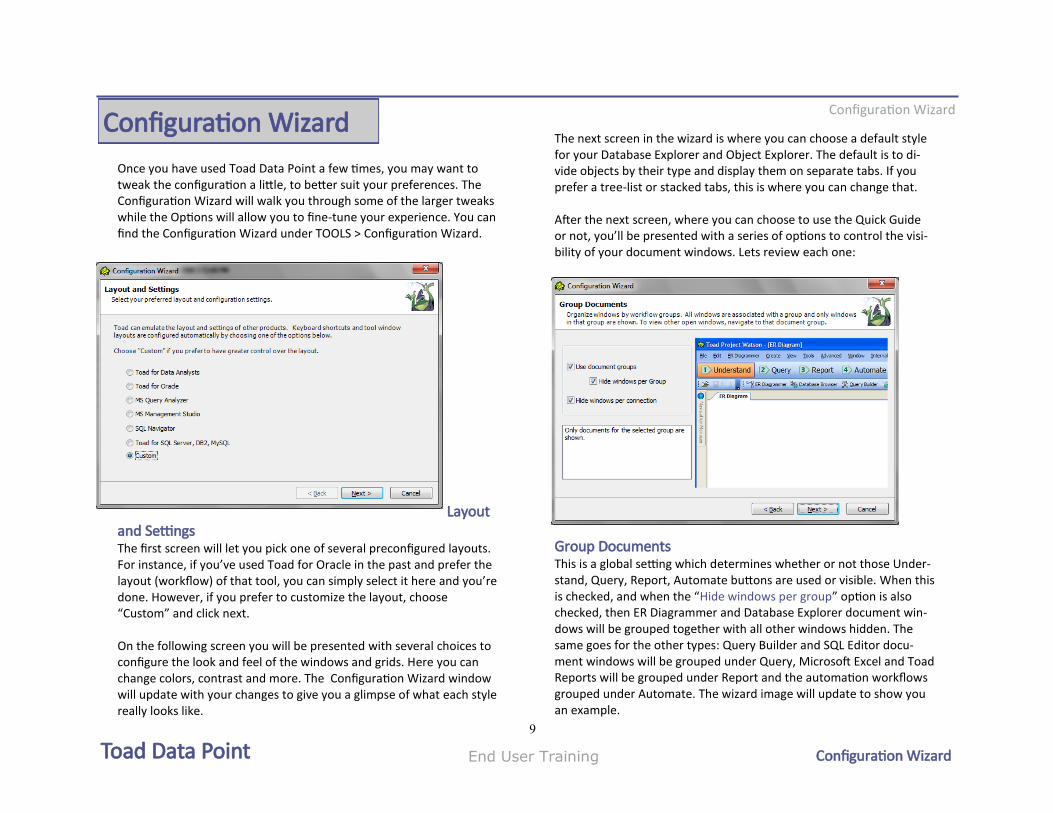
Once you have used Toad Data Point a few times, you may want to tweak the configuration a little, to better suit your preferences. The Configuration Wizard will walk you through some of the larger tweaks while the Options will allow you to fine-tune your experience. You can find the Configuration Wizard under TOOLS > Configuration Wizard.
Layout and Settings The first screen will let you pick one of several preconfigured layouts. For instance, if you’ve used Toad for Oracle in the past and prefer the layout (workflow) of that tool, you can simply select it here and you’re done. However, if you prefer to customize the layout, choose “Custom” and click next. On the following screen you will be presented with several choices to configure the look and feel of the windows and grids. Here you can change colors, contrast and more. The Configuration Wizard window will update with your changes to give you a glimpse of what each style really looks like.
The next screen in the wizard is where you can choose a default style for your Database Explorer and Object Explorer. The default is to di-vide objects by their type and display them on separate tabs. If you prefer a tree-list or stacked tabs, this is where you can change that. After the next screen, where you can choose to use the Quick Guide or not, you’ll be presented with a series of options to control the visi-bility of your document windows. Lets review each one:
Group Documents This is a global setting which determines whether or not those Under-stand, Query, Report, Automate buttons are used or visible. When this is checked, and when the “Hide windows per group” option is also checked, then ER Diagrammer and Database Explorer document win-dows will be grouped together with all other windows hidden. The same goes for the other types: Query Builder and SQL Editor docu-ment windows will be grouped under Query, Microsoft Excel and Toad Reports will be grouped under Report and the automation workflows grouped under Automate. The wizard image will update to show you an example.
Configuration Wizard Configuration Wizard
Configuration Wizard

10
End User Training Toad Data Point
Regardless of what option you choose there, the default is still set to hide all of the document windows not associated with the current database connection. However, if you want to turn off connection hiding, uncheck the “Hide windows per connection” checkbox.
Above is how things would look if everything was unchecked. Notice how the Understand, Query, Report and Automate buttons are miss-ing? Notice how there’s an Oracle document open as well as a MySQL document and that the Microsoft Excel report is no longer hidden?
Configuration Wizard
Group Document Defaults This screen will help you set up the default actions for the grouping buttons. (You will not see this screen if you chose not to use the doc-ument groups in the previous screen.) For example, clicking on the Understand button will open a new ER Diagrammer document, by default. If you prefer to use the Database Explorer instead, this is where you can change that. The Query and Report options are a little more important because your choice here not only applies to the document grouping buttons, but also to the Wizard Bar (discussed on the next page). For instance, when you’re using the ER Diagrammer and you want to begin your query with those tables, you can click “Send to Query” on the bottom of the screen. This action will open the Query Builder with these ta-bles, by default. So this Configuration Wizard screen is important because it allows you to change this default to the SQL Editor in-stead. The same applies to the Report option as well.
Tip: The hands on exercise at the end of this chapter familiarizes you with the configuration options and is well worth the time.
Configuration Wizard

11
End User Training Toad Data Point
Wizard Bar The Wizard Bar is located at the bottom of many document windows and is designed as a suggestive aid with links to things you may want to do next. It’s a dynamic bar as well, since it changes with context. As you can see below, when viewed in the SQL Editor, the Wizard Bar is configured with links for sending the results to a report, adding the query to the Project Manager, executing the query, opening a file and even a link to a video tutorial. This screen gives you the option to turn it off (on by default).
Configuration Wizard
Connection Documents This screen will allow you to specify which (if any) documents you want opened by default when you create a new connection. This can be a nice timesaver if you’re frequently doing the same thing each time you connect.
Additional Settings This last screen will let you specify whether or not you want to auto-matically add all saved files (ER Diagrams, queries, reports, automa-tion workflows, etc) and any query you execute to the Project Manag-er. This can be useful when building a new project template for other team members. Regardless of your choice here, you can still add things to the Project Manager through the various “Add to Project Manager” tool buttons. And that’s it! Once you’ve decided on these options, click “Finish.” (It’s recommended to restart Toad Data Point after making such sweeping changes.)
Configuration Wizard

12
End User Training Toad Data Point
Toad Data Point is very customizable; there’s an option for just about everything. You can access the options by going to TOOLS > Options. In the Options window you’ll see everything from advanced database features to controlling the Toad “croak” sound at startup! So, what to do with all of the options? Search! Every option in Toad Data Point is indexed and easily found with the search field as seen below.
When you search the options and have a set of search hits, clicking on them will switch the Options window to the page that option is found on and highlight it for you, to make things easy.
Useful Options The following tables list many of the most useful options to consider, and their location.
Configuration Options Configuration Options
Environment General “Allow multiple copies of Toad Data Point to load” will let you have two or more Toad’s open at the same time. Useful for comparing things side-by-side.
General “Save document files for recovery every [n] minutes” - Configure this to a frequency that you’re comfortable with.
Grid “Edit cell on single click” - This may be unnatural for some people. You can turn this off if you don’t edit data as often.
Grid “Automatically submit row changes as they oc-cur” - if you make a lot of updates to cell data, you may want to turn this off.
Grid “Move cell focus with ENTER key” - for some people, this may be unnatural.
Grid “Show data as Read-Only” is a nice way to set the grid to read-only by default. This can be easi-ly changed later by clicking a button on the grid.
Grid Formats—here’s where you can set number, date, time and other formats.
Network Share
Toad uses a common directory for sharing things across a network. Use this setting to change the default and enable one-click sharing with team members.
Explorer Objects If you usually work with only one or two object types, you can choose to hide other types here.
Editor General Use this to change fonts, encoding and more.
Tools “SQL Recall: Number of statements to display” If you want to keep a long history of executed que-ries, set this to a large number.
Configuration Options

13
End User Training Toad Data Point
Getting Additional Help Toad Data Point is designed with the intent to be intuitive; unfortu-nately, there’s no way to anticipate everyone’s impression ahead of time. So, in addition to the tutorial videos and the integrated HELP system, you can visit ToadWorld.com and the Toad Data Point com-munity page, http://tda.inside.quest.com. With forums, blogs and even more videos, these online resources offer helpful tips & tricks for getting more out of Toad Data Point. And, if you ever forget where to find us online, just look for the “User Forum” item in the HELP menu.
Support Bundles If you do happen to come across something that isn’t covered in the help or in one of the online resources, you should create a Support Bundle and contact Quest Support. Our friendly and well-trained support staff are eager to help you! To create a Support Bundle, navigate to the HELP menu and click on “Support Bundle.” This will create a ZIP file with all of the important information about your environment that we need to help trouble-shoot your problem.
Beta Program Are you eager to stay ahead of the game and be on the cutting edge of development changes in Toad Data Point? Join the beta program! It’s free and open to anyone. We work very closely with our beta users to understand how we can improve Toad Data Point to better meet their needs. To join, visit www.ToadWorld.com and look for the downloads section. And don’t worry… you can install the beta along-side your regular installation; you can have your cake and eat it too!
Configuration Options
Editor Formatter General formatting of your SQL scripts can be configured here.
Application Code
If you’re an application developer, often writing SQL to use in your VB, Java, C# (etc) code, use this to automatically format your SQL for use in the application code.
Database General “Number of rows to initially fetch in data tab” - when working with very large tables, this setting will prevent you from needlessly bringing too many records across the net-work. You can always scroll to the end of the set and Toad will fetch the next set.
Timeout When troubleshooting connections to data-bases over slow connections, the timeout threshold values may need to be length-ened.
Query Builder
On some databases, you may need to enable the use of fully qualified names in queries in order to make them run.
Cache “Object Annotation Cache” - this feature stores user annotations such as notes on tables or ER Diagrams, column lookup tables and hidden column setting between sessions of Toad. These annotations can be stored locally for reuse later or shared with other Toad users on the network.
Version Control General Use this area to set up and configure Version Control
Data Compare (Script settings)
Fine-tune the scripts produced by Data Com-pare & Sync
Configuration Options

14
End User Training Toad Data Point
Configuration Exercise
Purpose - To demonstrate how to configure Toad Data Point. Exercise Steps: 1) Start Toad Data Point. If the Quick Guide is displayed, close the
window by clicking the X. Using the Tools menu, open the Con-figuration Wizard. The Custom option should be pre-selected. Press “Next.”
2) Change the skin and grid style until you find something you like. The wizard window will show what the change will look like. Just for fun, try Pumpkin, Summer 2008, or Valentine. When you have found the skin you like, click “Next.”
3) Click on each database explorer style and select the one that you like the best. Click “Next.”
4) Uncheck the Quick Guide (you can always put this back later). Click “Next.”
5) On the Group Documents page, uncheck the “Use document groups.” Observe how this changes the application look and feel. Click the other options to see how they affect things. Reselect all options and press “Next.” (Try this default configuration for now.)
6) Change the group document defaults. This shows what type of window is opened by default when clicking on the document group buttons at the top of the application or from the Wizard Bar next button. Make a selection for each category and click “Next.”
7) Deselect the wizard bar and see how the wizard bar disappears. Reselect to use the Wizard Bar and press “Next.”
8) Choose a default option of what window to open after con-necting. Click “Next,” followed by “Finish.”
9) Open the Options window by using the Tools menu or clicking the dropdown on the configuration tool button.
10) View the options on the first page. Select the “Show connection dialog on startup.” Click on the grid tab. View the available op-tions. On the Date/Time Format tab on the right, use the dropdown to choose a date time format preference.
11) Find the search box at the bottom of the window. Enter “filter” and press “Search.” This will search all of the options looking for matches. The matches will display below the search area. Dou-ble click on the match “Prompt to filter list after.” This will load the page containing the option. Change the value from 2500 to 1000. This option configures a prompt to be displayed when more than a 1000 database objects are being displayed in the Object Explorer. For very large databases this filter is very im-portant. (How to use filters is covered in the Database Explorer Chapter.)
12) Click “OK” and restart application. Now you’re ready for the next chapter. Don't forget to come back and experiment with the many options available.
Configuration Exercise
Configuration—Exercises
15
End User Training Toad Data Point
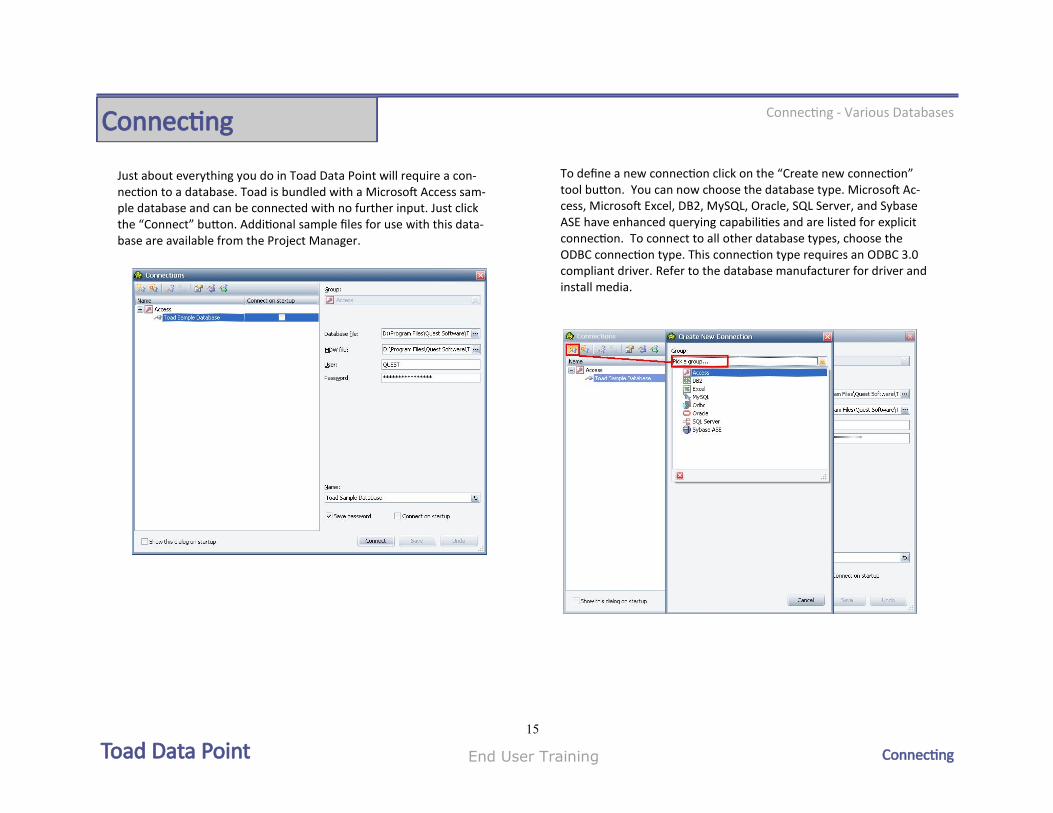
Just about everything you do in Toad Data Point will require a con-nection to a database. Toad is bundled with a Microsoft Access sam-ple database and can be connected with no further input. Just click the “Connect” button. Additional sample files for use with this data-base are available from the Project Manager.
Connecting - Various Databases
To define a new connection click on the “Create new connection” tool button. You can now choose the database type. Microsoft Ac-cess, Microsoft Excel, DB2, MySQL, Oracle, SQL Server, and Sybase ASE have enhanced querying capabilities and are listed for explicit connection. To connect to all other database types, choose the ODBC connection type. This connection type requires an ODBC 3.0 compliant driver. Refer to the database manufacturer for driver and install media.
Connecting
Connecting

16
End User Training Toad Data Point
Toad can connect to Oracle using an Oracle client or Direct Connec-tion. Direct Connection uses TCP/IP and does not require any addi-tional files. Simply input the server name or IP address, user id, user password and Oracle System ID (SID). The connection info will be stored in the applications data file direc-tory. Connections are stored in the connections.xml file and can be found using the “Application Data Directory” link in the About box. To always connect to this database when starting the application , select “Save password” and “Connect On Startup” options. (Note: Passwords are saved encrypted.)
Connecting - Oracle
Using the Oracle client to connect is similar to Direct Connect. From the database name dropdown, select the database you want to con-nect to. This list is populated from the current Oracle client TNS-names file. Enter your user name and password to connect using the defaults. To change to another client, select from the available clients listed in the dropdown next to the current home label. Toad Data Point also supports LDAP and ONAMES servers. To configure, edit the SQLnet.ora file to include these types in your directory path. The connect descriptors will be added to the available connections. NAMES.DIRECTORY_PATH= (LDAP, TNSNAMES, EZCONNECT)
Connecting - Oracle
Adding new names to your TNSnames file can be done through the TNSnames editor button or Oracle’s Net Configu-ration Assistant which can be launched from the ellipsis button […] on right side of the database name. When connecting, the current schema is your logon. Often your work is done in a different schema. You can specify this schema in the Schema edit box and when connecting Toad will alter the schema automatically. When doing this, all other windows will have this as the current schema. Each connection is given an alias name (Name box at bottom). You may cus-tomize this to further distinguish each connection you defined.
Connecting—Oracle
17
End User Training Toad Data Point
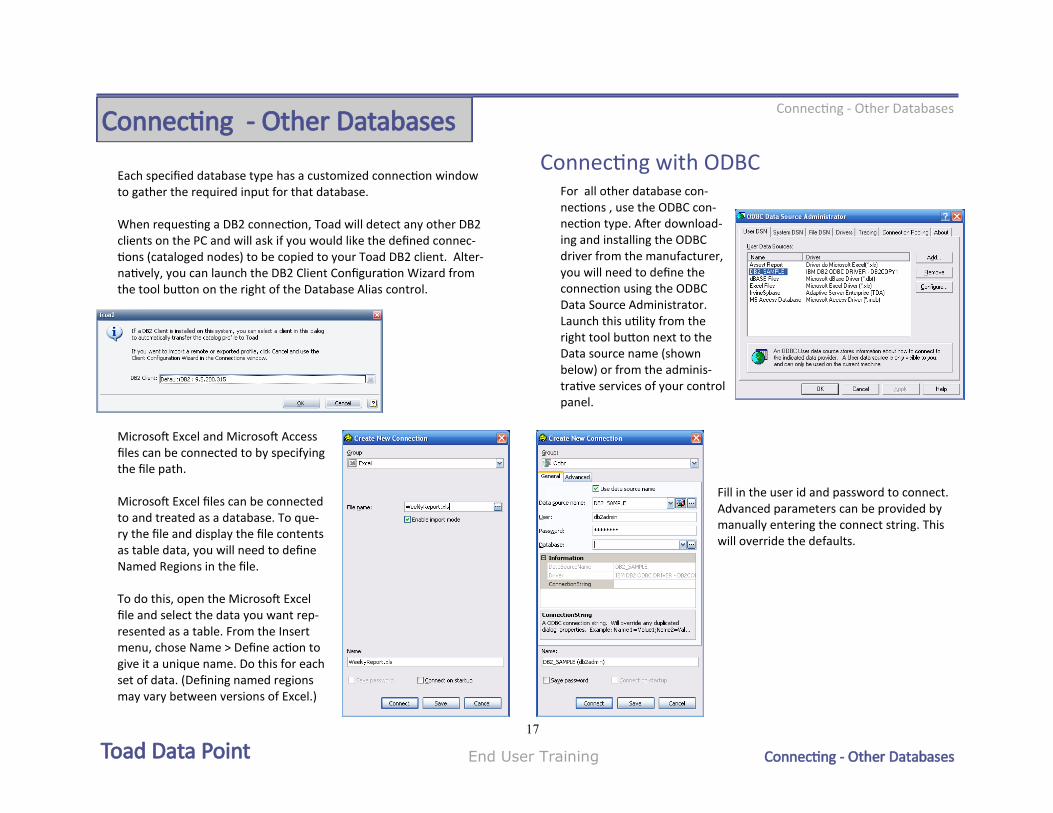
Each specified database type has a customized connection window to gather the required input for that database. When requesting a DB2 connection, Toad will detect any other DB2 clients on the PC and will ask if you would like the defined connec-tions (cataloged nodes) to be copied to your Toad DB2 client. Alter-natively, you can launch the DB2 Client Configuration Wizard from the tool button on the right of the Database Alias control.
Connecting - Other Databases
Connecting with ODBC
Connecting - Other Databases
Microsoft Excel and Microsoft Access files can be connected to by specifying the file path. Microsoft Excel files can be connected to and treated as a database. To que-ry the file and display the file contents as table data, you will need to define Named Regions in the file. To do this, open the Microsoft Excel file and select the data you want rep-resented as a table. From the Insert menu, chose Name > Define action to give it a unique name. Do this for each set of data. (Defining named regions may vary between versions of Excel.)
Fill in the user id and password to connect. Advanced parameters can be provided by manually entering the connect string. This will override the defaults.
For all other database con-nections , use the ODBC con-nection type. After download-ing and installing the ODBC driver from the manufacturer, you will need to define the connection using the ODBC Data Source Administrator. Launch this utility from the right tool button next to the Data source name (shown below) or from the adminis-trative services of your control panel.
Connecting - Other Databases

18
End User Training Toad Data Point
Once you have defined and connected to a database, the connection can be managed in the Connection Manager tool window. The con-nection aliases are grouped by database type. Currently opened con-nections display a green connection icon next to them. The application points to and uses only one connection at a time. The currently open connection that has focus is highlighted and is used globally in the application. This means that any new windows will open with this connection.
Connecting - Connection Management Connection Management
To change the focused connection, double-click on the preferred connection or right click and choose “Set as current.” If this connec-tion is not connected, it will automatically connect and then become the application’s focused connection. (Note: If you have not selected to save your password you will be prompted at this time.)
Importing/Exporting Connections
Toad can share connections by exporting or importing the connec-tion definitions. To do so, select the “Export Connections” button and save the connections to a XML file. Use this file as a collaborative resource; each Toad Data Point user can import the connections through the import connections feature.
Further organization of connections can be done by creating custom groups. The tree can be expanded or collapsed for easy use. Note: If a database type does not have any con-nections defined, it will not be displayed. In this example there are no SQL Server, Sybase, Microsoft Excel or ODBC connec-tions.
Connection Management
Tip: To prevent others from using passwords on shared connection files, use the Master Password option. See Options > Environment > Passwords

19
End User Training Toad Data Point
Connecting Exercise
Purpose - To demonstrate how to connect to the Toad Sample da-tabase and an Oracle database. Scenario - Define connections for most the commonly used data-bases. Exercise Steps:
1) Toad Sample Connection - Start Toad. If the Quick Start Guide displays, click on the “Connect To Data Sources” button. (If you did the prior exercise, the Connection window will dis-play.) The Toad Sample database should be focused. Press “connect.” Choose what window you would like to open after connection or “OK” to continue.
2) Click on the Navigation Manager window to confirm the con-nection is open. Observe the tables in the database through the Object Explorer. Columns are displayed at the bottom as you click from table to table.
3) Oracle Connection using Client - From the Navigation Manager, click on “Create New connection” button or use the File| New | Connection menu. Choose Oracle as the connection type. If you have an Oracle client installed, this tab will have focus in the middle of the window. If the Direct Connect tab has focus, follow the instructions in the next step. From the database name dropdown, choose a connection. Enter user name, pass-word. Check the “Save password’” option (if desired) and press “Connect.”
4) Oracle Connection Direct - To connect with Direct Connect, you will need to know the server and SID. Enter server, username, password, SID and press “Connect.”
5) Click on the Navigation Manager to confirm the connection is open. Notice the tables listed are the tables owned by the
Connecting - Exercises
login.
6) Right click on the connection and choose “Properties.” In the schema box, enter another schema (IE: Scott). Press “Reconnect.” Observe that the connection string now contains the new schema and the objects in the Object Explorer are tables owned by this schema. This is a way to define a connection using your logon while pointing to a different schema.
7) Changing Current Connection - In the Navigation Manager, double-click on the Toad Sample connection. The application is now us-ing this connection. Select the Oracle connection, right-click and choose the “Set as Current.” This also sets the current connection for the application.
8) Connect to Excel - To connect to a Microsoft Excel file, the data needs to be defined as a named region. To do this, open up an Microsoft Excel file outside of Toad. Highlight the data you want represented as a table. From the Insert menu, choose Name | Define. Give the data a name. Save and close.
9) Click the New Connection button and select Microsoft Excel con-nection type. Navigate to the Microsoft Excel file using the ellipsis button […]. When the filename is set, press “Connect.” In the Object Explorer, confirm the named data now displays as a table.
10) ODBC Connection - Note: To connect to a specific type of data-base, you will need to install the ODBC driver from the database provider. Press “New Connection” and choose ODBC type. If you have a predefined ODBC connection, choose this from the list. If not, press on the “Open ODBC Data Source Administrator” icon next to the dropdown. Click “Add” and define a Microsoft Text connection. Close the window and choose the ODBC connection you just defined. Click on “Connect.”
Connecting—Exercises

20
End User Training Toad Data Point
Navigating - Navigation Manager Navigation Manager
For each database object type there are several editors available: Create, Alter, Delete and Edit Privileges. The Create Table editors have an advance button that ex-pands the editor into all of the available options for that table type. By default these are not shown and the most common options of columns and comments are dis-played.
The default configuration for Toad Data Point includes the Navigation Manager. This tool window contains your connections, displays objects for browsing and organizes your SQL projects. The top part of this tool window is the Con-nection Manager, as discussed in the last sec-tion. Below it is the Object Explorer. When connected to a database the objects are viewed by that user id and are organized by object type. (IE: Table, View, Triggers, etc)
The object display type can be organized graphically by tabs, tabs wrapped onto multiple lines, dropdown list, flat tree or tree list. Change the object display type by dropping down the options for this explorer button as shown.
For tables and views, the columns are dis-played at the bottom of the object explorer. Extra columns are available for additional information and vary between database types. For Oracle, the extra column infor-mation can include the table type, such as standard, IOT, temporary, or nested object and last analyzed date.
Right-clicking on the Object Explor-er displays all of the available ac-tions for that database type.
Navigation Manager
Simple Editor
Advanced Editor

21
End User Training Toad Data Point
Navigating - Filters
Depending on the size of the database you are connected to, finding a specific object may be difficult. Most production databases have thousands of objects which make it tedious to manually scroll through a list to locate the tables or views needed for a query. To make this task easier, the Object Explorer offers filtering. When first loading an object type, you may be prompted to create a filter. The application options contain a filter threshold. When the number of objects exceed this value, you are prompted to build a filter. This option can be changed on the Explorer | General tab.
Filtering can be done three ways. The simplest filtering is to freehand type a filter string in the edit box located below the schema name in the Object Explorer. The filter is appended as a WHERE clause filter and the database re-queried.
Clicking on the funnel icon will bring up the filter editor. The first tab offers all of the available options for that database type. The filter is applied only to that connection, schema and object type and is re-tained between sessions.
Advanced filters can be created by selecting the SQL tab. To construct a custom filter, select “Enable custom SQL” and enter your WHERE clause criteria. The preview tab allows you to see the results before leaving the editor. Once you are satisfied with your filter, enter a name and save. If you set a named filter, you can apply or remove the filter by clicking the dropdown beside the filter icon.
Navigation—Filters
Simple Filter
Advanced Filter
Named Filter

22
End User Training Toad Data Point
Navigating - Exercises
Navigation Exercise
Purpose - To demonstrate how to configure the Navigation Manager for connections most commonly use. Scenario - Your business has over 100 databases, however you do most of your work on 3 test databases and 1 production server. These servers have thousands of tables. You usually only use 30 tables. Exercise Steps:
1) Organizing Connections - In the Navigation Manager click on a connection or connection type. Right-click and choose “‘Create Group.” Name it “Test.” Create a second group name “Production.” Drag existing connections into one of these groups.
2) Set Object Explorer View - Double-click on the connection you want to have focus. In the Object Explorer, click on the options for the explorer. Observe how the display changes when choos-ing tabbed multi-line, dropdown, tree list, and flat tree. Choose the view you feel most comfortable with.
3) Filter tables - Double-click on the Toad Sample database. In the filter edit box type “ORDER” and press enter. This is requesting an exact match. Since there are no tables named ORDER, none are displayed. Add an asterisk to the end -> ‘ORDER*’ and press en-ter. Now there are two tables showing that start with the name “Order.” Add an asterisk to the front and you will now see all ta-bles that contain the word “ORDER.”
4) Name Filters - Double-click on another connection type, such as
Oracle. Click on the filter funnel icon. This will bring up the filter editor. Type in a filter in the search condition. Click on the SQL tab and check “Enable custom SQL.” Edit the WHERE condition.
For example
LOWER(tabs.table_name) LIKE 'dept%' or LOWER(tabs.table_name) LIKE 'emp%'
Enter a name for the filter and press “save.” The filter will now be applied. Clear the filter by choosing “None” by the dropdown next to the filter or “Clear” on the filter editor.
5) Create Table - Using the connection of your choice, open the Create Table editor by doing one of the following: right-click on tables and choose “Create Table,” press the Create Table icon on the Object Explorer toolbar or File | New | Table.
6) Enter a name for the table. Rename the default column and choose data type and nullable selection. Press the “Add” button for more columns. If using an Oracle connection, press the “Advanced” option and explore the advanced settings. When done, press the “Show Script” tab to view creation script. Press “Execute” to create the table. It will now show in the Object Ex-plorer. Note: If you do not see the table and it was successfully created, remove any filters you may have or check to see if it was created under a different schema.
7) Delete Table - Select the table just created. Press “Delete” or use the right-click menu. The “Drop Object” editor will display. Mul-tiple objects can be dropped at once. Options applicable to the type will be displayed, such as “cascade.” Set drop options, view the script and execute. The tables will be dropped and the Ob-ject Explorer updated.
Navigation—Exercises

23
End User Training Toad Data Point
Navigating - Project manager Project Manager
The third and final piece of the Navigation Manager is the Project Manager. Located behind the Object Explorer tab, the Project Man-ager is a convenient place to store files, queries, To-Do lists, connec-tions, FTP connections, URLs and other things that you might need for a particular reporting project.
You can have many saved pro-jects within Toad. Just click on the project name to quickly switch to another saved project. To create a new project, click on
the button at the top of the Project Manager window. Double-clicking on any file will load that file into the proper window. Many parts of the program have tool buttons to save/add that windows content to the
project manager. Look for these on the wizard bar or toolbars.
New Folder Adding a new folder to the project is useful for group-ing similar or related objects. It’s a logical folder, so it has no affect on any files or directories on your comput-er.
Directory This action will let you add a physical directory from your computer (or on the network) to the project. When you open it, you are presented with a Windows Explorer-type interface
Existing File This action will add a file of any type to the project
FTP Connection Add a saved FTP connection to the project
URL URLs can point to intranet as well as internet sites. You can also use it to save a link to a network location.
Database Connection
Use this action to associate a saved connection for quick access
To-Do List Similar to a folder, but used for grouping To-Do items
To-Do Item Each To-Do item is a separate task. You can open these to add notes as well as due dates. The To-Do item will turn red when the due date has passed. Just check the checkbox to indicate that it’s complete.
The following project types can be added to your project.
Project Manager
Tip: Projects are a great way to organize all of the resources for a given report to then distribute to a team or to new team members.

24
End User Training Toad Data Point
Project Manager - Exercises
Project Manager Exercise
Purpose - To demonstrate how to create and build a project. Scenario - You are starting a new program task that will take awhile to build and you want to stay organized. Exercise Steps: 1) Click on the Project Manager tab. (It’s the second tab in the mid-
dle of the Navigation Manager, on the left of the application.) 2) Using the Sample project that is bundled with Toad, double-click
on one of the files under the Query folder. Notice how it opens into a window for use. Close that window.
3) Click on the folder icon on the tool bar of the Project Manager (just under the tab). This will create a new project and ask you to enter the name. Enter any name and click “OK.”
4) Right-click and add two new folders. Name one “Websites” and the other “To-Do.”
5) Open up a web browser from the standard toolbar. If the stand-ard tool bar is visible but you do not see the web browser, drag a toolbar to a new row so it expands the size. If you do not see the standard toolbar, click on the Tools document group (all the way to the right of the application, near top corner).
6) The web browser opens by default to the Toad Data Point com-munities page. Add this web link to your project by using the “Add to Project Manager” button on web browser toolbar.
7) Change the web address by entering a new address in the web bar. Click the green GO button to load page. Add this to your project. Close web browser.
8) Go back to your project and double-click on one of the URLs. This will load the page into a web browser.
9) To organize the two newly added URLs, drag the URLs under the
folder name “Websites”.
10) Click on the To-Do folder to give it focus. Right-click and add a To-Do item. Double-click on the item and enter task details and due date. When that day arrives, the node will turn red. When you are done with that task, check mark it and it will draw a line through the item.
11) Add any files you like to the Project Manager, such as *.SQL or *.XLS. Use the right click menu and choose “Add Existing File.” Once added, double-click to open in appropriate viewer.
12) You can also add connections and database objects. Click on the Object Explorer (next to Project Manager tab). Select a table. Right-click and use the “Send To Project Manager.” Go back to Project Manager and double click on the newly added table. This will open an Object Detail window at the bottom of your applica-tion. This is a docking window and can be dragged and docked anywhere.
Project Manager—Exercises

25
End User Training Toad Data Point
Understand - Diagrams Understand - Database Diagrams
Before writing any queries, you need to understand how the data is organized. The ER Diagram window helps you to easily identify rela-tionships between tables via foreign key relationships. Understanding the columns and their relationships will help you determine what col-umns you need and the natural join predicates that are available through primary and foreign keys.
Open an ER Diagram window by clicking on the ER Diagram tool button, tools menu or right-click Send To > ER Diagram action from the Object Explorer. Add tables by dragging or double-clicking from the Object Explorer. If the table has a foreign key on one of it’s col-umns the dependant table will be shown. The foreign key relationship will be drawn with a line between the associated columns.
The toolbar offers several features to organize the display. The first tool button auto-arranges the tables and the second auto-sizes them. Depending on how many tables you have, arranging and sizing may be needed for best viewing. Zooming in and out is controlled by the dropdown. The toolbar above shows 100%. The spin edit, next to this, designates the reference depth. The higher the number, the more tables may be drawn. To view details of a specific table, select the table and press F4 or the toolbar icon that looks like an eye.
Understand—Database Diagrams

26
End User Training Toad Data Point
The ER Diagram window can be annotated and used as a collaborative resource. Depending on what you want your diagram to focus on, there are many features that can be used.
The ER Diagram window is best used for graphically displaying the joins for a query. The joins that are not from foreign key relation-ships can be manually drawn and are shown has dotted lines as shown below.
For relationships only, all details can be minimized on the right-click menu. For additional column details, maximize the tables and choose “Show column details.” Some tables have so many columns it is difficult to understand them. Many of the columns do not provide useful query data and can be hidden using the Column Man-ager. Displaying only the most significant infor-mation makes it easier for you and your colleagues to pick up and use.
Additional annotation can be added as notes to any table or to the ER Diagram file. When table notes are present, a yellow note icon is used on the table name. These notes are saved in a annotation cache and will appear in other parts of the product such as the Database Explorer and Query Builder. The annotation cache can also be shared as a collaborative resource by storing it on a shared network drive. To share this file, set the network path under Database | Cache in the options window. When your ER Diagram is complete, save the file and add to the Pro-ject Manager. You can easily reopen this file by double-clicking from the Project Manager. To use the file as the join predicates of a query, press the “Send To Query” button on the Wizard Bar.
Many tables have columns with the same names which have data that would be useful to join. Use the Look-Up table utility to find tables with sim-ilar column names.
Understand—Database Diagrams
Understand - Diagrams

27
End User Training Toad Data Point
ER Diagram Exercises Exercise 1 Purpose - To demonstrate how to build a collaborative ER Diagram. Scenario - Several daily and weekly reports are generated regarding customer sales. Build an ER Diagram that can be used as a template for these queries. Exercise Steps:
1) Connect to the Toad Sample database by double-clicking on the connection string in the Navigation Manager.
2) Click on the ER Diagrammer from the standard toolbar. Select the contact table and drag to the diagram surface.
3) Right-click and deselect “Show Dependencies.”
4) The orders.shipping_address_id and orders.billing_address_id foreign key relations are not needed in most queries. Right-click and choose notes. Enter information for the users to remove these joins when building a query.
5) It is against company policy to display sex and home phone num-ber in reports. Right-click on these columns in the CONTACT ta-ble and select “Hide Columns.”
6) Right-click on the CONTACT table and choose “Manage hidden columns.” Select birth date and add to right side. This will hide this column also.
7) Click “Add to Project” from the Wizard Bar at the bottom of the window. Provide a name for the ER Diagram file.
8) Close the window. Click on the Project Manager. Locate the ER Diagram you just added. Double-click to reload.
Exercise 2 Purpose - To demonstrate how to manage large ER Diagrams. Scenario - New employees to your group need to learn the tables used in reporting. To start them off, build a single diagram that shows all tables and the database relationships. Exercise Steps: 1) Connect to an Oracle database that has the HR schema.
2) Go to Tools | Options | Database | Diagramming. Make the fol-lowing changes: Default table height 500, maximum number of tables 10, and maximum reference depth 5. Click “OK” to apply.
3) Set the schema to HR. Select the countries table. Right-click and Send to ER Diagrammer. A warning will be displayed that says you are exceeding your table limit. Select “No” to not limit.
4) There are too many tables and the size of the tables are too large. Click on the Auto Resize and Auto Arrange tool buttons. Better, but the tables still do not fit on the diagram.
5) Change the zoom percent by using the drop down on the toolbar. Auto arrange tables after zoom. Do this until you can fit all tables on the diagram.
6) Change the reference depth from 5 to 0 and press enter. This controls the depth of references. At 0 there are no dependen-cies. Change to 1 and 3. Auto arrange tables when needed.
7) Determine the reference depth that best suites your needs.
8) Notice that Employees.job_id and Job_History.job_id might be an important join. Manually draw a join by selecting one of these columns and dragging to the other.
9) You’d like to know more about the Job_history table. Right-click and “Show Column Details.” This is not enough information. Click on Object Details to load full details.
Database Diagram– Exercises
Understand - Diagrams Exercises

28
End User Training Toad Data Point
Understand - Database Explorer Understand - Database Explorer
The Database Explorer is made up of two primary pieces: the Object Explorer (part of the Navigation Manager) and the Viewer window (below). This section will focus on the Viewer window. (The Object Explorer is covered in another section.)
The Viewer has several tabs across the top which change slightly, de-pending on the database you’re connected to and the object type that you have in focus in the Object Explorer to the left. For now, we’ll just focus on how it works with the Oracle platform. (The table object type represents most of the tabs available for other types as well.) Tables The Columns tab gives you an overview of the table’s columns, dis-playing information such as column names, data types, whether or not a column is a primary key, whether it can contain NULL values, defaults, comments and the date when it was last analyzed.
This gives you an important high-level understanding of the table. The Data tab is where you’re likely to spend most of your time. This “browser” interface allows you to visually inspect the data in your table without writing any queries. Depending on your database cre-
dentials (and wheth-er or not you in-stalled Toad in Read-Only mode) you can modify records here; insert, update and delete capabilities are made easy.
You can use the viewer window to easily group or filter columns. When you need to sort through lots of records quickly, this can be a quick way to get the information you’re looking for. To filter your results quickly, click on the filter icon in the column header. To group columns, right-click on a col-umn and choose “Group By This Col-umn.” You can also view summary infor-mation for individual columns such as max, sum, average of a column and more by right-clicking.
Understand—Database Explorer
29
End User Training Toad Data Point
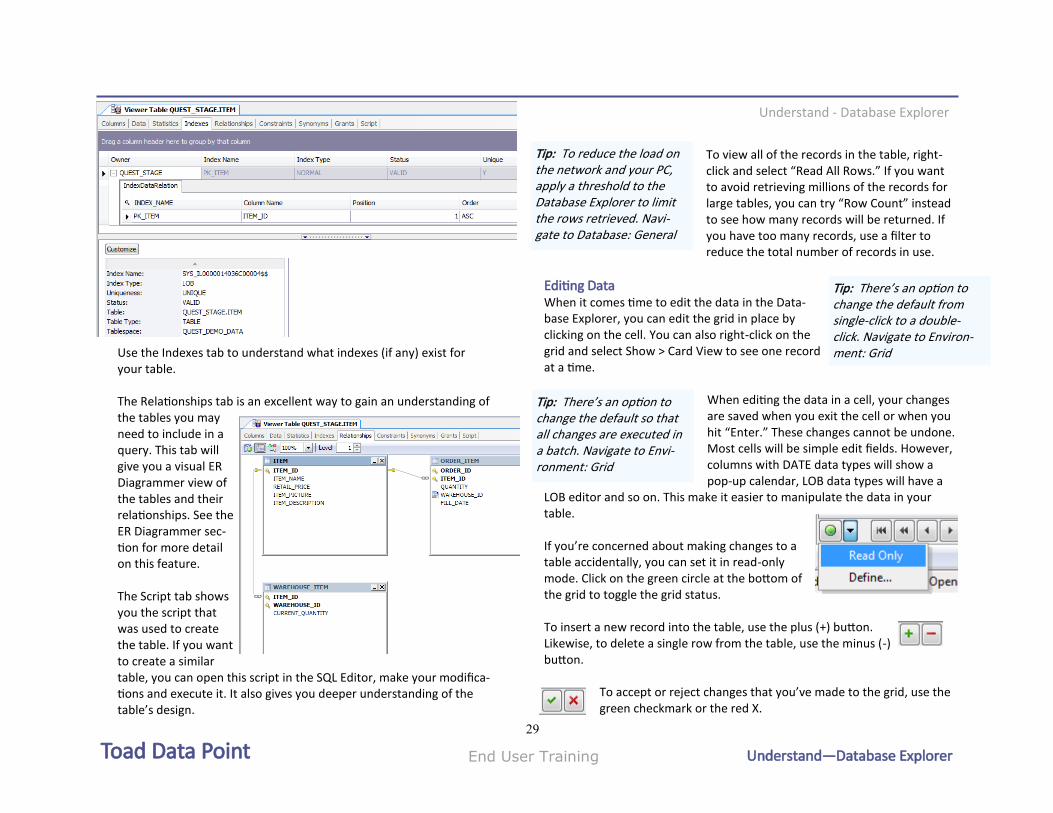
Use the Indexes tab to understand what indexes (if any) exist for your table. The Relationships tab is an excellent way to gain an understanding of the tables you may need to include in a query. This tab will give you a visual ER Diagrammer view of the tables and their relationships. See the ER Diagrammer sec-tion for more detail on this feature. The Script tab shows you the script that was used to create the table. If you want to create a similar table, you can open this script in the SQL Editor, make your modifica-tions and execute it. It also gives you deeper understanding of the table’s design.
To view all of the records in the table, right-click and select “Read All Rows.” If you want to avoid retrieving millions of the records for large tables, you can try “Row Count” instead to see how many records will be returned. If you have too many records, use a filter to reduce the total number of records in use.
Editing Data When it comes time to edit the data in the Data-base Explorer, you can edit the grid in place by clicking on the cell. You can also right-click on the grid and select Show > Card View to see one record at a time.
When editing the data in a cell, your changes are saved when you exit the cell or when you hit “Enter.” These changes cannot be undone. Most cells will be simple edit fields. However, columns with DATE data types will show a pop-up calendar, LOB data types will have a
LOB editor and so on. This make it easier to manipulate the data in your table. If you’re concerned about making changes to a table accidentally, you can set it in read-only mode. Click on the green circle at the bottom of the grid to toggle the grid status. To insert a new record into the table, use the plus (+) button. Likewise, to delete a single row from the table, use the minus (-) button.
To accept or reject changes that you’ve made to the grid, use the green checkmark or the red X.
Tip: There’s an option to change the default from single-click to a double-click. Navigate to Environ-ment: Grid
Tip: There’s an option to change the default so that all changes are executed in a batch. Navigate to Envi-ronment: Grid
Tip: To reduce the load on the network and your PC, apply a threshold to the Database Explorer to limit the rows retrieved. Navi-gate to Database: General
Understand—Database Explorer
Understand - Database Explorer

30
End User Training Toad Data Point
Understand - Database Explorer Exercises
Database Explorer Exercise Purpose - To demonstrate how to use the Database Explorer. Scenario - You need to build a query listing customers and want to know more about the table before writing the query. Note: This exercise uses the Toad Sample database. This connection does not have the relationship and script tabs. The tabs available can differ depending on the type of connection. Exercise Steps: 1) Connect to the Toad Sample database by double-clicking on con-
nection node in the Navigation Manager. 2) Double click or right click “View Details” on the contact table. 3) View the column data. 4) Click on the Indexes, Primary Keys and Foreign Keys tab. Observe
the index data. 5) Click on the Data tab. Find the row where the last name is
“Acton.” Do this by clicking the filter cone on the “Last_Name” column header. When you select “Acton” you will only see this row.
6) Use the column filter again and choose “All” to clear the filter. 7) Click on the column header. It will sort the rows by alternating
ascending and descending order. 8) Click on the filter cone in the top left. This brings up a custom
filter builder. Builder a filter such as “CONTACT_ID > 2000”. The filter string will display at the bottom on the grid. Click the checkbox to remove the filter.
9) Click on a row in the middle. Notice the row number change in the bottom right. Right click and choose “Row Count.” This gives you the total rows in the table.
10) Right click in the white space near the bottom of the grid in the
‘’SEX” column. Choose “Count.” This gives you the total count showing values in the grid. Using the column filter, choose to display only “F” values. Notice how the count total is now up-dated.
11) Using the column filter, choose all to display all rows. Click on the “SEX” column and drag to the grey row above the grid that says “Drag a column header here to group by that column.” All the rows are now grouped by the value of the “SEX” column. Each group can be expanded to view the row data.
12) Right click on the grid anywhere and choose “Card View.” Scroll through some records. Click on the customize button and use the column filter. Set this to “Address_id = 100”. Notice how the card view is filtered but not the grid view.
13) Go back to the grid view. Select a row in the First_Name column and edit the value. Press “Enter” to update the row. Go to the Birth_Date column and use the date picker to change the date. Each data type will have an appropriate editor. (NOTE: If you are using Oracle or a database that does not have Auto Commit turned on, you will need to press Commit at the left hand bottom of the window.)
14) Go to Tools | Options | Database | General tab. The very first option is “Number of rows to initially fetch in data tab.” Change this to 50 and click “OK.”
15) Go back to the data grid and refresh the grid by pressing F5. No-tice the right hand corner now says 1 of 50 (scroll for more). The option you set controls the number of rows fetched when the data tab is displayed. Click on the scroll bar and hold down to retrieve more. Right-click on the grid and choose “Read All Rows” to retrieve all table rows. This feature can be especially handy for viewing tables with many rows.
Database Explorer—Exercise

31
End User Training Toad Data Point
Query Builder Query - Query Builder
Start building a query in one of several ways:
Right-click on the selected object (s) in the Object Explorer and select the “Send To | Query Builder” menu option.
Press the Query tab on the Wizard bar at the top of the application. Drag and drop objects from the Object Ex-plorer onto the pane.
Use the Query Builder tool bar button. Drag and drop tables from Object Explorer.
When adding tables to the Query Builder, foreign key relationships are drawn automatically. Join additional columns by selecting a col-umn in a table and dragging it to a column in another table. A con-nector line displays between the two objects to visually represent the relationship.
Add columns to the query using one of the following methods:
Select the checkbox beside each column to include in the query.
Select (Add All Columns) to include all columns, using each col-umn name, in the query.
Select * (Wildcard) to add all columns to the query using a SELECT * statement. If selected, an asterisk displays for the Field name in the Criteria tab.
Query Builder
The Query Builder enables you to create a query without writing or editing SQL statements. Even if you are familiar with SQL, the graph-ical interface makes it easier to create relationships and visualize the query.

32
End User Training Toad Data Point
Query Builder Column Criteria
Column Criteria When a column is added to the query, a column criteria is added to the bottom pane of the Query Builder. Each col-umn can have any of the fol-lowing attributes:
Only fetch unique records
Select this checkbox to eliminate duplicate records from query results.
Table Displays the name of the table associated with this column.
Database Displays the name of the database associated with this column.
Aggregate Function Select one of the following functions to calculate column values: Count, Count (Distinct) , Max, Min..
Note: If you add a GROUP BY clause, you must specify an aggregate function for any remain-ing columns.
Where Condition Select operators, expressions, or a date range to include in the WHERE condition. Currently, you can have a maximum of two WHERE conditions joined by an OR condition. For more information, see Set Where Conditions.
Or Select the operators and expressions to add to the OR condition. For more information, see Add OR Conditions.
Group By Select the column you want to add the GROUP BY clause to and click +. You can add a new GROUP BY clause to any remaining columns to group them in sequence. Any remaining col-umns that do not have a GROUP BY clause must include an aggregate function.
Having Condition Select the operators, aggregate, and expressions to include in the HAVING condition. This option is disabled unless you have set a GROUP BY clause.
Sort Select an option to add this column to the ORDER BY clause and specify a sort direction.
Visible Select this checkbox to return this column in query results. This is useful if you need to in-clude a column in the selection criteria, but do not need to display it in the query results.
Field Alias Enter a name to use as an alias for the column name in the query results. This is useful if you have an ID or vague column name and want to easily identify that column in the query results.
Table Alias Enter a name to use as an alias for the table name in the query results. For example, if there are multiple employee tables that you need to join for the query, you can rename the tables to permanent, contract, etc. to easily identify them.
Note: If you selected All Columns for a table or created a column using the Edit Calculated
Query Builder

33
End User Training Toad Data Point
Query Builder Where Condition Editor
Where Condition Editor Open the Where Condition Editor by selecting the “Where Condi-tion” row and press the ellipsis button […] on the column you wish to define the where condition. A filter can be defined by constant, another column or bind variable. Selecting the column type will provide a list of available columns from the query. Selecting the constant type allows you to manually enter a value or the dropdown will query the database and provide a list of distinct values.
A bind variable can be used by enter-ing the bind symbol and bind name. IE: :a_bind At run time, a bind variable window will prompt you for the value. The use of bind variables prevents redun-dant parsing of the SQL statement by the database and should be consid-ered if the SQL statement is exe-cuted frequently.
The formula tab helps you build expressions. Doubleclick on any function, operator or field to set an expression on the selected col-umn.
If the column is a date, a Date Range tab is added. Select by clicking on the desired date range.
Query Builder
Dates
Filters
Formulas

34
End User Training Toad Data Point
Query Builder Query Execution
Query Execution Once you have built your query, you can execute it in a variety of ways: by pressing the “Run Query” button on the bottom Wizard Bar, pressing the “Execute SQL” toolbar button, F9 or right-click Execute action on the table pane. The result set will be displayed in a separate tab. Each time you exe-cute the script and get a new result set it is stored in a separate sub-tab. As you build and change your query the results may change and these changes can be viewed.
Execution time and messages are listed in the Messages tab. The right-click menu on this tab offers several grouping and customiza-tion features.
The Explain Plan tab shows the optimizer execution plan. Advanced SQL users can use the explain plan to manually tune their queries.
Query Builder

35
End User Training Toad Data Point
Reverse Engineering
The Query Builder allows you to enter a SELECT statement in the Query tab and reverse engineer it into a visual representation on the Diagram tab.
Simply type or paste a SELECT statement into the editor on the Query tab and click on the “Visualize SQL Statement” button to draw a dia-gram of the objects and relations in the SQL.
Existing SQL files can be opened in the SQL Editor and sent to the Query Builder to be converted visually. This is an easy way to port SQL into a common format to be used as a collaborative resource.
Some SQL syntax cannot be visually represented when reversed engi-neered. When this occurs, a Global Where Clause object is used to contain the logic of the clause. The Global Where Clause can be edit-ed by double clicking on the object or clicking the Global Where or Global Having buttons on the toolbar.
Errors in the SELECT statement will be flagged in the editor and add-ed to the Output window.
Note: By default the Query Builder uses ANSI joins. Sending a non-ANSI join query to the Query Builder will put the WHERE condition into the Global Where Clause. If you change the join type to non-ANSI join, make a change, and press the “Visualize query” action it will build the query.
Query Builder
Query Builder Reverse Engineering
36
End User Training Toad Data Point
Query Builder Advanced Features
Advanced Query Builder Features
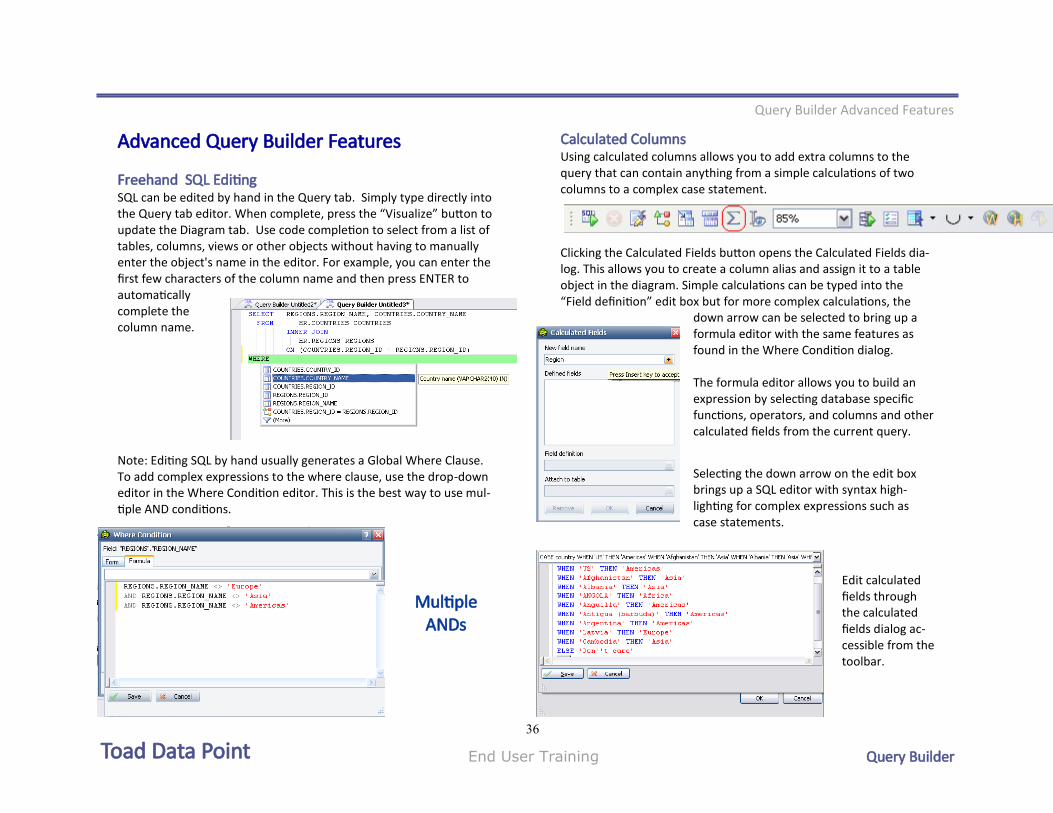
Freehand SQL Editing
SQL can be edited by hand in the Query tab. Simply type directly into the Query tab editor. When complete, press the “Visualize” button to update the Diagram tab. Use code completion to select from a list of tables, columns, views or other objects without having to manually enter the object's name in the editor. For example, you can enter the first few characters of the column name and then press ENTER to automatically complete the column name.
Note: Editing SQL by hand usually generates a Global Where Clause. To add complex expressions to the where clause, use the drop-down editor in the Where Condition editor. This is the best way to use mul-tiple AND conditions.
Calculated Columns Using calculated columns allows you to add extra columns to the query that can contain anything from a simple calculations of two columns to a complex case statement.
Clicking the Calculated Fields button opens the Calculated Fields dia-log. This allows you to create a column alias and assign it to a table object in the diagram. Simple calculations can be typed into the “Field definition” edit box but for more complex calculations, the
down arrow can be selected to bring up a formula editor with the same features as found in the Where Condition dialog. The formula editor allows you to build an expression by selecting database specific functions, operators, and columns and other calculated fields from the current query.
Selecting the down arrow on the edit box brings up a SQL editor with syntax high-lighting for complex expressions such as case statements.
Edit calculated fields through the calculated fields dialog ac-cessible from the toolbar.
Query Builder
Multiple ANDs

37
End User Training Toad Data Point
Query Builder Advanced Features Subqueries
Building a Subquery
Subquery, Inner query or Nested query is a query within a query. A subquery is usually added in the WHERE clause of the SQL statement. To add a subquery in the Query Builder, open the WHERE Condition editor for the column used with the subquery. Choose the operator type and select “Subquery.”
Navigation
When a subquery is present, a navigation tool window appears on the left side of the Query Builder. The main query and all sub queries are listed in a tree view. Clicking on a node of the tree will display its content on the right.
The subquery button brings up the subquery editor. This is best de-scribed as a Query Builder within a Query Builder. Everything you would normally do in a Query Builder can be done here to build the subquery. Add tables from the object palette, join, filter or calculate columns. You can execute the subquery to confirm the results. Note: A subquery can be used for a column value. In this case use the calculated columns editor and insert the subquery in the field defini-tion editor.
All subqueries are repre-sented as Global Where clauses in the diagram. Double clicking on the Global Where clause also loads the content of that subquery.
Query Builder

38
End User Training Toad Data Point
Query Builder Advanced Features
Query Types The Query Builder builds many types of statements. Choose from Select, Insert, Update, Delete, Create Table as Statement and View. These types are available from the toolbar. The Insert, Update and Delete statements use bind variables to ob-tain the values at execution time. Enter your values into the bind variable window. You may need to change the data type of the bind to match the column data type. The Create Table and Create View statements will prompt you for the name of the new database ob-ject.
Statement Operators
Statement operators can be used to combine two or more select statements. The Statement operators that are available for the cur-rent connection type are available from the toolbar or subquery navi-gation manager.
All statements combined with a statement operator must have the same number of columns. These statements are displayed as subqueries and can be accessed through the subquery navigation manager.
Query Builder

39
End User Training Toad Data Point
Query Builder Tool bar
The Query Builder toolbar has the following tool buttons: Execute Statement - Press this tool button to execute the query. You can also execute the statement using F9, the Run Query button on the Wizard Bar or from the right click menu. Cancel Execution - During the time a SQL is executing, you can cancel the query by clicking on this tool button. Canceling a query can also be done from the Background Processes window. Send to Editor - Use this button to send the current SQL in the Query Builder to a SQL editor. Arrange Tables - Auto arranged table to best fit in the Diagram. Resize Tables - This button sizes the table to display the visible columns. When working with many tables with many columns, use the column manager in the ER Diagram to hide unnecessary columns and then arrange and resize tables to best fit the tables in the diagram. Add Subquery - Adds subquery and opens subquery editor. Calculated Fields - Use Calculated Fields to create a new column that uses one or more fields and performs mathematical opera-tions. The tool button brings up access to all existing calculated fields for editing, deleting, or adding. View Object - The Object Details window will display the details for the currently focused table. The details window is equivalent to the right hand side tabs in the Object Viewer.
Zoom - Choose the zoom percentage.
Explain Plan - Generate an explain plan for the SQL Statement. The explain plan is displayed in a tab of the results tab and shows the steps the database will take to execute the query. Options - The Query Builder has options such as adding table name to each column, list order of table columns, and highlight coloring. Statement Types - Choose your statement type of Select, In-sert, Update, Delete, Create Table As, or Create view. Statement Operators - Combine statements using statement operators. Join Type - The Query Builder uses ANSI joins by default. When you are connected to Oracle you have the option to use Ora-cle’s join syntax. Where Clause Editor - When you send SQL to the Query Builder from the editor, all where conditions are contained in a Global Where Clause object. This editor edits its content. Having Clause Editor - Equivalent to the Global Where Clause editor only applicable to having clauses. Visualize Query - You can manually edit your SQL in the Query tab. Push this tool button to update the changes in the Diagram tab.
Query Builder
Query Builder Tool Bar

40
End User Training Toad Data Point
Query Builder Collaboration
Collaboration The Query Builder window contents can be saved to disk from the File menu. The files have a *.TSM extension and retain the connection and query information. In Toad Data Point version 2.5 and above, you have the option to also save the results.
Double-clicking on the Query Builder file icon or opening from the File menu or Wizard Bar will load the data into a
new Query Builder so you can pick up from where you last left off.
Network Share - Establish a network share location. Set this path in Toad Data Point and save your SQL related files to this location. See Options > Environment > Network Share.
Version Control - Use version control to protect and back up your SQL files. Version control is integrated into Toad. See Version Control section for details.
ER Diagrams - Build a library of tables that are most commonly used together. Add joins and annotation to describe how your environ-ment works with these tables. These diagrams can be used to edu-cate new users and is a vital reference in working with tables. You can send these diagrams to the query builder and the tables and re-lations can be used as templates for new queries.
Query Builder - Query Builder files can be used for executing results and used to build reports. The Query Builder results can be used to build the following report types: Microsoft Excel, Toad Data Reports, Toad Charts, and Toad Pivot Grids.
Automation - Recurring reports can be scheduled to be executed, exported, and emailed to recipients.
Organization of all your Toad Data Point files can be done through using a pro-ject in the Project Manager tab. See the Project Manger section for details. Files can also be checked in and out of the following version control systems: Microsoft Visual SourceSafe, CVS, Sub-version, Microsoft TFS.
Much can be said regarding the use of shared resources. Working together as a joint intellectual effort saves time and money. Toad Data Point recommends the following to enhance your groups SQL collaboration.
Query Builder

41
End User Training Toad Data Point
Query Builder Heterogeneous Queries
Heterogeneous Queries You can add tables and views from multiple databases to create a query that combines the generated results. To build a heterogeneous query, add a table to the Query Builder. Double-click on another con-nection, giving it focus. Add a table from this connection. When you have two or more tables from different data sources, the Query Build-er will display a “Heterogeneous Query” watermark.
When working with heterogeneous que-ries, you can determine the connection associated with each table or view by plac-ing the cursor over the table name in the Diagram pane. (See picture to the right.)
Consideration/
Limitation Description
Access database used for building heteroge-neous queries
The Query Builder uses the Microsoft Access data-base installed with Toad. Do not uninstall this data-base if you need to run heterogeneous queries.
Performance concerns A heterogeneous query may take longer to execute then a query against a single database because result sets from each database are retrieved and combined to generate a single result set. Also, ODBC data re-trieval is slower than using a native database client.
ODBC driver support for native database provider connections
You can select a specific driver to use for heterogene-ous queries when connected to a native Oracle, SQL Server, MySQL, or Sybase database provider in Tools | Options | Database | NativeDatabaseProvider. This is a global change that affects all connections that use this provider. To specify an ODBC driver for a single connection, right-click the connection in the Navigation Manager window and select Properties. Select the Advanced tab to choose a driver.
Supported join types You can only create inner and cross joins
Subqueries are not supported
You cannot create a heterogeneous subquery.
DB2 client connections are not supported
You cannot create a heterogeneous query from a native DB2 client connection. Instead, connect to the DB2 database using an ODBC connection, and then create the query.
Multiple Excel connec-tions are not support-ed
You cannot create a heterogeneous query between two or more Excel connections.
Combining Access and Excel queries is not supported
You cannot create a heterogeneous query between a Microsoft Access and Microsoft Excel connection.
Result sets cannot be edited
You cannot edit result sets.
Query Builder

42
End User Training Toad Data Point
Query Builder Exercises
Note: To change the dates in the sample database orders table exe-cute this or a similar query in the editor. Change the number of days (1095) to adjust the number of days to update. The exercise filters on current quarter. If you do not have any orders with dates in the cur-rent quarter, you will not get any rows returned. UPDATE ORDERS
SET ORDER_DATE = order_date + 1095;
Exercise Steps: 1) Connect to the Toad Sample database by double-clicking in the
Navigation Manager.
2) Click on Tools | Query Builder to open a new Query Builder. Add tables orders, order_item and item by dragging them onto the diagram from the Object Explorer. Joins are automatically drawn.
3) Choose Order_id and Order_date columns from ORDERS table. 3) Add WHERE condition on Order_date to show dates for the
currnet quarter. Do this by clicking on where condition cell of order_date. In editor, select Current Quarter on the Date Range tab. Execute and determine that you have row data.
4) Add calculated column that sums the order_item.quantity * item.retail_price. Click on Calculated Fields editor on toolbar. Enter new field name and click the plus sign. Click the drop down button for field definition. Enter sum(ORDER_ITEM.QUANTITY * ITEM.RETAIL_PRICE). Click “OK” and select a table from the “Attach to table” dropdown.
5) Click the Group By cell for order_id (1) and Order_date(2). 6) Click “Run Query” on the Wizard Bar.
Query Builder Exercises Exercise 1 Purpose - To demonstrate how to build a query with an aggregate function, group by and field alias. Scenario - You need a report that produces the quantity of items on hand for each warehouse. Exercise Steps:
1) Connect to the Toad Sample database by double-clicking the Navigation Manager.
2) Select tables WAREHOUSE and WAREHOUSE_ITEM, right-click and click “Send to Query Builder.”
3) Select warehouse_name and current_quantity columns.
4) Select the aggregate function of Sum on the current_quantity column.
5) Add a Field Alias name of "Total Quantity" to current_quantity column.
6) Click the Group By cell on the warehouse_name column.
7) Click “Run Query” on the Wizard Bar.
Exercise 2 Purpose - To demonstrate how to build a query with a calculated field and date range. Scenario - You need a report that lists the retail totals for each order in the last quarter.
Query Builder—Exercises

43
End User Training Toad Data Point
Query Builder Exercises
Exercise 4 (Note: This example uses the SCOTT schema of Oracle.) Purpose - To demonstrate reverse engineering SQL. Scenario - You have SQL that you use often and would like to convert to Query Builder files. Exercise Steps: 1) Connect to an Oracle database (9i or above)
2) Open a SQL editor and type in this query: select * from DEPT, EMP
where dept.DEPTNO = emp.DEPTNO
and DEPT.DEPTNO = 10
3) Execute the query to confirm it is a valid SQL. If you get an error, check your syntax or change the schema in the editor to SCOTT by choosing SCOTT from the dropdown toolbar. Also, check your connection. To switch connections in the editor, click the down arrow at the bottom right of your application. Select the connec-tion you want. This changes the connection to the editor and the global connection.
4) Press the “Send to Query Builder” button. Run the query. 5) Notice that the query has no joins and all WHERE conditions are
in the Global Where Clause. This is how a query looks when there has been difficulty reverse engineering it. It still can be stored and used in the Query Builder, but the visual aspects are not complete.
6) Click on the ANSI SQL tool button. This changes the join prefer-ence to non-ANSI. Go to the Query tab and type a space. Press the “Visualize Query” button. (The space triggers a change which enables this button.)
7) Go back to the diagram and note that the joins and where condi-tion are now visually drawn.
8) Save the query file. Note: The ANSI SQL button will retain your last setting. Toggle on and off as needed. This is only available on Oracle connections.
Exercise 3 Purpose - To demonstrate how to build a subquery and use bind vari-ables. Scenario - You need a report that lists the customers whose con-tacts are in a specific region specified by the user. Exercise Steps: 1) Connect to the Toad Sample database by double-clicking in the
navigation manager.
2) Open a new Query Builder by clicking on “(2) Query” button at the top of the application.
3) Add the CUSTOMER table to the Query Builder. Select Custom-er_id and Customer_name.
4) Click on the WHERE condition for customer_id. Select the IN operator and press “Subquery.”
5) Add CONTACT and ADDRESS table. The join is automatic.
6) Check the region_id and customer_id column. Click on the WHERE condition for the region_id column. Add = 1 to condition.
7) Deselect the visible property and run the query.
8) What if you don’t remember what region 1 is? Select the re-gion_id column in the diagram. Right-click and choose look-up table. Press “Yes” and “Apply Lookup Value.” Now go back to the WHERE condition for region_id and use the dropdown. Now the text value representation of the regions is listed. Choose a different region and execute.
9) For a user to enter a value, change the query to use a bind varia-ble. Do this by invoking the where condition editor for region_id and replace your constant with :a (colon is the symbol for bind followed by a bind name). Execute the query. Enter avalue when prompted.
Query Builder—Exercises

44
End User Training Toad Data Point
Query Builder Exercises
6) Add joins by dragging NewManager.region_id to re-gions.region_id and employees.employee_id to newmanag-er.manager_id.
7) Select the following columns to display: Regions.reigons_id, regions.region_name, Employee.First_name, Employ-ee.Last_name
8) Execute query.
Note: Heterogeneous queries are performed by using ODBC con-nections to each database. If there are any connection failures, de-bug by testing a ODBC connection to each source.
Exercise 5 Purpose - To demonstrate how to build a heterogeneous query. Scenario - New managers are assigned to each region. Their names are only available in a Microsoft Excel spreadsheet. You need a re-port that lists regions and their new managers. Exercise Steps: 1) Create a new Microsoft Excel worksheet with the following data.
2) In Microsoft Excel, create a named region. (Click on ‘Region_ID’ Cell, hold Ctrl key, and click on last Manager ID). Create a named region from the Insert | Named | Define menu action. Name the table NewManager. Save and close Microsoft Excel file.
3) Connect to the Microsoft Excel file. Click on “New Connection” and choose the Excel type. Navigate to the file just created. View the NewManager table in the Object Explorer. If you do not see it, recheck step 2.
4) Open a Query Builder and add the NewManager table to the diagram.
5) Connect to Oracle and select the HR schema. Add the REGIONS and EMPLOYEES table. Notice the background of the Query Builder now displays the watermark ‘Heterogeneous Query’.
REGION_ID MANAGER_ID
1 200
2 201
3 203
4 204
Query Builder—Exercises

45
End User Training Toad Data Point
The SQL Editor gives you full control over your queries. Whether you start with a blank page or open a saved query, you have full control over the query (or queries!) that get executed. This section will intro-duce you to all of the features and show you how to get the most out of the SQL Editor.
Layout The SQL Editor is split into two main sections: the edit pane (upper) and the results pane (lower). The edit pane has two tabs that are docked to the left: the Navigator and Group Execute. The results pane has four tabs: Result Sets, Messages, Explain Plan and Pivot & Chart. These together make up what we call the SQL Editor.
Query—SQL Editor Query: SQL Editor
Navigation The SQL Editor supports both a single statement as well as scripts, or groups of statements. Often when a scripts gets long, it can be hard to find certain places in the code. This is where the Navi-gator can be useful. Double-click to jump to that statement. Hold your mouse over a statement to see its contents.
When building a query, the process may remind you of some action that needs to be taken on one of the ob-jects you’re working with. You can use the Object Ac-tions menu from the right-click menu to get a quick list of actions. It’s context sensi-tive, so the menu will change depending on the object you right-click on in your SQL code.
Tip: A statement is de-fined as a distinct, com-plete unit of SQL code. Multiple statements may be grouped together to form a script as long as they’re separated by a delimiter. On the Oracle platform, this is a semi-colon while SQL Server uses the word GO.
SQL Editor

46
End User Training Toad Data Point
When working with long scripts, whether it’s a single statement or many, you can use regions to set up collapsible sections of code. This will help you organize the SQL into logical parts and aid in navigation. A region is recognized as a comment to the database, so you don’t need to worry about breaking your query by using them. To create a region, you need to define a beginning and an ending. To begin a region, type --region; to end a region, type --endregion. Any text that follows your region tags will be treated as a comment by the database and will become the “name” of your region. You can also nest regions within one another. You may also note in the image above that there are line numbers in the editor. This is a configurable option (EDITOR > General). Readable code is easier to understand and maintain. The editor also supports customizable formatting to help you keep your code reada-ble. To format your code, use the button on your toolbar or right-click in the editor window. If you regularly skip between places in your code, you can use book-marks to help you navigate quickly. To set a bookmark, use CTRL+SHIFT_[number] where you use a number between 0 an 9. To move to a bookmark, use CTRL+[number]. These are also available from the right-click menu.
Coding Shortcuts Code completion is a feature of the editor which pops up a list of items to choose from as you type. As you’re typing your SQL , it will suggest table/view names, column names and other rele-vant objects. Instead of typing these out, pick one from the list. If you find yourself typing the same thing over and over, Code Snip-pets will be an invaluable shortcut. Code Snippets are small code tem-plates that you can insert into your code to save time. Once you in-sert one, you can use the TAB key to move between the fields that need to be filled out. There are many pre-configured Code Snippets that come with Toad Data Point, but you can add your own.
To insert a snippet, right-click on the editor surface and navigate to Snippets > Insert snippet… You’ll be presented with a list of snip-pet categories to choose from. In the example to the left, I’ve chosen Analytic Functions.
Once you select your snippet, it gets inserted into the code and the first field required is selected. Simply begin typing and use the TAB key to jump to the next field. Each snippet includes a small description, which is very helpful when trying to insert various functions which you may be unfamiliar with.
Query - SQL Editor
SQL Editor

47
End User Training Toad Data Point
Query - SQL Editor
To create a new snippet, open the Code Snippet window by navi-gating to VIEW > Code Snippets. This will open a new docked window on the side of your editor. You’ll notice that the snippets are all ar-ranged by database platform and then by category, so you’ll need to deter-mine the best location for your new snippet. Once you figure this out, right-click on that location and choose “New Snippet.” Name your new snippet and you’ll be presented with the editor. To begin, type the structure of the statement you want to become a snip-pet. In this example, I’ve defined the two parameters (aka “fields”) by sur-rounding them with $ symbols. With your statement complete, fill in the properties of the snippet. The de-scription is important because it pops up as a tool-tip when you’re selecting the snippet and can help you recall what the snippet actually does. The help URL can be any website or intra-net site that would be helpful to refer-ence when you’re in need of a little aid. Next, switch to the Parameters tab. This is where you make your parameters official. Start by clicking on the green “+” symbol to create the first parameter. Type in the identifier, which should be the name that you’re already using in the editor. The default value should be relevant to the user because this is what they will see. Lastly, give the parameter a tool tip to help when you’re ac-tually using the snippet. Repeat the process for the other parameter.
To finish things up, click on the Test tab at the top of the window. This will place the snippet into a mini-editor for you to try out. You can TAB between the parameters and type over them to fill things in.
You can also see how your tool tips are being used. If you’re satisfied, click “OK” and you’re done. To use your new snippet, select it from the right-click menu like any other snip-pet. If you need to make any changes to it, right-click on it and select Properties. We’ve discussed “expansion” type snip-pets, but there’s also a “surrounds” type which let you literally surround a
highlighted block of code with that snip-pet. For in-stance, Toad Data Point comes with a surround type for commenting out a block of code. To create this type of snippet, follow the same
steps but change the Snippet Type to “SurroundsWith.” Use a param-eter of $selected$ to denote the selected code to be surrounded. Then anything before or after your $selected$ parameter will be in-serted into your code when you use the Surround With snippet.
SQL Editor

48
End User Training Toad Data Point
Query - SQL Editor
Last, but not least, is the Add Application Code feature. This feature will take the contents of your editor and format it to be used within your application code. For instance, if you’re building a Java applica-tion and the query you’ve just written will be used in it, the Add Ap-plication Code feature will format the SQL into code usable in Java.
To configure the feature, open the Toad Data Point options window and navigate to EDITOR > Application Code. You can select between C#, C++, Delphi, Java, Perl and VB.
Execution There are several different methods to execute queries in Toad Data Point: a single statement, as a script, the selected text and in an ex-ternal application. Lets begin with a look at the toolbar.
1) Execute as a script (F5) This execution method will send everything in the editor to the database, beginning at the top. If there are multi-ple statements in the editor, each will be executed and the result of each will be displayed on a separate tab in the Result Sets tab. 2) Execute selection or current statement (F9) With this method you can select a block of SQL code and only execute that piece. This is useful in many cases; for example, when you want to execute and verify the results of a sub-select. Using this method, you can also execute the statement located next to your cursor.
3) Execute from cursor Slightly different from the previous method, this method will not stop at the end of the current statement, but continue to the end of the script. 4) Execute in an external application This will open your SQL code in another application for execution. It’s useful for scripts with command line instructions (like SQL*Plus). 5) Current schema/user This is set to the currently connected user, by default. Choose anoth-er schema/user to set as current. When the SQL is executed, non schema referenced objects will try to resolve to this schema first. 6) Cancel If your query is running too long, use this button to cancel.
SQL Editor
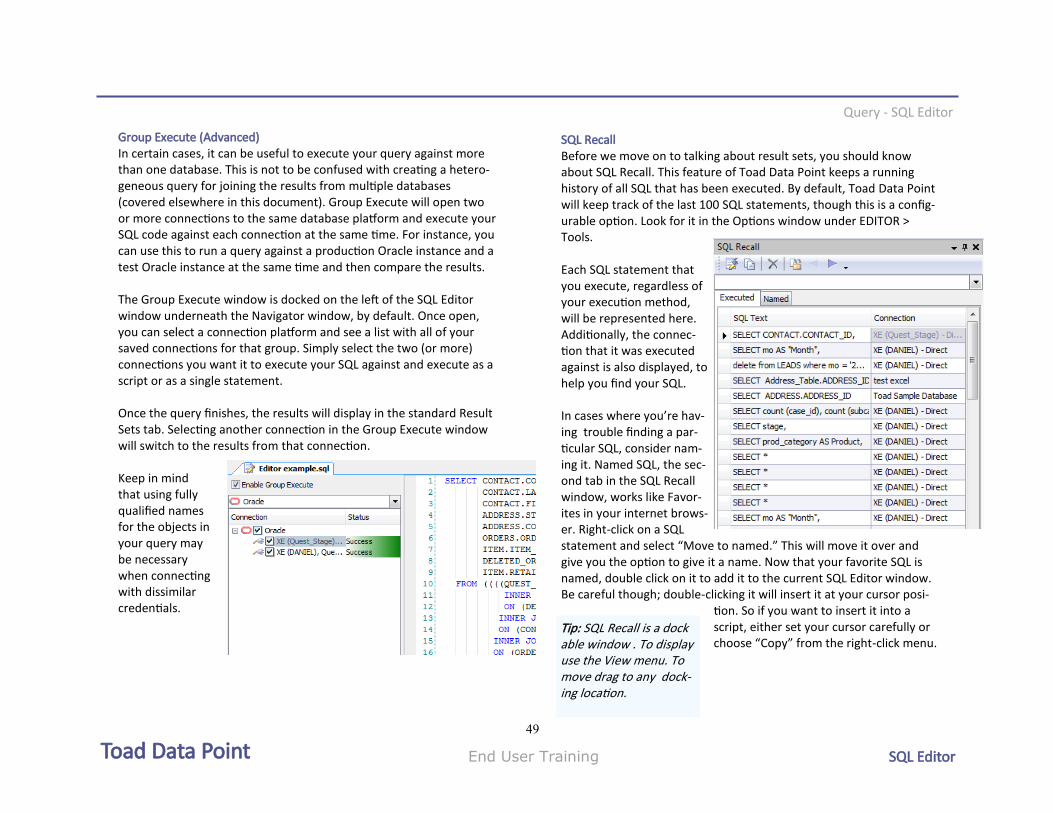
49
End User Training Toad Data Point
Query - SQL Editor
Group Execute (Advanced) In certain cases, it can be useful to execute your query against more than one database. This is not to be confused with creating a hetero-geneous query for joining the results from multiple databases (covered elsewhere in this document). Group Execute will open two or more connections to the same database platform and execute your SQL code against each connection at the same time. For instance, you can use this to run a query against a production Oracle instance and a test Oracle instance at the same time and then compare the results. The Group Execute window is docked on the left of the SQL Editor window underneath the Navigator window, by default. Once open, you can select a connection platform and see a list with all of your saved connections for that group. Simply select the two (or more) connections you want it to execute your SQL against and execute as a script or as a single statement. Once the query finishes, the results will display in the standard Result Sets tab. Selecting another connection in the Group Execute window will switch to the results from that connection. Keep in mind that using fully qualified names for the objects in your query may be necessary when connecting with dissimilar credentials.
SQL Recall Before we move on to talking about result sets, you should know about SQL Recall. This feature of Toad Data Point keeps a running history of all SQL that has been executed. By default, Toad Data Point will keep track of the last 100 SQL statements, though this is a config-urable option. Look for it in the Options window under EDITOR > Tools. Each SQL statement that you execute, regardless of your execution method, will be represented here. Additionally, the connec-tion that it was executed against is also displayed, to help you find your SQL. In cases where you’re hav-ing trouble finding a par-ticular SQL, consider nam-ing it. Named SQL, the sec-ond tab in the SQL Recall window, works like Favor-ites in your internet brows-er. Right-click on a SQL statement and select “Move to named.” This will move it over and give you the option to give it a name. Now that your favorite SQL is named, double click on it to add it to the current SQL Editor window. Be careful though; double-clicking it will insert it at your cursor posi-
tion. So if you want to insert it into a script, either set your cursor carefully or choose “Copy” from the right-click menu.
Tip: SQL Recall is a dock able window . To display use the View menu. To move drag to any dock-ing location.
SQL Editor

50
End User Training Toad Data Point
Query - SQL Editor
Working With Results The result of your queries will be displayed below the editor window in the Result Sets tab. Each executed statement will have its results displayed in a separate tab. However, if you execute a script with sev-eral statements, you will have a single result tab with a navigator win-dow attached to the left.
From within the results tab there are several options for working with your data. You can export it, copy it, change it, group it, sort it or just simply view it. To edit your data, click on one of the cells. If you changed the default configuration, you may need to double-click on a cell. As soon as you exit a cell, your edit will be posted back to the database. Each data type has its own miniature editor, so that when you’re editing simple CHAR data, you’ll have a text editor but when you have a DATE data type you'll be presented with a calendar popup. So regardless of the data type you’re working with, you’re covered. To export your data, try using the One-Click Export buttons on the toolbar (also available from the right-click menu). These allow you to
export your data to several pre-defined formats with a single click, saving time. 1) Export data to an Excel file This button will send the contents of the active Result Sets grid straight to a Microsoft Excel file with three different file type options: XLS, CSV and HTML. A dialog will appear after the results are saved with a link to the location of your new file. 2) Export data to an Excel instance In contrast to the previous button, this button will send the data to Microsoft Excel and open the document. It’s a bit of a shortcut over the pervious button if you know that you’re going to work with the data afterwards. If you click on the downward-pointing arrow to the right of the button, you’ll have an option to send the data to a specific cell in an already open Microsoft Excel document. So if you want to insert your records to cell D:7 of your Microsoft Excel document, this is the option for you. Just make sure you have that cell selected be-fore you click the button! 3) Export data to an Excel pivot table This is a nice shortcut for getting that pivot table started. Note that you can also choose to create the new pivot table beginning at a cer-tain cell in your Microsoft Excel document as well. 4) Export data to an Excel linked query You may find that its more convenient to distribute your data via a refreshable Microsoft Excel file; unfortunately, it’s not always easy to set that up in Microsoft Excel. With this button, you can bypass a lot of that setup and let Toad Data Point configure it for you. Your query, connection information and the initial data from your query will be sent to Microsoft Excel. You may notice that you still have the options to send it to an active cell, or a pivot table as well.
SQL Editor

51
End User Training Toad Data Point
Query - SQL Editor
Copying Data Copying data from the grid is fairly straightforward, though there are a few options to consider. From the right-click menu, you’ll notice there are two options: Copy Rows and Copy Cells. The standard copy method (supported by the Windows hotkey CTRL+C) is to Copy Cells. Begin by selecting one or more cells and then choose Copy Cells form the right-click menu. Keep in mind that Toad Data Point supports the ability to multi-select several non-contiguous cells, giving you great flexibility in copying only the data you’re interested in. To multi-select, hold the CTRL key while selecting cells. Similar to Copy Cells, the Copy Rows option will copy the entire row for a selected cell. Once you choose one of these options, you’ll be presented with this screen below. These options will give you further control over how your data is copied. If you always choose the same option, check the “Do not prompt me again” checkbox to always use that option. You can reset this dialog later from the Options menu.
“Send To” menu This menu gives you quick links to get data into one of several Toad Data Point reporting tools. These tools are covered else-where in this document. Working with Data The Toad Data Point data grid is the same grid that’s found in the Database Explorer and therefore has all of the same great features of grouping, sorting and summarization. See the Database Explorer section for more information on these features. Send to Report Below the Result Sets tab, is the Wizard Bar. The Wizard Bar is a sug-gestive shortcut toolbar that changes based on context. In the case of the SQL Editor, it offers options to learn how to use the SQL Editor, open files, execute files, add the current file to a project and send the data to a report. This last button will send the data to a Microsoft Excel file which is opened inside of Toad Data Point (by default). This makes quick tasks like saving data to a Microsoft Excel file for quick distribution via email extremely simple. Toad Editor Files When you save your SQL query, you can save it as a simple *.SQL file or as a more advanced *.TEF file. The Toad Editor File (*.TEF) offers the ability to save the results of your query with the query itself. As opposed to a *.SQL file where you merely save the SQL code itself, the *.TEF file will (optionally) remember the data of previous execu-tions in addition to the SQL code. This can be useful for comparing the results of a query over time. Simply open the *.TEF file and exe-cute it again to see the new results in a new tab, on top of the results of your last query execution.
SQL Editor

52
End User Training Toad Data Point
Messages & Explain Plan Tabs These tabs are covered in the Query Builder section under Query Execution. Pivot & Chart Tab Standard Pivot tables and charts are cov-ered extensively in the Data Reports sec-tion. What’s unique about this tab is that you don’t need to export your data to a separate window. Here in the Pivot & Chart tab, you can see the direct results of your query represented in these forms. This can be very useful as you analyze data during the process of refining your query.
To get the data into the tab, simply open it. If your query is paused (probably because you changed the default op-tion and applied the thresh-old to the SQL Editor), then you’ll need to finish running the query, first. To do this, right-click on the data in the Result Sets tab and click “Read all Rows.”
With all of the data fetched from the database, you can now open the Pivot & Chart tab. Creating your pivot and chart is as simple as se-lecting items from your Pivot Grid Field List and dragging them onto the pivot grid surface. With all of your data arranged in the pivot, the chart will automatically update. You can switch the chart type to pie, line, bar and more from the dropdown menu.
Query - SQL Editor
SQL Editor

53
End User Training Toad Data Point
Editor Exercises Exercise 1 Purpose - To demonstrate how to use the SQL Editor. Scenario - You know SQL pretty well and need to build a query and validate the results quickly. Exercise Steps: 1) Connect to the Toad Sample database and open an editor using
the standard bar tool button or from the Tools menu.
2) Type “Select * from” followed by Ctrl+ Period. This will give you a list of tables from the current connection. Select the ADDRESS table.
3) After selecting the ADDRESS table add an alias name of “a”. Your SQL should look like this —> “select * from address a”. Replace the wild card symbol “*” with the alias “a” followed by a period. This will display all the column values available for the column list. Choose a.address_id.
4) Your SQL should look like this —> “select a.address_id from ad-dress a”. Press F5 and view your result set in the grid.
5) Add a semi-colon to the end of the SQL statement. On a new line create a similar SQL statement querying from the contact table. End the statement with a semi-colon.
6) Press F9. Notice that you now have a second result set contain-ing the contact table rows. Press F5. You will now have a single result tab containing two result sets. Depending on what you are working on, each execution type will be very useful.
7) Select the orders table from the Object Explorer. Right click and choose Generate SQL | to Clipboard | Select statement. Paste into the editor.
Editor—SQL Editor
8) Format the SQL by pressing the Format SQL tool button or right–click action.
9) Click on the editor’s Navigation window. It may be minimized. If so, find the word Navigator written vertically on the left side of the editor. (Not the Navigation Manager.) Click on it and it will expand. To pin it, push the pin icon. There will be a keyword for each statement listed; for this exercise there will be 3 selects listed. Double-click on the middle one and notice that it will move your curser to that statement.
10) Click the “Add to Project” wizard button at the bottom of the editor. Enter the name “Sample.” This will save the file and add to the Project Manager.
SQL Editor—Exercises

54
End User Training Toad Data Point
Exercise 2 Purpose - To demonstrate how to use some advanced features of the SQL Editor. Scenario - You know SQL pretty well and need to build a query and validate the results quickly. Exercise Steps: 1) Connect to the Toad Sample database. Open the sample.sql script
from the last exercise by double clicking on it in the Project Man-ager.
2) From the View menu, choose the Code Snippets action. This will display the code snippet docking window. Expand the SQL (ODBC) | Generic Templates and double click on the Table snippet. This will add the Create Table template into the editor.
3) When you first add the template to the editor, several keywords are highlighted. Enter the value for the first highlighted keyword. Using the Tab key will move you to the second keyword and so on. This makes for rapid building from a template. Pressing F9 will execute that statement and create the table. To view, you can go to the Object Explorer. You will need to press F5 to refresh, as objects made in the editor are not automatically refreshed.
4) Let’s create a snippet. Click on the “Favorites” snippet folder. Right click and choose “New Snippet.” Enter the name “Region.” The snippet editor will open. Type “—region”. Move to a new line. Right click and choose Snippet Tokens | Selected Token. Right next to this select the Snippet Tokens | End Token. On a new line type “—endregion”. Your snippet will look like this.
--region
$selected$$end$
--endregion
Change the snippet type to SurrondsWith. This is located at the bottom right. Click “OK” to close.
Editor—SQL Editor
5) To use the region snippet, highlight a complete SQL statement. To apply the new snippet you can double-click on it in the docked window, or right-click and choose Code Snippets | Sur-rounds With. Using the latter method will bring up a snippet bar that has the same folder names as the docked window. Double-click to navigate and select the region snippet.
6) Notice how the SQL statement is now surrounded by the region comments. Click on the collapse symbol at the first part of the comment. This will collapse the SQL providing more space. Click again to expand.
7) Open up SQL Recall from the View menu or press F8. Click the pin to keep the docked window expanded. Place your cursor at the end of the file. Go to the SQL Recall window and double click on a statement. This will load this statement into the editor.
8) Right click on a statement in the SQL Recall window and choose “Move to Named.” Enter a name for the statement. You can also add this to the code snippets from the right-click menu.
9) In the editor type Ctrl+N. This now lists the favorites folder for this connection type and your named SQL is available for selec-tion.
10) SQL parameters can be used in the editor. Either positional or named are fine. To use a SQL parameter use a “?” for positional or parameter symbol plus name. Type the following into the editor:
Select * from region where region_id = ?;
11) Press F9. A SQL parameter window will show. Enter the value 2 and click “OK.”
12) Save the file as a Toad Editor File. From the file menu choose save. Enter a name and change the file type from *.SQL to *TEF. Click the “Add to Project Manager” button. Close the editor.
13) Find the file just created in the Project Manager. Double-click to load. Notice that the result sets have been saved. This is a good way to save an on going SQL design project.
SQL Editor—Exercises

55
End User Training Toad Data Point
Reports - Report Types
After gathering the data from the appropriate data sources, you will need to transform the data into useful and easily readable formats for consumers. Toad Data Point provides a variety of report and de-ployment formats for your reporting needs. These include Microsoft Excel, Toad Data Reports, Toad Pivot Grids and Toad Charts.
Report - Data Reports
Report—Data Reports
Excel Integration
Master Detail Reports
Pivot Grids & Graphs

56
End User Training Toad Data Point
Tip: Use the Export Wizard if you need to specify column delim-iters and advanced field options when exporting data.
Reports - Excel Integration
Microsoft Excel Integration From any data grid, you can export to Microsoft Excel with one click in a variety of formats. Use the One-Click toolbar or right-click on the grid you want to export.
To export data to file, select the range of data to export or click any row to export all data. The One-Click file type exports the data to an Excel, CSV or Html file and saves under a default name in the default export folder.
.
Select Excel instance to ex-port the data to a new work-sheet of Microsoft Excel.
To export the data to a specific cell or worksheet, first open Microsoft Excel and select a cell. Then select the “Excel Instance at active cell” option. The same choices are available for exporting the data to a Microsoft Excel pivot table.
If you need Microsoft Excel to refresh the data, use the Linked Query export types. Here the query is sent to Excel along with connect infor-mation and the results re-trieved in Excel. To refresh the data in excel, use the refresh data icon from the exter-nal data menu or tool bar from within Excel.
Report—Excel
Tip: Before you can export to Excel, the Primary Interop Assemblies (PIAs) for your version of Excel must be in-stalled. A prompt from the application will tell you how to do this.
File
One-Click Export
Instance
Pivot
Linked Query
MS Office 2007
2003

57
End User Training Toad Data Point
Data Reports The Toad Data Reports designer helps you build label, multi-column, table, and master-detail reports. From any grid, right-click and choose “Send to | Data Report Designer.”
Reports - Data Reports
The Report Wizard will guide you through the basic actions needed to set up a data-bound report.
The Data Report Wizard opens up the designer. Here you can cus-tomize the report layout. The designer has three modes: design, preview and html view. Tog-gle between these modes by clicking on the tabs at the bottom of the designer. When you are satisfied with your report you can export it to PDF, HTML, MHT, *.XLS, *.CSV, text or image formats from the toolbar on the preview tab. The Toad Data Report can be saved as a *.TDR file. The stored query in the report is executed each time you open the report in Toad.
Report—Toad Data Reports
Design
Preview
Export

58
End User Training Toad Data Point
Reports - Data Report Designer
Data Report Designer When you enter the designer from the wizard you will have a header, detail and footer band, column header labels and column data labels. Click on the preview to see the default design. To customize the report, the Data Report Designer groups its tools into four tool windows.
Field List Contains the fields available in the data set which you can include in the report.
Toolbox Contains a set of controls to customize the for-mat and display of the report.
Explorer Contains a list of items currently included in the report.
Property Grid Contains the properties that can be modified for the selected items in the report.
The field list tool window contains the fields from the result set. The Data Report Wizard will ask you what fields you want in your report and add a label object for each field. You can add a calculated field by right-clicking on the column in the Field List.
Field Formatting Once you have moved a data column onto the designer, there are many options to format. To access format options, click on column label and then click on the arrow.
Format data using any of the given formats for date/time, number, percent, currency or build your own format string.
Basic summary functions such as sum, count, and avg can be set from the Sum-mary editor.
Report—Toad Data Reports
Field List

59
End User Training Toad Data Point
Reports - Data Report Designer
Use the Explorer window for basic navigation. It contains a list of all objects in the report. When clicking on an object, the details are displayed in the Properties window and the object receives focus in the designer.
Report Bands Data reports have sections for header, detail, and page footers. Placing your objects in these bands, designates where they appear in the report (i.e.— placing a label in the header band will show at the top of the report). Additional bands can be added by right-clicking on a band. Change the height of the bands by dragging in the margin.
Header Band
Detail Band
Footer Band
Move Band
Properties define the attributes of any single object. The properties tool window shows all properties for the focused object. Often you will want to use the same settings for many objects. Instead of setting each object, cre-ate a style collection.
Style Collection Access the style editor by clicking on the Styles Collections in the Properties window. Create a style category by pressing the add button. Define the color, font, border, padding, etc. Predefined cat-egories for data field, odd and even data fields, caption, page info
and title can be edited in the styles editor. Setting the style for an object takes less time to design and make changes.
Report—Toad Data Report
Properties Explorer

60
End User Training Toad Data Point
Reports - Data Report Designer
Tool Box
All items in a data report are a type of control. Available controls are listed in the toolbox window. To add a control to your report, click on the control in the toolbox. To place onto the design surface, drag to or click the desired position. To change the attributes for any control, enter values into the prop-erties tool window. The most common input for a control is available from a right arrow at the top of the control.
Table The table object can be used as a container for several column objects. Here you can specify the row and column sizing. Right click to insert row and column cells. Add column data by dragging or click-position from the Field List window.
Label The label object is the most common object type used for display-ing text and column data. The Font can be changed in the Proper-ties grid as well as formatting, color, etc. Picture The picture object can be used to import a graphic. The default graphic for the report can be changed to your logo in the Op-tions under Database > Diagramming > Reporting.
Chart Enter properties for a Chart through the Chart Wizard. Assign the axis values in the Series Bind-ing tab. Choose a data column for the argument and value proper-ties. The Chart will display in the designer. To change values, access the Chart designer through the right arrow at top of object. All Chart properties are also con-tained in the properties tool win-dow.
Pivot Grid To configure a pivot grid, click on the right arrow at the top of the object. Set the data source from the top drop down. Run the pivot design-er from the bottom link. Use the de-signer layout to drag columns to row,
column, and data areas. Format or add functions in the designer field section.
Report—Toad Data Reports

61
End User Training Toad Data Point
Reports - Data Report Types
Data Report Types The data report designer helps you design the most common types of reports, such as multiple column, group summary, and master detail reports. Toad Data Point includes samples of each of these report types. To access, double click on the Toad Sample database connection. Then from the Project Manager double click on the Customer List, Items Per Warehouse, or Customer Orders report.
Multi-Column Report A multi-column report can be built by using a table object to hold the values for one entry. The number of columns, direction, etc. is set in the detail band. Access this from the right arrow in the detail band. See the Toad Sample Customer List report for example.
Group Summary Report
To group and sum data per page, first set the columns you want to group by in the Wizard.
Master Detail Report
A master detail report can be built from a query in the Master Detail window or any group by query. Set the grouping columns and any summary functions in the data designer wizard.
Place objects in the group or detail band. Add group header or footer bands by right clicking on an existing band. See Toad sample report “Items to Order” for an example.
Add detail or group bands where desired. Use the label object summary editor for group and report totals.
Reports—Toad Data Reports

62
End User Training Toad Data Point
Reports - Data Report Export
Data Report Exporting and Maintenance
After you have designed your Toad Data Report, you can save it with a *.TDR extension. The design layout, connection type, and query are saved in the file. A report can be refreshed on any connection of the same type. Connection type, not connection details, are stored in the report file. Opening the file in Toad Data Point, executes the query and displays the report in preview mode. From the preview window, you can print or export to PDF, HTML, MHT, rich text, Microsoft Excel, *.CSV, text or graphic format. You can also attach an exported report to an email and send from the same window.
You may want to edit your report after saving it. To edit an existing report, open to preview, then press the Design Report tool button. To change the query, select the “Edit underlying query” tool button. After editing, you can return to the designer and refresh the report.
Report Manager
The Reports Manager, available from the tools menu, is a handy organizer for your Toad Data and Excel reports. Reports are organized by connection type. The sam-ple reports are listed here under ODBC. A wide variety of reports are bundled with Toad for general database infor-mation. From the right-click menu, create new folders, add existing reports, edit a re-port in the designer, or edit the query. Search for a report from the search bar. Reports located in the Toad share direc-tory will be displayed at the bottom. Re-ports can be easily saved to the Shared directory from the designer window and will be accessible to all Toad users.
Project Manager
Reports can be added to the project manger and organized by pro-ject. You can open, design, or edit the que-ry from the right click menu when a Toad Data Report has focus. Opening a report causes an execution of the query on the current connection. Make sure you are connected to the correct connection before opening a Toad report.
Report—Toad Data Reports

63
End User Training Toad Data Point
Reports - Data Charts
Chart Reports Charts are a very effective way to visually represent summarized da-ta. To design a report with a chart only, right click from any data grid and “Send To | Chart Designer.”
This will open the Chart Wizard. The wizard guides you through the essential questions to design a chart. Advanced users may enter data through the navigation bar.
Choose from 43 different styles and colors.
Charts display a series of summarized data. The data used in your chart is from the grid you right clicked on. At the very minimum, you need to set the values used for the X and Y axis. Use the Series Bind-ing tab in the Data section, to set the columns used for argument and values (X and Y axis).
When you finish the wiz-ard it will open the Report Designer. Here you can add any additional report objects and save or ex-port your report. Add your report to the Project Manager, send to the Toad Network Share loca-tion or email the report from the Wizard Bar at the bottom of the design-er. A chart report is saved
with a *.tdr extension. When later opened in Toad it will refresh the data by executing the original que-ry and graph the new data. The report uses the cur-rent connection and will only execute on the same type of database connec-tion. To export the data in a common format, such as pdf, use the export docu-ment menu.
Report—Chart Reports

64
End User Training Toad Data Point
Reports - Pivot Grids
Pivot Grid Reports Looking at data in several dimensions such as sales by region, sales by sales rep, sales by product category, sales by month, etc. is essen-tial for a data analyst. Pivot grid/tables provide this functionality and can be used in reports.
To build a pivot table, right click from any data grid and choose “Send to | Pivot Grid.” The con-nection type, query, and data results will be sent to the pivot grid designer.
Using the field list, drag the columns to the row, column and data area. Or use the “Add To” button and area drop down. The resulting pivot table will be displayed.
Several pivot actions are available from the right-click menu or toolbar.
Change the summary function on a column using the Setup Grid editor.
Or, set the cell format string from the Setup Grid editor. You can change the query using the “edit underlying query” action. Display a chart using the chart action. Export the pivot grid from the print preview window.
Save your pivot as a *.TPG file with or without the data. If the data is not saved, the query will be executed when you open the file. Re-fresh the data from the right click menu at any time.
Report—Pivot Reports

65
End User Training Toad Data Point
Reports—Report Exercises
Report Exercises Exercise 1 Purpose - To demonstrate how to build a Microsoft Excel report. Scenario - You need a report that shows how many address there are for each region and the IDs of each region. Exercise Steps:
1) Connect to the Toad Sample database by double-clicking the Navigation Manager.
2) Multi-select tables REGION and ADDRESS, right-click and choose “Send to Query Builder.”
3) Select region.region_name and address.address_id columns. This query will list the address_ids and region they are in.
4) Execute the query. Click the Excel Pivot Table tool button or right-click and choose Quick Export > Excel Instance Pivot Table. (For the right-click you need to have focus on the result set.) This will open a new instance of Microsoft Excel, send the data to Mi-crosoft Excel and open the Pivot Table Field List.
5) Drag the region_name to the row area. Drag the address_id to the data area. Close the field list. This will display the total num-ber of addresses per region.
6) We now want to add a list of region IDs and names to the report. Click on cell D4.
7) Go back to Toad and remove the ADDRESS table and run the query. Export the result set to the active cell by using the “Excel Instance at active cell” tool button or right-click menu item.
8) This gives you a report built from two result sets.
Exercise 2 Purpose - To demonstrate how to build a Toad Data Report with grouping bands and styles. Scenario - You need a report that lists the order quantity totals for contact numbers 2 and 3. Exercise Steps: 1) Connect to the Toad Sample database by double-clicking the
Navigation Manager.
2) Select tables CONTACT, ORDERS and ORDER_ITEM. Right-click and choose “Send to Query Builder.” Select columns Or-ders.Order_id, Orders.order_date, Contact.Contact_id, Con-tact.last_name, Order_item.Item_id, Order_item.Quantity.
3) Locate the contact_id column in the bottom part of the query builder and add the WHERE condition “IN (2,3)”. (Note: Do this by invoking the WHERE condition editor.) Choose the IN opera-tor and manually type ‘2,3’. (The parentheses will be added by the program.) Run the query and review the results.
4) From the Results tab, right-click and click “Send To Data Report Designer.” In the Data Report Wizard add all of the columns to the report.
5) Add the following grouping levels: (Item_id and Quantity will be the detail columns.)
CONTACT_ID, LAST_NAME
ORDER_ID, ORDER_DATE
6) Check to sum the quantity column. Click through to the end. This will open up Report Designer.
Cont’d
Report—Exercises

66
End User Training Toad Data Point
7) Now we want to define some styles for our report. Click on any data field, then go to the properties window. Scroll down until you see the Styles Property. Click on the collection to invoke the editor.
8) To add a new style, click on the green plus sign at the top left. Enter the name “Contact” in the name property on the right. In the Background Color, use the drop-down custom tab and choose Orange. In the Font property, enter Font Style Italic and type in Tahoma for the font.
9) Add the following three styles;
Name: Orders Name: ItemsEven Background Color: SteelBlue Background Color: Transparent Font: Tahoma, Bold Border Color: 175,190,216 Name: ItemsOdd Background Color: 239,243,250 Border Color: 175,190,216 10) Now we want to assign these styles to the fields. Set contact_id
and last_name to the Contact style. To do this expand the Styles property. Click on the Style property and select Contact. Set order_id and order_date to the Order Style.
11) To set the detail band columns to alternate row color, set the Evan Style property to ItemsEven and the Odd Style property to the ItemsOdd style. Do this for columns item_id and quantity.
12) Change the date format by clicking on the right arrow of or-der_date. Click on format string to bring up the editor and se-lect DateTime. Click the format of your choice.
13) Click on preview to view the report.
14) Continue to add objects to your report or set alignment and for-matting properties until your have the design you want.
Reports—Report Exercises
Exercise 3 Purpose - To demonstrate how to build a Toad Chart from a dataset. Scenario - You need a graph report showing how many orders there are per region. Exercise Steps: 1) Connect to the Toad Sample database by double-clicking the
Navigation Manager.
2) Multi-select tables REGION, ORDERS and ADDRESS, right-click and click “Send to Query Builder.” Select columns region_id and order_id.
3) Remove the shipping_address_id and address_id join. This is a database reference that is not needed for the query. Select the aggregate function of sum to the ORDERS column to give you the total of ORDERS. Click the Group By row for the region name. Run the query.
4) If the result looks correct, right-click and choose “Send To | Chart Designer.” This will open up the Chart Wizard.
5) Choose bar chart type. Click through to the Data section. Select the Series Binding tab on this page. Choose Region_name for the argument. Select Express01 for the value. This is your total of ORDERS for each region. Click “Finish.”
6) This will put you in the Report Designer. Change any property here or add objects. Press “Preview” to view the report. Select save on the Preview window to export the report as PDF.
7) Note: If you want to go through the Chart Wizard again, click back on the designer tab at the bottom of the window. Click on the chart. On the bottom of the property window you will see a hyper-link to open the wizard.
8) Click on “Add to Project” to save the report and add to project manager.
Report—Exercises
67
End User Training Toad Data Point
Reports—Report Exercises
Exercise 4 Purpose - To demonstrate how to build a Toad Pivot Grid from a da-taset. Scenario - You need a graph report showing sales totals per region by year and quarter. Exercise Steps: 1) Connect to the Toad Sample database by double-clicking the
Navigation Manager.
2) Multi-select tables REGION, ADDRESS, ODERS, ORDER_ITEM and ITEM. Right-click and click “Send to Query Builder.” Select col-umns region_name and order_date.
3) Remove the shippind_address_id to address_id reference by right-click, remove.
4) Add a calculated column by invoking the calculated fields editor from the toolbar. Enter the name ‘Sales Total’ into the name field. Press the field definition dropdown and build this expres-sion.
ITEM.RETAIL_PRICE * ORDER_ITEM.QUANTITY
Attach this calculated field to a table. Click “OK” to close editor.
5) Execute query. You should have almost 44,000 rows. Right-click on the result set and choose “Send To | Pivot Grid.”
6) Drag the region_name field to the row area. Drag the Or-der_date field to the column area. Drag the Sales Total to the Data area. You can also use the “Add To” button on the field list.
7) Right-click and choose the SetupGrid. Select Order_Date. Click on the “Group Dates On” dropdown. Select Year and Quarter.
8) Select Sales Total. Open up the cell format editor. Choose the Custom tab and select the last format string.
9) Pivot grid now shows order totals by year and quarter by region.
10) Expand the graph to view the data graph. From the toolbar of the graph deselect grand totals. (If selected)
11) Right-click and choose “Edit underlying query” to view the query that generated the data.
12) Right-click to refresh the data by querying the database.
13) Click on “Print” to export the pivot grid in various formats: PDF, HTML, Microsoft Excel. Save file as *.TPG file for later use.
Report—Exercises

68
End User Training Toad Data Point
Automation - Basics Automation
Every business wants to do more with the same (or fewer!) re-sources. Automation can help you schedule repetitive tasks, leaving you more time to do other things. You can schedule long running queries to be run at non-peak data-base times, or import/export data to ready your data sources before you arrive each morning. Monthly reports can be generated and emailed or FTP’d to recipients.
Workflow From any report window, send the report to the automation design-er from the Wizard Bar button.
This will automatically create a script that refreshes the report and attaches it to an email. Fill out the email information and test the script.
Script
Schedule
From the automation designer, send to the scheduler by clicking the Wizard Bar button on the bottom right. The sched-uler sets up the task to be executed by the Microsoft Windows scheduler. Enter frequency and logon password.
Task status and management of tasks can be done from the main Toad Scheduler window. For heavy automation work, install Toad Data Point on a Microsoft Windows server for automation use only. When running automation tasks, Toad runs in non-visual mode.
Automation

69
End User Training Toad Data Point
Automation - Designer
Automation Designer
The Automation designer can be opened from the Tools menu or Automation document grouping button.
Activities Automation activities are available from the toolbox. There are three groups: Database, File and System activities. Click or drag to add to your script.
Script Settings
Script settings contain the name of the script, exception handling, and logging information.
Exceptions
When an exception is thrown during au-tomation execution, you can send an email to notify you of the issue. If logging is enabled, the log file will be attached.
Logging
Logging the steps of your activities can be done in basic or verbose mode. Set the level and file loca-tion in the script settings. To debug your script use verbose mode. Dur-ing script testing the log data is displayed in the output window. Report files can be viewed by click-ing on the hyperlink.
Edit Activities Edit an activity by double clicking on the activity. This brings up the activity editor. Or edit the activity values in the property tool window on the right.
Automation

70
End User Training Toad Data Point
Execute script executes the contents of a script. If there is a result set, it can be assigned to a script variable and ac-cessed in the Loop Dataset activity
Automation - Database Activities
Automation Database Activities
A database connection is necessary for any data retrieval. A connection is automatically added when choosing any of the other database activities and points to the current connection. Change connections in the activity editor and choose from any you have defined in the Connection Man-ager.
Validation Any time there is missing input,
a red validation sign will be displayed. The drop down hint will provide detail on what data is needed. Enter missing data by double clicking on the activity.
Select to file takes any *.SQL or Query Builder file and executes the SQL. The results are exported to Microsoft Excel, CSV or HTML format and saved in a path you designate. Excel options of exporting to named region or cell loca-tion are available from the File Option attribute of the activity. File names can be unique by appending a date suffix.
Select to Editor with Results executes the SQL in a saved Toad Editor File (*.TEF). The result set is saved in the file. You can choose to delete prior saved results or append the new result for comparisons.
Export Wizard invokes the Toad Export Wizard. Enter all export attributes and save to a Toad Export template (*.TXP). When you build an export template, it is added to the Project Manager and appears in the Export activity list. To edit the values, choose “edit selected template” from the dropdown.
Import Wizard works the same as the export activity, building and saving a Toad Import template (*.TIP). The Ex-port and Import templates can also be used from the Tools menu to edit or execute.
Toad Reports can be refreshed (query executed against the associated con-nection) and exported to *.PDF, HTML, *.RTF or *.MTF formats. If a unique file name is needed, append a date time
Toad Pivot Grid activities refresh the pivot grid of an ex-isting Toad Pivot Grid file (*.TPG) and export as *.PDF, Microsoft Excel, HTML and *.RTF document types.
Automation

71
End User Training Toad Data Point
Parallel - Run two or more activities in parallel. After add-ing a parallel activity to the design pane, you can right-click it to add additional branches for parallel activities.
Automation - File and System Activities
Automation File Activities Automation System Activities
Copy File copies, renames, appends suffix or moves a file.
Delete File deletes one or more files. Use the file collec-tion editor by pushing add and then clicking on the File Name property.
Log Comment adds a comment to the script and log file. You can dereference variables by using the ‘#’ symbol. (i.e.— The value of variable Month = #Month#)
Zip Files by entering collection of files and providing ar-chive name. Zip files can be password protected.
Find and Replace text within a file. Variables can be used for find or replace values. Text files can be used as tem-plates and with find and replace customize items such as dates and salutations.
Send Email is the most common form of deployment for automation. The email activity uses SMTP. Reports gener-ated in the script are easily found through the attachment editor. You can use a file for body content and attach the log file.
FTP your reports with the FTP activity. Upload or down-load files from the same activity.
Run Program executes a run command with arguments and uses common verbs such as print. Set a cancel value if you want to cancel the execution after a specific num-ber of minutes.
Set Variable is used to define and set the value of a varia-ble. Give the variable a name and set it’s value using the expression builder. Test an expression by pressing the test button.
If Condition - Execute activities conditionally based on the value of a variable expression. For each condition you can define unique activities. To use this activity you must de-fine a variable in the automation script with the Set Varia-ble activity. Delete or add conditions by right-clicking.
While—Execute activities while a variable expression is true. The activity ends when the condition becomes false, or when it completes the selected number of loops.
Loop Dataset—Execute activities on each row of a data table. The data table must be the result set from an Exe-cute Script activity that occurs previously in the automa-tion script. You can reference a column in the data table. See exercise for example.
Templates - Any activity or connection activity and child activities can be saved as a template. This saves the activity de-tails for use in other scripts. To save as a
template, right click and provide a name. Templates are added to the template section. Click to add to script.
Automation
72
End User Training Toad Data Point
Automation - Exercises
Automation Exercises Exercise 1 Purpose - To demonstrate how to automate and schedule basic tasks. Scenario - You need a Microsoft Excel report of current regions and addresses emailed to your manager every week. Exercise Steps: 1) Save the following statements to a single file. Select * from region; Select * from address; 2) Open the Automation window by clicking on Automation docu-
ment tool button or using the Tools menu. 3) Double-click on the Script Settings to invoke the Activity Editor.
Enter your email address in the To and From properties. Enter your SMTP server address. Change port if not the default. Click “OK” to close. This will set up the exception email. If you do not want an exception email, change the Email on Error property to False and Show Warning to False.
4) Click on the “Select To File” activity in the toolbox. Double-click on the activity in the design area to invoke the Activity Editor. (You can also enter values in the activities property window on the right.)
5) Select the dropdown for the SQL Script property. Browse to the file made in step one and select. Click the dropdown again and notice that the file, just selected, is in the list. All files added in the activity are automatically added to your Project Manager under Queries. All files in that folder are listed for this activity.
6) Click the file options. The Excel file type is selected by default. Click the browse button at the end of the filename box to select a directory. Enter file name. Check the Add/Date suffix and Choose Date (YYYY-MM-DD) and click “OK.” This finishes all val-ues needed for Select To File activity.
7) Double-click on Connection activity (note: all activities that need a database connection must be a child activity of the connection it will use). Select the Toad Sample database connection. The connection activity should select the current connection or last connection made.
8) Add an email activity by clicking or dragging from the toolbox on the left.
9) Double-click on the Email activity to invoke the Activity Editor. Confirm the To, From, and Server values have been entered. Click on the attachments. Any files that are generated by the automation script will display on the right. Click “Add” to move the file to the left side. This will now be added as an email attachment. (Note: The Date format string will be replaced at run time.) Close the window by clicking the X. Enter your Subject and body of the email.
10) To test your script, click the “Test” button on the Wizard Bar or “Test” button on the toolbar. It will ask you to enter a file name and path.
11) First, the automation script is compiled, then executed. All re-sults are displayed in the Output window. Failures are flagged with a red icon. All successful steps display the icon of the activi-ty used.
12) Review the output. Click on the Microsoft Excel file generated. It will display the Microsoft Excel file in Toad. Notice that the re-sults of each SQL statement are in a different worksheet.
13) Double-click on the Script Settings and change the Logging level to “verbose.” Run the script again. Review the output and see the additional data added when using verbose logging. This will be especially helpful when debugging issues.
14) To schedule the automation script to run at a later time, click on the “Schedule” button on the Wizard Bar.
15) When the Task window displays, enter your password using the “Set Password” button. On the Schedule tab, choose to run once two minutes from now. Click “OK.”
16) Check your email for confirmation of execution as well as the status of the Job Manager window.
Automation—Exercises

73
End User Training Toad Data Point
Exercise 2 Purpose - To demonstrate how to use the Toad report, zip and copy file automation activities. Scenario - You need to refresh and export the Customer List and save to network backup drive. Exercise Steps: 1) Connect to the Toad Sample Database. Open an automation
window by clicking on Automation document tool button or us-ing the Tools menu.
2) Drag or select the Toad Report activity from the tool box. Dou-ble click on the activity. Click the Toad Report drop down and select the CustomerList.tdr. This is a sample Toad Report includ-ed with the product.
3) Click the Save Report As property. Choose the export type. PDF is the default. Select the directory and export file name.
4) Add a Zip File activity by dragging or clicking from the toolbox. Double click on the activity and enter the Archive File directory and name. Click on the File Collection and choose the file output from Step 3. It should be displayed in right side of attachment editor. Enter a password for the Zip File.
5) Add Copy File activity to script. Enter Source File name, destina-tion folder, copy name and suffix.
6) Save and test the script. 7) Click the link in the output window to open zip file. Click on file
and enter password to open.
Exercise 3 Purpose - To demonstrate how to use the row count variable and If activity. (Available in Toad Data Point 2.5 and above) Scenario - You need to build a report and perform a specific activity only if there are rows returned from the query and do something different if there are no rows. Exercise Steps: 1) Drag or select the Select to File activity. Double click on the data-
base connection and select the Toad Sample database. 2) Double click on the Select to File activity. Enter the variable
name “rc” in the row count property. From the drop down of the sql script select the AddressesForSmithAndEvens.tsm file. Set the file options for export.
3) Add an If..Condition activity to the automation script by dragging or clicking from the Systems Activities section of the toolbox.
4) Double click on the If_Condition_1 child activity. Pushing the Condition property drop down will bring up the condition editor. Click the word Variables on the left side. It will display on the right side all variables that are defined in the script. Double click on the variable named “rc”. This will add to the condition ex-pression. Click on the Operators type and double click >. Finish the expression by typing 0 so the expression reads “rc > 0”. Click the test button to validate the expression. The expression will validate to False because the value of rc right now is 0. If an er-ror occurs it will be displayed in red.
5) Add a Log Comment to the If_Condition_1. Enter this string for the message. “The condition has evaluated to true. The Value of rc is #rc#” Note: The # symbols dereference the value of the variable.
6) In the If_Condition_2 activity, add this expression, rc = 0. Note: Variable names are case sensitive. Add a similar comment activi-ty. Run and test script logic and variable values.
Automation - Exercises
Automation—Exercises

74
End User Training Toad Data Point
Exercise 4 Purpose - To demonstrate how to use variables and the loop dataset activity. (Available in Toad Data Point 2.5 and above.) Scenario - You need to build a report containing the addresses for each region and put in a ZIP file. Exercise Steps: 1) Create two SQL files. One for each of the SQL below: Select * from region; Select * from address where region_id = :id; 2) Connect to the Toad Sample database and open an Automation
window by clicking on Automation documents tool button or us-ing the Tools menu.
3) We well need a variable to be used with the parameter in the SQL above. Add a Set Variable activity from the System Activities sec-tion of the toolbox. Enter the name “id” with value 0. (Note: The names are case sensitive so check to see the name matches the parameter name in the SQL above.)
4) Add an “Execute Script” activity by clicking or dragging from the toolbox. Enter the path to the script for the first statement above. Enter a name for the result variable, such as region. This allows us to use the results from this query as a variable in another activity.
5) Add a “Loop Dataset” variable from the System Activities section of the toolbox. Double-click on the drop down for the Data table property and select the region variable. (or name set in step 4)
6) Add a Set Variable activity to Loop_row_1 activity. For each row of the dataset we want to set the value of id to the column value of region.region_id. To do this, double click on the set variable activity and enter the name id. Enter the variable value as “region.region_id”.
7) Add a “Select to file” activity as a child activity of Loop_row_1. If it is added to the top of the script, just drag it below the Set Varia-ble activity. The Connection and Select to File activity need to be
a child activity of Loop_row_1. Enter the path to the second file created in step 1. Choose your export options. As a nice touch, have the file name include the name of the region_id to make the file name unique. To do this choose the directory path and enter the file name like this —>“region_#id#”. The “#id#’ will be replaced at runtime with the value of the variable “id”.
8) Add an Archive activity as the last child of loop_row_1. Enter archive name and for files to zip, choose the file “region_#id#.xls’ from step 7. 9) Save and run the script. In the Output window click on the archive file and open. There should be 5 files, each containing the address for the region number in the file name.
Automation—Exercises
Automation - Exercises

75
End User Training Toad Data Point
Export & Import
Importing data to and exporting data from the database is made as easy as possible with Toad Data Point. There are separate wizards for each, so we'll go through them separately.
Export Wizard The Export Wizard is found under the Tools menu in the Export sub-menu. There are three options here: Export Wiz-ard, Open Export Tem-plate and Execute Export Template.
Import and Export Templates are nothing more that a saved copy of your Import/Export Wizard settings. This way, you can create any number of templates to cover all of your common import & export scenarios and execute them one at a time with a single click. If you regularly import or export the same information using the same settings, this will save you lots of time. In addition to being able to execute these templates directly from this menu, you can plug them into Automation to get even greater time-saving benefits. The first screen gives you six options for export. The first two allow you to select one or more tables or views, all from the same schema/user, selected from the Schema dropdown. The Schemas option will allow you to export all of the tables or views (or both) for one or more schemas/users. The Text List option gives you the flexibility to select specific tables and views from multiple schemas. Using fully qualified object names ([owner].[object_name]) separated by com-mas, you can enter a list of objects to export. The last two options allow you to export the results of a query, either saved to disk or one that you want to quickly type or paste into the
However, it’s much more efficient—and a lot faster—to let Toad Data Point simply write the results straight to disk. There’s less memory used as well, so if you have a query that takes a long time to load or one that returns millions and millions of records, try exporting the results directly with the Export Wizard. With your tables, views or query selected, click “Next” to move forward.
Tip: You can use the Que-ry method to export your query results in Automa-tion by saving the Export Wizard settings to a tem-plate.
window. When your goal is simply to save the result to a Microsoft Excel or CSV file anyway, the benefit of this method is speed. When you execute a query in the Query Builder or the SQL Editor, you have to wait for the results to be loaded into the grid on the screen.
Export & Import
Export & Import

76
End User Training Toad Data Point
Export & Import
The next screen is where you can set your output options. There are several different types of file formats supported by Toad Data Point:
Delimited Comma Separated (*.CSV), Tab Separated (*.TAB), and Delimited Text (*.TXT) all offer the same capabilities, just using different column de-limiters. The Delimited Text option, of course, allows you to choose a custom delimiter. This is useful when you have special characters in your data that might otherwise be misinterpreted as a delimited us-ing the other methods.
Fixed Column Width This method will not use a de-limiter; instead, columns will end after a specified number of characters, defined in the “Default fixed width size” field. For instance, if your default size is 50, any columns that run be-yond 50 characters will be trun-cated; any columns with fewer than 50 characters will be pad-ded with spaces to 50 charac-ters. This is a special output for-mat that you should only use if you will be reading the data from a program that’s designed to look for new columns based on the character position in the file.
XML Data Data is exported to an XML format of <Data_Table>
<TABLE_NAME>
<col_name>data</col_name>
<col_name>data</col_name>
<col_name>data</col_name>
</TABLE_NAME>
</Data_Table>
HTML Table Data is exported to a simple HTML table. This is useful when you want to include your data in a web page or publish straight to a web server.
SQL Script Data is exported to a series of SQL INSERT statements. This is useful when you need to pre-serve the data type of your data. (Using some other formats, Like Microsoft Excel, will convert your database types into Microsoft Excel types.) Access Database File This method exports data to a table in a new Microsoft Access file (*.MDB or *.ACCDB). Create as New Table Similar to the SQL Script method, this is useful for preserving data types. The resulting script can be used as a backup or to create a copy of your table elsewhere.
Export & Import

77
End User Training Toad Data Point
Export & Import
Excel There are quite a few options that you can configure in the Excel ex-port type. Begin with selecting to use either a file or an instance. The difference here is that a file can be anything you’ve saved before or it can be a totally new file; choosing “Excel Instance” will let you pick between all of the open Microsoft Excel files. Regardless of which one you choose, you can choose to use a new worksheet or an existing work-sheet. If you choose an existing work-sheet, you can also choose to export the data beginning with a particular cell. This way, you don’t have to overwrite that worksheet. If you want your column names included in the export, check the “Use column names for a header row” checkbox. Be careful though—if you’re exporting to a certain row and column, you may not want a column header.
The new Microsoft Excel 2007 file format (*.XLSX) is not supported yet in Toad Data Point. Therefore, if your data is greater than 64k rows, either use one of the delimited formats or use the “Add Excel worksheet if row limit reached” option. This will allow your rows to “spill over” onto new worksheets. The date/time suffixes supported by Toad Data Point are helpful for keeping histori-cal copies of your data as well as not over-writing files.
On the next page you will be presented with two choices: save the tem-plate and/or go ahead with the export. If you plan to do this exact same export again in the future, or if you want to use these export settings in an Automation script, you should save the tem-plate. Optionally, you can also export the data at this point. Once your export is com-plete, you will be pre-sented with a confirma-tion screen with a link to your Microsoft Excel file.
Tip: To build an Excel report that you can re-fresh on a regular basis, use the Excel export method to place the data into a specific worksheet and save the settings as a template. Then you can add it to automation.
Export & Import

78
End User Training Toad Data Point
Export—Import
Import Wizard You can access the Import Wizard from the Tools menu under the Import sub-menu. There are three options here: Import Wizard, Open Import Template and Execute Import Template.
Import and Export Tem-plates are nothing more that a saved copy of your Import/Export Wizard settings. This way, you can create any number of templates to cover all of your common import & export scenarios and exe-cute them one at a time with a sin-gle click. If you
regularly import or export the same information using the same settings, this will save you lots of time. In addition to being able to execute these templates directly from this menu, you can plug them into Automation to get even greater time-saving benefits.
The Import Wizard be-gins with a welcome screen and then a screen asking you to provide one or more files for import. The list of supported file types is seen on the left.
You can add as many files to this list as you want, but you can only do so one at a time. This is be-cause you need to specify unique settings for each one. In this way, you have granular control over exact-ly where and how your data is im-ported.
Once you pick a file, the next screen is a confirmation of the file type and its char-acteristics. Depending on the file type, differ-ent options will be available. In the case of Microsoft Excel, as seen to the left, you can specify the first row of data as the column names, choose which row to begin reading data,
treat empty fields as NULL fields, verify or change the file encoding and choose how many rows to process at a time.
Export & Import

79
End User Training Toad Data Point
Export & Import
Once you’re comfortable with these settings, move on to the next screen where you can take a peek at your data. This screen will dis-play your data in a tabular fashion and allow you to specify a starting position for the import. (Whereas the previous screen asked you to specify where the data starts, this screen is asking you to define the data you actually want to import.) In the case of Microsoft Excel, you can choose to import data from more than one worksheet or even a selection of certain worksheets.
The following screen is where you provide the destination of your data. If you aren’t already connected to the database that you want to import data into, stop here. You must be connected to the destina-tion database when you begin the Import Wizard. That being said, you still have the ability to import data into a schema/user other than the user you’re connected as (depending on your database permis-sions). To switch schemas/users, simply click on the schema dropdown. If there are too many schemas/users, you can filter them there, too.
In some cases, the table you want to import into doesn’t exist. Toad Data Point can help you there, too. Instead of choosing an existing table, use the “A single new table” radio-button on the right of the window. Here you can specify the name of your new table as well as the schema/user that will own the table. This is designed to be used for quick and simple imports, so you are limited to a single data type for all columns in the table. If you need to get specific with your data types, you can create the table with the Create Table dialog, available on the Object Explorer toolbar. With your destination defined, the next screen will give you a preview of the data currently in that table. This is useful to con-firm that the data is going to the right place. In some cases you may want to clear the table’s contents before inserting new data; use the “Truncate Table” checkbox to accomplish this.
Tip: Remember, as with every-thing in Toad Data Point, you can only perform ac-tions in the database for which you have database permissions. Ask your DBA for help if you do not have permission.
Export & Import

80
End User Training Toad Data Point
Export & Import
The next screen will show you how the columns in your import file map to the columns in the database. In this example, the import col-umns are named the same and are in the same order, so Toad for Data Analysts was able to map them easily. If the default mapping isn’t right, you can use one of the two options for automatic mapping: by position or by name. If it’s still not right, you can map the columns manually, one by one.
Once you have the columns mapped, move to the next screen. Coincidentally, the next screen is where you first started—you’ve come full-circle, back to the screen where you can choose another file to import. If you’re only importing one, click “Next;” if you’re im-porting another file, click “Add File.”
After clicking “Next,” you’ll be presented with a summary page, dis-playing what will be imported. If you’re satisfied with this, move to the next screen. Here you will be presented with two choices: save the template and/or go ahead with the import. If you plan to do this exact same import again in the future, or if you want to use these import settings in an Automation script, you should save the tem-plate. Optionally, you can also import the data at this point. When the import has completed, you will be presented with a confir-mation screen, such as this one.
If you’ve done things correctly, you should be finished at this point. However, in some cases you may encounter an error. In this example, the import data violated a database constraint. Toad informed me that a database error had occurred and asked if it should continue or stop. As you can see from the screen above, the import was canceled after the first error and stopped the whole operation. This screen includes quick links to the event log (to better understand the error), the files you tried to import and a link to restart the wiz-ard.
Export & Import

81
End User Training Toad Data Point
Export & Import Exercises Exercise 1 Purpose - To demonstrate how to export to new Microsoft Access Database File. Scenario - You need to build a Microsoft Access database for publica-tion to users. Exercise Steps: Note: We are using the Toad Sample database to export and import into. In a real world scenario these tables might be on different data-bases and the connection would change on the import step. 1) Connect to the Toad Sample database. From the Object Explorer,
select the WAREHOUSE table. Right-click and choose “Send To—Export Wizard.”
2) This brings up the Export Wizard with the table name and type already selected and displays the second page of the wizard.
3) Select the Access Database File Output type. Click next to view the data to be exported. Click “Next” and enter the location and name of the new Microsoft Access file. When the export is done, check that the number of rows is 50. Click “OK” to close.
4) To view the new Microsoft Access file, create a new connection. Click on new connection from the top left toolbar of the Naviga-tion Manager. Choose the Microsoft Access type and select the access file created in step 3. Click OK to connect. (No user id or password are needed)
5) You will see the WAREHOUSE table in the Object Explorer. Right-click and choose “View Details.” Check the columns and data content.
Export & Import - Exercises
Exercise 2 Purpose - To demonstrate how to export and import a new table into Microsoft Access Scenario - You need to build a Microsoft Access database for publica-tion to users. Exercise Steps: 1) The WAREHOUSE_ITEM table is needed in the new access data-
base. Instead of using the Create New Table as all string/VARCHAR columns we want the same table definition. To do this, connect to the Toad Sample database by double clicking in the Navigation Manager.
2) Select the WAREHOUSE_ITEM table, right-click and choose “Create Like.” Enter the table name of WAREHOUSE_ITEM. Click on the SQL Script tab and view the DDL script created for you. Don’t click “Execute” as you are on the sample database and we want to create on the new Microsoft Access Database. Instead use the tool button to send the script to an editor.
3) You are probably already connected to the new database from Exercise 1. To change the connection, go to the bottom Right of the application and press the dropdown. The current connec-tions are listed here. Choose the New Access connection. This changes the current connection for the application and changes the connection for the editor.
4) Press F5 to execute. To view the new table press Shft+F5. (This refreshes all windows.) This creates the table with the correct columns. Now we need to import the data.
5) Change the connection back to the Toad Sample database using the connection switcher at the right bottom of the application. Type “Select * from warehouse_item where warehouse_ID <> 2” and press F5 to execute.
Export & Import –Exercises

82
End User Training Toad Data Point
6) In this export, we are going to use the contents of the data grid to do the export. Right-click on the grid and choose Export | Export Wizard. Choose CSV as the Output format.
7) Click next through the wizard making sure to enter the file name. When export is finished and you see the Export Summary Re-sults, click on the link to the export file. This will show you the contents of the file. Close the file. (Note: A file can not be used for import if it is open by another application.)
8) Double-click on the New Access database to change the connec-tion. From the Tools Menu, choose Import | Import Wizard. Add the file you just created. Click next. The input format should be fine. Click to view the content of the file. Click Next. Choose the warehouse_item table. Click Next. (Note: The content should be empty as this is a new table.) If there are rows, you are probably connected to the wrong database. Click next to see that the col-umn mapping is correct. Click Next through the rest to complete.
9) When successful, you can view the imported rows using the “View Details” on the Object Explorer.
Exercise 3 Purpose - To demonstrate how to automate an export query. Scenario - You need to export the results of several queries every week. Exercise Steps: 1) From the tools menu, choose Export | Export Wizard. Click Next.
On the “Select Objects” page, chose the Query file type. From the Stored Query edit box, navigate to the sample.sql file made in Editor Exercise 2. (If you do not have this file, change the file type to “Query” and enter the following SQL.)
Select * from region; Select * from address; 2) Click Next. Choose Microsoft Excel as the output format. (Scroll
down to the very bottom.) Click Next, and on the Excel Options page enter the path and file name.
3) On the last page, deselect the “Export data” option and select the “Save as Template” option. Navigate to a directory and sup-ply a file name. This makes a *.TXP file (Toad Export file) Click to close the wizard.
4) Open an Automation window using the Tool menu or Automa-tion document grouping button. Add an Export activity to the automation script.
5) Double-click on the activity to invoke the Activity Editor. Browse and select the export template you just created. Click OK. If you want to view the template or make changes, you can choose “Edit selected template.” You can also build a new template from this activity by choosing “Build Export Template.”
6) Test the script by pressing the “Test” button on the Wizard Bar. Provide a script name when prompted.
7) When the script is complete, view the steps in the output win-dow. Click on the link to the exported Microsoft Excel file. Notice how each query results was exported to a separate sheet.
8) Click on the Schedule wizard button to schedule this automation task weekly.
Export & Import –Exercises
Export & Import - Exercises

83
End User Training Toad Data Point
Data Compare & Sync Data Compare and Sync
Data Compare and Sync
Data Compare and Sync is a powerful tool for comparing the data in your tables and then synchronizing it between your source and tar-get databases. Don’t confuse this with Schema Comparison found in some of the other Toad products, however. Those tools will compare objects in the database and generate scripts to create or alter objects on the target database to match the source. This is beyond the scope of Data Compare and Sync which, as the name implies, is solely fo-cused on the data contained within the objects. This section will take you through the tool and cover its general usage. You can launch the Data Com-pare and Sync tool from the Tools menu under TOOLS > Compare > Data Compare & Sync. The first screen will let you de-fine two database connections. Your source is your “master,” or the database you want to com-pare against; the target is the database you want to update. You can compare between sche-mas within the same database (i.e.– user_a to user_b), two databases of the same type (i.e.—Oracle to Oracle) or even across database platforms (i.e.—SQL Server and DB2). With ver-sion 2.5, you can even compare between more obscure data-bases via ODBC connections.
The following screen is where you pick the tables or views that you wish to compare. The left of the window is a list of all of the tables in your source database. Click on a cell in the “Target Object” column to get a list of the tables and views in the target database to compare. You can choose to compare one or two tables or every one of them with the “Map All” button. If you want Toad Data Point to find the matching table for you automati-cally, use the “Map Selected” button.
You can refine your mappings by clicking the cell in the “Key Columns” column. This column must have unique values for the comparison. If the tool cannot determine the correct column to use for the compari-son, then clicking here will give you the ability to change it. To change the key column, select the col-umn with unique values in the “Key to Compare” column. You can also choose not to compare a column by unchecking it in the “Compare” column. The source and target custom filters accept standard SQL syntax. Use the syntax you would use if you were writing a WHERE clause, though omit the word “where.” (See the example to the left.) Once your mappings are defined and your key columns and filters are defined, click “Next.”
Tip: The “Map Selected” and “Map All” buttons will try to match tables or views by their name. If your tables or views are named differ-ently, these buttons may not be effective.

84
End User Training Toad Data Point
Data Compare and Sync
Data Compare and Sync
The next screen allows you to define particular options for the com-parison. These options apply to all tables or views in the comparison and are separated by options for the comparison and options for the synchronization. The comparison options allow you to specify things that you may want to ignore. For instance, if your MySQL database (source) has a fixed width column of 50 characters but your Oracle database (target) has a variable width column, then each and every record would appear as different because the MySQL records are padded with spaces to fill the fixed width column. By unchecking this option, you can omit the spaces and get an accurate comparison. The Record Types to Synchronize options allow you to specify wheth-er you want to include missing, additional, different, identical and conflict records in the synchronization. If you uncheck an option
here, that type will not display in the summary later, thus reducing the amount of information to sift through. After you click “Next,” the comparison will begin. You will see a screen with status indicators, showing you what the tool is doing along the way. Once complete, you should see a summary screen like this:
Here you can see how many records are different on both the source and target, additional (missing on the target), missing (missing from the source), equal and in conflict. Conflict records are records that could not be compared because of something like a data type differ-ence.

85
End User Training Toad Data Point
3) Refresh: If you’ve saved the comparison, or if significant
time has passed and there may be changes to the data in your tables, you can refresh the comparison with the cur-rent settings.
4) Select All: Select all of the comparison rows for the sync. 5) Show/Hide Differences: These buttons will show or hide
tables with these differences in your comparison results. 6) Synchronize: Green is for “GO” - when you’re ready to
synchronize the data, use this button to launch the Syn-chronization wizard.
Data Compare and Sync
Data Compare and Sync
With the wizard complete, the Data Compare & Sync sum-mary widow will be displayed. It has quite a bit of infor-mation on it, so we’ll cover it in pieces. Summary View The uppermost section of the window is a summary of each table or view that you compared. The checkboxes to the left are used to include that comparison in the synchro-nization, later. You can see a summary of the differences between the two objects in the columns to the right. Detail View The next section (in the middle) is where the de-tails of the comparison in focus is displayed. To show records here, click on one row in the summary view above. Here you will see each record displayed with the source on the left and the target on the right. Row Viewer The lowest section of the window is where you can view the differences in a single row. This is particularly useful when you have a row with many, many columns. Using this view, you can easily see the differences side by side. Cell Viewer Behind the Row Viewer is the Cell Viewer, which gives you an even more granular view of the differences, cell by cell. Data Compare & Sync Toolbar 1) New Compare: Use this to start
over with a new comparison. 2) Change Data Wizard: Opens the
current comparison wizard so you can alter the settings

86
End User Training Toad Data Point
Data Compare and Sync
Data Compare and Sync
With your comparison complete, the next step is to synchronize the data. Use the green start button on the toolbar to launch the wizard. The wizard will take you through the various options to get the data synchronized. The first question is whether you wish to make the target like the source (standard) or make the source like the target (reverse). In most cases you will want to choose the default here and make the target like the source. You can use the color-coded data-base icons to help you remember which is which.
The wizard creates a script which you can optionally choose to exe-cute at the end of the wizard. If you want to change the default loca-tion of that script, there’s a place to do that here. Finally, at the bottom of the window is an option to generate the SQL script for a certain percentage of the records. You can also choose to write the script for n records or for every n records. This gives you the ability to see a small representative script instead of the full script if you want to verify things first.
The “Options” button at the bottom of the wizard will allow you to configure some advanced options. While useful (or necessary) in some cases, they can affect the integrity of your data if used improperly. Make sure you fully under-stand the implications of these options before you use them.
With your options configured, click “Next.” The following screen will display the progress of the script creation. Once that’s complete, you will be presented with one final screen of the wizard. This last screen will show you a summary of the script’s contents and give you three options: execute it in the Toad SQL Editor, run it immediately or take no action. If you want to inspect the script or make any changes, choose to open it in the Toad SQL Editor. Otherwise, if you’re ready,
execute the script to syn-chronize your tables or views. Next, the Data Compare & Sync window will refresh to verify that the objects you compared are indeed in sync!

87
End User Training Toad Data Point
Data Compare and Sync - Exercises
Data Compare and Sync-Exercises
Data Compare & Sync Exercises Exercise 1 Purpose - To demonstrate how to compare two tables. Scenario - You have a transactional database with data that is copied to the data warehouse each night. You need to verify that the data was copied properly. Setup Steps: We will simulate having two databases in this example. In order to get the scenario to work you must connect to a database where you have permission to create a table. Follow these setup steps. 1) Connect to the database. 2) Right-click on a table and click “Create Like” 3) Give the new table a name like “[old_name]_COPY” 4) Click “Show Script” and then “Execute” 5) Right-click on the original table and click Send To > Export
Wizard 6) Export the table data to a Microsoft Excel file 7) Open the Microsoft Excel file and remove a few records 8) Right-click on the NEW table and click Send To > Import Wizard 9) Import the exported data into the NEW table Now you should have two tables in the same database with the same structure and nearly the same data.
Exercise Steps:
1) Open the Data Compare & Sync wizard and make connections to the same database (assuming you followed the directions to set up the scenario, your two tables are in the same database and owned by the same user).
2) On the “Select Objects” screen, find your source table from the setup steps and select the NEW table on the right.
3) Click on the “Key Columns” ellipsis […] to verify that the compar-ison will use a column with unique values. Click “Next.”
4) (Do not alter the “Select Comparison Options” screen.) Click “Next.”
5) When the wizard completes, you should have identical records and a few missing records (the records you deleted from the Excel file).
6) Next, inspect the records that will be synchronized.
7) Click on the “Synchronize” button on the toolbar or on the wiz-ard bar at the bottom of the window.
8) Keep the source to target synchronization in the first screen and click “Next.”
9) When the script has been generated, choose the “Run script immediately” option and click “Next.” (WARNING—Ensure that you are updating the NEW table you created and not a table with real production data!)
10) When the synchronization is complete, click “OK” when asked if you want to compare again to display the differences.
11) Verify that the tables are synchronized.

88
End User Training Toad Data Point
Data Diff Viewer The Data Diff Viewer is very simi-lar to the Text Diff Viewer, though launching it is different. To get started with the Data Diff Viewer, you first need a data set. From within a Query Builder or SQL Editor window, either create a new query or open a saved one and execute it. With data in the data grid, right-click on the data and browse to the Compare To sub-menu.
You can compare the result set to another Toad Editor file (*.TEF), another result set in the current file or to the result set of anoth-er file already open in Toad. This is very use-ful when you want to quickly compare the results of different queries. You can even use it to see the changes in a query’s result over time. Save your query in either the Toad Editor format (*.TEF) or in the Query Builder format (*.TSM) and choose to save the results with it when you click “Save.” This way you can compare the results when you run it again at a later date.
Difference Viewers Difference Viewer
Diff Viewer
Toad Data Point has two main tools for comparing data: Data Com-pare & Sync and the Difference viewer. The former is covered in the previous section. This section will be devoted to the latter which comes in two forms: the Text Difference Viewer and the Data Differ-ence Viewer. They are both essentially the same, though each is ded-icated to a specific type of information. Text Diff Viewer The Text Viewer can be opened from the Tools menu under Compare > Text Diff Viewer. Simply use the ellipsis […] to browse for a file on each side. As soon as the second file is opened, the two files will be compared. You can see the differences quickly as Toad Data Point highlights each one.
Tip: The Difference
Viewers are just that—viewers. If you want o make changes to your text or data, you need to edit them outside of this tool.

89
End User Training Toad Data Point
Difference Viewer - Exercises
Diff Viewer
Difference Viewer Exercises Exercise 1 Purpose - To demonstrate how to compare two data grids. Scenario - You have a query which returns a specific set of records. However, your boss tells you that something in the reports you’re distributing has changed. You need to verify that the data in your query isn’t changing over time. Exercise Steps: 1) Connect to your database. 2) Create a simple query (or open a query from disk). Ensure that
the query contains at least one column with unique values. 3) Execute the query to obtain a result set 4) If you’re using the Query Builder, save the file as a *.TSM file and
choose to save the results. Alternately, if you’re using the SQL Editor, save the file as a Toad Editor file (*.TEF) and choose to save the results if prompted.
5) Close & reopen the file. Verify that the data is saved with the file.
6) With the file open, re-execute the query to obtain a second re-sult set.
7) In the second result set, right-click on the grid and choose Com-pare To > Set 1
8) Choose the column to “make up the primary key.” This will be your column with unique values.
9) Scroll through your results to view any differences.

90
End User Training Toad Data Point
Object Search Object Search
Object search can help you quickly locate an object rather than browsing through a list of objects in the Database Explorer. The Ob-ject Search window is available from the Tools menu.
Object Search searches object names, table and view column names, and source code for proce-dures, functions, triggers, and views. A string text is searched with your defined criteria on the schemas se-lected.
To perform a search 1. Enter your search text criteria, case sensitivity and location
(starts with, contains, exact match). 2. Select types of objects to search, source code object types and
columns. 3. Highlight the schemas/databases to search in. 4. Press “Search” to do a new search, or “Append” to add to ex-
isting objects.
Object Search

91
End User Training Toad Data Point
Master-Detail Browser Master Detail Browser - Building
Use the Master Detail Browser to browse data in parent tables and drill-down to data in related child tables.
Build Master Detail To build a master detail result set, add two tables to the diagram area. You can drag from the object palette or right-click and use “Send To | Master Detail.” The foreign key joins will be drawn automatically. Add joins by dragging one col-umn to the join column of the other table. Delete a join by selecting and press-ing “Delete.” Select the columns you want in your result set. Add fetch limits or a where con-dition in the property win-dow on the right of the win-dow.
Execute the query by pressing the first tool button. The results is dis-played in a collapsed result set. To view child table results, press the expand button and the child table can be viewed.
Note: When expanding to view the child ta-ble, a query is executed to retrieve only that child table. To retrieve all rows at once, press the second tool button, “Fetch All Data.”
Browsing Data
Table from SQL - Tables can be built from SQL statements. To add, right-click on diagram and choose “Add table from Query.” Type or paste in SQL to the editor. Execute if you want to see the result set prior to adding to the master de-tail. Click “OK” to add. The query will be used as a table. The diagram will show the columns of the query. The name of the table is SQL (timestamp).
Master-Detail Browser

92
End User Training Toad Data Point
Master Detail Browser - Building
Master Detail Report
To build a report from a the Master Detail window, press the “Generate Report” tool button. Choose the columns and set the grouping levels.
Master Detail Fields All of the data must be retrieved to design a report, so this may take a little time. When done, the Toad Data Re-port Wizard will guide you through the setup. When the designer is opened, the field list will display the Master table, with the child table columns in line.
Adding Detail band To add a child detail band, right click and choose “Insert Detail Report -> %Child Table Name%.” The Child Table Name is assigned in the Field list. (See highlighted table name above.) Add data to this area by drag-ging in any of the columns from the child columns in the field list.
Group Summary Band Add a group summary band by right clicking on the detail band, and insert group footer. Drag a column to that band and set the summary function, as well as range of summary. In this case the range is Group. Summary ranges include page, group and report.
Master-Detail Browser

93
End User Training Toad Data Point
Master Detail Browser - Exercise
Master Detail Report Exercise
Purpose - To demonstrate how to build a Master Detail report. Scenario - Using the Toad Sample database, build a report that shows the oldest addresses by region and gives the count. The oldest ad-dresses are the address IDs less than 50. Exercise Steps: 1) To connect, double-click on the Toad Sample database . 2) Select the ADDRESS and REGION table. Right-click and choose
“Send To | Master Detail Browser” 3) Choose the columns you want included in the report. 4) Filter the address_id column so you only retrieve IDs less than 50.
To do this, select the ADDRESS table. Then add “address_id < 50” in the where condition property on the right. (Docked window)
5) Click the browser button or press F9.
5) Send data to the report designer by pressing on the tool button, or right click “Send To | Report Designer. “
6) In the Toad Data Report Wizard, select all of the columns and choose to group by region name.
7) Add a child detail band. To do this, right click on the detail band and choose “Insert Detail Report | FK_ADDRESS_REGION_ID.” This is the name the designer has assigned to the child table. The new band will be added in green. (Your table name may be different.)
8) From the Field List window, drag the FK_ADDRESS_REGION_ID table to the new child detail band. It will place all columns in the band.
9) Change the spacing of the band by moving the band handle in the margin. A hand will display when your mouse is over it.
10) To add a count of how many addresses are in a region, right-click on the detail band and insert Group Footer band. Add the address_id column by dragging from the Field List. Click on the right arrow and click on “Summary.” Using the Summary Editor, set the function to Count. Change the format string to Number and check to see that the summary is for the group (not page or report).
11) Do the same actions covered in step 10 for the report footer, except change sum to report total.
12) Click on the Preview Tab to review your report. Export your report in PDF format.
Master-Detail Report-Exercise

94
End User Training Toad Data Point
Appendix A - Installation
Full details of installation are published in the Toad Install Guide. This guide covers desktop (client), server, Citrix and user requirements. Toad Data Point can be installed silently or repackaged for multiple desktop rollout. An individual install is easily done by following the Install Wizard.
There are two install types — normal and Read-Only. A Read-Only install is used to disable features in the application that could change database objects. Choosing Read-Only will disable all create editors (table, view, etc), execution of insert, update, and delete state-ments, importing data, and editing of data in the grids.
Using the Installation Wizard
Installation—Using the Installation Wizard
Installation

95
End User Training Toad Data Point
Most of the features of Toad Data Point allow saving your work to file. These proprietary files are saved with a defined extension. Dur-ing install these file extensions are registered to this newly installed application. SQL scripts (*.SQL) can also be associated to open in Toad.
Installation—Using the Installation Wizard
After the files are installed, Toad optimizes the code for faster load and execution times. Toad is a .NET application and this part of the install creates native images, which are files containing compiled pro-cessor-specific machine code, and installs them into the native image cache on the local computer. This process can take several minutes and is normal.
Installation
Note: There are separate installers for Toad Data Point Base edition, Pro edition, and 64-bit. The 64-bit installer is for use on 64-bit pcs that have an existing DB2 64-bit client. Toad Data Point is a 32-bit application and does not run as 64-bit. The 64-bit installer is only for support of DB2 64-bit clients. Oracle 64-bit client support is offered in Toad for Data Point 3.4 and later. It is still a 32-bit application that has a connection bridge that utilizes the Oracle 64-bit client.

96
End User Training Toad Data Point
Upon launching Toad, you may be asked to provide a license key to enable the application. The key is provided through email by Quest, and can be copied and pasted into the edit boxes shown. Trial versions of the software are installed with a 90-day trial key. Trial extensions can be requested from the product website. After purchasing Toad you can install the commercial version. This is a sep-arate install and application from the trial. Patches of the same major release (IE: 2.0—2.1) uninstall and up-grade into the same directory. Major releases are installed separately and can be installed side-by-side. For any installation issues please contact Quest support.
Installation—Using the Installation Wizard
Installation Requirements Desktop client recommendations are 1 GB RAM, 1 GHZ CPU, and 250 MB disk space. You need to be an administrator run the installer. Toad Data Point requires the .NET Framework . The installer checks for this dependency and if not installed, provides the link to the Mi-crosoft install media. Before you can export to Microsoft Excel, the Primary Interop Assem-blies (PIAs) for your version of Microsoft Excel need to be installed. If the PIA is not installed, a message prompts you to download and install.
Database Client Requirements
Oracle - Toad Data Point can connect to Oracle using TCP/IP and does not need any client files. However, for best performance and viewing and handling of advanced data types, an Oracle OCI client needs to be installed. All 9i and later Oracle clients are supported. (See connection section for further details regarding Oracle Instant Client.) Oracle 64-bit client is supported in Toad Data Point 3.4 and later.
DB2 - Toad Data Point installs its own copy of the DB2 client. This client is compatible with any existing DB2 clients installed.
SQL Server - No additional files are needed.
MySQL—No additional files are needed.
ODBC - For connecting to any other database an ODBC 3.0 com-patible driver needs to be installed. Please refer to the database manufacturer for download and installation.
Terdata—Please install Teradata client from vender.
Installation
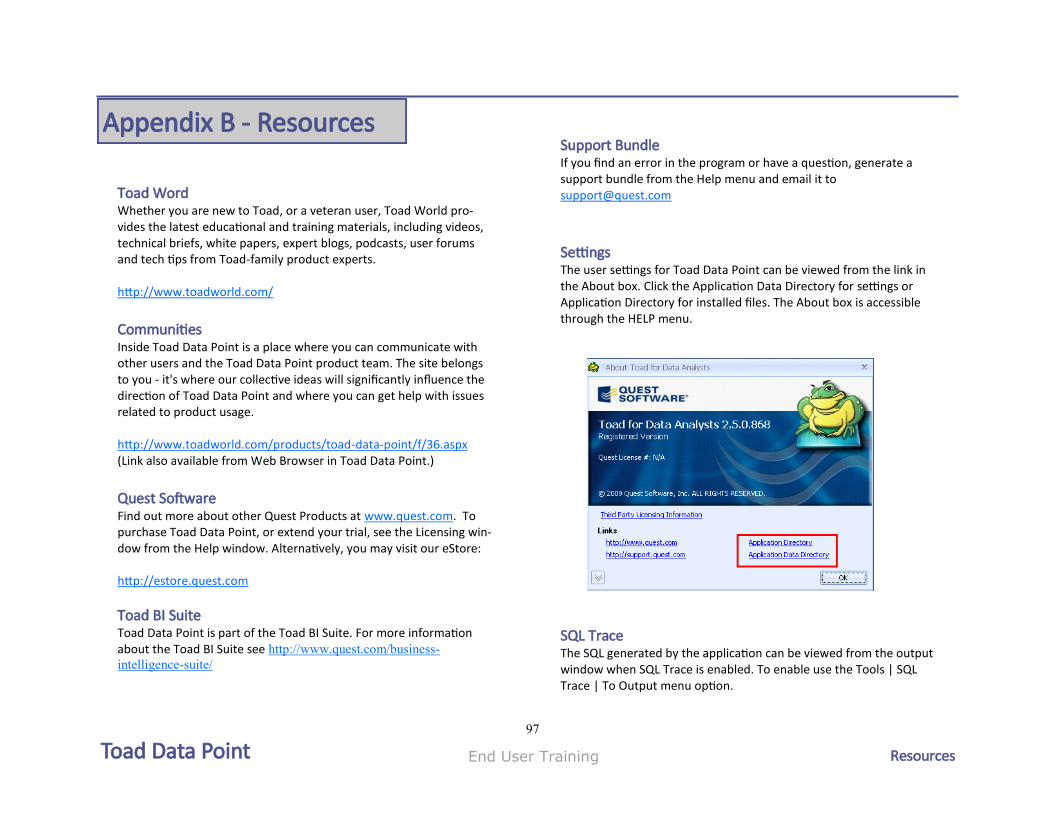
97
End User Training Toad Data Point
Appendix B - Resources
Toad Word
Whether you are new to Toad, or a veteran user, Toad World pro-vides the latest educational and training materials, including videos, technical briefs, white papers, expert blogs, podcasts, user forums and tech tips from Toad-family product experts. http://www.toadworld.com/
Communities
Inside Toad Data Point is a place where you can communicate with other users and the Toad Data Point product team. The site belongs to you - it's where our collective ideas will significantly influence the direction of Toad Data Point and where you can get help with issues related to product usage. http://www.toadworld.com/products/toad-data-point/f/36.aspx (Link also available from Web Browser in Toad Data Point.)
Quest Software Find out more about other Quest Products at www.quest.com. To purchase Toad Data Point, or extend your trial, see the Licensing win-dow from the Help window. Alternatively, you may visit our eStore: http://estore.quest.com
Toad BI Suite Toad Data Point is part of the Toad BI Suite. For more information about the Toad BI Suite see http://www.quest.com/business-
intelligence-suite/
Resources
Support Bundle If you find an error in the program or have a question, generate a support bundle from the Help menu and email it to [email protected]
Settings The user settings for Toad Data Point can be viewed from the link in the About box. Click the Application Data Directory for settings or Application Directory for installed files. The About box is accessible through the HELP menu.
SQL Trace
The SQL generated by the application can be viewed from the output window when SQL Trace is enabled. To enable use the Tools | SQL Trace | To Output menu option.