to trust or not to trust? a simulation-based experimental
TRANSCRIPT

To Trust or Not to Trust? A Simulation-based Experimental Paradigm
Foroogh Hajiseyedjavadi
Graduate Research Assistant
Department of Civil & Environmental
Engineering
University of Massachusetts, Amherst
Michael Knodler Jr., Ph.D.
Associate Professor
Department of Civil & Environmental
Engineering
University of Massachusetts, Amherst

To Trust or Not to Trust? A Simulation-Based Experimental Paradigm Michael Knodler Jr., PhD, PI Associate Professor Department of Civil and Environmental Engineering University of Massachusetts, Amherst https://orcid.org/0000-0002-6517-4066 Eleni Christofa, PhD Assistant Professor Department of Civil and Environmental Engineering University of Massachusetts, Amherst https://orcid.org/0000-0002-8740-5558 Foroogh Hajiseyedjavadi Graduate Research Assistant Department of Civil and Environmental Engineering University of Massachusetts, Amherst https://orcid.org/0000-0003-3448-1239
Francis Tainter Graduate Research Assistant Department of Civil and Environmental Engineering University of Massachusetts, Amherst https://orcid.org/0000-0003-0180-6113
Nicholas Campbell Graduate Research Assistant Department of Civil and Environmental Engineering University of Massachusetts, Amherst https://orcid.org/0000-0001-7076-6835

ii
A Report on Research Sponsored by
SAFER-SIM University Transportation Center
Federal Grant No: 69A3551747131
August 2018
iii
DISCLAIMER
The contents of this report reflect the views of the authors, who are responsible for the facts and
the accuracy of the information presented herein. This document is disseminated in the interest
of information exchange. The report is funded, partially or entirely, by a grant from the U.S.
Department of Transportation’s University Transportation Centers Program. However, the U.S.
Government assumes no liability for the contents or use thereof.

iv
Table of Contents
Table of Contents ........................................................................................................................ iv
List of Figures .............................................................................................................................. v
List of Tables ............................................................................................................................... vi
Abstract ...................................................................................................................................... vii
Introduction ..................................................................................................................................1
1.1 Overview of Trust ...................................................................................................................1
1.2 Background ............................................................................................................................3
1.3 Objectives ..............................................................................................................................4
1.4 Hypotheses ............................................................................................................................4
Methods .......................................................................................................................................6
2.1 Apparatus ...............................................................................................................................6
2.2 Physiological Measures .........................................................................................................7
2.3 Psychological Measures ........................................................................................................8
2.4 Driver Measures .....................................................................................................................9
2.5 Experimental Design and Procedure .....................................................................................9
2.6 Scenarios and Drives ...........................................................................................................10
Results and Discussion ..............................................................................................................12
3.1 Physiological Results ...........................................................................................................12
3.2 Psychological Results ..........................................................................................................15
3.3 Driver Measures ...................................................................................................................17
Conclusion .................................................................................................................................22
References .................................................................................................................................23
v
List of Figures
Figure 1.1 - Technology Acceptance Model developed by IBM Canada in the 1980s ................. 2
Figure 1.2 – Modified TAM model by Ghazizadeh et al. (2012) .................................................... 3
Figure 3.1 - Order of Scenarios for Group One Pedestrian Failure ............................................ 13
Figure 3.2 - Order of Scenarios for Group Two Pedestrian Failure ............................................ 13
Figure 3.3 - Order of Scenarios for Group One, Vehicle Failure ................................................. 14
Figure 3.4 - Order of Scenarios for Group Two, Vehicle Failures ............................................... 14
Figure 3.5 - Disengagement rate for no-fail scenarios ................................................................ 16
Figure 3.6 - Disengagement rates across different types of failure ............................................ 16
Figure 3.7 - Average number of movements across relative sequences of scenarios for the
group with one pedestrian failure ................................................................................................ 17
Figure 3.8 – Average number of movements across relative sequences of scenarios for the
group with one vehicle failure ..................................................................................................... 18
Figure 3.9 – Average number of movements across relative sequences of scenarios for the
group with two pedestrian failures .............................................................................................. 18
Figure 3.10 – Average number of movements across relative sequences of scenarios for the
group with two vehicle failures .................................................................................................... 19
Figure 3.11 – Average number of feet movements across relative sequences of scenarios for
the group with one pedestrian failure .......................................................................................... 20
Figure 3.12 – Average number of feet movements across relative sequences of scenarios for
the group with one vehicle failure ............................................................................................... 20
Figure 3.13 – Average number of feet movements across relative sequences of scenarios for
the group with two pedestrian failures ........................................................................................ 21
Figure 3.14 – Average number of feet movements across relative sequence of scenarios for the
group with two vehicle failures .................................................................................................... 21

vi
List of Tables
Table 2.1 - Sample of simulator evaluation scenarios ................................................................ 11
vii
Abstract
The automated driving system is expected to enhance traffic safety and flow; however, the
system will not be as effective if users do not accept it or do not utilize it appropriately [1].
Appropriate acceptance and use of technology depends on attributes such as perceived risk,
mental workload, self-confidence, and appropriate level of trust that matches system
performance. An inappropriate level of trust in the technology, whether it is over-trust or under-
trust, would negatively affect the benefits of that technology. Based on the literature, trust is a
dynamic construct that consists of an initial or dispositional trust that is shaped before
experiencing the system performance and a history-based trust that constantly changes with
user experience of the system. This study first reviews the history of research on humans’ trust
in automation and the factors that are correlated with trust. It also provides a brief overview of
some previous models of trust in automation. Then, based on the gaps in the literature, a
simulator-based experiment is proposed to further study the factors affecting initial or
dispositioned trust and history-based trust. The results of this study are expected to help better
understand drivers’ trust in automated vehicles and help enhance human-automation interaction
models.

1 To Trust or Not to Trust? A Simulation-Based Experimental Paradigm
1 Introduction
1.1 Overview of Trust
Advancements in technology have been leading to the automation of manual tasks in
different fields, including manufacturing, aviation, maritime operations, and most recently
the vehicle industry. Because of the varying definitions of automation across disciplines,
it is important to note that the definition used in this study is derived from the work of
Parasuraman et al. [2], which defines automation as the execution of one or multiple
functions that were previously carried out by a human operator [1, 3].
Automation can, to some extent, cover for human errors, which can increase the
safety and performance of the systems; however, in most cases, a human operator is
still needed to interact with the system to execute the remaining tasks, monitor the
automated system, or assume control when necessary. It should be noted that
automated systems do not replace human activities completely; a human is still needed
most of the time, but the automation allows the human to perform different tasks while
the automation operates [2].
In addition to the technical capabilities, a person’s behavior and interaction with the
system should be considered as a main parameter in the design of the automated
vehicles. Automation technology will not be as effective if drivers do not accept the
technology or if they fail to utilize it appropriately. Unlike automation studies in fields like
aviation and process operation, there are few articles focused on human trust in
automated vehicles [2, 4]. Studies of human-machine interaction in different areas (e.g.,
aviation, maritime operations, processing, and transportation) can facilitate an
understanding of human behavior with automation in general and can be useful for the
design of automated vehicle studies.
Appropriate acceptance and use of technology depend on the interaction of different
social and individual variables such as subjective norms, perceived risk, mental
2 To Trust or Not to Trust? A Simulation-Based Experimental Paradigm
workload, and self-confidence, as well as an appropriate level of trust that matches
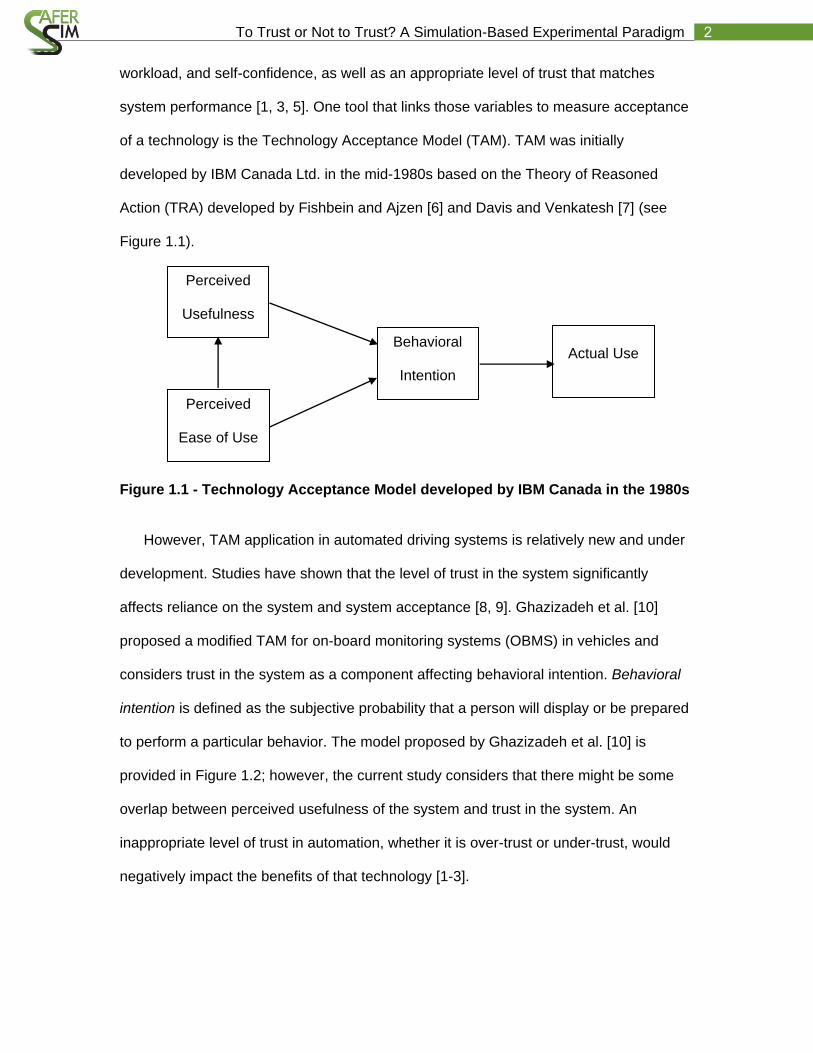
system performance [1, 3, 5]. One tool that links those variables to measure acceptance
of a technology is the Technology Acceptance Model (TAM). TAM was initially
developed by IBM Canada Ltd. in the mid-1980s based on the Theory of Reasoned
Action (TRA) developed by Fishbein and Ajzen [6] and Davis and Venkatesh [7] (see
Figure 1.1).
Figure 1.1 - Technology Acceptance Model developed by IBM Canada in the 1980s
However, TAM application in automated driving systems is relatively new and under
development. Studies have shown that the level of trust in the system significantly
affects reliance on the system and system acceptance [8, 9]. Ghazizadeh et al. [10]
proposed a modified TAM for on-board monitoring systems (OBMS) in vehicles and
considers trust in the system as a component affecting behavioral intention. Behavioral
intention is defined as the subjective probability that a person will display or be prepared
to perform a particular behavior. The model proposed by Ghazizadeh et al. [10] is
provided in Figure 1.2; however, the current study considers that there might be some
overlap between perceived usefulness of the system and trust in the system. An
inappropriate level of trust in automation, whether it is over-trust or under-trust, would
negatively impact the benefits of that technology [1-3].
Perceived
Usefulness
Perceived
Ease of Use
Behavioral
Intention
Actual Use

3 To Trust or Not to Trust? A Simulation-Based Experimental Paradigm
Figure 1.2 – Modified TAM model by Ghazizadeh et al. (2012)
1.2 Background
As discussed earlier, almost every definition of trust across different disciplines
considers an element of risk or uncertainty associated with the performance of the
trustee [1, 11]. It is important that the level of trust and users’ expectancy matches the
actual performance of the system.
An inappropriate level of trust that does not match system performance, whether it is
mistrust or distrust of the system, can defeat the benefits of automation. Muir [11]
introduced the concept of trust calibration as the “process of adjusting trust to
correspond to an objective measure of trustworthiness.” Mistrust and distrust are two
cases of poor trust calibration: mistrust occurs when a subject’s trust in the system is
higher than its trustworthiness, and distrust occurs when the subjective person’s level of
trust in the system is less than the trustworthiness of the system [8]. The factors
affecting trust can be classified into three categories: (a) machine performance, (b) user-
related factors, and (c) environment-related factors [12]. Learning how each of these
factors affects trust can help to manipulate individuals’ level of trust to match the
capabilities of the system. The initial investigation of the effect of system performance
Perceived
Usefulness
Perceived
Ease of Use
Behavioral
Intention
Actual Use Trust

4 To Trust or Not to Trust? A Simulation-Based Experimental Paradigm
and, more importantly, users’ subjective opinion about the system performance on their
level of trust is the concern of this chapter.
The effect of poor performance of the automated system on users’ trust might vary
with different characteristics of the automated system as well as the characteristics of
the failure. The characteristics of the system include type of automation, which can be
(1) the information acquisition system, (2) the warning system, (3) the partial control
system, or (4) the full control system. The characteristics of the failure include type of
failure, which can be a false alarm or miss, risk associated with the failure, or frequency
of failure. To be more accurate, it is the user’s subjective opinion on items (2), (3), and
(4), rather than the actual state of those items, that changes the user’s trust in the
system. As mentioned by Merritt and Ilgen [13], perception mediates the effect of system
performance on trust. Considering that, users’ perception of the system performance,
and not only the actual performance of the system, should be studied when designing an
automated system.
A user’s characteristics and personal traits affect how system failure changes one’s
trust [13]. In human-human interaction studies, it is also argued that highly trusting
individuals usually acquire a more appropriate level of trust in the other party [1]. Merritt
and Ilgen [13] showed that trust degradation as a result of observing system failure is
more severe for people with higher trust propensity than people with low trust propensity.
Their data also show that the individual’s perception of trust accounts for 52% of trust
variance above the variance caused by the actual trustworthiness of the system.
1.3 Objectives
The main objective of this study was to gain a better understanding of how individual
differences and the performance of the system affect one’s trust in the system.
1.4 Hypotheses
The following hypotheses were tested in the simulated environment:
5 To Trust or Not to Trust? A Simulation-Based Experimental Paradigm
a) Glance behavior changes as an individual’s trust in the system changes [11].
Horizontal glance distribution, monitoring rate, and blink rate have an inverse
correlation with trust in the system.
b) Physiological measures vary with subjects’ level of trust in the system.
c) Individual differences affect subjects’ initial and history-based trust. The effect of
system failure on trust varies across subjects with different levels of propensity to
trust [13].
d) The type of hazard in failure conditions and the frequency of failures affect
subjects’ trust fall.

6 To Trust or Not to Trust? A Simulation-Based Experimental Paradigm
2 Methods
2.1 Apparatus
This study considers the effect of system failure on subjects’ trust in the system
when driving with an automated vehicle. A total of 80 subjects aged 20-30 years
participated in this study. All participants were recruited from the University of
Massachusetts Amherst and the local area and were compensated for their time. All the
participants had a U.S. driving license with a minimum of two years of driving
experience.
Multiple questionnaires, a physiological sensor, an eye-tracker, and vehicle data
were used to capture participants’ initial level of trust in automated systems in general as
well as in automated vehicles, their subjective and objective driving skills, their driving
history, their interaction with automated vehicles with different levels of system
performance, and their subjective and objective levels of trust after interacting with the
automated system. A SensoMotoric Instruments (SMI) head-mounted eye tracker was
used to gather eye behavior during the simulated drives. Vehicle behaviors were
automatically recorded by the Realtime Technologies Inc. (RTI) driving simulator. In
addition, a chest-band physiological sensor collected subjects’ physiological data as they
were driving the scenarios. The driving simulator is a fixed-base RTI full cab with 6
screens surrounding it that subtend to 330 degrees of horizontal field of view and 30
degrees of vertical field of view. The SMI head-mounted eye-tracking system tracked
and recorded drivers’ eye movements during the experiment. The eye-tracking system
has three cameras, one facing the scene and two facing the participant’s eyes. Each
camera records video at 60 frames per second.
The study was a mixed design with five different levels of system performance
across groups and eight scenarios within each group. All the subjects drove the same
set of scenarios once in the manual driving mode and once in the fully automated driving
7 To Trust or Not to Trust? A Simulation-Based Experimental Paradigm
mode, experiencing one of the five system performance levels to capture their manual
driving skill and their interaction with the automated system. The automated vehicle in
this experiment was of level 2 automation, in which the automated system is completely
in charge of driving tasks; however, the subject still needs to monitor the system and is
responsible for the fallbacks.
Each subject was assigned to one of the five groups of system performance: 100%
performance, 88% performance with pedestrian interaction failure (i.e., one failure in
interaction with pedestrian out of eight total interactions), 75% performance with
pedestrian interaction failure (i.e., two failures in interaction with pedestrian out of eight
total interactions), 88% performance with stop sign failure (i.e., one failure in interaction
with a stop-controlled intersection out of eight total interactions), and 75% performance
with stop sign failure (i.e., two failures in interaction with a stop-controlled intersection
out of eight total interactions). For the high mental workload experiment, subjects were
asked to conduct a hands-free secondary task while completing both manual and
automated driving tasks.
2.2 Physiological Measures
Subjects’ physiological measures including heart rate (HR) and heart rate variability
(HRV) were collected using a BioHarness chest strap sensor. Heart rate variability is the
change in the time intervals between consecutive heartbeats. Multiple studies have
shown that HRV might be affected by physiological, psychological, and environmental
conditions. As an example, Morales et al. [ 15] showed that HRV is affected by the level
of anxiety in athletes. Some works have used HRV as a measure of drivers’
psychological conditions while driving [16]. Multiple works in the driver behavior domain
used HRVs as a measure of drives’ mental state. Wintersberger and Riener [16] showed
HRV changes in different driving environments, such as tunnels versus open roads,
indicating drivers’ levels of anxiety. Knowing the potential impacts on HRV, this paper
8 To Trust or Not to Trust? A Simulation-Based Experimental Paradigm
investigated the potential correlation with drivers’ stress caused by failure of the
automated vehicle and their subjective level of trust of the system with their
disengagement of automation.
Some of the well-known methods to evaluate HRV include time-domain methods,
frequency-domain methods, and a method based on the non-linear dynamics of HR [17,
18]. A time-domain method was used for the analysis in this paper. The list of accepted
time-domain measures includes standard deviation of NN (SDNN), standard deviation of
RR (SDRR), standard deviation of the average NN (SDANN), standard deviation for all
NN intervals (SDNNI), Pnn50, HR Max-HR Min, RMSSD, HRV triangular index, and
Triangular Interpolation of the NN (TINN) [18]. An algorithm developed by BioH
calculates a rolling 300 heartbeat SDNN HRV value. This is updated once per second.
For the first 300 beats of a log, an invalid value is reported.
Heart rate variability data often contain false beats due to either physiological or
technical conditions [17]. The BioH uses an algorithm that considers a worn detection
indication and the signal-to-noise ratio of the ECG signal to establish HR confidence.
The HR confidence is between 0-100% and above 20% indicates a reliable heart rate.
2.3 Psychological Measures
Participants were encouraged to use automation as much as possible during
automated drives. Subjects were instructed that they were responsible for any behavior
of the vehicle and that automation could be disengaged if it felt unsafe or uncomfortable
to allow the vehicle to conduct the driving task. Automation could be disengaged either
by pressing the brake pedal or by pressing the prescribed button on the steering wheel.
The disengagement methods were explained to participants before they completed the
practice drive, allowing them to use the disengagement methods outside of the
experimental scenarios. If participants disengaged automation from 500 feet before the
hazard to about 160 feet after the hazard, the disengagement was scored as 1 for that

9 To Trust or Not to Trust? A Simulation-Based Experimental Paradigm
subject for that scenario. The sum of the disengagement scores for each scenario was
calculated across subjects and was divided by the total number of interactions.
2.4 Driver Measures
Subjects’ hand and feet movements were recorded using two video cameras. The
steering camera was mounted outside the car and was pointed towards the steering
wheel through the front passenger window, and the pedal camera was mounted beneath
the dash facing the pedals. Recorded streams were synced with the simulator data
based on the time stamps in the data outputs using a signal sent at the start of each
drive during the experiments. The signal was a beep triggered at the start of the
simulator run. The videos were then scored manually to capture hand and foot
movements, hereafter referred to as events. The notes reported by the scorers were
categorized based on keywords and were either placed into one of the defined
categories or discarded as unknown or unrelated events.
2.5 Experimental Design and Procedure
A between-subjects design was used in this study. Each subject was assigned to
one of the system performance groups and drove through the eight scenarios once in a
manual mode in which the subject was completely in charge of the driving tasks and
once in a fully automated mode in which the automated system was in control of the
driving tasks. The subject was required to monitor the system and was in charge of the
safety redundancies during the automated drives (Level 2 automation as described in
SAE International [17]). The order of presenting manual and automated drives was
completely randomized. Participants were pseudo-randomly assigned to one of the five
groups that interact with an automated system that was either 100% reliable, 88%
reliable with pedestrian or stop control failure, or 75% reliable with pedestrian or stop
control failure. The 100%, 88%, and 75% reliability levels, as explained earlier, had 0, 1,
or 2 failures, respectively, out of the total of eight scenarios.
10 To Trust or Not to Trust? A Simulation-Based Experimental Paradigm
Each participant provided a written informed consent to participate in the experiment.
Participants then completed a demographic and driving history questionnaire, a
personality questionnaire, and a pre-experiment trust questionnaire. Following this,
participants were outfitted with a physiological sensor around their chests using a chest
band and a head-mounted eye-tracker. Complementary instructions were provided before
starting the first drive and at the start of each subsequent drive. Two practice drives, one in
a completely manual mode and one in a fully automated mode, were provided to the
subjects to familiarize them with the controls of the simulator, the simulated environment,
and the automated driving system.
In the automated drives, subjects were instructed that they may disengage automation
and take over control of the vehicle using a hard button assigned to the automation on the
steering wheel or by pressing the brake pedal, and participants were advised to do so if
the simulation felt unsafe. Participants were instructed that they could reengage
automation if they felt safe doing so by using the same button. Subjects were encouraged
to use automation as much as possible throughout the simulation. Subjects were asked to
fill out the NASA-TLX questionnaire to measure the level of workload after each of the four
drives. They were also asked to answer six trust-related questions after each automated
drive. After completing all the driving tasks, subjects were given a post-study trust
questionnaire, which was the same as the pre-study trust questionnaire that was
completed before the driving simulated scenarios to capture the effect of system
performance on their subjective level of trust.
2.6 Scenarios and Drives
Eight scenarios were used in this experiment. The eight scenarios were presented to the
subject twice, once in a manual driving task and once in a fully automated driving task.
The eight scenarios included four pedestrian scenarios and four stop-sign-controlled
intersections. In each of the pedestrian scenarios, a mid-block crosswalk was placed in

11 To Trust or Not to Trust? A Simulation-Based Experimental Paradigm
the subject’s path and a pedestrian crossing either from the right side or the left side of
the road was presented to the subject. The roads in all the scenarios were four-lane,
two-way roadways in a suburban environment. The sequence of the eight scenarios
presented to the subjects was fully counterbalanced using the balanced Latin-square
method.
The failure of the pedestrian scenario happened when the automated vehicle did not
yield to the pedestrian entering the crosswalk. There was no crash between the subject
vehicle and the pedestrian since the pedestrian always stopped crossing the road before
entering the subjects’ travel path if the subject vehicle did not yield. The failure of the
stop-controlled intersection scenario happened when the automated vehicle did not stop
at the stop bar before entering the intersection. There was no other vehicle at the
intersection and there were not any crashes in these scenarios. An example of the
scenarios can be seen in Table 2.1.
Table 2.1 - Sample of simulator evaluation scenarios
Sample
Pedestrian
Scenarios
Sample
Intersection
Scenarios

12 To Trust or Not to Trust? A Simulation-Based Experimental Paradigm
3 Results and Discussion
3.1 Physiological Results
The physiological data from the sensor and the driving data from the simulator were
synced after the experiment using their time stamps. The frequencies of the data
collected from the simulator and the physiological sensor were 60 Hz and 1 HZ,
respectively. To sync the two datasets, the simulator data was sampled down to 1 Hz.
Since the collected measures including HR and HRV were interpolated, an alternative
approach would be to interpolate physiological data to match the 60 Hz data points using
the linear or cubic spline interpolation method.
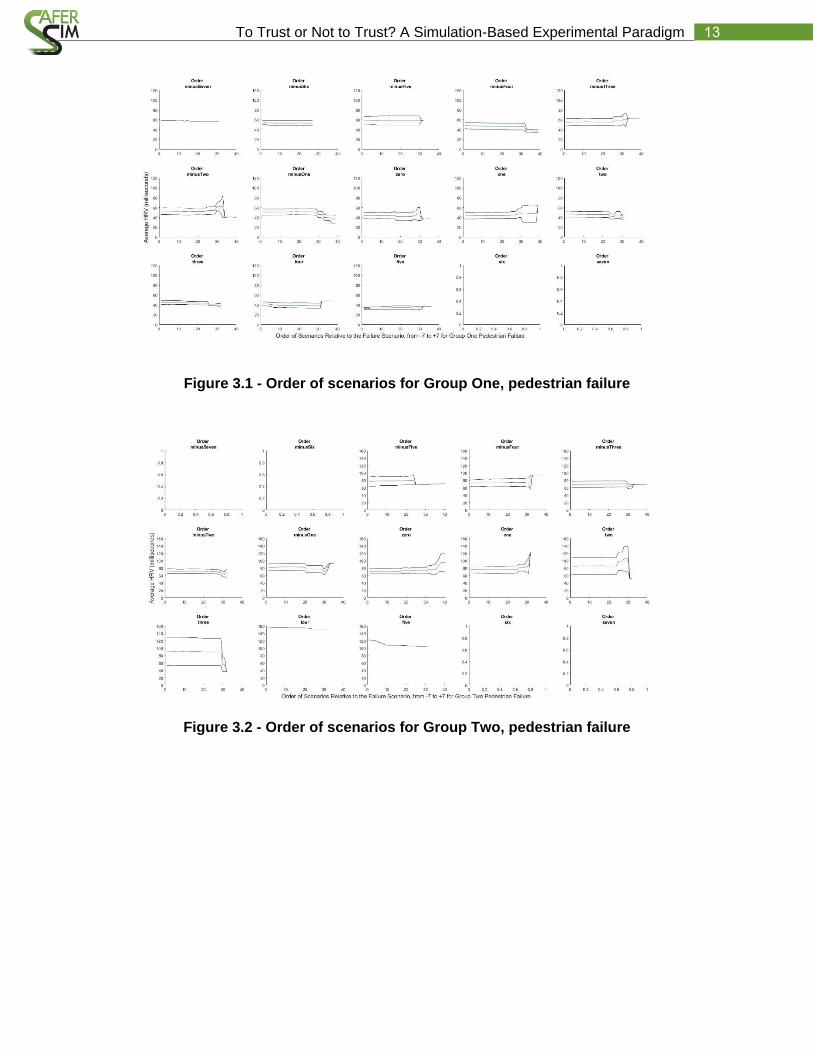
A descriptive analysis of the HRV across groups was conducted and is presented in
the following graphs. The presented scenarios are flagged with the order in which they
were presented to the participants relative to the failure scenario(s). For example, if the
scenario was presented right before the failure scenario, its relative order was flagged as
-1, and if it was presented right after the failure, its relative order was flagged as 1. The
black lines on the top and bottom of the average line represent the standard error of the
mean (SEM) for each order. The average of the HRV across subjects in each group is
presented for each order in the following figures. Based on the literature on physiological
measures, a lower level of HRV is usually correlated with a higher level of anxiety [15].
The sequence of scenarios for the four groups is shown in Figures 1.3-1.6.
13 To Trust or Not to Trust? A Simulation-Based Experimental Paradigm
Figure 3.1 - Order of scenarios for Group One, pedestrian failure
Figure 3.2 - Order of scenarios for Group Two, pedestrian failure

14 To Trust or Not to Trust? A Simulation-Based Experimental Paradigm
Figure 3.3 - Order of scenarios for Group One, vehicle failure
Figure 3.4 - Order of scenarios for Group Two, vehicle failures
To quantify the differences between HRV for scenario orders before and after the
failure scenario, an ANOVA test was conducted. The number of observations per order
is not the same for all the orders due to the design of the experiment, subject drop outs,
or technical limitations with the BioH, the simulator, or the synchronization of the two.
Considering this variation in the number of observations, the design was considered

15 To Trust or Not to Trust? A Simulation-Based Experimental Paradigm
unbalanced, and an N-way ANOVA was used to quantify the differences between HRV
of multiple orders.
The Kolmogorov-Smirnov normality test showed that HRV data across all the groups
and orders follow the normal distribution. The one-way ANOVA was conducted to
compare the effect of orders -1 and 1 on HRV across four groups. The results show a
significant effect of order on HRV at the p<0.05 level across the two orders for the one-
pedestrian failure [F (1, 511) = 13.83, p = 0.002] and the one-vehicle failure [F (1, 660) =
4.86, p = 0.03] groups. The same analysis on orders -1 and 3 across four groups shows
that the effect of order on HRV is significant for the one-pedestrian failure [F (1, 413) =
21.23, p <0.0001], one-vehicle failure [F (1, 450) =4.95, p <0.05], and two-vehicle
failures [F (1, 222) = 7.49, p <0.002] groups.
3.2 Psychological Results
A look at the automation usage shows that drivers who have experienced any level
or type of system failure are more probable to disengage the automated system in
situations where the system is appropriately responding to the environment. In other
words, any type or level of system failure that is introduced in this study significantly
increases the probability of unnecessary disengagement when the system’s response is
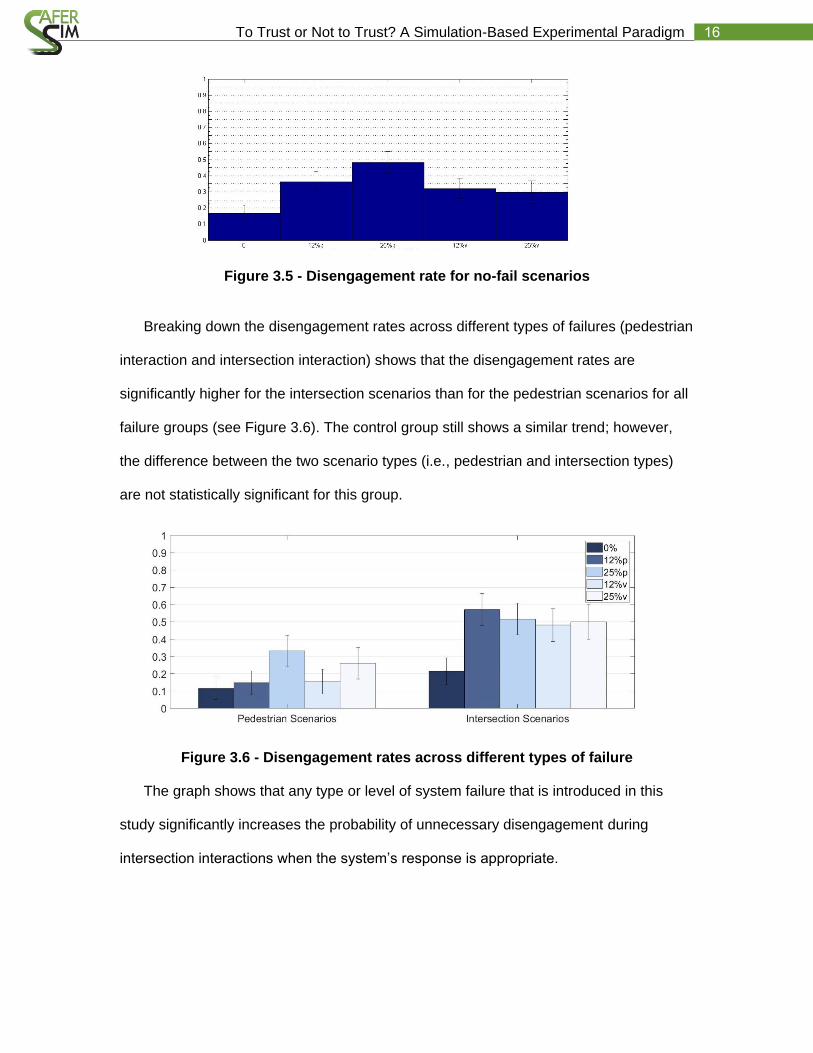
appropriate. The following Figure 3.5 compares the disengagement rates for the control
group (presented as 0 failure) and the rest of the groups that experienced some type of
failure.
16 To Trust or Not to Trust? A Simulation-Based Experimental Paradigm
Figure 3.5 - Disengagement rate for no-fail scenarios
Breaking down the disengagement rates across different types of failures (pedestrian
interaction and intersection interaction) shows that the disengagement rates are
significantly higher for the intersection scenarios than for the pedestrian scenarios for all
failure groups (see Figure 3.6). The control group still shows a similar trend; however,
the difference between the two scenario types (i.e., pedestrian and intersection types)
are not statistically significant for this group.
Figure 3.6 - Disengagement rates across different types of failure
The graph shows that any type or level of system failure that is introduced in this
study significantly increases the probability of unnecessary disengagement during
intersection interactions when the system’s response is appropriate.

17 To Trust or Not to Trust? A Simulation-Based Experimental Paradigm
3.3 Driver Measures
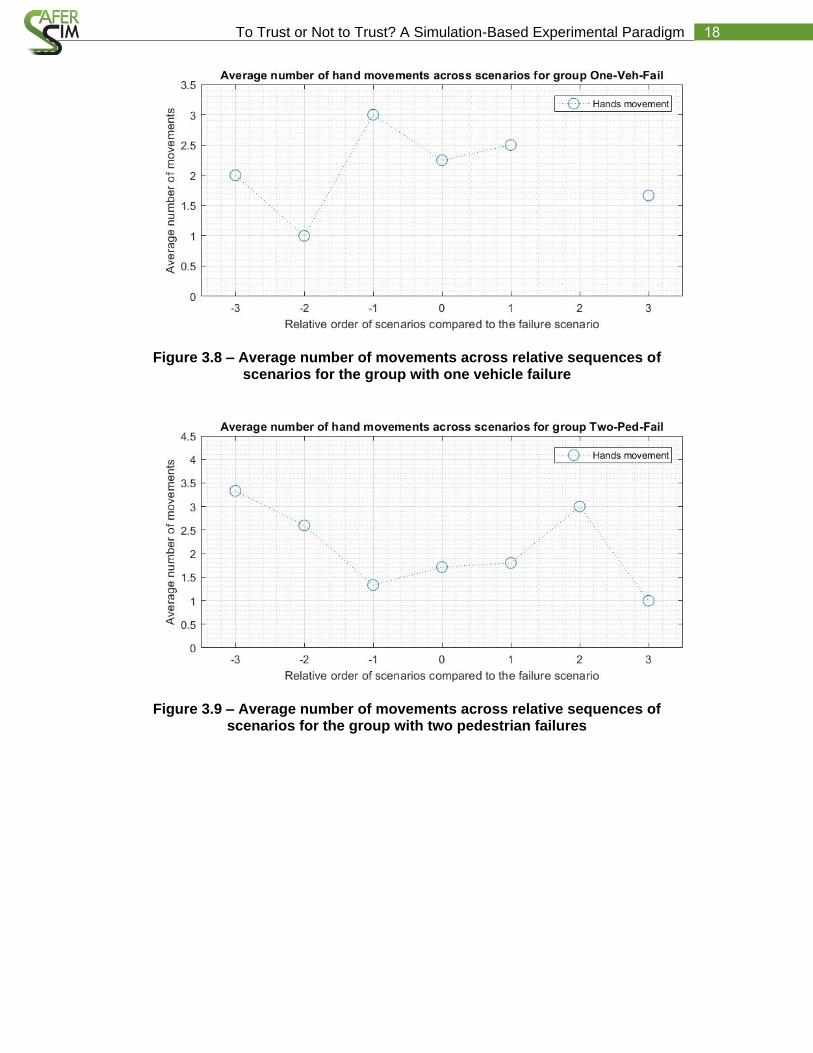
Hand movements were categorized into four groups: (1) engage automation, (2)
disengage automation, (3) hands toward steering wheel, and (4) hands away from
steering wheel. The average number of events for each of the four categories and the
average number of all the events combined were calculated and plotted across subjects
in each of the failure groups (Figure 3.7, Figure 3.8, Figure 3.9, Figure 3.10). The
average number of events were calculated for scenarios that had been presented to the
drivers anywhere between the third scenario before the failure scenario and the third
scenario after the failure scenario.
Based on the experimental design, the number of data points would decrease
significantly for relative orders more distant than three scenarios from the failure
scenario. The trends show an increase in the average number of hand events in the
failure scenarios, which is expected since the subject should notice the failure and take
control of the driving task. The average might increase for the scenario right after the
failure scenario, but in most cases, it will decrease as the subject proceeds through
more scenarios afterward.
Figure 3.7 - Average number of movements across relative sequences of scenarios for the group with one pedestrian failure
18 To Trust or Not to Trust? A Simulation-Based Experimental Paradigm
Figure 3.8 – Average number of movements across relative sequences of scenarios for the group with one vehicle failure
Figure 3.9 – Average number of movements across relative sequences of scenarios for the group with two pedestrian failures

19 To Trust or Not to Trust? A Simulation-Based Experimental Paradigm
Figure 3.10 – Average number of movements across relative sequences of scenarios for the group with two vehicle failures
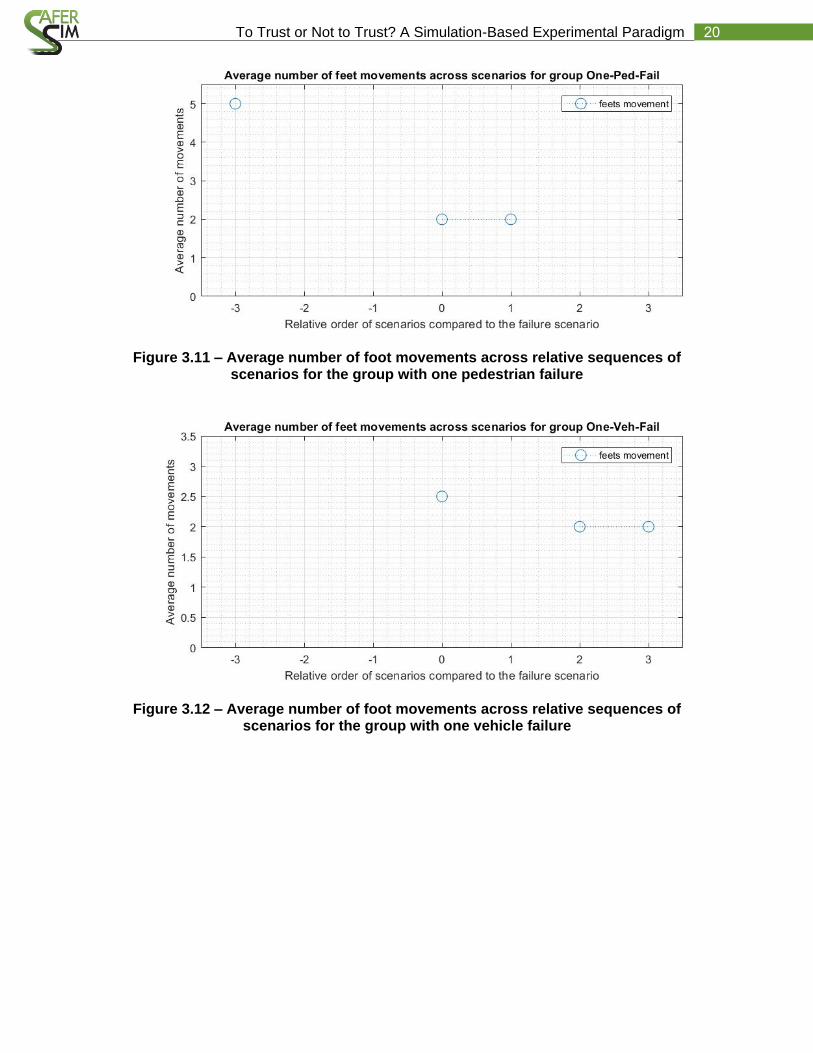
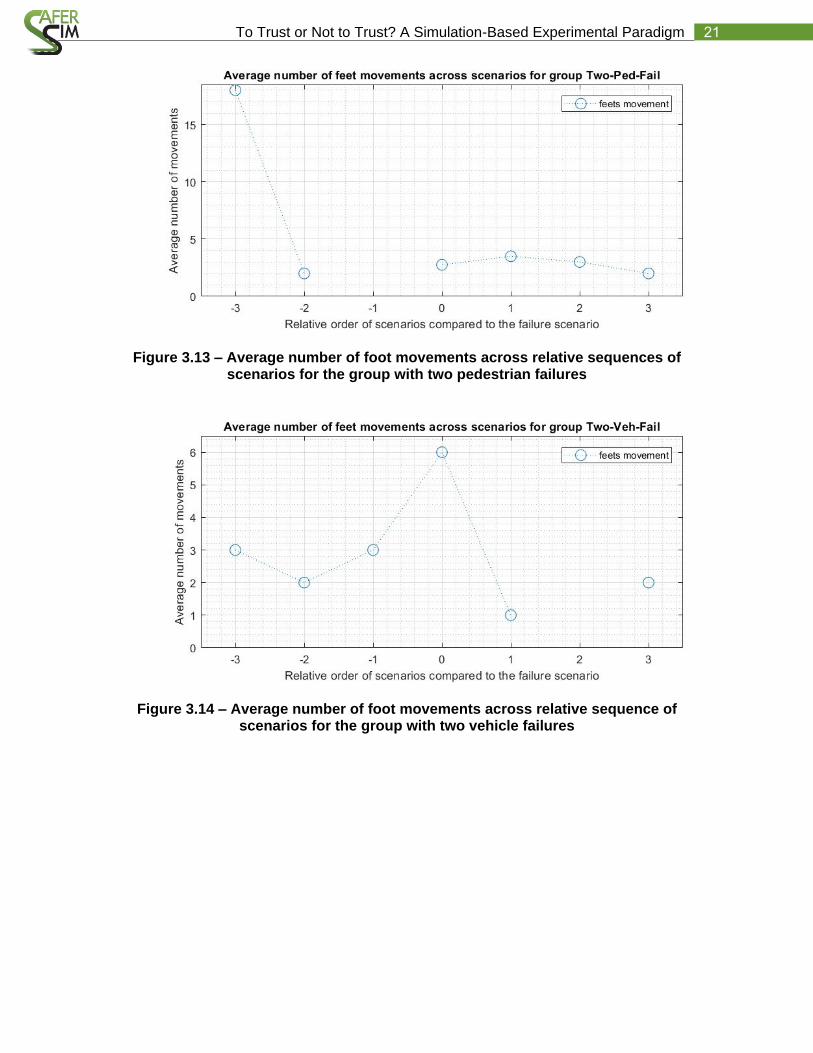
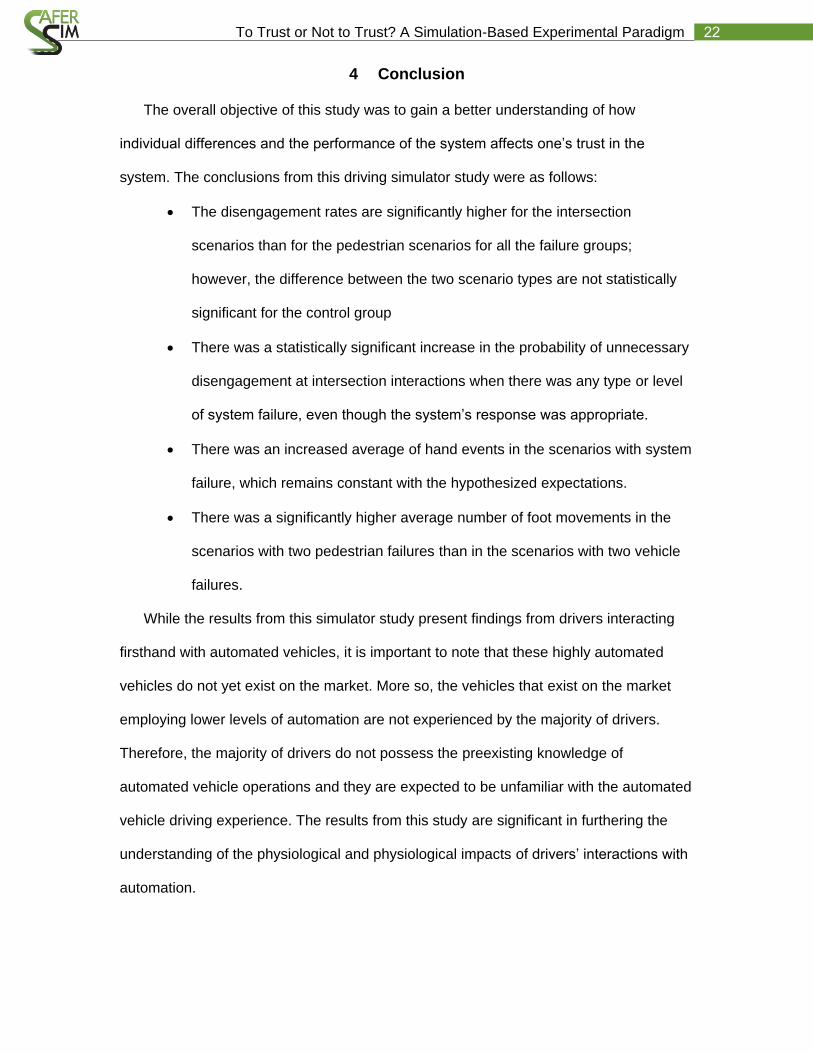
Subjects’ feet movements near pedals were captured using video cameras during
the experiments and scored manually afterward. The events are categorized into 6
groups: (1) foot moves away from pedals completely, (2) brake, (3) foot moves toward
brake, (4) foot moves away from bake/release brake, (5) press gas and, (6) foot moves
away from gas/release gas. The average occurrences of each event as well as all
events combined are calculated across subjects in each of the four failure groups. The
averages are calculated for scenarios that have been presented to the drivers anywhere
between the third scenario before the failure scenario and the third scenario after the
failure scenario. The average of all events combined is plotted for each of the failure
groups (Figure 3.11, Figure 3.12, Figure 3.13, Figure 3.14).
20 To Trust or Not to Trust? A Simulation-Based Experimental Paradigm
Figure 3.11 – Average number of foot movements across relative sequences of scenarios for the group with one pedestrian failure
Figure 3.12 – Average number of foot movements across relative sequences of scenarios for the group with one vehicle failure
21 To Trust or Not to Trust? A Simulation-Based Experimental Paradigm
Figure 3.13 – Average number of foot movements across relative sequences of scenarios for the group with two pedestrian failures
Figure 3.14 – Average number of foot movements across relative sequence of scenarios for the group with two vehicle failures
22 To Trust or Not to Trust? A Simulation-Based Experimental Paradigm
4 Conclusion
The overall objective of this study was to gain a better understanding of how
individual differences and the performance of the system affects one’s trust in the
system. The conclusions from this driving simulator study were as follows:
The disengagement rates are significantly higher for the intersection
scenarios than for the pedestrian scenarios for all the failure groups;
however, the difference between the two scenario types are not statistically
significant for the control group
There was a statistically significant increase in the probability of unnecessary
disengagement at intersection interactions when there was any type or level
of system failure, even though the system’s response was appropriate.
There was an increased average of hand events in the scenarios with system
failure, which remains constant with the hypothesized expectations.
There was a significantly higher average number of foot movements in the
scenarios with two pedestrian failures than in the scenarios with two vehicle
failures.
While the results from this simulator study present findings from drivers interacting
firsthand with automated vehicles, it is important to note that these highly automated
vehicles do not yet exist on the market. More so, the vehicles that exist on the market
employing lower levels of automation are not experienced by the majority of drivers.
Therefore, the majority of drivers do not possess the preexisting knowledge of
automated vehicle operations and they are expected to be unfamiliar with the automated
vehicle driving experience. The results from this study are significant in furthering the
understanding of the physiological and physiological impacts of drivers’ interactions with
automation.
23 To Trust or Not to Trust? A Simulation-Based Experimental Paradigm
5 References
1. Lee, J.D., & See, K.A. (2004). Trust in automation: Designing for appropriate reliance. Human Factors: The Journal of the Human Factors and Ergonomics Society 46(1), 50-80.
2. Parasuraman, R., Sheridan, T.B., & Wickens, C.D. (2000). A model for types and
levels of human interaction with automation. IEEE Transactions on systems, man, and cybernetics-Part A: Systems and Humans 30(3), 286-297.
3. Parasuraman, R., & Riley, V. (1997). Humans and automation: Use, misuse,
disuse, abuse. Human Factors: The Journal of the Human Factors and Ergonomics Society 39(2), 230-253.
4. Gold, C., Körber, M., Hohenberger, C., Lechner, D., & Bengler, K. (2015). Trust in
automation–before and after the experience of take-over scenarios in a highly automated vehicle. Procedia Manufacturing 3, 3025-3032.
5. Riley, V. (1989). A general model of mixed-initiative human-machine systems.
Proceedings of the Human Factors Society Annual Meeting 33(2), 124-128.
6. Fishbein, M., & Ajzen, I. (1977). Belief, attitude, intention, and behavior: An introduction to theory and research. Reading, MA: Addison-Wesley Pub. Co.
7. Davis, F.D., & Venkatesh, V. (1996). A critical assessment of potential
measurement biases in the technology acceptance model: Three experiments. International Journal of Human-Computer Studies 45(1), 19-45.
8. Lee, J.D., & Moray, N. (1994). Trust, self-confidence, and operators' adaptation to
automation. International Journal of Human-Computer Studies 40(1), 153-184.
9. Parasuraman, R., Sheridan, T.B., & Wickens, C.D. (2008). Situation awareness, mental workload, and trust in automation: Viable, empirically supported cognitive engineering constructs. Journal of Cognitive Engineering and Decision Making 2(2), 140-160.
10. Ghazizadeh, M., Peng, Y., Lee, J.D., & Boyle, L.N. (2012). Augmenting the
technology acceptance model with trust: Commercial drivers’ attitudes towards monitoring and feedback. Proceedings of the Human Factors and Ergonomics Society Annual Meeting, 2286-2290.
11. Muir, B.M. (1994). Trust in automation: Part I. Theoretical issues in the study of
trust and human intervention in automated systems. Ergonomics 37(11), 1905-1922.
12. Hancock, P.A., Billings, D.R., Schaefer, K.E., Chen, J.Y., De Visser, E.J., &
Parasuraman, R. (2011). A meta-analysis of factors affecting trust in human-robot interaction. Human Factors 53(5), 517-527.
13. Merritt, S.M., & Ilgen, D.R. (2008). Not all trust is created equal: Dispositional and
history-based trust in human-automation interactions. Human Factors 50 (2), 194-210.

24 To Trust or Not to Trust? A Simulation-Based Experimental Paradigm
14. Morales, J., Garcia, V., García-Massó, X., Salvá, P., & Escobar, R. (2013). The
use of heart rate variability in assessing precompetitive stress in high-standard judo athletes. International Journal of Sports Medicine 34(02), 144-151.
15. Wintersberger, P., & Riener, A. (2016). Trust in technology as a safety aspect in
highly automated driving. i-com 15(3), 297-310.
16. Peltola, M. (2012). Role of editing of rr intervals in the analysis of heart rate variability. Frontiers in Physiology 3, 148.
17. SAE International. (2016). Taxonomy and definitions for terms related to driving autoamtion systems for on-road motor vehicles.
18. Shaffer, F., & Ginsberg, J. (2017). An overview of heart rate variability metrics and
norms. Frontiers in Public Health 5, 258.