to do addm – add chart showing advice over time client id – draw sessions and client bouncing...
TRANSCRIPT
To Do
ADDM – add chart showing advice over time
Client id – draw sessions and client bouncing from session to session
Services – show connection diagram Get John’s screen shot Talk about SQL tuning on SQL details Show group bys with ASH by various axes Show examples of setting client_id,
service, turning on More test cases, what does ADDM find
Performance Tuning in Oracle 10g
Kyle Hailey

EM Product Layout for Performance
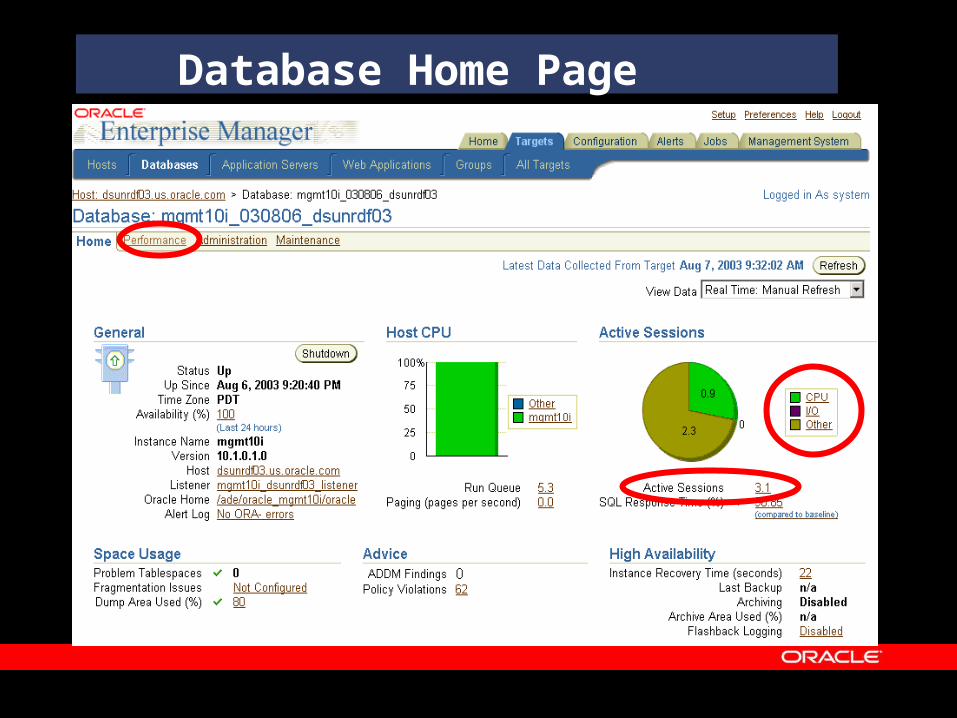
Database Home Page
Database Performance Page
Drilldowns
SQL Session
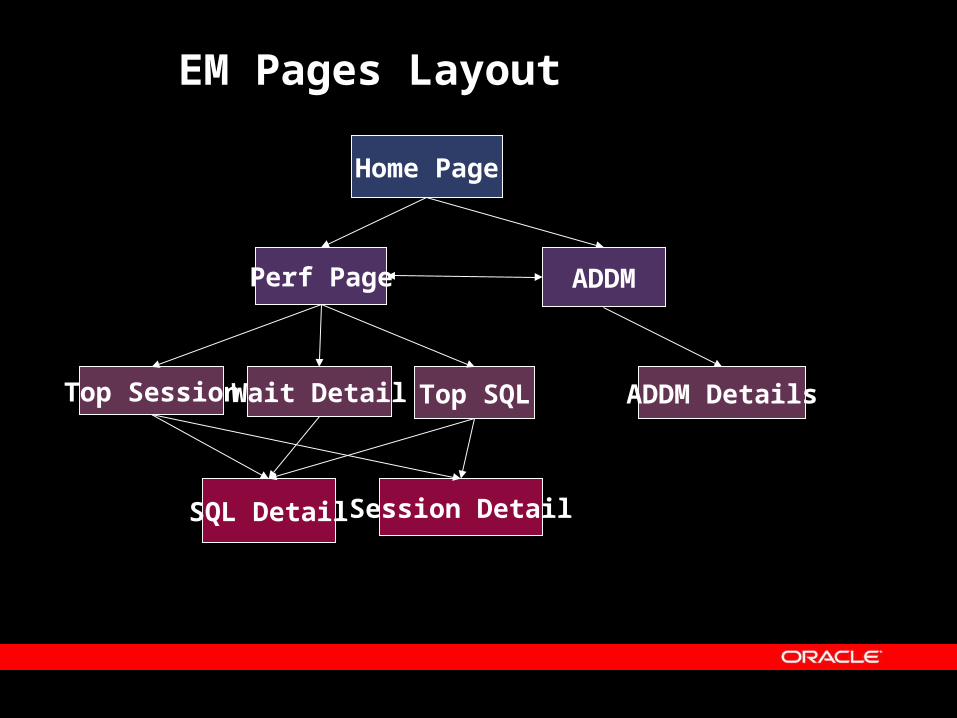
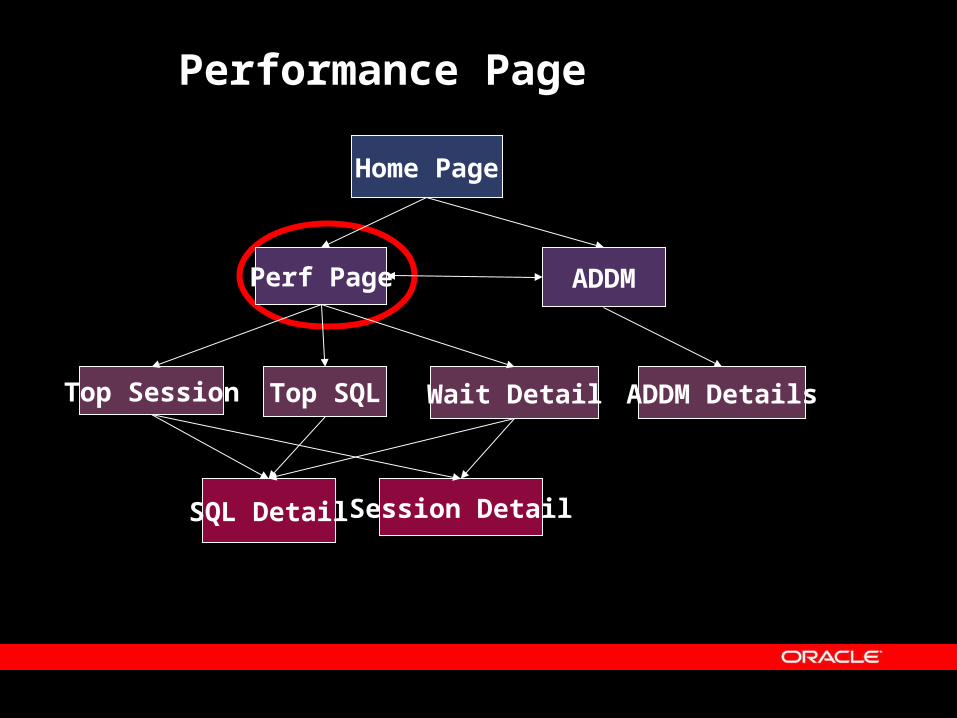
EM Pages Layout
Home Page
Perf Page
Top Session Wait Detail Top SQL
SQL Detail Session Detail
ADDM
ADDM Details
Buffer Busy Waits Use Case

Home Page
Perf Page
Top Session Wait Detail Top SQL
SQL Detail Session Detail
ADDM
ADDM Details
Three Paths

ADDM Path
Home Page
Perf Page
Top Session Wait Detail Top SQL
SQL Detail Session Detail
ADDM
ADDM Details
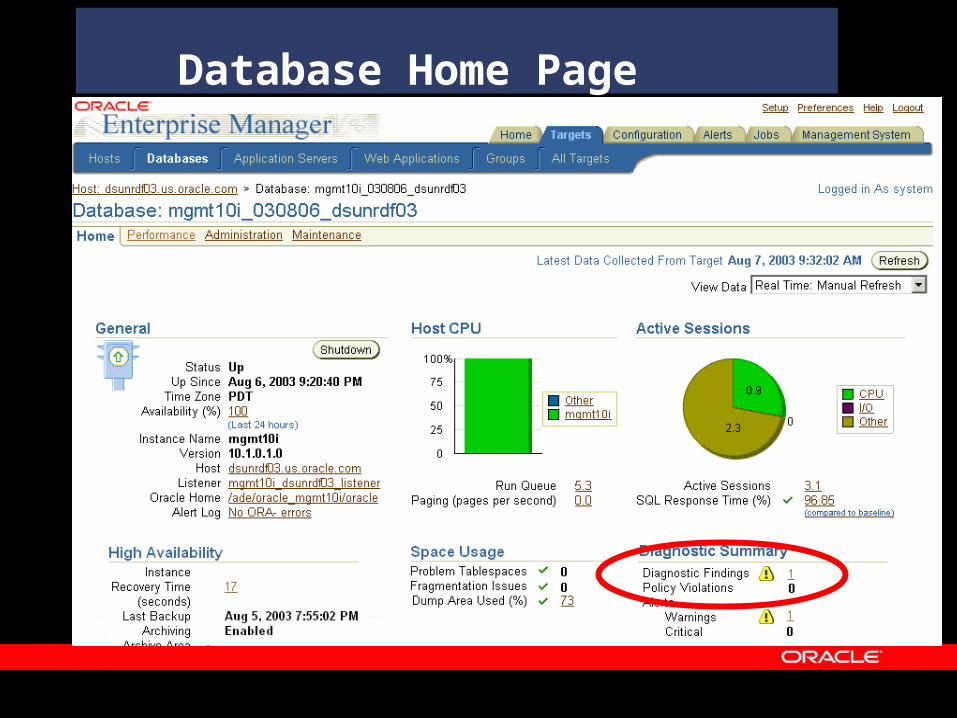
Database Home Page

ADDM Home
Home Page
Perf Page
Top Session Wait Detail Top SQL
SQL Detail Session Detail
ADDM
ADDM Details
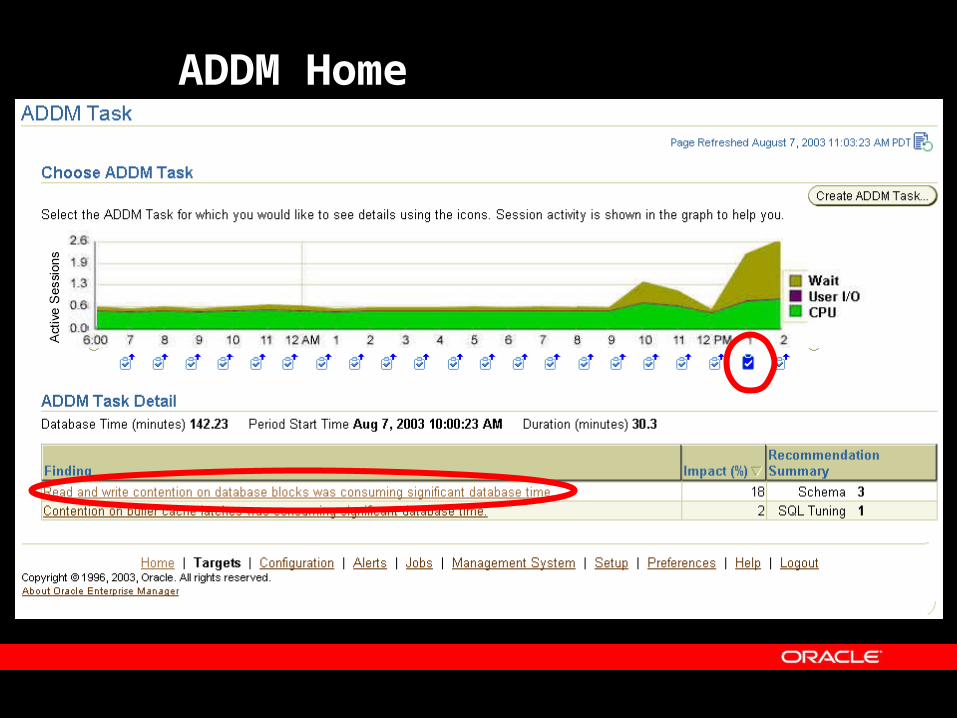
ADDM Home

ADDM Details
Home Page
Perf Page
Top Session Wait Detail Top SQL
SQL Detail Session Detail
ADDM
ADDM Details
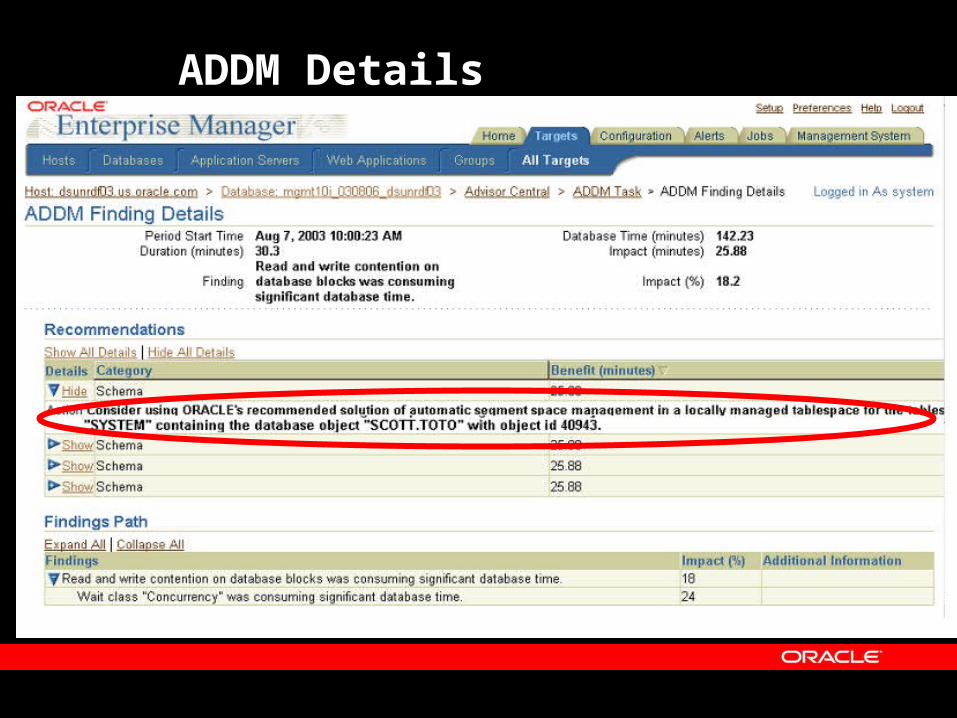
ADDM Details
Home Page
Perf Page
Top Session Wait Detail Top SQL
SQL Detail Session Detail
ADDM
ADDM Details
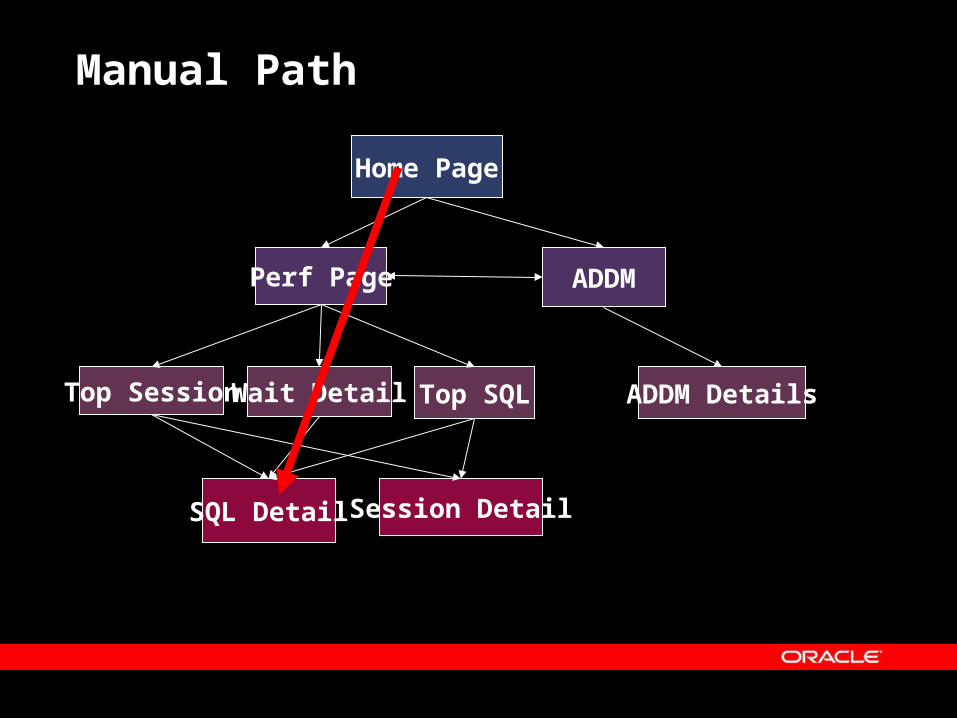
Manual Path
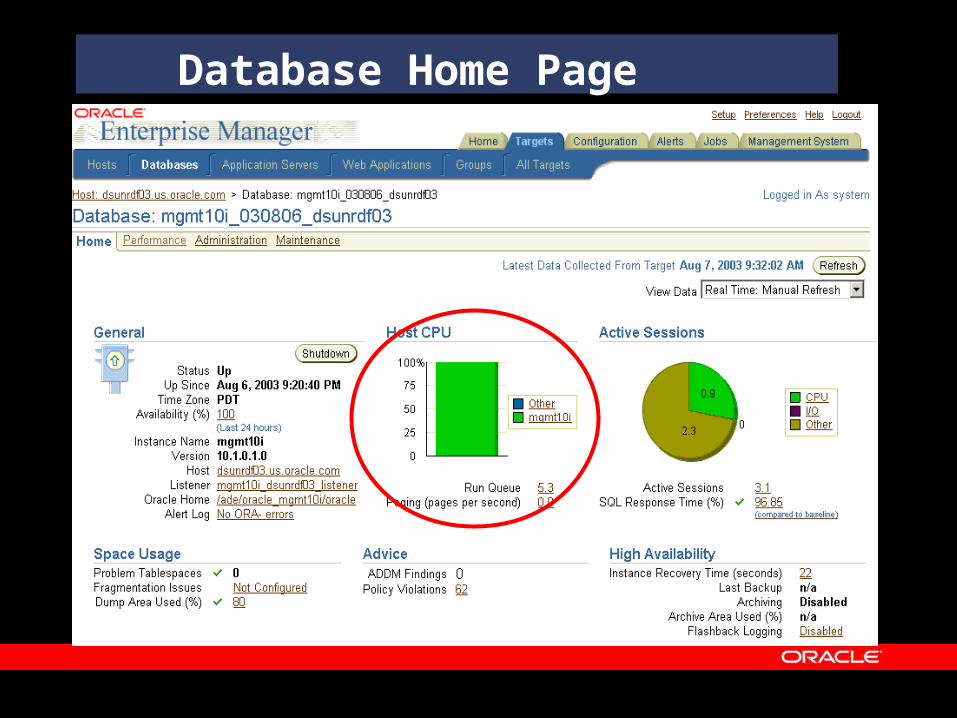
Database Home Page

Database Home Page
Database Home Page
Performance Page
Home Page
Perf Page
Top Session Top SQL Wait Detail
SQL Detail Session Detail
ADDM
ADDM Details

Database Performance Page

Database Performance Page highlight
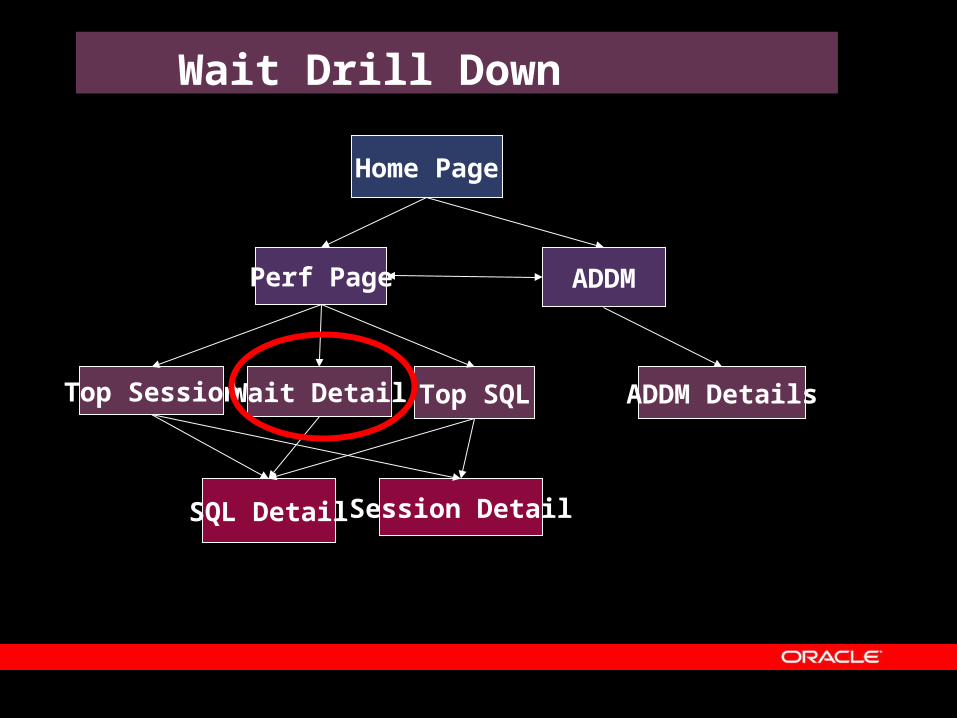
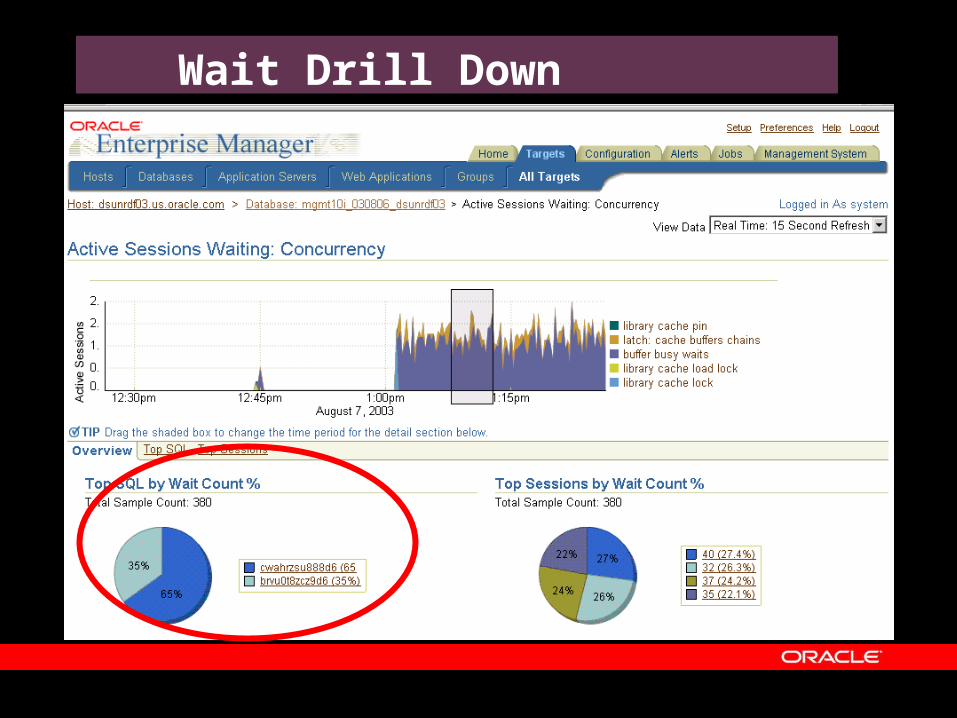
Wait Drill Down
Home Page
Perf Page
Top Session Wait Detail Top SQL
SQL Detail Session Detail
ADDM
ADDM Details

Wait Drill Down

Wait Drill Down
Wait Drill Down

Wait Drill Down highlight

Wait Drill Down – Top SQL
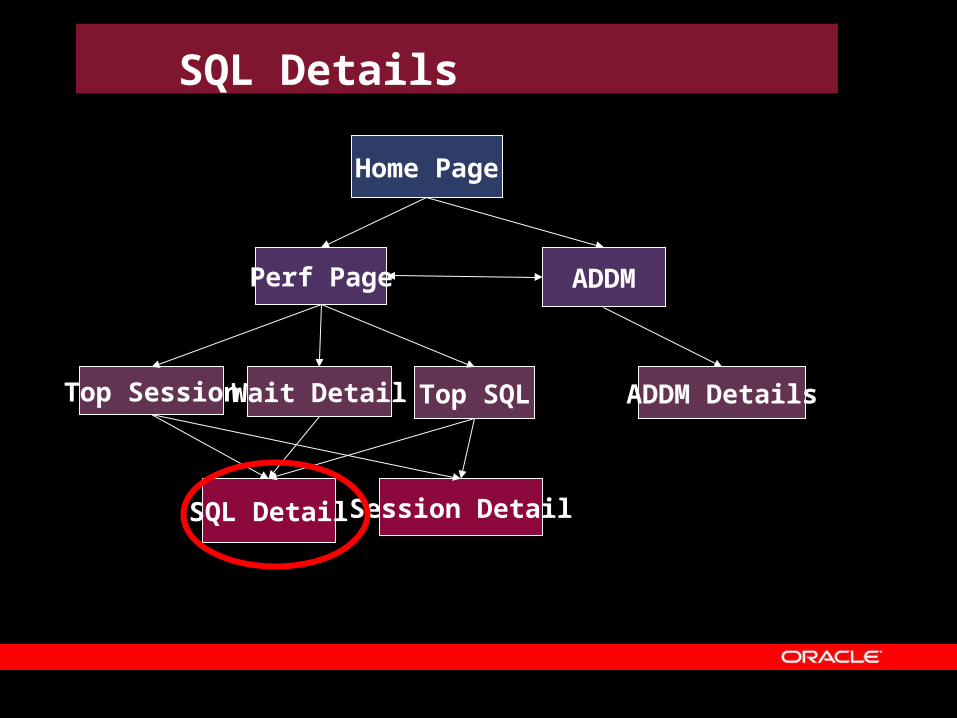
SQL Details
Home Page
Perf Page
Top Session Wait Detail Top SQL
SQL Detail Session Detail
ADDM
ADDM Details

SQL Details

New Features
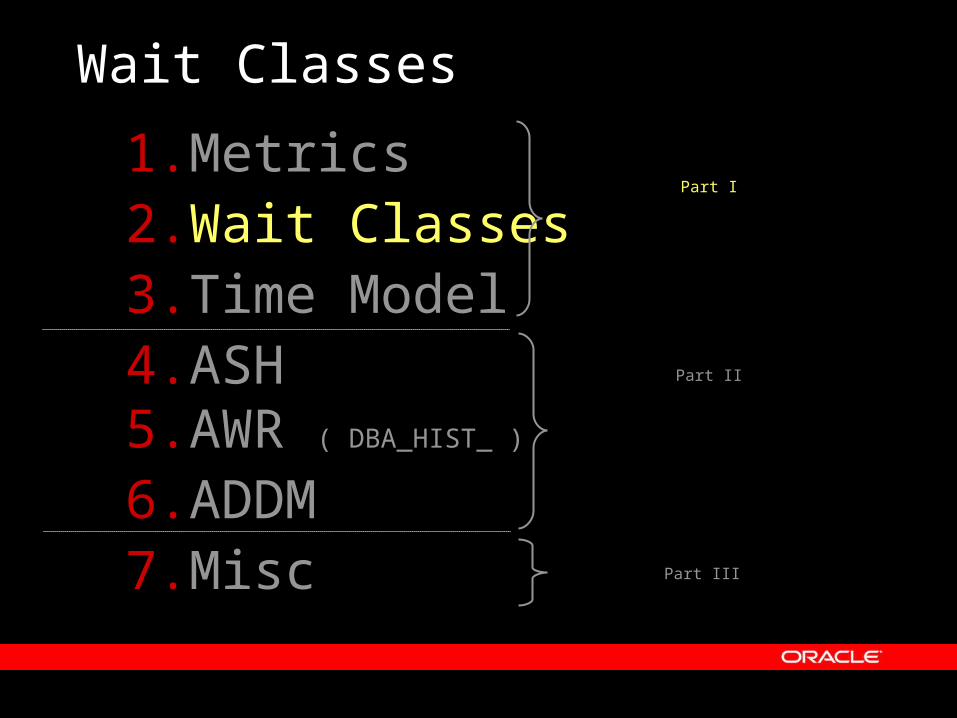
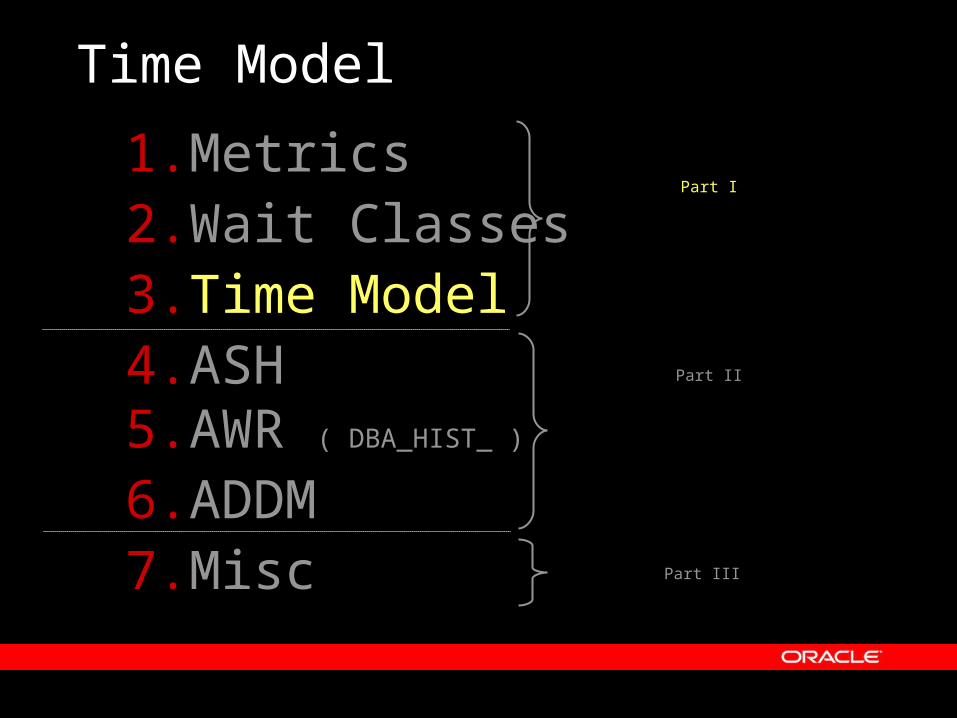
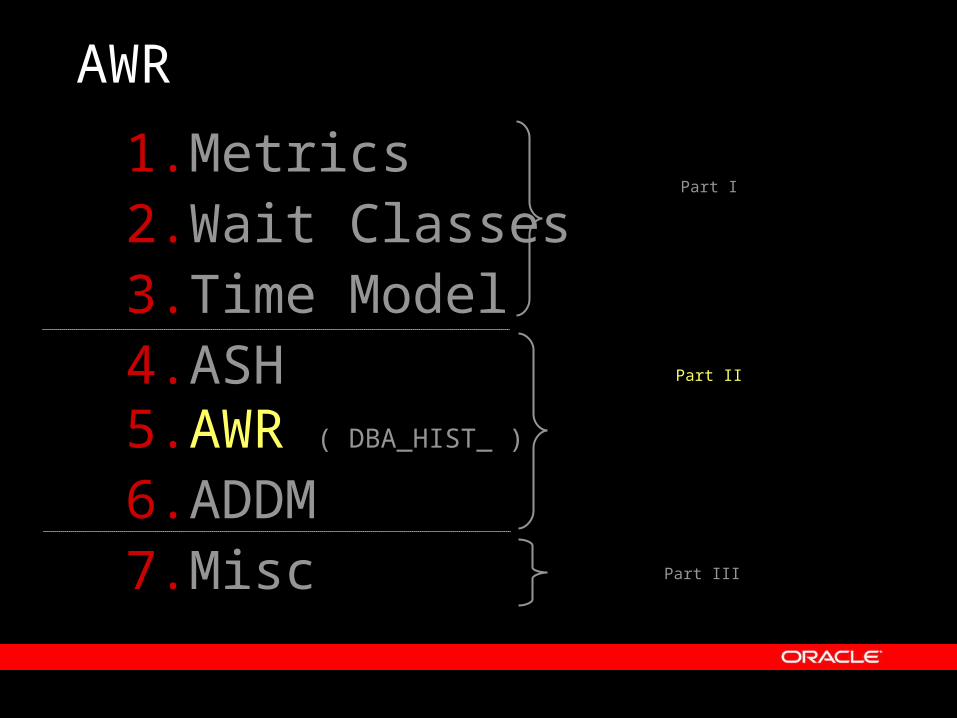
1.Metrics2.Wait Classes3.Time Model4.ASH5.AWR ( DBA_HIST_ )
6.ADDM7.Misc
Part I
Part II
Part III
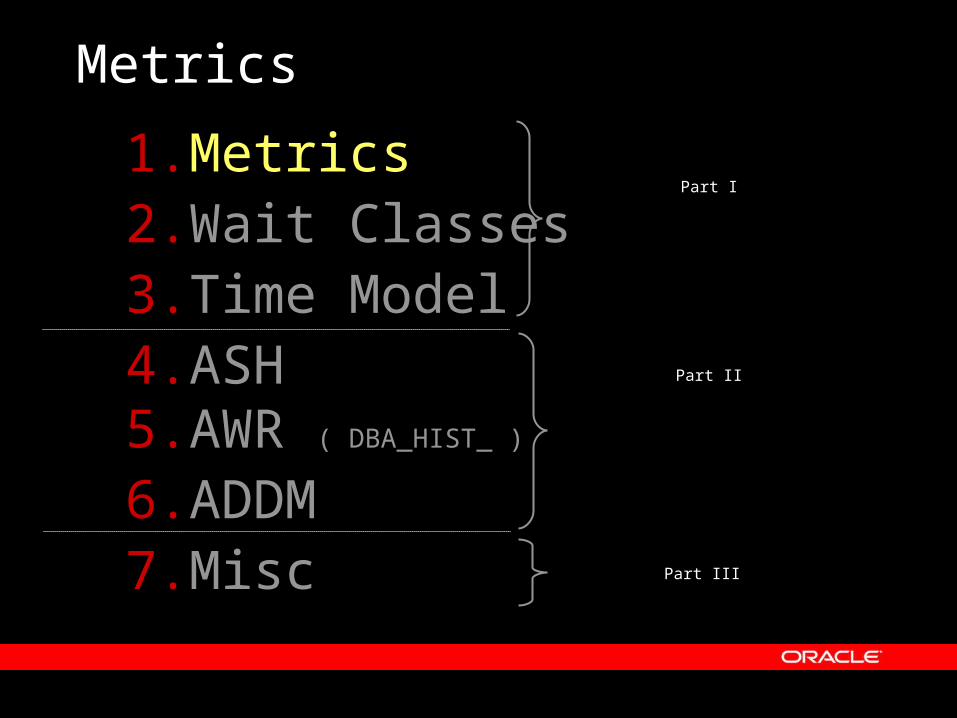
Metrics
1.Metrics2.Wait Classes3.Time Model4.ASH5.AWR ( DBA_HIST_ )
6.ADDM7.Misc
Part I
Part II
Part III
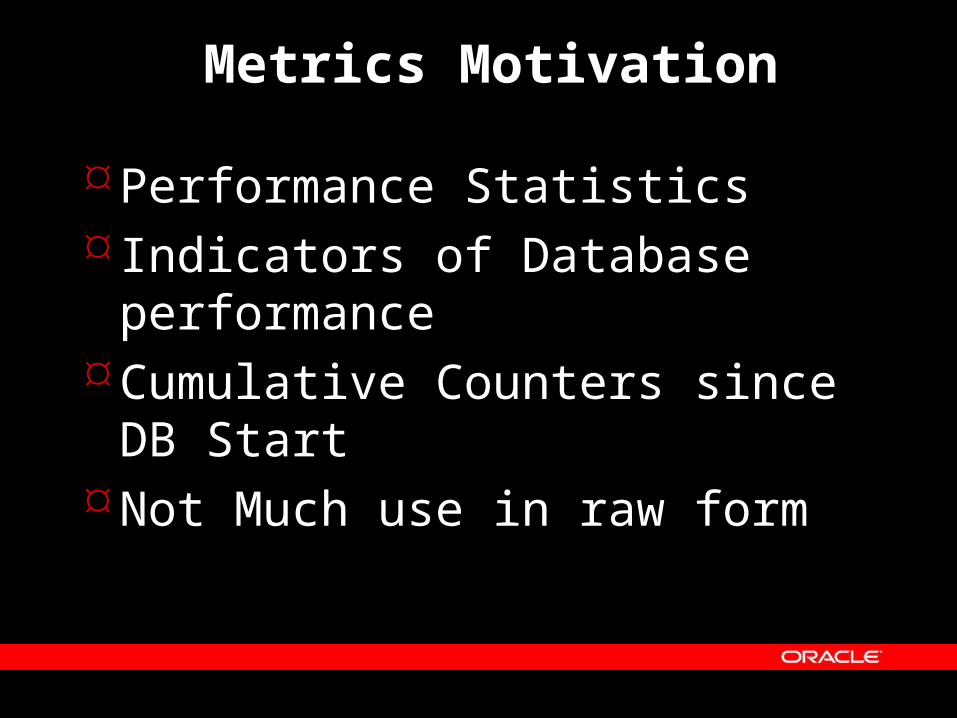
Metrics Motivation
Performance Statistics Indicators of Database
performanceCumulative Counters since DB
StartNot Much use in raw form
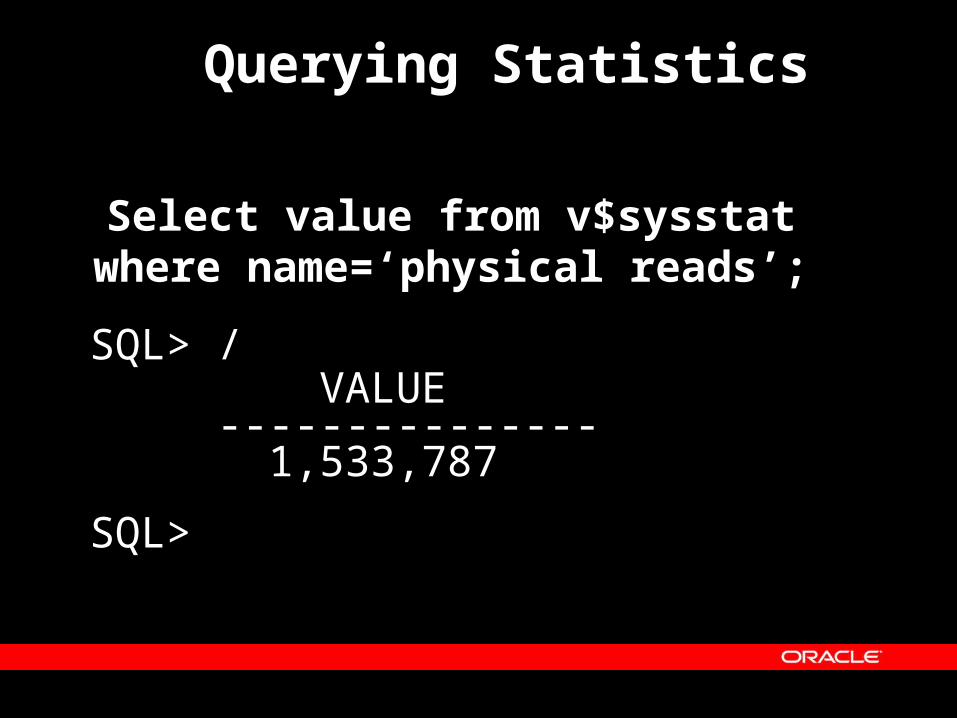
Querying Statistics
Select value from v$sysstat where name=‘physical reads’;
SQL> / VALUE --------------- 1,533,787
SQL>

Statistics are Cumulative
Statistics just keep growing
v$sysstat
physical reads
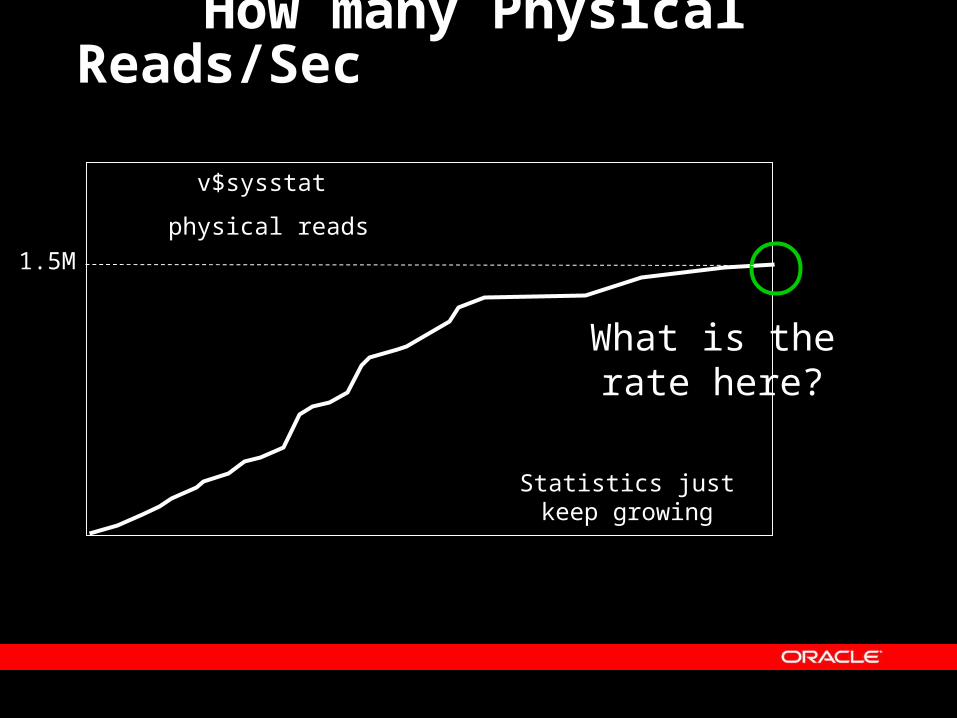
How many Physical Reads/Sec
Statistics just keep growing
v$sysstat
physical reads
What is the rate here?
1.5M

Low IO
v$sysstat
physical reads1.5M
IO’s
time
30 minutes
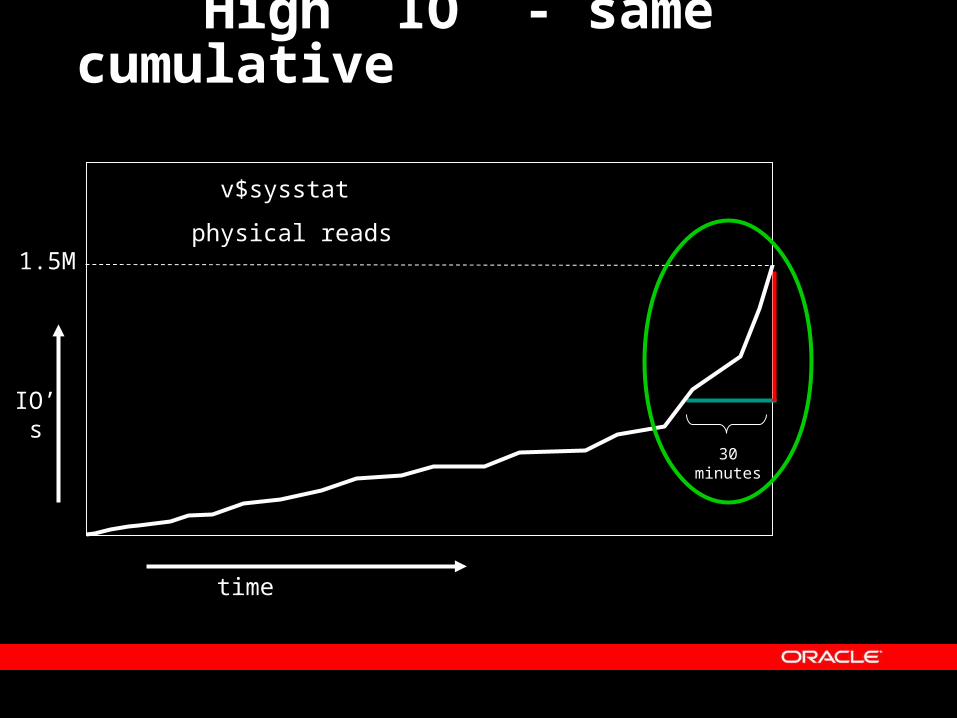
High IO - same cumulative
v$sysstat
physical reads1.5M
IO’s
time
30 minutes
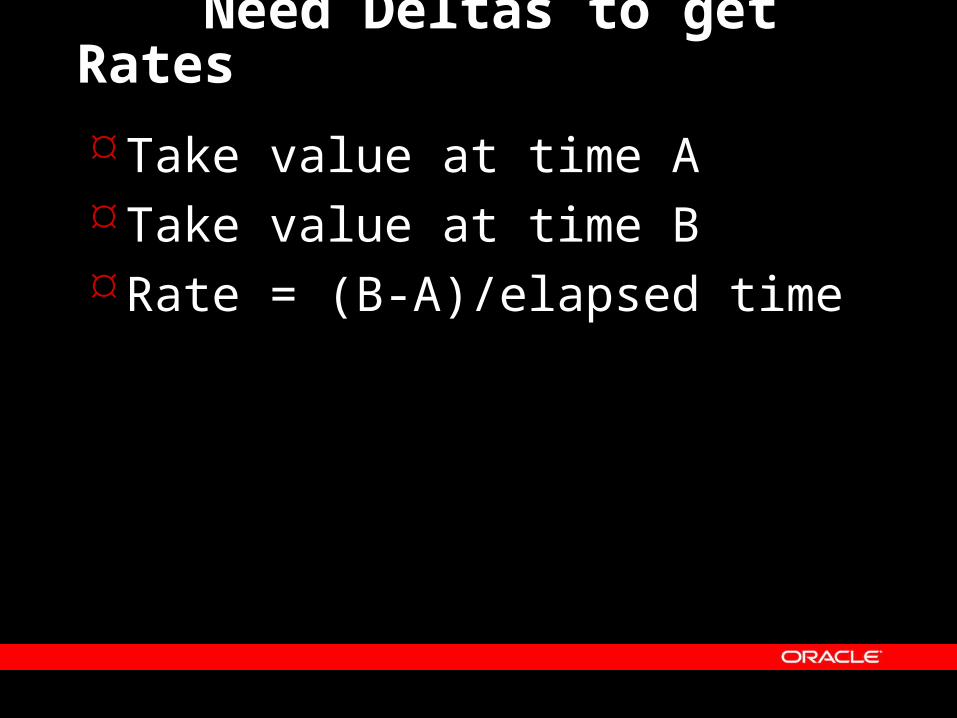
Need Deltas to get Rates
Take value at time A Take value at time BRate = (B-A)/elapsed time

Current Methods Utlbstat.sql/Utlestat.sql
– Creates tables, inserts, deletes
Statspack– needs to be set up
Customized Scripts– Take time to write, no standards
Bit overkill for just a quick statistic rate query
Solution : Metrics
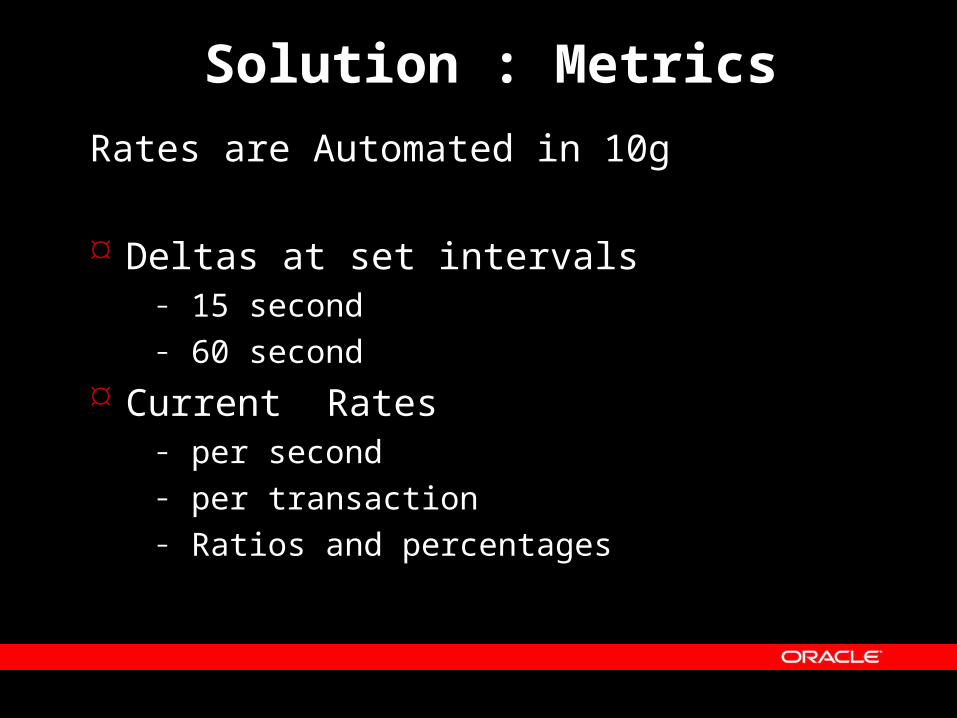
Rates are Automated in 10g
Deltas at set intervals– 15 second– 60 second
Current Rates – per second – per transaction– Ratios and percentages
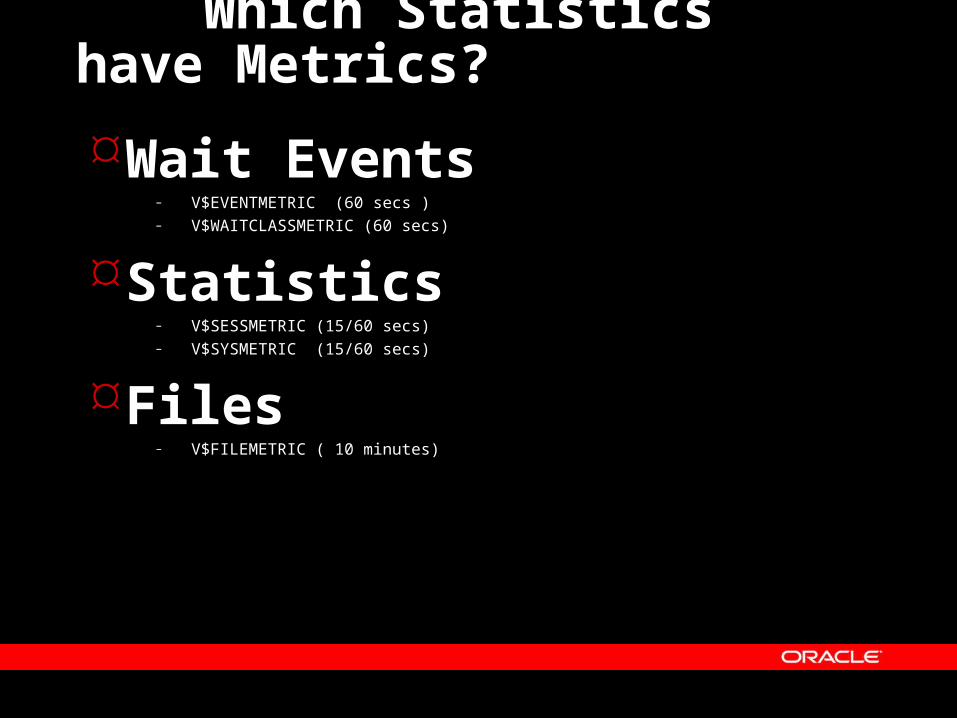
Which Statistics have Metrics?
Wait Events– V$EVENTMETRIC (60 secs )– V$WAITCLASSMETRIC (60 secs)
Statistics– V$SESSMETRIC (15/60 secs)– V$SYSMETRIC (15/60 secs)
Files– V$FILEMETRIC ( 10 minutes)
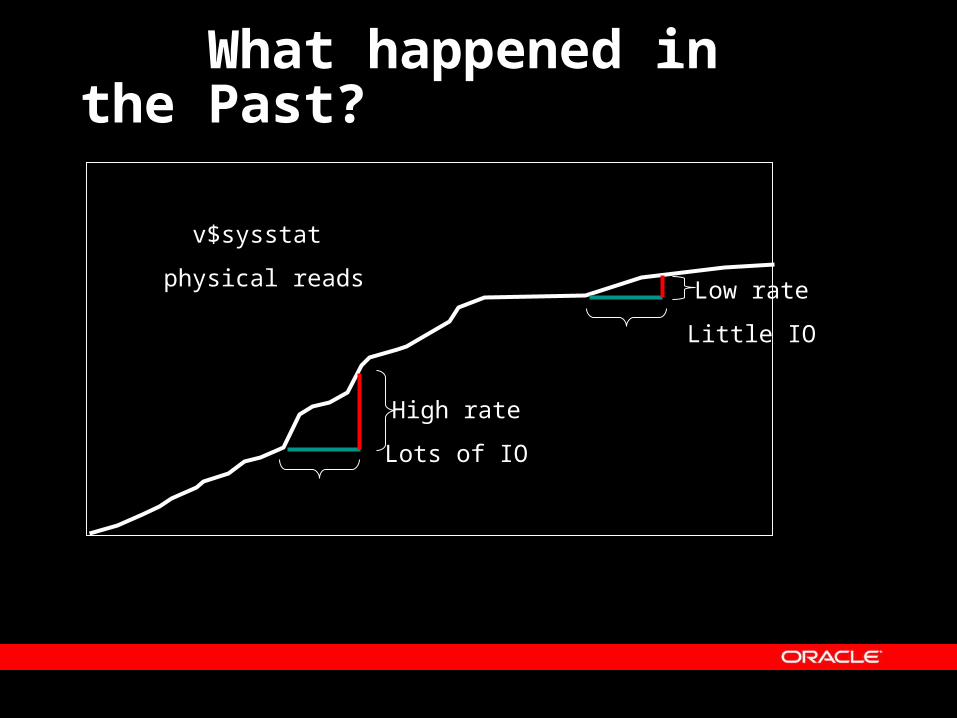
Short Term History: What happened in the Past?
High rate
Lots of IO
Low rate
Little IO
v$sysstat
physical reads

Solution: Metric History Tables Last 60 minutes of history
v$sysstat
physical reads
60 secs 60 secs 60 secs 60 secs 60 secs 60 secs 60 secs
delta
delta
delta
delta
deltadeltadelta

Metric History Tables In memory
Statistics– V$SYSMETRIC_HISTORY (15 and 60 seconds)
File IO– V$FILEMETRIC_HISTORY (10 minutes)
Waits– V$WAITCLASSMETRIC_HISTORY ( 60 seconds)
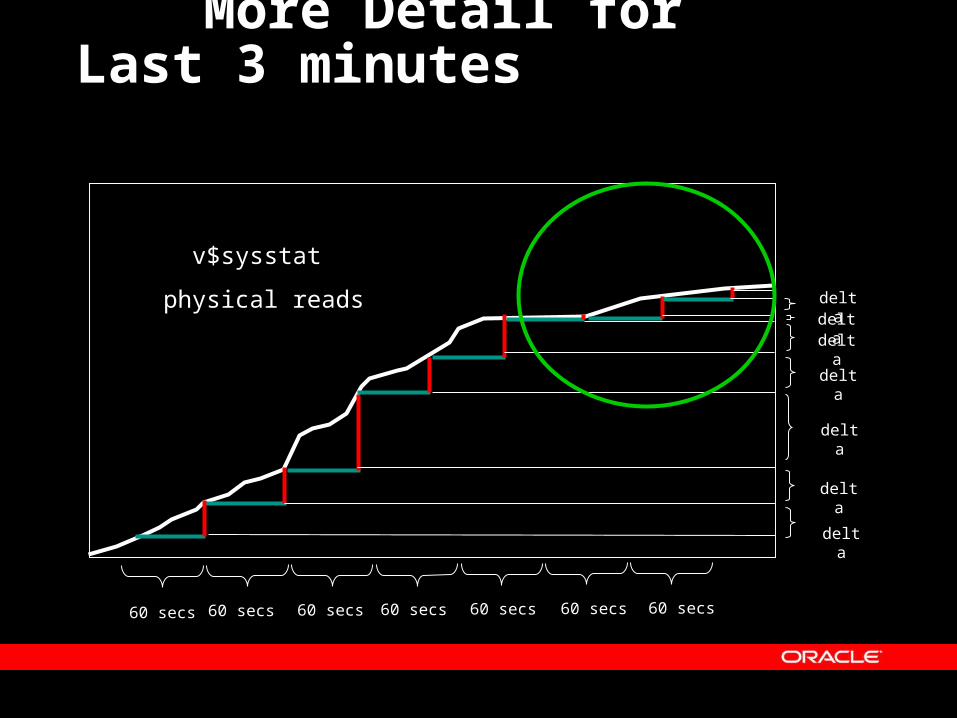
More Detail for Last 3 minutes
v$sysstat
physical reads
60 secs 60 secs 60 secs 60 secs 60 secs 60 secs 60 secs
delta
delta
delta
delta
deltadeltadelta

Statistics have 15 sec deltas
3 Minutes 15 second deltas
v$sysstat
physical reads
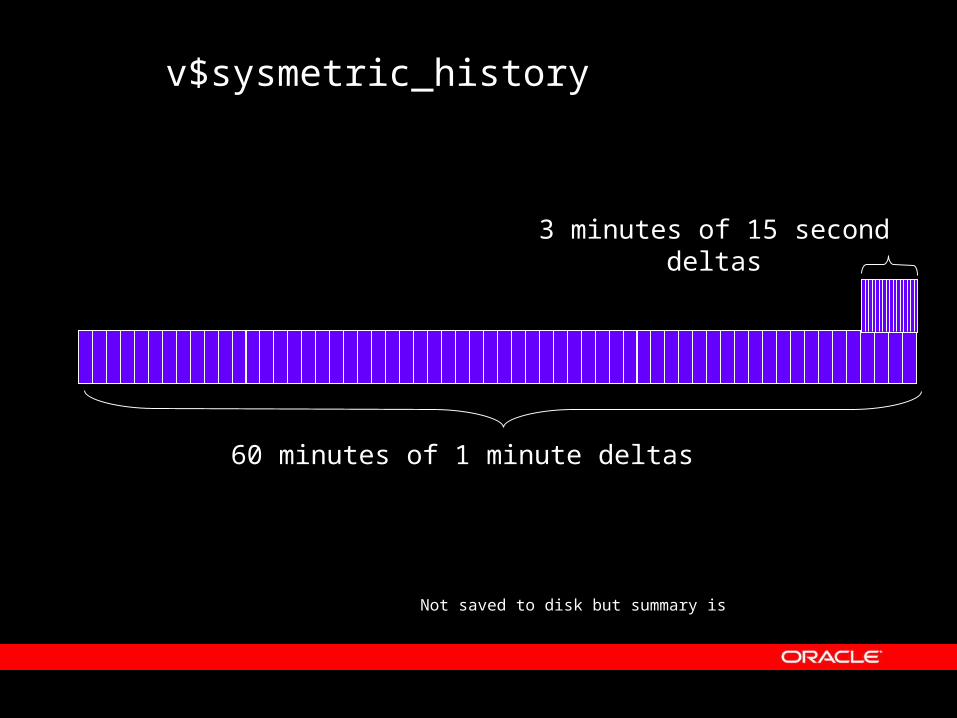
v$sysmetric_history
Not saved to disk but summary is
60 minutes of 1 minute deltas
3 minutes of 15 second deltas

Long Term History, 7 days
On Disk
Statistics– DBA_HIST_SYSMETRIC_SUMMARY– DBA_HIST_SYSSTAT (cumulative)– DBA_HIST_SYSMETRIC_HISTORY (alerts)
Waits– WAITCLASSMETRIC_HISTORY (alerts) – DBA_HIST_SYSTEM_EVENT (cumulative)
File IO– DBA_HIST_FILEMETRIC_HISTORY (alerts)– DBA_HIST_FILESTATXS (cumulative)
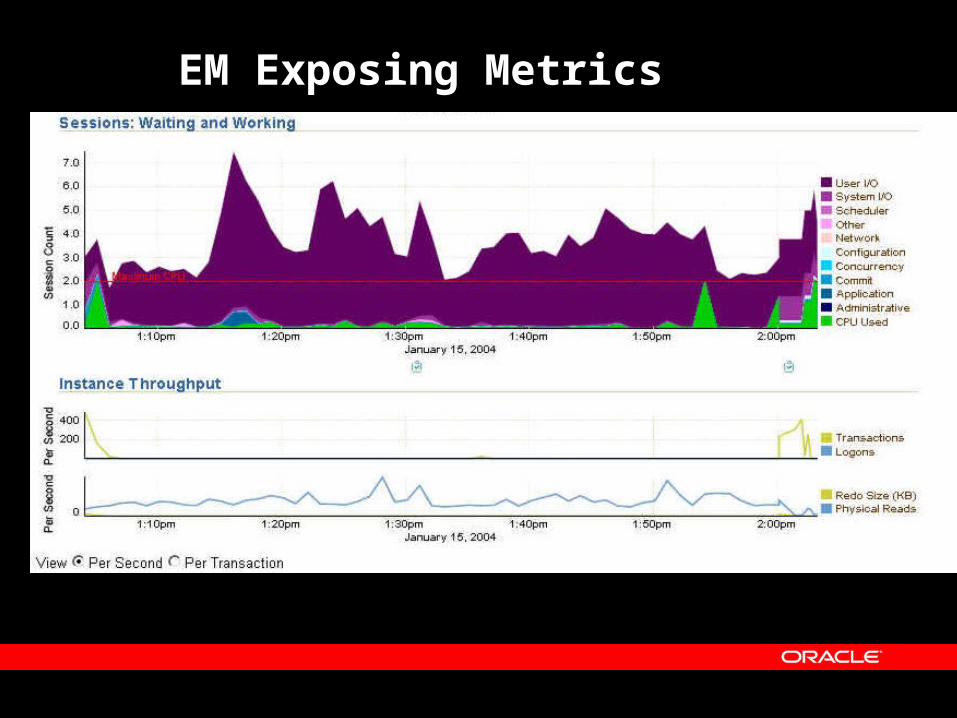
EM Exposing Metrics

In Resume: Statistics
• Raw : v$sysstat• Now : v$sysmetric • 1 Hour : v$sysmetric_history (in memory)
• 7 Days : dba_hist_sysmetric_summary (with AWR)
There is also v$sessmetric
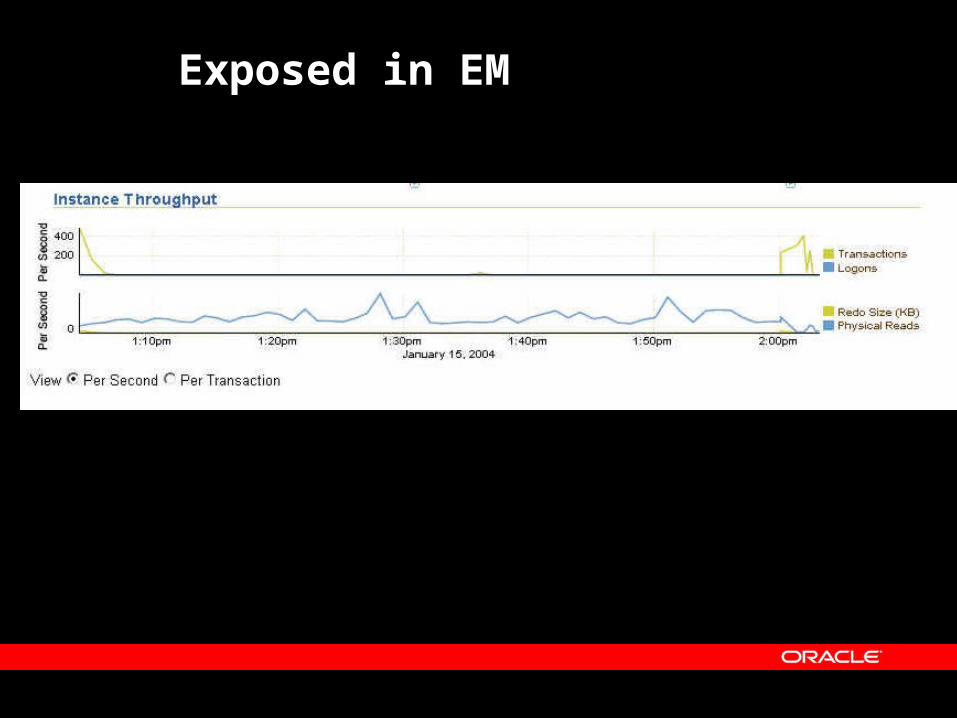
Exposed in EM
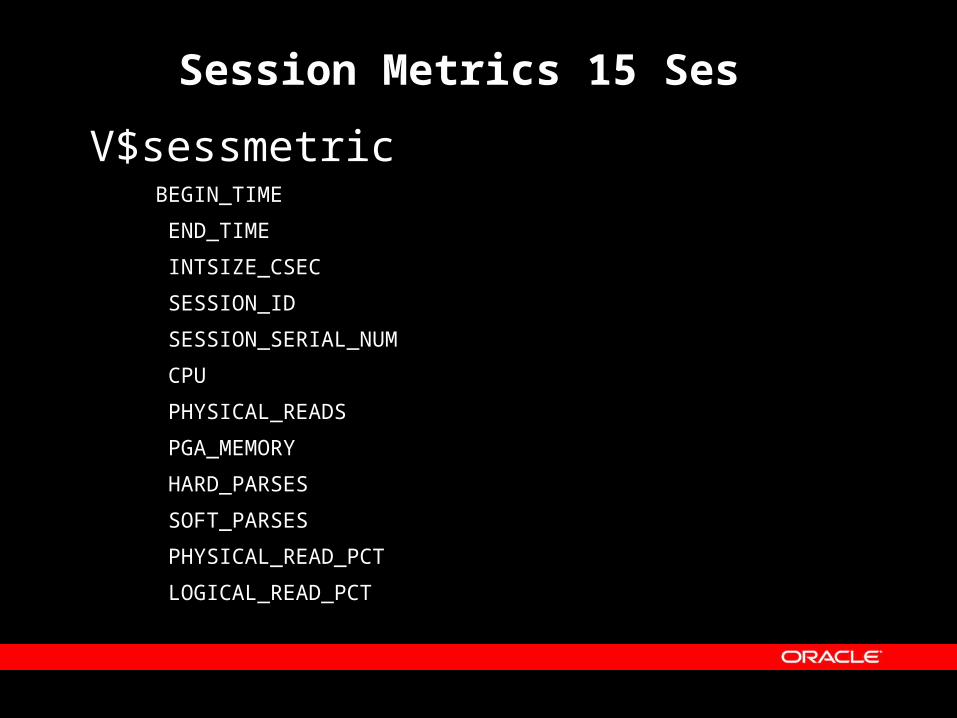
Session Metrics 15 Ses
V$sessmetricBEGIN_TIME
END_TIME
INTSIZE_CSEC
SESSION_ID
SESSION_SERIAL_NUM
CPU
PHYSICAL_READS
PGA_MEMORY
HARD_PARSES
SOFT_PARSES
PHYSICAL_READ_PCT
LOGICAL_READ_PCT
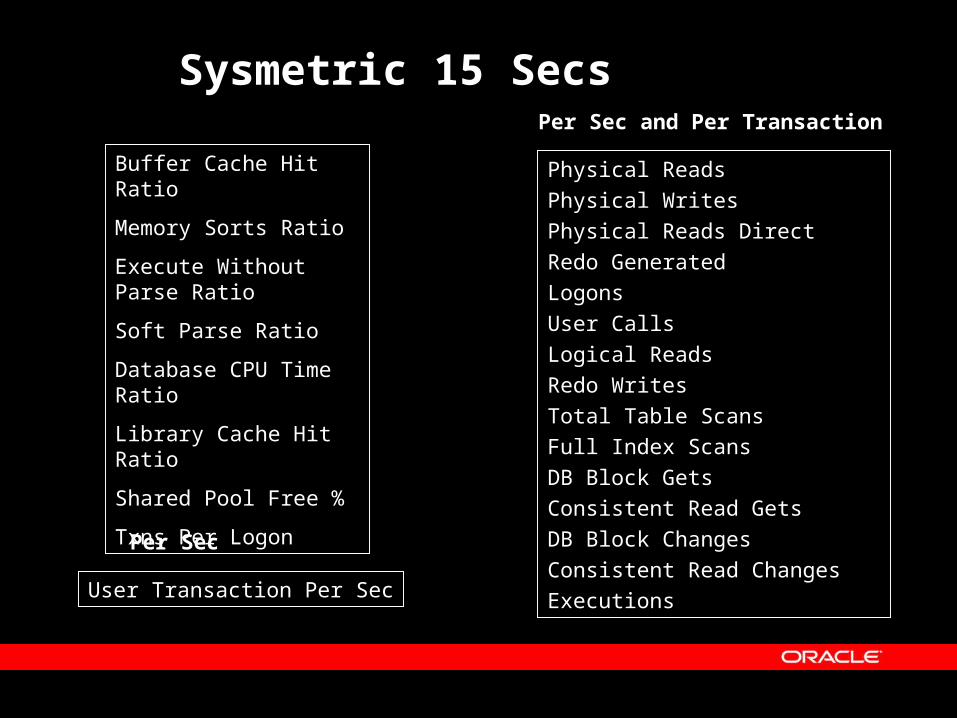
Sysmetric 15 Secs
Buffer Cache Hit Ratio
Memory Sorts Ratio
Execute Without Parse Ratio
Soft Parse Ratio
Database CPU Time Ratio
Library Cache Hit Ratio
Shared Pool Free %
Txns Per Logon
Physical Reads
Physical Writes
Physical Reads Direct
Redo Generated
Logons
User Calls
Logical Reads
Redo Writes
Total Table Scans
Full Index Scans
DB Block Gets
Consistent Read Gets
DB Block Changes
Consistent Read Changes
ExecutionsUser Transaction Per Sec
Per Sec and Per Transaction
Per Sec

Sysmetric 60 Sec
Buffer Cache Hit Ratio
Memory Sorts Ratio
Redo Allocation Hit Ratio
User Commits Percentage
User Rollbacks Percentage
Cursor Cache Hit Ratio
Rows Per Sort
Execute Without Parse Ratio
Soft Parse Ratio
User Calls Ratio
Global Cache Average CR Get Time
Global Cache Average Current Get Time
Global Cache Blocks Corrupted
Global Cache Blocks Lost
Current Logons Count
Current Open Cursors Count
User Limit %
SQL Service Response Time
Database Wait Time Ratio
Database CPU Time Ratio
Row Cache Hit Ratio
Row Cache Miss Ratio
Library Cache Hit Ratio
Library Cache Miss Ratio
Shared Pool Free %
PGA Cache Hit %
Process Limit %
Session Limit %
Txns Per Logon
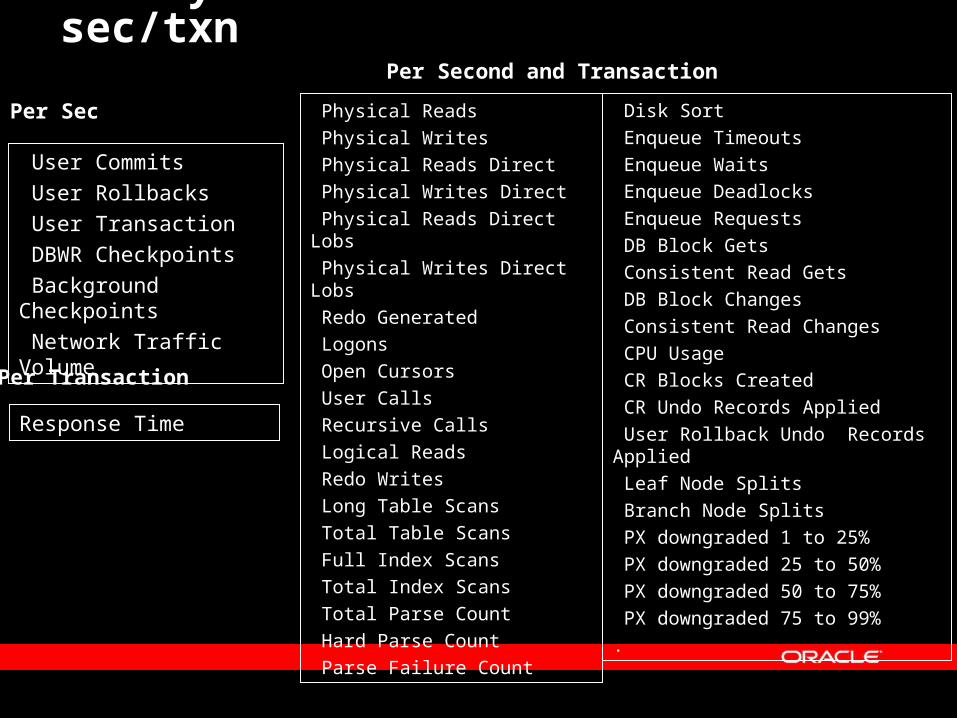
Sysmetric 60 Sec rates sec/txn
Physical Reads
Physical Writes
Physical Reads Direct
Physical Writes Direct
Physical Reads Direct Lobs
Physical Writes Direct Lobs
Redo Generated
Logons
Open Cursors
User Calls
Recursive Calls
Logical Reads
Redo Writes
Long Table Scans
Total Table Scans
Full Index Scans
Total Index Scans
Total Parse Count
Hard Parse Count
Parse Failure Count
User Commits
User Rollbacks
User Transaction
DBWR Checkpoints
Background Checkpoints
Network Traffic Volume
Response Time
Disk Sort
Enqueue Timeouts
Enqueue Waits
Enqueue Deadlocks
Enqueue Requests
DB Block Gets
Consistent Read Gets
DB Block Changes
Consistent Read Changes
CPU Usage
CR Blocks Created
CR Undo Records Applied
User Rollback Undo Records Applied
Leaf Node Splits
Branch Node Splits
PX downgraded 1 to 25%
PX downgraded 25 to 50%
PX downgraded 50 to 75%
PX downgraded 75 to 99%
.
Per Second and Transaction
Per Sec
Per Transaction

Statistics Metrics
v$sessmetricBEGIN_TIME
END_TIME
INTSIZE_CSEC
SESSION_ID
SESSION_SERIAL_NUM
CPU
PHYSICAL_READS
PGA_MEMORY
HARD_PARSES
SOFT_PARSES
PHYSICAL_READ_PCT
LOGICAL_READ_PCTv$metricname GROUP_ID GROUP_NAME METRIC_ID METRIC_NAME METRIC_UNIT
v$sysmetric_summary BEGIN_TIME END_TIME INTSIZE_CSEC -> intsize GROUP_ID METRIC_ID METRIC_NAME NUM_INTERVAL MAXVAL MINVAL AVERAGE STANDARD_DEVIATION METRIC_UNIT
v$sysmetric_historyBEGIN_TIME
END_TIME
INTSIZE_CSEC
GROUP_ID
METRIC_ID
METRIC_NAME
VALUE
METRIC_UNIT
v$sysmetric BEGIN_TIME END_TIME INTSIZE_CSEC GROUP_ID METRIC_ID METRIC_NAME VALUE METRIC_UNIT v$sysstat
STATISTIC# NAME CLASS VALUE HASH
Stats – ER
v$metricgroup GROUP_ID
NAME
INTERVAL_SIZE
MAX_INTERVAL
v$sessstat STATISTIC# NAME CLASS VALUE HASH

In Resume: Waits
• Raw : v$system_event• Now : v$eventmetric (60 seconds)• 1 Hour : -----• 7 Days : dba_hist_system_event (cumulative)

In Resume: Files
• Raw : v$fileio• Now : v$filemetric ( 10 Minutes)• 1 Hour : v$filemetric_history ( 1 hour, 7
points)• 7 Days : dba_hist_filemetric_history (alerts
only)

System Statistics ViewStats ( V$stat_name) Waits ( V$event_name ) Files
Raw V$sysstat v$system_event
v$event_histogram
v$system_wait_class
v$fileio
Now
v$metricgroupv$metricname
V$sysmetric v$eventmetric
v$waitclassmetric
v$filemetric
1 Hour
V$sysmetric_history V$sysmetric_summary
v$waitclassmetric_history v$filemetric_history
7 days
DBA_HIST_*
SYSMETRIC_SUMMARY
SYSSTAT (cumulative)
SYSMETRIC_HISTORY (alerts)
SYSTEM_EVENT(cumulative)
WAITCLASSMETRIC_HISTORY (alert) FILESTATXS (cumulative)
TEMPSTATXS (cumulative)
FILEMETRIC_HISTORY (alert)
Metrics Summary
Current rates are easy and efficient Last hour quickly accessible History kept for a week
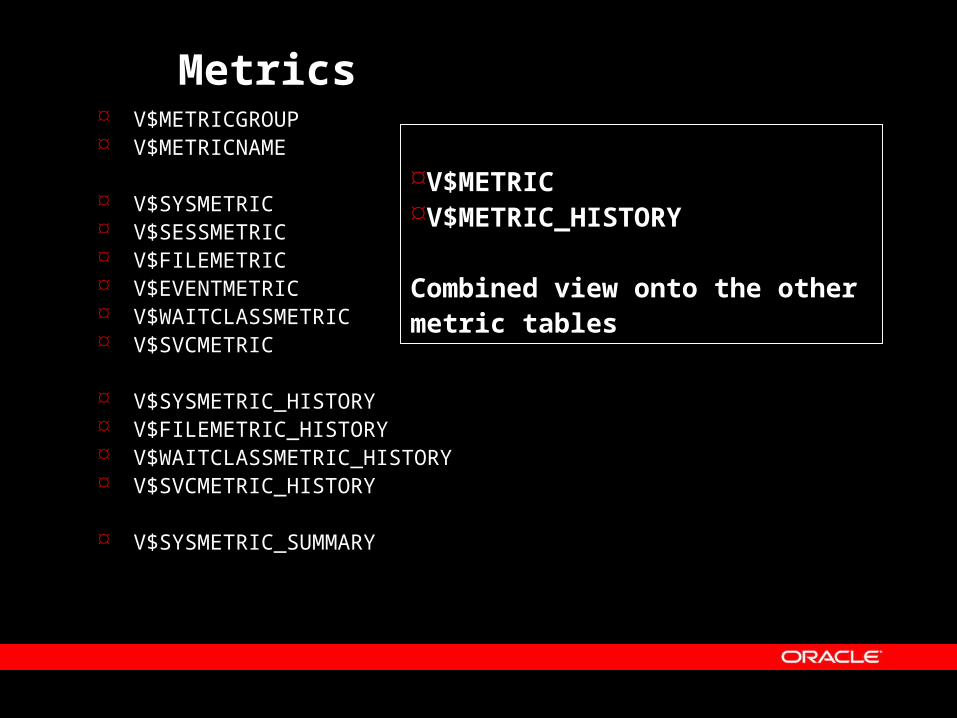
Metrics V$METRICGROUP V$METRICNAME
V$SYSMETRIC V$SESSMETRIC V$FILEMETRIC V$EVENTMETRIC V$WAITCLASSMETRIC V$SVCMETRIC
V$SYSMETRIC_HISTORY V$FILEMETRIC_HISTORY V$WAITCLASSMETRIC_HISTORY V$SVCMETRIC_HISTORY
V$SYSMETRIC_SUMMARY
V$METRICV$METRIC_HISTORY
Combined view onto the other metric tables
Wait Classes
1.Metrics2.Wait Classes3.Time Model4.ASH5.AWR ( DBA_HIST_ )
6.ADDM7.Misc
Part I
Part II
Part III

Wait Classes Administrative (39)
– switch logfile– rebuild index
Application (11)– enqueues – sqlnet break/reset
Cluster (113)
Commit (1)– Log file Sync
Concurrency (12)– Latches: cbc, lbc,– Lib cache locks– Buffer busy wait
Configuration (20)– log file size– Enqueues: ST, HW, ITL– Latch: redo copy,shared pool
Idle (56)
Network (25)
System I/O (19)
Scheduler (6)
User I/O (12)
Other (485)
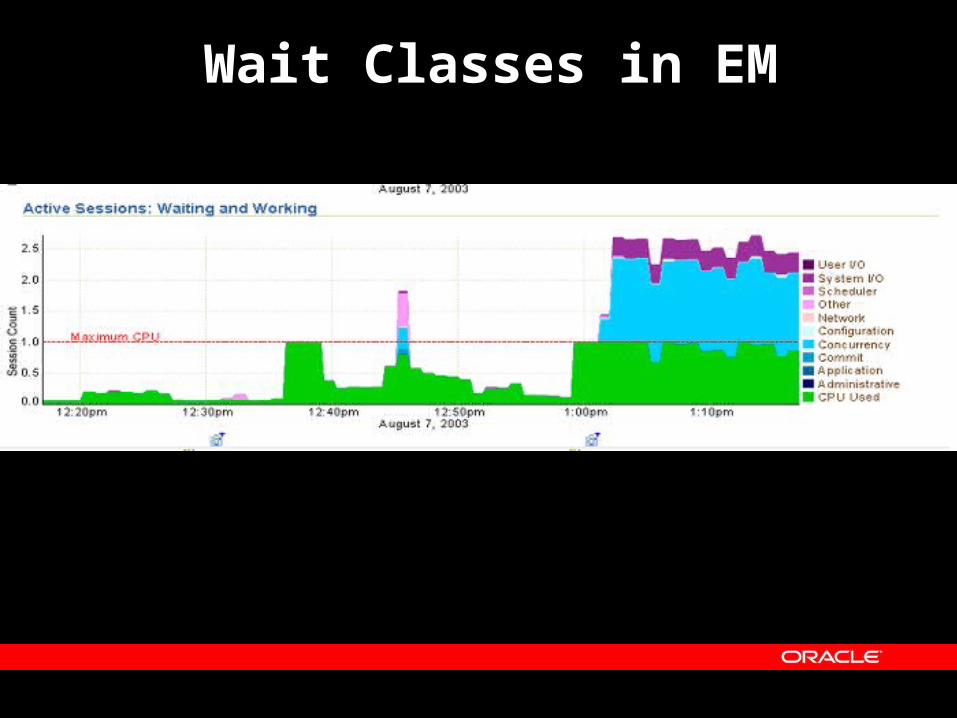
Wait Classes in EM
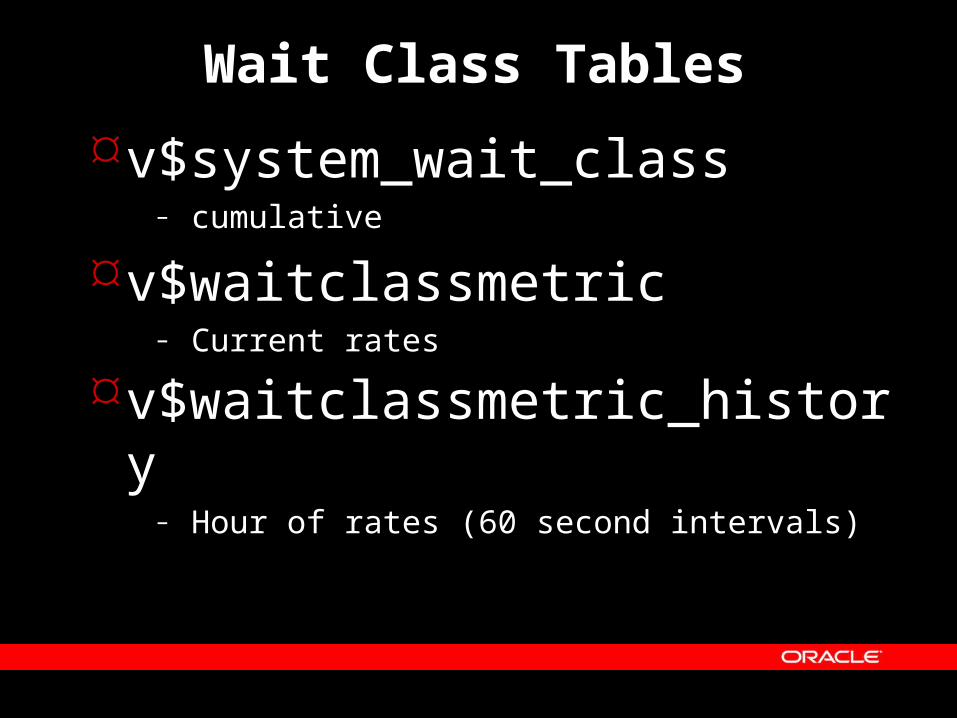
Wait Class Tables
v$system_wait_class– cumulative
v$waitclassmetric – Current rates
v$waitclassmetric_history
– Hour of rates (60 second intervals)
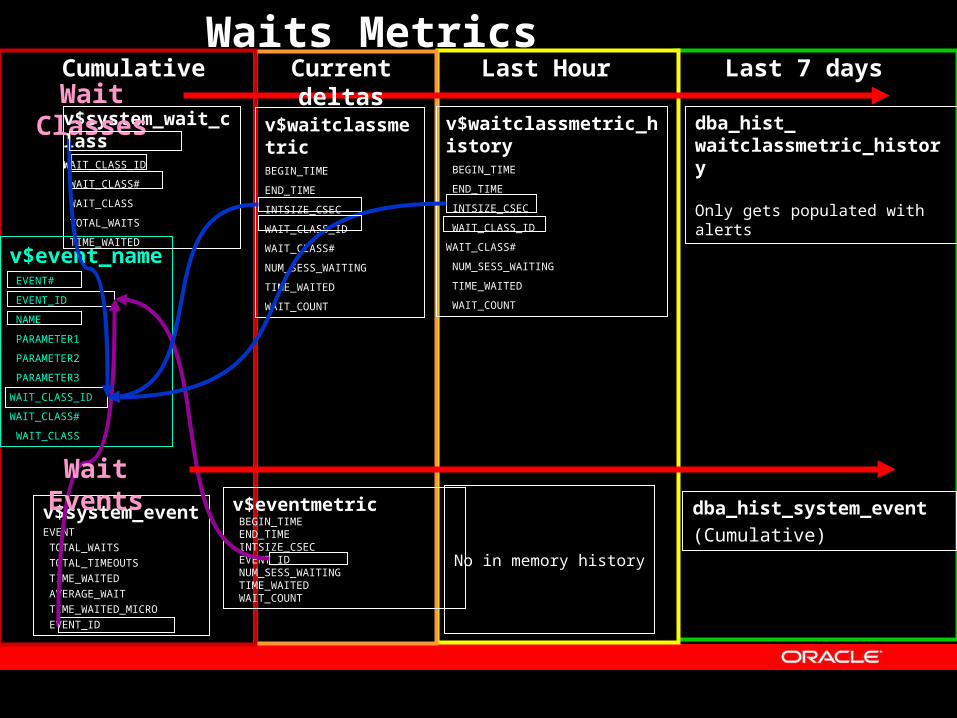
v$waitclassmetricBEGIN_TIME
END_TIME
INTSIZE_CSEC
WAIT_CLASS_ID
WAIT_CLASS#
NUM_SESS_WAITING
TIME_WAITED
WAIT_COUNT
Waits Metrics
v$waitclassmetric_history BEGIN_TIME
END_TIME
INTSIZE_CSEC
WAIT_CLASS_ID
WAIT_CLASS#
NUM_SESS_WAITING
TIME_WAITED
WAIT_COUNT
v$eventmetric BEGIN_TIME END_TIME INTSIZE_CSEC EVENT_ID NUM_SESS_WAITING TIME_WAITED WAIT_COUNT
v$event_name EVENT#
EVENT_ID
NAME
PARAMETER1
PARAMETER2
PARAMETER3
WAIT_CLASS_ID
WAIT_CLASS#
WAIT_CLASS
v$system_wait_classWAIT_CLASS_ID
WAIT_CLASS#
WAIT_CLASS
TOTAL_WAITS
TIME_WAITED
v$system_eventEVENT
TOTAL_WAITS
TOTAL_TIMEOUTS
TIME_WAITED
AVERAGE_WAIT
TIME_WAITED_MICRO
EVENT_ID
No in memory history
dba_hist_system_event
(Cumulative)
dba_hist_waitclassmetric_history
Only gets populated with alerts
Wait Classes
Wait Events
Cumulative Current deltas Last Hour Last 7 days
Time Model
1.Metrics2.Wait Classes3.Time Model4.ASH5.AWR ( DBA_HIST_ )
6.ADDM7.Misc
Part I
Part II
Part III

Time Model
New concept• DB Time
Total time for all database calls• cpu time • wait time
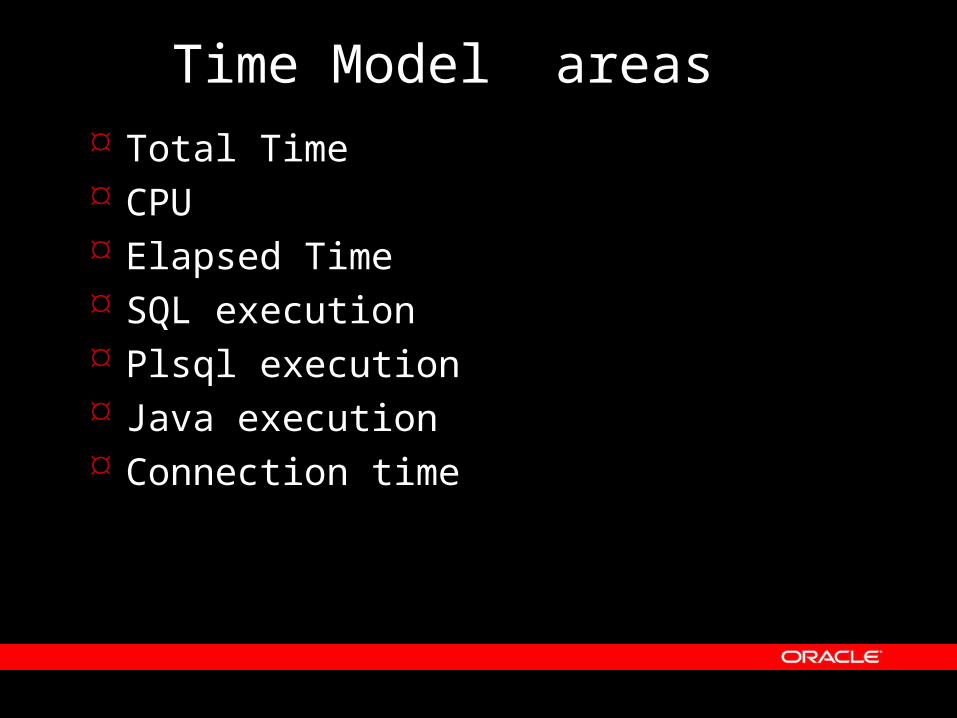
Time Model areas Total Time CPU Elapsed Time SQL execution Plsql execution Java execution Connection time
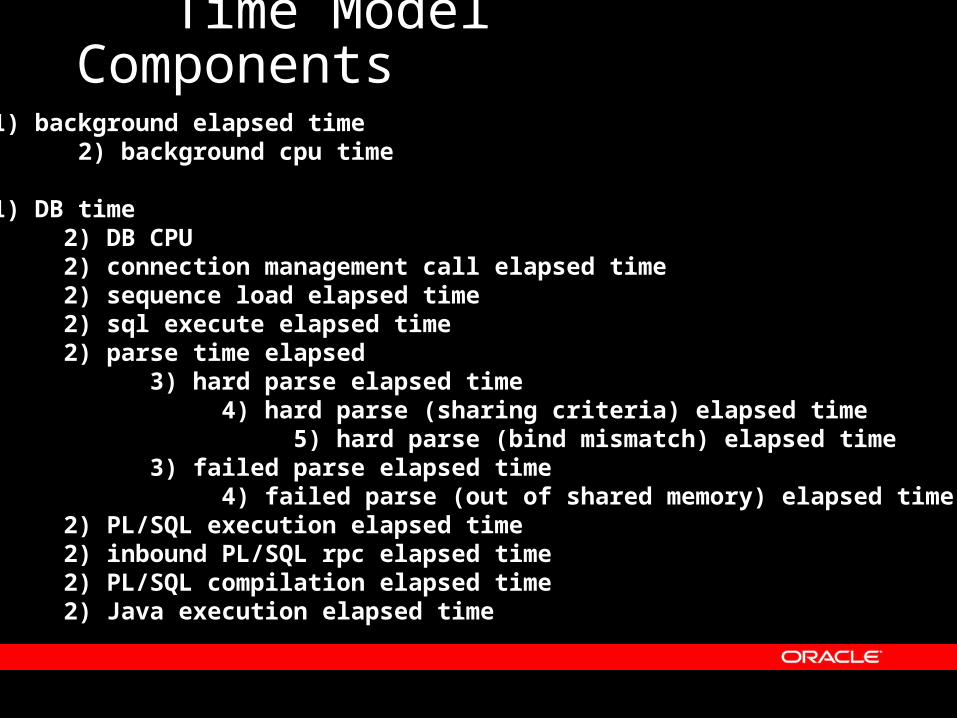
Time Model Components1) background elapsed time 2) background cpu time
1) DB time 2) DB CPU 2) connection management call elapsed time 2) sequence load elapsed time 2) sql execute elapsed time 2) parse time elapsed 3) hard parse elapsed time 4) hard parse (sharing criteria) elapsed time 5) hard parse (bind mismatch) elapsed time 3) failed parse elapsed time 4) failed parse (out of shared memory) elapsed time 2) PL/SQL execution elapsed time 2) inbound PL/SQL rpc elapsed time 2) PL/SQL compilation elapsed time 2) Java execution elapsed time
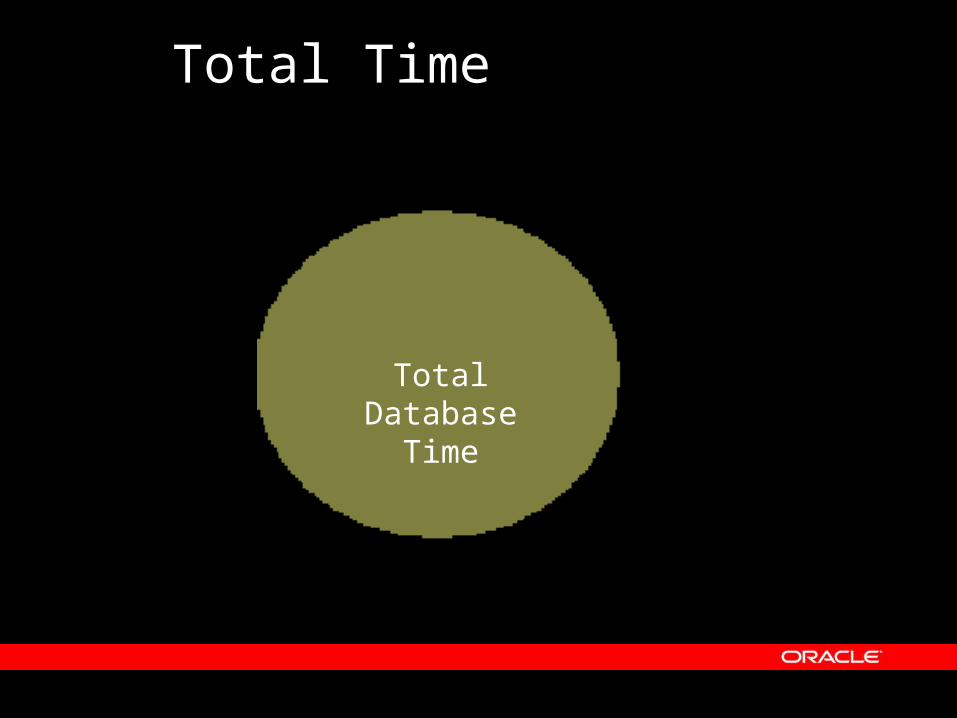
Total Time
Total Database Time
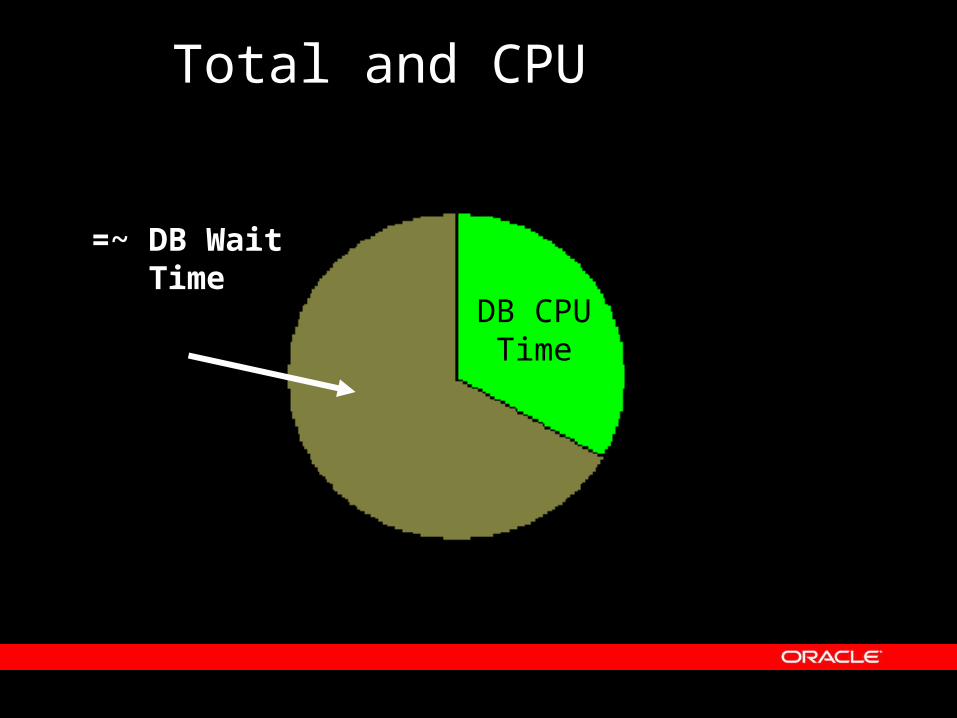
Total and CPU
DB CPU Time
=~ DB Wait Time
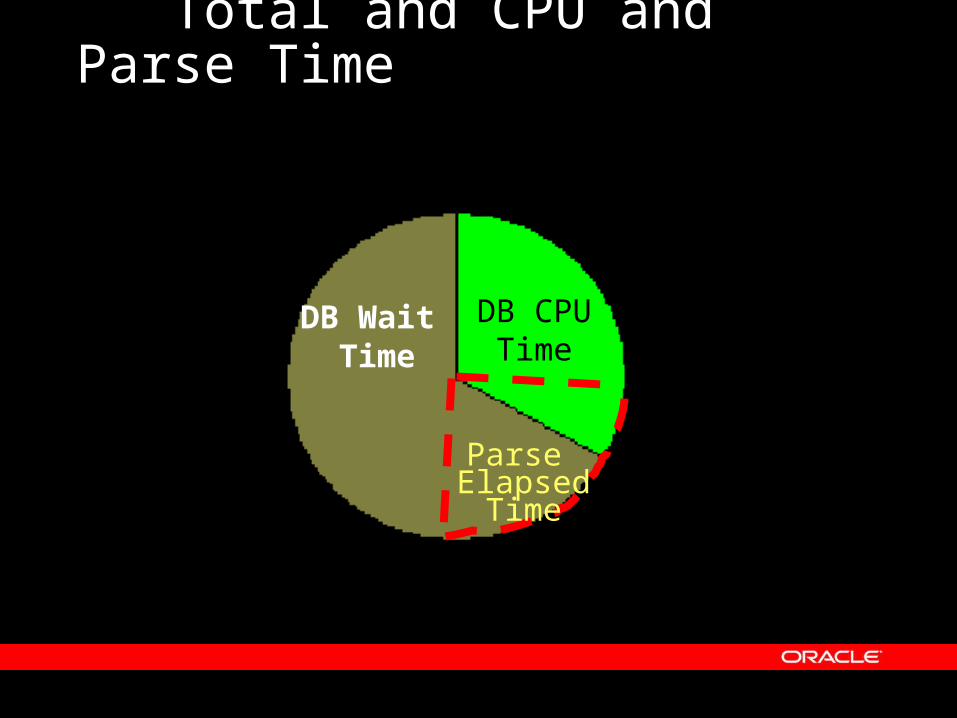
Total and CPU and Parse Time
DB CPU Time
DB Wait
Time
Parse Elapsed
Time
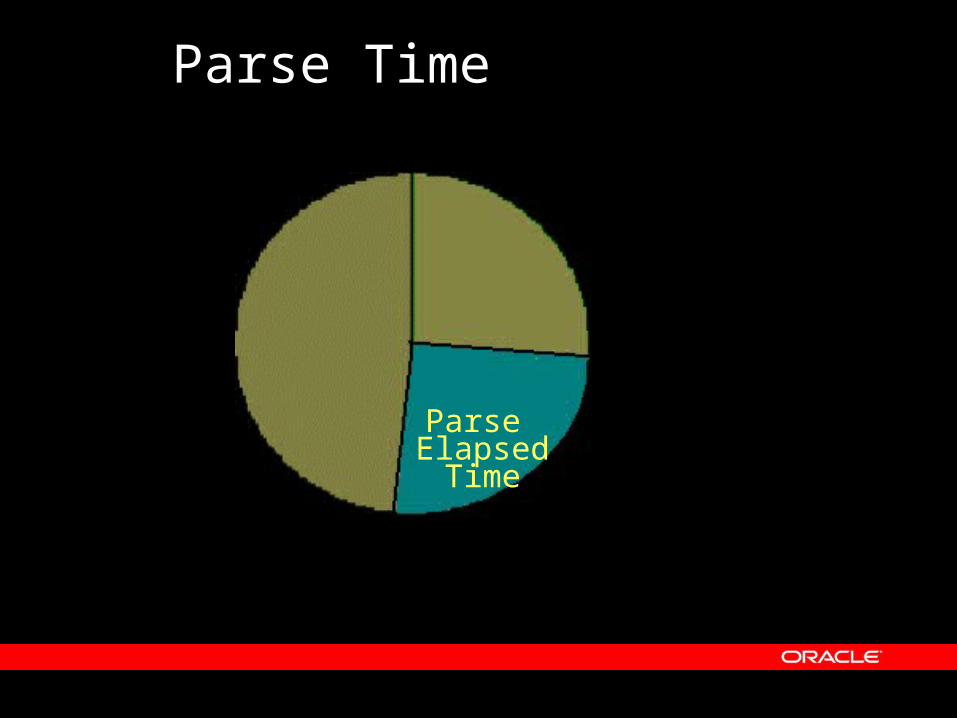
Parse Time
Parse Elapsed
Time

Hard Parse
Parse
time
elapsed
hard parse elapsed time
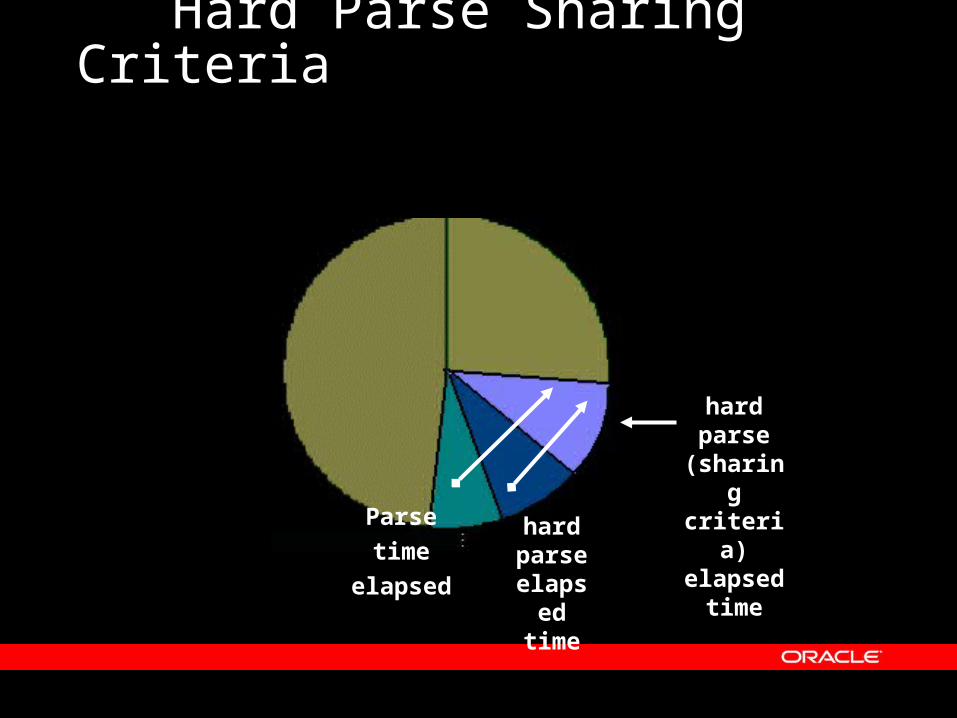
Hard Parse Sharing Criteria
Parse
time
elapsed
hard parse elapsed time
hard parse
(sharing criteria) elapsed
time
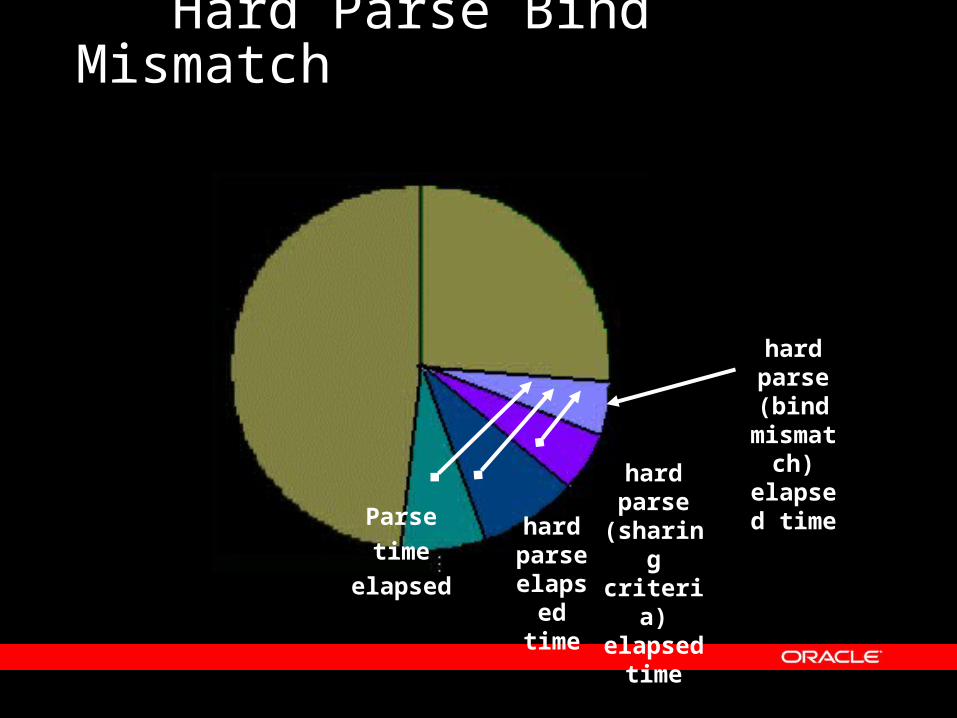
Hard Parse Bind Mismatch
Parse
time
elapsed
hard parse elapsed time
hard parse
(sharing criteria) elapsed
time
hard parse (bind
mismatch)
elapsed time
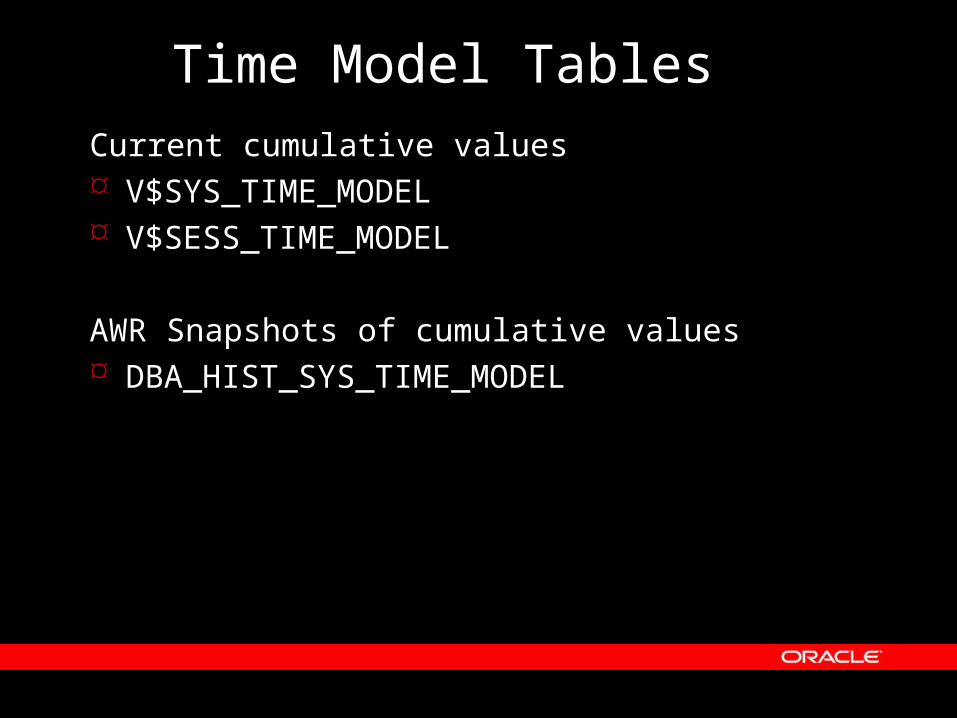
Time Model TablesCurrent cumulative values V$SYS_TIME_MODEL V$SESS_TIME_MODEL
AWR Snapshots of cumulative values DBA_HIST_SYS_TIME_MODEL
ASH
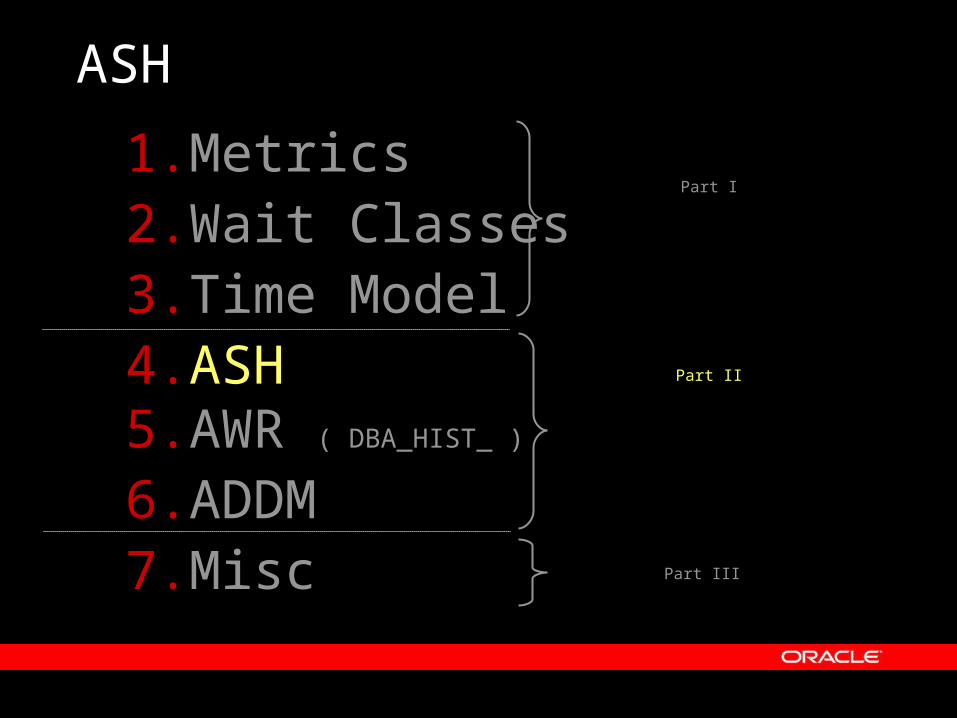
1.Metrics2.Wait Classes3.Time Model4.ASH5.AWR ( DBA_HIST_ )
6.ADDM7.Misc
Part I
Part II
Part III
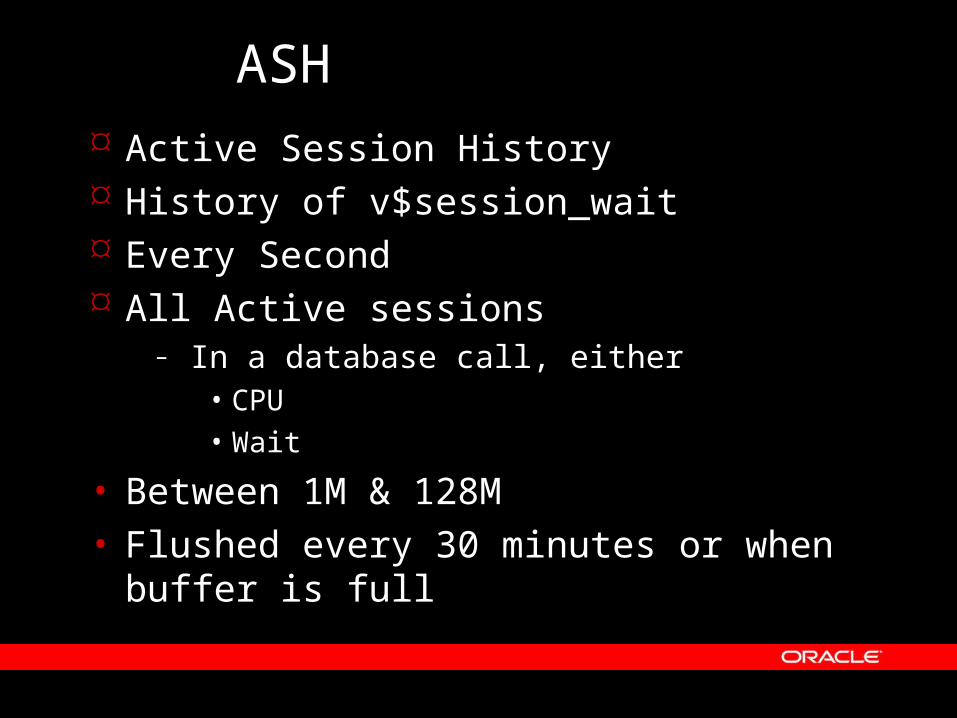
ASH Active Session History History of v$session_wait Every Second All Active sessions
– In a database call, either • CPU • Wait
• Between 1M & 128M• Flushed every 30 minutes or when buffer
is full
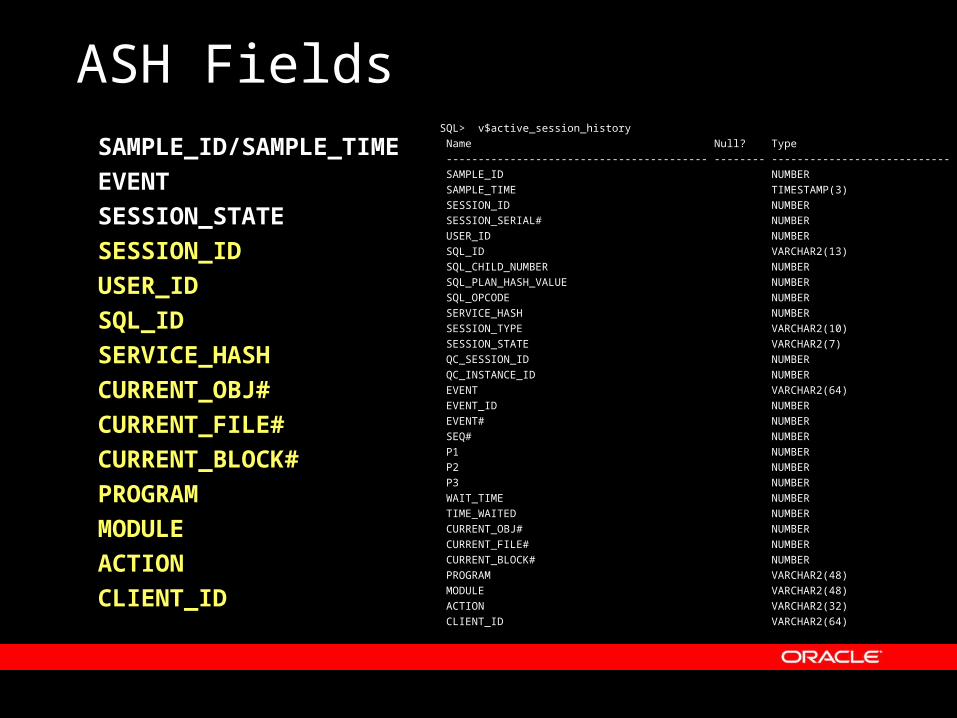
ASH FieldsSQL> v$active_session_history
Name Null? Type
----------------------------------------- -------- ----------------------------
SAMPLE_ID NUMBER
SAMPLE_TIME TIMESTAMP(3)
SESSION_ID NUMBER
SESSION_SERIAL# NUMBER
USER_ID NUMBER
SQL_ID VARCHAR2(13)
SQL_CHILD_NUMBER NUMBER
SQL_PLAN_HASH_VALUE NUMBER
SQL_OPCODE NUMBER
SERVICE_HASH NUMBER
SESSION_TYPE VARCHAR2(10)
SESSION_STATE VARCHAR2(7)
QC_SESSION_ID NUMBER
QC_INSTANCE_ID NUMBER
EVENT VARCHAR2(64)
EVENT_ID NUMBER
EVENT# NUMBER
SEQ# NUMBER
P1 NUMBER
P2 NUMBER
P3 NUMBER
WAIT_TIME NUMBER
TIME_WAITED NUMBER
CURRENT_OBJ# NUMBER
CURRENT_FILE# NUMBER
CURRENT_BLOCK# NUMBER
PROGRAM VARCHAR2(48)
MODULE VARCHAR2(48)
ACTION VARCHAR2(32)
CLIENT_ID VARCHAR2(64)
SAMPLE_ID/SAMPLE_TIME
EVENT
SESSION_STATE
SESSION_ID
USER_ID
SQL_ID
SERVICE_HASH
CURRENT_OBJ#
CURRENT_FILE#
CURRENT_BLOCK#
PROGRAM
MODULE
ACTION
CLIENT_ID
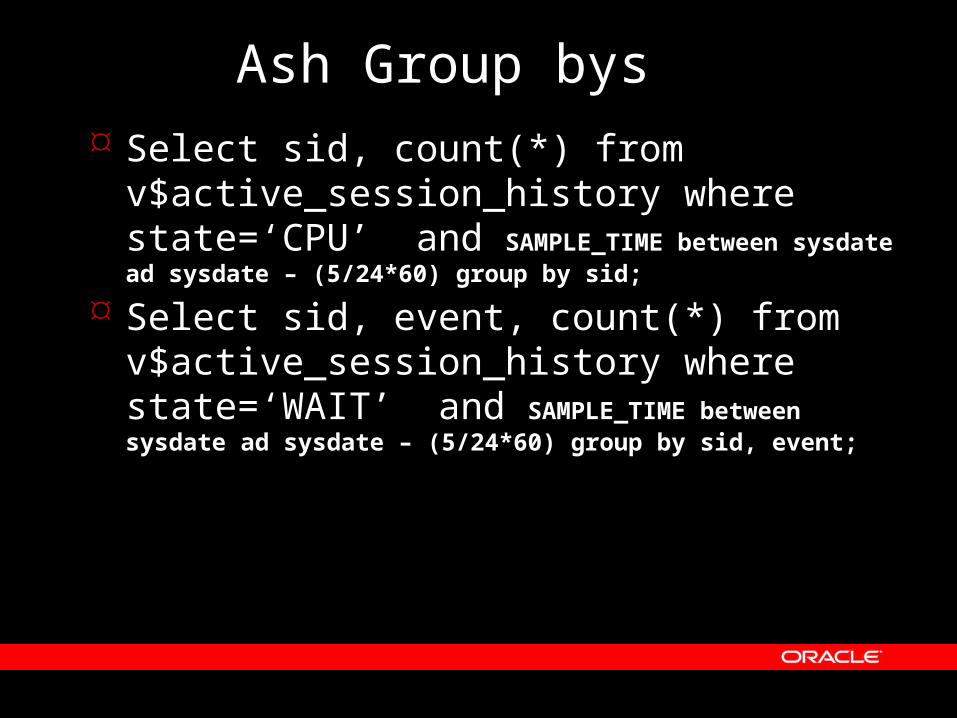
Ash Group bys Select sid, count(*) from
v$active_session_history where state=‘CPU’ and SAMPLE_TIME between sysdate ad sysdate – (5/24*60) group by sid;
Select sid, event, count(*) from v$active_session_history where state=‘WAIT’ and SAMPLE_TIME between sysdate ad sysdate – (5/24*60) group by sid, event;

Wait Time vs Time Waited SESSION_STATE
– Waiting, on CPU– Based on WAIT_TIME
WAIT_TIME– 0 => waiting– >0 => CPU (value is time of last wait)
TIME_WAITED – Actual time waited for event– 0 until wait finishes – Fix up values (no one else can do this)
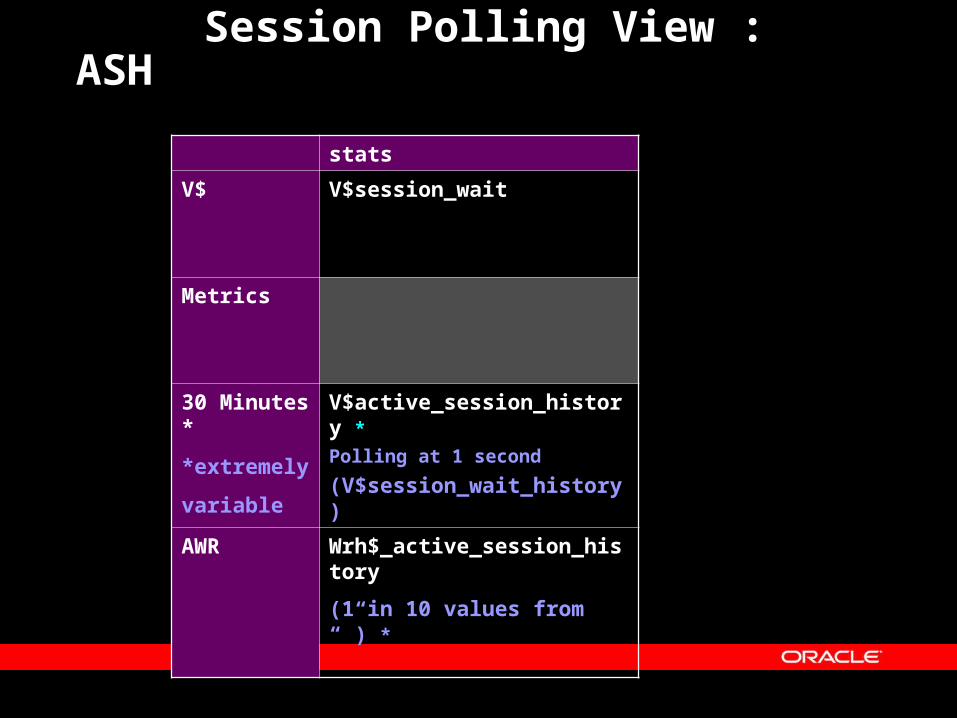
Session Polling View : ASH
stats
V$ V$session_wait
Metrics
30 Minutes *
*extremely
variable
V$active_session_history *Polling at 1 second
(V$session_wait_history)
AWR Wrh$_active_session_history
(1 in 10 values from “”) *
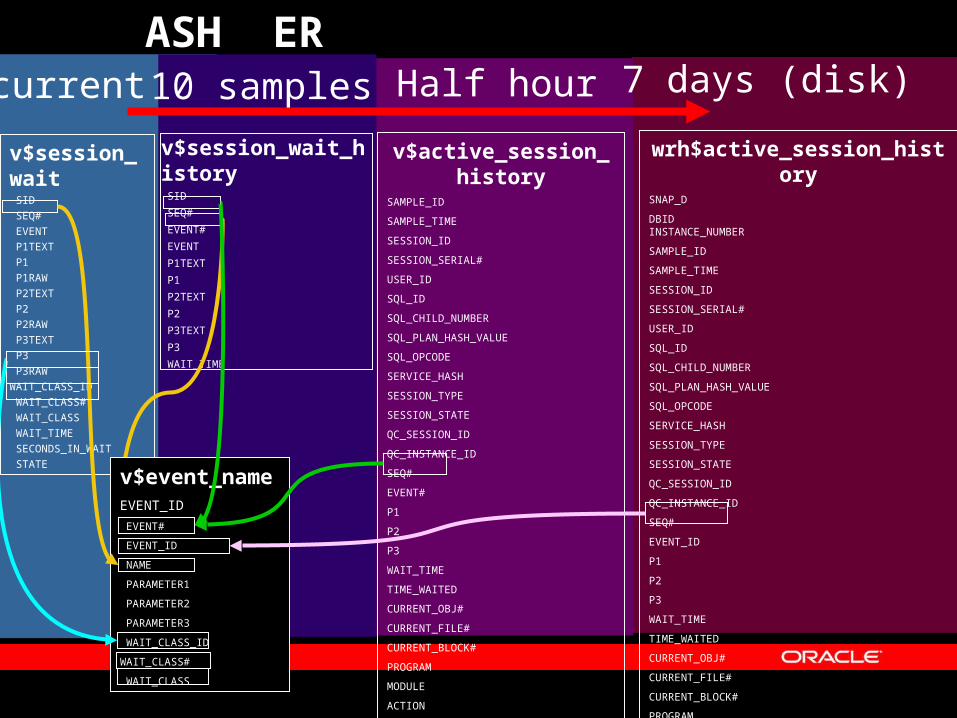
ASH ER
v$session_wait SID
SEQ#
EVENT
P1TEXT
P1
P1RAW
P2TEXT
P2
P2RAW
P3TEXT
P3
P3RAW
WAIT_CLASS_ID
WAIT_CLASS#
WAIT_CLASS
WAIT_TIME
SECONDS_IN_WAIT
STATE
v$session_wait_history SID
SEQ#
EVENT#
EVENT
P1TEXT
P1
P2TEXT
P2
P3TEXT
P3
WAIT_TIME
v$event_nameEVENT_ID
EVENT#
EVENT_ID
NAME
PARAMETER1
PARAMETER2
PARAMETER3
WAIT_CLASS_ID
WAIT_CLASS#
WAIT_CLASS
v$active_session_historySAMPLE_ID
SAMPLE_TIME
SESSION_ID
SESSION_SERIAL#
USER_ID
SQL_ID
SQL_CHILD_NUMBER
SQL_PLAN_HASH_VALUE
SQL_OPCODE
SERVICE_HASH
SESSION_TYPE
SESSION_STATE
QC_SESSION_ID
QC_INSTANCE_ID
SEQ#
EVENT#
P1
P2
P3
WAIT_TIME
TIME_WAITED
CURRENT_OBJ#
CURRENT_FILE#
CURRENT_BLOCK#
PROGRAM
MODULE
ACTION
CLIENT_ID
current 10 samples Half hour
wrh$active_session_historySNAP_D
DBIDINSTANCE_NUMBER
SAMPLE_ID
SAMPLE_TIME
SESSION_ID
SESSION_SERIAL#
USER_ID
SQL_ID
SQL_CHILD_NUMBER
SQL_PLAN_HASH_VALUE
SQL_OPCODE
SERVICE_HASH
SESSION_TYPE
SESSION_STATE
QC_SESSION_ID
QC_INSTANCE_ID
SEQ#
EVENT_ID
P1
P2
P3
WAIT_TIME
TIME_WAITED
CURRENT_OBJ#
CURRENT_FILE#
CURRENT_BLOCK#
PROGRAM
MODULE
ACTION
CLIENT_ID
7 days (disk)

ASH in Wait Drilldown
AWR
1.Metrics2.Wait Classes3.Time Model4.ASH5.AWR ( DBA_HIST_ )
6.ADDM7.Misc
Part I
Part II
Part III

Automatic Workload Repository Statspack on Steroids More efficient than Statspack Keeps stats every hour Stores by default the last 7 days
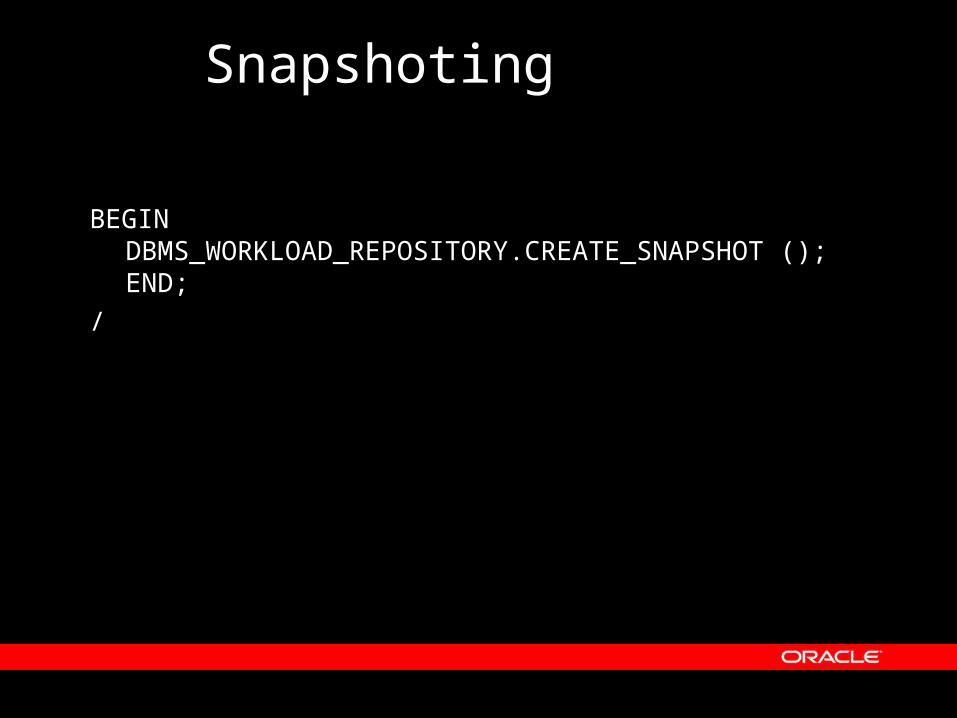
Snapshoting
BEGINDBMS_WORKLOAD_REPOSITORY.CREATE_SNAPSHOT ();END;
/

DBA_HISTDBA_HIST_DATABASE_INSTANCEDBA_HIST_SNAPSHOT- DBA_HIST_SNAP_ERROR- DBA_HIST_BASELINE- DBA_HIST_WR_CONTROL ? (work load repository ?)- DBA_HIST_DATAFILEDBA_HIST_FILESTATXS – only file number, no name- DBA_HIST_TEMPFILEDBA_HIST_TEMPSTATXS – onl;y file number+DBA_HIST_SQLSTAT group by parent cursor plus DELTAs was (stats$sql_summary)DBA_HIST_SQLTEXT+DBA_HIST_SQL_SUMMARY – identify litterals (was stat$sql_statistics)DBA_HIST_SQL_PLAN-DBA_HIST_SQLBIND-DBA_HIST_OPTIMIZER_ENV-DBA_HIST_EVENT_NAMEDBA_HIST_SYSTEM_EVENTDBA_HIST_BG_EVENT_SUMMARY – sum of backgroundsDBA_HIST_WAITSTATDBA_HIST_ENQUEUE_STAT-DBA_HIST_LATCH_NAMEDBA_HIST_LATCHDBA_HIST_LATCH_CHILDRENDBA_HIST_LATCH_PARENTDBA_HIST_LATCH_MISSES_SUMMARY – summed over parent latchDBA_HIST_LIBRARYCACHEDBA_HIST_DB_CACHE_ADVICEDBA_HIST_BUFFER_POOL_STATDBA_HIST_ROWCACHE_SUMMARY – summed over rowcache entriesDBA_HIST_SGADBA_HIST_SGASTATDBA_HIST_PGASTAT
DBA_HIST_RESOURCE_LIMITDBA_HIST_SHARED_POOL_ADVICE?DBA_HIST_SQL_WORKAREA_HSTGRMDBA_HIST_PGA_TARGET_ADVICEDBA_HIST_INSTANCE_RECOVERYDBA_HIST_JAVA_POOL_ADVICEDBA_HIST_THREAD - logswitches-DBA_HIST_STAT_NAMEDBA_HIST_SYSSTAT-DBA_HIST_SYS_TIME_MODEL-DBA_HIST_OSSTAT_NAME-DBA_HIST_OSSTATDBA_HIST_PARAMETER_NAMEDBA_HIST_PARAMETERDBA_HIST_UNDOSTATDBA_HIST_ROLLSTATDBA_HIST_SEG_STATDBA_HIST_SEG_STAT_OBJ-DBA_HIST_METRIC_NAME-DBA_HIST_SYSMETRIC_HISTORY alert-DBA_HIST_SYSMETRIC_SUMMARY – max, min, avg standard deviation-DBA_HIST_SESSMETRIC_HISTORY alert-DBA_HIST_FILEMETRIC_HISTORY alert-DBA_HIST_WAITCLASSMET_HISTORY alertDBA_HIST_DLM_MISC-DBA_HIST_RCVRY_FILE_DEST_STAT-DBA_HIST_RMAN_PERFORMANCE-DBA_HIST_ACTIVE_SESS_HISTORY – every 10th point from v$active_session_history-DBA_HIST_TABLESPACE_STAT-DBA_HIST_LOGDBA_HIST_MTTR_TARGET_ADVICE-DBA_HIST_TBSPC_SPACE_USAGE - ?
New in 10g

ADDM
1.Metrics2.Wait Classes3.Time Model4.ASH5.AWR ( DBA_HIST_ )
6.ADDM7.Misc
Part I
Part II
Part III
Automatic Database Diagnostic Monitor
Every Hour with AWR Analyze Identify problems Proposes solutions
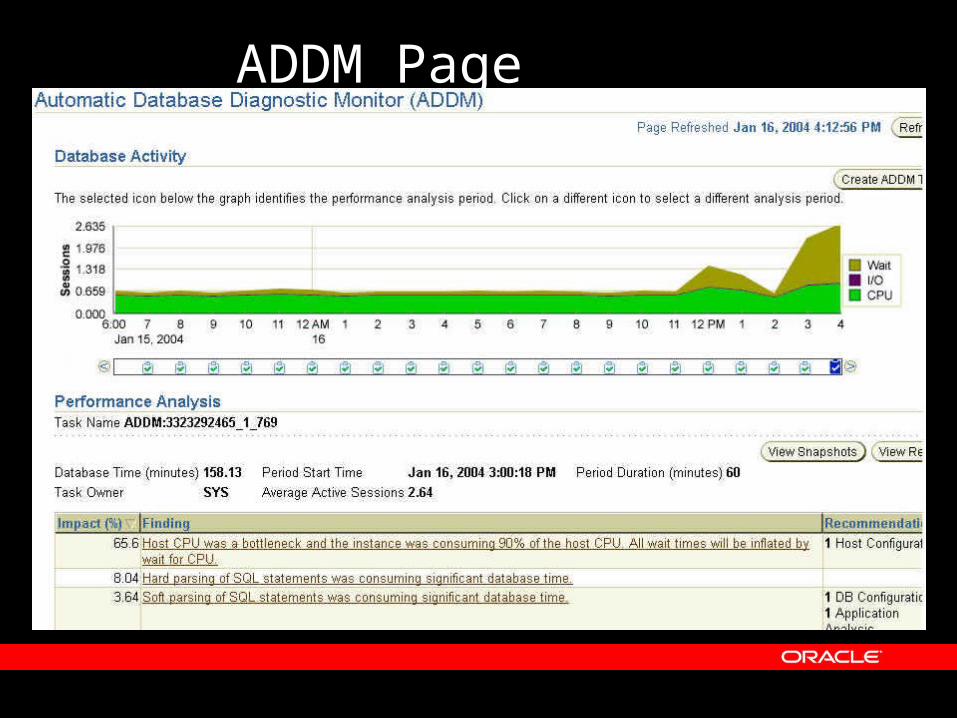
ADDM Page
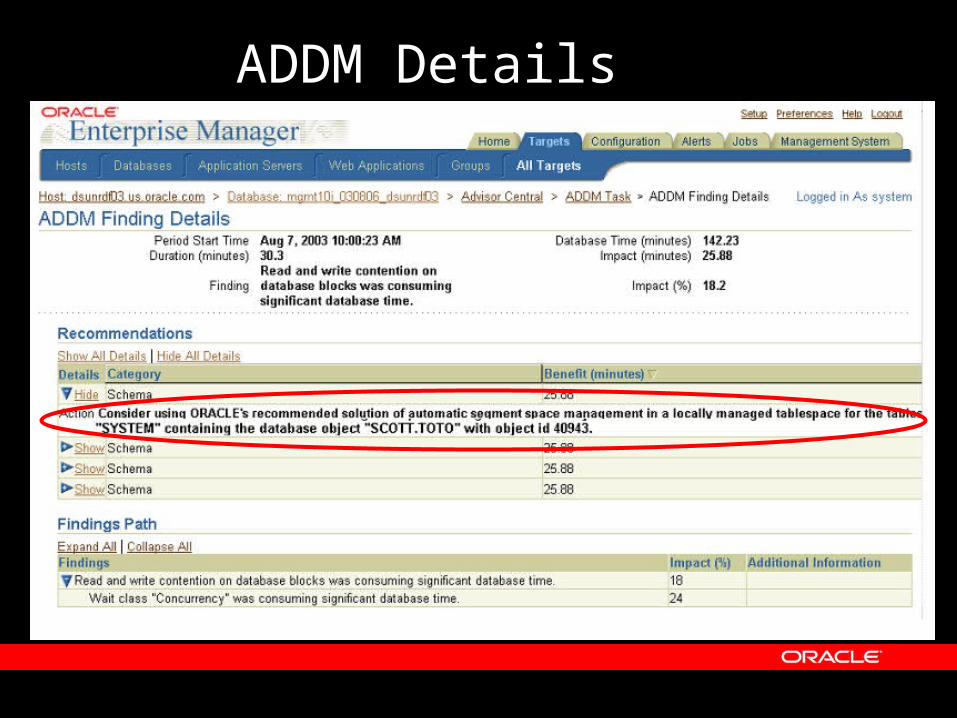
ADDM Details

ADDM Advice

ADDM
dba_advisor_findings TASK_NAME, TASK_ID (is indexed)
dba_advisor_recommendations TASK_ID,FINDING_ID
dba_advisor_actions TASK_ID and REC_ID
dba_advisor_rationale TASK_ID and REC_ID
dba_advisor_objects TASK_ID , OBJECT_ID from actions or rationale.

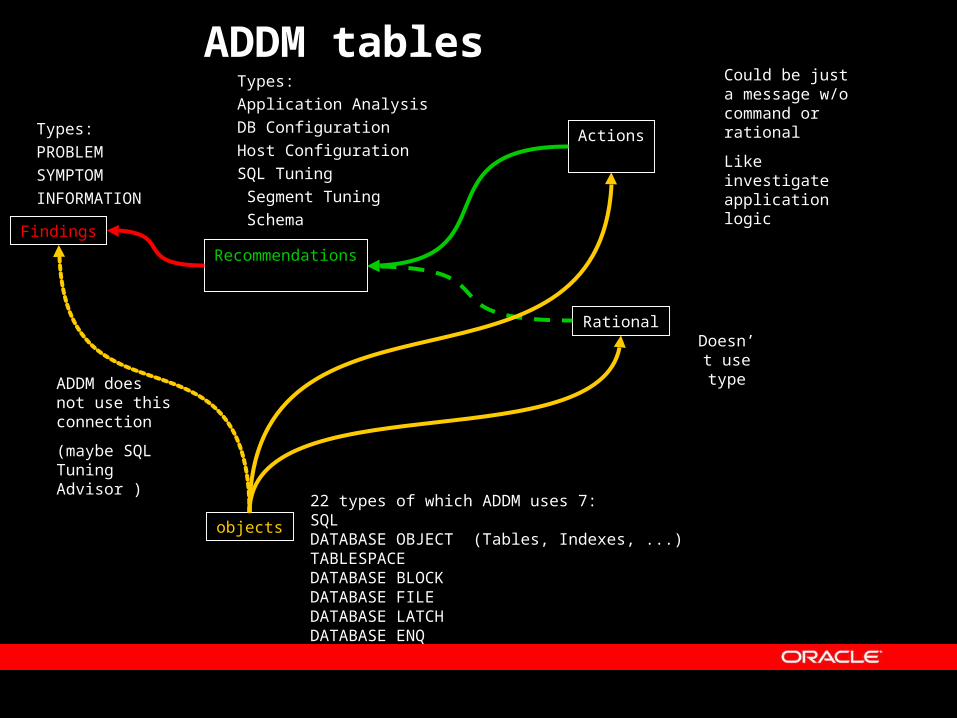
ADDM tables
Actions
Findings
Recommendations
objects
Rational
Add Free lists or move to ASSM
SQL
BBW:
Read & write contention
on a block
Segment Tuningobjects Tables
ADDM tables
Actions
Findings
Recommendations
objects
Rational
Could be just a message w/o command or rational
Like investigate application logic
22 types of which ADDM uses 7:SQLDATABASE OBJECT (Tables, Indexes, ...)TABLESPACEDATABASE BLOCKDATABASE FILEDATABASE LATCHDATABASE ENQ
ADDM does not use this connection
(maybe SQL Tuning Advisor )
Types:
PROBLEM
SYMPTOM
INFORMATION
Types:
Application Analysis
DB Configuration
Host Configuration
SQL Tuning
Segment Tuning
Schema
Doesn’t use type

Miscellaneous
1.Metrics2.Wait Classes3.Time Model4.ASH5.AWR ( DBA_HIST_ )
6.ADDM7.Misc
Part I
Part II
Part III

Miscellaneous
Field naming conventions Wait Improvements
– Wait histograms– Waits in v$session and v$sql– Waits broken out for latches and locks– Waits show the blocker– Wait history of last 10 waits
Services Client Id
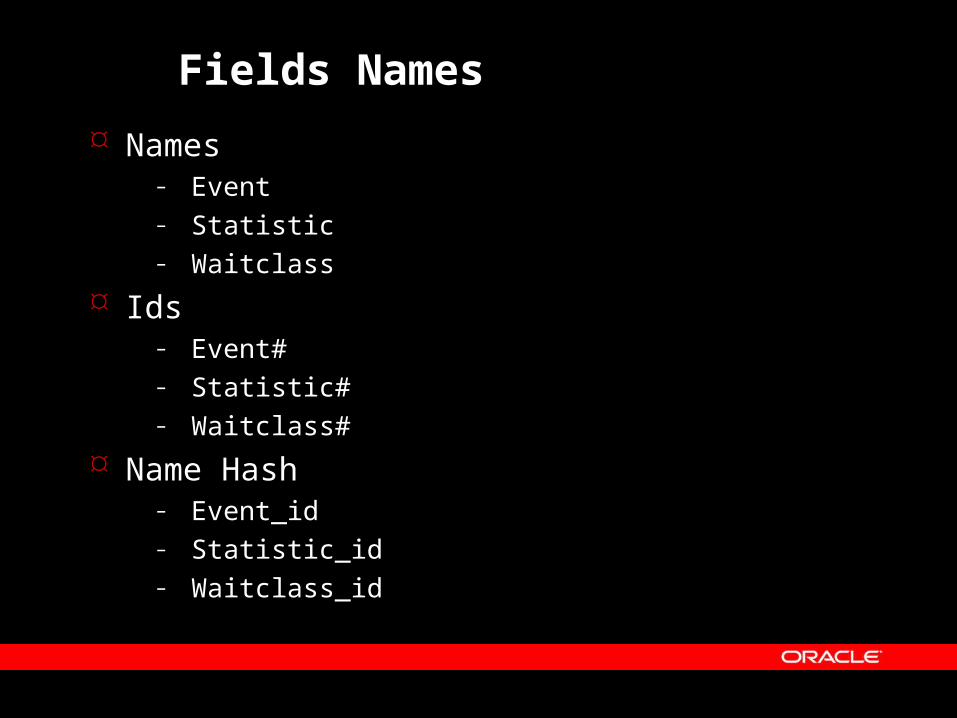
Fields Names
Names– Event– Statistic– Waitclass
Ids – Event#– Statistic#– Waitclass#
Name Hash– Event_id– Statistic_id– Waitclass_id
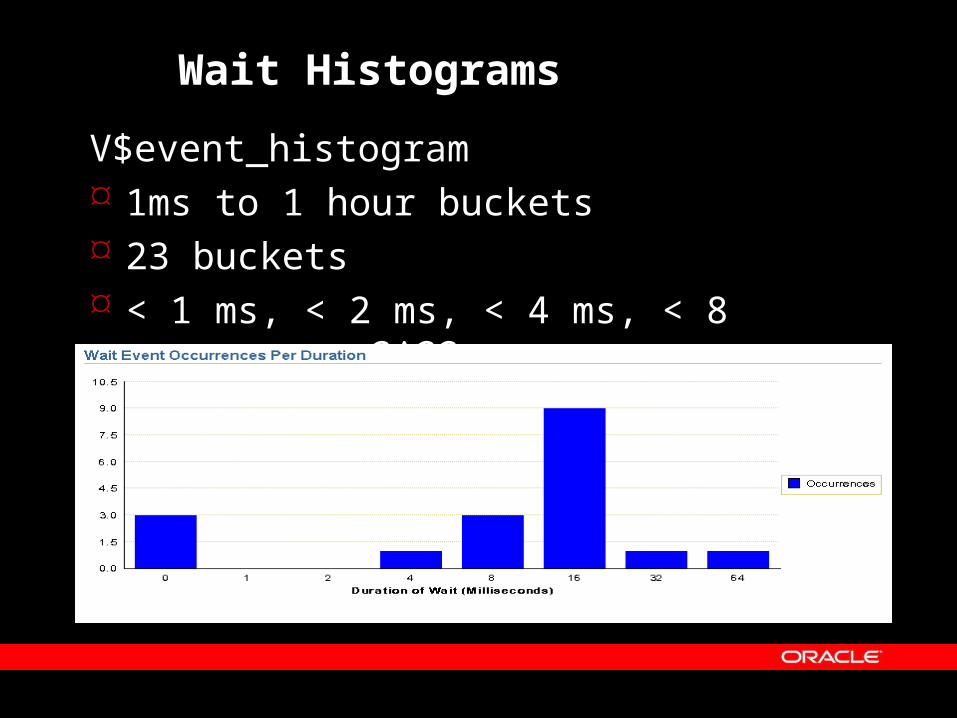
Wait Histograms
V$event_histogram 1ms to 1 hour buckets 23 buckets < 1 ms, < 2 ms, < 4 ms, < 8 ms, ..., < 2^22 ms
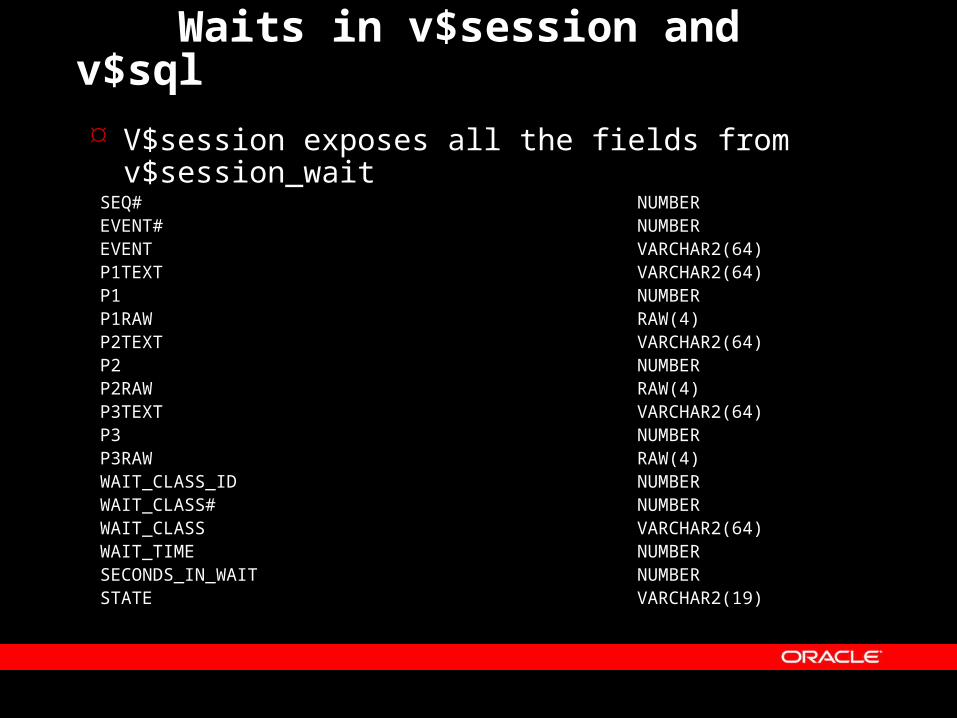
Waits in v$session and v$sql V$session exposes all the fields from
v$session_wait SEQ# NUMBER EVENT# NUMBER EVENT VARCHAR2(64) P1TEXT VARCHAR2(64) P1 NUMBER P1RAW RAW(4) P2TEXT VARCHAR2(64) P2 NUMBER P2RAW RAW(4) P3TEXT VARCHAR2(64) P3 NUMBER P3RAW RAW(4) WAIT_CLASS_ID NUMBER WAIT_CLASS# NUMBER WAIT_CLASS VARCHAR2(64) WAIT_TIME NUMBER SECONDS_IN_WAIT NUMBER STATE VARCHAR2(19)

V$SQL SQL_FULLTEXT SQL_ID FETCHES END_OF_FETCH_COUNT DIRECT_WRITES APPLICATION_WAIT_TIME CONCURRENCY_WAIT_TIME CLUSTER_WAIT_TIME USER_IO_WAIT_TIME PLSQL_EXEC_TIME JAVA_EXEC_TIME CPU_TIME ELAPSED_TIME

Wait Types Broken Out
800 waits Latches broken out
– Ex) Latch: library cache latch
Enqueues broken out– Ex) Enq: HW - contention
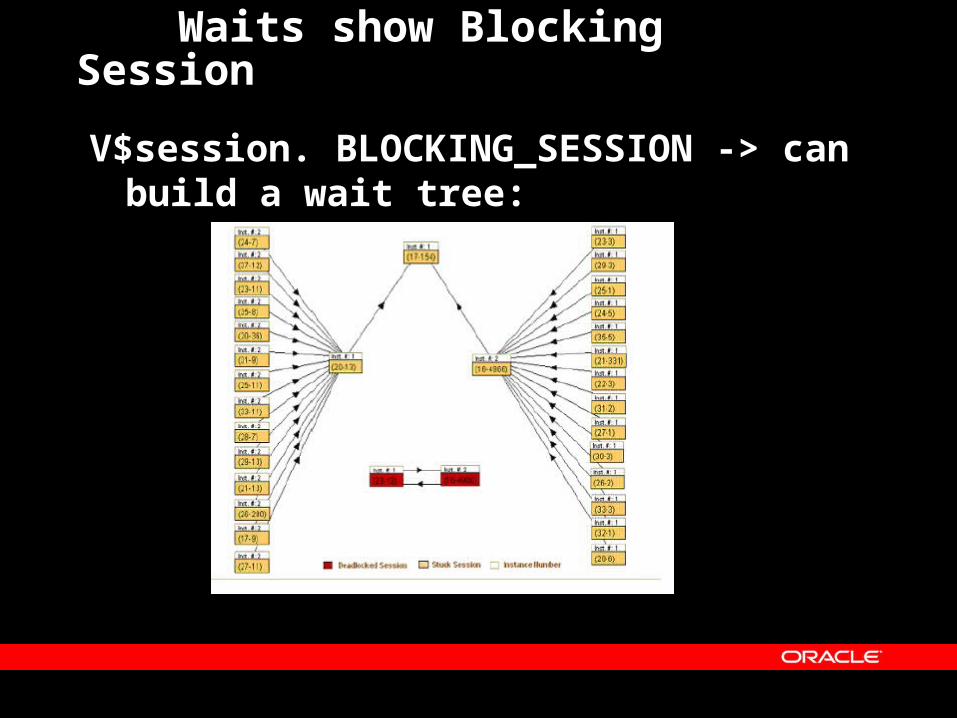
Waits show Blocking Session
V$session. BLOCKING_SESSION -> can build a wait tree:

Waits History of last 10 waits
select sid, event, p1,p2,p3 from v$session_wait_history
SID EVENT P1 P2 P3---------- --------------------------- ---------- ---------- ---------- 36 db file sequential read 1 953 1 36 SQL*Net message from client 1413697536 1 0 36 SQL*Net message from client 1413697536 1 0 36 SQL*Net message to client 1413697536 1 0 36 db file sequential read 1 658 1 36 db file sequential read 1 828 1 36 db file sequential read 1 569 1 36 db file sequential read 1 827 1 36 db file sequential read 1 19199 1 36 db file sequential read 1 29 1

Services
Services is a new way to measure resource usage and statistics. A session is associated with a services when the session connects to the database via the listener.
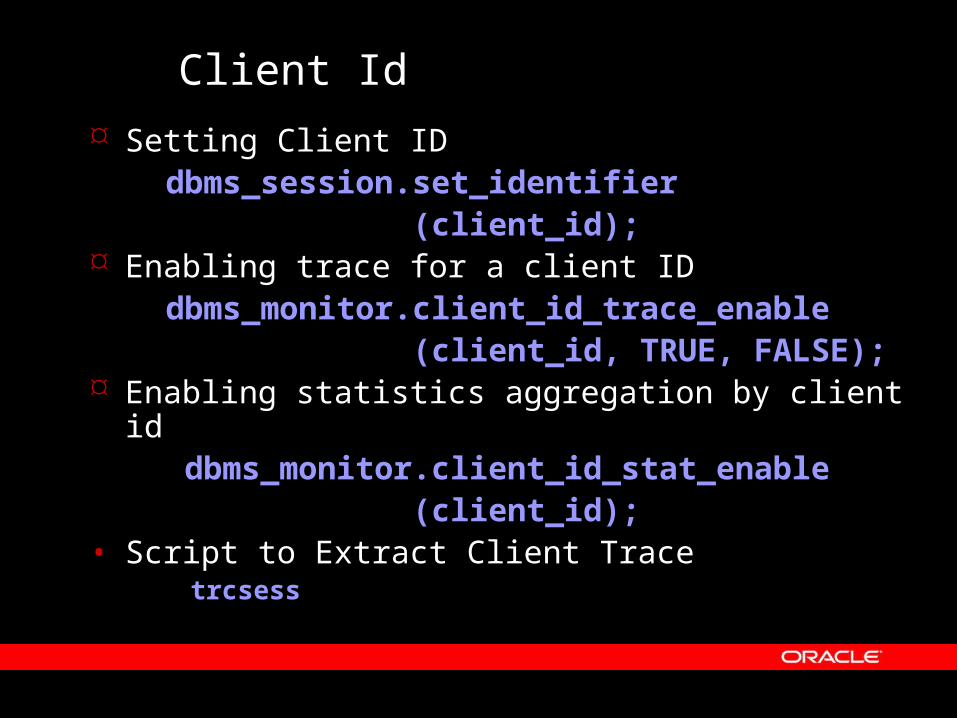
Client Id
Setting Client ID dbms_session.set_identifier (client_id); Enabling trace for a client ID dbms_monitor.client_id_trace_enable (client_id, TRUE, FALSE); Enabling statistics aggregation by client id dbms_monitor.client_id_stat_enable (client_id);• Script to Extract Client Trace
trcsess
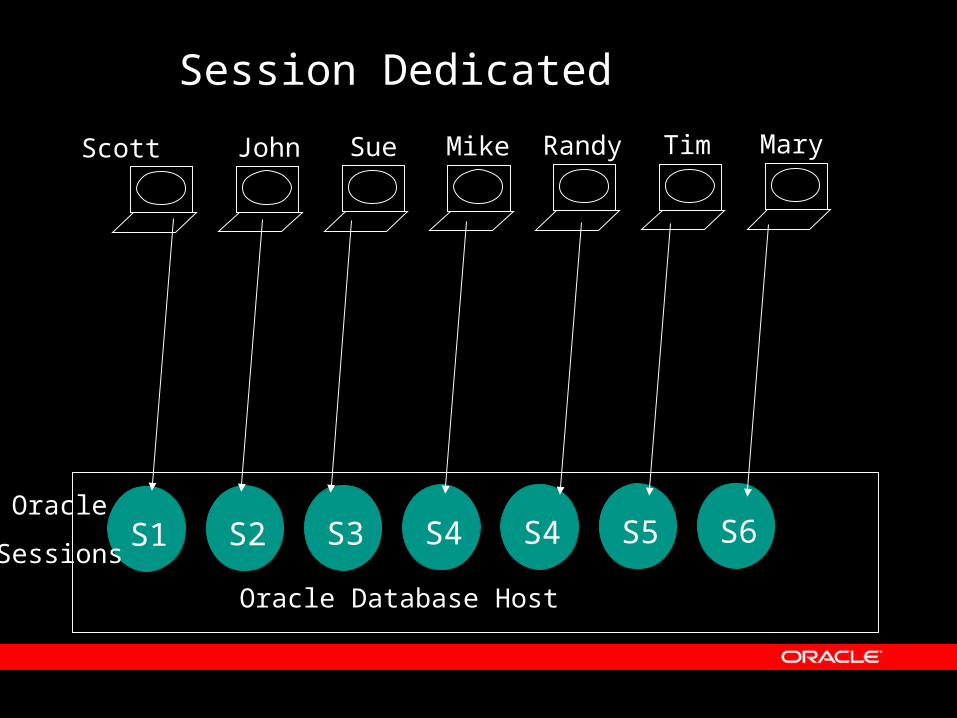
Session Dedicated
Oracle Database Host
Oracle
SessionsS1 S2 S3 S4 S4 S5 S6
Scott John Sue Mike Randy Tim Mary
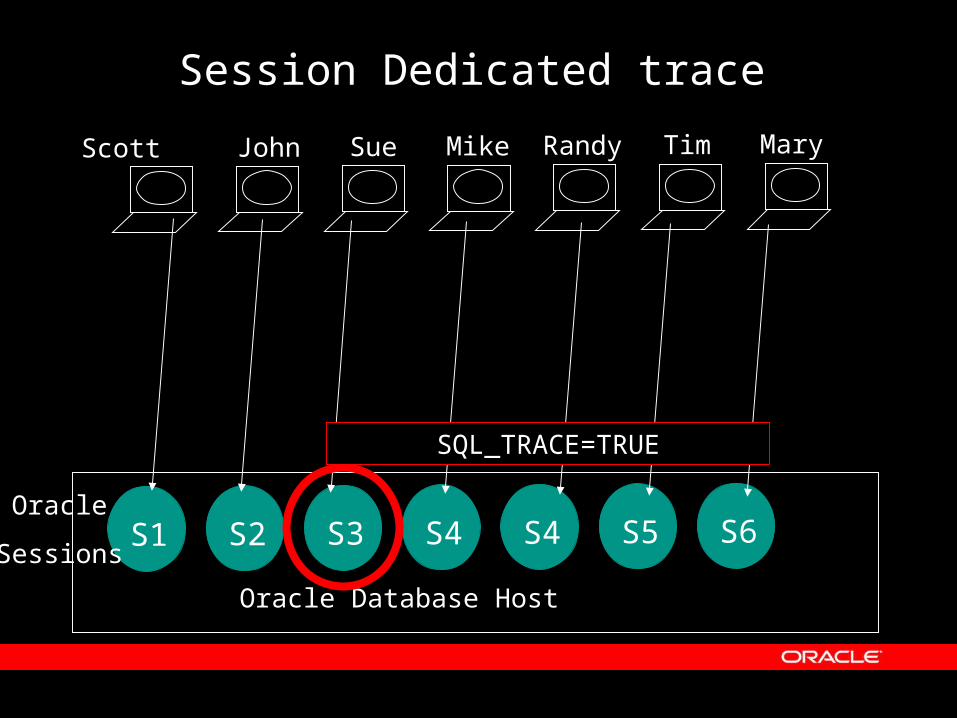
Session Dedicated trace
Oracle Database Host
Oracle
SessionsS1 S2 S3 S4 S4 S5 S6
Scott John Sue Mike Randy Tim Mary
SQL_TRACE=TRUE

Session Pooling
Oracle Database Host
APP Server
1
Oracle
SessionsS1 S2 S3 S4 S4 S5 S6 S7
Scott John Sue Mike Randy Tim Mary
Set client_id = SCOTT
dbms_monitor.client_id_trace_enable
(client_id, TRUE, FALSE);
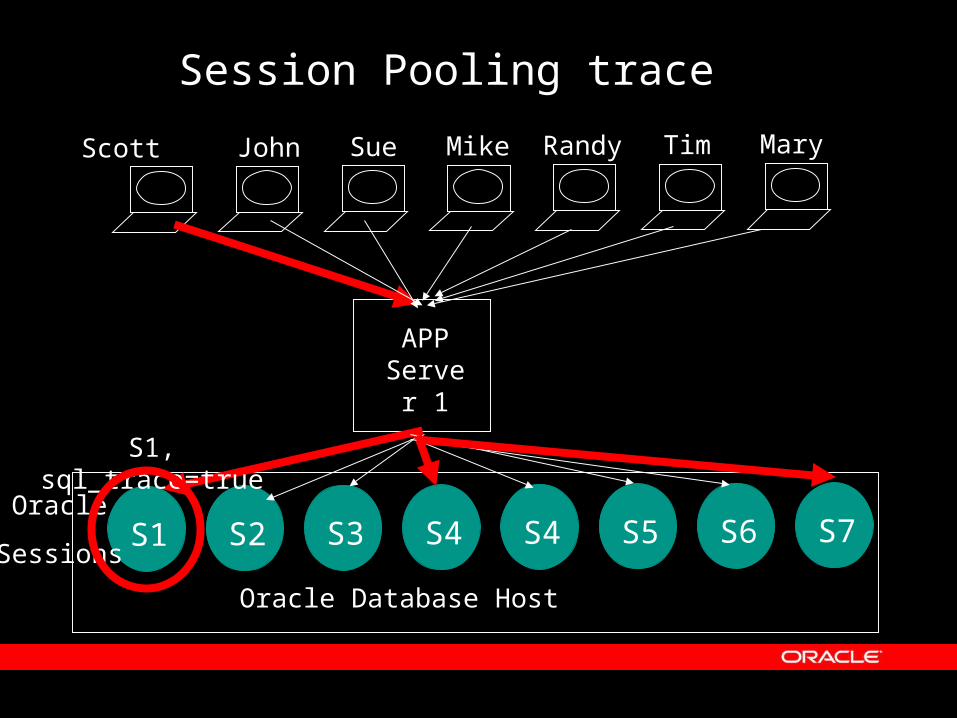
Session Pooling trace
Oracle Database Host
APP Server
1
Oracle
SessionsS1 S2 S3 S4 S4 S5 S6 S7
Scott John Sue Mike Randy Tim Mary
S1, sql_trace=true

Session Pooling multi app serv
Oracle Database Host
APP Server
1
Oracle
SessionsS1 S2 S3 S4 S4 S5 S6 S7
Scott John Sue Mike Randy Tim Mary
APP Server
2
APP Server
3
------ Reference -------------
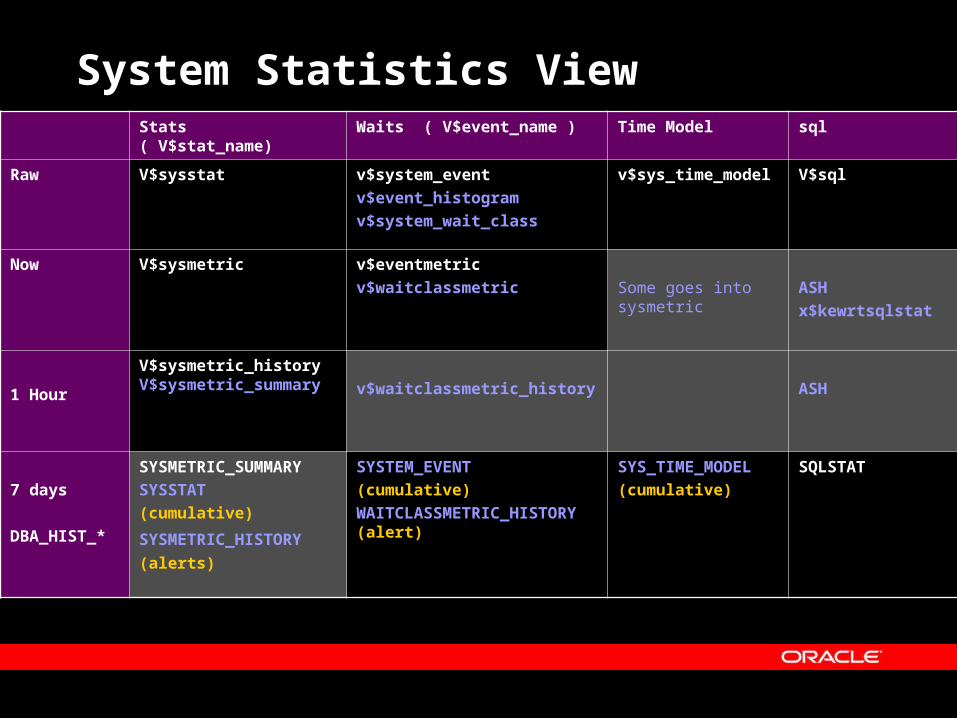
System Statistics ViewStats ( V$stat_name) Waits ( V$event_name ) Time Model sql
Raw V$sysstat v$system_event
v$event_histogram
v$system_wait_class
v$sys_time_model V$sql
Now V$sysmetric v$eventmetric
v$waitclassmetric Some goes into sysmetric
ASH
x$kewrtsqlstat
1 Hour
V$sysmetric_history V$sysmetric_summary
v$waitclassmetric_history ASH
7 days
DBA_HIST_*
SYSMETRIC_SUMMARY
SYSSTAT
(cumulative)
SYSMETRIC_HISTORY (alerts)
SYSTEM_EVENT
(cumulative)
WAITCLASSMETRIC_HISTORY (alert)
SYS_TIME_MODEL
(cumulative)
SQLSTAT

Session Statistics Viewstats waits waitclasses Time Model sql
V$ V$sessstat V$session_event ---------------- V$sess_time_model *
-----------------
(some stats possible from ASH)
Metrics V$sessmetric ----------------- ----------------- ----------------- -----------------
Metrics
history
----------------- ----------------- ----------------- ----------------- -----------------
AWR WRH$_SESSMETRIC_HISTORY *(alert only)
-----------------
(some stats possible from ASH)
---------------- ----------------- -----------------
(some stats possible from ASH)

V$metric
v$metric
BEGIN_TIME
END_TIME
INTSIZE_CSEC
GROUP_ID
ENTITY_ID – session id, wait_class_id, etc
ENTITY_SEQUENCE
METRIC_ID
METRIC_NAME
VALUE
METRIC_UNIT

ASH
ASH provides two x$ fixed tables
x$kewash - returns a row for every ASH sample taken
x$ash- returns a row for every active session in every ASH sample
SELECT /*+ no_merge ordered use_nl(s,a) */ a.inst_id, a.sample_id, a.sample_tim
e, a.session_id, a.session_serial#, a.user_id, a.sql_id, a.sql_child_number,
a.sql_plan_hash_value, a.sql_opcode, a.service_hash, decode(a.session_type, 1,'FORE
GROUND', 2,'BACKGROUND', 'UNKNOWN'), decode(a.wait_time, 0, 'WAITING', 'ON CPU')
, a.qc_session_id, a.qc_instance_id, a.seq#, a.event#, a.p1, a.p2, a.p3, a.wait_
time, a.time_waited, a.current_obj#, a.current_file#, a.current_block#, a.progra
m, a.module, a.action, a.client_id FROM x$kewash s, x$ash a WHERE s.sample_addr
= a.sample_addr and s.sample_id = a.sample_id
No range scans on x$ tables, so full scan x$kewash and then use equality in query on x$ash

X$ Desc x$ashSQL> desc x$kewash ADDR RAW(4) INDX NUMBER INST_ID NUMBER SAMPLE_ID NUMBER SAMPLE_TIME TIMESTAMP(3) SAMPLE_ADDR NUMBER SAMPLE_LENGTH NUMBER ROW_COUNT NUMBER
desc x$ash ADDR RAW(4) INDX NUMBER INST_ID NUMBER SAMPLE_ADDR NUMBER SAMPLE_ID NUMBER SAMPLE_TIME TIMESTAMP(3) SESSION_ID NUMBER SESSION_SERIAL# NUMBER USER_ID NUMBER SQL_ID VARCHAR2(13) SQL_CHILD_NUMBER NUMBER SQL_PLAN_HASH_VALUE NUMBER SERVICE_HASH NUMBER SESSION_TYPE NUMBER SQL_OPCODE NUMBER QC_SESSION_ID NUMBER QC_INSTANCE_ID NUMBER CURRENT_OBJ# NUMBER CURRENT_FILE# NUMBER CURRENT_BLOCK# NUMBER SEQ# NUMBER EVENT# NUMBER P1 NUMBER P2 NUMBER P3 NUMBER WAIT_TIME NUMBER TIME_WAITED NUMBER PROGRAM VARCHAR2(48) MODULE VARCHAR2(48) ACTION VARCHAR2(32) CLIENT_ID VARCHAR2(64)

Sql metrics: x$kewrtsqlstat
x$kewrtsqlstat