tmp116 ambient air temperature measurement - ti. · pdf filetmp116 ambient air temperature...
TRANSCRIPT

1SNOA966–August 2017Submit Documentation Feedback
Copyright © 2017, Texas Instruments Incorporated
TMP116 Ambient Air Temperature Measurement
Application ReportSNOA966–August 2017
TMP116 Ambient Air Temperature Measurement
AaronHeng
ABSTRACTPower-hungry electronic components such as processor chips, field programmable gate arrays (FPGAs),application-specific integrated circuits (ASICs), as well as power ICs heat up during operation. When thesystem is turned on, the heat generated by these ICs transfers to lower temperature objects nearby.Measuring ambient air temperature with a surface mount device can be challenging because heat transferfrom components on the same PCB can influence and interfere with the ambient air temperature readingof the sensor. To maintain accuracy in applications that require ambient air temperature measurement, itis important to follow good layout techniques such as understanding the dominant thermal path, isolatingthe island surrounded by the package, and keeping the device as far away from interfering heat sourcesas possible. This application note will focus on layout strategies to overcome off-board (ambient air)temperature sensing challenges encompassing many applications. It details recommended layouttechniques for accurate measurement of ambient air temperature with a temperature sensor in a plasticpackage, such as the TMP116. The application note includes measurement data of the TMP116 ambientair temperature measurement, and the LMT70 which is used as a reference to the temperature sensor todistinguish between air temperature measurement and the interference from a nearby heat source.

www.ti.com
2 SNOA966–August 2017Submit Documentation Feedback
Copyright © 2017, Texas Instruments Incorporated
TMP116 Ambient Air Temperature Measurement
Contents1 Introduction ................................................................................................................... 32 Method and Procedure...................................................................................................... 43 Result ........................................................................................................................ 134 Conclusion .................................................................................................................. 19
List of Figures
1 Heat Transfer WSON (TMP116) Package Cross Section ............................................................. 32 Heat Transfer WCSP (LMT70) Package Cross Section................................................................ 43 Ambient Air Temperature Measurement System Block Diagram ..................................................... 54 General Physical Layout for Test Board.................................................................................. 65 TMP116 Block Diagram..................................................................................................... 76 LMT70 Block Diagram ...................................................................................................... 77 ADS1115 Block Diagram ................................................................................................... 88 Test Setup System Diagram.............................................................................................. 129 Layout A, B, C Ambient Air Temperature Measurement.............................................................. 1310 Layout D, E, F Ambient Air Temperature Measurement .............................................................. 1411 Layout A, B, C — 0.508-mm Distance .................................................................................. 1412 Layout A, B, C — 15.24-mm Distance .................................................................................. 1513 Layout D, E, F — 0.508-mm Distance .................................................................................. 1514 Layout D, E, F — 7.62-mm Distance .................................................................................... 1615 Layout D, E, F — 2.54-mm Isolation Air Gap .......................................................................... 1616 Heat Radiated Across Test Board ....................................................................................... 1717 Layout D, E, F Extended Distance....................................................................................... 1718 Layout D, E, F Thermal Air Gap 0.8-mm Slot Width .................................................................. 1819 Layout D, E, F Thermal Air Gap 1.8-mm Slot Width................................................................... 18
List of Tables
1 Cross Section Layout ....................................................................................................... 92 Recommended Distance Away From Heat Source.................................................................... 16
TrademarksAll trademarks are the property of their respective owners.

Die
Exposed Pad
Epoxy
Pin
Bond Wire
Mold Compound
Heat Flow
www.ti.com Introduction
3SNOA966–August 2017Submit Documentation Feedback
Copyright © 2017, Texas Instruments Incorporated
TMP116 Ambient Air Temperature Measurement
1 IntroductionThere are three methods of heat transfer: heat conduction through solids, heat convection through fluids,and heat generated by radiation. This report focuses on heat conduction as it dominates the heat transferin PCBs and is therefore most relevant to temperature measurements. Heat is transferred from nearbycomponents of the PCB to the die of the sensor through the PCB itself and through the sensor package.For details on heat conduction and how it applies to heat transfer through a PCB and through selectedsurface mount packages, refer to the application note, Temperature Sensors: PCB Guidelines for SurfaceMount Devices (SNOA967).
1.1 Temperature Sensor LocationThe most accurate method for measuring the temperature of a local analog or digital temperature sensoris to physically measure its own die temperature. Section 1.1.1 and Section 1.1.2 show the cross sectiondrawings of the TMP116 and the LMT70, respectively, including their dominant conduction transfer paths.
1.1.1 Dominant Thermal Conduction Path of a DFN (TMP116)For sensors in plastic packages without leads such as TMP116 WSON, the DAP (Die Attach Pad)provides the most dominant thermal path from its environment to the die, as shown in Figure 1. Becauseof the large contact area of the DAP, a temperature sensor can respond quickly to changes in PCBtemperature and create a thermal equilibrium between the surrounding PCB temperature and thetemperature of the sensor die. The cross section figure shows that the die is mounted on top of the metalplate leadframe with a non-conductive die adhesive, allowing for a fast thermal response transferringthrough the pins.
Figure 1. Heat Transfer WSON (TMP116) Package Cross Section
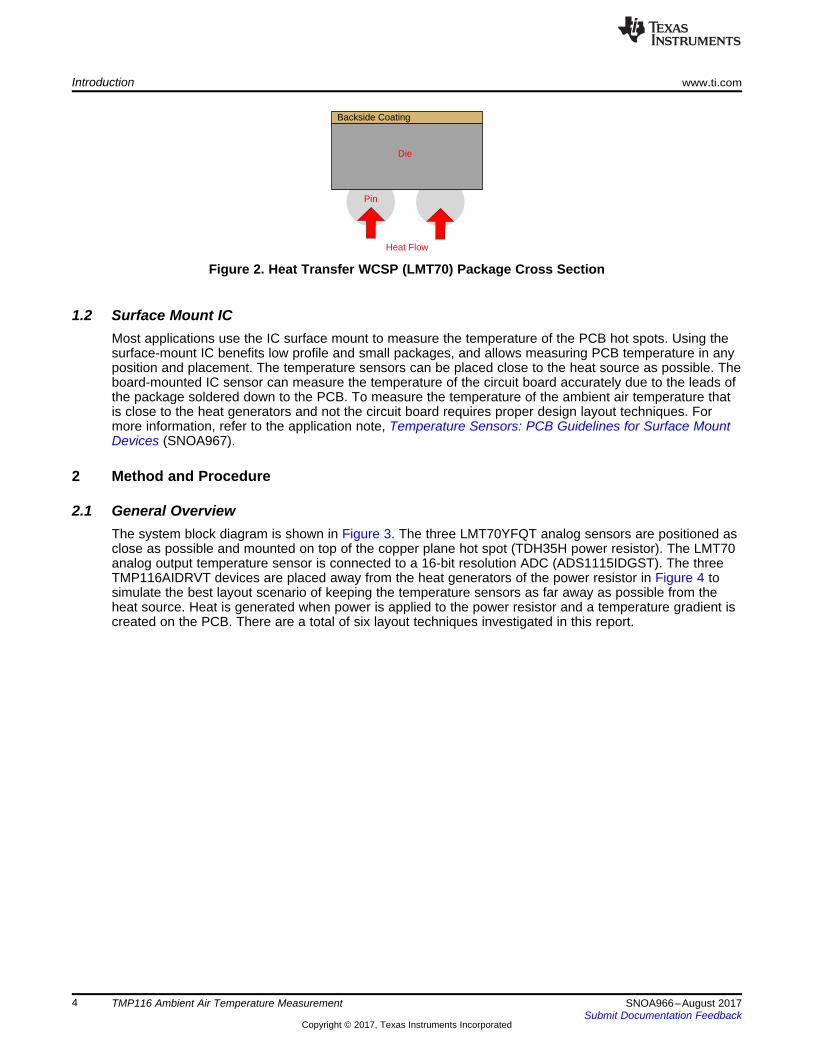
1.1.2 Dominant Thermal Conduction Path of a WCSP (LMT70)Wafer Chip Scale Package (WCSP) leads are actually Ball Grid Array (BGA) balls processed directly ontothe die; they are different than a regular surface-mount package. Heat from the PCB is directly transferredto the die through the balls instead of transferring through the pins or the DAP, as shown in Figure 2.
Heat Flow
Backside Coating
Die
Pin
Introduction www.ti.com
4 SNOA966–August 2017Submit Documentation Feedback
Copyright © 2017, Texas Instruments Incorporated
TMP116 Ambient Air Temperature Measurement
Figure 2. Heat Transfer WCSP (LMT70) Package Cross Section
1.2 Surface Mount ICMost applications use the IC surface mount to measure the temperature of the PCB hot spots. Using thesurface-mount IC benefits low profile and small packages, and allows measuring PCB temperature in anyposition and placement. The temperature sensors can be placed close to the heat source as possible. Theboard-mounted IC sensor can measure the temperature of the circuit board accurately due to the leads ofthe package soldered down to the PCB. To measure the temperature of the ambient air temperature thatis close to the heat generators and not the circuit board requires proper design layout techniques. Formore information, refer to the application note, Temperature Sensors: PCB Guidelines for Surface MountDevices (SNOA967).
2 Method and Procedure
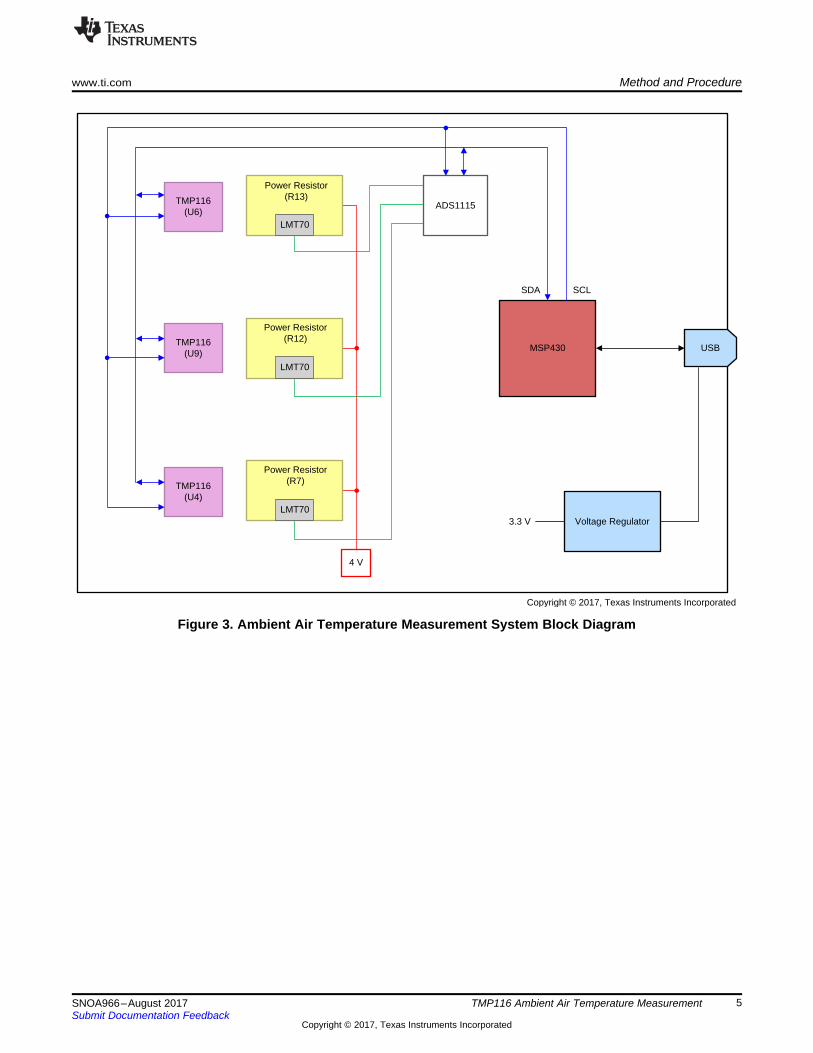
2.1 General OverviewThe system block diagram is shown in Figure 3. The three LMT70YFQT analog sensors are positioned asclose as possible and mounted on top of the copper plane hot spot (TDH35H power resistor). The LMT70analog output temperature sensor is connected to a 16-bit resolution ADC (ADS1115IDGST). The threeTMP116AIDRVT devices are placed away from the heat generators of the power resistor in Figure 4 tosimulate the best layout scenario of keeping the temperature sensors as far away as possible from theheat source. Heat is generated when power is applied to the power resistor and a temperature gradient iscreated on the PCB. There are a total of six layout techniques investigated in this report.
USB
Voltage Regulator3.3 V
MSP430
TMP116 (U6)
ADS1115
LMT70
LMT70
LMT70
Power Resistor(R13)
Power Resistor(R12)
Power Resistor(R7)
TMP116 (U9)
TMP116 (U4)
SDA SCL
4 V
Copyright © 2017, Texas Instruments Incorporated
www.ti.com Method and Procedure
5SNOA966–August 2017Submit Documentation Feedback
Copyright © 2017, Texas Instruments Incorporated
TMP116 Ambient Air Temperature Measurement
Figure 3. Ambient Air Temperature Measurement System Block Diagram

U11 ± LMT70R7 ± TDH35H Power Resistor
U4 ± TMP116D
Method and Procedure www.ti.com
6 SNOA966–August 2017Submit Documentation Feedback
Copyright © 2017, Texas Instruments Incorporated
TMP116 Ambient Air Temperature Measurement
Figure 4. General Physical Layout for Test Board
Thermal Diodes
LMT70
GND
TAO
T_ON
VDD
DiodeTemp
Sensor
'6 A/D
Converter
OSC
Control Logic
Serial Interface
Config and Temp Register
Temperature
SCL1
3
6
4ALERT
SDA
GND2 5
V+
ADD0
EE
PR
OM
www.ti.com Method and Procedure
7SNOA966–August 2017Submit Documentation Feedback
Copyright © 2017, Texas Instruments Incorporated
TMP116 Ambient Air Temperature Measurement
2.2 Key System Components
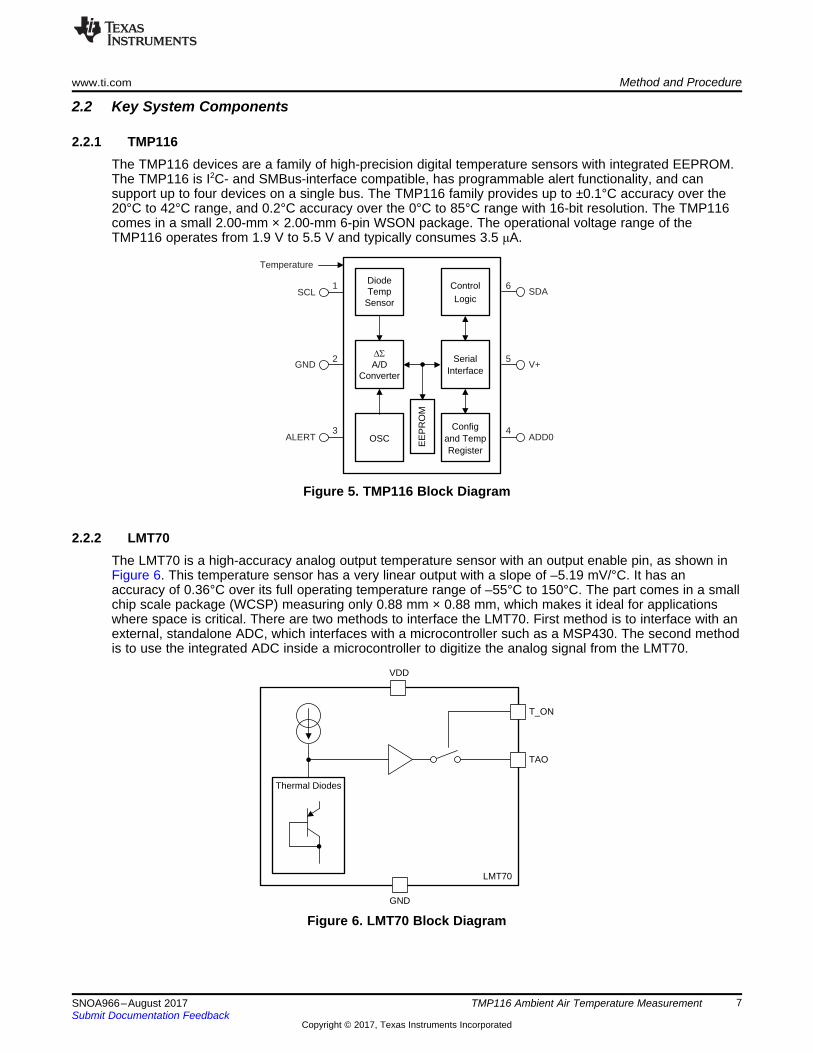
2.2.1 TMP116The TMP116 devices are a family of high-precision digital temperature sensors with integrated EEPROM.The TMP116 is I2C- and SMBus-interface compatible, has programmable alert functionality, and cansupport up to four devices on a single bus. The TMP116 family provides up to ±0.1°C accuracy over the20°C to 42°C range, and 0.2°C accuracy over the 0°C to 85°C range with 16-bit resolution. The TMP116comes in a small 2.00-mm × 2.00-mm 6-pin WSON package. The operational voltage range of theTMP116 operates from 1.9 V to 5.5 V and typically consumes 3.5 μA.
Figure 5. TMP116 Block Diagram
2.2.2 LMT70The LMT70 is a high-accuracy analog output temperature sensor with an output enable pin, as shown inFigure 6. This temperature sensor has a very linear output with a slope of –5.19 mV/°C. It has anaccuracy of 0.36°C over its full operating temperature range of –55°C to 150°C. The part comes in a smallchip scale package (WCSP) measuring only 0.88 mm × 0.88 mm, which makes it ideal for applicationswhere space is critical. There are two methods to interface the LMT70. First method is to interface with anexternal, standalone ADC, which interfaces with a microcontroller such as a MSP430. The second methodis to use the integrated ADC inside a microcontroller to digitize the analog signal from the LMT70.
Figure 6. LMT70 Block Diagram
16-Bit�����'6
ADCMUX PGA
VoltageReference
I2CInterface
OscillatorADS1115
Only
AIN0
AIN1
AIN2
AIN3
VDD
ALERT/RDY
ADDR
SCL
SDA
GND
Method and Procedure www.ti.com
8 SNOA966–August 2017Submit Documentation Feedback
Copyright © 2017, Texas Instruments Incorporated
TMP116 Ambient Air Temperature Measurement
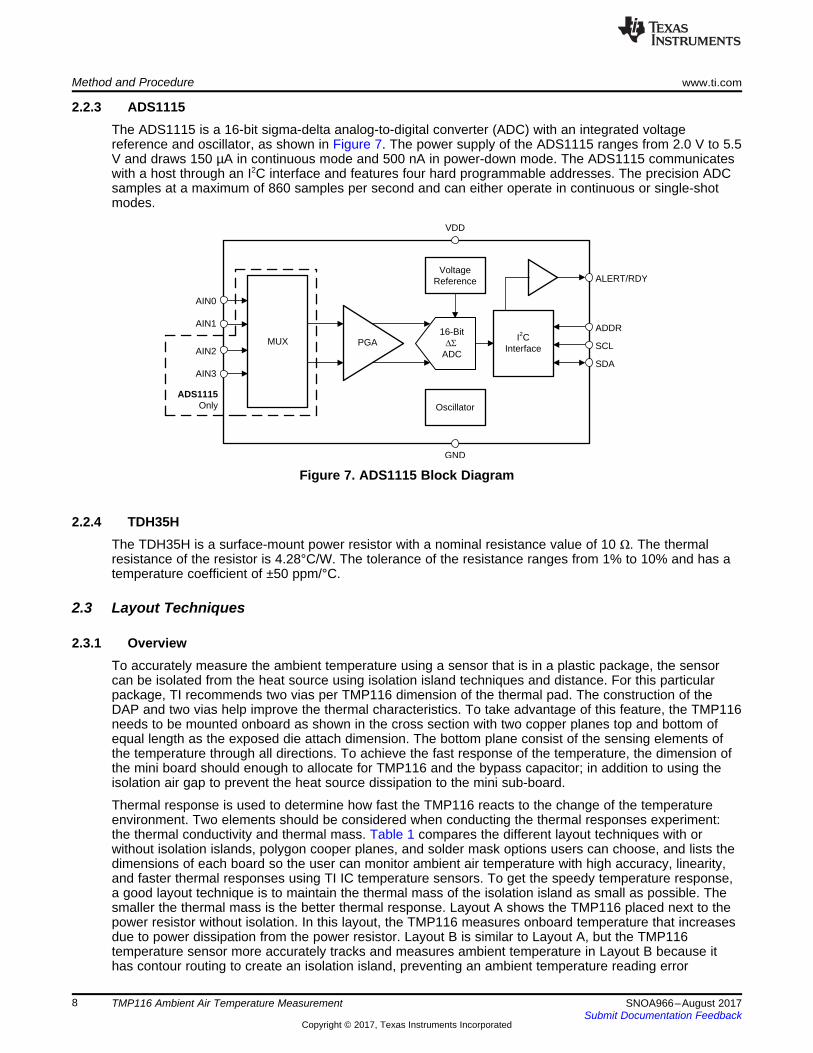
2.2.3 ADS1115The ADS1115 is a 16-bit sigma-delta analog-to-digital converter (ADC) with an integrated voltagereference and oscillator, as shown in Figure 7. The power supply of the ADS1115 ranges from 2.0 V to 5.5V and draws 150 µA in continuous mode and 500 nA in power-down mode. The ADS1115 communicateswith a host through an I2C interface and features four hard programmable addresses. The precision ADCsamples at a maximum of 860 samples per second and can either operate in continuous or single-shotmodes.
Figure 7. ADS1115 Block Diagram
2.2.4 TDH35HThe TDH35H is a surface-mount power resistor with a nominal resistance value of 10 Ω. The thermalresistance of the resistor is 4.28°C/W. The tolerance of the resistance ranges from 1% to 10% and has atemperature coefficient of ±50 ppm/°C.
2.3 Layout Techniques
2.3.1 OverviewTo accurately measure the ambient temperature using a sensor that is in a plastic package, the sensorcan be isolated from the heat source using isolation island techniques and distance. For this particularpackage, TI recommends two vias per TMP116 dimension of the thermal pad. The construction of theDAP and two vias help improve the thermal characteristics. To take advantage of this feature, the TMP116needs to be mounted onboard as shown in the cross section with two copper planes top and bottom ofequal length as the exposed die attach dimension. The bottom plane consist of the sensing elements ofthe temperature through all directions. To achieve the fast response of the temperature, the dimension ofthe mini board should enough to allocate for TMP116 and the bypass capacitor; in addition to using theisolation air gap to prevent the heat source dissipation to the mini sub-board.
Thermal response is used to determine how fast the TMP116 reacts to the change of the temperatureenvironment. Two elements should be considered when conducting the thermal responses experiment:the thermal conductivity and thermal mass. Table 1 compares the different layout techniques with orwithout isolation islands, polygon cooper planes, and solder mask options users can choose, and lists thedimensions of each board so the user can monitor ambient air temperature with high accuracy, linearity,and faster thermal responses using TI IC temperature sensors. To get the speedy temperature response,a good layout technique is to maintain the thermal mass of the isolation island as small as possible. Thesmaller the thermal mass is the better thermal response. Layout A shows the TMP116 placed next to thepower resistor without isolation. In this layout, the TMP116 measures onboard temperature that increasesdue to power dissipation from the power resistor. Layout B is similar to Layout A, but the TMP116temperature sensor more accurately tracks and measures ambient temperature in Layout B because ithas contour routing to create an isolation island, preventing an ambient temperature reading error

www.ti.com Method and Procedure
9SNOA966–August 2017Submit Documentation Feedback
Copyright © 2017, Texas Instruments Incorporated
TMP116 Ambient Air Temperature Measurement
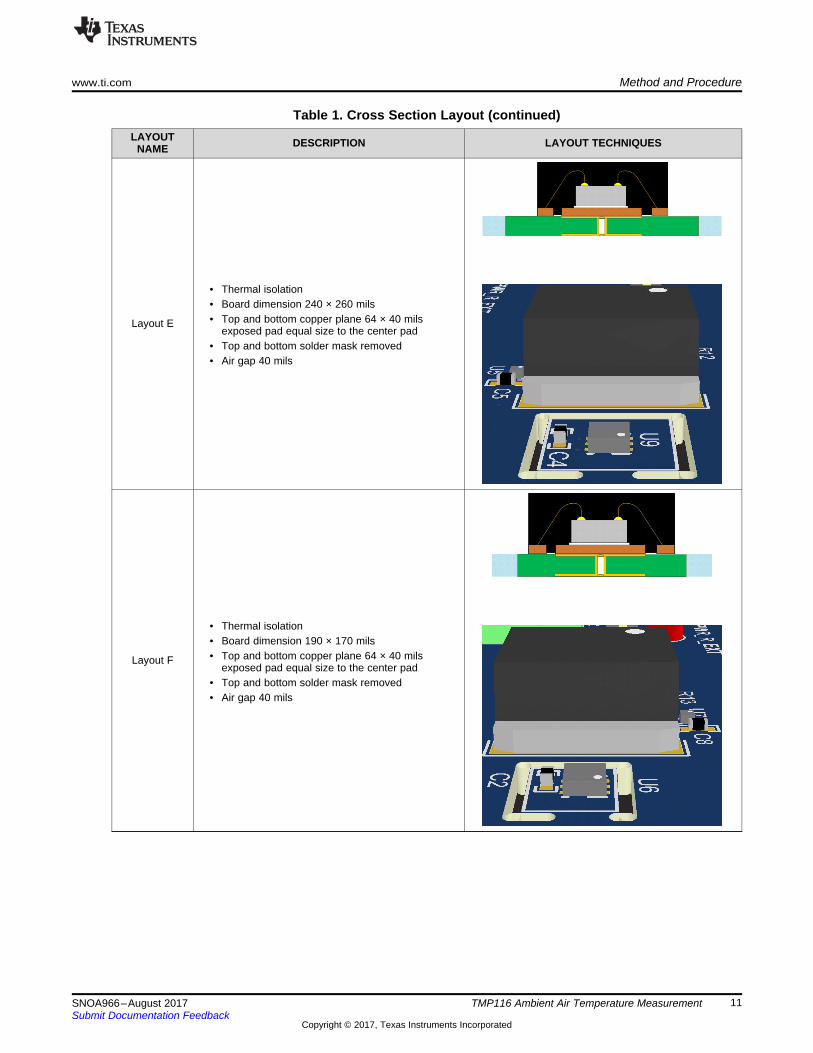
associated with heat dissipating directly to the TMP116. In Layout C, two polygon copper planes arecreated on both top and bottom layers extending beyond the TMP116 package. This helps absorb theambient temperature to reach equilibrium temperature at steady-state, but it has a slow thermal responsedue to thermal mass. Layout D also has two copper planes on the top and bottom layers with equal size tothe package’s dimension, but the thermal response is very similar to Layout C. Layout E and F have asimilar design to Layout D, but the two polygon copper planes are of equal size to the thermal pad. LayoutF shows a significantly faster thermal response and accurately measures the ambient air temperature.
Table 1. Cross Section Layout
LAYOUTNAME DESCRIPTION LAYOUT TECHNIQUES
Layout A
• No perforation isolation island• No bottom copper plane• No top and bottom solder mask removed• TMP116 senses PCB temperature
Layout B
• Thermal isolation• Board dimension 240 × 260 mils• No bottom copper plane• No top and bottom soldermask removed• Air gap 40 mils

Method and Procedure www.ti.com
10 SNOA966–August 2017Submit Documentation Feedback
Copyright © 2017, Texas Instruments Incorporated
TMP116 Ambient Air Temperature Measurement
Table 1. Cross Section Layout (continued)LAYOUT
NAME DESCRIPTION LAYOUT TECHNIQUES
Layout C
• Thermal isolation• Board dimension 240 × 260 mils• Top and bottom copper plane 130 × 140 mils
exposed pad• Top and bottom solder mask removed• Air gap 40 mils
Layout D
• Thermal isolation• Board dimension 240 × 260 mils• Top and bottom copper plane 100 × 100 mils
exposed pad equal size to the package• Top and bottom solder mask removed• Air gap 40 mils
www.ti.com Method and Procedure
11SNOA966–August 2017Submit Documentation Feedback
Copyright © 2017, Texas Instruments Incorporated
TMP116 Ambient Air Temperature Measurement
Table 1. Cross Section Layout (continued)LAYOUT
NAME DESCRIPTION LAYOUT TECHNIQUES
Layout E
• Thermal isolation• Board dimension 240 × 260 mils• Top and bottom copper plane 64 × 40 mils
exposed pad equal size to the center pad• Top and bottom solder mask removed• Air gap 40 mils
Layout F
• Thermal isolation• Board dimension 190 × 170 mils• Top and bottom copper plane 64 × 40 mils
exposed pad equal size to the center pad• Top and bottom solder mask removed• Air gap 40 mils

MCUResistor
Clear Plastic Box
70.1
70.1
Thermocouple Readout
TMP116
23RTD Readout
External PowerSupply
TMP116
Power Resistor MSP430
Probe
USB
Copyright © 2017, Texas Instruments Incorporated
Method and Procedure www.ti.com
12 SNOA966–August 2017Submit Documentation Feedback
Copyright © 2017, Texas Instruments Incorporated
TMP116 Ambient Air Temperature Measurement
2.4 Test SetupThe system diagram of the test setup for simulating enclosed chassis environment for off-boardtemperature sensing is shown in Figure 8. This shows the test setup used to determine an effective way tomeasure air temperature using a PCB. Each test board is placed inside an 11-in.’ × 10-in. × 7-in. clearplastic box to simulate a still-air condition. The red line rectangular box is the cardboard box that helps tocreate another layer of insulation. This will prevent any disturbance of the air flow. The board has anintegrated MSP430 microcontroller that provides I2C communication protocol between the sensors and amicrocontroller to a computer.
The temperature of the power resistor is monitored by contact with the LMT70 at the edge of the powerresistor mounted pad. The resistor temperature is also measured with a very fine-type T thermocouple tipinto a hole on the backside of the resistor through bottom side. This thermocouple is connected to anOmega DPi8-C24 readout. The LMT70 is used as a reference temperature for the TMP116. A high-precision RTD is connected to a Fluke 1502A with an excellent reference probe model 5615-9. It has anaccuracy of 12m°C, and is placed inside the clear plastic box just right above the TMP116 to measure theambient air temperature. The power resistor generates heat when voltage and current is applied 4 V and0.4 A, respectively, from an external power supply. The controlled temperature of the power resistor iswithin 90°C. The hot spot is controlled to have temperature ranging from 40°C to 100°C. The temperaturevalues from the system is gathered with I2C interface board and sent over USB as well as GPIB to aLabView program.
Figure 8. Test Setup System Diagram

Sample Count
Tem
pera
ture
(qC
)
0 250 500 750 1000 1250 1500 1750 2000 2250 250020
20.2
20.4
20.6
20.8
21
21.2
21.4
21.6
21.8
22
D001
Ref ProbeLayout CLayout BLayout A
www.ti.com Result
13SNOA966–August 2017Submit Documentation Feedback
Copyright © 2017, Texas Instruments Incorporated
TMP116 Ambient Air Temperature Measurement
3 Result
3.1 Temperature ResponseIn Table 1 is an example of PCB layouts to prevent heat source affecting the ambient temperaturemeasurement of the TMP116. The thermal isolation is required to avoid thermal coupling from the heatsource component through the PCB, because heat can radiate through air and transfer the heat tosurrounding components. To accurately monitor ambient temperature, maximize the air gap between thetemperature sensors and heat source by creating a contour routing around the desired hot spot (anti-etching) with a wider cutout when it is close to the source. Another method is to move the sensor awayfrom the heater source as far as possible; however, the wider cutout is not required when the distance isaway from the heat source. Figure 9 is example of an ambient temperature measurement without heatsource.
In Figure 11 through Figure 15, power is applied to the power resistor to generate heat approximately90°C. The results for TMP116 ambient air temperature measurement is shown in Figure 9 throughFigure 15. The measurement result shows the temperature gradient decreasing when the TMP116 isplaced farther away from the heat source and the hot spot temperature increases logarithmically for alllayouts.
Figure 9. Layout A, B, C Ambient Air Temperature Measurement

Sample Count
Tem
pera
ture
(qC
)
0 1000 2000 3000 4000 5000 6000 7000 8000 9000 10000 11000 12000 13000 1400020
30
40
50
60
70
80
90
100
11
45qC35qC
D002
Ref ProbeLayout CLayout BLayout AR12R13R7
Sample Count
Tem
pera
ture
(qC
)
0 500 1000 1500 2000 2500 3000 3500 4000 450020.5
20.6
20.7
20.8
20.9
21
21.1
21.2
21.3
21.4
21.5
D007
Layout DLayout FLayout ERef Probe
Result www.ti.com
14 SNOA966–August 2017Submit Documentation Feedback
Copyright © 2017, Texas Instruments Incorporated
TMP116 Ambient Air Temperature Measurement
Figure 10. Layout D, E, F Ambient Air Temperature Measurement
In Figure 11 and Figure 13, the TMP116 mini-sub board was placed a close distance of 0.508 mm awayfrom the power resistor. Creating a PCB contour routing around the sensor and other circuits, and leavinga narrow channel away from heat source components as a routing bridge into the island, minimizes themain heat source dissipation into the TMP116. Layout A (TMP116_U9) without the cutout island isolationshows that the TMP116 temperature reading is influenced by the power resistor temperature; thereforeaffecting the reading the ambient temperature. However, Layout C with contour routing, via and twocopper planes shows the TMP116 temperature reading is much closer to the reference temperature. Thetwo exposed copper planes that are bolted the top to the bottom layer with two recommended vias havevery high thermal conductivity. At a distance of 15.24 mm away from the heat source, there is nosignificant temperature gradient difference between contour routing and no contour routing.
Figure 11. Layout A, B, C — 0.508-mm Distance

Sample Count
Tem
pera
ture
(qC
)
0 12400 24800 37200 49600 62000 74400 86800 99200 111600 12400020
25
30
35
40
45
50
55
60
65
70
75
80
85
90
95
100
142qC
D004
Ref ProbeLayout DLayout FLayout ER12R13R7
Sample Count
Tem
pera
ture
(qC
)
0 5200 10400 15600 20800 26000 31200 36400 41600 46800 5200020
25
30
35
40
45
50
55
60
65
70
75
80
85
90
95
100
1 157qC 59qC
D003
Ref ProbeLayout CLayout BLayout AR12R13R7
www.ti.com Result
15SNOA966–August 2017Submit Documentation Feedback
Copyright © 2017, Texas Instruments Incorporated
TMP116 Ambient Air Temperature Measurement
Figure 12. Layout A, B, C — 15.24-mm Distance
Figure 13. Layout D, E, F — 0.508-mm Distance

Sample Count
Tem
pera
ture
(qC
)
0 8660 17320 25980 34640 43300 51960 60620 69280 77940 8660020
25
30
35
40
45
50
55
60
65
70
75
80
85
90
95
100
155qC
D006
Ref ProbeLayout DLayout FLayout ER12R13R7
Sample Count
Tem
pera
ture
(qC
)
0 19300 38600 57900 77200 96500 115800 135100 154400 173700 19300020
25
30
35
40
45
50
55
60
65
70
75
80
85
90
95
100
155qC
D005
Ref ProbeLayout DLayout FLayout ER12R13R7
Result www.ti.com
16 SNOA966–August 2017Submit Documentation Feedback
Copyright © 2017, Texas Instruments Incorporated
TMP116 Ambient Air Temperature Measurement
Figure 14. Layout D, E, F — 7.62-mm Distance
In comparison between Figure 14 and Figure 15, opening a wider air gap on the contour routing from 1.52mm to 2.54 mm does not show much temperature difference when measuring the ambient temperatureaway from the heat source components.
Figure 15. Layout D, E, F — 2.54-mm Isolation Air Gap
Distance is very important when measuring the ambient temperature. Table 2 lists the recommendeddistances for the heat source temperature.
Table 2. Recommended Distance Away From Heat Source
HEAT SOURCE TEMPERATURE AMBIENT TEMPERATURE RECOMMENDED DISTANCE40°C 20°C 7.62 mm60°C 20°C 15.24 mm100°C 20°C 38.1 mm

TMP116
Heat Source
Test Board TMP116
Heat Source
www.ti.com Result
17SNOA966–August 2017Submit Documentation Feedback
Copyright © 2017, Texas Instruments Incorporated
TMP116 Ambient Air Temperature Measurement
3.2 IR Thermal ImageAll simulations were done with PCB inside a 254-mm × 175-mm × 172-mm plastic box with a 3-mm thickwall. The air temperature surrounding the box is 20°C, where the power resistor heater pads are set at40°C, 60°C and 100°C. The temperature boundary condition was used instead of applying power to theheater. Thermal images were captured with FloTHERM thermal analysis tool to show the temperaturedistribution of the hot spot across the board. In Figure 16 heat radiated through air from the heat source.The temperature of the hotspot varies depending on where the reference probe is placed. The thermalmap shows a significant temperature concentration near the resistor hot spot due to low thermalconductivity between the TMP116 sensors and hot spot. The thermal image Figure 17 provides a topdown view of the PCB. So, it is important to know where the heat source is so that routing traces near theheat source can be avoided.
Figure 16. Heat Radiated Across Test Board
Figure 17. Layout D, E, F Extended Distance

Result www.ti.com
18 SNOA966–August 2017Submit Documentation Feedback
Copyright © 2017, Texas Instruments Incorporated
TMP116 Ambient Air Temperature Measurement
In Figure 18 the isolation air gap is about 0.8 mm. The bigger the air gap the better the ambient airmeasurement when the temperature sensors are close to the heat source. However, the gap does notmake any difference when the temperature sensor is placed far away.
Figure 18. Layout D, E, F Thermal Air Gap 0.8-mm Slot Width
Figure 19. Layout D, E, F Thermal Air Gap 1.8-mm Slot Width

www.ti.com Conclusion
19SNOA966–August 2017Submit Documentation Feedback
Copyright © 2017, Texas Instruments Incorporated
TMP116 Ambient Air Temperature Measurement
4 ConclusionPCB physical design can have a significant effect on temperature sensing. In this investigation, layout Fshowed the best result because it has a small dimension with fast temperature response. TI recommendsthat the designer consider the following design guidelines:• Copper planes and vias should be used to enhance thermal conduction and allow a better ambient air
temperature measurement• Miniaturize the board to reduce thermal mass to provide improved thermal response, if needed• Place two copper planes of equal size to the top and bottom of the exposed pad so that the ambient
air temperature can be transferred directly to the device.• Remove the top solder mask if possible because it helps absorb a better air temperature.• Cover exposed copper with solder paste to prevent oxidation.• Thermal isolation is required to avoid thermal coupling from heat source components through the PCB.• Avoid running copper plane underneath the temperature sensor.• Maximize the air gap between the sensor and the surrounding copper areas (anti-etch), especially
when close to the heat source.• Create a PCB cutout between sensor and other circuits. Leave a narrow channel away from heat
source components as a routing bridge into the island.• Route all signals on the bottom side, avoid traces on top if heat source is coming from the top side.• Place the board vertically to improve air flow and to reduce dust collection.• Do not solder thermal pad for improved accuracy.

IMPORTANT NOTICE FOR TI DESIGN INFORMATION AND RESOURCES
Texas Instruments Incorporated (‘TI”) technical, application or other design advice, services or information, including, but not limited to,reference designs and materials relating to evaluation modules, (collectively, “TI Resources”) are intended to assist designers who aredeveloping applications that incorporate TI products; by downloading, accessing or using any particular TI Resource in any way, you(individually or, if you are acting on behalf of a company, your company) agree to use it solely for this purpose and subject to the terms ofthis Notice.TI’s provision of TI Resources does not expand or otherwise alter TI’s applicable published warranties or warranty disclaimers for TIproducts, and no additional obligations or liabilities arise from TI providing such TI Resources. TI reserves the right to make corrections,enhancements, improvements and other changes to its TI Resources.You understand and agree that you remain responsible for using your independent analysis, evaluation and judgment in designing yourapplications and that you have full and exclusive responsibility to assure the safety of your applications and compliance of your applications(and of all TI products used in or for your applications) with all applicable regulations, laws and other applicable requirements. Yourepresent that, with respect to your applications, you have all the necessary expertise to create and implement safeguards that (1)anticipate dangerous consequences of failures, (2) monitor failures and their consequences, and (3) lessen the likelihood of failures thatmight cause harm and take appropriate actions. You agree that prior to using or distributing any applications that include TI products, youwill thoroughly test such applications and the functionality of such TI products as used in such applications. TI has not conducted anytesting other than that specifically described in the published documentation for a particular TI Resource.You are authorized to use, copy and modify any individual TI Resource only in connection with the development of applications that includethe TI product(s) identified in such TI Resource. NO OTHER LICENSE, EXPRESS OR IMPLIED, BY ESTOPPEL OR OTHERWISE TOANY OTHER TI INTELLECTUAL PROPERTY RIGHT, AND NO LICENSE TO ANY TECHNOLOGY OR INTELLECTUAL PROPERTYRIGHT OF TI OR ANY THIRD PARTY IS GRANTED HEREIN, including but not limited to any patent right, copyright, mask work right, orother intellectual property right relating to any combination, machine, or process in which TI products or services are used. Informationregarding or referencing third-party products or services does not constitute a license to use such products or services, or a warranty orendorsement thereof. Use of TI Resources may require a license from a third party under the patents or other intellectual property of thethird party, or a license from TI under the patents or other intellectual property of TI.TI RESOURCES ARE PROVIDED “AS IS” AND WITH ALL FAULTS. TI DISCLAIMS ALL OTHER WARRANTIES ORREPRESENTATIONS, EXPRESS OR IMPLIED, REGARDING TI RESOURCES OR USE THEREOF, INCLUDING BUT NOT LIMITED TOACCURACY OR COMPLETENESS, TITLE, ANY EPIDEMIC FAILURE WARRANTY AND ANY IMPLIED WARRANTIES OFMERCHANTABILITY, FITNESS FOR A PARTICULAR PURPOSE, AND NON-INFRINGEMENT OF ANY THIRD PARTY INTELLECTUALPROPERTY RIGHTS.TI SHALL NOT BE LIABLE FOR AND SHALL NOT DEFEND OR INDEMNIFY YOU AGAINST ANY CLAIM, INCLUDING BUT NOTLIMITED TO ANY INFRINGEMENT CLAIM THAT RELATES TO OR IS BASED ON ANY COMBINATION OF PRODUCTS EVEN IFDESCRIBED IN TI RESOURCES OR OTHERWISE. IN NO EVENT SHALL TI BE LIABLE FOR ANY ACTUAL, DIRECT, SPECIAL,COLLATERAL, INDIRECT, PUNITIVE, INCIDENTAL, CONSEQUENTIAL OR EXEMPLARY DAMAGES IN CONNECTION WITH ORARISING OUT OF TI RESOURCES OR USE THEREOF, AND REGARDLESS OF WHETHER TI HAS BEEN ADVISED OF THEPOSSIBILITY OF SUCH DAMAGES.You agree to fully indemnify TI and its representatives against any damages, costs, losses, and/or liabilities arising out of your non-compliance with the terms and provisions of this Notice.This Notice applies to TI Resources. Additional terms apply to the use and purchase of certain types of materials, TI products and services.These include; without limitation, TI’s standard terms for semiconductor products http://www.ti.com/sc/docs/stdterms.htm), evaluationmodules, and samples (http://www.ti.com/sc/docs/sampterms.htm).
Mailing Address: Texas Instruments, Post Office Box 655303, Dallas, Texas 75265Copyright © 2017, Texas Instruments Incorporated