title: skewed child sex ratios in india: continuity and change
TRANSCRIPT
Population Association of America Annual Meeting 2019
Title: Skewed Child Sex Ratios in India: Continuity and
Change
Author: Aradhana Singh
† Jawaharlal Nehru University, New Delhi, India
Presenting Author: Aradhana Singh
Doctoral Student, Jawaharlal Nehru University, New Delhi, India
Email: [email protected]
Introduction
The historic masculinization of the population at birth and initial ages in the country continues in
spite of several initiatives from the government of India to balance the female-male populations. It
has been more than two decades since the inception of the Pre-Conception and Pre-Natal Diagnostic
Techniques (Prohibition of Sex Selection) Act (PC-PNDT Act), but the impact of the initiative is
limited as the problem of sex-selective abortions continue to persist (Sen, 2003; Jha et al., 2011;
Myers, 2012; Arokiasamy and Goli, 2012; Stallard, 2016). The reports and the factsheet based on
the National Family Health Survey (NFHS) IV (IIPS and MoHFW, 2017) and a few studies using
this information (Radkar, 2018) from the factsheets present socio-economic and geographical
pattern of Sex Ratio at Birth (SRB) in India but they hide much more than they reveal and to the
extent misreport the estimates. Unlike the NFHS (2015-16) factsheets, findings based on Sample
Registration System (SRS) data do not support the logic of disappearance of excess female child
mortality. Therefore, the release of unit level information has facilitated us to re-examine the
estimate of the NFHS IV factsheets and studies based on them. The NFHS factsheets show that the
Child Sex Ratio (CSR) has been improved and the SRB is worsening (IIPS and MoHFW, 2017),
which indicate a disappearance of excess female child mortality in India which is impossible by any
logic and thus not true. This ambiguity shows that there is a need to recheck the estimates presented
in the NFHS IV factsheets by re-estimating it from the unit level data. At an outset, we have three-
fold objectives for this study. First, to re-estimate SRB and CSR by socio-economic groups, states,
and districts using unit level information of NFHS IV (2015-16). Second, is to present the trends in
SRB and CSR with a uniform definition by states and socio-economic groups since 1990s using
successive rounds of NFHS. Third, is to estimate the recent correlates of skewed CSR, SRB, and
SRLB in India.
Background
In most societies in the world, culturally females have always a lower perceived value than males.
Historically lower perceived utility of girls over boys continuously making girls marginalized in
terms of their numbers in the population. In 1662, John Graunt was the first to observe the
difference between the number of males and females at birth, which set a curiosity among
researchers to look into this disparity in the number of males and females in a population
(Chahnazarian, 1990; Campbell, 2001). In India, this deficit of females had been evident from the
very first Indian decennial Census in 1872 (Visaria, 2005). The overall sex ratio (female per
thousand males) has declined from 972 (1901) to 940 (2011) in 110 years (Appendix Table 1). In
late 1990s Amartya Sen came with the magnitude of the masculinization and analyzed the number
of "missing girls" from the population of Asia. After that many demographers estimated the missing
girls from Indian population (George, 2006, Kulkarni, 2007; Sahni et al., 2008; Gupta et al., 2009;
Jha et al., 2011). A Growing number of studies also report a continuous decline in the sex ratio in
initial ages (0-6) (see appendix table 2) and at birth (Kundu and Sahu, 1991; Rajan et al., 1991;
Raju and Premi, 1992; Nair, 1996; Premi, 2001; Agnihotri, 2000, 2003; Guilmoto and Depledge,
2008; Arokiaswamy and Goli, 2012). Moreover, this ascendancy of the number of males in
population exists in every stage of life cycle except in older population, because of different type of
neglect in terms of health, nutrition, hygiene and financial resources faced by females at the time of
birth, childhood, adolescence, marriage, pregnancy, and illness. The previous studies attribute the
India’s distorted child sex ratios to the factors like, sex-selective abortions, female infanticide and
foeticides and excess female child mortality and also due to under-enumeration of female
population (Das Gupta 1987; Kishore 1993; Sen 1992; Bhat, 2002; Arnold, Kishor and Roy, 2002;
Bhat and Zavier, 2007; Arokiaswamy, 2004; Visaria, 2005; Malhotra and Kant, 2006; Bongaarts
and Guilmoto, 2015). The economic survey of 2018 come up with the concept of “son meta
preference” which depicts the level of son preference in the society and how the couples are
stopping their fertility after achieving the desired number of the son in their family.
Context and Rationale
Although, previous studies have already revealed the possible reasons of skewed sex ratio at birth
and early ages, the analyses using the most recent NFHS data released in January 2018 will make
us cognizant of the recent positive or negative change in SRB and CSR across different
geographical and socio-economic settings. This study is meant to document the most recent socio-
economic and geographic trend and patterns considering uniform definition across the successive
rounds of NFHS. This study tests how far “north-west and south-east” divide, “Bermuda triangle”
and “rice and wheat belt” hypotheses previously used to explain the geographical pattern of sex
ratio (Miller 1981, Kishor, 1993; Raju, 1997; Agnihotri, 1994), are still valid in the present
context. For the first time, NFHS allow us to estimate district level SRB and Sex Ratio at Last
Birth (SRLB) which helps to test above said hypotheses with robust measures. This study also
tries to bring out the driving factors of SRB, CSR, and SRLB in the context of socio-economic
settings in the country. The economic Survey (2018) has taken note of the behavioural pattern of
Indian parents who prefer to have children “until the desired number of sons is born” and termed
it as “Meta Son Preference” (Government of India, 2018), but hardly there is any study which
comprehensively documented the impact of stopping rule behaviour1 on SRLB.
Data
This study used the census data for analyzing the long-term trends (1961 to 2011) in overall sex
ratio and sex ratio of children in 0-6 year age group. The NFHS data (1992-93, 1998-99, 2005-06
and 2015-16) has been used to analyze the emerging geographical and socio-economic pattern of
CSR, SRB, and SRLB. The appropriate weight has been used to make the estimates representative
and to account for multistage sampling design. The NFHS IV (2015-16) data is being analyzed to
see the socio-economic correlates of CSR, SRB, and SRLB.
Methods
The methodology in this paper involves calculation of CSR from census by using sex-wise
population in 0-6 year age group. The direct estimation of CSR, SRB and the SRLB was carried
out using unit level information from the successive round of NFHS. The CSR is estimated as
female/male ratio of living child population of 0 to 72 months, while the SRB and SRLB were
calculated as female/male ratio of total births in the five complete calendar years:1987-1991
(NFHS I), 1993-1997 (NFHS II), 2000-2004 (NFHS III) and 2010-2014 (NFHS IV). Further the
geographical pattern of CSR, SRB, and SRLB is represented through Arc GIS.
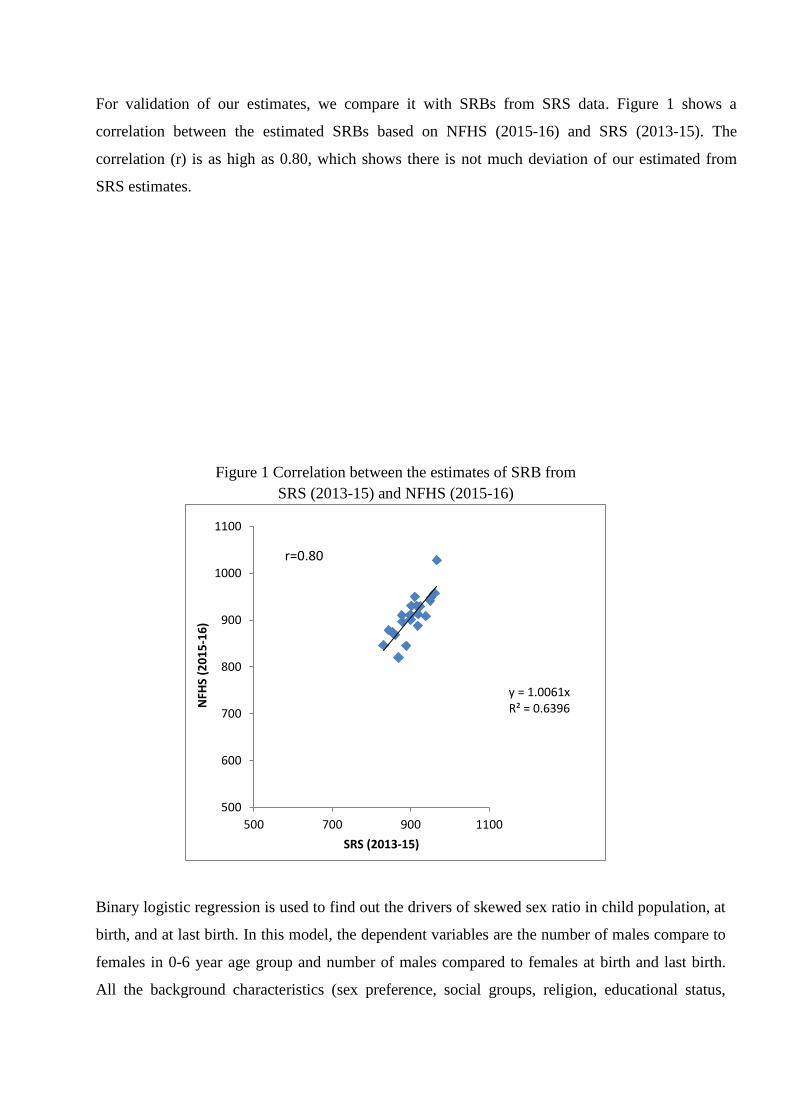
For validation of our estimates, we compare it with SRBs from SRS data. Figure 1 shows a
correlation between the estimated SRBs based on NFHS (2015-16) and SRS (2013-15). The
correlation (r) is as high as 0.80, which shows there is not much deviation of our estimated from
SRS estimates.
Figure 1 Correlation between the estimates of SRB from
SRS (2013-15) and NFHS (2015-16)
Binary logistic regression is used to find out the drivers of skewed sex ratio in child population, at
birth, and at last birth. In this model, the dependent variables are the number of males compare to
females in 0-6 year age group and number of males compared to females at birth and last birth.
All the background characteristics (sex preference, social groups, religion, educational status,
y = 1.0061xR² = 0.6396
500
600
700
800
900
1000
1100
500 700 900 1100
NFH
S (2
01
5-1
6)
SRS (2013-15)
r=0.80
wealth quintile, place of residence and region) are independent variables. The mathematical
expressions of the models are given elsewhere (see Retherford and Choe, 1991)
We used human fertility decision model to assess the effect of stopping rule behaviour on SRLB
which stimulate that couple's parity progression continues until they achieve the desired sex
composition.
Assumptions made here are as follows:
If the woman has the child at parity i
1. The probability of having a boy = p
2. The probability of having a girl = 1-p
If the sex ratio is 105 (biological or normal sex ratio)
3. Then p = 0.512
4. 1-p = 0.488
5. The probability of having all girls at parity I = (1-p) i.
If women move to next parity i+1
6. Probability of having all girls at parity i+1 = (1-p) i+1. *the probability of having all girls will
decline and having all boys will have increased by moving to next parity i+1.
Findings
Trends in sex preference, CSR, SRB, and SRLB
The estimates based on the four rounds of NFHS found that the sex ratio of the child population is
continuously masculinizing (Table 1). There was strong son preference2 in 1992-93 but over the
period it is decreasing, and by 2015-16 it is decreased by half to the level of 1992-93 (46.25 % in
1992-93 to 26.43% in 2015-16). Nevertheless, the CSR, SRB, and SRLB have not shown a
remarkable improvement. The proportion of women preferring for a girl child is very less during
the entire period, as it was only 2.86% in 1992-93 and 3.63 in 2015-16. SRB shows a declining
trend from 1992-93 to the 2015-16. The SRLB is adverse compared to all the other indicators of
sex ratio. It was 873 in 1992-93 which declined to 803 girls in 2015-16. The decline in CSR (0-6
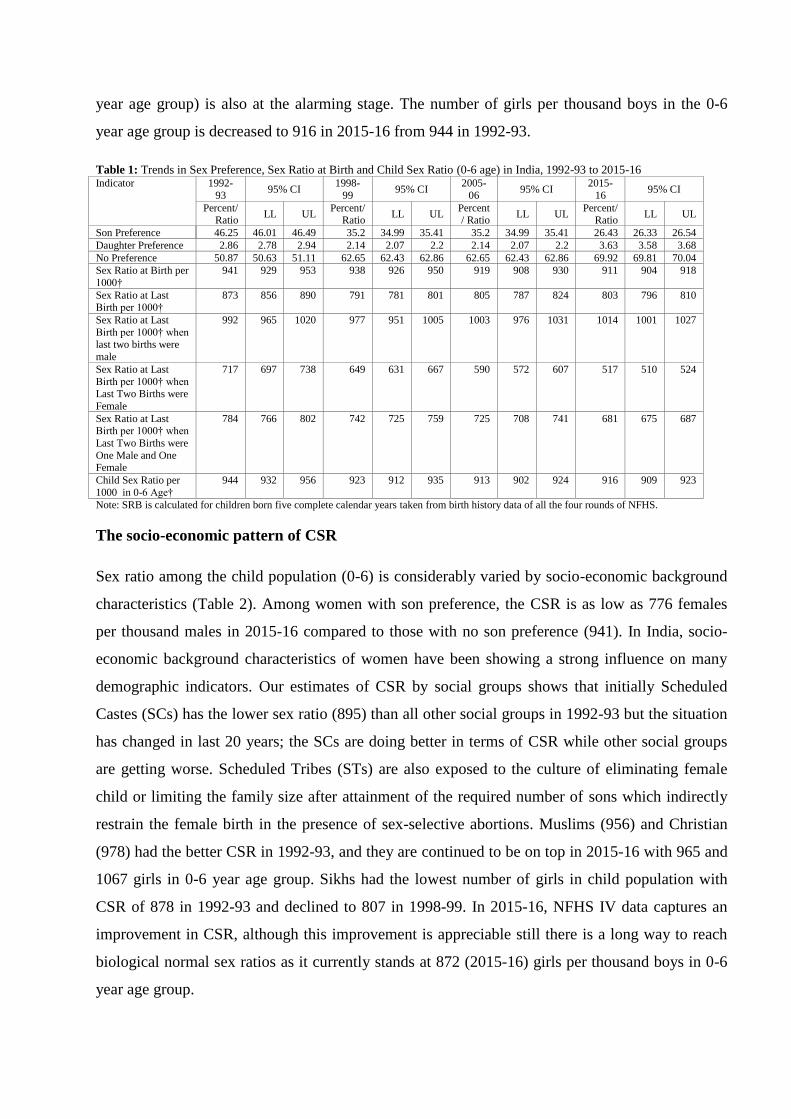
year age group) is also at the alarming stage. The number of girls per thousand boys in the 0-6
year age group is decreased to 916 in 2015-16 from 944 in 1992-93.
Table 1: Trends in Sex Preference, Sex Ratio at Birth and Child Sex Ratio (0-6 age) in India, 1992-93 to 2015-16 Indicator 1992-
93 95% CI
1998-
99 95% CI
2005-
06 95% CI
2015-
16 95% CI
Percent/ Ratio
LL UL Percent/
Ratio LL UL
Percent / Ratio
LL UL Percent/
Ratio LL UL
Son Preference 46.25 46.01 46.49 35.2 34.99 35.41 35.2 34.99 35.41 26.43 26.33 26.54
Daughter Preference 2.86 2.78 2.94 2.14 2.07 2.2 2.14 2.07 2.2 3.63 3.58 3.68
No Preference 50.87 50.63 51.11 62.65 62.43 62.86 62.65 62.43 62.86 69.92 69.81 70.04
Sex Ratio at Birth per
1000†
941 929 953 938 926 950 919 908 930 911 904 918
Sex Ratio at Last Birth per 1000†
873 856 890 791 781 801 805 787 824 803 796 810
Sex Ratio at Last
Birth per 1000† when last two births were
male
992
965 1020 977 951 1005
1003 976 1031 1014 1001 1027
Sex Ratio at Last
Birth per 1000† when Last Two Births were
Female
717 697 738 649 631 667 590 572 607 517 510 524
Sex Ratio at Last Birth per 1000† when
Last Two Births were
One Male and One Female
784 766 802 742 725 759 725 708 741 681 675 687
Child Sex Ratio per
1000 in 0-6 Age†
944 932 956 923 912 935 913 902 924 916 909 923
Note: SRB is calculated for children born five complete calendar years taken from birth history data of all the four rounds of NFHS.
The socio-economic pattern of CSR
Sex ratio among the child population (0-6) is considerably varied by socio-economic background
characteristics (Table 2). Among women with son preference, the CSR is as low as 776 females
per thousand males in 2015-16 compared to those with no son preference (941). In India, socio-
economic background characteristics of women have been showing a strong influence on many
demographic indicators. Our estimates of CSR by social groups shows that initially Scheduled
Castes (SCs) has the lower sex ratio (895) than all other social groups in 1992-93 but the situation
has changed in last 20 years; the SCs are doing better in terms of CSR while other social groups
are getting worse. Scheduled Tribes (STs) are also exposed to the culture of eliminating female
child or limiting the family size after attainment of the required number of sons which indirectly
restrain the female birth in the presence of sex-selective abortions. Muslims (956) and Christian
(978) had the better CSR in 1992-93, and they are continued to be on top in 2015-16 with 965 and
1067 girls in 0-6 year age group. Sikhs had the lowest number of girls in child population with
CSR of 878 in 1992-93 and declined to 807 in 1998-99. In 2015-16, NFHS IV data captures an
improvement in CSR, although this improvement is appreciable still there is a long way to reach
biological normal sex ratios as it currently stands at 872 (2015-16) girls per thousand boys in 0-6
year age group.
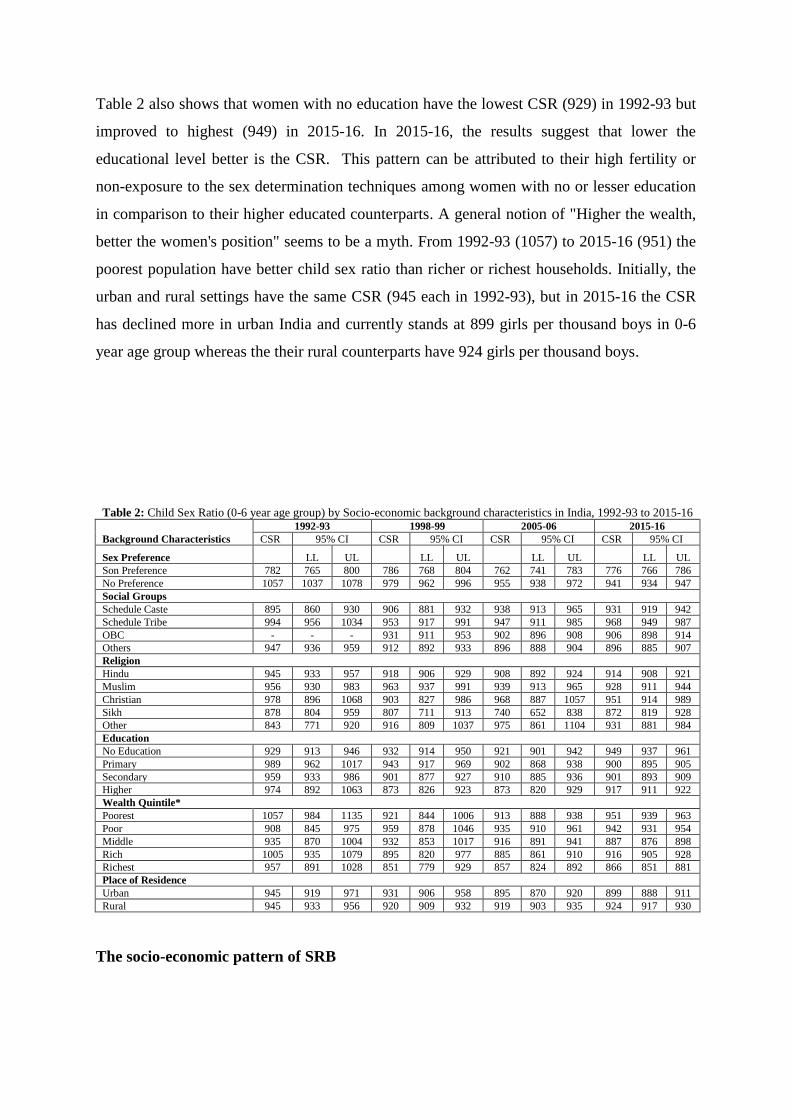
Table 2 also shows that women with no education have the lowest CSR (929) in 1992-93 but
improved to highest (949) in 2015-16. In 2015-16, the results suggest that lower the
educational level better is the CSR. This pattern can be attributed to their high fertility or
non-exposure to the sex determination techniques among women with no or lesser education
in comparison to their higher educated counterparts. A general notion of "Higher the wealth,
better the women's position" seems to be a myth. From 1992-93 (1057) to 2015-16 (951) the
poorest population have better child sex ratio than richer or richest households. Initially, the
urban and rural settings have the same CSR (945 each in 1992-93), but in 2015-16 the CSR
has declined more in urban India and currently stands at 899 girls per thousand boys in 0-6
year age group whereas the their rural counterparts have 924 girls per thousand boys.
Table 2: Child Sex Ratio (0-6 year age group) by Socio-economic background characteristics in India, 1992-93 to 2015-16
Background Characteristics
1992-93 1998-99 2005-06 2015-16
CSR 95% CI CSR 95% CI CSR 95% CI CSR 95% CI
Sex Preference LL UL LL UL LL UL LL UL
Son Preference 782 765 800 786 768 804 762 741 783 776 766 786
No Preference 1057 1037 1078 979 962 996 955 938 972 941 934 947
Social Groups
Schedule Caste 895 860 930 906 881 932 938 913 965 931 919 942
Schedule Tribe 994 956 1034 953 917 991 947 911 985 968 949 987
OBC - - - 931 911 953 902 896 908 906 898 914
Others 947 936 959 912 892 933 896 888 904 896 885 907
Religion
Hindu 945 933 957 918 906 929 908 892 924 914 908 921
Muslim 956 930 983 963 937 991 939 913 965 928 911 944
Christian 978 896 1068 903 827 986 968 887 1057 951 914 989
Sikh 878 804 959 807 711 913 740 652 838 872 819 928
Other 843 771 920 916 809 1037 975 861 1104 931 881 984
Education
No Education 929 913 946 932 914 950 921 901 942 949 937 961
Primary 989 962 1017 943 917 969 902 868 938 900 895 905
Secondary 959 933 986 901 877 927 910 885 936 901 893 909
Higher 974 892 1063 873 826 923 873 820 929 917 911 922
Wealth Quintile*
Poorest 1057 984 1135 921 844 1006 913 888 938 951 939 963
Poor 908 845 975 959 878 1046 935 910 961 942 931 954
Middle 935 870 1004 932 853 1017 916 891 941 887 876 898
Rich 1005 935 1079 895 820 977 885 861 910 916 905 928
Richest 957 891 1028 851 779 929 857 824 892 866 851 881
Place of Residence
Urban 945 919 971 931 906 958 895 870 920 899 888 911
Rural 945 933 956 920 909 932 919 903 935 924 917 930
The socio-economic pattern of SRB

The SRB is also worsening (794 in 1992-93 to 756 in 2015-16) over the period among the
women with son preference (Table 3). Except for SCs the number of girls born per thousand
boys has been worsening in all social groups from 1992-93 to 2015-16. Even among the STs,
who believed to be having better SRBs in the past, shown a decreasing trend (973 in 1992-93
to 953 in 2015-16). Among all the religions, Sikhs are eliminating larger number of girls at
birth and in early childhood. The SRB among Sikhs is getting slightly better from its previous
values of 835 in 1992-93 to 861 in 2015-16, although such smaller improvement in a 20 years
span could not help in balancing the SRB. Christian shows better SRB in comparison to other
religion in India (1017 in 1992-93 and 956 in 2015-16).
In 1992-93 the SRB was found to be better among primary (968) and secondary educated
women (965) in comparison to the highly educated women (934), but in 2015-16 it gets
adversely worse among the former than the later educational group. The SRB is found to be
lowest among the women with secondary level of education in 2015-16. The households with
the poorest income quintile have the highest number of girls (1031) born per thousand boys
born in 1992-93, but it reduced to 939 in 2015-16. Among all the income groups the middle
(892) and richest (845) households have the lowest SRB in 2015-16. Both rural and urban
India is continuously evident for missing girls at birth from last two decades (Table 3). But
comparatively urban India (895) has significantly less number of girls born to every thousand
boys than rural India (917) according to 2015-16 estimates.
Table 3: Sex Ratio at Birth by socio-economic background characteristics in India, 1992-93-93 to 2015-16 Background
Characteristics
1992-93 1998-99 2005-06 2015-16
SRB 95% CI SRB 95% CI SRB 95% CI SRB 95% CI
LL UL LL UL LL UL LL UL Sex Preference
Son Preference 794 776 812 800 782 819 795 773 817 756 746 765 No Preference 1042 1019 1067 997 977 1016 953 934 972 929 921 937 Social Groups
schedule Caste 901 865 936 944 918 971 941 915 968 927 915 938 schedule Tribe 973 936 1012 941 905 979 997 958 1037 953 932 975 OBC - - - 941 916 968 903 883 924 900 892 908 Others 945 928 961 925 905 946 897 872 922 888 877 900 Religion Hindu 941 924 957 936 920 953 914 898 930 907 901 914 Muslim 954 917 992 963 926 1002 944 908 982 924 908 940 Christian 1017 980 1168 944 864 1030 1018 933 1111 956 919 994
Sikh 835 737 945 832 734 942 719 633 814 861 809 916 Other 887 929 953 849 750 962 897 792 1015 912 863 964 Education No Education 930 914 946 954 936 973 940 919 961 939 928 951 Primary 968 931 1007 930 895 968 884 850 919 900 882 917 Secondary 965 928 1004 923 898 949 904 879 929 896 888 903
Higher 934 908 960 862 810 917 889 827 955 904 883 924 Wealth Quintile * Poorest 1031 944 1126 852 780 930 965 938 992 939 927 951 Poor 950 870 1037 947 867 1034 930 904 956 939 928 951 Middle 923 859 991 992 909 1083 922 897 948 892 881 903 Rich 1006 937 1081 927 849 1012 887 853 923 912 896 928 Richest 943 878 1013 947 836 1072 857 824 892 845 828 862 Place of Residence Urban 948 868 1035 942 916 969 897 873 922 895 884 906 Rural 939 923 956 937 932 942 926 908 945 917 909 925 Note: SRB is calculated for all births in the five complete calendar years (1987-1991, 1993-1997, 2000-2004 and 2010-2014) taken from birth history data of all round of NFHS 1, NFHS 2, NFHS 3 and NFHS 4.
*Wealth Index for NFHS 1 (1992-93) and NFHS 2 (1998-99) are calculated by authors.
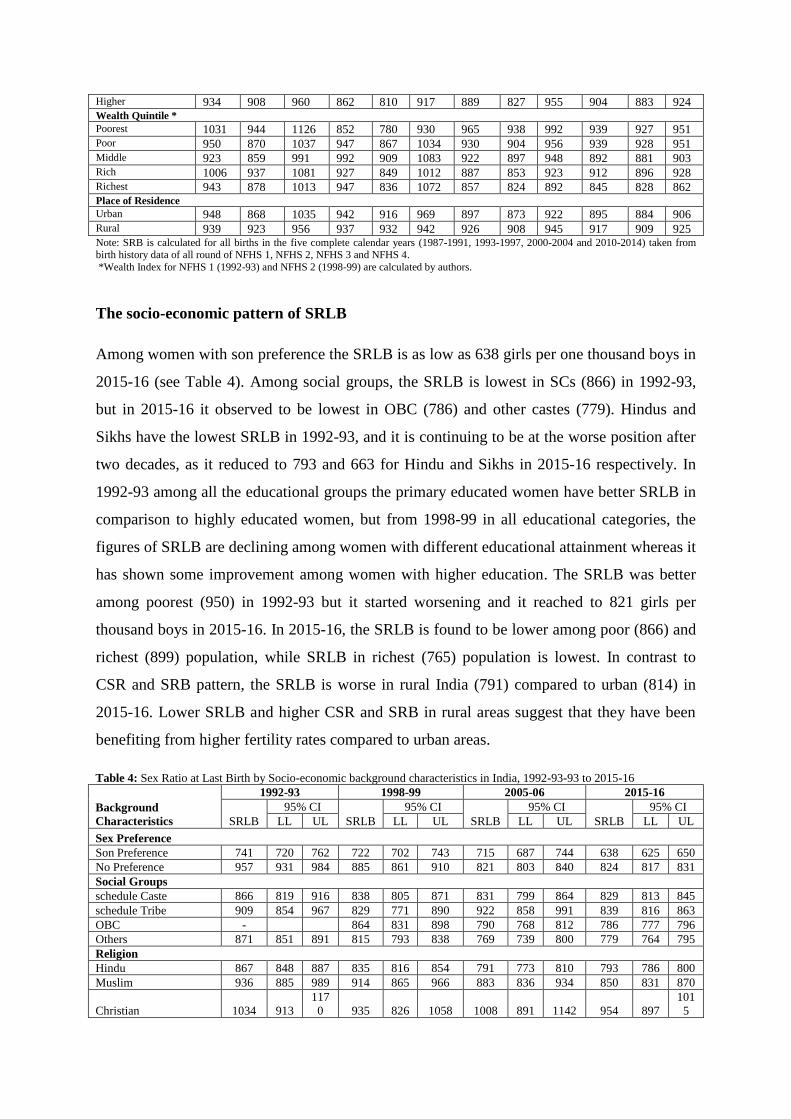
The socio-economic pattern of SRLB
Among women with son preference the SRLB is as low as 638 girls per one thousand boys in
2015-16 (see Table 4). Among social groups, the SRLB is lowest in SCs (866) in 1992-93,
but in 2015-16 it observed to be lowest in OBC (786) and other castes (779). Hindus and
Sikhs have the lowest SRLB in 1992-93, and it is continuing to be at the worse position after
two decades, as it reduced to 793 and 663 for Hindu and Sikhs in 2015-16 respectively. In
1992-93 among all the educational groups the primary educated women have better SRLB in
comparison to highly educated women, but from 1998-99 in all educational categories, the
figures of SRLB are declining among women with different educational attainment whereas it
has shown some improvement among women with higher education. The SRLB was better
among poorest (950) in 1992-93 but it started worsening and it reached to 821 girls per
thousand boys in 2015-16. In 2015-16, the SRLB is found to be lower among poor (866) and
richest (899) population, while SRLB in richest (765) population is lowest. In contrast to
CSR and SRB pattern, the SRLB is worse in rural India (791) compared to urban (814) in
2015-16. Lower SRLB and higher CSR and SRB in rural areas suggest that they have been
benefiting from higher fertility rates compared to urban areas.
Table 4: Sex Ratio at Last Birth by Socio-economic background characteristics in India, 1992-93-93 to 2015-16
Background
Characteristics
1992-93 1998-99 2005-06 2015-16
SRLB
95% CI
SRLB
95% CI
SRLB
95% CI
SRLB
95% CI
LL UL LL UL LL UL LL UL
Sex Preference
Son Preference 741 720 762 722 702 743 715 687 744 638 625 650
No Preference 957 931 984 885 861 910 821 803 840 824 817 831
Social Groups
schedule Caste 866 819 916 838 805 871 831 799 864 829 813 845
schedule Tribe 909 854 967 829 771 890 922 858 991 839 816 863
OBC - 864 831 898 790 768 812 786 777 796
Others 871 851 891 815 793 838 769 739 800 779 764 795
Religion
Hindu 867 848 887 835 816 854 791 773 810 793 786 800
Muslim 936 885 989 914 865 966 883 836 934 850 831 870
Christian 1034 913
117
0 935 826 1058 1008 891 1142 954 897
101
5
Sikh 612 509 731 596 495 712 494 408 593 663 616 713
Other 781 689 884 654 532 796 820 687 977 818 761 879
Education
No Education 866 846 886 866 843 891 835 812 858 807 793 821
Primary 904 869 940 809 765 856 776 734 820 769 752 787
Secondary 885 851 921 815 783 847 775 745 807 801 791 811
Higher 835 764 912 810 754 870 800 732 873 845 821 868
Wealth Quintile *
Poorest 950 870
103
7 798 703 903 889 855 925 821 805 837
Poor 866 793 946 965 852 1092 788 758 820 811 795 827
Middle 924 846
100
8 874 771 989 808 777 840 796 780 811
Rich 948 869
103
5 974 860 1102 769 739 800 817 801 833
Richest 899 824 982 796 702 901 757 727 787 765 747 782
Place of Residence
Urban 879 845 914 849 816 883 802 771 834 814 804 824
Rural 872 853 892 840 821 859 806 788 824 798 791 805 Note: SRLB is calculated for all last births in the five complete calendar years (1987-1991, 1993-1997, 2000-2004 and 2010-2014) taken
from birth history data of all round of NFHS 1, NFHS 2, NFHS 3 and NFHS 4.
*Wealth Index for NFHS 1 (1992-93) and NFHS 2 (1998-99) are calculated by authors.
The geographical pattern of CSR, SRB, and SRLB
The disparity in terms of sex ratio among Indian states is not a new phenomenon, and this
regional inconsistency is revealed by time to time from different data sources like the census,
vital statistics and sample surveys (Ramchandran and Deshpande, 1964; Agnihotri, 2000;
Guilmoto and Depledge, 2008; Arokiasamy, 2004; Kumar and Sathyanarayana, 2012). As per
the sex ratio scenario, a north-south divide has been noticed which is also described as rice
and wheat belt divide where rice belt includes all the southern and eastern parts of the country
and the wheat producing areas are mainly concentrated in western parts (Miller 1981, Kishor,
1993; Raju, 1997). Agnihotri in 1996 found that the dearth of females in the primary age
group is prevalent in north and north-west part of India and termed this region as “Bermuda
triangle” which includes districts of Haryana, ravine area of Madhya Pradesh, Rajasthan and
western Uttar Pradesh. Here, in this paper, the analysis of recent data shows an emerging
geographical pattern of sex ratio in the 0-6 year age group and at birth. Although, the most
recent census (2011) continue to support the fact that the north, west, and central India is
mainly contributing to the decline in the CSRs at the national level, but also hints the decline
the CSR in several districts of south and eastern India (Arokiasamy and Goli, 2012). Now it's
been seven years after the last census conducted, the analyses based on 2015-16 data shows
an emerging pattern in CSR and SRB (see table 5, 6 and table 7).
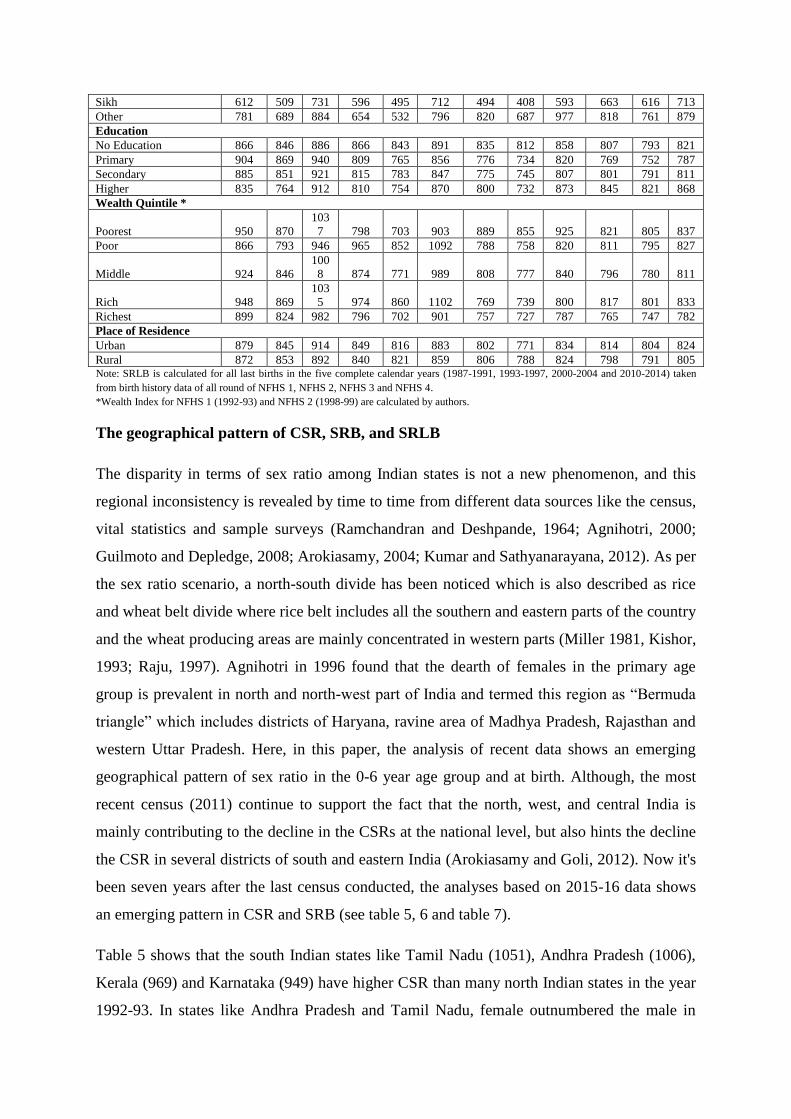
Table 5 shows that the south Indian states like Tamil Nadu (1051), Andhra Pradesh (1006),
Kerala (969) and Karnataka (949) have higher CSR than many north Indian states in the year
1992-93. In states like Andhra Pradesh and Tamil Nadu, female outnumbered the male in
child (0-6) population in 1992-93. However, over the period during 1992-93 to 2015-16, the
CSR deteriorated in every south Indian state except Kerala (1025). Despite being one of the
southern and rice cultivating Indian states, Telangana (912) has very less number of girls than
boys in 0-6 year age group in 2015-16. In 1992-93, the northern states, Delhi (904), Punjab
(887), Rajasthan (877) and Haryana (859) have the least number of girls in child population,
and these states are continuing to be at the bottom till 2015-16. In 2015-16, the north-eastern
states like Manipur (982), Meghalaya (1014), Mizoram (946) and Nagaland (949) have better
sex ratios in comparison to many north Indian states like Delhi (835), Uttar Pradesh (904),
Bihar (935) and Jammu & Kashmir (911). Overall, a majority of the Indian states have
experiencing a declining trend in the number of girls per thousand boys in the child
population. From 1992-92 to 2015-16, the states which have shown an improvement in child
CSR are Kerala (+56), Himachal Pradesh (+44), Meghalaya (+40), Arunachal Pradesh (+30),
Mizoram (+13), Rajasthan (+6) and Odisha (+1). Although, it was widely discussed and
documented about north-south or east-west divide in CSR patterns by the previous studies,
our trend analysis suggest that CSR is undoubtedly declining in almost all part of India and
leading to an emerging geographical patterns of sex ratio imbalance in the country.
Table 5: Child Sex Ratios for all States of India, 1992-93 to 2015-16
States
1992-93 1998-99 2005-06 2015-16
CSR
95% CI
CSR
95% CI
CSR
95% CI
CSR
95% CI
LL UL LL UL LL UL LL UL
Andhra Pradesh 1006 952 1063 920 871 973 891 837 948 894 870 919
Arunachal Pradesh 894 598 1324 867 579 1283 1020 686 1519 924 759 1125
Assam 1022 952 1098 915 838 998 988 905 1079 921 885 957
Bihar 941 905 979 939 903 977 887 852 922 935 917 954
Goa 954 640 1417 847 565 1253 960 644 1425 902 740 1097
Gujarat 966 908 1028 922 901 943 902 840 969 881 856 905
Haryana 859 786 937 857 785 936 759 694 829 826 794 860
Himachal Pradesh 900 754 1072 934 767 1136 893 733 1087 944 864 1030
Jammu and Kashmir 863 707 1049 878 775 994 911 804 1031 911 848 979
Karnataka 949 779 1154 957 891 1028 945 880 1015 922 897 948
Kerala 969 888 1058 942 863 1028 925 847 1009 1025 985 1066
Madhya Pradesh 921 885 958 910 875 946 975 917 1038 919 899 940
Maharashtra 956 920 995 931 895 968 882 834 932 923 903 945
Manipur 1060 803 1403 992 750 1310 1012 766 1337 982 868 1112
Meghalaya 974 736 1286 898 678 1185 974 736 1286 1014 895 1148
Mizoram 933 625 1384 871 581 1289 1025 690 1526 946 776 1151
Nagaland 950 718 1255 922 696 1217 975 737 1288 949 796 1131
Delhi 904 798 1023 833 735 942 855 755 968 835 784 888
Odisha 934 869 1003 955 889 1026 924 860 993 935 899 973
Punjab 887 812 969 830 760 906 725 663 792 840 808 874
Rajasthan 877 824 933 883 835 934 860 808 915 883 859 908
Tamil Nadu 1051 988 1118 967 909 1029 933 869 1003 944 918 971
Tripura 961 789 1170 983 743 1299 972 735 1284 953 842 1079
Uttar Pradesh 919 893 944 936 910 962 906 881 932 904 893 915
West Bengal 969 932 1008 898 849 949 975 923 1031 953 932 975
Sikkim - - - 920 616 1364 1003 674 1492 891 596 1320
Chhattisgarh - - - - - - 927 849 1011 966 853 1094
Jharkhand - - - - - - 1085 994 1185 921 886 958
Uttarakhand - - - - 911 763 1085 891 829 957
Telangana - - - - - - - - - 912 877 948
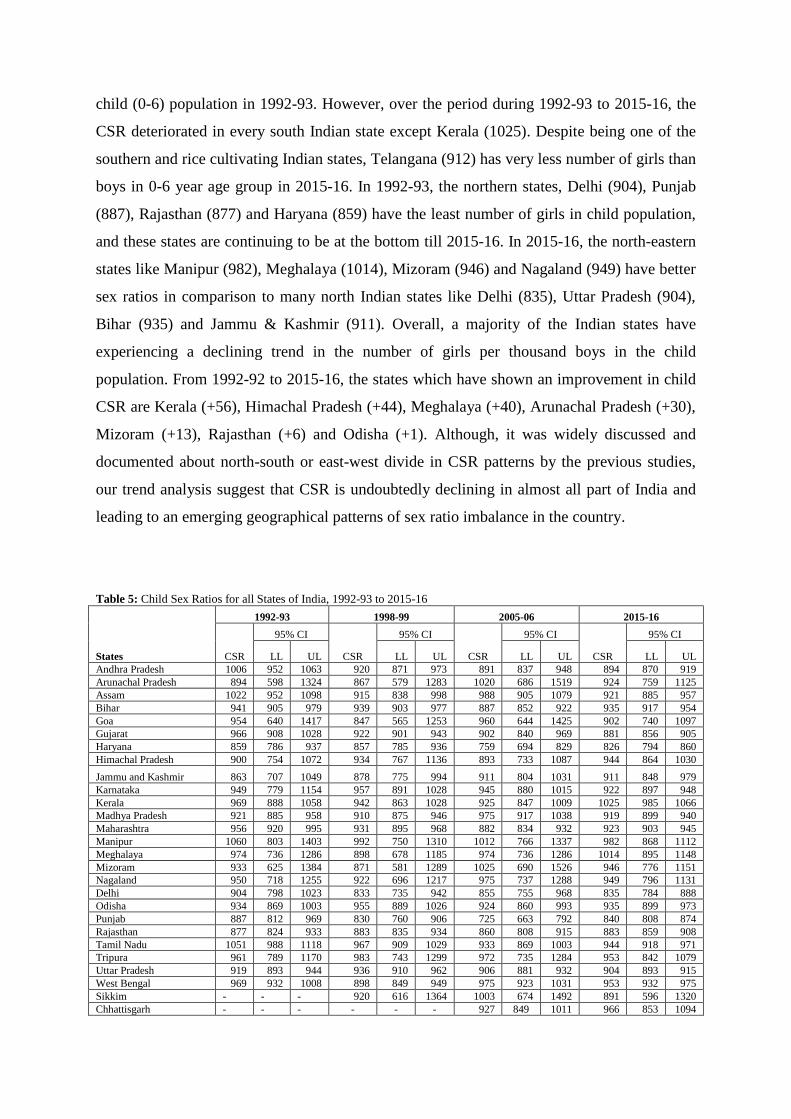
Table 6: Sex Ratio at Birth for all States of India, 1992-93 to 2015-16
States
1992-93 1998-99 2005-06 2015-16
SRB
95% CI
SRB
95% CI
SRB
95% CI
SRB
95% CI
LL UL LL UL LL UL LL UL
Andhra Pradesh 1005 985 1025 950 899 1004 872 811 936 899 864 935
Arunachal Pradesh 971 652 1443 820 546 1213 1001 673 1489 910 747 1,107
Assam 962 895 1033 909 832 992 982 900 1072 901 866 937
Bihar 955 918 993 944 908 982 921 886 958 931 913 949
Goa 965 648 1434 878 586 1300 945 634 1403 949 779 1,154
Gujarat 980 912 1053 901 838 967 897 835 964 873 850 898
Haryana 904 828 987 877 803 958 726 640 823 846 813 880
Himachal Pradesh 852 722 1071 903 741 1099 901 739 1095 930 851 1,015
Jammu and Kashmir 880 722 1071 911 804 1031 908 761 1082 910 847 978
Karnataka 929 873 988 964 897 1035 970 903 1042 909 884 934
Kerala 961 880 1049 892 817 974 934 825 1057 1028 972 1,087
Madhya Pradesh 930 895 968 915 880 952 1014 953 1079 913 888 938
Maharashtra 961 924 1000 926 876 978 865 818 914 911 890 931
Manipur 1057 800 1399 1068 809 1413 1010 764 1335 964 852 1,092
Meghalaya 1021 773 1350 849 640 1120 929 702 1226 992 876 1,123
Mizoram 980 658 1456 936 628 1389 1032 695 1538 986 810 1,200
Nagaland 943 632 1399 884 667 1167 902 603 1337 955 785 1,163
Delhi 884 780 1000 847 748 959 859 719 1023 820 770 873
Odisha 948 882 1018 992 923 1065 886 812 968 941 905 979
Punjab 828 758 904 874 800 954 742 678 810 845 800 894
Rajasthan 893 839 950 896 842 953 897 843 955 869 845 893
Tamil Nadu 1018 957 1084 1000 931 1074 991 923 1065 950 924 977
Tripura 908 745 1104 981 742 1296 978 739 1292 936 826 1,059
Uttar Pradesh 909 884 934 972 945 999 915 890 941 896 881 912
West Bengal 963 911 1018 927 877 980 947 890 1007 947 921 974
Sikkim - - - 896 599 1328 986 662 1465 802 533 1,186
Chhattisgarh - - - - - - 890 815 971 958 921 996
Jharkhand - - - - - - 1062 972 1159 930 895 968
Uttarakhand - - - - - - 873 716 1062 878 817 943
Telangana - - - - - - - - - 875 841 910
SRB is getting deteriorated in almost all the states of India (Table 6). The southern India,
which is known for its better demographic indicators have also not remained untouched by
this demographic constraint. From 1992-93 to 2015-16 the states which have shown an
improvement in SRB are Himachal Pradesh (+78), Kerala (+38), Jammu & Kashmir (+30),
Punjab (+17), Mizoram (+6) and Nagaland (+12), except these states all other have declining
trend from last two decades. The newly formed Telangana also have very less number of girls
(875) per thousand boys at birth. In 2015-16, among major Indian states, Haryana (846) and
Punjab (845) are continuously displaying lowest SRB. Since 1992-93 the north-eastern states
like Mizoram (+6), Tripura (+28) Nagaland (+12) have shown positive growth in the number
of girls at birth. But the remaining states like Meghalaya and Manipur have very less number
of girls per thousand boys at birth from last two decades. Top five states where the SRB is
better in 2015-16 are, Kerala (1028), Meghalaya (992), Mizoram (986), Manipur (964) and
Chhattisgarh (958) and the bottom five states where the SRB is worst in 2015-16 are Sikkim
(802), Delhi (820), Punjab (845), Haryana (846) and Rajasthan (869).
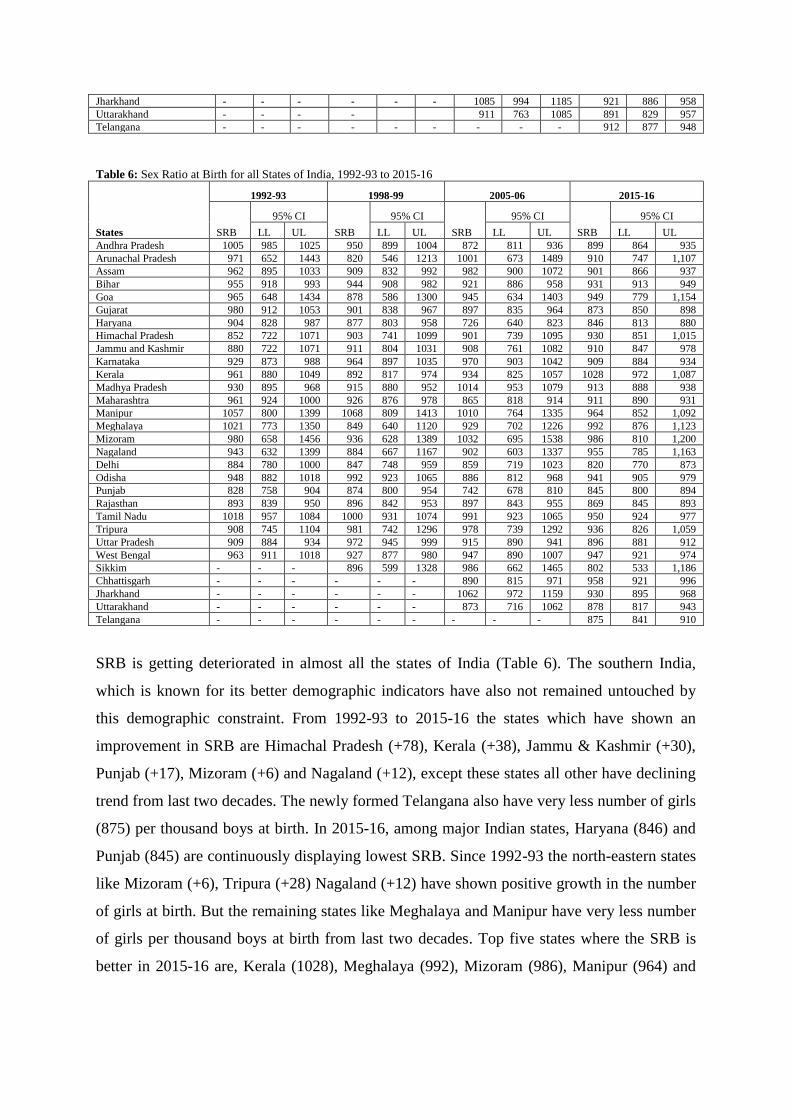
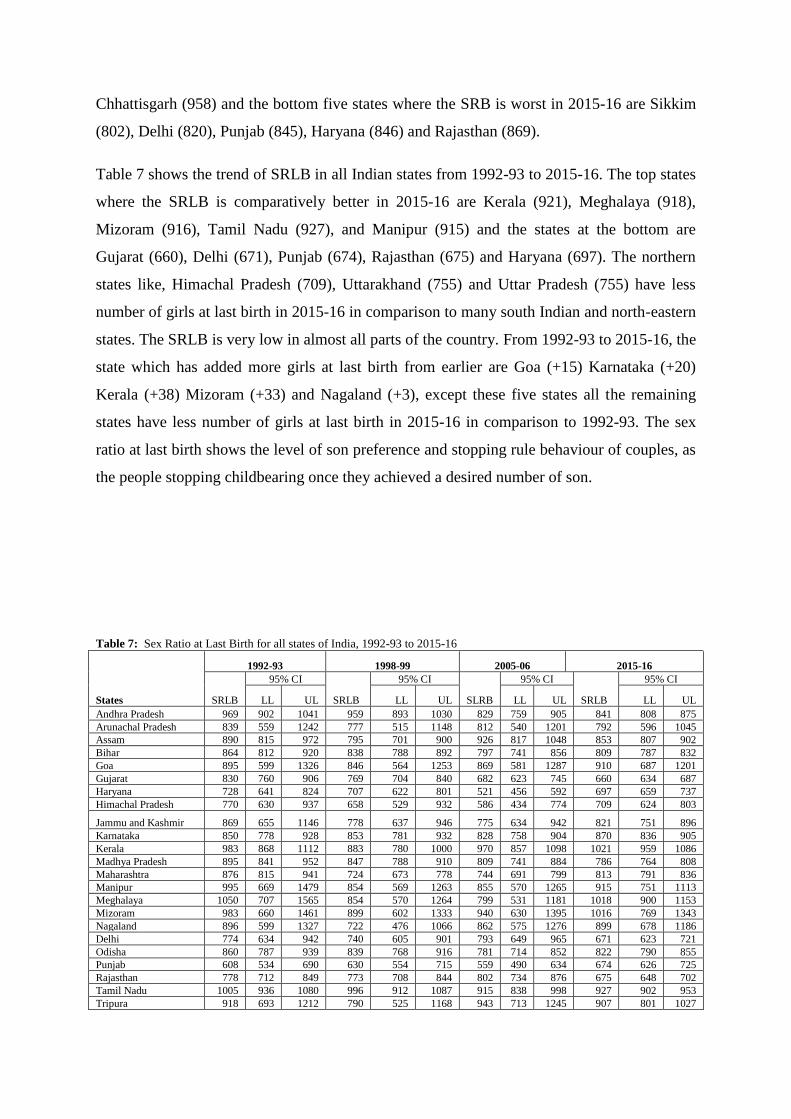
Table 7 shows the trend of SRLB in all Indian states from 1992-93 to 2015-16. The top states
where the SRLB is comparatively better in 2015-16 are Kerala (921), Meghalaya (918),
Mizoram (916), Tamil Nadu (927), and Manipur (915) and the states at the bottom are
Gujarat (660), Delhi (671), Punjab (674), Rajasthan (675) and Haryana (697). The northern
states like, Himachal Pradesh (709), Uttarakhand (755) and Uttar Pradesh (755) have less
number of girls at last birth in 2015-16 in comparison to many south Indian and north-eastern
states. The SRLB is very low in almost all parts of the country. From 1992-93 to 2015-16, the
state which has added more girls at last birth from earlier are Goa (+15) Karnataka (+20)
Kerala (+38) Mizoram (+33) and Nagaland (+3), except these five states all the remaining
states have less number of girls at last birth in 2015-16 in comparison to 1992-93. The sex
ratio at last birth shows the level of son preference and stopping rule behaviour of couples, as
the people stopping childbearing once they achieved a desired number of son.
Table 7: Sex Ratio at Last Birth for all states of India, 1992-93 to 2015-16
States
1992-93 1998-99 2005-06 2015-16
SRLB
95% CI
SRLB
95% CI
SLRB
95% CI
SRLB
95% CI
LL UL LL UL LL UL LL UL
Andhra Pradesh 969 902 1041 959 893 1030 829 759 905 841 808 875
Arunachal Pradesh 839 559 1242 777 515 1148 812 540 1201 792 596 1045
Assam 890 815 972 795 701 900 926 817 1048 853 807 902
Bihar 864 812 920 838 788 892 797 741 856 809 787 832
Goa 895 599 1326 846 564 1253 869 581 1287 910 687 1201
Gujarat 830 760 906 769 704 840 682 623 745 660 634 687
Haryana 728 641 824 707 622 801 521 456 592 697 659 737
Himachal Pradesh 770 630 937 658 529 932 586 434 774 709 624 803
Jammu and Kashmir 869 655 1146 778 637 946 775 634 942 821 751 896
Karnataka 850 778 928 853 781 932 828 758 904 870 836 905
Kerala 983 868 1112 883 780 1000 970 857 1098 1021 959 1086
Madhya Pradesh 895 841 952 847 788 910 809 741 884 786 764 808
Maharashtra 876 815 941 724 673 778 744 691 799 813 791 836
Manipur 995 669 1479 854 569 1263 855 570 1265 915 751 1113
Meghalaya 1050 707 1565 854 570 1264 799 531 1181 1018 900 1153
Mizoram 983 660 1461 899 602 1333 940 630 1395 1016 769 1343
Nagaland 896 599 1327 722 476 1066 862 575 1276 899 678 1186
Delhi 774 634 942 740 605 901 793 649 965 671 623 721
Odisha 860 787 939 839 768 916 781 714 852 822 790 855
Punjab 608 534 690 630 554 715 559 490 634 674 626 725
Rajasthan 778 712 849 773 708 844 802 734 876 675 648 702
Tamil Nadu 1005 936 1080 996 912 1087 915 838 998 927 902 953
Tripura 918 693 1212 790 525 1168 943 713 1245 907 801 1027
Uttar Pradesh 843 810 877 886 852 921 817 785 849 755 749 760
West Bengal 928 863 997 883 822 949 872 811 936 895 870 920
Sikkim - - - 713 470 1053 905 605 1341 782 519 1156
Chhattisgarh - - - - - - 829 731 938 822 772 875
Jharkhand - - - - - - 976 862 1105 766 725 810
Uttarakhand - - - - - - 684 558 833 755 691 825
Telangana - - - - - - - - - 868 835 903
Note: SRLB is calculated for all last births in the five complete calendar years (1987-1991, 1993-1997, 2000-2004 and 2010-2014) taken
from birth history data of all round of NFHS 1, NFHS 2, NFHS 3 and NFHS 4.
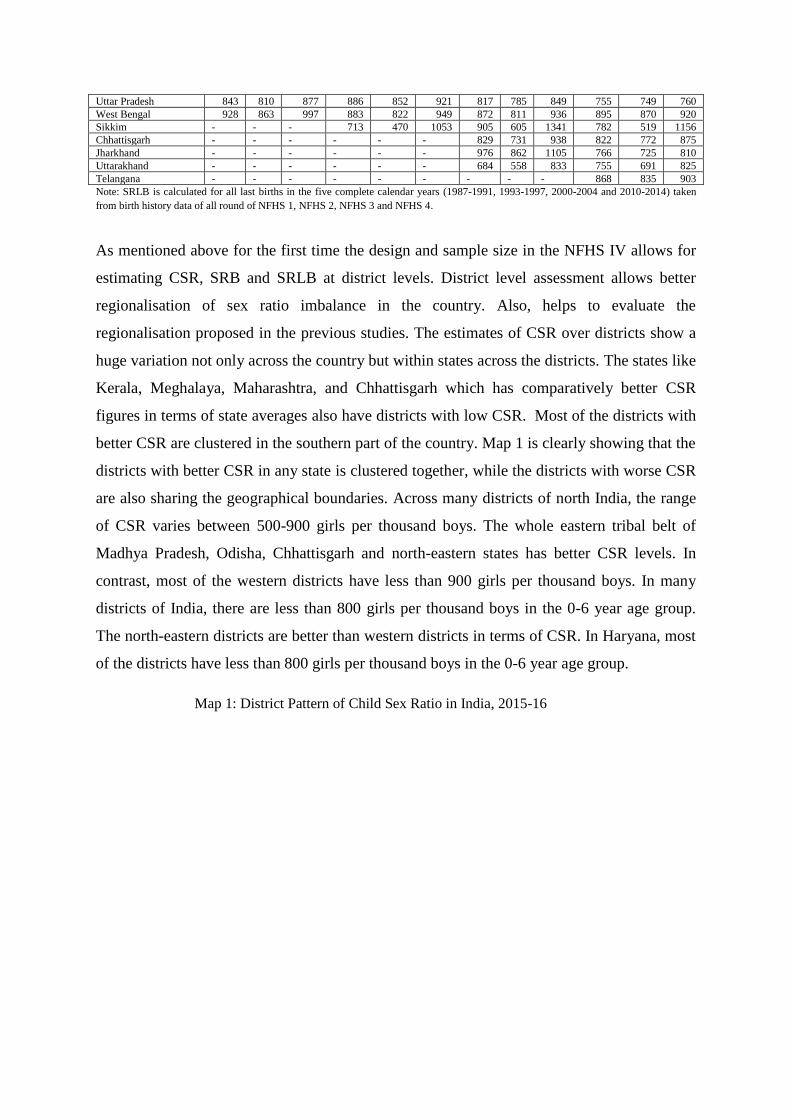
As mentioned above for the first time the design and sample size in the NFHS IV allows for
estimating CSR, SRB and SRLB at district levels. District level assessment allows better
regionalisation of sex ratio imbalance in the country. Also, helps to evaluate the
regionalisation proposed in the previous studies. The estimates of CSR over districts show a
huge variation not only across the country but within states across the districts. The states like
Kerala, Meghalaya, Maharashtra, and Chhattisgarh which has comparatively better CSR
figures in terms of state averages also have districts with low CSR. Most of the districts with
better CSR are clustered in the southern part of the country. Map 1 is clearly showing that the
districts with better CSR in any state is clustered together, while the districts with worse CSR
are also sharing the geographical boundaries. Across many districts of north India, the range
of CSR varies between 500-900 girls per thousand boys. The whole eastern tribal belt of
Madhya Pradesh, Odisha, Chhattisgarh and north-eastern states has better CSR levels. In
contrast, most of the western districts have less than 900 girls per thousand boys. In many
districts of India, there are less than 800 girls per thousand boys in the 0-6 year age group.
The north-eastern districts are better than western districts in terms of CSR. In Haryana, most
of the districts have less than 800 girls per thousand boys in the 0-6 year age group.
Map 1: District Pattern of Child Sex Ratio in India, 2015-16
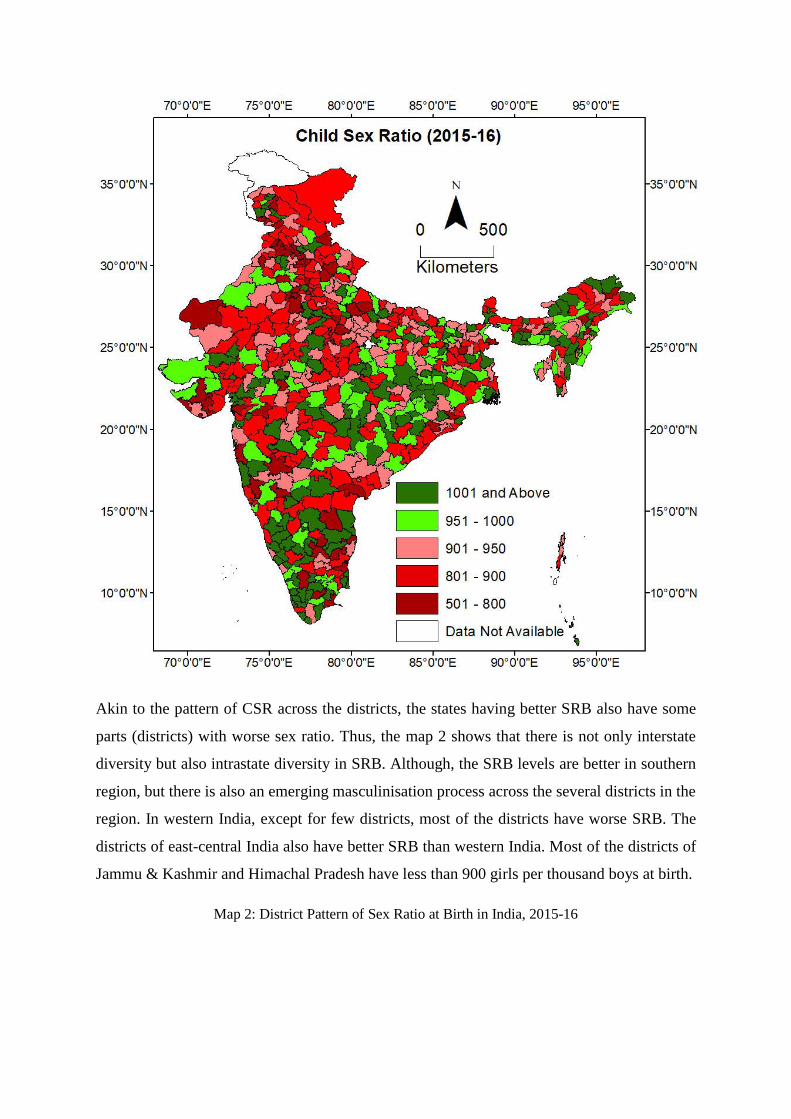
Akin to the pattern of CSR across the districts, the states having better SRB also have some
parts (districts) with worse sex ratio. Thus, the map 2 shows that there is not only interstate
diversity but also intrastate diversity in SRB. Although, the SRB levels are better in southern
region, but there is also an emerging masculinisation process across the several districts in the
region. In western India, except for few districts, most of the districts have worse SRB. The
districts of east-central India also have better SRB than western India. Most of the districts of
Jammu & Kashmir and Himachal Pradesh have less than 900 girls per thousand boys at birth.
Map 2: District Pattern of Sex Ratio at Birth in India, 2015-16
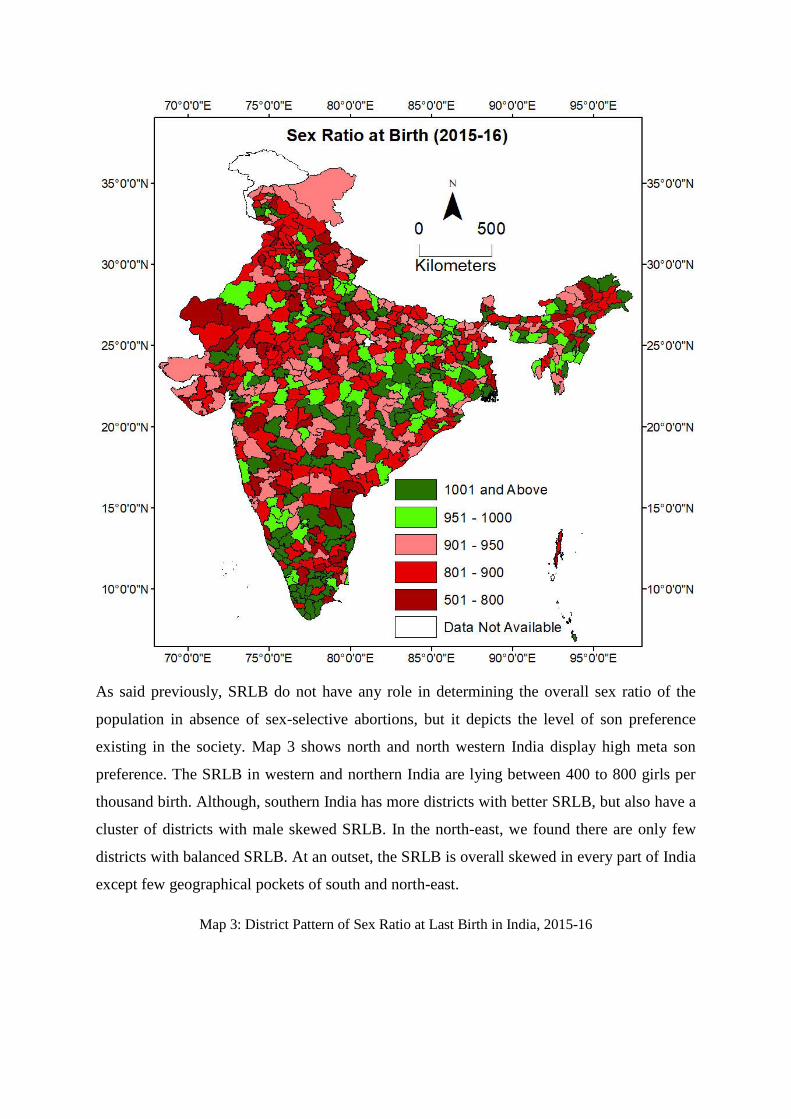
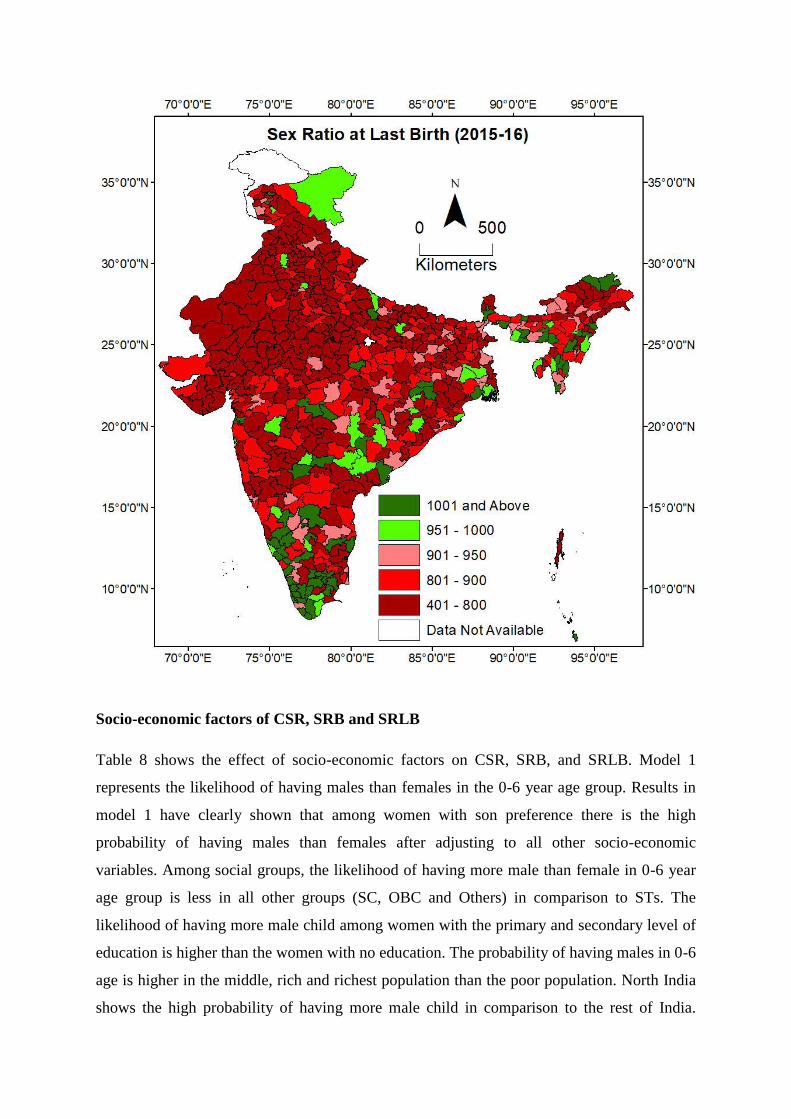
As said previously, SRLB do not have any role in determining the overall sex ratio of the
population in absence of sex-selective abortions, but it depicts the level of son preference
existing in the society. Map 3 shows north and north western India display high meta son
preference. The SRLB in western and northern India are lying between 400 to 800 girls per
thousand birth. Although, southern India has more districts with better SRLB, but also have a
cluster of districts with male skewed SRLB. In the north-east, we found there are only few
districts with balanced SRLB. At an outset, the SRLB is overall skewed in every part of India
except few geographical pockets of south and north-east.
Map 3: District Pattern of Sex Ratio at Last Birth in India, 2015-16
Socio-economic factors of CSR, SRB and SRLB
Table 8 shows the effect of socio-economic factors on CSR, SRB, and SRLB. Model 1
represents the likelihood of having males than females in the 0-6 year age group. Results in
model 1 have clearly shown that among women with son preference there is the high
probability of having males than females after adjusting to all other socio-economic
variables. Among social groups, the likelihood of having more male than female in 0-6 year
age group is less in all other groups (SC, OBC and Others) in comparison to STs. The
likelihood of having more male child among women with the primary and secondary level of
education is higher than the women with no education. The probability of having males in 0-6
age is higher in the middle, rich and richest population than the poor population. North India
shows the high probability of having more male child in comparison to the rest of India.
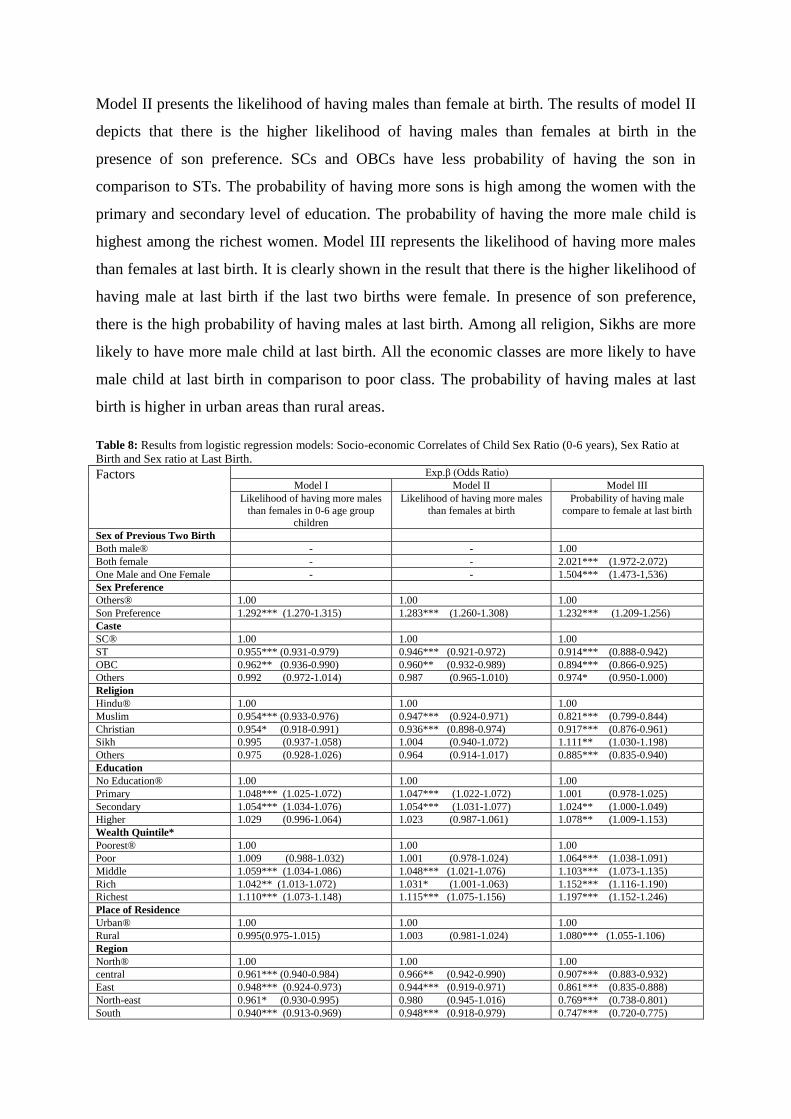
Model II presents the likelihood of having males than female at birth. The results of model II
depicts that there is the higher likelihood of having males than females at birth in the
presence of son preference. SCs and OBCs have less probability of having the son in
comparison to STs. The probability of having more sons is high among the women with the
primary and secondary level of education. The probability of having the more male child is
highest among the richest women. Model III represents the likelihood of having more males
than females at last birth. It is clearly shown in the result that there is the higher likelihood of
having male at last birth if the last two births were female. In presence of son preference,
there is the high probability of having males at last birth. Among all religion, Sikhs are more
likely to have more male child at last birth. All the economic classes are more likely to have
male child at last birth in comparison to poor class. The probability of having males at last
birth is higher in urban areas than rural areas.
Table 8: Results from logistic regression models: Socio-economic Correlates of Child Sex Ratio (0-6 years), Sex Ratio at
Birth and Sex ratio at Last Birth.
Factors Exp.β (Odds Ratio)
Model I Model II Model III
Likelihood of having more males
than females in 0-6 age group children
Likelihood of having more males
than females at birth
Probability of having male
compare to female at last birth
Sex of Previous Two Birth
Both male® - - 1.00
Both female - - 2.021*** (1.972-2.072)
One Male and One Female - - 1.504*** (1.473-1,536)
Sex Preference
Others® 1.00 1.00 1.00
Son Preference 1.292*** (1.270-1.315) 1.283*** (1.260-1.308) 1.232*** (1.209-1.256)
Caste
SC® 1.00 1.00 1.00
ST 0.955*** (0.931-0.979) 0.946*** (0.921-0.972) 0.914*** (0.888-0.942)
OBC 0.962** (0.936-0.990) 0.960** (0.932-0.989) 0.894*** (0.866-0.925)
Others 0.992 (0.972-1.014) 0.987 (0.965-1.010) 0.974* (0.950-1.000)
Religion
Hindu® 1.00 1.00 1.00
Muslim 0.954*** (0.933-0.976) 0.947*** (0.924-0.971) 0.821*** (0.799-0.844)
Christian 0.954* (0.918-0.991) 0.936*** (0.898-0.974) 0.917*** (0.876-0.961)
Sikh 0.995 (0.937-1.058) 1.004 (0.940-1.072) 1.111** (1.030-1.198)
Others 0.975 (0.928-1.026) 0.964 (0.914-1.017) 0.885*** (0.835-0.940)
Education
No Education® 1.00 1.00 1.00
Primary 1.048*** (1.025-1.072) 1.047*** (1.022-1.072) 1.001 (0.978-1.025)
Secondary 1.054*** (1.034-1.076) 1.054*** (1.031-1.077) 1.024** (1.000-1.049)
Higher 1.029 (0.996-1.064) 1.023 (0.987-1.061) 1.078** (1.009-1.153)
Wealth Quintile*
Poorest® 1.00 1.00 1.00
Poor 1.009 (0.988-1.032) 1.001 (0.978-1.024) 1.064*** (1.038-1.091)
Middle 1.059*** (1.034-1.086) 1.048*** (1.021-1.076) 1.103*** (1.073-1.135)
Rich 1.042** (1.013-1.072) 1.031* (1.001-1.063) 1.152*** (1.116-1.190)
Richest 1.110*** (1.073-1.148) 1.115*** (1.075-1.156) 1.197*** (1.152-1.246)
Place of Residence
Urban® 1.00 1.00 1.00
Rural 0.995(0.975-1.015) 1.003 (0.981-1.024) 1.080*** (1.055-1.106)
Region
North® 1.00 1.00 1.00
central 0.961*** (0.940-0.984) 0.966** (0.942-0.990) 0.907*** (0.883-0.932)
East 0.948*** (0.924-0.973) 0.944*** (0.919-0.971) 0.861*** (0.835-0.888)
North-east 0.961* (0.930-0.995) 0.980 (0.945-1.016) 0.769*** (0.738-0.801)
South 0.940*** (0.913-0.969) 0.948*** (0.918-0.979) 0.747*** (0.720-0.775)
West 0.978 (0.947-1.012) 0.984 (0.949-1.019) 1.014 (0.976-1.056)
Constant 1.019 (0.982-1.059) 1.029 (0.989-1.072) 0.960 (0.916-1.006)
® - Reference category; Level of significance: * p < 0.05; ** p < 0.01; *** p < 0.001.
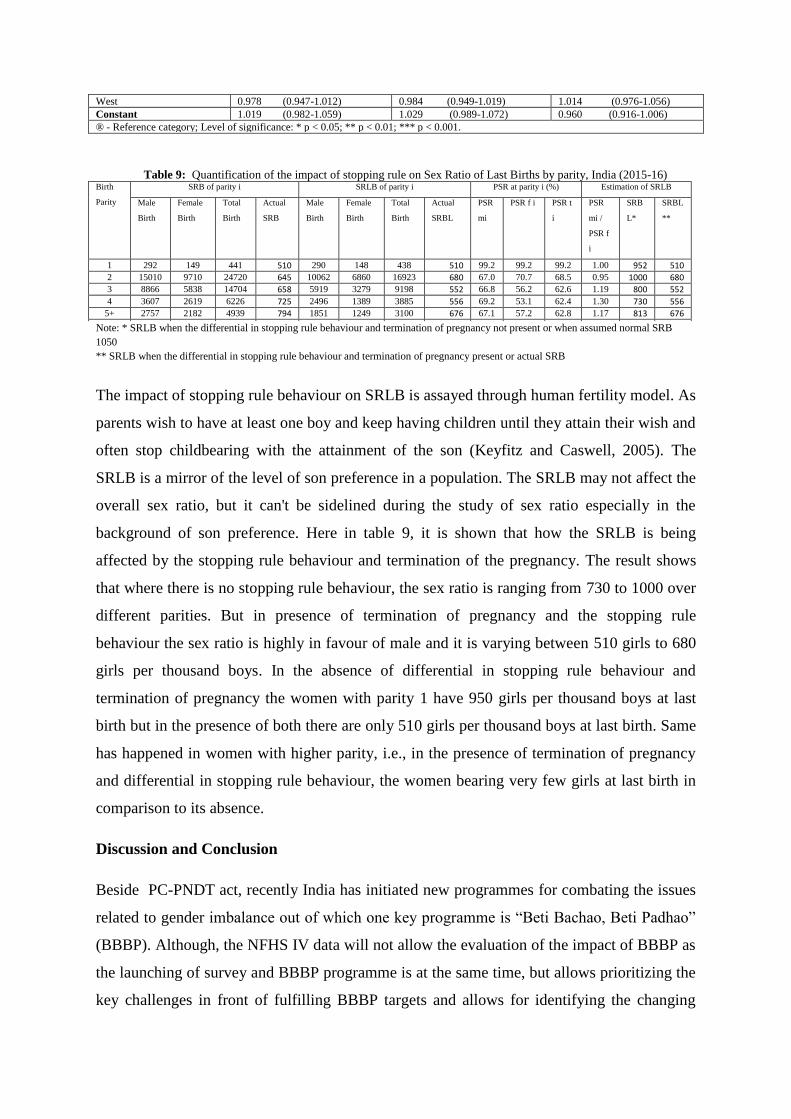
Table 9: Quantification of the impact of stopping rule on Sex Ratio of Last Births by parity, India (2015-16) Birth
Parity
SRB of parity i SRLB of parity i PSR at parity i (%) Estimation of SRLB
Male
Birth
Female
Birth
Total
Birth
Actual
SRB
Male
Birth
Female
Birth
Total
Birth
Actual
SRBL
PSR
mi
PSR f i PSR t
i
PSR
mi /
PSR f
i
SRB
L*
SRBL
**
1 292 149 441 510 290 148 438 510 99.2 99.2 99.2 1.00 952 510
2 15010 9710 24720 645 10062 6860 16923 680 67.0 70.7 68.5 0.95 1000 680
3 8866 5838 14704 658 5919 3279 9198 552 66.8 56.2 62.6 1.19 800 552
4 3607 2619 6226 725 2496 1389 3885 556 69.2 53.1 62.4 1.30 730 556
5+ 2757 2182 4939 794 1851 1249 3100 676 67.1 57.2 62.8 1.17 813 676 Note: * SRLB when the differential in stopping rule behaviour and termination of pregnancy not present or when assumed normal SRB
1050
** SRLB when the differential in stopping rule behaviour and termination of pregnancy present or actual SRB
The impact of stopping rule behaviour on SRLB is assayed through human fertility model. As
parents wish to have at least one boy and keep having children until they attain their wish and
often stop childbearing with the attainment of the son (Keyfitz and Caswell, 2005). The
SRLB is a mirror of the level of son preference in a population. The SRLB may not affect the
overall sex ratio, but it can't be sidelined during the study of sex ratio especially in the
background of son preference. Here in table 9, it is shown that how the SRLB is being
affected by the stopping rule behaviour and termination of the pregnancy. The result shows
that where there is no stopping rule behaviour, the sex ratio is ranging from 730 to 1000 over
different parities. But in presence of termination of pregnancy and the stopping rule
behaviour the sex ratio is highly in favour of male and it is varying between 510 girls to 680
girls per thousand boys. In the absence of differential in stopping rule behaviour and
termination of pregnancy the women with parity 1 have 950 girls per thousand boys at last
birth but in the presence of both there are only 510 girls per thousand boys at last birth. Same
has happened in women with higher parity, i.e., in the presence of termination of pregnancy
and differential in stopping rule behaviour, the women bearing very few girls at last birth in
comparison to its absence.
Discussion and Conclusion
Beside PC-PNDT act, recently India has initiated new programmes for combating the issues
related to gender imbalance out of which one key programme is “Beti Bachao, Beti Padhao”
(BBBP). Although, the NFHS IV data will not allow the evaluation of the impact of BBBP as
the launching of survey and BBBP programme is at the same time, but allows prioritizing the
key challenges in front of fulfilling BBBP targets and allows for identifying the changing
“hot spots” of the problem by analyzing the trends and patterns of the sex ratio imbalance and
key factors associated with it. This study based on 2015-16 data is showing the most recent
trends of masculinisation of the population by estimating the SRB, CSR, and SRLB. Given
that NFHS IV factsheets wrongly representing the trends in SRB and CSR, the study for the
first time present the correct estimates of SRB and CSR since the release of NFHS IV
factsheets and the data. A high correlation between the NFHS and SRS based estimates
intersperse faith in our estimates.
The estimation from all the rounds of NFHS data shows that there is a declining trend in
CSR, SRB, and SRLB against what has been reported in the factsheets of NFHS. A more
surprising fact is in spite of decline in son preference almost by half, the masculinisation of
the population at early ages continues. Over the period, except slight improvement of CSR in
SCs and SRB in STs, in general CSR, SRB, and SRLB worsened across all the social groups.
Masculinisation continues across the population in all the religious groups, educational level,
and wealth quintiles. In spite of a slight improvement in SRB and SRLB among all the
religious groups, Sikhs stands at the bottom in all three indicators CSR, SRB, and SRLB. The
decline is significant among females with higher education, rich wealth quintile and urban
residents than their counterparts. Meta son preference is a significant factor for highly
skewed SRLB. Sex of the previous births is also a critical determinant of the sex of the
subsequent child. Although, states from the north and north-west India continue to show a
greater masculinization of the child population, the district level assessment shows
assimilation of the culture of elimination of girl child in several districts of east and south
India. Therefore, the previous notion of “rice” and “wheat” belt divide or “north-west” and
“south-east” divide in sex ratio imbalance (Miller, 1981; Dyson and Moore, 1983) can’t be
strictly valid now as the intra-regional variation are a new emerging pattern in all three
indicators of sex ratios. The culture of elimination of girl child is spreading to southern,
eastern and remote areas of central India with development of increasing communication and
technological access.
In a policy perspective, we put forward that the act like PC-PNDT and recent initiatives such
as BBBP and other conditional cash transfers which are mainly targeting the legal
surveillance of births, behaviour and attitude changes and state-specific conditional cash
transfers which needs to be strictly evaluated for their impact. We especially recommend not
to target only below poverty line families or marginalized communities in these programmes
because the problem of skewed CSR is in the wealthiest, urban and educated families as well.
We have also doubt, how much the awareness programmes mostly driven by advertisements
work as the problem lies with most educated, wealthiest and urban communities who are well
aware of the legal consequences of the elimination of the girl child. The state-specific trends
suggest that a strict implementation and monitoring of PC-PNDT act is having some impact
regarding improving the scenario of the sex ratio in highly focused states like Punjab,
Haryana, and Rajasthan where the problem continues to be severe. The problem of sex ratio
imbalance roots in patriarchy and overvaluing the sons over daughters. One-side we are
promoting girl child education through the programme like BBBP, but on the other side, we
are reducing spending on public education and health programmes (Ministry of Finance,
2018). The catastrophic expenditures in education, health and marriages are key factors
which are more affecting the girls than boys and undermine the value of daughters in the
society. By providing good education, better health care and employment opportunities which
will improve the value of daughters and parents trust on daughters for old age security. The
continuous religious divide in the sex ratio imbalance shows that interventions in religious
culture and norms are must for improving the value of daughters in the society. There is must
be a change in the norm of "raising daughters is like a watering neighbour’s garden”. As long
as patrilineal and patrilocal societies continue, the parent’s insecurity of lineage and old age
social security continues which will keep on undermining the value of daughters. Unless, we
raise the value of daughter in the Indian society and its culture, the problem can’t be
eliminated through legal measures or advertisements.
References:
Agnihotri, S B (2000). Sex Ratio Patterns in the Indian Population: A Fresh Exploration (New Delhi: Sage).
Agnihotri, S. (1996). Juvenile sex ratios in India: a disaggregated analysis. Economic and Political Weekly,
3369-3382.
Agnihotri, S. B. (2003). Survival of the Girl Child: Tunnelling Out of the Chakravyuha. Economic and Political
Weekly, 4351-4360.2
Arnold, F., Kishor, S., & Roy, T. K. (2002). Sex‐selective abortions in India. Population and development
review, 28(4), 759-785.
Arokiasamy, P (2004). Regional Patterns of Sex Bias and Excess Female Child Mortality in India. Population,
Vol 59, No 6, pp 833-63.
Arokiasamy, P and S Goli (2012). Provisional Results of the 2011 Census of India: Slowdown in Growth,
Ascent in Literacy, But More Missing Girls. International Journal of Social Economics, Vol 39, No 10.
Available on file:///C:/Users/hp/Downloads/India%20Sex%20Selective%20Abortion%20FINAL.pdf
Bhat, P. M. (2002). On the Trail of'Missing'Indian Females: II: Illusion and Reality. Economic and political
weekly, 5244-5263.
Bhat, P. M., & Zavier, A. F. (2007). Factors influencing the use of prenatal diagnostic techniques and the sex
ratio at birth in India. Economic and Political Weekly, 2292-2303.
Bongaarts, J., & Guilmoto, C. Z. (2015). How Many More Missing Women? Excess Female Mortality and
Prenatal Sex Selection, 1970–2050. Population and Development Review, 41(2), 241-269.
Cai, Y., & Lavely, W. (2007). CSRs and their Regional Variation. In Transition and challenge: China's
population at the beginning of the 21st century. Oxford University Press.
Campbell, R. B. (2001). John Graunt, John Arbuthnott, and the Human Sex Ratio. Human Biology, 605-610.
Chahnazarian, A. (1990). Historical Trends in the Sex Ratio at Birth. John Hopkins Population Center
Das Gupta, M (1987): Selective Discrimination against Female Child in Rural Punjab. Population and
Development Review, Vol 13, No 1, pp 77-100.
Dyson, T and M Moore (1983): On Kinship Structure, Female Autonomy, Demographic Behavior. Population
and Development Review, Vol 9, pp 35-60.
Economic SRUVEY OF India 2018, Government of India, available at
http://mofapp.nic.in:8080/economicsurvey/
George, S. M. (2006). Millions of Missing Girls: From Fetal Sexing to High Technology Sex Selection in India.
Prenatal diagnosis, 26(7), 604-609.
Graunt, J. 1662. Natural and Political Observation made upon the Bills of Mortality. In Earliest Classics, Gregg
International Publishers Limited, 1973
Guilmoto, C. Z., & Depledge, R. (2008). Economic, Social and Spatial Dimensions of India's Excess Child
Masculinity. Population, 63(1), 91-117.
Gupta, M. D., Chung, W., & Shuzhuo, L. (2009). Evidence for an Incipient Decline in Numbers of Missing
Girls in China and India. Population and Development Review, 35(2), 401-416.
India, Registrar General, 1963. Census of India 1961, Part II-C (i) Social and Cultural Tables (C VI, pp 412-
477) Delhi: Controller of Publications.
India, Registrar General, 1976. Census of India 1971, Series 1 India, Part II-C(ii) Social and Cultural Tables (C
IV, pp 135-196). New Delhi: Controller of Publications.
India, Registrar General, 1987. Census of India 1981, Series 1 India, Part IV A- Social and Cultural Tables
(Tables C5, pp 530-686). New Delhi: Controller of Publications.
India, Registrar General, 2015. Sample Registration System Statistical Report 2015. Delhi: Controller of
Publications.
International Institute for Population Sciences and Macro International (1994, 1999, 2007 And 2017): National
Family Health Survey (NFHS-1 NFHS-2 NFHS-3 and NFHS-4) 2005-06 India (Mumbai: International Institute
for Population Sciences).
Jha, P., Kesler, M. A., Kumar, R., Ram, F., Ram, U., Aleksandrowicz, L., & Banthia, J. K. (2011). Trends in
Selective Abortions of Girls in India: Analysis of Nationally Representative Birth Histories from 1990 to 2005
and Census Data from 1991 to 2011. The Lancet, 377(9781), 1921-1928.
John, M. E., Kaur, R., Palriwala, R., Raju, S., & Sagar, A. (2008). Planning Families, Planning Gender: The
Adverse CSR in Selected Districts of Madhya Pradesh, Rajasthan, Himachal Pradesh, Haryana and Punjab.
ActionAid, New Delhi, IN.
Keyfitz, N. (1977). Introduction to the mathematics of population: with revisions. Addison-Wesley Series in
Behavioural Science: Quantitative Methods.
Keyfitz, N., & Caswell, H. (2005). Applied mathematical demography (Vol. 47). New York: Springer.
Kishor, S (1993). May God Give Sons to All: Gender Differences in Child Mortality in India? American
Sociological Review, Vol 58, pp 247 -65.
Kulkarni, P. M. (2007). Estimation of missing girls at birth and juvenile ages in India. Paper commissioned by
the United Nations Population Fund, UNFP.
Kumar, S., & Sathyanarayana, K. M. (2012). District-level Estimates of Fertility and Implied SRB in
India. Economic and Political Weekly, 66-72.
Kundu, A., & Sahu, M. K. (1991). Variation in Sex Ratio: Development Implications. Economic and Political
Weekly, 2341-2342.
Malhotra, S., & Kant, S. (2006). Adverse Female-to-male Sex Ratio at Birth in India: A Cause for Concern. The
National Medical Journal of India, 19(3), 152.
Mealey, L., & Mackey, W. (1990). Variation in Offspring Sex Ratio in Women of Differing Social
Status. Evolution and Human Behaviour, 11(2), 83-95.
Miller, B. D. (1981) The Endangered Sex: Neglect of Female Children in Rural North India. Ithaca, NY: Cornell
University Press
Myers, C. (2012). Sex Selective Abortion in India. Global Tides, 6(1), 3.
Nair, P. M. (1996). Imbalance of Sex Ratio of Children in India. Demography India, 25(2), 177-87.
Planning commission of India, 2015
(http://planningcommission.nic.in/data/datatable/data_2312/DatabookDec2014%20215.pdf)
Premi, M K. (2001). The Missing Girl Child. Economic and Political Weekly, 36: 1875-80.
Radkar, A. (2018). Is Son Preference Weakening?. Economic & Political Weekly, 53(12), 101.
Rajan S. Irudaya, Mishra, U.S., and Navaneetham K. (1991). Decline in Sex Ratio: An Alternative Explanation
Revisited. Economic and Political Weekly, 26: 2963-64.
Raju, Saraswati and Premi M.K. (1992). Decline in Sex Ratio: Alternative Explanation Re-examined. Economic
and Political Weekly, 27: 911-12
Ramachandran, K. V., & Deshpande, V. A. (1964). The Sex Ratio at Birth in India by Regions. The Milbank
Memorial Fund Quarterly, 42(2), 84-94.
Retherford, R. D., & Choe, M. K. (2011). Statistical Models for Causal Analysis. John Wiley & Sons.
Sahni, M., Verma, N., Narula, D., Varghese, R. M., Sreenivas, V., & Puliyel, J. M. (2008). Missing Girls in
India: Infanticide, Feticide and Made-to-Order Pregnancies? Insights from Hospital-Based Sex-Ratio-at-Birth
Over the Last Century. PloS one, 3(5), e2224.
Sen, A. (1990). More Than 100 Million Women Are Missing. New York Review of Books, Vol 37, No 20, pp 61-
66.
Sen, A. (2003). Missing Women Revisited: Reduction in Female Mortality has been Counter Balanced by Sex
Selective Abortions. BMJ: British Medical Journal, 327(7427), 1297.
Stallard, R. (2016). Sex-Selective Abortion in India. Child Reach International, United Kingdom.
Union Budget of India, Ministry of Finance available on https://www.finmin.nic.in/#
Visaria, L. (2005). Female Deficit in India: Role of Prevention of Sex Selective Abortion Act. In CEPED-
CICREDINED Seminar on Female Deficit in Asia: T rends and Perspectives, Singapore (pp. 5-7).
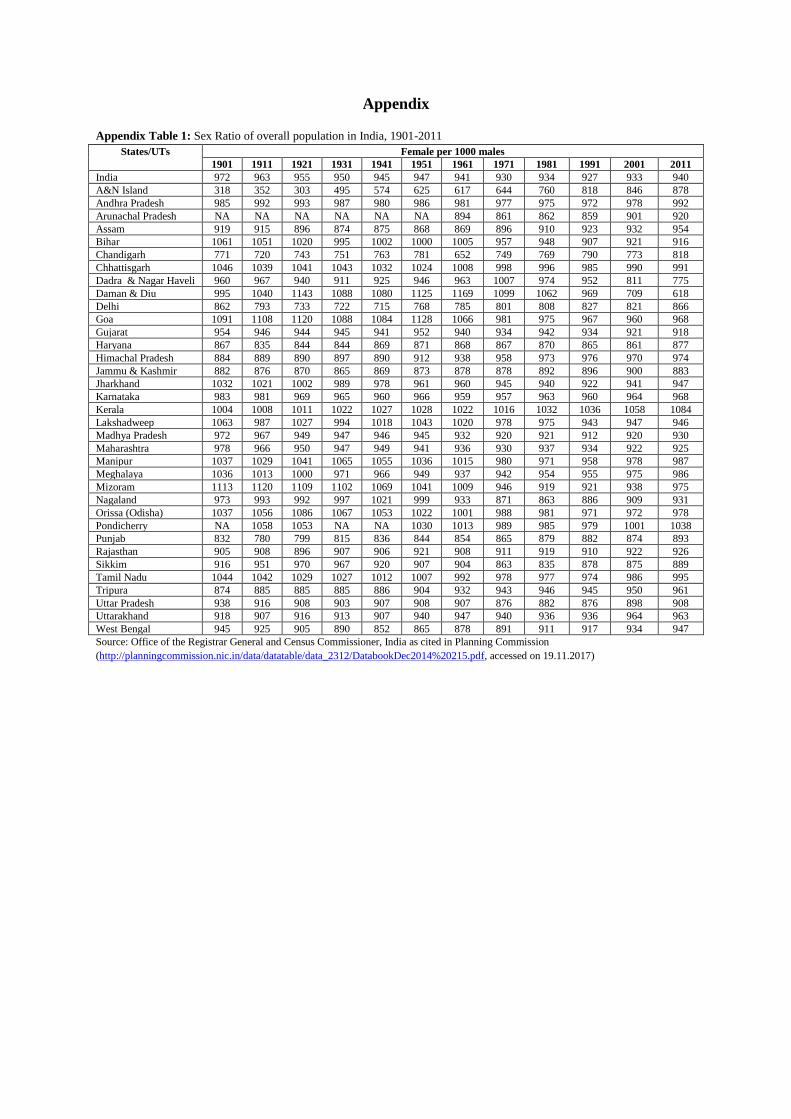
Appendix
Appendix Table 1: Sex Ratio of overall population in India, 1901-2011
States/UTs Female per 1000 males
1901 1911 1921 1931 1941 1951 1961 1971 1981 1991 2001 2011
India 972 963 955 950 945 947 941 930 934 927 933 940
A&N Island 318 352 303 495 574 625 617 644 760 818 846 878
Andhra Pradesh 985 992 993 987 980 986 981 977 975 972 978 992
Arunachal Pradesh NA NA NA NA NA NA 894 861 862 859 901 920
Assam 919 915 896 874 875 868 869 896 910 923 932 954
Bihar 1061 1051 1020 995 1002 1000 1005 957 948 907 921 916
Chandigarh 771 720 743 751 763 781 652 749 769 790 773 818
Chhattisgarh 1046 1039 1041 1043 1032 1024 1008 998 996 985 990 991
Dadra & Nagar Haveli 960 967 940 911 925 946 963 1007 974 952 811 775
Daman & Diu 995 1040 1143 1088 1080 1125 1169 1099 1062 969 709 618
Delhi 862 793 733 722 715 768 785 801 808 827 821 866
Goa 1091 1108 1120 1088 1084 1128 1066 981 975 967 960 968
Gujarat 954 946 944 945 941 952 940 934 942 934 921 918
Haryana 867 835 844 844 869 871 868 867 870 865 861 877
Himachal Pradesh 884 889 890 897 890 912 938 958 973 976 970 974
Jammu & Kashmir 882 876 870 865 869 873 878 878 892 896 900 883
Jharkhand 1032 1021 1002 989 978 961 960 945 940 922 941 947
Karnataka 983 981 969 965 960 966 959 957 963 960 964 968
Kerala 1004 1008 1011 1022 1027 1028 1022 1016 1032 1036 1058 1084
Lakshadweep 1063 987 1027 994 1018 1043 1020 978 975 943 947 946
Madhya Pradesh 972 967 949 947 946 945 932 920 921 912 920 930
Maharashtra 978 966 950 947 949 941 936 930 937 934 922 925
Manipur 1037 1029 1041 1065 1055 1036 1015 980 971 958 978 987
Meghalaya 1036 1013 1000 971 966 949 937 942 954 955 975 986
Mizoram 1113 1120 1109 1102 1069 1041 1009 946 919 921 938 975
Nagaland 973 993 992 997 1021 999 933 871 863 886 909 931
Orissa (Odisha) 1037 1056 1086 1067 1053 1022 1001 988 981 971 972 978
Pondicherry NA 1058 1053 NA NA 1030 1013 989 985 979 1001 1038
Punjab 832 780 799 815 836 844 854 865 879 882 874 893
Rajasthan 905 908 896 907 906 921 908 911 919 910 922 926
Sikkim 916 951 970 967 920 907 904 863 835 878 875 889
Tamil Nadu 1044 1042 1029 1027 1012 1007 992 978 977 974 986 995
Tripura 874 885 885 885 886 904 932 943 946 945 950 961
Uttar Pradesh 938 916 908 903 907 908 907 876 882 876 898 908
Uttarakhand 918 907 916 913 907 940 947 940 936 936 964 963
West Bengal 945 925 905 890 852 865 878 891 911 917 934 947
Source: Office of the Registrar General and Census Commissioner, India as cited in Planning Commission
(http://planningcommission.nic.in/data/datatable/data_2312/DatabookDec2014%20215.pdf, accessed on 19.11.2017)
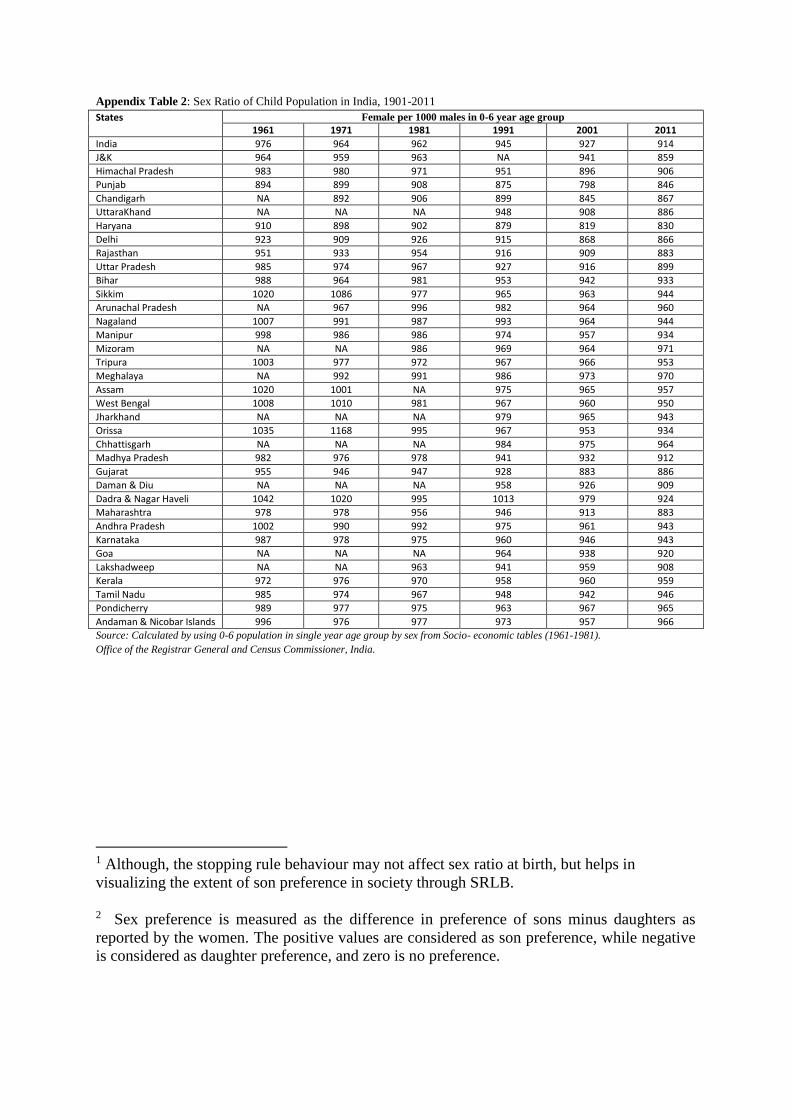
Appendix Table 2: Sex Ratio of Child Population in India, 1901-2011
States Female per 1000 males in 0-6 year age group 1961 1971 1981 1991 2001 2011
India 976 964 962 945 927 914
J&K 964 959 963 NA 941 859
Himachal Pradesh 983 980 971 951 896 906
Punjab 894 899 908 875 798 846
Chandigarh NA 892 906 899 845 867
UttaraKhand NA NA NA 948 908 886
Haryana 910 898 902 879 819 830
Delhi 923 909 926 915 868 866
Rajasthan 951 933 954 916 909 883
Uttar Pradesh 985 974 967 927 916 899
Bihar 988 964 981 953 942 933
Sikkim 1020 1086 977 965 963 944
Arunachal Pradesh NA 967 996 982 964 960
Nagaland 1007 991 987 993 964 944
Manipur 998 986 986 974 957 934
Mizoram NA NA 986 969 964 971
Tripura 1003 977 972 967 966 953
Meghalaya NA 992 991 986 973 970
Assam 1020 1001 NA 975 965 957
West Bengal 1008 1010 981 967 960 950
Jharkhand NA NA NA 979 965 943
Orissa 1035 1168 995 967 953 934
Chhattisgarh NA NA NA 984 975 964
Madhya Pradesh 982 976 978 941 932 912
Gujarat 955 946 947 928 883 886
Daman & Diu NA NA NA 958 926 909
Dadra & Nagar Haveli 1042 1020 995 1013 979 924
Maharashtra 978 978 956 946 913 883
Andhra Pradesh 1002 990 992 975 961 943
Karnataka 987 978 975 960 946 943
Goa NA NA NA 964 938 920
Lakshadweep NA NA 963 941 959 908
Kerala 972 976 970 958 960 959
Tamil Nadu 985 974 967 948 942 946
Pondicherry 989 977 975 963 967 965
Andaman & Nicobar Islands 996 976 977 973 957 966
Source: Calculated by using 0-6 population in single year age group by sex from Socio- economic tables (1961-1981).
Office of the Registrar General and Census Commissioner, India.
1 Although, the stopping rule behaviour may not affect sex ratio at birth, but helps in
visualizing the extent of son preference in society through SRLB.
2 Sex preference is measured as the difference in preference of sons minus daughters as
reported by the women. The positive values are considered as son preference, while negative
is considered as daughter preference, and zero is no preference.