synopsys incorporated (snps) april 11, 2016 · while the working capital ratios are skewed by the...
TRANSCRIPT

Important disclosures appear on the last page of this report.
The Henry Fund
Henry B. Tippie School of Management
Ajay Kaushik Rajagopalan [[email protected]]
Synopsys Incorporated (SNPS) April 11, 2016
Information Technology – Electronic Design and Automation Stock Rating Buy
Investment Thesis Target Price $51-58 Synopsys Inc., since its inception in 1986, has established itself as the leader in electronic design and automation (EDA). It has supplemented its EDA software products with intellectual property (IP) offerings and software integrity solutions. The current product portfolio of Synopsys has positioned it well to leverage the demand that will be generated due to the 6-9% sales growth that the end market segments of semiconductor industry is expected to witness in the next 5 years. (3) A positive earnings outlook and the fact that the current stock price is trading at 14.8% discount to its intrinsic value are the drivers for the buy recommendation suggested by this report. Drivers of Thesis
An increase in the popularity of wearables technologies as well as Internet of Things (IOT) will provide a fillip to revenue growth of Synopsys. The IoT market is expected to grow from $500 billion in 2015 to over $1.5 trillion in 2019.(23)
The market for big data is expected to grow at 10% CAGR to reach $85 billion by 2026. (22).
The $20 billion outlay as part of the cybersecurity national action plan, the outlook for IoT, big data, and other electronics devices are expected to drive the 7.07% revenue CAGR of Synopsys from 2015 to 2020. .
Risks to Thesis
Increased consolidation through M&A among its customers could pose significant pressure on the price that Synopsys can charge for its products.
Though patent infringement litigations are quite commonplace in the EDA industry, any adverse judgements against Synopsys can significantly impact the stock price.
Synopsys has made and is expected to make acquisitions going forward. Any significant future acquisition made by Synopsys that fails to bear results can significantly impact the enterprise value of Synopsys and hence the intrinsic worth of the stock.
Henry Fund DCF $55.37 Henry Fund DDM N/A Relative Multiple $38.55 Price Data Current Price $48.24 52wk Range $39.26 – 52.78 Consensus 1yr Target $54.88 Key Statistics Market Cap (B) $7.31 Shares Outstanding (M) $151.5 Institutional Ownership 95.0% Five Year Beta 1.00 Dividend Yield 0.0% Analyst Est. 5yr Growth 8.70% Price/Earnings (TTM) 34.21 Price/Earnings (FY1) 16.2 Price/Sales (TTM) 3.54 Price/Book (mrq) 2.47 Profitability Operating Margin 12.86% Profit Margin 10.12% Return on Assets (TTM) 4.60% Return on Equity (TTM) 7.30%
Earnings Estimates Year 2013 2014 2015 2016E 2017E 2018E
EPS $1.62 $1.67 $1.46 $1.70 $2.01 $2.24
growth 30.6% 3.1% -12.6% 16.5% 18.0% 11.6%
12 Month Performance Company Description
Synopsys Inc., established in 1986, is engaged in the provision of EDA software products, intellectual property, services, and software integrity products. These product offerings are used for electronic chip design and software integrity checks in the electronics, industrials, financial services, and energy industries. In addition to the software and hardware products, Synopsys also provides technical consulting services.
18.8
10.3
14.0
16.4
12.1 12.5
0
5
10
15
20
P/E ROE(%) EV/EBITDA
SNPS Sector
-30%
-20%
-10%
0%
10%
20%
30%
A M J J A S O N D J F M
SNPS S&P 500
Source: Yahoo Finance
Source: FactSet

Page 2
EXECUTIVE SUMMARY
Synopsys Inc. is ranked 27th among the global software companies by revenue. Incorporated in 1986, Synopsys has grown to become the leader in electronic design and automation (EDA) software and ranks second (after ARM) in the semiconductor IP market. Synopsys provides solutions for electronic chip and system design, software integrity checks, and technical consulting services to the electronics, industrials, financial services, and energy industries. (7, 16, 18)
Synopsys has focused on both organic and inorganic avenues for growth. R&D expenditure as a percentage of sales, an indicator of organic growth, has consistently remained above 34%. Synopsys has made over 15 acquisitions in past 4 years and this is an indicator of the inorganic growth avenues followed by Synopsys.(17) Some of these acquisitions have been strategic as they have helped Synopsys diversify its product offerings to include software integrity solutions.
The drivers of the Synopsys revenue growth are dependent on the outlook of the end market demand for electronic products that Synopsys helps design and manufacture. A study of the end market demand for these end user products suggest a 6-9% expected growth in sales from 2015 to 2020. This translates to a 7.1% 5-year CAGR for revenue during the same period for Synopsys. The DCF model, which factors in all assumptions for future growth and costs, indicates that the current price of the stock is undervalued in comparison to its intrinsic worth. The 14.8% upside suggested by the model on the current stock price (as of April 10th 2016) is the driver for the buy recommendation for Synopsys.
COMPANY DESCRIPTION
Synopsys Inc. is the leader in electric design and automation (EDA) software, intellectual property (IP), and semiconductor design and manufacturing services. Its EDA products include the Galaxy design platform that facilitates the design of integrated chips (ICs). The EDA product portfolio also boasts of a Verification platform that helps customers accelerate design verification and hence contribute to advancing the time-to-market of advanced System on Chips (SoCs). EDA solutions also include software to design Field Programmable Gate Arrays (FPGAs), a form of complex configurable integrated circuit.
With increasing complexity of ICs, the number of third party IPs is rapidly increasing. Synopsys ranks second in terms of market share in the IP core rankings. The number one spot in the IP market is held by ARM Holdings. In the low power processor segments, Synopsys ARC processors are the second most popular processor after the ARM processor by units sold. (16, 18)
As 28% of Synopsys’ business is dependent on its IP portfolio and superiority of its technology, it is paramount to study the patent portfolio held by Synopsys. As of its last 10K filing, Synopsys held 2100 patents with expiration dates through 2033. These patents are also a driver of the various patent litigation suits that Synopsys has filed over other EDA vendors. The patent litigations have been covered separately under recent developments section of this report. (1, 17)
Synopsys entered the software quality and security market with the acquisition of Coverity in February 2014 for $375 million. (9) The software integrity platform includes testing tools that help software engineers reduce risk of errors and catch security defects in code before it is released. Synopsys has further expanded its software quality and security offerings through further acquisitions. The M&A deals of Synopsys have been discussed in detail under the recent developments section of this report.
Revenue Decomposition
Source: 10K
Technology subscription licenses (TSLs) are time based licenses for a limited term and provide the customer with the right to receive not only the current software
79.9%
8.8%
11.3%
FY 15 Revenue Breakdown by Categories
Time Based Licenses Upfront Licenses
Maintenance & Service
Page 3
technology, but also the right to receive certain future unspecified technology. The post-sales maintenance and service contracts are bundled into the license contract and are not charged for separately. Any technology that Synopsys develops can be licensed as a TSL and hence this categorization is more sales and marketing driven than by any factor that can be associated to the end market demand drivers. While the terms of the TSL contract differ from customer to customer, the average life of a TSL across customers is 3 years.
Term licenses and perpetual licenses constitute the upfront licenses revenue stream of Synopsys. Term licenses are also limited term licenses but without the flexibility to receive any future unspecified technology. Even the maintenance fees are dissociated from the license contract terms and need to be renewed by the customers periodically. Perpetual licenses continue as long the customer renews the maintenance contract plus an additional 20 years. Perpetual licenses also do not provide the customer the flexibility to receive any future unspecified technology. (1)
Since the type of the licensing agreement is dependent on factors not directly attributable to the end market demand drivers of the semiconductor products that the Synopsys technologies power , the model does not attempt to forecast the license agreement composition going forward. Instead, the model assumes a breakup similar to the historical breakup. This is no way an indication of the future events, but instead an assumption made to derive the revenue forecasts on factors attributable to the end market demand drivers.
The maintenance and services revenue as the name suggests is the revenue attributable to the professional services, training, and the maintenance provided for the Synopsys products. The major factor that drives the maintenance revenue is the sale of Synopsys products and hence the end market demand for Synopsys products. After studying the demand drivers of Synopsys products, the 5-year CAGR for maintenance and service revenue has been modelled as being equal to the overall revenue growth rate of 7.1%. The demand drivers for each of the Synopsys products will be discussed in detail later in this report.
The breakdown of revenue by product categorization has been shown below and each of these categories will be discussed in the subsequent sections of this report.
Source: 10K
Deferred Revenue
An important implication of the TSLs is the increase in the liabilities carried on the balance sheet. This has to do with the way revenue is recognized under the TSL contracts. Revenue from TSLs are recognized through the life of the contract term and these contracts are on an average 3 years long. With TSLs contributing to nearly 80% of the $2.24 billion revenue, nearly 53% of the total TSL revenue is recorded as deferred revenues. This results in skewing the working capital ratios and makes it hard to compare them across industries.
While the working capital ratios are skewed by the excess weight of the deferred revenues, these deferred revenues do help in smoothening the future earnings as the revenue in any fiscal quarter derives to a great extent (nearly 80%) from the TSL orders delivered in the previous quarters. This makes the revenue forecast for Synopsys more predictable than most other firms.
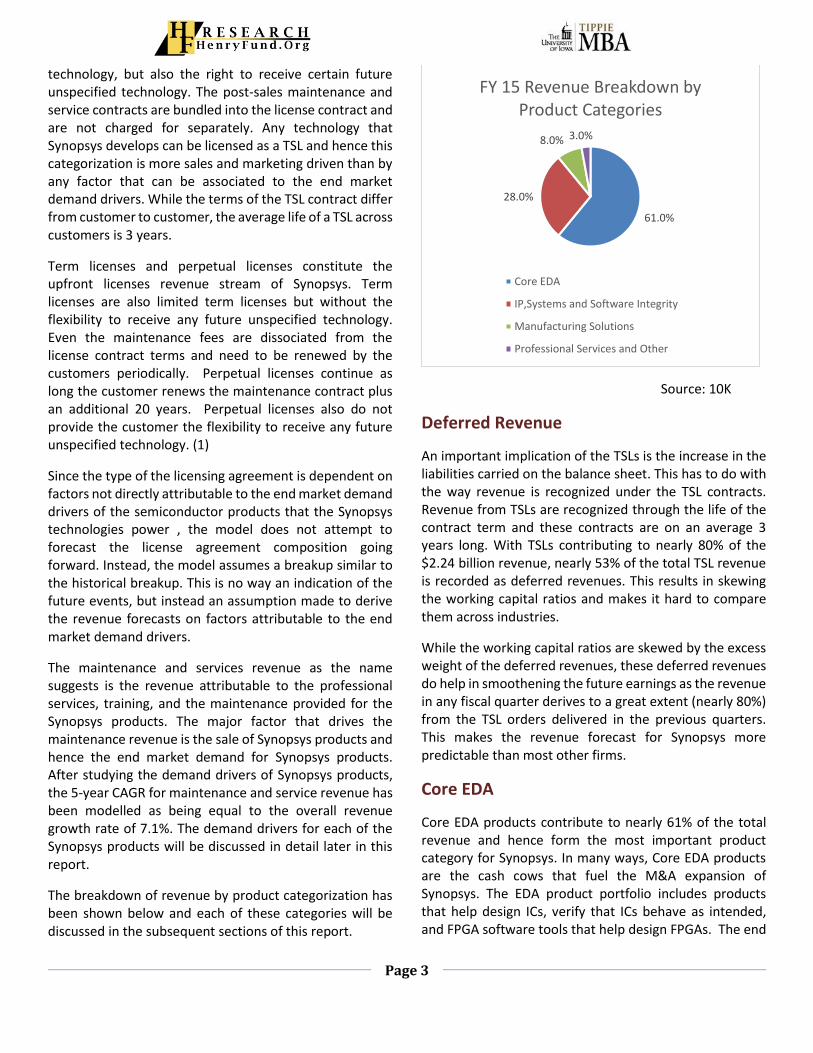
Core EDA
Core EDA products contribute to nearly 61% of the total revenue and hence form the most important product category for Synopsys. In many ways, Core EDA products are the cash cows that fuel the M&A expansion of Synopsys. The EDA product portfolio includes products that help design ICs, verify that ICs behave as intended, and FPGA software tools that help design FPGAs. The end
61.0%
28.0%
8.0% 3.0%
FY 15 Revenue Breakdown by Product Categories
Core EDA
IP,Systems and Software Integrity
Manufacturing Solutions
Professional Services and Other
Page 4
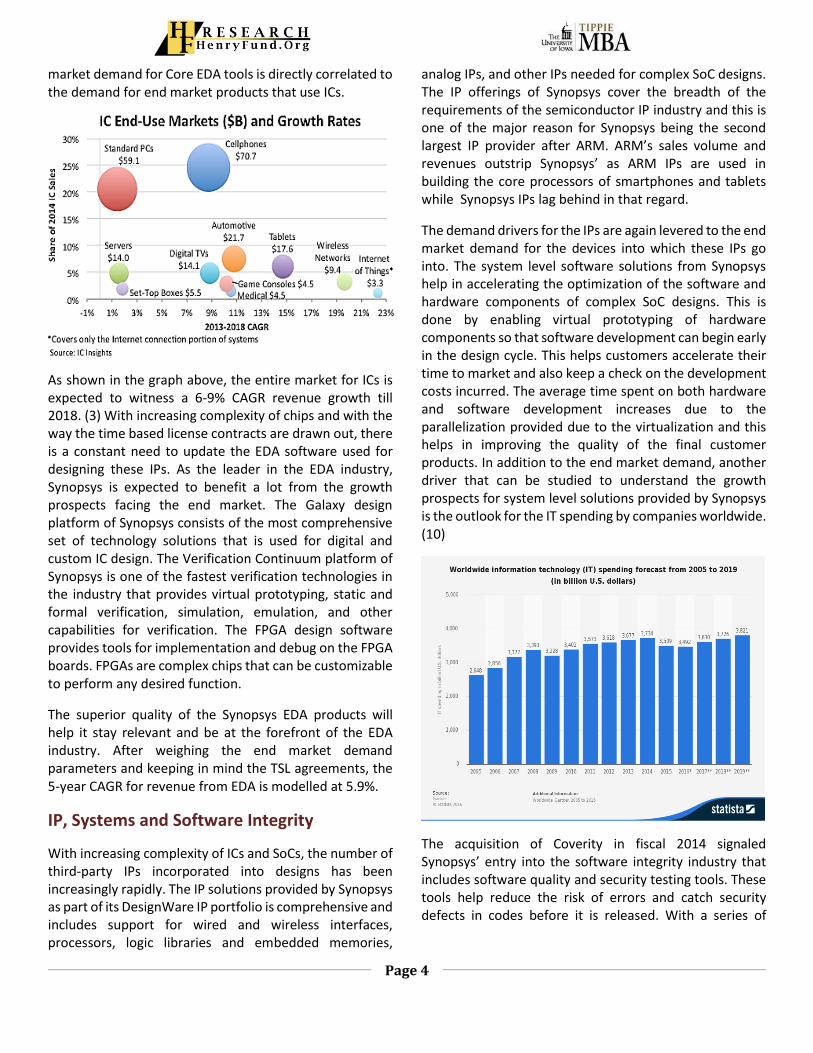
market demand for Core EDA tools is directly correlated to the demand for end market products that use ICs.
As shown in the graph above, the entire market for ICs is expected to witness a 6-9% CAGR revenue growth till 2018. (3) With increasing complexity of chips and with the way the time based license contracts are drawn out, there is a constant need to update the EDA software used for designing these IPs. As the leader in the EDA industry, Synopsys is expected to benefit a lot from the growth prospects facing the end market. The Galaxy design platform of Synopsys consists of the most comprehensive set of technology solutions that is used for digital and custom IC design. The Verification Continuum platform of Synopsys is one of the fastest verification technologies in the industry that provides virtual prototyping, static and formal verification, simulation, emulation, and other capabilities for verification. The FPGA design software provides tools for implementation and debug on the FPGA boards. FPGAs are complex chips that can be customizable to perform any desired function.
The superior quality of the Synopsys EDA products will help it stay relevant and be at the forefront of the EDA industry. After weighing the end market demand parameters and keeping in mind the TSL agreements, the 5-year CAGR for revenue from EDA is modelled at 5.9%.
IP, Systems and Software Integrity
With increasing complexity of ICs and SoCs, the number of third-party IPs incorporated into designs has been increasingly rapidly. The IP solutions provided by Synopsys as part of its DesignWare IP portfolio is comprehensive and includes support for wired and wireless interfaces, processors, logic libraries and embedded memories,
analog IPs, and other IPs needed for complex SoC designs. The IP offerings of Synopsys cover the breadth of the requirements of the semiconductor IP industry and this is one of the major reason for Synopsys being the second largest IP provider after ARM. ARM’s sales volume and revenues outstrip Synopsys’ as ARM IPs are used in building the core processors of smartphones and tablets while Synopsys IPs lag behind in that regard.
The demand drivers for the IPs are again levered to the end market demand for the devices into which these IPs go into. The system level software solutions from Synopsys help in accelerating the optimization of the software and hardware components of complex SoC designs. This is done by enabling virtual prototyping of hardware components so that software development can begin early in the design cycle. This helps customers accelerate their time to market and also keep a check on the development costs incurred. The average time spent on both hardware and software development increases due to the parallelization provided due to the virtualization and this helps in improving the quality of the final customer products. In addition to the end market demand, another driver that can be studied to understand the growth prospects for system level solutions provided by Synopsys is the outlook for the IT spending by companies worldwide. (10)
The acquisition of Coverity in fiscal 2014 signaled Synopsys’ entry into the software integrity industry that includes software quality and security testing tools. These tools help reduce the risk of errors and catch security defects in codes before it is released. With a series of
Page 5
acquisitions, Synopsys has now expanded its product offerings in the software integrity platform.
After studying the end market demand for the end use products and the level of IT spending expected, the 5-year CAGR revenue growth for the IP, Systems and Software Integrity category has been modelled at 11%. Currently, this product segment contributes 28% of the total revenue and its contribution is expected to be above 33% by 2020.
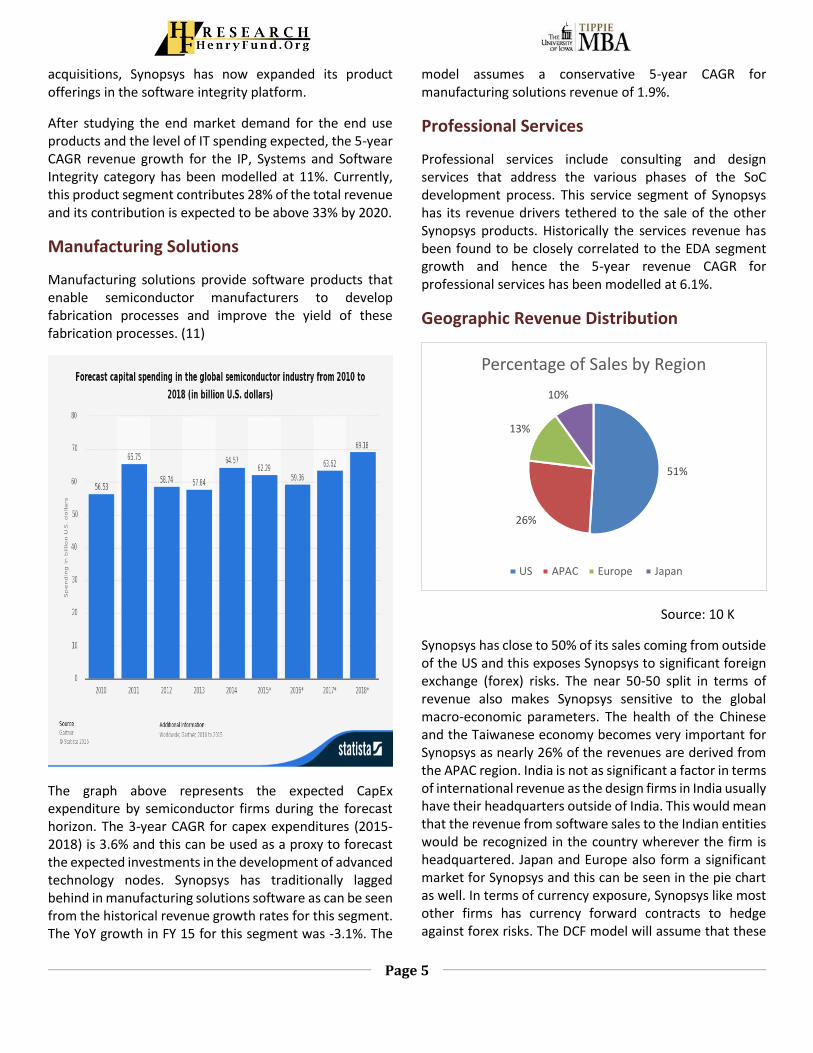
Manufacturing Solutions
Manufacturing solutions provide software products that enable semiconductor manufacturers to develop fabrication processes and improve the yield of these fabrication processes. (11)
The graph above represents the expected CapEx expenditure by semiconductor firms during the forecast horizon. The 3-year CAGR for capex expenditures (2015-2018) is 3.6% and this can be used as a proxy to forecast the expected investments in the development of advanced technology nodes. Synopsys has traditionally lagged behind in manufacturing solutions software as can be seen from the historical revenue growth rates for this segment. The YoY growth in FY 15 for this segment was -3.1%. The
model assumes a conservative 5-year CAGR for manufacturing solutions revenue of 1.9%.
Professional Services
Professional services include consulting and design services that address the various phases of the SoC development process. This service segment of Synopsys has its revenue drivers tethered to the sale of the other Synopsys products. Historically the services revenue has been found to be closely correlated to the EDA segment growth and hence the 5-year revenue CAGR for professional services has been modelled at 6.1%.
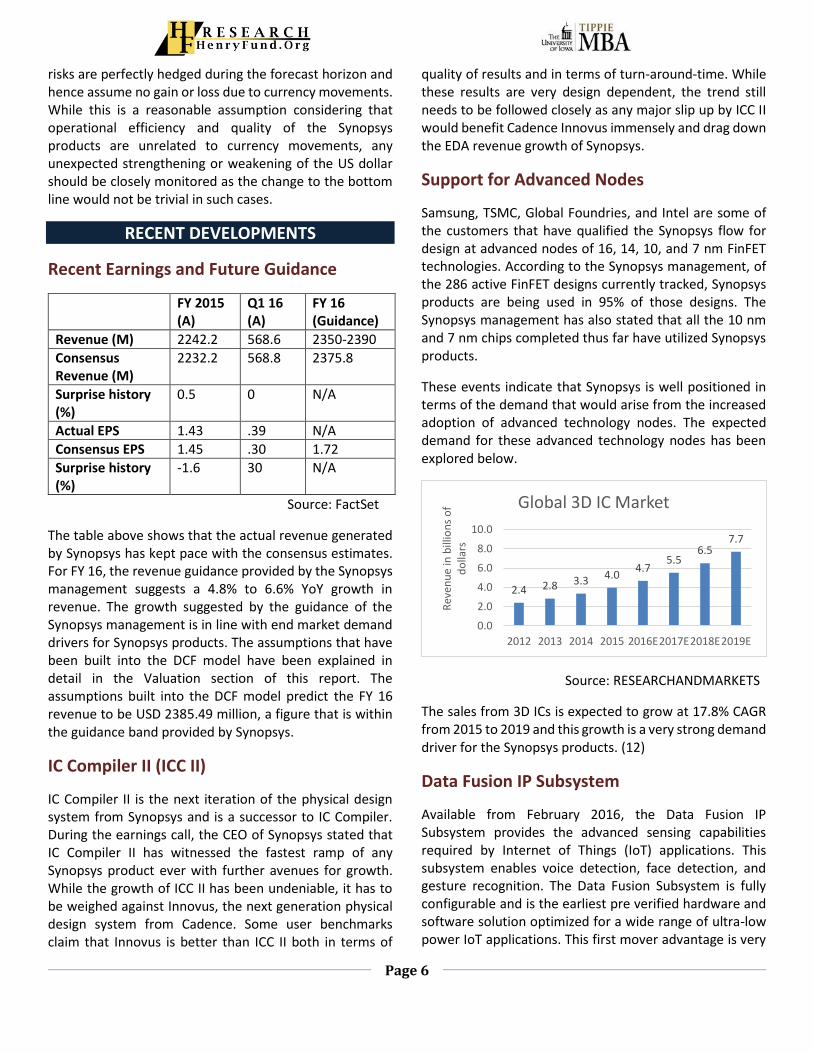
Geographic Revenue Distribution
Source: 10 K
Synopsys has close to 50% of its sales coming from outside of the US and this exposes Synopsys to significant foreign exchange (forex) risks. The near 50-50 split in terms of revenue also makes Synopsys sensitive to the global macro-economic parameters. The health of the Chinese and the Taiwanese economy becomes very important for Synopsys as nearly 26% of the revenues are derived from the APAC region. India is not as significant a factor in terms of international revenue as the design firms in India usually have their headquarters outside of India. This would mean that the revenue from software sales to the Indian entities would be recognized in the country wherever the firm is headquartered. Japan and Europe also form a significant market for Synopsys and this can be seen in the pie chart as well. In terms of currency exposure, Synopsys like most other firms has currency forward contracts to hedge against forex risks. The DCF model will assume that these
51%
26%
13%
10%
Percentage of Sales by Region
US APAC Europe Japan
Page 6
risks are perfectly hedged during the forecast horizon and hence assume no gain or loss due to currency movements. While this is a reasonable assumption considering that operational efficiency and quality of the Synopsys products are unrelated to currency movements, any unexpected strengthening or weakening of the US dollar should be closely monitored as the change to the bottom line would not be trivial in such cases.
RECENT DEVELOPMENTS
Recent Earnings and Future Guidance
FY 2015 (A)
Q1 16 (A)
FY 16 (Guidance)
Revenue (M) 2242.2 568.6 2350-2390
Consensus Revenue (M)
2232.2 568.8 2375.8
Surprise history (%)
0.5 0 N/A
Actual EPS 1.43 .39 N/A
Consensus EPS 1.45 .30 1.72
Surprise history (%)
-1.6 30 N/A
Source: FactSet
The table above shows that the actual revenue generated by Synopsys has kept pace with the consensus estimates. For FY 16, the revenue guidance provided by the Synopsys management suggests a 4.8% to 6.6% YoY growth in revenue. The growth suggested by the guidance of the Synopsys management is in line with end market demand drivers for Synopsys products. The assumptions that have been built into the DCF model have been explained in detail in the Valuation section of this report. The assumptions built into the DCF model predict the FY 16 revenue to be USD 2385.49 million, a figure that is within the guidance band provided by Synopsys.
IC Compiler II (ICC II)
IC Compiler II is the next iteration of the physical design system from Synopsys and is a successor to IC Compiler. During the earnings call, the CEO of Synopsys stated that IC Compiler II has witnessed the fastest ramp of any Synopsys product ever with further avenues for growth. While the growth of ICC II has been undeniable, it has to be weighed against Innovus, the next generation physical design system from Cadence. Some user benchmarks claim that Innovus is better than ICC II both in terms of
quality of results and in terms of turn-around-time. While these results are very design dependent, the trend still needs to be followed closely as any major slip up by ICC II would benefit Cadence Innovus immensely and drag down the EDA revenue growth of Synopsys.
Support for Advanced Nodes
Samsung, TSMC, Global Foundries, and Intel are some of the customers that have qualified the Synopsys flow for design at advanced nodes of 16, 14, 10, and 7 nm FinFET technologies. According to the Synopsys management, of the 286 active FinFET designs currently tracked, Synopsys products are being used in 95% of those designs. The Synopsys management has also stated that all the 10 nm and 7 nm chips completed thus far have utilized Synopsys products.
These events indicate that Synopsys is well positioned in terms of the demand that would arise from the increased adoption of advanced technology nodes. The expected demand for these advanced technology nodes has been explored below.
Source: RESEARCHANDMARKETS
The sales from 3D ICs is expected to grow at 17.8% CAGR from 2015 to 2019 and this growth is a very strong demand driver for the Synopsys products. (12)
Data Fusion IP Subsystem
Available from February 2016, the Data Fusion IP Subsystem provides the advanced sensing capabilities required by Internet of Things (IoT) applications. This subsystem enables voice detection, face detection, and gesture recognition. The Data Fusion Subsystem is fully configurable and is the earliest pre verified hardware and software solution optimized for a wide range of ultra-low power IoT applications. This first mover advantage is very
2.4 2.8 3.3 4.04.7
5.56.5
7.7
0.0
2.0
4.0
6.0
8.0
10.0
2012 2013 2014 2015 2016E2017E2018E2019E
Rev
enu
e in
bill
ion
s o
f d
olla
rs
Global 3D IC Market
Page 7
important for Synopsys to capture the growth that IoT applications are expected to witness. (14)
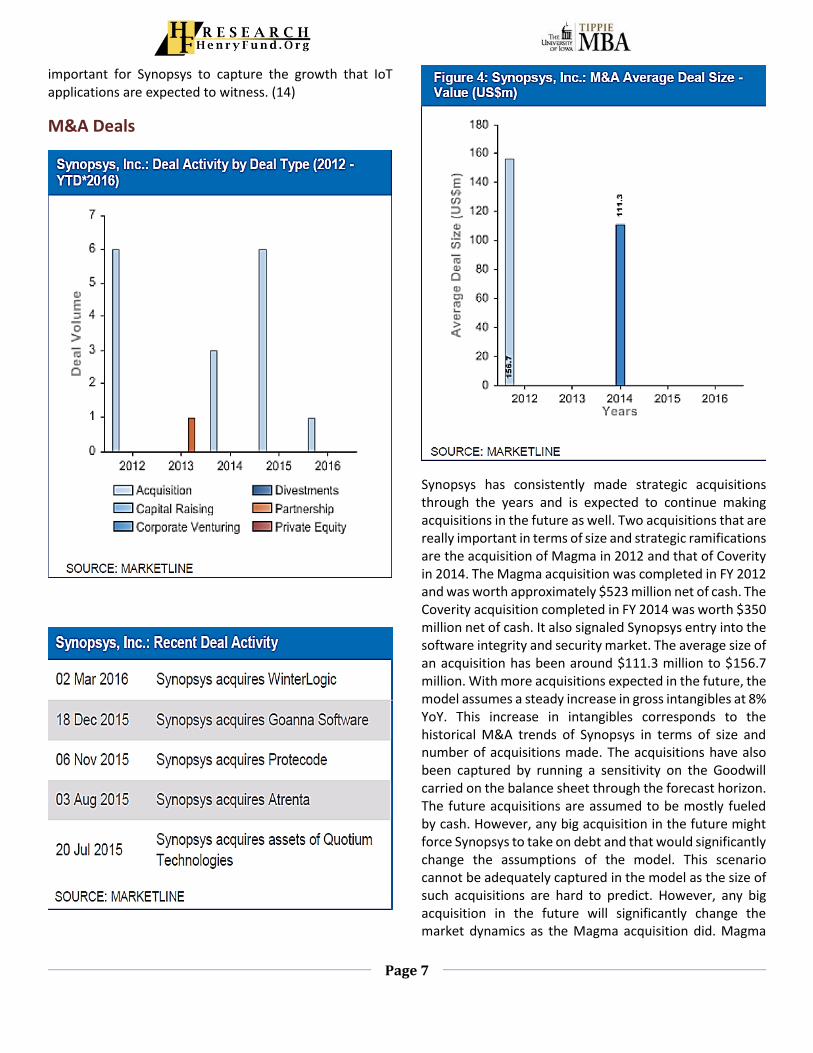
M&A Deals
Synopsys has consistently made strategic acquisitions through the years and is expected to continue making acquisitions in the future as well. Two acquisitions that are really important in terms of size and strategic ramifications are the acquisition of Magma in 2012 and that of Coverity in 2014. The Magma acquisition was completed in FY 2012 and was worth approximately $523 million net of cash. The Coverity acquisition completed in FY 2014 was worth $350 million net of cash. It also signaled Synopsys entry into the software integrity and security market. The average size of an acquisition has been around $111.3 million to $156.7 million. With more acquisitions expected in the future, the model assumes a steady increase in gross intangibles at 8% YoY. This increase in intangibles corresponds to the historical M&A trends of Synopsys in terms of size and number of acquisitions made. The acquisitions have also been captured by running a sensitivity on the Goodwill carried on the balance sheet through the forecast horizon. The future acquisitions are assumed to be mostly fueled by cash. However, any big acquisition in the future might force Synopsys to take on debt and that would significantly change the assumptions of the model. This scenario cannot be adequately captured in the model as the size of such acquisitions are hard to predict. However, any big acquisition in the future will significantly change the market dynamics as the Magma acquisition did. Magma
Page 8
was the fourth largest EDA firm when Synopsys acquired Magma. (17)
Patent Infringement Litigations
The EDA firms are constantly engaged in patent litigations against each other and Synopsys is no exception to this trend. Synopsys is engaged in a complex patent litigation with Mentor Graphics Corporation involving an acquisition that Synopsys made. The $36 million (23 cents per share) in damages that were awarded to Mentor has been upheld by the US Court of Appeals of the federal circuit in February 2016. (1).
In March 2016, a federal court jury found ATop Tech guilty for patent infringement and awarded Synopsys $30.4 (19 cents per share) million in damages. (15)
Most patent battles that Synopsys is engaged in sees Synopsys as the plaintiff. In cases where Synopsys is the defendant, it is mostly battling other EDA firms on patent infringement claims levelled against the companies it acquired.
These patent infringement litigations need to be followed closely as there can be a significant ruling either for or against Synopsys and that can have a material impact on the future earnings potential of Synopsys.
INDUSTRY TRENDS
Cybersecurity National Action Plan
The Cybersecurity Act passed in December 2015 provides important tools necessary to strengthen the cybersecurity of US. Over $20 billion in outlays are expected as part of the plan. This cash outlay is for the modernization of the IT infrastructure and for increased investments to improve cybersecurity measures. (4) Synopsys’ integrity platform provides tools that help in catching known vulnerabilities and protect against exposures. Synopsys’ acquisition of Coverity, the acquisition that started the foray of Synopsys into the software integrity technologies, gives it the static code analysis tools to look for software weaknesses. Other acquisitions in recent times have strengthened the integrity product portfolio and have positioned Synopsys well to make a significant contribution to the cybersecurity measures that are undertaken both globally and in the US.
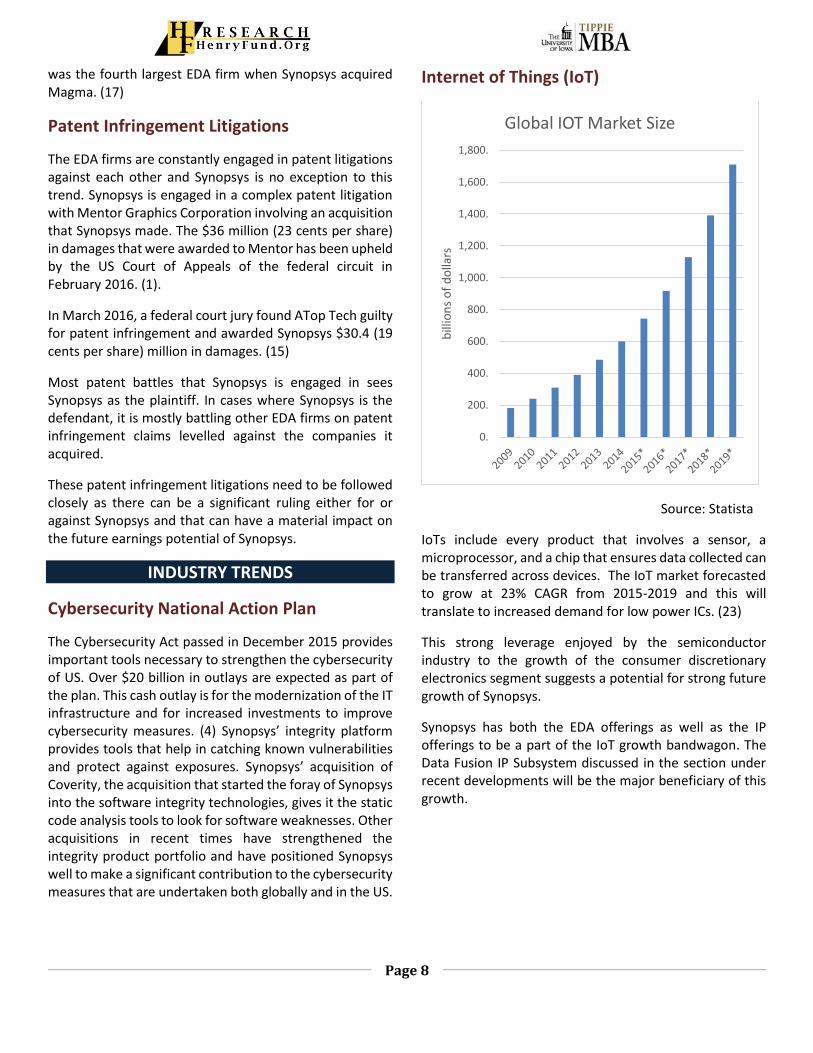
Internet of Things (IoT)
Source: Statista
IoTs include every product that involves a sensor, a microprocessor, and a chip that ensures data collected can be transferred across devices. The IoT market forecasted to grow at 23% CAGR from 2015-2019 and this will translate to increased demand for low power ICs. (23)
This strong leverage enjoyed by the semiconductor industry to the growth of the consumer discretionary electronics segment suggests a potential for strong future growth of Synopsys.
Synopsys has both the EDA offerings as well as the IP offerings to be a part of the IoT growth bandwagon. The Data Fusion IP Subsystem discussed in the section under recent developments will be the major beneficiary of this growth.
0.
200.
400.
600.
800.
1,000.
1,200.
1,400.
1,600.
1,800.
bill
ion
s o
f d
olla
rs
Global IOT Market Size
Page 9
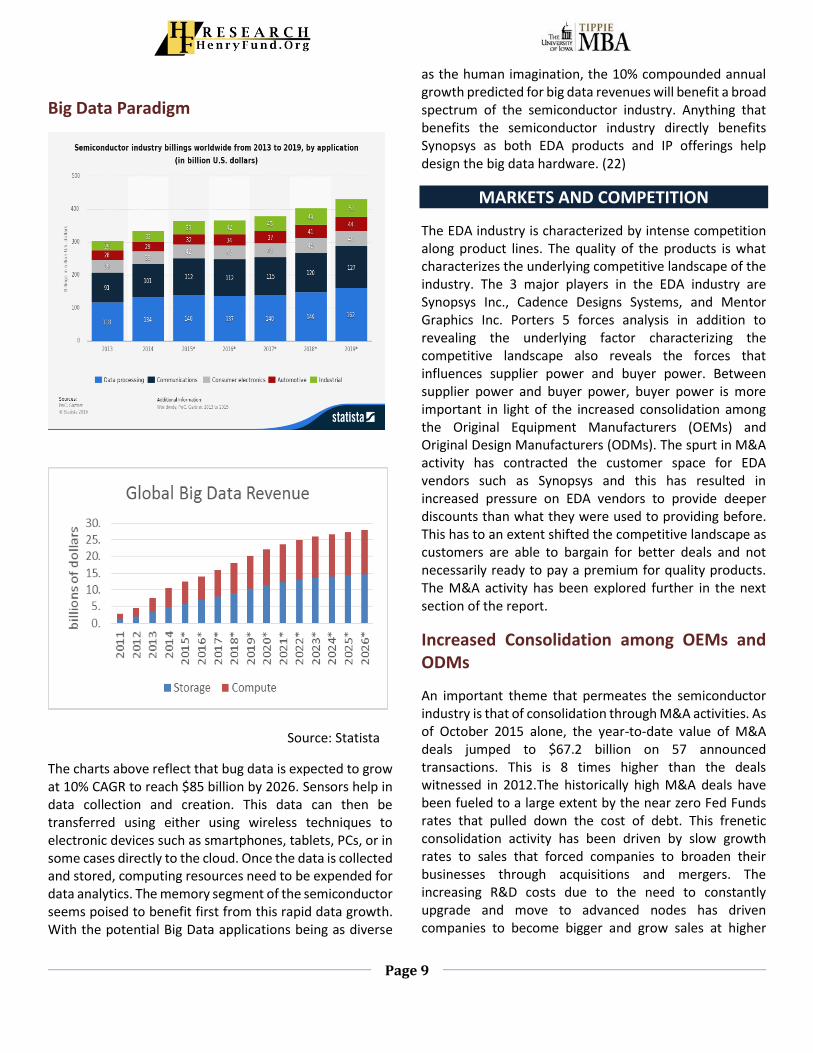
Big Data Paradigm
Source: Statista
The charts above reflect that bug data is expected to grow at 10% CAGR to reach $85 billion by 2026. Sensors help in data collection and creation. This data can then be transferred using either using wireless techniques to electronic devices such as smartphones, tablets, PCs, or in some cases directly to the cloud. Once the data is collected and stored, computing resources need to be expended for data analytics. The memory segment of the semiconductor seems poised to benefit first from this rapid data growth. With the potential Big Data applications being as diverse
as the human imagination, the 10% compounded annual growth predicted for big data revenues will benefit a broad spectrum of the semiconductor industry. Anything that benefits the semiconductor industry directly benefits Synopsys as both EDA products and IP offerings help design the big data hardware. (22)
MARKETS AND COMPETITION
The EDA industry is characterized by intense competition along product lines. The quality of the products is what characterizes the underlying competitive landscape of the industry. The 3 major players in the EDA industry are Synopsys Inc., Cadence Designs Systems, and Mentor Graphics Inc. Porters 5 forces analysis in addition to revealing the underlying factor characterizing the competitive landscape also reveals the forces that influences supplier power and buyer power. Between supplier power and buyer power, buyer power is more important in light of the increased consolidation among the Original Equipment Manufacturers (OEMs) and Original Design Manufacturers (ODMs). The spurt in M&A activity has contracted the customer space for EDA vendors such as Synopsys and this has resulted in increased pressure on EDA vendors to provide deeper discounts than what they were used to providing before. This has to an extent shifted the competitive landscape as customers are able to bargain for better deals and not necessarily ready to pay a premium for quality products. The M&A activity has been explored further in the next section of the report.
Increased Consolidation among OEMs and ODMs
An important theme that permeates the semiconductor industry is that of consolidation through M&A activities. As of October 2015 alone, the year-to-date value of M&A deals jumped to $67.2 billion on 57 announced transactions. This is 8 times higher than the deals witnessed in 2012.The historically high M&A deals have been fueled to a large extent by the near zero Fed Funds rates that pulled down the cost of debt. This frenetic consolidation activity has been driven by slow growth rates to sales that forced companies to broaden their businesses through acquisitions and mergers. The increasing R&D costs due to the need to constantly upgrade and move to advanced nodes has driven companies to become bigger and grow sales at higher

Page 10
rates. Western Digital’s announcement in Oct 2015 to acquire SanDisk is another example of the consolidations taking place in the semiconductor industry.
Key Semiconductor M&A deals in 2014-2015
The consolidation activity is one of the major aspects that should be monitored as it directly impacts the top line revenue growth of EDA vendors. Smaller EDA companies could quote deeper discounts than major EDA vendors to get business from the OEMs and hence make a dent into the future revenue growth prospects. However, this must be weighed against the propensity of the major EDA vendors to acquire any small competitors who are viewed as a threat to their market share or as avenue to acquire promising technologies to augment their product portfolio. Synopsys’ acquisition of Atrenta in FY 15 is an example of market consolidation and product line augmentation. These acquisition trends need constant monitoring. (21)
Peer Comparisons
Source: IBIS World, 10 K
Source: Gartner Inc., eetimes.com
The charts above represent the leadership position enjoyed by Synopsys in its various product segments. It enjoys a clear leadership in the EDA industry and is second only to ARM in the IP market. The software integrity industry is highly fragmented and Synopsys’ attempt to consolidate its place in the integrity market through its various M&A deals will help it gain clear market share over its rivals.
20.1%
13.4%
11.4%
55.1%
FY 15 EDA Market Share by Revenue
Synopsys Cadence Mentor Others
46.0%
13.8%
8.8%
4.7%
26.7%
FY 14 Semiconductor IP Market Share by Sales
ARM Synopsys Imagination Cadence Others

Page 11
Synopsys 2.242 10.08 4.6 7.3 18 6.54
Cadence 1.702 14.83 9.08 18.63 19.1 25.3
Mentor 1.181 8.17 4.69 7.45 11.2 20.71
ARM 1.477 35.08 17.05 20.43 33.9 0.63
P/E
(ntm)
Debt/
Equit
y %
Sales
(B)
Net
Profit
Margin
(%)
ROA
(%)
ROE
(%)
Source: FactSet, Mergent
Cadence and Mentor Graphics are the closest and the most well defined competitors to Synopsys in the EDA industry while ARM is the clear market leader in the IP industry. This is the reason why the above mentioned companies have been chosen for peer comparisons. However, there are still stark differences in the way each of these firms operate and recognize revenues. The differences do not allow clear cut comparisons as one would hope with direct competitors.
Source: FactSet, 10K
In terms of Revenue, Synopsys is the clear leader among its peers and is the only company that has crossed the USD 2 billion mark. ARM Holdings has its headquarters in London, where the corporate tax rate is 20%. The corporate federal tax rate in US is 35%. Hence the pre-tax margin has been studied as it removes the effects of income tax from the analysis. The study of the pre-tax margins reveal that ARM is the clear leader. This analysis is still skewed as the costs of the peers are very different to the costs associated with Synopsys. Moreover, ARM and Synopsys compete only in the IP sphere while the major cash cow for Synopsys is its EDA products. ARM generates close to USD 1.47 billion from its IP business while Synopsys generates less than half that amount from its IP
business. The margins of Synopsys from its IP business is not exactly determinable from its 10K. Hence this report will not derive any conclusion from the comparisons between the EDA vendors and ARM.
Source: FactSet
The R&D expenses across the EDA competitors is higher than the average R&D expense across the entire technology sector. The average R&D expenditure of technology companies is around 26%. In terms of individual comparisons, there isn’t much of a difference in terms of R&D expenses across the EDA competitors as can be seen in the graph above.
To study the costs across the EDA vendors, depreciation and amortization costs as a percentage of sales was plotted. ARM was included in the analysis for the sake of completeness even though no opinion would be expressed on the numbers of ARM.
Source: FactSet, 10K
12.6%15.7%
10.1%
43.2%
0.0%
10.0%
20.0%
30.0%
40.0%
50.0%
Synopsys Cadence Mentor ARM
FY 15 Pre-Tax Margin
35%37%
32%
25%
30%
35%
40%
Synopsys Cadence Mentor
FY 15 R&D expenditure as a percentage of sales
R&D expenditure as a percentage of sales
9.5%
6.9%
4.4% 4.3%
0.0%
2.0%
4.0%
6.0%
8.0%
10.0%
Synopsys Cadence Mentor ARM
FY 15 Depreciation and Amortization as a percentage of
revenue

Page 12
The graph above shows that Synopsys has a much higher depreciation and amortization cost as a percentage of revenue when compared to its peers. In fact the difference between Synopsys and Cadence is approximately equal to the difference in their pre-tax margins. What is however stark from this analysis is that Mentor is the least profitable firm when compared to its EDA peers (10.1% Pre-Tax Margin). The higher amortization and depreciation costs associated with Synopsys are a direct function of the acquisitions that Synopsys makes. Every acquisition increases the intangible assets and the property plant and equipment that Synopsys carries on the balance sheet and hence also contributes to the increase in the depreciation and amortization expenses year-over-year.
Source: Factset, Mergent
Cadence and Mentor are more leveraged than Synopsys and this indicates a higher tax shield in comparison to Synopsys.
Source: FactSet, 10K
To study the ROE comparisons, two factors need to be accounted for. One of them is the costs associated with each firm. The major difference in the costs in terms of
depreciation and amortization has been highlighted in the previous paragraphs. Another difference is the book value of equity and this difference has been studied by working out the Price to Book ratio for the peers. The graph above shows that the Price to Book ratio for Cadence is the highest. The Price to Book ratio has been overlaid with the actual market capitalization for each firm and this analysis reveals that the book value of equity carried by Cadence is much lower than what Synopsys or Mentor carries on its balance sheet. This is the reason there is a huge difference in ROE numbers and also the ROA numbers of Synopsys. The book value of equity is skewed to a large extent by the stock based compensation plans followed by each of these firms. Due to such misalignments in terms of the company fundamentals, the metric that is used to compare the peers is the forward Price/Pre-Tax Income ratio.
The forward Price/Pre-Tax Income ratio works around most shortcomings of the other metrics mentioned in the paragraphs above. It can be seen that Synopsys is relatively undervalued when compared to its peers. Though Mentor has a lower Price/Pre-Tax Income ratio, it has been pointed above that Mentor is the least profitable among the EDA peers and hence it is more fairly valued than undervalued.
ECONOMIC OUTLOOK
Synopsys products power end market products such as PCs, Smartphones, and other electronic devices. The IT spending outlook of industries fuel the demand for the Synopsys product that cater to security and code integrity checks. Since a lot of end market demand for the Synopsys products is dependent on consumer spending, GDP becomes one of the major factors that influences the top line revenue growth of Synopsys. Synopsys with its time based licensing approach has for most part smoothened its earnings, but long term revenue growth prospects are strongly correlated to the GDP growth expected.
0
5
10
15
20
25
30
Synopsys Cadence Mentor ARM
FY 15 D/E
2.1
4.7
1.9
9.1
0.0
2.0
4.0
6.0
8.0
10.0
Synopsys Cadence Mentor ARM
5 year averge P/B
12.815.5
9.6
25.2
0.0
5.0
10.0
15.0
20.0
25.0
30.0
Synopsys Cadence Mentor ARM
1 yr Forward Price/Pre-tax Income
Page 13
Unemployment rates are negatively correlated to median disposable income per household and this availability of disposable income is a positive driver for discretionary consumer spending on electronic products.
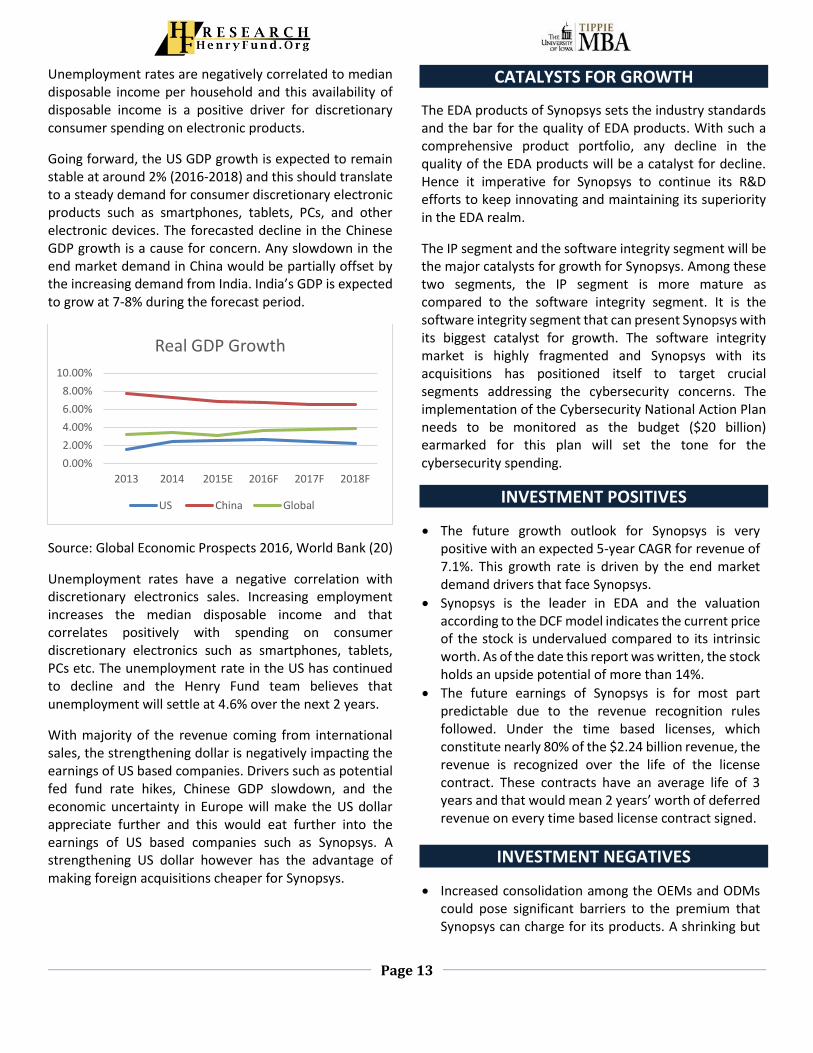
Going forward, the US GDP growth is expected to remain stable at around 2% (2016-2018) and this should translate to a steady demand for consumer discretionary electronic products such as smartphones, tablets, PCs, and other electronic devices. The forecasted decline in the Chinese GDP growth is a cause for concern. Any slowdown in the end market demand in China would be partially offset by the increasing demand from India. India’s GDP is expected to grow at 7-8% during the forecast period.
Source: Global Economic Prospects 2016, World Bank (20)
Unemployment rates have a negative correlation with discretionary electronics sales. Increasing employment increases the median disposable income and that correlates positively with spending on consumer discretionary electronics such as smartphones, tablets, PCs etc. The unemployment rate in the US has continued to decline and the Henry Fund team believes that unemployment will settle at 4.6% over the next 2 years.
With majority of the revenue coming from international sales, the strengthening dollar is negatively impacting the earnings of US based companies. Drivers such as potential fed fund rate hikes, Chinese GDP slowdown, and the economic uncertainty in Europe will make the US dollar appreciate further and this would eat further into the earnings of US based companies such as Synopsys. A strengthening US dollar however has the advantage of making foreign acquisitions cheaper for Synopsys.
CATALYSTS FOR GROWTH
The EDA products of Synopsys sets the industry standards and the bar for the quality of EDA products. With such a comprehensive product portfolio, any decline in the quality of the EDA products will be a catalyst for decline. Hence it imperative for Synopsys to continue its R&D efforts to keep innovating and maintaining its superiority in the EDA realm.
The IP segment and the software integrity segment will be the major catalysts for growth for Synopsys. Among these two segments, the IP segment is more mature as compared to the software integrity segment. It is the software integrity segment that can present Synopsys with its biggest catalyst for growth. The software integrity market is highly fragmented and Synopsys with its acquisitions has positioned itself to target crucial segments addressing the cybersecurity concerns. The implementation of the Cybersecurity National Action Plan needs to be monitored as the budget ($20 billion) earmarked for this plan will set the tone for the cybersecurity spending.
INVESTMENT POSITIVES
The future growth outlook for Synopsys is very positive with an expected 5-year CAGR for revenue of 7.1%. This growth rate is driven by the end market demand drivers that face Synopsys.
Synopsys is the leader in EDA and the valuation according to the DCF model indicates the current price of the stock is undervalued compared to its intrinsic worth. As of the date this report was written, the stock holds an upside potential of more than 14%.
The future earnings of Synopsys is for most part predictable due to the revenue recognition rules followed. Under the time based licenses, which constitute nearly 80% of the $2.24 billion revenue, the revenue is recognized over the life of the license contract. These contracts have an average life of 3 years and that would mean 2 years’ worth of deferred revenue on every time based license contract signed.
INVESTMENT NEGATIVES
Increased consolidation among the OEMs and ODMs could pose significant barriers to the premium that Synopsys can charge for its products. A shrinking but
0.00%
2.00%
4.00%
6.00%
8.00%
10.00%
2013 2014 2015E 2016F 2017F 2018F
Real GDP Growth
US China Global

Page 14
consolidated customer base would mean that the buyers have significantly more bargaining power and hence pose a threat to the size of the future deals signed between Synopsys and its customers.
Though patent infringement litigations are quite commonplace in the EDA industry, any adverse judgements against Synopsys can significantly impact the stock price. Currently there are no patent litigations against any of the core technologies of Synopsys and all patent battles are on the acquisitions made. This however need not be the case in the future.
Strengthening US dollar is always a cause for concern as it can significantly impact the earnings of a US based company. Synopsys will also suffer from the continued appreciation of the US dollar.
VALUATION
DCF, DDM, and relative P/E analysis have been used to value Synopsys Inc. The three valuation techniques yield stock prices of $55.4, $30.4, and$38.6 respectively. We believe that the intrinsic value of the Synopsys stock is closest to the DCF model.
Synopsys has no history of paying any dividend. The top management of Synopsys has indicated that it has no plans to initiate a dividend policy in the foreseeable future. Hence the stock price indicated by the DDM model is disregarded. Despite the historical track record of not paying dividend and the forecasted horizon maintaining that trend, the DDM model was still performed to gain an insight into the theoretical P/E value of Synopsys leading into its steady state. The continuing value P/E multiple leading to the steady state turns out to be 15.2 in the DDM model. The continuing value P/E is lesser than the current expected forward P/E of 16.2. For a firm whose revenue is modelled to grow at 7.1% CAGR from 2015 to 2020 and with a long term growth rate of 3.5%, the P/E multiple of 15.2 represents a stock price that is undervalued to its future earnings potential. No importance has been attached to the stock price derived from the DDM model.
Among all available competitors, Cadence Design Systems and Mentor Graphics Corporation are the best aligned publicly traded competitors in the EDA domain. With respect to IP solutions, Cadence, Mentor Graphics, and ARM holdings are the best aligned publicly traded competitors. The stock price for Synopsys computed using the relative P/E model is $36.6, which is way below the
current stock price of $48.2. The stock price arrived at using the relative P/E model indicates a 24% discount to the current stock price of Synopsys. Not only is the price from the model misaligned with the current stock price, but also is misaligned from the consensus 1 year target estimate of $54.9. The relative comparison was expanded by adding Ansys and Autodesk to the analysis. Ansys and Autodesk are examples of firms who make computer aided engineering software, but do not directly compete with Synopsys. The forward P/E ratio for Autodesk is skewed as analysts expect Autodesk to make a loss during this fiscal year. After correcting for the anomalies and re-computing the expected forward looking P/E ratios, the model still gave a price that was at 30% discount to the consensus 1 year target price. Considering the abovementioned anomalies in the relative P/E model and the P/E ratio suggested by the consensus target price, the share price suggested by the model will be viewed subservient to the DCF model.
Short-Term Revenue Growth Assumptions
The 5-year revenue growth assumptions for individual segments of Synopsys have been determined by studying the end market demand for each of these segments. Though individual segments of Synopsys face mostly overlapping demand drivers, the 5-year CAGR growth assumptions have been arrived at by concentrating on the drivers unique to each segment.
Synopsys reports its revenues under 3 main categories, time-based license revenue, upfront license revenue, and maintenance and service revenue. Though these are the categories used by Synopsys to report its revenue, the model however uses different segments for forecasting revenue. The segments used are Core EDA, IP Systems and Software Integrity, Manufacturing Solutions, Professional Services. The reason for this discord is that the categories used by Synopsys are shaped by their sales decisions. Core EDA licenses can be sold both as a time-based license and as an upfront license. What is however independent of the license model is the end market demand for the Core EDA solutions. This is the reason why the growth rates were not forecasted for the categories reported in the income statement of Synopsys and instead new categories were defined.
After forecasting the revenues for the newly defined categories, the forecast figures were retrofitted into the existing income statement by assuming that the breakup

Page 15
between time-based licenses, upfront licenses, and maintenance and services revenue would be at historical levels. However, to test this assumption, a sensitivity analysis was performed by varying the short term deferred revenues and the long term deferred revenues. Deferred revenues are a direct function of time-based licenses and hence these line items were chosen to perform the sensitivity analysis. The sensitivity analysis revealed that increasing the deferred revenues would increase the intrinsic value of the stock. At current revenue growth assumptions, if the short term deferred revenues were at 47% of revenues and the long term deferred revenues were at 7.5% of revenues, then the DCF stock price would increase to $58. This would translate to time-based licenses that have a higher contract period.
The reasoning behind the growth assumptions for each segment has been explained in detail in the company description section. The table below encapsulates the assumptions made:
Segment 2016-2020 CAGR (%)
Core EDA 5.9%
IP, Systems and Software Integrity
10.8%
Manufacturing Solutions
1.9%
Professional Services and Other
5.5%
Source: HF Estimates
Costs and Margins
In the Q1 2016 earnings call, the CFO of Synopsys stated that Synopsys was targeting a 25% Non-GAAP operating margins and a $500 million operating cash flows. Synopsys has a history of making acquisitions year after year. In 2015 alone it made 6 acquisitions. Synopsys is expected to make significant number of acquisitions going forward as well and hence this report has given precedence to the GAAP margins and earnings to better reflect the cash flow situations at Synopsys. Acquisitions have been modelled to go directly into intangible assets. Though every future investment might add to the goodwill, the model eschews from forecasting goodwill. Instead a sensitivity analysis
was performed by varying goodwill to study the impact on the intrinsic stock price. With all other parameters held constant, varying goodwill does not impact the intrinsic value of the stock price in any significant manner.
The major costs comprising of the cost of goods sold are the licensing costs, maintenance and service costs, and the amortizations costs. These costs have been modelled by studying the historical trends of how these costs vary with the respective revenue segment line item. For instance, costs of licensing has been matched with the revenue from time-based licenses as well as upfront licenses. The respective assumptions for the cost of licensing and cost of maintenance and services as percentage of their respective revenue segments were 15.3% and 41.7%. A sensitivity analysis on these cost assumptions gave an intrinsic stock price that is higher than the current stock price on either sides of the assumptions. The other significant component of cost of goods sold is amortization expense associated with the intellectual properties held by Synopsys. Synopsys follows a straight line amortization schedule and hence past trends were studied and replicated in terms of forecasted amortization expenses. Since the intangible assets held by Synopsys are also forecasted to grow during the forecast horizon, the amortization expenses were not uniform. No sensitivity was performed on the amortization expense as there is very little room for a firm to play with the amortization schedule for the intangible assets held by the firm.
Another significant assumption that has an impact on the cash flows is the growth rate for Property Plant and Equipment. The growth of Property Plant and Equipment is tricky as Synopsys is very likely to acquire companies during the forecast horizon. However, the historical data for the Property Plant and Equipment has this trend for acquisitions built in as Synopsys has been quite active in acquiring companies in the past. Hence the historical growth in gross PP&E was used as a proxy to forecast the future outlays for buying new PP&E. The historical trend for PP&E was 11% year over year growth in PP&E. With acquisitions expected in the pipeline, it was considered prudent to run a sensitivity analysis on the assumption for PP&E and the sensitivity analysis revealed that the growth in PP&E could be as high as 15% year over year and the DCF stock price would still be above $53. Any large acquisition in the future would however pose significant threat to this assumption.
Page 16
In addition to the R&D expenses, operational costs include two major components for Synopsys, namely sales and marketing costs and general administrative costs. These costs have been forecasted at historical averages to the revenue. Sensitivity analysis was performed to study the impact of operational cost cutting measures on the intrinsic share price and the price was found to be reasonably sensitive to these costs.
Under the current cost assumptions, the gross margin for Synopsys is seen to be consistent during the forecast horizon. In FY 2015, the gross margin for Synopsys was 76.9% and this is expected to go up to 78.5% by 2020. The operating margins are expected to increase from its current levels of 11.9% to 14.1%. This increase is in line with the Synopsys management’s effort to increase its NON-GAAP operating margins from 22.5% to 25% in the coming years. The net profit margins are also expected to stay within historical limits during the forecast horizon and is expected to settle at 12.9% by 2020.
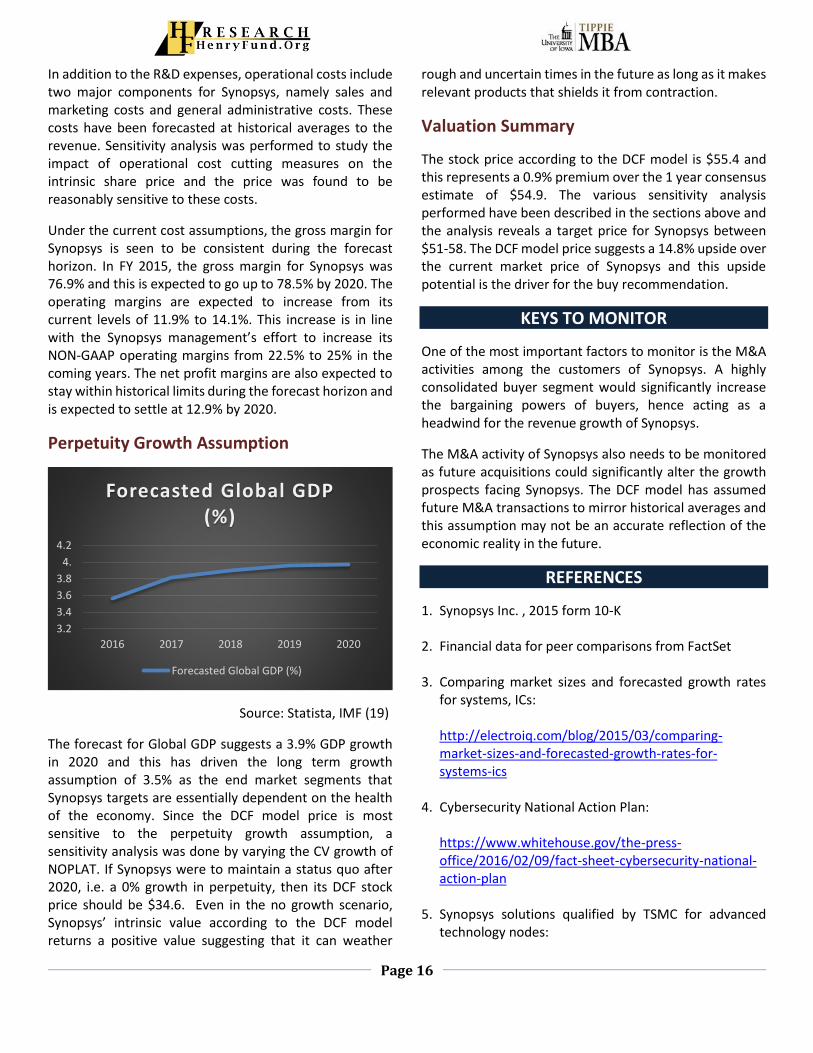
Perpetuity Growth Assumption
Source: Statista, IMF (19)
The forecast for Global GDP suggests a 3.9% GDP growth in 2020 and this has driven the long term growth assumption of 3.5% as the end market segments that Synopsys targets are essentially dependent on the health of the economy. Since the DCF model price is most sensitive to the perpetuity growth assumption, a sensitivity analysis was done by varying the CV growth of NOPLAT. If Synopsys were to maintain a status quo after 2020, i.e. a 0% growth in perpetuity, then its DCF stock price should be $34.6. Even in the no growth scenario, Synopsys’ intrinsic value according to the DCF model returns a positive value suggesting that it can weather
rough and uncertain times in the future as long as it makes relevant products that shields it from contraction.
Valuation Summary
The stock price according to the DCF model is $55.4 and this represents a 0.9% premium over the 1 year consensus estimate of $54.9. The various sensitivity analysis performed have been described in the sections above and the analysis reveals a target price for Synopsys between $51-58. The DCF model price suggests a 14.8% upside over the current market price of Synopsys and this upside potential is the driver for the buy recommendation.
KEYS TO MONITOR
One of the most important factors to monitor is the M&A activities among the customers of Synopsys. A highly consolidated buyer segment would significantly increase the bargaining powers of buyers, hence acting as a headwind for the revenue growth of Synopsys.
The M&A activity of Synopsys also needs to be monitored as future acquisitions could significantly alter the growth prospects facing Synopsys. The DCF model has assumed future M&A transactions to mirror historical averages and this assumption may not be an accurate reflection of the economic reality in the future.
REFERENCES
1. Synopsys Inc. , 2015 form 10-K
2. Financial data for peer comparisons from FactSet
3. Comparing market sizes and forecasted growth rates for systems, ICs: http://electroiq.com/blog/2015/03/comparing-market-sizes-and-forecasted-growth-rates-for-systems-ics
4. Cybersecurity National Action Plan: https://www.whitehouse.gov/the-press-office/2016/02/09/fact-sheet-cybersecurity-national-action-plan
5. Synopsys solutions qualified by TSMC for advanced technology nodes:
3.2
3.4
3.6
3.8
4.
4.2
2016 2017 2018 2019 2020
Forecasted Global GDP (%)
Forecasted Global GDP (%)

Page 17
https://finance.yahoo.com/news/synopsys-custom-compiler-certified-tsmc-130600445.html
6. Synopsys solutions qualified by Intel for advanced technology nodes : https://finance.yahoo.com/news/intel-custom-foundry-certifies-synopsys-130500248.html
7. Synopsys’ rank in the semiconductor IP market: http://www.eetimes.com/document.asp?doc_id=1322055
8. Synopsys ARC processors vs ARM processor: http://www.eejournal.com/archives/articles/20131106-archs/
9. Coverity Acquisition: http://www.coverity.com/press-releases/synopsys-enters-software-quality-and-security-market-with-coverity-acquisition/
10. Global IT Spending:
http://www.statista.com/statistics/203935/overall-it-spending-worldwide/
11. Semiconductor Capex Spending:
http://www.statista.com.proxy.lib.uiowa.edu/statistics/267396/capital-spending-in-the-semiconductor-industry-until-2015/
12. 3D ICs Market - Global Industry Analysis:
http://www.prnewswire.com/news-releases/3d-ics-market---global-industry-analysis-size-share-growth-trends-and-forecast-to-2019-246567691.html
13. Cadence Innovus vs Synopsys ICC2:
http://www.deepchip.com/items/0550-01.html
14. Synopsys Data Fusion IP Subsystem:
https://www.synopsys.com/dw/ipdir.php?ds=smart-data-fusion-subsystem
15. Patent against ATop Tech:
http://news.synopsys.com/2016-03-10-Jury-Finds-in-Favor-of-Synopsys-in-ATopTech-Copyright-Infringement-Case
16. Global software leaders by revenue:
http://www.pwc.com/gx/en/industries/technology/publications/global-software-100-leaders/compare-results.html
17. Marketline research, Synopsys:
WWW.MARKETLINE.COM
BF68379C-775D-4B24-8F1E-9B6BA4A89857
18. IBIS World Report on EDA industry:
http://www.ibisworld.com/industry/electronic-design-automation-software-developers.html
19. Global GDP forecasts:
http://www.statista.com/statistics/273951/growth-of-the-global-gross-domestic-product-gdp/
20. World Bank GDP forecasts:
http://pubdocs.worldbank.org/pubdocs/publicdoc/2016/1/88501452035054522/Global-Economic-Prospects-January-2016-Table1.pdf
21. Key semiconductor deals in 2014-2015:
https://www.pwc.com/us/en/technology/publications/assets/semiconductor-industry-device-deal-trends.pdf
22. Big data market forecast worldwide from 2011 to 2026:
http://www.statista.com.proxy.lib.uiowa.edu/statistics/255970/global-big-data-market-forecast-by-segment/
23. Size of the global Internet of Things (IoT) market:

Page 18
http://www.statista.com.proxy.lib.uiowa.edu/statistics/485136/global-internet-of-things-market-size/
IMPORTANT DISCLAIMER
Henry Fund reports are created by student enrolled in the Applied Securities Management (Henry Fund) program at the University of Iowa’s Tippie School of Management. These reports are intended to provide potential employers and other interested parties an example of the analytical skills, investment knowledge, and communication abilities of Henry Fund students. Henry Fund analysts are not registered investment advisors, brokers or officially licensed financial professionals. The investment opinion contained in this report does not represent an offer or solicitation to buy or sell any of the aforementioned securities. Unless otherwise noted, facts and figures included in this report are from publicly available sources. This report is not a complete compilation of data, and its accuracy is not guaranteed. From time to time, the University of Iowa, its faculty, staff, students, or the Henry Fund may hold a financial interest in the companies mentioned in this report.
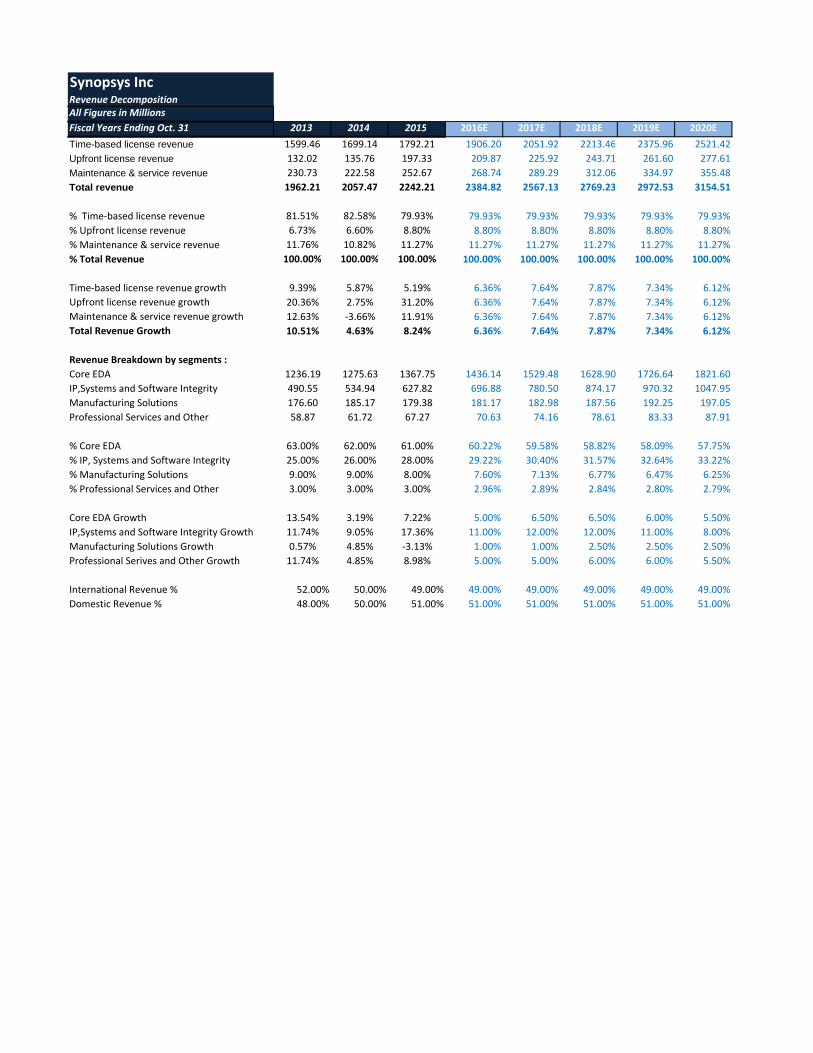
Synopsys IncRevenue DecompositionAll Figures in Millions
Fiscal Years Ending Oct. 31 2013 2014 2015 2016E 2017E 2018E 2019E 2020E
Time-based license revenue 1599.46 1699.14 1792.21 1906.20 2051.92 2213.46 2375.96 2521.42
Upfront license revenue 132.02 135.76 197.33 209.87 225.92 243.71 261.60 277.61
Maintenance & service revenue 230.73 222.58 252.67 268.74 289.29 312.06 334.97 355.48
Total revenue 1962.21 2057.47 2242.21 2384.82 2567.13 2769.23 2972.53 3154.51
% Time‐based license revenue 81.51% 82.58% 79.93% 79.93% 79.93% 79.93% 79.93% 79.93%
% Upfront license revenue 6.73% 6.60% 8.80% 8.80% 8.80% 8.80% 8.80% 8.80%
% Maintenance & service revenue 11.76% 10.82% 11.27% 11.27% 11.27% 11.27% 11.27% 11.27%
% Total Revenue 100.00% 100.00% 100.00% 100.00% 100.00% 100.00% 100.00% 100.00%
Time‐based license revenue growth 9.39% 5.87% 5.19% 6.36% 7.64% 7.87% 7.34% 6.12%
Upfront license revenue growth 20.36% 2.75% 31.20% 6.36% 7.64% 7.87% 7.34% 6.12%
Maintenance & service revenue growth 12.63% ‐3.66% 11.91% 6.36% 7.64% 7.87% 7.34% 6.12%
Total Revenue Growth 10.51% 4.63% 8.24% 6.36% 7.64% 7.87% 7.34% 6.12%
Revenue Breakdown by segments :
Core EDA 1236.19 1275.63 1367.75 1436.14 1529.48 1628.90 1726.64 1821.60
IP,Systems and Software Integrity 490.55 534.94 627.82 696.88 780.50 874.17 970.32 1047.95
Manufacturing Solutions 176.60 185.17 179.38 181.17 182.98 187.56 192.25 197.05
Professional Services and Other 58.87 61.72 67.27 70.63 74.16 78.61 83.33 87.91
% Core EDA 63.00% 62.00% 61.00% 60.22% 59.58% 58.82% 58.09% 57.75%
% IP, Systems and Software Integrity 25.00% 26.00% 28.00% 29.22% 30.40% 31.57% 32.64% 33.22%
% Manufacturing Solutions 9.00% 9.00% 8.00% 7.60% 7.13% 6.77% 6.47% 6.25%
% Professional Services and Other 3.00% 3.00% 3.00% 2.96% 2.89% 2.84% 2.80% 2.79%
Core EDA Growth 13.54% 3.19% 7.22% 5.00% 6.50% 6.50% 6.00% 5.50%
IP,Systems and Software Integrity Growth 11.74% 9.05% 17.36% 11.00% 12.00% 12.00% 11.00% 8.00%
Manufacturing Solutions Growth 0.57% 4.85% ‐3.13% 1.00% 1.00% 2.50% 2.50% 2.50%
Professional Serives and Other Growth 11.74% 4.85% 8.98% 5.00% 5.00% 6.00% 6.00% 5.50%
International Revenue % 52.00% 50.00% 49.00% 49.00% 49.00% 49.00% 49.00% 49.00%
Domestic Revenue % 48.00% 50.00% 51.00% 51.00% 51.00% 51.00% 51.00% 51.00%
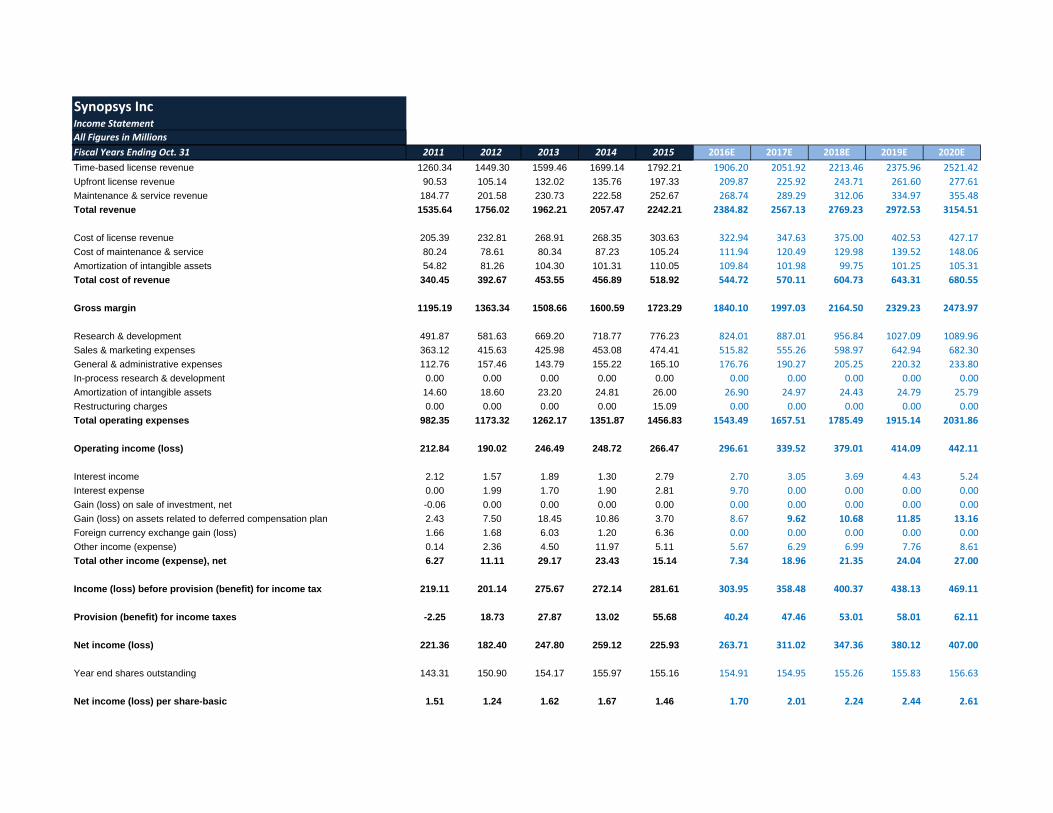
Synopsys IncIncome Statement
All Figures in Millions
Fiscal Years Ending Oct. 31 2011 2012 2013 2014 2015 2016E 2017E 2018E 2019E 2020E
Time-based license revenue 1260.34 1449.30 1599.46 1699.14 1792.21 1906.20 2051.92 2213.46 2375.96 2521.42
Upfront license revenue 90.53 105.14 132.02 135.76 197.33 209.87 225.92 243.71 261.60 277.61
Maintenance & service revenue 184.77 201.58 230.73 222.58 252.67 268.74 289.29 312.06 334.97 355.48
Total revenue 1535.64 1756.02 1962.21 2057.47 2242.21 2384.82 2567.13 2769.23 2972.53 3154.51
Cost of license revenue 205.39 232.81 268.91 268.35 303.63 322.94 347.63 375.00 402.53 427.17
Cost of maintenance & service 80.24 78.61 80.34 87.23 105.24 111.94 120.49 129.98 139.52 148.06
Amortization of intangible assets 54.82 81.26 104.30 101.31 110.05 109.84 101.98 99.75 101.25 105.31
Total cost of revenue 340.45 392.67 453.55 456.89 518.92 544.72 570.11 604.73 643.31 680.55
Gross margin 1195.19 1363.34 1508.66 1600.59 1723.29 1840.10 1997.03 2164.50 2329.23 2473.97
Research & development 491.87 581.63 669.20 718.77 776.23 824.01 887.01 956.84 1027.09 1089.96
Sales & marketing expenses 363.12 415.63 425.98 453.08 474.41 515.82 555.26 598.97 642.94 682.30
General & administrative expenses 112.76 157.46 143.79 155.22 165.10 176.76 190.27 205.25 220.32 233.80
In-process research & development 0.00 0.00 0.00 0.00 0.00 0.00 0.00 0.00 0.00 0.00
Amortization of intangible assets 14.60 18.60 23.20 24.81 26.00 26.90 24.97 24.43 24.79 25.79
Restructuring charges 0.00 0.00 0.00 0.00 15.09 0.00 0.00 0.00 0.00 0.00
Total operating expenses 982.35 1173.32 1262.17 1351.87 1456.83 1543.49 1657.51 1785.49 1915.14 2031.86
Operating income (loss) 212.84 190.02 246.49 248.72 266.47 296.61 339.52 379.01 414.09 442.11
Interest income 2.12 1.57 1.89 1.30 2.79 2.70 3.05 3.69 4.43 5.24
Interest expense 0.00 1.99 1.70 1.90 2.81 9.70 0.00 0.00 0.00 0.00
Gain (loss) on sale of investment, net -0.06 0.00 0.00 0.00 0.00 0.00 0.00 0.00 0.00 0.00
Gain (loss) on assets related to deferred compensation plan 2.43 7.50 18.45 10.86 3.70 8.67 9.62 10.68 11.85 13.16
Foreign currency exchange gain (loss) 1.66 1.68 6.03 1.20 6.36 0.00 0.00 0.00 0.00 0.00
Other income (expense) 0.14 2.36 4.50 11.97 5.11 5.67 6.29 6.99 7.76 8.61
Total other income (expense), net 6.27 11.11 29.17 23.43 15.14 7.34 18.96 21.35 24.04 27.00
Income (loss) before provision (benefit) for income tax 219.11 201.14 275.67 272.14 281.61 303.95 358.48 400.37 438.13 469.11
Provision (benefit) for income taxes -2.25 18.73 27.87 13.02 55.68 40.24 47.46 53.01 58.01 62.11
Net income (loss) 221.36 182.40 247.80 259.12 225.93 263.71 311.02 347.36 380.12 407.00
Year end shares outstanding 143.31 150.90 154.17 155.97 155.16 154.91 154.95 155.26 155.83 156.63
Net income (loss) per share-basic 1.51 1.24 1.62 1.67 1.46 1.70 2.01 2.24 2.44 2.61

Synopsys IncBalance SheetAll Figures in Millions
Fiscal Years Ending Oct. 31 2013 2014 2015 2016E 2017E 2018E 2019E 2020E
Cash & cash equivalents 1022.44 985.76 836.19 959.32 1186.39 1451.14 1738.10 2034.55
Short-term investments 0.00 0.00 128.75 129.61 130.48 131.35 132.23 133.12
Total cash, cash equivalents & short-term investments 1022.44 985.76 964.94 1088.93 1316.87 1582.50 1870.34 2167.66
Accounts receivable, gross 260.28 328.75 388.26 397.00 427.35 461.00 494.84 525.14
Less: allowances for doubtful accounts 4.25 2.03 2.56 2.53 2.73 2.94 3.16 3.35
Accounts receivable, net 256.03 326.73 385.69 394.47 424.63 458.06 491.68 521.78
Deferred income taxes 92.06 111.45 94.99 68.66 80.98 90.44 98.97 105.97
Income taxes receivable & prepaid taxes 18.28 26.50 46.73 47.36 55.86 62.38 68.27 73.10
Prepaid expenses & other current assets 59.18 54.30 71.45 70.28 75.66 81.61 87.60 92.97
Total current assets 1447.98 1504.74 1563.80 1669.71 1953.99 2274.99 2616.87 2961.48
Property & equipment, gross 589.71 686.84 717.13 796.02 883.58 980.77 1088.66 1208.41
Less accumulated depreciation & amortization 392.11 437.74 454.06 471.29 492.55 518.16 548.46 583.84
Property & equipment, net 197.60 249.10 263.08 324.73 391.02 462.61 540.19 624.56
Long-term investments 0.00 0.00 0.00 0.00 0.00 0.00 0.00 0.00
Goodwill 1975.97 2255.71 2471.24 2471.24 2471.24 2471.24 2471.24 2471.24
Intangible assets, net 335.43 365.03 363.66 337.65 330.27 335.24 348.67 368.20
Long-term prepaid taxes 7.94 17.65 18.74 26.52 31.27 34.93 38.22 40.92
Long-term deferred income taxes 243.07 208.16 178.92 129.32 152.52 170.34 186.41 199.59
Other long-term assets 150.96 175.13 186.31 206.80 229.55 254.80 282.83 313.94
Total assets 4358.94 4775.50 5045.74 5165.97 5559.87 6004.15 6484.43 6979.95
Liabilities and Stockholder's equity:
Accounts payable & accrued liabilities 358.20 397.11 385.54 435.23 468.51 505.39 542.49 575.70
Accrued income taxes 7.17 31.40 19.57 14.14 16.68 18.63 20.38 21.83
Deferred revenue 827.55 928.24 968.25 1037.18 1116.47 1204.37 1292.78 1371.93
Short-term debt 30.00 30.00 205.00 0.00 0.00 0.00 0.00 0.00
Total current liabilities 1222.92 1386.76 1578.35 1486.55 1601.66 1728.38 1855.66 1969.46
Long term accrued income taxes 53.06 50.95 37.76 27.30 32.19 35.95 39.34 42.13
Long-term deferred revenue 54.74 77.65 93.61 99.57 107.18 115.62 124.10 131.70
Long-term debt 75.00 45.00 0.00 0.00 0.00 0.00 0.00 0.00
Total other long-term liabilities 164.94 158.97 202.02 224.24 248.91 276.29 306.68 340.42
Total liabilities 1570.66 1719.33 1911.75 1837.66 1989.94 2156.24 2325.79 2483.70
Common Stock , Net 1598.79 1616.16 1612.01 1612.01 1612.01 1612.01 1612.01 1612.01
Retained earnings (accumulated deficit) 1324.85 1551.59 1725.73 1989.44 2300.46 2647.82 3027.94 3434.94
Treasury stock, at cost , Net of ESPP 106.67 49.50 98.38 167.77 237.16 306.55 375.94 445.33
Accumulated other comprehensive income (loss) -28.70 -62.09 -105.38 ‐105.38 ‐105.38 ‐105.38 ‐105.38 ‐105.38
Total stockholders' equity 2788.28 3056.17 3133.99 3328.31 3569.94 3847.91 4158.64 4496.25
Total equity 2788.28 3056.17 3133.99 3328.31 3569.94 3847.91 4158.64 4496.25
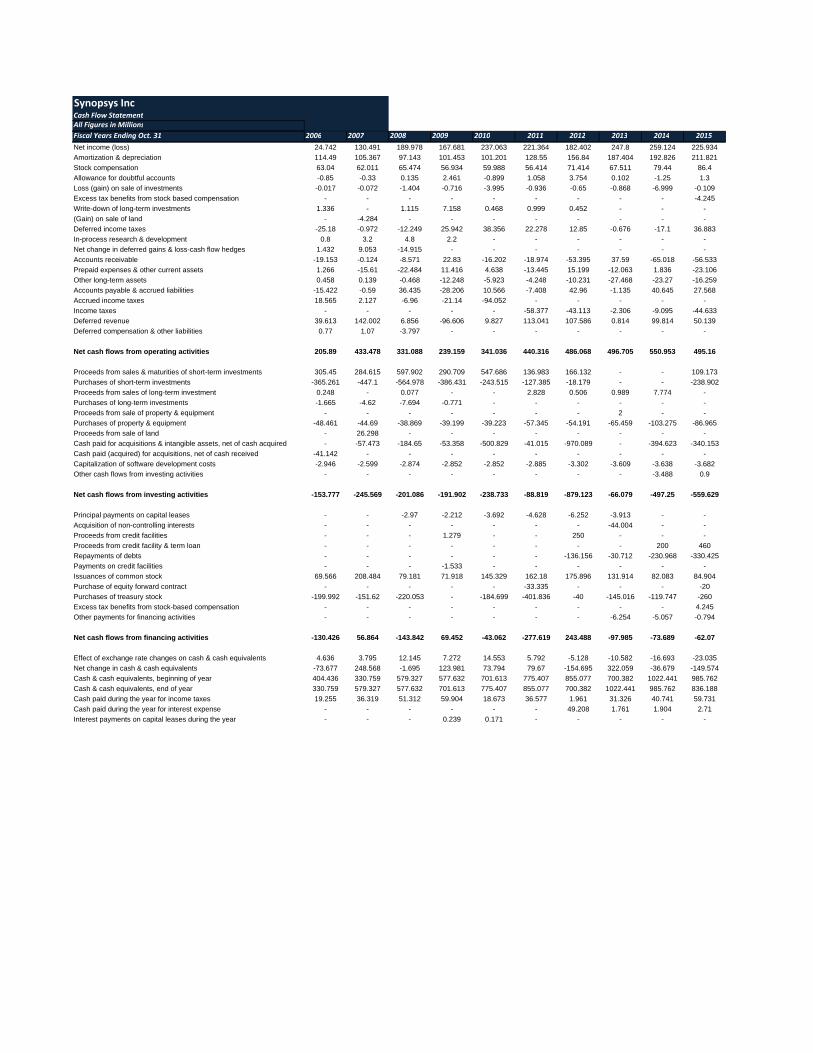
Synopsys IncCash Flow StatementAll Figures in Millions
Fiscal Years Ending Oct. 31 2006 2007 2008 2009 2010 2011 2012 2013 2014 2015
Net income (loss) 24.742 130.491 189.978 167.681 237.063 221.364 182.402 247.8 259.124 225.934
Amortization & depreciation 114.49 105.367 97.143 101.453 101.201 128.55 156.84 187.404 192.826 211.821
Stock compensation 63.04 62.011 65.474 56.934 59.988 56.414 71.414 67.511 79.44 86.4
Allowance for doubtful accounts -0.85 -0.33 0.135 2.461 -0.899 1.058 3.754 0.102 -1.25 1.3
Loss (gain) on sale of investments -0.017 -0.072 -1.404 -0.716 -3.995 -0.936 -0.65 -0.868 -6.999 -0.109
Excess tax benefits from stock based compensation - - - - - - - - - -4.245
Write-down of long-term investments 1.336 - 1.115 7.158 0.468 0.999 0.452 - - -
(Gain) on sale of land - -4.284 - - - - - - - -
Deferred income taxes -25.18 -0.972 -12.249 25.942 38.356 22.278 12.85 -0.676 -17.1 36.883
In-process research & development 0.8 3.2 4.8 2.2 - - - - - -
Net change in deferred gains & loss-cash flow hedges 1.432 9.053 -14.915 - - - - - - -
Accounts receivable -19.153 -0.124 -8.571 22.83 -16.202 -18.974 -53.395 37.59 -65.018 -56.533
Prepaid expenses & other current assets 1.266 -15.61 -22.484 11.416 4.638 -13.445 15.199 -12.063 1.836 -23.106
Other long-term assets 0.458 0.139 -0.468 -12.248 -5.923 -4.248 -10.231 -27.468 -23.27 -16.259
Accounts payable & accrued liabilities -15.422 -0.59 36.435 -28.206 10.566 -7.408 42.96 -1.135 40.645 27.568
Accrued income taxes 18.565 2.127 -6.96 -21.14 -94.052 - - - - -
Income taxes - - - - - -58.377 -43.113 -2.306 -9.095 -44.633
Deferred revenue 39.613 142.002 6.856 -96.606 9.827 113.041 107.586 0.814 99.814 50.139
Deferred compensation & other liabilities 0.77 1.07 -3.797 - - - - - - -
Net cash flows from operating activities 205.89 433.478 331.088 239.159 341.036 440.316 486.068 496.705 550.953 495.16
Proceeds from sales & maturities of short-term investments 305.45 284.615 597.902 290.709 547.686 136.983 166.132 - - 109.173
Purchases of short-term investments -365.261 -447.1 -564.978 -386.431 -243.515 -127.385 -18.179 - - -238.902
Proceeds from sales of long-term investment 0.248 - 0.077 - - 2.828 0.506 0.989 7.774 -
Purchases of long-term investments -1.665 -4.62 -7.694 -0.771 - - - - - -
Proceeds from sale of property & equipment - - - - - - - 2 - -
Purchases of property & equipment -48.461 -44.69 -38.869 -39.199 -39.223 -57.345 -54.191 -65.459 -103.275 -86.965
Proceeds from sale of land - 26.298 - - - - - - - -
Cash paid for acquisitions & intangible assets, net of cash acquired - -57.473 -184.65 -53.358 -500.829 -41.015 -970.089 - -394.623 -340.153
Cash paid (acquired) for acquisitions, net of cash received -41.142 - - - - - - - - -
Capitalization of software development costs -2.946 -2.599 -2.874 -2.852 -2.852 -2.885 -3.302 -3.609 -3.638 -3.682
Other cash flows from investing activities - - - - - - - - -3.488 0.9
Net cash flows from investing activities -153.777 -245.569 -201.086 -191.902 -238.733 -88.819 -879.123 -66.079 -497.25 -559.629
Principal payments on capital leases - - -2.97 -2.212 -3.692 -4.628 -6.252 -3.913 - -
Acquisition of non-controlling interests - - - - - - - -44.004 - -
Proceeds from credit facilities - - - 1.279 - - 250 - - -
Proceeds from credit facility & term loan - - - - - - - - 200 460
Repayments of debts - - - - - - -136.156 -30.712 -230.968 -330.425
Payments on credit facilities - - - -1.533 - - - - - -
Issuances of common stock 69.566 208.484 79.181 71.918 145.329 162.18 175.896 131.914 82.083 84.904
Purchase of equity forward contract - - - - - -33.335 - - - -20
Purchases of treasury stock -199.992 -151.62 -220.053 - -184.699 -401.836 -40 -145.016 -119.747 -260
Excess tax benefits from stock-based compensation - - - - - - - - - 4.245
Other payments for financing activities - - - - - - - -6.254 -5.057 -0.794
Net cash flows from financing activities -130.426 56.864 -143.842 69.452 -43.062 -277.619 243.488 -97.985 -73.689 -62.07
Effect of exchange rate changes on cash & cash equivalents 4.636 3.795 12.145 7.272 14.553 5.792 -5.128 -10.582 -16.693 -23.035
Net change in cash & cash equivalents -73.677 248.568 -1.695 123.981 73.794 79.67 -154.695 322.059 -36.679 -149.574
Cash & cash equivalents, beginning of year 404.436 330.759 579.327 577.632 701.613 775.407 855.077 700.382 1022.441 985.762
Cash & cash equivalents, end of year 330.759 579.327 577.632 701.613 775.407 855.077 700.382 1022.441 985.762 836.188
Cash paid during the year for income taxes 19.255 36.319 51.312 59.904 18.673 36.577 1.961 31.326 40.741 59.731
Cash paid during the year for interest expense - - - - - - 49.208 1.761 1.904 2.71
Interest payments on capital leases during the year - - - 0.239 0.171 - - - - -

Synopsys IncForecasted Cash Flow Statement
All figures in millionsFiscal Years Ending Oct. 31 2016E 2017E 2018E 2019E 2020E
Cash flow from operations:Net Income (loss) 263.71 311.02 347.36 380.12 407.00Add Depreciation 17.23 21.27 25.61 30.30 35.38Add Amortization 136.73 126.95 124.18 126.05 131.10Changes : Accounts receivable, net -8.78 -30.16 -33.43 -33.63 -30.10Deferred income taxes 26.33 -12.32 -9.46 -8.53 -7.00Income taxes receivable & prepaid taxes -0.63 -8.50 -6.53 -5.88 -4.83Prepaid expenses & other current assets 1.16 -5.37 -5.96 -5.99 -5.36Long-term prepaid taxes -7.78 -4.76 -3.65 -3.29 -2.70Long-term deferred income taxes 49.59 -23.20 -17.82 -16.07 -13.18Other long-term assets -20.49 -22.75 -25.25 -28.03 -31.11Accounts payable & accrued liabilities 49.69 33.27 36.88 37.10 33.21Accrued income taxes -5.42 2.54 1.95 1.76 1.44Deferred revenue 68.93 79.29 87.90 88.42 79.14Long term accrued income taxes -10.47 4.90 3.76 3.39 2.78Long-term deferred revenue 5.95 7.61 8.44 8.49 7.60Total other long-term liabilities 22.22 24.67 27.38 30.39 33.74Net Cash flow from operating activities 587.99 504.47 561.36 604.59 637.11
Cash flow from investing:Changes:Short-term investments -0.86 -0.87 -0.87 -0.88 -0.89Property & equipment, gross -78.88 -87.56 -97.19 -107.88 -119.75Goodwill 0.00 0.00 0.00 0.00 0.00Intangible assets, Gross -110.72 -119.58 -129.15 -139.48 -150.64Short-term debt -205.00 0.00 0.00 0.00 0.00Accumulated other comprehensive income (loss) 0.00 0.00 0.00 0.00 0.00Net Cash flow from investing -395.47 -208.01 -227.21 -248.24 -271.27
Cash flow from financing:ESPP 130.61 130.61 130.61 130.61 130.61 Treasury stock, at cost , Net of ESPP -200.00 -200.00 -200.00 -200.00 -200.00Net cash flow from financing -69.39 -69.39 -69.39 -69.39 -69.39
Change in cash 123.13 227.07 264.76 286.96 296.44
Beginning Cash 836.19 959.32 1186.39 1451.14 1738.10Ending Cash 959.32 1186.39 1451.14 1738.10 2034.55

Synopsys IncCommon Size Income StatementAll Figures in Millions
Fiscal Years Ending Oct. 31 2013 2014 2015 2016E 2017E 2018E 2019E 2020E
Time-based license revenue 81.51% 82.58% 79.93% 79.93% 79.93% 79.93% 79.93% 79.93%
Upfront license revenue 6.73% 6.60% 8.80% 8.80% 8.80% 8.80% 8.80% 8.80%
Maintenance & service revenue 11.76% 10.82% 11.27% 11.27% 11.27% 11.27% 11.27% 11.27%
Total revenue 100.00% 100.00% 100.00% 100.00% 100.00% 100.00% 100.00% 100.00%
Cost of license revenue 13.70% 13.04% 13.54% 13.54% 13.54% 13.54% 13.54% 13.54%
Cost of maintenance & service 4.09% 4.24% 4.69% 4.69% 4.69% 4.69% 4.69% 4.69%
Amortization of intangible assets 5.32% 4.92% 4.91% 4.61% 3.97% 3.60% 3.41% 3.34%
Total cost of revenue 23.11% 22.21% 23.14% 22.84% 22.21% 21.84% 21.64% 21.57%
Gross margin 76.89% 77.79% 76.86% 77.16% 77.79% 78.16% 78.36% 78.43%
Research & development 34.10% 34.93% 34.62% 34.55% 34.55% 34.55% 34.55% 34.55%
Sales & marketing expenses 21.71% 22.02% 21.16% 21.63% 21.63% 21.63% 21.63% 21.63%
General & administrative expenses 7.33% 7.54% 7.36% 7.41% 7.41% 7.41% 7.41% 7.41%
In-process research & development 0.00% 0.00% 0.00% 0.00% 0.00% 0.00% 0.00% 0.00%
Amortization of intangible assets 1.18% 1.21% 1.16% 1.13% 0.97% 0.88% 0.83% 0.82%
Restructuring charges 0.00% 0.00% 0.67% 0.00% 0.00% 0.00% 0.00% 0.00%
Total operating expenses 64.32% 65.71% 64.97% 64.72% 64.57% 64.48% 64.43% 64.41%
Operating income (loss) 12.56% 12.09% 11.88% 12.44% 13.23% 13.69% 13.93% 14.02%
Interest income 0.10% 0.06% 0.12% 0.11% 0.12% 0.13% 0.15% 0.17%
Interest expense 0.09% 0.09% 0.13% 0.41% 0.00% 0.00% 0.00% 0.00%
Gain (loss) on sale of investment, net 0.00% 0.00% 0.00% 0.00% 0.00% 0.00% 0.00% 0.00%
Gain (loss) on assets related to deferred compensation plan 0.94% 0.53% 0.17% 0.36% 0.37% 0.39% 0.40% 0.42%
Foreign currency exchange gain (loss) 0.31% 0.06% 0.28% 0.00% 0.00% 0.00% 0.00% 0.00%
Other income (expense) 0.23% 0.58% 0.23% 0.24% 0.25% 0.25% 0.26% 0.27%
Total other income (expense), net 1.49% 1.14% 0.68% 0.31% 0.74% 0.77% 0.81% 0.86%
Income (loss) before provision (benefit) for income tax 14.05% 13.23% 12.56% 12.75% 13.96% 14.46% 14.74% 14.87%
Provision (benefit) for income taxes 1.42% 0.63% 2.48% 1.69% 1.85% 1.91% 1.95% 1.97%
Net income (loss) 12.63% 12.59% 10.08% 11.06% 12.12% 12.54% 12.79% 12.90%
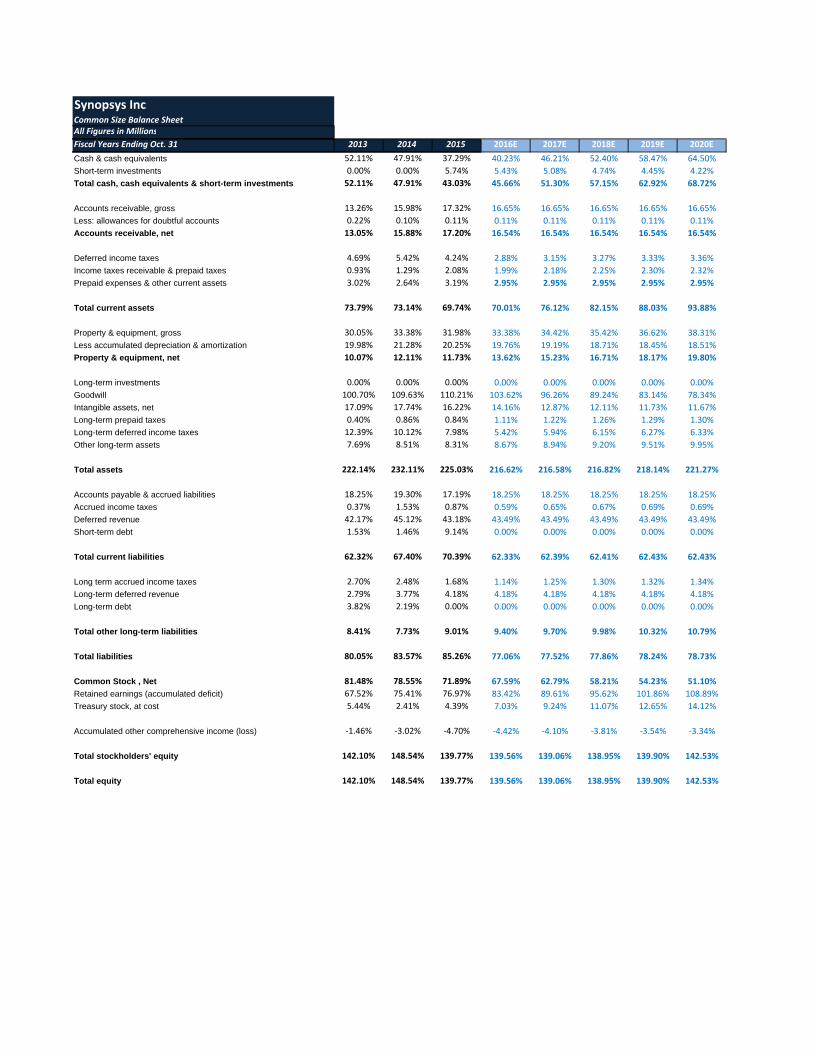
Synopsys IncCommon Size Balance SheetAll Figures in Millions
Fiscal Years Ending Oct. 31 2013 2014 2015 2016E 2017E 2018E 2019E 2020E
Cash & cash equivalents 52.11% 47.91% 37.29% 40.23% 46.21% 52.40% 58.47% 64.50%
Short-term investments 0.00% 0.00% 5.74% 5.43% 5.08% 4.74% 4.45% 4.22%
Total cash, cash equivalents & short-term investments 52.11% 47.91% 43.03% 45.66% 51.30% 57.15% 62.92% 68.72%
Accounts receivable, gross 13.26% 15.98% 17.32% 16.65% 16.65% 16.65% 16.65% 16.65%
Less: allowances for doubtful accounts 0.22% 0.10% 0.11% 0.11% 0.11% 0.11% 0.11% 0.11%
Accounts receivable, net 13.05% 15.88% 17.20% 16.54% 16.54% 16.54% 16.54% 16.54%
Deferred income taxes 4.69% 5.42% 4.24% 2.88% 3.15% 3.27% 3.33% 3.36%
Income taxes receivable & prepaid taxes 0.93% 1.29% 2.08% 1.99% 2.18% 2.25% 2.30% 2.32%
Prepaid expenses & other current assets 3.02% 2.64% 3.19% 2.95% 2.95% 2.95% 2.95% 2.95%
Total current assets 73.79% 73.14% 69.74% 70.01% 76.12% 82.15% 88.03% 93.88%
Property & equipment, gross 30.05% 33.38% 31.98% 33.38% 34.42% 35.42% 36.62% 38.31%
Less accumulated depreciation & amortization 19.98% 21.28% 20.25% 19.76% 19.19% 18.71% 18.45% 18.51%
Property & equipment, net 10.07% 12.11% 11.73% 13.62% 15.23% 16.71% 18.17% 19.80%
Long-term investments 0.00% 0.00% 0.00% 0.00% 0.00% 0.00% 0.00% 0.00%
Goodwill 100.70% 109.63% 110.21% 103.62% 96.26% 89.24% 83.14% 78.34%
Intangible assets, net 17.09% 17.74% 16.22% 14.16% 12.87% 12.11% 11.73% 11.67%
Long-term prepaid taxes 0.40% 0.86% 0.84% 1.11% 1.22% 1.26% 1.29% 1.30%
Long-term deferred income taxes 12.39% 10.12% 7.98% 5.42% 5.94% 6.15% 6.27% 6.33%
Other long-term assets 7.69% 8.51% 8.31% 8.67% 8.94% 9.20% 9.51% 9.95%
Total assets 222.14% 232.11% 225.03% 216.62% 216.58% 216.82% 218.14% 221.27%
Accounts payable & accrued liabilities 18.25% 19.30% 17.19% 18.25% 18.25% 18.25% 18.25% 18.25%
Accrued income taxes 0.37% 1.53% 0.87% 0.59% 0.65% 0.67% 0.69% 0.69%
Deferred revenue 42.17% 45.12% 43.18% 43.49% 43.49% 43.49% 43.49% 43.49%
Short-term debt 1.53% 1.46% 9.14% 0.00% 0.00% 0.00% 0.00% 0.00%
Total current liabilities 62.32% 67.40% 70.39% 62.33% 62.39% 62.41% 62.43% 62.43%
Long term accrued income taxes 2.70% 2.48% 1.68% 1.14% 1.25% 1.30% 1.32% 1.34%
Long-term deferred revenue 2.79% 3.77% 4.18% 4.18% 4.18% 4.18% 4.18% 4.18%
Long-term debt 3.82% 2.19% 0.00% 0.00% 0.00% 0.00% 0.00% 0.00%
Total other long-term liabilities 8.41% 7.73% 9.01% 9.40% 9.70% 9.98% 10.32% 10.79%
Total liabilities 80.05% 83.57% 85.26% 77.06% 77.52% 77.86% 78.24% 78.73%
Common Stock , Net 81.48% 78.55% 71.89% 67.59% 62.79% 58.21% 54.23% 51.10%
Retained earnings (accumulated deficit) 67.52% 75.41% 76.97% 83.42% 89.61% 95.62% 101.86% 108.89%
Treasury stock, at cost 5.44% 2.41% 4.39% 7.03% 9.24% 11.07% 12.65% 14.12%
Accumulated other comprehensive income (loss) ‐1.46% ‐3.02% ‐4.70% ‐4.42% ‐4.10% ‐3.81% ‐3.54% ‐3.34%
Total stockholders' equity 142.10% 148.54% 139.77% 139.56% 139.06% 138.95% 139.90% 142.53%
Total equity 142.10% 148.54% 139.77% 139.56% 139.06% 138.95% 139.90% 142.53%
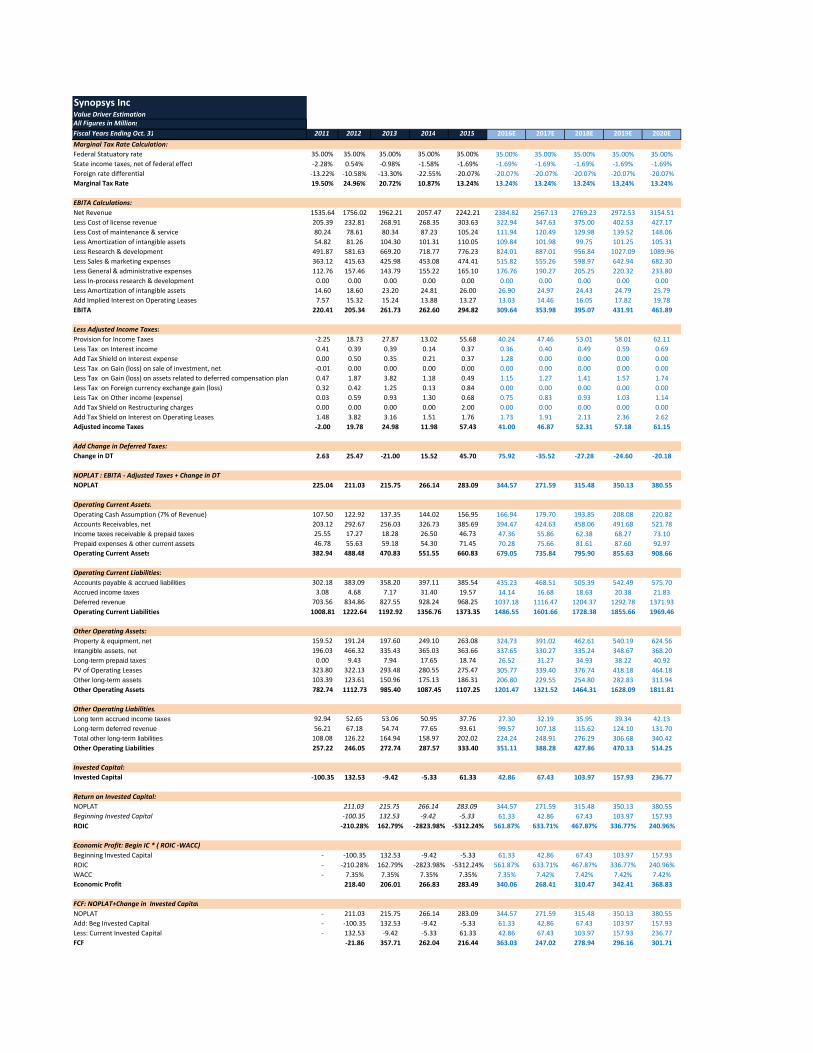
Synopsys IncValue Driver EstimationAll Figures in Millions
Fiscal Years Ending Oct. 31 2011 2012 2013 2014 2015 2016E 2017E 2018E 2019E 2020E
Marginal Tax Rate Calculation:
Federal Statuatory rate 35.00% 35.00% 35.00% 35.00% 35.00% 35.00% 35.00% 35.00% 35.00% 35.00%
State income taxes, net of federal effect ‐2.28% 0.54% ‐0.98% ‐1.58% ‐1.69% ‐1.69% ‐1.69% ‐1.69% ‐1.69% ‐1.69%
Foreign rate differential ‐13.22% ‐10.58% ‐13.30% ‐22.55% ‐20.07% ‐20.07% ‐20.07% ‐20.07% ‐20.07% ‐20.07%
Marginal Tax Rate 19.50% 24.96% 20.72% 10.87% 13.24% 13.24% 13.24% 13.24% 13.24% 13.24%
EBITA Calculations:
Net Revenue 1535.64 1756.02 1962.21 2057.47 2242.21 2384.82 2567.13 2769.23 2972.53 3154.51
Less Cost of license revenue 205.39 232.81 268.91 268.35 303.63 322.94 347.63 375.00 402.53 427.17
Less Cost of maintenance & service 80.24 78.61 80.34 87.23 105.24 111.94 120.49 129.98 139.52 148.06
Less Amortization of intangible assets 54.82 81.26 104.30 101.31 110.05 109.84 101.98 99.75 101.25 105.31
Less Research & development 491.87 581.63 669.20 718.77 776.23 824.01 887.01 956.84 1027.09 1089.96
Less Sales & marketing expenses 363.12 415.63 425.98 453.08 474.41 515.82 555.26 598.97 642.94 682.30
Less General & administrative expenses 112.76 157.46 143.79 155.22 165.10 176.76 190.27 205.25 220.32 233.80
Less In‐process research & development 0.00 0.00 0.00 0.00 0.00 0.00 0.00 0.00 0.00 0.00
Less Amortization of intangible assets 14.60 18.60 23.20 24.81 26.00 26.90 24.97 24.43 24.79 25.79
Add Implied Interest on Operating Leases 7.57 15.32 15.24 13.88 13.27 13.03 14.46 16.05 17.82 19.78
EBITA 220.41 205.34 261.73 262.60 294.82 309.64 353.98 395.07 431.91 461.89
Less Adjusted Income Taxes:
Provision for Income Taxes ‐2.25 18.73 27.87 13.02 55.68 40.24 47.46 53.01 58.01 62.11
Less Tax on Interest income 0.41 0.39 0.39 0.14 0.37 0.36 0.40 0.49 0.59 0.69
Add Tax Shield on Interest expense 0.00 0.50 0.35 0.21 0.37 1.28 0.00 0.00 0.00 0.00
Less Tax on Gain (loss) on sale of investment, net ‐0.01 0.00 0.00 0.00 0.00 0.00 0.00 0.00 0.00 0.00
Less Tax on Gain (loss) on assets related to deferred compensation plan 0.47 1.87 3.82 1.18 0.49 1.15 1.27 1.41 1.57 1.74
Less Tax on Foreign currency exchange gain (loss) 0.32 0.42 1.25 0.13 0.84 0.00 0.00 0.00 0.00 0.00
Less Tax on Other income (expense) 0.03 0.59 0.93 1.30 0.68 0.75 0.83 0.93 1.03 1.14
Add Tax Shield on Restructuring charges 0.00 0.00 0.00 0.00 2.00 0.00 0.00 0.00 0.00 0.00
Add Tax Shield on Interest on Operating Leases 1.48 3.82 3.16 1.51 1.76 1.73 1.91 2.13 2.36 2.62
Adjusted income Taxes ‐2.00 19.78 24.98 11.98 57.43 41.00 46.87 52.31 57.18 61.15
Add Change in Deferred Taxes:
Change in DT 2.63 25.47 ‐21.00 15.52 45.70 75.92 ‐35.52 ‐27.28 ‐24.60 ‐20.18
NOPLAT : EBITA ‐ Adjusted Taxes + Change in DT
NOPLAT 225.04 211.03 215.75 266.14 283.09 344.57 271.59 315.48 350.13 380.55
Operating Current Assets:
Operating Cash Assumption (7% of Revenue) 107.50 122.92 137.35 144.02 156.95 166.94 179.70 193.85 208.08 220.82
Accounts Receivables, net 203.12 292.67 256.03 326.73 385.69 394.47 424.63 458.06 491.68 521.78
Income taxes receivable & prepaid taxes 25.55 17.27 18.28 26.50 46.73 47.36 55.86 62.38 68.27 73.10
Prepaid expenses & other current assets 46.78 55.63 59.18 54.30 71.45 70.28 75.66 81.61 87.60 92.97
Operating Current Assets 382.94 488.48 470.83 551.55 660.83 679.05 735.84 795.90 855.63 908.66
Operating Current Liabilities:
Accounts payable & accrued liabilities 302.18 383.09 358.20 397.11 385.54 435.23 468.51 505.39 542.49 575.70
Accrued income taxes 3.08 4.68 7.17 31.40 19.57 14.14 16.68 18.63 20.38 21.83
Deferred revenue 703.56 834.86 827.55 928.24 968.25 1037.18 1116.47 1204.37 1292.78 1371.93
Operating Current Liabilities 1008.81 1222.64 1192.92 1356.76 1373.35 1486.55 1601.66 1728.38 1855.66 1969.46
Other Operating Assets:
Property & equipment, net 159.52 191.24 197.60 249.10 263.08 324.73 391.02 462.61 540.19 624.56
Intangible assets, net 196.03 466.32 335.43 365.03 363.66 337.65 330.27 335.24 348.67 368.20
Long-term prepaid taxes 0.00 9.43 7.94 17.65 18.74 26.52 31.27 34.93 38.22 40.92
PV of Operating Leases 323.80 322.13 293.48 280.55 275.47 305.77 339.40 376.74 418.18 464.18
Other long-term assets 103.39 123.61 150.96 175.13 186.31 206.80 229.55 254.80 282.83 313.94
Other Operating Assets 782.74 1112.73 985.40 1087.45 1107.25 1201.47 1321.52 1464.31 1628.09 1811.81
Other Operating Liabilities:
Long term accrued income taxes 92.94 52.65 53.06 50.95 37.76 27.30 32.19 35.95 39.34 42.13
Long-term deferred revenue 56.21 67.18 54.74 77.65 93.61 99.57 107.18 115.62 124.10 131.70
Total other long-term liabilities 108.08 126.22 164.94 158.97 202.02 224.24 248.91 276.29 306.68 340.42
Other Operating Liabilities 257.22 246.05 272.74 287.57 333.40 351.11 388.28 427.86 470.13 514.25
Invested Capital:
Invested Capital ‐100.35 132.53 ‐9.42 ‐5.33 61.33 42.86 67.43 103.97 157.93 236.77
Return on Invested Capital:
NOPLAT 211.03 215.75 266.14 283.09 344.57 271.59 315.48 350.13 380.55
Beginning Invested Capital ‐100.35 132.53 ‐9.42 ‐5.33 61.33 42.86 67.43 103.97 157.93
ROIC ‐210.28% 162.79% ‐2823.98% ‐5312.24% 561.87% 633.71% 467.87% 336.77% 240.96%
Economic Profit: Begin IC * ( ROIC ‐WACC)
Beginning Invested Capital ‐ ‐100.35 132.53 ‐9.42 ‐5.33 61.33 42.86 67.43 103.97 157.93
ROIC ‐ ‐210.28% 162.79% ‐2823.98% ‐5312.24% 561.87% 633.71% 467.87% 336.77% 240.96%
WACC ‐ 7.35% 7.35% 7.35% 7.35% 7.35% 7.42% 7.42% 7.42% 7.42%
Economic Profit 218.40 206.01 266.83 283.49 340.06 268.41 310.47 342.41 368.83
FCF: NOPLAT+Change in Invested Capital
NOPLAT ‐ 211.03 215.75 266.14 283.09 344.57 271.59 315.48 350.13 380.55
Add: Beg Invested Capital ‐ ‐100.35 132.53 ‐9.42 ‐5.33 61.33 42.86 67.43 103.97 157.93
Less: Current Invested Capital ‐ 132.53 ‐9.42 ‐5.33 61.33 42.86 67.43 103.97 157.93 236.77
FCF ‐21.86 357.71 262.04 216.44 363.03 247.02 278.94 296.16 301.71
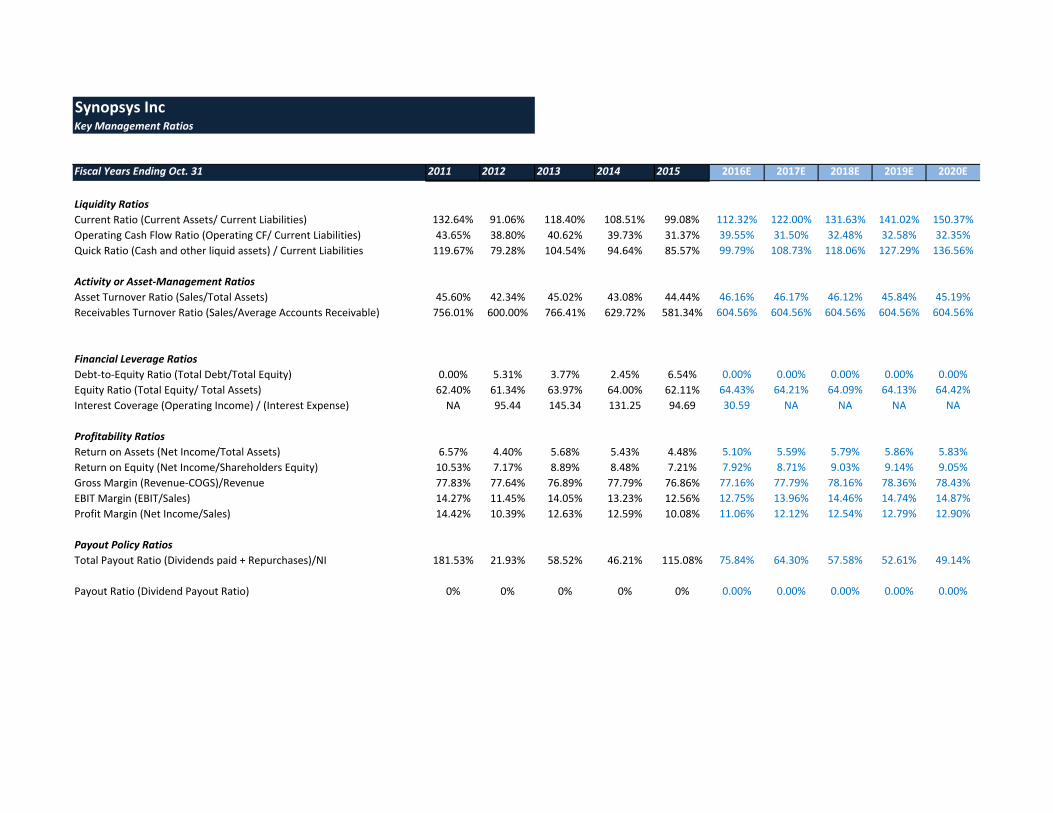
Synopsys IncKey Management Ratios
Fiscal Years Ending Oct. 31 2011 2012 2013 2014 2015 2016E 2017E 2018E 2019E 2020E
Liquidity Ratios
Current Ratio (Current Assets/ Current Liabilities) 132.64% 91.06% 118.40% 108.51% 99.08% 112.32% 122.00% 131.63% 141.02% 150.37%
Operating Cash Flow Ratio (Operating CF/ Current Liabilities) 43.65% 38.80% 40.62% 39.73% 31.37% 39.55% 31.50% 32.48% 32.58% 32.35%
Quick Ratio (Cash and other liquid assets) / Current Liabilities 119.67% 79.28% 104.54% 94.64% 85.57% 99.79% 108.73% 118.06% 127.29% 136.56%
Activity or Asset‐Management Ratios
Asset Turnover Ratio (Sales/Total Assets) 45.60% 42.34% 45.02% 43.08% 44.44% 46.16% 46.17% 46.12% 45.84% 45.19%
Receivables Turnover Ratio (Sales/Average Accounts Receivable) 756.01% 600.00% 766.41% 629.72% 581.34% 604.56% 604.56% 604.56% 604.56% 604.56%
Financial Leverage Ratios
Debt‐to‐Equity Ratio (Total Debt/Total Equity) 0.00% 5.31% 3.77% 2.45% 6.54% 0.00% 0.00% 0.00% 0.00% 0.00%
Equity Ratio (Total Equity/ Total Assets) 62.40% 61.34% 63.97% 64.00% 62.11% 64.43% 64.21% 64.09% 64.13% 64.42%
Interest Coverage (Operating Income) / (Interest Expense) NA 95.44 145.34 131.25 94.69 30.59 NA NA NA NA
Profitability Ratios
Return on Assets (Net Income/Total Assets) 6.57% 4.40% 5.68% 5.43% 4.48% 5.10% 5.59% 5.79% 5.86% 5.83%
Return on Equity (Net Income/Shareholders Equity) 10.53% 7.17% 8.89% 8.48% 7.21% 7.92% 8.71% 9.03% 9.14% 9.05%
Gross Margin (Revenue‐COGS)/Revenue 77.83% 77.64% 76.89% 77.79% 76.86% 77.16% 77.79% 78.16% 78.36% 78.43%
EBIT Margin (EBIT/Sales) 14.27% 11.45% 14.05% 13.23% 12.56% 12.75% 13.96% 14.46% 14.74% 14.87%
Profit Margin (Net Income/Sales) 14.42% 10.39% 12.63% 12.59% 10.08% 11.06% 12.12% 12.54% 12.79% 12.90%
Payout Policy Ratios
181.53% 21.93% 58.52% 46.21% 115.08% 75.84% 64.30% 57.58% 52.61% 49.14%
Payout Ratio (Dividend Payout Ratio) 0% 0% 0% 0% 0% 0.00% 0.00% 0.00% 0.00% 0.00%
Total Payout Ratio (Dividends paid + Repurchases)/NI

Weighted Average Cost of Capital (WACC) Estimation
Marginal Tax Rate 13.24%
Cost of equity Calculation
Risk Free Rate 2.73% (30 Yr Treasury Note)
+
Beta* 0.97
Market Risk Premium 5.00%
= Cost of Equity 7.56%
WACC Calculation (till 2016)
Shares outstanding* 155.157
MV of share 48.24
=Total MV of Equity [E] 7484.77
MV of Term Loan [DT] 45.00
MV of Revolver Loan [DR] 160.00
MV of Long Term debt [DL] 275.47 (Only Operating Leases)
Cost of Term Loan 4.73% Assuming Long Term cost of Debt
Cost of Revolver Loan 4.73% Assuming Long Term cost of Debt
Cost of Long Term Debt 4.73%
MV of equity 7484.77
+
MV of debt 480.47
= MV of the firm [V] 7965.24
Cost of Equity * 7.56%
(E/V) 93.97%
+
Cost of Term Loan 4.73%
(1‐Marginal tax Rate) 86.76%
(DL/V) 0.56%
+
Cost of Revolver Loan 4.73%
(1‐Marginal tax Rate) 86.76%
(DR/V) 2.01%
+
Cost of Long Term Debt 4.73%
(1‐Marginal tax Rate) 86.76%
(DL/V) 3.46%
= WACC 7.35%
WACC Calculation (post 2016)
Shares outstanding* 154.908
MV of share 48.24
=Total MV of Equity [E] 7472.78
MV of Term Loan [DT] 0.00
MV of Revolver Loan [DR] 0.00
MV of Long Term debt [DL] 305.77 (Only Operating Leases)
Cost of Term Loan 2.36%
Cost of Revolver Loan 2.23%
Cost of Long Term Debt 4.73%
MV of equity 7472.78
+
MV of debt 305.77
= MV of the firm [V] 7778.55
Cost of Equity * 7.56%
(E/V) 96.07%
+
Cost of Term Loan 2.36%
(1‐Marginal tax Rate) 86.76%
(DL/V) 0.00%
+
Cost of Revolver Loan 2.23%
(1‐Marginal tax Rate) 86.76%
(DR/V) 0.00%
+
Cost of Long Term Debt 4.73%
(1‐Marginal tax Rate) 86.76%
(DL/V) 3.93%
= WACC 7.42%
Synopsys Inc
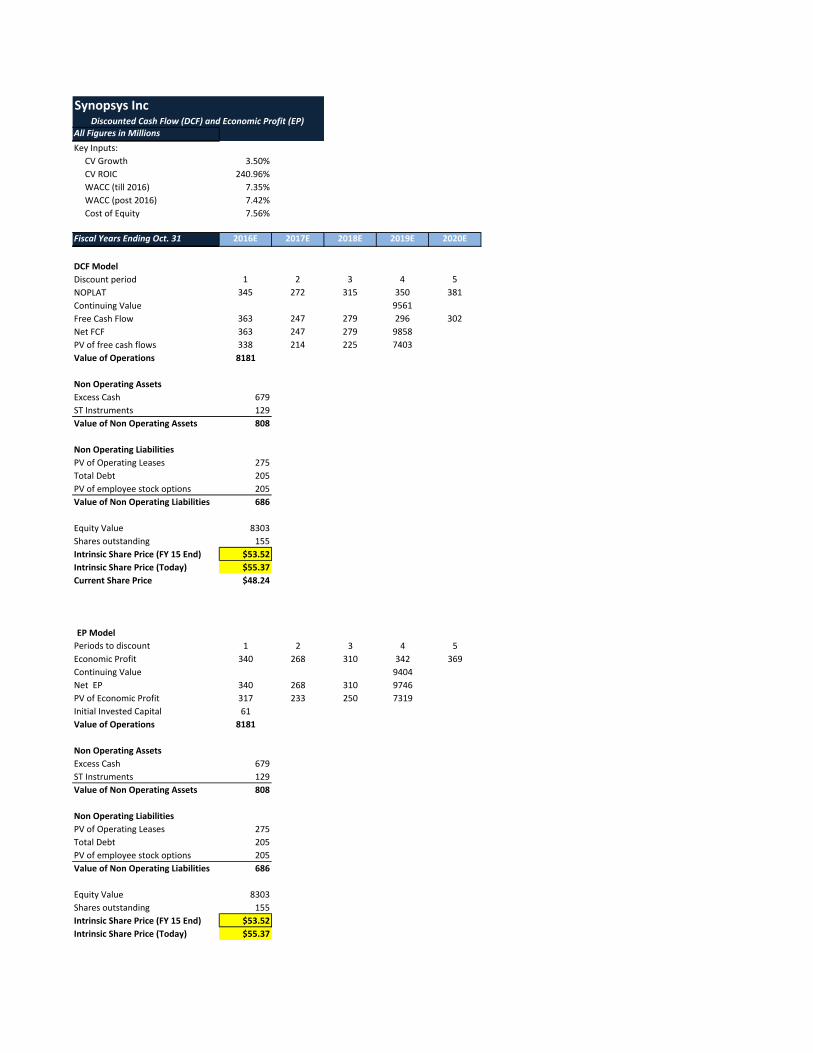
Synopsys Inc
All Figures in Millions
Key Inputs:
CV Growth 3.50%
CV ROIC 240.96%
WACC (till 2016) 7.35%
WACC (post 2016) 7.42%
Cost of Equity 7.56%
Fiscal Years Ending Oct. 31 2016E 2017E 2018E 2019E 2020E
DCF Model
Discount period 1 2 3 4 5
NOPLAT 345 272 315 350 381
Continuing Value 9561
Free Cash Flow 363 247 279 296 302
Net FCF 363 247 279 9858
PV of free cash flows 338 214 225 7403
Value of Operations 8181
Non Operating Assets
Excess Cash 679
ST Instruments 129
Value of Non Operating Assets 808
Non Operating Liabilities
PV of Operating Leases 275
Total Debt 205
PV of employee stock options 205
Value of Non Operating Liabilities 686
Equity Value 8303
Shares outstanding 155
Intrinsic Share Price (FY 15 End) $53.52
Intrinsic Share Price (Today) $55.37
Current Share Price $48.24
EP Model
Periods to discount 1 2 3 4 5
Economic Profit 340 268 310 342 369
Continuing Value 9404
Net EP 340 268 310 9746
PV of Economic Profit 317 233 250 7319
Initial Invested Capital 61
Value of Operations 8181
Non Operating Assets
Excess Cash 679
ST Instruments 129
Value of Non Operating Assets 808
Non Operating Liabilities
PV of Operating Leases 275
Total Debt 205
PV of employee stock options 205
Value of Non Operating Liabilities 686
Equity Value 8303
Shares outstanding 155
Intrinsic Share Price (FY 15 End) $53.52
Intrinsic Share Price (Today) $55.37
Discounted Cash Flow (DCF) and Economic Profit (EP)

Synopsys Inc
Fiscal Years Ending Oct. 31 2016E 2017E 2018E 2019E 2020E
EPS 1.70 2.01 2.24 2.44 2.61
Key Assumptions
CV growth 3.50%
CV ROE 9.05%
Cost of Equity 7.56%
Future Cash Flows
P/E Multiple (CV Year) 15.11
EPS (CV Year) 2.61
Future Stock Price 39.37
Dividends Per Share 0.00 0.00 0.00 0.00 0.00
Future Cash Flows 0.00 0.00 0.00 39.37
Discounted Cash Flows 0.00 0.00 0.00 29.42
Intrinsic Value 29.42
Intrinsic Share Price (Today) 30.44
Dividend Discount Model (DDM) or Fundamental P/E
Valuation Model

Relative Valuation ModelsPeer Comparison
EPS EPSTicker Company Price 2016E 2017E P/E 16 P/E 17
MENT Mentor Grpahics Corp $20.10 $1.68 $1.84 12.0 10.9
CDNS Cadence Design Systems, Inc $23.41 $1.21 $1.34 19.3 17.5
ARMH ARM Holdings $44.06 $1.49 $1.68 29.6 26.2 Average 20.3 18.2
SNPS Synopsys Inc $48.24 $1.70 $2.01 28.4 24.0
Implied Value:
Relative P/E (EPS16) $ 34.52
Relative P/E (EPS16) 36.55$
Industy Comparison
EPS EPSTicker Company Price 2016E 2017E P/E 16 P/E 17
MENT Mentor Grpahics Corp $20.10 $1.68 $1.84 12.0 10.9
CDNS Cadence Design Systems, Inc $23.41 $1.21 $1.34 19.3 17.5
ARMH ARM Holdings $44.06 $1.49 $1.68 29.6 26.2
ANSS Ansys, Inc $87.67 $3.60 $3.95 24.4 22.2
ADSK Autodesk,Inc $56.76 ($0.72) $0.08 (78.8) 709.5 Not including Autodesk as the P/E ratios will be skewedAverage 21.3 19.2
SNPS Synopsys Inc $48.24 $1.70 $2.01 28.4 24.0
Implied Value:
Relative P/E (EPS16) $ 36.25
Relative P/E (EPS17) 38.55$
Synopsys Inc
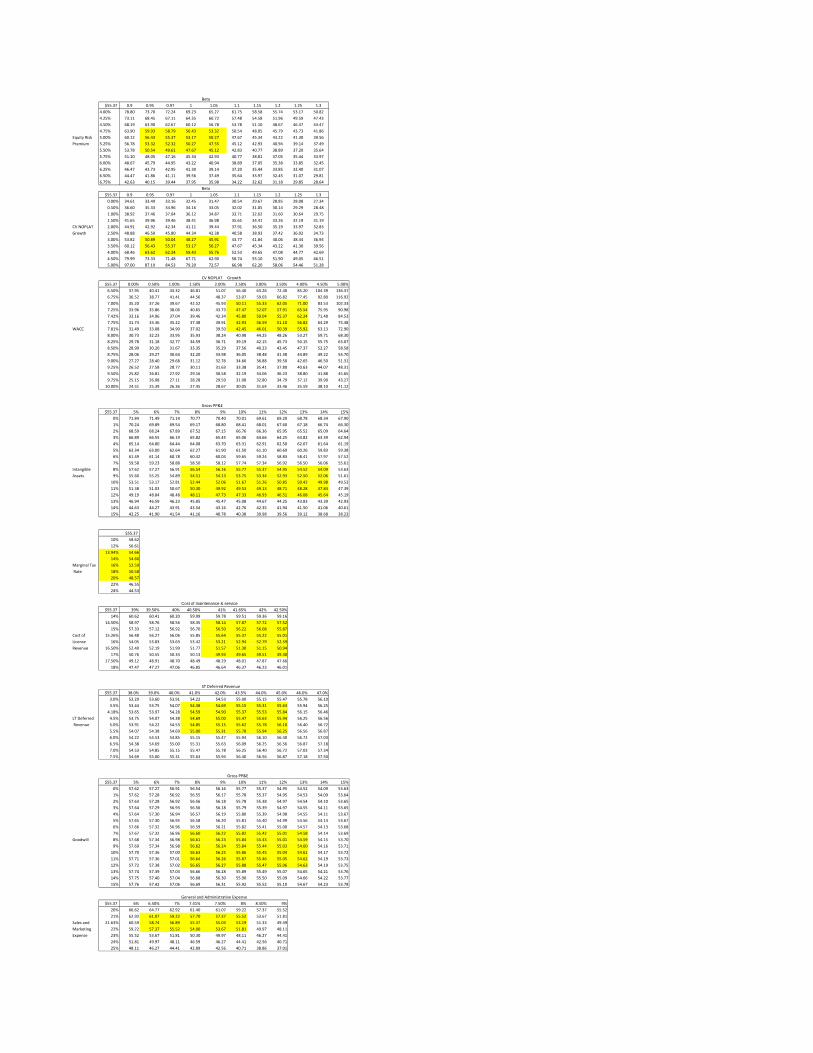
Beta
$55.37 0.9 0.95 0.97 1 1.05 1.1 1.15 1.2 1.25 1.3
4.00% 78.80 73.70 72.24 69.23 65.27 61.75 58.58 55.74 53.17 50.82
4.25% 73.11 68.45 67.11 64.35 60.72 57.48 54.58 51.96 49.59 47.43
4.50% 68.19 63.90 62.67 60.12 56.78 53.78 51.10 48.67 46.47 44.47
4.75% 63.90 59.93 58.79 56.43 53.32 50.54 48.05 45.79 43.73 41.86
Equity Risk 5.00% 60.12 56.43 55.37 53.17 50.27 47.67 45.34 43.22 41.30 39.56
Premium 5.25% 56.78 53.32 52.32 50.27 47.55 45.12 42.93 40.94 39.14 37.49
5.50% 53.78 50.54 49.61 47.67 45.12 42.83 40.77 38.89 37.20 35.64
5.75% 51.10 48.05 47.16 45.34 42.93 40.77 38.81 37.05 35.44 33.97
6.00% 48.67 45.79 44.95 43.22 40.94 38.89 37.05 35.38 33.85 32.45
6.25% 46.47 43.73 42.95 41.30 39.14 37.20 35.44 33.85 32.40 31.07
6.50% 44.47 41.86 41.11 39.56 37.49 35.64 33.97 32.45 31.07 29.81
6.75% 42.63 40.15 39.44 37.95 35.98 34.22 32.62 31.18 29.85 28.64
Beta
$55.37 0.9 0.95 0.97 1 1.05 1.1 1.15 1.2 1.25 1.3
0.00% 34.61 33.49 33.16 32.45 31.47 30.54 29.67 28.85 28.08 27.34
0.50% 36.60 35.33 34.96 34.16 33.05 32.02 31.05 30.14 29.29 28.48
1.00% 38.92 37.46 37.04 36.12 34.87 33.71 32.62 31.60 30.64 29.75
1.50% 41.65 39.96 39.46 38.41 36.98 35.65 34.41 33.26 32.19 31.19
CV NOPLAT 2.00% 44.91 42.92 42.34 41.11 39.44 37.91 36.50 35.19 33.97 32.83
Growth 2.50% 48.88 46.50 45.80 44.34 42.38 40.58 38.93 37.42 36.02 34.73
3.00% 53.82 50.89 50.04 48.27 45.91 43.77 41.84 40.06 38.44 36.94
3.50% 60.12 56.43 55.37 53.17 50.27 47.67 45.34 43.22 41.30 39.56
4.00% 68.46 63.62 62.24 59.43 55.76 52.53 49.65 47.08 44.77 42.69
4.50% 79.99 73.33 71.48 67.71 62.90 58.74 55.10 51.90 49.05 46.51
5.00% 97.00 87.19 84.53 79.20 72.57 66.98 62.20 58.06 54.46 51.28
CV NOPLAT Growth
$55.37 0.00% 0.50% 1.00% 1.50% 2.00% 2.50% 3.00% 3.50% 4.00% 4.50% 5.00%
6.50% 37.95 40.41 43.32 46.81 51.07 56.40 63.26 72.40 85.20 104.39 136.37
6.75% 36.52 38.77 41.41 44.56 48.37 53.07 59.03 66.82 77.45 92.80 116.92
7.00% 35.20 37.26 39.67 42.52 45.93 50.11 55.33 62.05 71.00 83.53 102.33
7.25% 33.96 35.86 38.06 40.65 43.73 47.47 52.07 57.91 65.54 75.95 90.98
7.42% 33.16 34.96 37.04 39.46 42.34 45.80 50.04 55.37 62.24 71.48 84.53
7.75% 31.74 33.36 35.22 37.38 39.91 42.93 46.59 51.10 56.82 64.29 74.48
WACC 7.81% 31.49 33.08 34.90 37.02 39.50 42.45 46.01 50.39 55.92 63.13 72.90
8.00% 30.73 32.23 33.95 35.93 38.24 40.98 44.25 48.26 53.27 59.71 68.30
8.25% 29.78 31.18 32.77 34.59 36.71 39.19 42.15 45.73 50.15 55.75 63.07
8.50% 28.90 30.20 31.67 33.35 35.29 37.56 40.23 43.45 47.37 52.27 58.58
8.75% 28.06 29.27 30.64 32.20 33.98 36.05 38.48 41.38 44.89 49.22 54.70
9.00% 27.27 28.40 29.68 31.12 32.76 34.66 36.88 39.50 42.65 46.50 51.31
9.25% 26.52 27.58 28.77 30.11 31.63 33.38 35.41 37.80 40.63 44.07 48.31
9.50% 25.82 26.81 27.92 29.16 30.58 32.19 34.06 36.23 38.80 41.88 45.65
9.75% 25.15 26.08 27.11 28.28 29.59 31.08 32.80 34.79 37.12 39.90 43.27
10.00% 24.51 25.39 26.36 27.45 28.67 30.05 31.64 33.46 35.59 38.10 41.12
Gross PP&E
$55.37 5% 6% 7% 8% 9% 10% 11% 12% 13% 14% 15%
0% 71.84 71.49 71.14 70.77 70.40 70.01 69.61 69.20 68.78 68.34 67.90
1% 70.24 69.89 69.54 69.17 68.80 68.41 68.01 67.60 67.18 66.74 66.30
2% 68.59 68.24 67.89 67.52 67.15 66.76 66.36 65.95 65.52 65.09 64.64
3% 66.89 66.55 66.19 65.82 65.45 65.06 64.66 64.25 63.82 63.39 62.94
4% 65.14 64.80 64.44 64.08 63.70 63.31 62.91 62.50 62.07 61.64 61.19
5% 63.34 63.00 62.64 62.27 61.90 61.50 61.10 60.69 60.26 59.83 59.38
6% 61.49 61.14 60.78 60.42 60.04 59.65 59.24 58.83 58.41 57.97 57.52
7% 59.58 59.23 58.88 58.50 58.12 57.74 57.34 56.92 56.50 56.06 55.61
Intangible 8% 57.62 57.27 56.91 56.54 56.16 55.77 55.37 54.95 54.52 54.09 53.63
Assets 9% 55.60 55.25 54.89 54.51 54.13 53.75 53.34 52.93 52.50 52.06 51.61
10% 53.51 53.17 52.81 52.44 52.06 51.67 51.26 50.85 50.42 49.98 49.53
11% 51.38 51.03 50.67 50.30 49.92 49.53 49.13 48.71 48.28 47.84 47.39
12% 49.19 48.84 48.48 48.11 47.73 47.33 46.93 46.51 46.08 45.64 45.19
13% 46.94 46.59 46.23 45.85 45.47 45.08 44.67 44.25 43.83 43.39 42.93
14% 44.63 44.27 43.91 43.54 43.16 42.76 42.35 41.94 41.50 41.06 40.61
15% 42.25 41.90 41.54 41.16 40.78 40.38 39.98 39.56 39.12 38.68 38.23
$55.37
10% 58.62
12% 56.61
13.94% 54.66
14% 54.60
Marginal Tax 16% 52.59
Rate 18% 50.58
20% 48.57
22% 46.55
24% 44.53
Cost of maintenance & service
$55.37 39% 39.50% 40% 40.50% 41% 41.65% 42% 42.50%
14% 60.62 60.41 60.20 59.99 59.78 59.51 59.36 59.16
14.50% 58.97 58.76 58.56 58.35 58.14 57.87 57.72 57.52
15% 57.33 57.12 56.92 56.70 56.50 56.22 56.08 55.87
Cost of 15.26% 56.48 56.27 56.06 55.85 55.64 55.37 55.22 55.01
License 16% 54.05 53.83 53.63 53.42 53.21 52.94 52.79 52.59
Revenue 16.50% 52.40 52.19 51.99 51.77 51.57 51.30 51.15 50.94
17% 50.76 50.55 50.34 50.13 49.93 49.65 49.51 49.30
17.50% 49.12 48.91 48.70 48.49 48.29 48.01 47.87 47.66
18% 47.47 47.27 47.06 46.85 46.64 46.37 46.23 46.01
ST Deferred Revenue
$55.37 38.0% 39.0% 40.0% 41.0% 42.0% 43.5% 44.0% 45.0% 46.0% 47.0%
3.0% 53.29 53.60 53.91 54.22 54.53 55.00 55.15 55.47 55.78 56.10
3.5% 53.44 53.75 54.07 54.38 54.69 55.15 55.31 55.63 55.94 56.25
4.18% 53.65 53.97 54.28 54.59 54.90 55.37 55.53 55.84 56.15 56.46
LT Deferred 4.5% 53.75 54.07 54.38 54.69 55.00 55.47 55.63 55.94 56.25 56.56
Revenue 5.0% 53.91 54.22 54.53 54.85 55.15 55.62 55.78 56.10 56.40 56.72
5.5% 54.07 54.38 54.69 55.00 55.31 55.78 55.94 56.25 56.56 56.87
6.0% 54.22 54.53 54.85 55.15 55.47 55.94 56.10 56.40 56.72 57.03
6.5% 54.38 54.69 55.00 55.31 55.63 56.09 56.25 56.56 56.87 57.18
7.0% 54.53 54.85 55.15 55.47 55.78 56.25 56.40 56.72 57.03 57.34
7.5% 54.69 55.00 55.31 55.63 55.94 56.40 56.56 56.87 57.18 57.50
Gross PP&E
$55.37 5% 6% 7% 8% 9% 10% 11% 12% 13% 14% 15%
0% 57.62 57.27 56.91 56.54 56.16 55.77 55.37 54.95 54.52 54.09 53.63
1% 57.62 57.28 56.92 56.55 56.17 55.78 55.37 54.95 54.53 54.09 53.64
2% 57.63 57.28 56.92 56.56 56.18 55.78 55.38 54.97 54.54 54.10 53.65
3% 57.64 57.29 56.93 56.56 56.18 55.79 55.39 54.97 54.55 54.11 53.65
4% 57.64 57.30 56.94 56.57 56.19 55.80 55.39 54.98 54.55 54.11 53.67
5% 57.65 57.30 56.95 56.58 56.20 55.81 55.40 54.99 54.56 54.13 53.67
6% 57.66 57.32 56.96 56.59 56.21 55.82 55.41 55.00 54.57 54.13 53.68
7% 57.67 57.32 56.96 56.60 56.22 55.82 55.42 55.01 54.58 54.14 53.69
Goodwill 8% 57.68 57.34 56.98 56.61 56.23 55.84 55.43 55.01 54.59 54.15 53.70
9% 57.69 57.34 56.98 56.62 56.24 55.84 55.44 55.03 54.60 54.16 53.71
10% 57.70 57.36 57.00 56.63 56.25 55.86 55.45 55.04 54.61 54.17 53.72
11% 57.71 57.36 57.01 56.64 56.26 55.87 55.46 55.05 54.62 54.19 53.73
12% 57.72 57.38 57.02 56.65 56.27 55.88 55.47 55.06 54.63 54.19 53.75
13% 57.74 57.39 57.03 56.66 56.28 55.89 55.49 55.07 54.65 54.21 53.76
14% 57.75 57.40 57.04 56.68 56.30 55.90 55.50 55.09 54.66 54.22 53.77
15% 57.76 57.42 57.06 56.69 56.31 55.92 55.52 55.10 54.67 54.23 53.78
General and Administrative Expense
$55.37 6% 6.50% 7% 7.41% 7.50% 8% 8.50% 9%
20% 66.62 64.77 62.92 61.40 61.07 59.22 57.37 55.52
21% 62.92 61.07 59.22 57.70 57.37 55.52 53.67 51.81
Sales and 21.63% 60.59 58.74 56.89 55.37 55.03 53.19 51.33 49.49
Marketing 22% 59.22 57.37 55.52 54.00 53.67 51.81 49.97 48.11
Expense 23% 55.52 53.67 51.81 50.30 49.97 48.11 46.27 44.41
24% 51.81 49.97 48.11 46.59 46.27 44.41 42.56 40.71
25% 48.11 46.27 44.41 42.89 42.56 40.71 38.86 37.01

Present Value of Operating Lease Obligations (2015) Present Value of Operating Lease Obligations (2014) Present Value of Operating Lease Obligations (2013) Present Value of Operating Lease Obligations (2012)
Operating Operating Operating Operating
Fiscal Years Ending Oct. 31 Leases Fiscal Years Ending Oct. 31 Leases Fiscal Years Ending Oct. 31 Leases Fiscal Years Ending Oct. 31 Leases
2016 49.687 2015 38.887 2014 45.615 2013 43.686
2017 45.632 2016 39.278 2015 34.523 2014 43.222
2018 38.859 2017 35.073 2016 34.055 2015 32.184
2019 33.29 2018 29.406 2017 30.922 2016 32.04
2020 23.262 2019 28.736 2018 28.008 2017 29.674
Thereafter 160.299 Thereafter 195.048 Thereafter 215.939 Thereafter 254.254
Total Minimum Payments 351.029 Total Minimum Payments 366.428 Total Minimum Payments 389.062 Total Minimum Payments 435.06
Less: Interest 76 Less: Interest 86 Less: Interest 96 Less: Interest 113
PV of Minimum Payments 275 PV of Minimum Payments 281 PV of Minimum Payments 293 PV of Minimum Payments 322
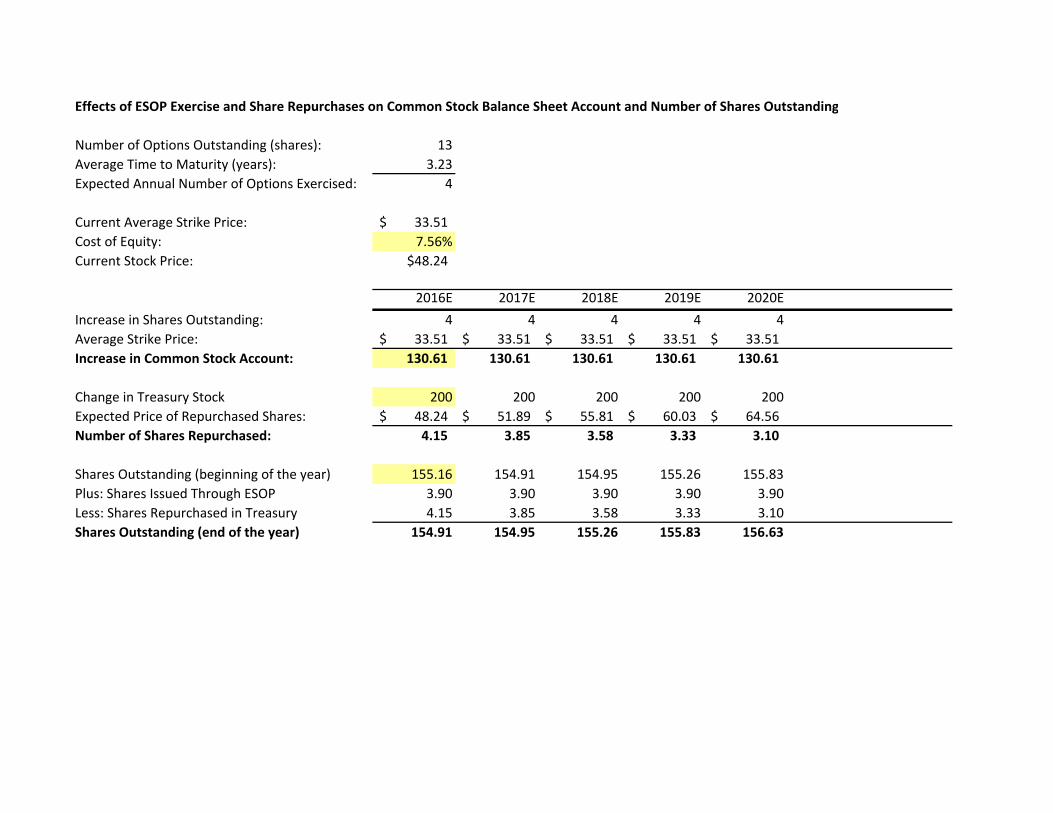
Effects of ESOP Exercise and Share Repurchases on Common Stock Balance Sheet Account and Number of Shares Outstanding
Number of Options Outstanding (shares): 13
Average Time to Maturity (years): 3.23
Expected Annual Number of Options Exercised: 4
Current Average Strike Price: 33.51$
Cost of Equity: 7.56%
Current Stock Price: $48.24
2016E 2017E 2018E 2019E 2020E
Increase in Shares Outstanding: 4 4 4 4 4
Average Strike Price: 33.51$ 33.51$ 33.51$ 33.51$ 33.51$
Increase in Common Stock Account: 130.61 130.61 130.61 130.61 130.61
Change in Treasury Stock 200 200 200 200 200
Expected Price of Repurchased Shares: 48.24$ 51.89$ 55.81$ 60.03$ 64.56$
Number of Shares Repurchased: 4.15 3.85 3.58 3.33 3.10
Shares Outstanding (beginning of the year) 155.16 154.91 154.95 155.26 155.83
Plus: Shares Issued Through ESOP 3.90 3.90 3.90 3.90 3.90
Less: Shares Repurchased in Treasury 4.15 3.85 3.58 3.33 3.10
Shares Outstanding (end of the year) 154.91 154.95 155.26 155.83 156.63
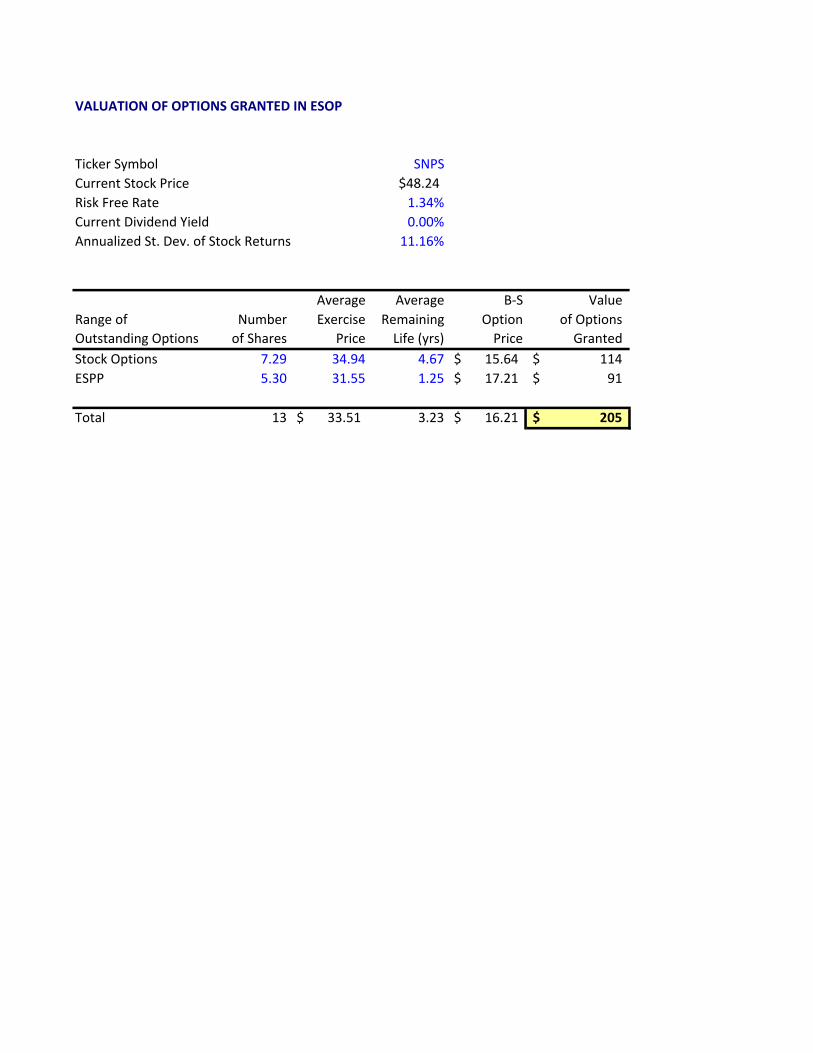
VALUATION OF OPTIONS GRANTED IN ESOP
Ticker Symbol SNPS
Current Stock Price $48.24
Risk Free Rate 1.34%
Current Dividend Yield 0.00%
Annualized St. Dev. of Stock Returns 11.16%
Average Average B‐S Value
Range of Number Exercise Remaining Option of Options
Outstanding Options of Shares Price Life (yrs) Price Granted
Stock Options 7.29 34.94 4.67 15.64$ 114$
ESPP 5.30 31.55 1.25 17.21$ 91$
Total 13 33.51$ 3.23 16.21$ 205$