title of research: frequency and prognostic …
TRANSCRIPT

i
TITLE OF RESEARCH: FREQUENCY AND PROGNOSTIC SIGNIFICANCE OF
ABNORMAL ELECTROENCEPHALOGRAPHIC FINDINGS IN ACUTE STROKE
PATIENTS AT THE UNIVERSITY COLLEGE HOSPITAL, IBADAN.
NAME OF INVESTIGATOR: DR. LUQMAN, OPEOLUWA OGUNJIMI (MBChB)
<[email protected]> 07032683222
NAMES OF SUPERVISORS: PROF. A. OGUNNIYI (FMCP, FWACP)
PROF. M.O. OWOLABI (FMCP)
TRAINING INSTITUTION: UNIVERSITY COLLEGE HOSPITAL IBADAN, OYO
STATE
PURPOSE OF RESEARCH: PARTIAL FULFILMENT OF THE REQUIREMENTS
FOR THE AWARD OF THE FELLOWSHIP OF THE
MEDICAL COLLEGE OF PHYSICIANS
(NEUROLOGY)
DATE OF PASSING PART 1: NOVEMBER, 2012
MAY, 2017

ii
DECLARATION
I hereby declare that this research work is original unless otherwise acknowledged. The work has
neither been presented to any college for an award nor has it been submitted elsewhere for
publication.
------------------------------------ -----------------------------
DR L. O. OGUNJIMI DATE

iii
CERTIFICATION
We attest that the information herewith contained is true and original research carried out under
our supervision by Dr. L. O. OGUNJIMI in partial fulfillment of requirements for the award of the
Fellowship of the National Postgraduate Medical College of Nigeria in Internal Medicine
(Neurology).
______________________________ ______________________
Professor A. OGUNNIYI Date Professor of Medicine/ Consultant
Department of Medicine
University College Hospital
Ibadan
______________________________ ______________________
Professor. M.O. OWOLABI Date Consultant Neurologist
Department of Medicine
University College Hospital
Ibadan

iv
ATTESTATION
I certify that the research work was carried out by DR L.O. OGUNJIMI in the Department of
Medicine, University College Hospital, Ibadan, under the supervision of PROF. A. OGUNNIYI
and PROF. M.O. OWOLABI.
NAME: --------------------------------------------
SIGNATURE: ________________________________
DESIGNATION: HEAD OF DEPARTMENT
DATE: ____________________________________

v
ACKNOWLEDGEMENTS
My immense gratitude goes to the Creator, God Almighty for enabling me to execute this project.
To my mentor, father and teacher Prof A. Ogunniyi, I am grateful to you for the indispensable
support and professional guidance you gave me from the initiation into Neurology to the
completion of this research. The fatherly role you have played during my training has contributed
profoundly to my progress, only God Almighty can reward you and I will always remain grateful
to you sir.
I also wish to appreciate all my teachers including Dr. O.S.A. Oluwole, Prof. M.O. Owolabi, and
Dr Akinyemi for painstakingly teaching me Neurology, as well as all consultants in the Department
of Medicine for their contributions to my knowledge base and skills acquired. I also wish to
appreciate all my colleagues within and outside Neurology Unit (Dr. T. Lola Taiwo, Dr. S.O.
Ekanem, Dr. Temitope Farombi, Dr. P. Olowoyo and Dr. A. Makanjuola) for their support and
team spirit in learning and management of patients. To Dr. Joseph Yaria, I cannot but appreciate
you for your very presence in my time of need, for your patience and resourcefulness. To my
lovely and beautiful wife, Bisi, how could I have gone this far without you? I thank you for your
support, understanding and patience with me while I executed this research, you are my sunshine.
To my kids Wafeeqah and Faheezah, thank you for motivating daddy to complete this study and
for bearing with my absence during my training.
To all my well-wishers, thank you and God bless you!

vi
TABLE OF CONTENTS
Page
Title Page……………………..….……………………………………………………………….… i
Declaration Page………………………………………….………………………………………… ii
Certification Page….………………………………………….……………………………………. iii
Attestation Page……………………………………………………………………………………. iv
Acknowledgement………………………………………………………………………………….. v
Table of Contents……………………………………………..…………………………………… vi
List of Tables……………………………………………………………………………………… vii
List of Figures……………………………………………………………………………………... viii
List of Abbreviations……………………………………………………………………………… ix
Summary……………………………………………………………..…………………………….. x
CHAPTER ONE
Introduction………….…………………………….…….………….………………………………. 1
Rationale …………………………………………….……….………..…….................................... 3
Aim and Objectives…………………………………..…….……………………………………… 4
CHAPTER TWO
Literature Review…………………………………….……...……………………………………… 5
CHAPTER THREE
Methodology………………..……………………….…….………………....................................... 22
Data Collection And Analysis……………………….…………….……………………………….. 27
Ethical Consideration…………………………………….…..……….............................................. 27
CHAPTER FOUR
Results…………………………………………………………………….……………………….. 31
CHAPTER FIVE
Discussion……………………………………………………………………................................... 65
CHAPTER SIX
Conclusion…………………………………………………………………………………………. 76
Recommendation…………………………………………………………………………………… 76
Limitations of The Study……………………………………………….......................................... 77
References………………………………………………….…………...….................................... 78
Appendix I (Ethical Approval) ………………………….……………............................................ 89
Appendix II (Informed Consent) …………………………..…………............................................. 90
Appendix III (Study Questionnaire) ….……....…….……...……….……………………………... 92
Appendix IV (NIHSS)…………………………....…………………..……..……………………… 98
Appendix V (MRS)……………………………………………………………................................. 100
Appendix VI (SLS)……………………………………………………….………………................ 101
Appendix VII (Barthel Index) ……………………………………..….............................................. 102
Appendix VIII (Figures And Values) ………………………………..…………………………….. 103
Appendix IX (Positive Predictive Values, Negative Predictive Value, Sensitivity, Specificity)….. 106

vii
LIST OF TABLES
Pages
Table1: Socio-Demographic Characteristics of Participants……………………. 32
Table 2: Comparison of Baseline EEG Findings in Stroke Patients Controls………. 38
Table 3: Epileptiform Pattern in Cases and Controls………………………………. 39
Table 4: Clinical Characteristics Associated with Outcome of Stroke……………. 44
Table 5: Case Fatality Rate In Acute Stroke ……………………………………….. 45
Table 6: Relationship Between Special Patterns and Early Onset Seizures……….. 64

viii
LIST OF FIGURES
Pages
Figure 1A: Frequencies of The Risk Factors For Stroke…..………................................................................. 33
Figure 1B: Proportion of Stroke Type Among Particitpants……..................................................................... 34
Figure 2A: Ischaemic Stroke Phenotyping Using OCSP…………….……………………………………….. 36
Figure 2B: Ischaemic Stroke Phenotyping Using Trial of ORG 10172 In Acute Stroke Treatment (Toast)…. 36
Figure 3: Showing Background Rhythm Among Stroke Patients.………………..………………………….. 40
Figure 4: Showing Pattern of EEG Waves From Admission To 30 Days………..………………………….. 41
Figure 5: Showing Epileptiform Pattern Among Stroke Patients…………………………………………….. 42
Figure 6: Showing Effect of Slowing on Outcomes Among Ischaemic Stroke Patients………..…………… 47
Figure 7: Showing Effect of Slowing on Outcomes Among Haemorrhagic Stroke Patients .……………… 49
Figure 8: Showing Trend of Predictive Values of Slowing Among Stroke Patient……………………...….. 51
Figure 9: Showing Effect of Alpha Rhythm In Outcomes Among Ischaemic Stroke Patients ………..……. 53
Figure 10: Showing Effect of Alpha on Outcomes Among Haemorrhagic Stroke Patients ………………… 55
Figure 11: Showing Trend of Predictive Values Of Alpha Rhythm Among Stroke Patients……………..…. 57
Figure 12: Showing Effect of Beta on Outcomes Among Ischaemic Stroke Patients …………………….. 58
Figure 13: Effect of Outcomes Among Haemorrhagic Stroke Patients……………..………………………. 59
Figure 14: Trend of Predictive Values of Beta Rhythm Among Stroke Patients…………………..……....... 61
Figure 15: Showing Trend of Seizure from Presentation To 30 Days………………………………………. 62
Figure 16: Showing Relationship Between EEG Wave Pattern and Trend of Seizure from
Presentation To 14 Days............................................................................................................... 63

ix
LIST OF ABBREVIATIONS
ASPECTS – Alberta, Stroke Program Early Computerized Tomograph
ATP – Adenosine Triphosphate
BI – Barthel Index
CBF – Cerebral Blood Flow
CFR – Case Fatality Rate
CT - Computerized Tomography
DWI – Diffusion Weighted Imaging
EEG – Electroencephalography
GOS – Glasgow Outcome Scale
HDL – High-Density Lipoprotein
ICA – Internal Carotid Artery
IDF – International Diabetes Federation
LACI – Lacunar Infarct
LDL – Low-Density Lipoprotein
MCA – Middle Cerebral Artery
MRI - Magnetic resonance imaging
MRS – Modified Rankin Scale
NIHSS - National Institute of Health Stroke Scale
NMDA - N-methyl-D-aspartate receptor
NPV- Negative Predictive Value
OSCP – Oxfordshire Community Stroke Project
PACI – Partial Anterior Circulation Infarct
PCV – Packed Cell Volume
PET – Positron Emission Tomograph
PLED – Periodic Lateralizing Epileptiform Discharges
PPV- Positive Predictive Value
POCI – Posterior Circulation Infarct
RAWOD – Regional Attenuation Without Delta
SLS – Stroke Levity Score
TACI – Total Anterior Circulation Infarct
TOAST - Trial of ORG 10172 in Acute Stroke Treatment
UCH – University College Hospital
WHO – World Health Organization

x
SUMMARY
BACKGROUND:
Stroke is a leading cause of morbidity and mortality in adults in the productive ages that contribute
to the work force of the society. Prevention, early detection, continuous and emergent monitoring
of cerebral physiological activities and aggressive intervention to treat may reduce the
unacceptably high mortality rate of stroke in our environment. Electroencephalography’s (EEG)
close correlation with cerebral metabolism and its ability to detect brief transient alterations in
cortical function make are indicators to its possible usefulness. The aim of the study is to determine
the frequency and prognostic role of abnormal electroecenphalograhic patterns and its relationship
with early onset seizures in acute stroke
METHODOLOGY:
Adult patients with acute stroke who presented to the University College Hospital and who met
the inclusion criteria were recruited consecutively after obtaining written informed consent.
Cranial computerized tomography was done for all cases recruited within 72 hours of stroke onset.
Ischaemic stroke was defined by brain CT scan (normal brain CT scan or recent infarct in the
clinically relevant area on scan performed within 3 days or 72 hours of stroke onset). Trial of ORG
10172 in Acute Stroke Treatment (TOAST) classification was used in phenotyping of ischaemic
stroke into large vessel atherosclerosis, cardioembolic, lacunar and undetermined. Stroke severity
was determined using the National Institutes of Health Stroke Scale (NIHSS) and patients’
functional outcomes were assessed at 72hours, 14days and 30 days using Modified Rankin Scale
(MRS). EEG was obtained in all cases and repeated at 72 hours, 7 days, 14 days and 30 days.
Epileptiform patterns were defined as focal spikes, focal sharps, sharps with accompanying slow
waves and spikes with accompanying slow waves. Pearson chi square test was used to assess
association between stroke characteristics, stroke type, EEG characteristics and stroke severity.

xi
The positive predictive and negative predictive values of EEG in determining stroke outcome were
calculated.
RESULTS: One Hundred and sixty participants were recruited into this study comprising eighty
consecutive stroke patients and eighty controls which were adequately matched for age and sex.
The cases recruited were 39 males (48.8%) and 41 females (51.2%) with mean age was 57.6 ±
14.6, while controls had equal numbers of male and females with mean age of 54.9 ± 12.6.
Background alpha rhythms and beta rhythm were more common in controls than in cases, while
delta rhythm and theta rhythm were seen more in cases than controls. Among the stroke patients,
alpha and beta background rhythm were on increase, while delta and theta rhythm decreased in the
course of 30-day monitoring. Among ischeamic stroke patients that had good outcome, presence
of slowing was on decline from 87.1% at presentation to 66.7% at 30days but there was only
marginal decline from 83.3% to 71.4% among ischeamic stroke cases with poor outcome. Alpha
rhythm was seen more in those with good outcome (Ischaemic 29.6%, haemorrhagic 37.5%)
compared to those with poor outcome (Ischaemic 14.3%, haemorrhagic 37.5%) at day 30
respectively. Beta rhythm was seen more in those with poor outcome (Ischaemic 42.5%,
haemorrhagic 25%) compared to those with good outcome (Ischaemic 33.3%, haemorrhagic
20%)at day 30 respectively. The positive predictive value (PPV) of slowing decreased marginally,
while that of alpha wave decreased by 50% from presentation till 30days. The PPV of Beta wave
increased from 0.14% to 0.17 % (Ischaemic), 0.33% to 0.4% (haemorrhagic) thus, predictive of
poor outcome. The negative predictive value of slowing, alpha wave and beta wave was on linear
increase from presentation to 30days. Epileptiform discharges were observed only in 31.6% of
cases at presentation, 32.9% at 72hrs, 62.7% at 7days, 57.9% after 14 days and in 44.4% at day
30.

xii
CONCLUSION: Alpha and beta rhythm increased while delta and theta rhythm decreased in the
course of 30-day monitoring. The PPV of alpha wave and slowing was maximal at presentation
and decreased within 30days. The PPV of beta wave increased marginally, thus predictive of poor
outcome. The NPV of alpha wave and beta wave in predicting poor outcome was increased from
presentation to 30days. The presence of alpha rhythm excluded poor outcome and predicted good
outcome while beta rhythm predicted poor outcome but did not exclude good outcome. The
proportion of epileptiform activities seen on EEG were more than the cases of seizures in this
study.

1
CHAPTER ONE
1.0 INTRODUCTION
Stroke can be defined as rapidly developing signs of focal or global disturbance of cerebral or
intracranial neuronal function with symptoms lasting for more than 24 hours or leading to the death
of the patient with no apparent cause other than that of vascular origin.1 The classic definition is
mainly clinical and does not account for advances in science and technology thus the Stroke
Council of the American Heart Association/American Stroke Association convened a writing
group to develop an expert consensus document for an updated definition of stroke for the 21st
century.2 Based on this, Central Nervous System infarction is now defined as brain, spinal cord,
or retinal cell death attributable to ischemia, based on neuropathological, neuroimaging, and/or
clinical evidence of permanent injury.2
Silent central nervous system infarction defined as imaging or neuropathological evidence of CNS
infarction, without a history of acute neurological dysfunction attributable to the lesion but
ischaemic stroke specifically refers to central nervous system infarction accompanied by overt
symptoms.2
Stroke caused by intracerebral haemorrhage is defined as rapidly developing clinical signs of
neurological dysfunction attributable to a focal collection of blood within the brain parenchyma or
ventricular system that is not caused by trauma, while silent cerebral is regarded as a focal
collection of chronic blood products within the brain parenchyma, subarachnoid space, or
ventricular system on neuroimaging or neuropathological examination that is not caused by trauma
and without a history of acute neurological dysfunction attributable to the lesion.2
Definition of stroke caused by subarachnoid haemorrhage is that of rapidly developing signs of
neurological dysfunction and/or headache because of bleeding into the subarachnoid space (the
space between

2
the arachnoid membrane and the pia mater of the brain or spinal cord), which is not caused by
trauma.2
Definition of stroke caused by cerebral venous thrombosis is that of infarction or in the brain,
spinal cord, or retina because of thrombosis of a cerebral venous structure. Symptoms or signs
caused by reversible edema without infarction or do not qualify as stroke.2
Stroke is the leading cause of neurological disability in adults and also a leading cause of morbidity
and mortality in adults in the productive ages that contribute to the work force of the society.3–5
The outcome following stroke is influenced by several factors such as subtype, severity of stroke,
the predisposing factor(s), associated factors, presence of complications, access to specialist care,
and availability of stroke care facility.6,7
Neuroimaging is mandatory for the avoidance of stroke misdiagnosis and for distinguishing it from
TIAs and stroke mimics (subdural hematoma, brain abscess, and brain tumor).2,8
Computerized Tomography (CT) is very sensitive for identifying acute and is considered the gold
standard; gradient echo and T2 susceptibility-weighted MRI are as sensitive as CT for detection of
acute blood and are more sensitive for identification of prior .9,10
There is evidence that electroencephalography (emergency and continuous) adds value to early
diagnosis, outcome prediction, patient selection for treatment, clinical management, and seizure
detection in acute ischaemic stroke and also vasospasm prediction and detection in subarachnoid
haemorrhage .11–13 Because of its sensitivity to metabolic and ionic disturbances related to
ischemia, electroencephalography potentially is a useful tool for acute stroke detection, monitoring
of the affected tissue and prognosis.14
Iranmanesh in a study done at Taiwan, showed that electroencephalography abnormality was
positively correlated with poor prognosis in patients with ischaemic stroke.15

3
Detection of seizures, confirmation of diagnosis, intraoperative monitoring, prognosis and level of
consciousness are areas of proven usefulness of electroencephalography in the evaluation of acute
stroke.12,13,15–17 Electroencephalography can be altered in response to the presence of seizures or
periodic discharges, changes in intracranial pressure or in the setting of systemic illness, sedatives,
narcotics, temperatures and glucose level.13,18
Several scales have proven reliability and validity in stroke trials, including the National Institutes
of Health Stroke Scale (NIHSS), Modified Rankin scale (MRS), Barthel Index (BI), Glasgow
outcome scale (GOS), and stroke levity scale.19–22 The Stroke Levity Scale showed significant
correlation to the NIHSS, Modified Rankin Scale and Health-Related Quality of Life in Stroke
Patients (HRQOLISP) questionnaire.22
1.1 RATIONALE
Stroke is increasingly contributing to the burden of disease worldwide and becoming a major cause
of death and morbidity in African population.23 Electroencephalography close correlation with
cerebral metabolism and its ability to detect brief transient alterations in cortical functions are
indicators of its possible usefulness. The use of emergency EEG in acute stroke can reveal a
distinctive EEG pattern that may be useful in prediction of functional outcome in acute
stroke.11,12,24 Electroencephalography has been shown to be a reliable marker of the decline in
neuronal integrity associated with a decline in blood flow.14,16 Moreover, there is a paucity of
published data on role of electroencephalography in acute stroke patients in our environment. This
study will be the first of its kind in Nigeria and add to the existing literature on stroke in the country
and globally.

4
1.2 AIM AND OBJECTIVES
1.2.1 General Objective
To determine the frequency and prognostic role of abnormal electroecenphalograhic patterns in
acute stroke at UCH, Ibadan.
1.2.2 Specific Objectives
1. To determine predictive value of electroencephalography wave patterns in acute
ischaemic stroke
2. To determine predictive value of electroencephalography wave patterns in acute
haemorrhagic stroke
3. To determine any relationship between early onset seizures and
electroencephalographic wave patterns in acute stroke.

5
CHAPTER TWO
2.0 LITERATURE REVIEW
2.1 Burden of Stroke
Worldwide, stroke remains a major cause of death, despite advances in its management.23,25,26
_ENREF_38The global estimates of disease burden indicate that over the next two decades,
cerebrovascular disease will continue to rank amongst the top four leading causes of death, even
in low-income countries.1,22,25
Previous reports detailed an increasing incidence but these were hospital-based studies, they could
be inaccurate and probably represent the tip of the iceberg.4,27,28 The current prevalence of stroke
in Africa is 114 to 1000 per 100 000 while the 30-day case fatality rate is as high as 40%.23,28,29
2.2 Prevalence
An earlier door to door rural community-based study of neurological disorders in south-western
Nigeria, conducted by Osuntokun et al at Aiyete, Igboora three decades ago, had stroke prevalence
of 58 per 100 000 reported. A study by same group at Udo, reported prevalence of 68/ 100
000.23,30,31 In a similar door-to-door survey done on a random sample of 60 820 rural Ethiopians,
stroke prevalence was 15 per 100 000 among people aged 28—85 years (crude prevalence 15 per
100 000).23
The largest study of the prevalence of disabling hemiplegic stroke in sub-Saharan Africa was done
in 1994 in the rural Hai district of Tanzania with crude prevalence of 127/100,000 while the age-
standardized (to the Segi world population) prevalence of disability resulting from stroke was 154
per 100 000 in men and 114 per 100 000 in women over 15 years of age.32,33

6
In 2001, the Southern Africa Stroke Prevention Initiative (SASPI) team did a stroke prevalence
study in Agincourt, a rural region in South Africa and reported stroke prevalence rate of 300 per
100,000 in people over the age of 15 years.34
More recently, Danesi et al reported an overall crude prevalence rate of 1.14/1000 in an urban
mixed income community in Lagos Nigeria and concluded that stroke prevalence rates in urban
Nigeria are lower than those in most developed countries, though the lower rates may be related
to lower incidence and higher stroke mortality in developing countries.35 The prevalence of stroke
is less than half that found in high-income regions with age-standardized rates of 114—315 per
100 000 for women and 154—281 per 100 000 for men, but disabling stroke prevalence may be at
least as high as in high-income areas.23 Without community-based incidence studies with follow-
up, determining whether the low prevalence results from low incidence or high case fatality or
both is impossible.
2.3 Incidence
2.3.1 Community-based incidence
Data from Ibadan Stroke Registry, from April 1973 to March 1975 described as first in Africa
reported an incidence rate of 26 per 100,000(13 per 100,000 in females and 25 per 100,000 in
males) and this was the first serious attempt at a community-based incidence study from sub-
Saharan Africa by Osuntokun and colleagues.23,25,36 The Tanzania Stroke Incidence Project (TSIP)
recorded crude incidences in Hai and Dar-es-Salam district of Tanzania as 94.5/100,000 and
107.9/100,000 respectively, the reported age standardized incidence rates to World Health
Organization world population were 108.6 and 315.9/100,000 respectively.
In a recent prospective community-based epidemiological stroke study by Danesi et al in Lagos,
Nigeria, an incidence rate of 25.2 per 100, 000 ( 28.3 per 100 000 in males and 21.3 per 100 000
in females) was reported.37

7
2.3.2 Hospital-based incidence
Most studies of stroke in sub-Saharan Africa are hospital-based. Typically, these studies
documented the proportion of patients admitted to medical and neurology services who had had
strokes38. Hospital admissions for acute stroke were monitored over a twelve-month period by
Rosman in Pretoria, South Africa. Out of a population at risk of 114931, there were 116 cases,
giving an overall incidence of 101 per 100,000 population per year over age twenty23.
Data from all four general hospitals in Harare, Zimbabwe, with a population of 887 768 black
Zimbabweans reported the crude stroke incidence to be 31 per 100 000 per year and when
standardised to the world population, the incidence was 68 per 100 00038.
The frequencies in Nigeria hospital populations varied from 0.9% to 4.0% and stroke accounted
for 0.5% to 45% of neurological admissions.5
The phenomenal increase in the incidence of stroke in Nigerian Africans and in other developing
countries has been described as “the Epidemiologic Transition” from infectious and nutritional
disease burden to diseases related to hypertension, high-fat diets, cigarette smoking, and sedentary
lifestyle6,39.
2.4 RISK FACTORS
Risk factors are divided into those that are modifiable and nonmodifiable.40 Non modifiable risk
factors for stroke include age, sex, race or ethnicity, and heredity.23 Men have greater stroke
incidence than women, although the absolute number of women having a stroke each year is
greater because women live longer than men.41,42 At older ages, the difference in the relative risk
between men and women diminishes.41 Hereditary factors contribute to stroke risk, although
teasing apart risk due to genetic mutations from risk due to shared familial exposures remains
challenging.43 While certain single gene disorders are associated with ischaemic and haemorrhagic
strokes as either a primary phenomenon or as part of a spectrum of illness, most genetic disorders
8
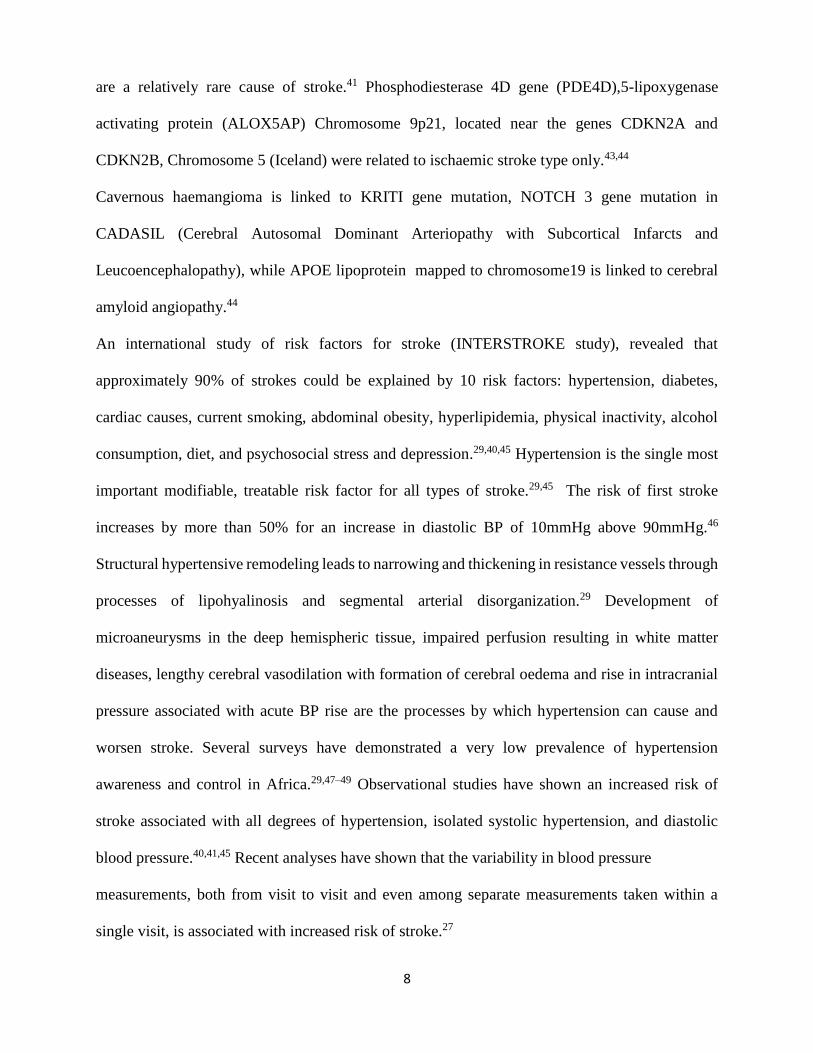
are a relatively rare cause of stroke.41 Phosphodiesterase 4D gene (PDE4D),5-lipoxygenase
activating protein (ALOX5AP) Chromosome 9p21, located near the genes CDKN2A and
CDKN2B, Chromosome 5 (Iceland) were related to ischaemic stroke type only.43,44
Cavernous haemangioma is linked to KRITI gene mutation, NOTCH 3 gene mutation in
CADASIL (Cerebral Autosomal Dominant Arteriopathy with Subcortical Infarcts and
Leucoencephalopathy), while APOE lipoprotein mapped to chromosome19 is linked to cerebral
amyloid angiopathy.44
An international study of risk factors for stroke (INTERSTROKE study), revealed that
approximately 90% of strokes could be explained by 10 risk factors: hypertension, diabetes,
cardiac causes, current smoking, abdominal obesity, hyperlipidemia, physical inactivity, alcohol
consumption, diet, and psychosocial stress and depression.29,40,45 Hypertension is the single most
important modifiable, treatable risk factor for all types of stroke.29,45 The risk of first stroke
increases by more than 50% for an increase in diastolic BP of 10mmHg above 90mmHg.46
Structural hypertensive remodeling leads to narrowing and thickening in resistance vessels through
processes of lipohyalinosis and segmental arterial disorganization.29 Development of
microaneurysms in the deep hemispheric tissue, impaired perfusion resulting in white matter
diseases, lengthy cerebral vasodilation with formation of cerebral oedema and rise in intracranial
pressure associated with acute BP rise are the processes by which hypertension can cause and
worsen stroke. Several surveys have demonstrated a very low prevalence of hypertension
awareness and control in Africa.29,47–49 Observational studies have shown an increased risk of
stroke associated with all degrees of hypertension, isolated systolic hypertension, and diastolic
blood pressure.40,41,45 Recent analyses have shown that the variability in blood pressure
measurements, both from visit to visit and even among separate measurements taken within a
single visit, is associated with increased risk of stroke.27

9
Diabetes has been identified as an independent risk factor for thromboembolic stroke in previous
studies.41 Patients with impaired fasting glucose also have double risk of brain infarction than
people who are nondiabetic.50 Even among those without frank diabetes, insulin resistance appears
to predict risk of first stroke.50 Diabetes causes an increased susceptibility to atherosclerosis and
increased prevalence of atherogenic risk factors such as hypertension, obesity and abnormal
lipids.41,50
According to International Diabetes Federation (IDF), the current estimated prevalence rate of type 2
diabetes in Africa is about 2.8%.29 Currently, there are 10.4 million individuals with diabetes in sub-
Saharan Africa, representing 4.2% of the global population with diabetes.29
There is a significant relationship between total and low density lipoprotein cholesterol and a
protective influence of high density lipoprotein, cholesterol in stroke.41,50 Dyslipidemia has
emerged as an important risk factor in Africa. For example, Norman and colleagues found that
high cholesterol levels (≥ 3.8 mmol/l) accounted for 59% of ischaemic heart disease and 29% of
ischaemic stroke burden in adults aged 30 years and over.51 The prevalence of dyslipidemia,
especially cholesterol has been shown to vary across regions in Africa.51 In a study of healthy
workers in Nigeria, 5% of the study population had hypercholesterolaemia, 23% elevated total
serum cholesterol levels, 51% elevated low-density lipoprotein (LDL) cholesterol levels and 60%
low high-density lipoprotein (HDL) cholesterol levels, with females recording better overall lipid
profiles.50 The effects of lipids probably differ for haemorrhagic and ischaemic strokes, and even
among ischaemic subtypes.41,50 There is a positive relationship between total and low density
lipoprotein cholesterol and a protective influence of high density lipoprotein cholesterol on
extracranial carotid atherosclerosis.41,50

10
Cardiac diseases are a well-recognized cause of embolic cerebral infarction. Certain cardiac
diseases, such as atrial fibrillation (AF), recent myocardial infarction, significant left ventricular
dysfunction with mural thrombus, and valvular heart disease, are proven causes of stroke.41
Others, including patent foramen ovale (PFO), mitral valve strands, aortic arch atheroma, and left
ventricular hypertrophy, have more equivocal epidemiologic evidence.41 Patent foramen ovale has
been recognized as a potential cause of stroke for a long time.45 Many studies have shown
increased prevalence of PFO in patients with cryptogenic stroke compared with controls and those
with strokes of other known causes.41,45
A J-shaped association curve was suggested for the relation of alcohol consumption and ischaemic
stroke while heavy consumption of alcohol increases the risk for brain .41,52–54 Alcohol relationship
with stroke is dose dependent.29 In a meta-analysis of 25 ischaemic stroke studies, 11 intracerebral
and subarachnoid haemorrhage studies. It was demonstrated that light and moderate consumption
of alcohol was associated with lower risk of ischaemic stroke while high and heavy drinking was
associated with high risk.54 Furthermore, in the haemorrhagic stroke subtype light, moderate and
high alcohol consumption were associated with increased risk of intracerebral haemorrhage .54
Reynolds et al demonstrated that consumption of 60grammes of alcohol per day was associated
with increased relative risk of total stroke, while consumption of less than 12grammes or between
12grammes to 24grammes of alcohol per day was associated with a reduced relative risk of
ischaemic stroke.55 A study by Casolla and colleagues demonstrated that heavy alcohol intake
defined as consumption of more than 300grammes in a week was associated with occurrence of
intracerebral haemorrhage at a young age.56

11
2.5 Case fatality
Bamford and associates in a prospective community based study as part of the Oxfordshire
Community Stroke Project reported a case fatality rate (CFR) of 19%.57 The 30 day case fatality
rate for patients with cerebral infarction was 10% (57 of 545), primary intracerebral haemorrhage
was 52% (34 of 66), subarachnoid haemorrhage was 45% (15 of 33) and for those of uncertain
pathological type 74% (23 of 31).57,58 Rosman found a higher case fatality in patients with cerebral
(58%) than in those with ischaemic stroke (22%) but patients who died before they had a CT scan
were assumed to have had an intracerebral haemorrhage, which would have increased the
estimate.59
Community-based case fatality study are rare in sub- Saharan Africa but data from the Ibadan
stroke registry reported a 3-week case fatality of 35% for all stroke and highest for intracerebral
and subarachnoid haemorrhage at 61% and 62% respectively.36 Stroke types, other than
subarachnoid haemorrhage, must have been diagnosed unreliably without CT scanning.
Furthermore, the investigators had great difficulty with follow-up and at 3 months only 76 of 318
patients could be traced36.
A hospital-based study without cranial computed tomograghy done in the Gambia with long-term
follow-up over 4 years to determine case fatality, time to death, and likely causes of death reported
case fatality of 27% and 44% at 1 month and 6 months respectively, and 75% of patients had died
by the final follow-up.60 At the end of follow-up, the cause of death in all patients were the initial
stroke in 61%, further stroke in 7%, infection in 12%, and another vascular cause (hypertensive
encephalopathy) in only one patient. Remarkably, only four patients were lost to follow-up60. A
similar hospital based study among comatose stroke patients in Nigeria by Obiako et-al revealed
intracerebral haemorrhage (78.8%) and large cerebral infarction (21.2%) as the subtypes seen with
12
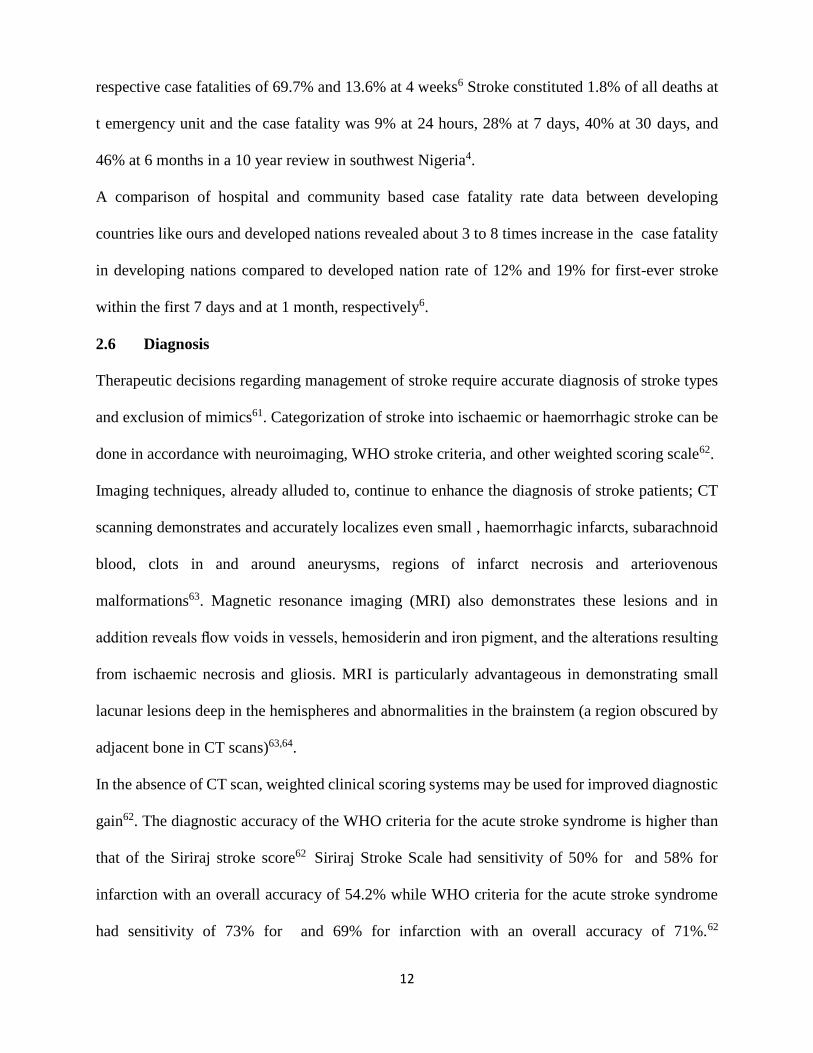
respective case fatalities of 69.7% and 13.6% at 4 weeks6 Stroke constituted 1.8% of all deaths at
t emergency unit and the case fatality was 9% at 24 hours, 28% at 7 days, 40% at 30 days, and
46% at 6 months in a 10 year review in southwest Nigeria4.
A comparison of hospital and community based case fatality rate data between developing
countries like ours and developed nations revealed about 3 to 8 times increase in the case fatality
in developing nations compared to developed nation rate of 12% and 19% for first-ever stroke
within the first 7 days and at 1 month, respectively6.
2.6 Diagnosis
Therapeutic decisions regarding management of stroke require accurate diagnosis of stroke types
and exclusion of mimics61. Categorization of stroke into ischaemic or haemorrhagic stroke can be
done in accordance with neuroimaging, WHO stroke criteria, and other weighted scoring scale62.
Imaging techniques, already alluded to, continue to enhance the diagnosis of stroke patients; CT
scanning demonstrates and accurately localizes even small , haemorrhagic infarcts, subarachnoid
blood, clots in and around aneurysms, regions of infarct necrosis and arteriovenous
malformations63. Magnetic resonance imaging (MRI) also demonstrates these lesions and in
addition reveals flow voids in vessels, hemosiderin and iron pigment, and the alterations resulting
from ischaemic necrosis and gliosis. MRI is particularly advantageous in demonstrating small
lacunar lesions deep in the hemispheres and abnormalities in the brainstem (a region obscured by
adjacent bone in CT scans)63,64.
In the absence of CT scan, weighted clinical scoring systems may be used for improved diagnostic
gain62. The diagnostic accuracy of the WHO criteria for the acute stroke syndrome is higher than
that of the Siriraj stroke score62 Siriraj Stroke Scale had sensitivity of 50% for and 58% for
infarction with an overall accuracy of 54.2% while WHO criteria for the acute stroke syndrome
had sensitivity of 73% for and 69% for infarction with an overall accuracy of 71%.62
13
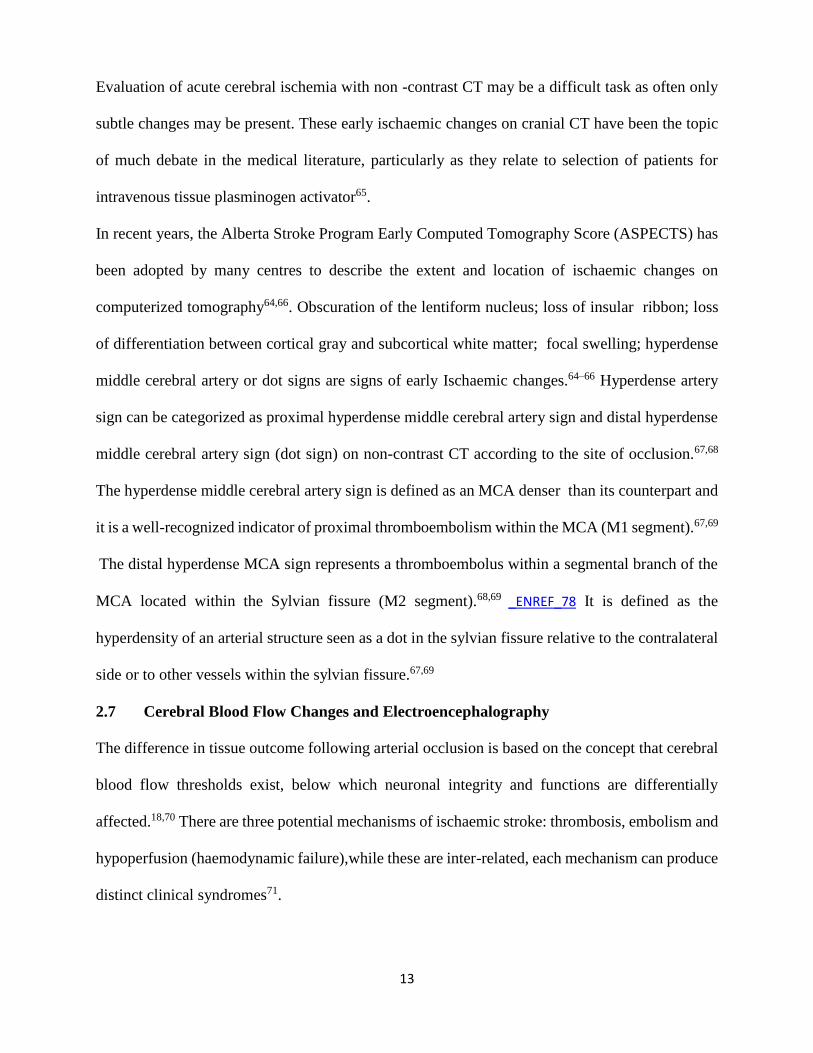
Evaluation of acute cerebral ischemia with non -contrast CT may be a difficult task as often only
subtle changes may be present. These early ischaemic changes on cranial CT have been the topic
of much debate in the medical literature, particularly as they relate to selection of patients for
intravenous tissue plasminogen activator65.
In recent years, the Alberta Stroke Program Early Computed Tomography Score (ASPECTS) has
been adopted by many centres to describe the extent and location of ischaemic changes on
computerized tomography64,66. Obscuration of the lentiform nucleus; loss of insular ribbon; loss
of differentiation between cortical gray and subcortical white matter; focal swelling; hyperdense
middle cerebral artery or dot signs are signs of early Ischaemic changes.64–66 Hyperdense artery
sign can be categorized as proximal hyperdense middle cerebral artery sign and distal hyperdense
middle cerebral artery sign (dot sign) on non-contrast CT according to the site of occlusion.67,68
The hyperdense middle cerebral artery sign is defined as an MCA denser than its counterpart and
it is a well-recognized indicator of proximal thromboembolism within the MCA (M1 segment).67,69
The distal hyperdense MCA sign represents a thromboembolus within a segmental branch of the
MCA located within the Sylvian fissure (M2 segment).68,69 _ENREF_78 It is defined as the
hyperdensity of an arterial structure seen as a dot in the sylvian fissure relative to the contralateral
side or to other vessels within the sylvian fissure.67,69
2.7 Cerebral Blood Flow Changes and Electroencephalography
The difference in tissue outcome following arterial occlusion is based on the concept that cerebral
blood flow thresholds exist, below which neuronal integrity and functions are differentially
affected.18,70 There are three potential mechanisms of ischaemic stroke: thrombosis, embolism and
hypoperfusion (haemodynamic failure),while these are inter-related, each mechanism can produce
distinct clinical syndromes71.

14
The effect of a localized blood vessel occlusion will depend on the following factors: the area of
brain supplied by the vessel, the nature of the occlusion, the time that the occlusion lasts, its degree
and anatomy of collateral circulation.72,73
Neuronal cell death occurs as a result of two main mechanisms: necrosis and apoptosis. Necrosis
occurs predominantly in the hyperacute stage within the ischaemic core. It occurs mainly as a
consequence of disruption of cellular homeostasis due to energy failure and is accompanied by
cellular swelling, membrane lysis, inflammation, vascular damage, and oedema formation.18,71,74
Apoptosis is the main mechanism of neuronal injury in the penumbra where, because of the
milder degree of ischemia, sufficient energy is produced to allow for expression of new proteins
that mediate cell death through an ordered and tightly controlled set of changes in gene expression
and protein activity.71,75
Studies of CBF and cerebral rate of oxygen metabolism (CMRO2) using Xenon computed
tomography and positron emission tomography (PET) in ischaemic stroke have demonstrated that
regional electroencephalography changes also reflect the coupling of cerebral blood flow and
metabolism.16 During recovery from stroke, partial dissociation from cerebral blood flow and
oxygen content occur and under these circumstances, the electroencephalography more closely
reflects cerebral metabolism than does the cerebral blood flow, making it potentially more
valuable as a measure of neuronal function13.
The brain accounts for only 2% of body weight, it uses 20% of cardiac output when the body is at
rest and constant supply of ATP is essential for neuronal integrity and this process is much more
efficient in the presence of oxygen. Although ATP can be formed by anaerobic glycolysis, the
energy yielded by this pathway is small and it also leads to the accumulation of lactic acid.76 The

15
brain needs and uses approximately 500 mL oxygen and 100 mg glucose each minute, hence the
need for a rich supply of oxygenated blood containing glucose.16
Cerebral blood flow (CBF) is normally approximately 50 - 55mL/minute for each 100 g of brain;
while neuronal functionality is maintained at flow rate 23mL/100g/min. Adequate compensation
can be made even if blood flow is reduced to approximately 20–25 mL per 100 g/minute by
autoregulatory mechanism.70,73,77
When CBF falls below 18 – 20ml /100 g/min, oxygen extraction starts to fall and changes are
detected on electroencephalography which becomes reduced in amplitude. At levels below 10 -
12mL/100 g/minute, cell membrane functions are severely disrupted. The threshold for
maintaining morphological neuronal integrity is 6 – 8ml/100g/min below which neuronal death is
irreversible.77
Infarction may not occur for hours at this degree of flow limitation and some electrical activity
(mostly delta frequencies) may be seen, but as the cerebral blood flow continues to decrease toward
the infarction threshold (10–12 ml/100 g/min and below), the EEG becomes isoelectric and
cellular damage becomes irreversible74,77. A CBF of 6 to 8 mL/100 g/min causes marked ATP
depletion, increase in extracellular K, increase in intracellular calcium, and cellular acidosis,
leading invariably to histologic signs of necrosis.75
Calcium influx is further enhanced by impairment in the energy-dependent reuptake of excitatory
amino acids, especially glutamate, and by release of excitatory amino acids into the extracellular
space. An increase in extracellular glutamate leads to increased calcium influx, through increased
stimulation of the NMDA or non-NMDA.73

16
At the same time, sodium and chloride enter the neuron which create osmotic gradients, leading to
oedema, which is predominantly cytotoxic and can further diminish perfusion in regions
surrounding the core.70,72,75
The accumulation of intracellular calcium leads to a series of events at both the cytoplasmic and
nuclear levels that result in cell death through several mechanisms: activation of enzymes that
degrade cytoskeletal proteins; activation of lipoxygenase, cyclooxygenase, xanthine oxidase and
nitric oxide synthase with resultant accumulation of highly cytotoxic oxygen free radicals.18,71,75,78
2.8 Concept of Ischaemic Penumbra
Ischaemic core corresponds to cerebral blood flow values of less than 7 mL/100g/min to 12
mL/100 g/min..70 Ischaemic penumbra corresponds to a high CBF limit of 17 - 22 mL/100 g/min
and a low CBF limit of 7 to 12 mL/100 g/min18,70. Salvaging this tissue by restoring its flow to
non-ischaemic levels is the aim of acute stroke therapy.63,70,75,79
Oligemia represents from the normal range down to around 22 mL/100 mg/min.16
Advanced MRI techniques, particularly perfusion and diffusion-weighted imaging, have been the
cornerstone of the concept of Ischaemic penumbra.64,80
Restriction of acute stroke therapy aimed at vessel recanalization to 3 hours from onset of
symptoms for IV thrombolysis and 4.5 hours for intra-arterial thrombolysis is based on the concept
that the ischaemic penumbra has a short lifespan, being rapidly incorporated into the core within
hours of the ictus tolerance to hypoxia by 25 to 30 percent.81,82
These biochemical, cellular, and CBF findings enable one to conceptualize manoeuvres for
restoring blood flow within the marginally hypoperfused zone and salvaging brain tissue,
particularly under conditions of partial ischemia.70,76,78

17
2.9 Stroke Scales
The NIHSS has been repeatedly validated as a tool for assessing stroke severity and as an excellent
predictor of patient outcomes whereas the Barthel index is useful for planning rehabilitative
strategies.19,81
Due to the NIHSS’s focus on cortical function, patients with cortical stroke tend to have worse
baseline scores. Approximately 98% of humans have verbal processing taking place in the left
hemisphere, indicating that the NIHSS places more value on deficits in the left hemisphere19,81.
The modified Rankin scale ( MRS) and the Glasgow outcome scale (GOS) provide summary
measures of outcome and might be most relevant to clinicians and patients considering early
intervention82. The MRS, a clinician-reported measure of global disability, is widely applied for
evaluating stroke patient outcomes and as an end point in randomized clinical trials90.
The Stroke Levity Scale (SLS) is a concise, valid, and reliable stroke impairment scale that can be
used routinely to monitor outcome.22 It is the summation of the best motor power in dominant
hand/upper limb, best motor power in the weaker lower limb, mobility score minus score of one
in those with aphasia.22 It takes less than 2 minutes to administer the SLS in contrast to 8 min for
the NIHSS22 The NIHSS neurologic scale appears more sensitive than the Barthel Index or
modified Rankin scale allowing smaller sample sizes or greater statistical power. The Barthel
Index (BI) and the Modified Rankin Scale (MRS) are commonly used scales that measure
disability or dependence in activities of daily living in stroke victim82.
2.10 Factors Affecting Prognosis and Outcome in Stroke
High blood glucose on admission predicts an increased risk of mortality and poor outcome in
patients with and without diabetes83. Admission hyperglycaemia is a significant predictor of short-
term case fatality but not poor functional outcome in first ever acute ischaemic stroke in

18
Nigerians.83 Fever is associated with increased morbidity, mortality and unfavourable outcome7,9.
The incidence of fever after basal ganglionic and lobar ICH is high, especially in patients with
intraventricular haemorrhage 9. Fever occurs in 25% to 50% of patients after acute ischaemic
stroke and is more common with more severe deficits.9 Although mortality appears to be lower
and long-term outcomes better for those patients who are hypothermic on admission, the effect of
maintained or induced hypothermia on outcome after acute ischaemic stroke is questionable.9 A
major risk to consider is that such hypothermia might suppress or mask a fever caused by
infection.9
A few studies have examined the role of iron in patients with intracerebral haemorrhage and
reported that high serum ferritin levels are associated with poor outcome after intracerebral
haemorrhage and correlate with the peri-hematoma oedema9.Age above 39 years, male gender,
systemic hypertension, early onset of coma after stroke, aspiration pneumonia, recurrent seizures,
hyperglycemia, and sepsis have been found to be associated with poor stroke outcome6,84.
2.11 EEG CHANGES IN ACUTE STROKE
Pyramidal neurons found in layers III, V, and VI are exquisitely sensitive to conditions of low
oxygen, such as ischemia, thus leading to many of the abnormal changes in the patterns seen on
EEG which are closely tied to cerebral blood flow16 The basic repertoire of EEG changes in
ischemia was delineated as decreased beta-range fast activities; increased slowing in theta and
delta ranges; loss of normal background rhythms such as the alpha rhythm and decreased overall
amplitude13. Marked focal slowing and attenuation of background activity occur with an
intracerebral haemorrhage .16 If there is a shift across the midline or compromise of the midline
structures, intermittent rhythmic delta activity may also be present.85 After controlling for age and
Hunt & Hess grade in subarachnoid haemorrhage on admission, poor outcome was associated with
the presence of periodic lateralized epileptiform discharges (PLEDS), absent EEG reactivity,

19
generalized periodic epileptiform discharges bilateral independent PLED or non-convulsive status
epilepticus.86
Brain function is represented on EEG by oscillations of certain frequencies. Slower frequencies
(typically delta [0.5–3 Hz] or theta [4–7 Hz]) are generated by the thalamus and by cells in layers
II-VI of the cortex while faster frequencies (or alpha, typically 8–12 Hz) derive from cells in layers
IV and V of the cortex16. All frequencies are modulated by the reticular activating system, which
correspond to the observation of reactivity on the EEG.16
Cerebral blood flow is normally approximately 55mL/minute for each 100g of brain, oxygen
consumption is about 3.5 mL/ 100 g of brain/min (49 mL/min for the whole brain) in an adult
which is approximately 20% of the total body resting oxygen consumption.16 EEG would slow
down when mean CBF falls below 23 mL/100 g/min, while at values below 15 mL/100 g/min the
EEG would become flat.16,70. The threshold for maintaining morphological integrity of the neuron
is 6- 8ml/100g/min, when the value goes below this, neurons die irreversibly because of excessive
ATP depletion.70,71 From carotid endarterectomy and cerebral-blood-flow studies,
electroencephalography has been shown to be a reliable marker of the decline in neuronal integrity
associated with a decline in blood flow14,16.
2.12 PREDICTIVE VALUE OF EEG CHANGES IN ACUTE STROKE
Recognition of changes in background EEG pattern provide valuable prognostic information and
also improves prediction of functional outcome in patient with a severe neurological deficit in
acute stage of cerebral ischemia and critically ill patients.12,86–88 While patterns like lack of delta
or the presence of faster frequencies within 24 hours, intermittent theta and/or delta activity on the
side of the infarction correlate with a good outcome12,17,24,89. The presence of unilateral prominent
continuous polymorphic delta slowing, decreased alpha, Regional Attenuation Without Delta
(RAWOD), slowing or depression of the alpha or beta activity and periodic lateralized epileptiform

20
discharges (PLEDs) add significantly to clinical prediction of poor outcome11,24,89. A study of
emergency EEG in 48 patiens with acute ischaemic event by Jordan and colleagues, revealed a
distinctive EEG pattern of regional attenuation of all frequencies without supervening delta in 18
subjects with infarcts in the ICA/MCA distribution.11
RAWOD can identify patients with massive acute stroke earlier than CT or MRI11,24. It was
submitted that RAWOD was specific for people with large infarct.24 There was no false positive
as all patients with RAWOD had severe clinical deficit but over 50% of the participant with
ischaemic stroke did not show RAWOD.24 Furthermore, comparison of RAWOD patients
presenting less than 3 hours after symptom onset and 3 to 24 hours after symptom onset, revealed
that 40.9 % of patients who presented less than 3 hours had RAWOD.24 All patients with RAWOD
had extremely severe clinical deficits, with a mean NIHSS score of 31.24 RAWOD are maximal
and persist in the frontal, central, parietal, and temporal derivations, which predominantly reflect
the ICA/MCA vascular distributions but relative sparing of activity in the occipital derivations,
which predominantly reflects the posterior cerebral vascular distribution.24
Sixty one of one hundred and thirty patients studied by Garcia-Morales et al had Periodic
Lateralizing Epileptic Discharge (PLED) which were associated with an acute process and
occurred early during the course of the illness in all patients studied and were usually associated
with structural lesions, with stroke being the main aetiology89. Also, epileptiform electrical activity
occurs in 10%to 20% of stroke which are associated with seizures and the focus is usually
demonstrable on an electroencephalogram86,90–92. Seizures occur more commonly with
haemorrhagic stroke than with ischaemic stroke and patients with a disabling cortical infarct or a
cortical are more likely to have seizures after stroke; those with late-onset seizures are at greater
risk of epilepsy.91–93

21
Diffusion-weighted magnetic resonance images (DWI MRI) are capable of detecting changes in
cerebral blood flow within 11 to 30 minutes64,94,95. In contrast, electroencephalography detects
changes at the same CBF within seconds and allows for continuous monitoring of these changes
over time16,18. This can be crucial for detecting evolving ischaemic changes when the cranial CT
is negative during early infarction, or when there is a mismatch between DWI MRI and the clinical
examination95_ENREF_29.
22
CHAPTER THREE
METHODOLOGY
3.1 Study Site
This study was carried out in the medical wards of the University College Hospital (UCH), Ibadan,
Oyo state.
3.2 Study Design
This study utilized a case control design involving acute stroke patients and apparently healthy
subjects.
3.3 Period of Study
The study was conducted over a period of months between 24/4/2013 and 23/4/2015
3.4 Study Population
All consenting patients admitted to medical wards in UCH who were diagnosed with acute stroke
were recruited to participate in the study.
3.5 Cases
3.5.1 Inclusion Criteria
1. History, physical examination and neuroimaging (CT and/or MRI) confirmation of stroke
2. Presentation within 3 days of ictus
3.5.2 Exclusion Criteria for Cases
1. Background history of seizure disorders
2. Stroke presentation > 3days of stroke onset
3. Concurrent primary cerebral disorder e.g. Pre-existing Parkinson’s disease, Brain tumour,
subdural haematoma.
4. Inability to provide an informed consent and no surrogate available
5. Patient on sedatives

23
3.6 CONTROL
3.6.1 Inclusion Criteria
1. The healthy subject matched for age and sex.
2. No background history of seizure disorder.
3. No background history of brain tumor.
4. No background history of use of psychoactive substances
3.6.2 Exclusion Criteria
1. Background history of seizure disorders
2. Previous history of stroke
3. Concurrent primary cerebral disorder e.g. Pre-existing Parkinson’s disease, Brain tumour,
subdural haematoma.
3.7 Sample Size Determination
Using Peacock formula for case control studies:
N = 2 (Zα + Z1-β)2 [P1 (1- P1) + P2 (1- P2)]
(P1 – P2)2
Where,
N = minimum sample size for cases or controls
Zα = Standard normal deviate at 5% level of significance = 1.96
Z1-β = Standard normal deviate corresponding to a power of 80% = 0.84
P1 = Prevalence of abnormal EEG in patients with stroke = 50%
P2 = Prevalence of abnormal EEG in normal subjects = 10%

24
Therefore;
N = 2(1.96 + 0.84)2[0.5 (1-0.5) +0.1 (1- 0.1)]
(0.5 – 0.1)2
N = 66.6
The minimum sample size required is 67 each for the cases and controls, 134 patients should be
recruited for the cases and controls. With an attrition rate of 10% (13 patients), a total of 160 (80
cases and controls) were recruited for the study.
3.8 Assessment of Subjects
A stroke register was opened in University College Hospital Ibadan to record all cases of stroke
seen during the period of study, irrespective of the outcome.
Using a questionnaire, baseline information was obtained from the study participants covering
demographic characteristics (name, sex, age, number of years of completed education, contact
address, telephone number, marital status, socio-economic status), medical history relating to the
stroke- (previous stroke, temporal profile, risk factors, and other co-morbidities), waist and hip
circumference ratio, smoking, alcohol use, past and current medications including psychoactive
substances. Blood samples were taken to assess complete blood count, blood glucose, lipid profile,
retroviral status, genotype, electrolyte urea and creatinine.
3.9 Neuroimaging Studies
Cranial computerized tomography was done for all cases recruited into the study. Ischaemic stroke
was defined by brain CT scan (normal brain CT scan or recent infarct in the clinically relevant
area on scan performed within 3 days or 72 hours of stroke onset). Pre-contrast images were
acquired and immediately reviewed. For haemorrhagic stroke, no contrast was given and the
procedure would be concluded. However, for ischaemic stroke, 40mls of Ultravist (an iodine-based

25
contrast medium) was injected intravenously fast and post-contrast images were immediately
acquired.
Calculation of the volume of bleed and infarct on head CT was performed using the ABC/2
method.96–99 The dimensions of the hematoma are measured in centimeters to create a volume in
cubic centimeters (cm3).97,98 A is the greatest haemorrhage diameter by CT, B is the diameter 90
degrees to A, and C is the approximate number of CT slices with haemorrhage multiplied by the
slice thickness.99 First, the longest axis measured (in centimeters) is labeled A, then a
perpendicular to line A is drawn and labeled B; then, the number of slices on which contiguous
blood noted were multiplied by the slice thickness and labeled C. The slice thickness on standard
head CT protocols is 0.5 cm.
3.10 Stroke severity and outcome
Stroke severity on admission was assessed using the NIHSS and was repeated at 72hours, 7days,
14days and 30days after stroke. (APPENDIX III). The scores range between (0), no stroke to
(42), the most severe stroke. Mild stroke was defined as stroke with NIHSS scores 1-4 while
moderate stroke was defined as stroke with NIHSS scores of 5-15. Moderate to severe stroke was
defined as stroke with NIHSS scores of 16-20 and NIHSS scores of 21-42 constituted severe
stroke. Functional outcome was assessed using the MRS at presentation, at two weeks and 30 days
after stroke (APPENDIX 1V). These assessments were done by the candidate using the Modified
Rankin scale forms. Participants with MRS 1, 2 and 3 were taken as having good outcome while
those with MRS 4,5,6 were taken as having poor outcome.
3.11 Management Protocol
All patients received standard management in accordance with the management guidelines of the
neurology unit of the hospital which was adopted from various international management
guidelines.2,8,9,100,101 The patients had isotonic fluid infusion and regular physiotherapy, with early

26
ambulation where possible. All patients with elevated blood pressure had antihypertensives
administered if there were compelling indications such as acute left ventricular failure, myocardial
ischemia / infarction, rapid decline in renal function or dissecting aortic aneurysm. Unconscious
patients were frequently turned in bed to prevent pressure sores while those with hemiplegia
received prophylactic subcutaneous heparin to prevent deep venous thrombosis. Antiplatelets and
anticoagulation were avoided in those with haemorrhagic stroke. The patients were followed up
until 30 days post stroke onset.
3.12 Electroencephalography
Using the international 10-20 electrode placement, electroencephalography was obtained in all
cases and controls using a Phoenix digital 16 channel electroencephalography machine by a trained
technologist under the my supervision and report the supervising consultant. These recordings
were taken daily in the first seven days, repeated at two weeks and 30days and each recording took
20 – 30 minutes. Hyperventilation which is one of the activation procedures was not done because
it could induce hypocarbia and cerebral vasoconstriction which would worsen the condition in
acute stroke. Pulse oximetry was done before and after the procedure and SPO2 of recruited patients
ranged from 94% to 100% to allow for proper oxygenation. The reports were interpreted by the
investigator, vetted by the supervising consultant and artefactual results were repeated. The
controls had electroencephalography done at presentation in order to compare the pattern found in
controls and cases. Standard sensitivity recording was set at 100uv/cm for all patients, however,
this was adjusted as required and reduced to 70uv/cm, 30uv/cm, 15uv/cm to increase the
amplitude. Filter was set at 70Hz as standard but reduced to 30Hz and 15Hz as required to reduce
the effect of interference.

27
3.13 Data Analysis
Data obtained from participants were entered in Microsoft Excel for cleaning and transferred to
the Statistical Package for Social Science version 22 for analysis. Baseline socio-demographic and
clinical characteristics of participants were obtained and continuous variables were presented as
means (standard deviation) while categorical variables were presented as frequencies
(percentages). Pearson chi square test was used to assess association between stroke characteristics
and stroke type, EEG characteristics and stroke severity. Pearson chi square test was used to assess
if there was any difference in the frequency of diabetes, dyslipidemia, ischaemic stroke, and
between those with poor outcome and good outcome. The independent student t-test was used to
determine association between age, systolic blood pressure, diastolic blood pressure, temperature,
EEG variable and stroke size. p-value <0.05 was deemed significant. Sensitivity, specificity,
positive predictive and negative predictive value of EEG in determining stroke outcome for
ischaemic and haemorrhagic stroke were also calculated. (APPENDIX IX) Stroke and EEG
characteristics were presented as frequencies (proportions) and case fatality rate was also
calculated. Stroke severity was dichotomized using NIHSS. (APPENDIX 111)
3.14 Ethical Consideration
3.14.1 Ethical Clearance
This was obtained from the Joint University of Ibadan/University College Hospital Institutional
Review Board (IRB).
3.14.2 Confidentiality of Data
Personal details obtained from participants including information and data were treated with
utmost confidentiality.

28
3.14.3 Beneficence
Electroencephalogram was done at no cost to the patients after due consultation with hospital
management. Permission was obtained from the patients or their relations to use the patients’ brain
CT scan or MRI for this study. Brain CT scan is part of routine investigation of patients with
stroke. Patients were allowed to have access to their results if they so desired by participating.
3.14.4 Non-maleficence
All procedures carried out on patients were done with extreme care and concern to ensure that
patients suffered no harm.
3.14.5 Voluntary participation
Subjects for this study were fully informed on the research protocol after which they were required
to give written informed consent. No patient was forced or cajoled to carry out investigations. The
consent was translated to the local language for those who did not understand English language.
For the 19 non Yorubas (13 cases and 6 controls), the services of interpreters were employed.
Participants were free to decline participation or withdraw from the study at any time without
reprisal or loss of benefit.
3.9 Operational Definition
3.9.1 Dyslipidaemia
Dyslipidaemia was defined as LDL ≥ 100mg/dl or HDL ≤ 50mg\dl in women and 40mg\dl in men
or Triglyceride ≥ 150mg/dl or Total cholesterol ≥200mg/dl according to NCEP – ATP 111
guidelines.102,103
3.9.2 Smoking
Smoking was defined as use of cigarette and duration defined in pack year. Pack year was
calculated by multiplying the number of packs of cigarettes smoked per day by the number

29
of years the person has smoked. 1 pack year was defined as smoking 20 sticks of cigarettes per
day for one year or 40 sticks of cigarettes per day for half a year.
3.9.3 Diabetes mellitus
Diabetes mellitus was defined as FPG ≥ 126 mg/dl or random plasma glucose ≥ 200 mg/dl
3.9.4 Hypertension
Hypertension was defined as previous blood pressure ≥ 140/90 taken at different time, previous
history of hypertension, current use of antihypertensive.
3.9.5 Stroke phenotyping
Toast classification was used in phenotyping of stroke into large vessel atherosclerosis,
cardioembolic, lacunar, undetermined.104 Large-vessel atherosclerosis was defined as clinical
evidence of involvement of the cortex (aphasia,neglect,hemianopsia,restricted weaknesses),
subcortical region, cerebellum, or brainstem and imaging evidence of CT showing evidence of
cortical, subcortical, cerebellar, or brainstem infarction >1.5cm in diameter.104
Cardioembolism stroke was defined as clinical evidence of cortical, subcortical, cerebellar, or
brainstem dysfunction and imaging evidence of CT imaging evidence or cortical, subcortical,
cerebellar or brainstem infarction >1.5cm in diameter with electrocardiography and
echocardiography supporting cardiac sources for embolus. Small-vessel occlusion was defined as
an evidence of a lacunar syndrome (pure motor hemiparesis, pure sensory syndrome, mixed
sensorimotor syndrome, ataxic hemiparesis, clumsy hand dysarthria syndrome) with no clinical
evidence of cortical involvement (aphasia, neglect hemianopia, restricted motor syndrome), and
imaging evidence of CT that were normal or show a small subcortical or brainstem infarct < 1.5cm
in diameter, and results of echocardiography not suggesting large vessel atherosclerosis or
cardioembolic sources of stroke.104

30
Stroke of undetermined origin was defined as incidents in whom the cause of stroke cannot be
determined with any degree of confidence. This includes patients in whom there was no obvious
source of stroke, patients in whom an incomplete or cursory evaluation was done, and patients
with two or more potential causes of stroke.104
3.9.6 Epileptiform pattern
Epileptiform pattern was defined as presence of either focal spikes, focal sharps, sharps with
accompanying slow waves or spikes with accompanying slow waves on each EEG recorded at
presentation, 7days, 14days and 30days.105
Sharps were defined as transient, clearly distinguishable from background activity, with pointed
peaks and duration of 70-200 milliseconds. Spikes were defined as transient, clearly
distinguishable from background activity, with pointed peaks and duration of 20-70
milliseconds.105 Fast waves were defined as Alpha waves with frequencies of 8 – 13 per second
and Beta waves at frequencies greater than 13 per second.106 Slow waves were defined as Theta
waves with frequencies between 4 – 7 waves per second and Delta waves at frequencies less than
4 waves per second.105,106
3.9.6 Early onset post stroke seizures
Early onset seizure was defined as presence of seizures within 14 days of stroke onset.107,108

31
CHAPTER FOUR
4.0 RESULT
4.1: BASELINE SOCIODEMOGRAPHIC CHARACTERISTICS
One Hundred and sixty participants were recruited into this study comprising eighty consecutive
stroke patients and eighty controls which were adequately matched for age and sex. As shown in
table 1 below, the mean age of cases was 57.6 ± 14.6 and control was 54.9 ± 12.6. For the cases,
there 39 males (48.8%) and 41 females (51.2%). In the control group, there were equal number of
males 40 (50%) and females 40 (50%). There were more cases with no formal education when
compared with controls and this was statistically significant. More controls were single, divorced
or widowed when compared with cases, however, there were more married patients than controls
in this study (p=0.003).

32
Table 1: Socio-demographic characteristics of participants
CASES CONTROLS X2 p-VALUE
N = 80 N = 80
Age (Mean, SD) 57.6 (14.6) 54.8 (12.4) 1.29 0.198
Gender (N, %)
Male 40 (50.0%) 40 (50.0%) 0.01 0.936
Female 40 (50.0%) 40 (50.0%)
Education (N, %)
No formal education 18 (22.5) 2 (2.5)
Primary 10 (16.9) 13 (16.7) 20.81 <0.001*
Secondary 32 (27.1) 37 (47.4)
Tertiary 20 (33.9) 28 (35.9)
Marital Status (N, %)
Single 49 (70.0) 58 (82.9) 0.003*
Married 21 (30.0) 12 (17.14)
Divorced 3 (3.75) 4 (5.0)
Widow 7 (8.75) 6 (7.5)
*Statistically Significant

33
4.2 RISK FACTORS FOR STROKE
In this study, of the cases recruited, 83.3%, 25%, 21.3%,20%,15.3%, 2.5% had hypertension,
diabetes mellitus, dyslipidemia, alcohol consumption, cardio-embolic source and smoking
respectively.
Figure 1a: Showing the frequencies of Risk Factors for Stroke
0.00%
10.00%
20.00%
30.00%
40.00%
50.00%
60.00%
70.00%
80.00%
90.00%
Hypertension Dyslipidaemia Diabetesmellitus
Alcohol Cardio-embolic Smoking

34
4.3 CLASSIFICATION OF STROKE
The highest proportion of cases (61.0%) had Ischaemic stroke, 36.0% suffered from Intracerebral
haemorrhage and 3.0% had sub-arachnoid haemorrhage. These are shown in Figure 1b below
FIGURE 1b: Proportion of Stroke type among cases
61%
36%
3%
Percentage
Infarct
ICH
Sub-arachnoid Haemorrhage

35
4.4 ISCHAEMIC STROKE PHENOTYPING
Using Oxfordshire Community Stroke Project (OCSP) classification of ischaemic strokes, Partial
Anterior Circulation Infarct (PACI) and Lacunar Infarct (LACI) were more common with
proportions of 44.9% and 42.96% respectively. TACI and POCI had equal proportions of 6.1%
each as shown in Figure 2A. Based on the Trial of Org 10172 in Acute Stroke Treatment (TOAST)
system of classification as shown in Figure 2B, 37.7% of cases with ischaemic stroke had small
vessel disease, followed by 35.9% under the large vessel category, 20.8% had cardio-embolic,
5.7% were of undetermined aetiology.

36
FIGURE 2A: ISCHAEMIC STROKE PHENOTYPING USING OCSP
TACI – Total Anterior Circulation Infarct PACI – Partial Anterior Circulation Infarct
POCI – Posterior Circulation Infarct LACI – Lacunar Infarct
OCSP – Oxfordshire Community Stroke Project
0
5
10
15
20
25
30
35
40
45
50
TACI PACI POCI LACI
PER
CEN
TAG
ES
CLASSIFICATIONS OF STROKE SUBTYPES
0
5
10
15
20
25
30
35
40
LARGE VESSEL SMALL VESSEL CARDIO-EMBOLIC
UNDETERMINED
PER
CEN
TAG
ES

37
FIGURE 2B: ISCHAEMIC STROKE PHENOTYPING USING TRIAL OF ORG 10172 IN
ACUTE STROKE TREATMENT (TOAST)
4.5 BASELINE EEG FINDINGS IN CASES AND CONTROLS
As shown in Table 3, 22.8%, 21.5%,24.1%, 12.7% and 18.9% of cases had frequencies at < 4Hz
(delta), 4-7 Hz(theta), 8-12Hz(alpha), > 12Hz (beta) and intermixed frequency respectively. In the
control arm, 5.0%, 3.8%, 66.3, 17.5 and 7.5% had < 4Hz (delta), 4-7Hz(theta), 8-12Hz(alpha), >
12Hz (beta) and intermixed frequency respectively.
While fast frequencies were seen in 83.8% of controls, it was observed in 36.7% of cases. A
statistically higher proportion of cases had slow frequencies compared to controls (63.3%
versus16.2%; p = 0.001).

38
TABLE 2: COMPARISON OF BASELINE EEG FINDINGS IN STROKE PATIENTS
WITH CONTROLS
A – BACKGROUND RHYTHM
Background Frequency Cases (n=80)
N (%)
Controls (n=80)
N (%)
p-value
DELTA
THETA
ALPHA
BETA
INTERMIXED
(<4HZ)
(4- 7HZ)
(8- 12HZ)
(> 12HZ)
-
18(22.8)
17(21.5)
19(24.1)
10(12.7)
15(18.9)
4(5.0)
3(3.8)
53(66.3)
14(17.5)
6(7.5)
0.008*
Intermixed (Alpha + Delta) as observed in cases 3(5.7)
Intermixed (Delta + Theta) as observed in cases 12(17.1)
Intermixed (Delta + Theta) as observed in controls6(12.9)
B- FREQUENCY OF BACKGROUND RHYTHM IN CASES AND CONTROLS
Frequency Cases (n=80)
N (%)
Controls (n=80)
N (%)
p-value
Slow
Fast
51(63.3)
29(36.7)
13(16.2)
67(83.8)
0.001*

39
4.6: EPILEPTIFORM PATTERNS IN CASES AND CONTROLS
As shown in Table 3, a statistically higher proportion of cases had epileptiform patterns compared
to controls (31.6% versus 11.2%; p = 0.041)
TABLE 3- SHOWING EPILEPTIFORM PATTERN IN CASES AND CONTROLS
Epileptiform Cases (n=80)
N (%)
Controls (n=80)
N (%)
p-value
Present
Absent
25(31.6)
54(68.4)
9(11.2)
71(88.8)
0.041*

40
4.7: PATTERN OF CHANGE IN THE BACKGROUND RHYTHM AMONG STROKE PATIENTS
As shown in Figure 3, background pattern showed increasing alpha and decreasing abnormal rhythms from
presentation till 30days.
FIGURE 3: SHOWING BACKGROUND RHYTHM AMONG STROKE PATIENTS
0
10
20
30
40
50
60
70
80
AtPresentation
72 hrs 7 days 14 days 30 days
PER
CEN
TGES
Alpha
Abnormal

41
4.8: PATTERN OF ELECTROENCEPHALOGRAPHIC WAVES FROM ADMISSION TO
30 DAYS.
At presentation, 61.9% of stroke patients had slow waves and the proportion reduced to 12.5% by
the 30th day. Beta waves were also observed in 12.7% of cases at presentation and 12.5% of cases
showed beta waves at day 30. Twenty four percent of cases had alpha waves at presentation and
this increased to 31.2% by day 30.
FIGURE 4: SHOWING PATTERN OF EEG WAVES FROM ADMISSION TO 30DAYS
0
10
20
30
40
50
60
70
AtPresentation
72 hrs 7 days 14 days 30 days
PER
CEN
TAG
ES
Beta
Alpha
Slow Waves

42
4.9: TIME TREND IN THE PATTERN OF EPILEPTIFORM DISCHARGES AMONG
STROKE PATIENTS
Epileptiform discharges were seen in 31.6%, 32.9%, 62.7%, 57.9% and 44.4% of cases at
presentation, 72hours, 7days, 14days and 30days respectively.
FIGURE 5: SHOWING EPILEPTIFORM PATTERN AMONG STROKE PATIENTS
0
10
20
30
40
50
60
70
80
At Presentation 72 hrs 7 days 14 days 30 days
PER
CEN
TAG
ES
Absent
Present
43
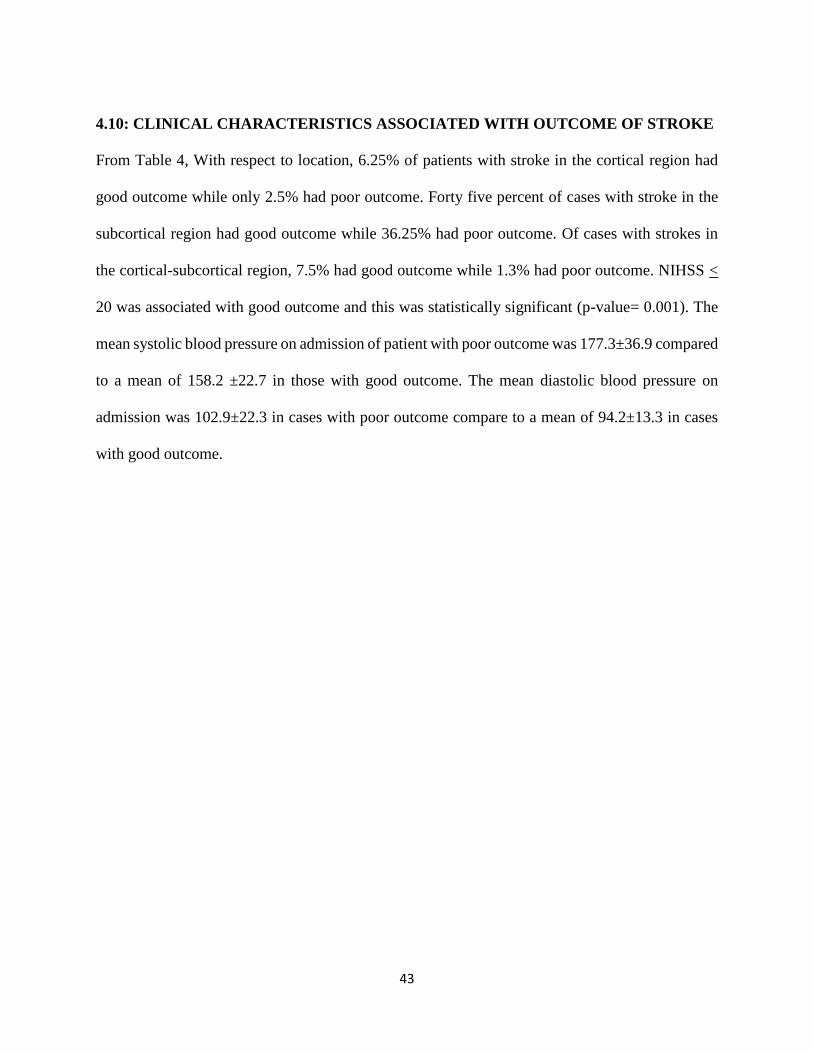
4.10: CLINICAL CHARACTERISTICS ASSOCIATED WITH OUTCOME OF STROKE
From Table 4, With respect to location, 6.25% of patients with stroke in the cortical region had
good outcome while only 2.5% had poor outcome. Forty five percent of cases with stroke in the
subcortical region had good outcome while 36.25% had poor outcome. Of cases with strokes in
the cortical-subcortical region, 7.5% had good outcome while 1.3% had poor outcome. NIHSS <
20 was associated with good outcome and this was statistically significant (p-value= 0.001). The
mean systolic blood pressure on admission of patient with poor outcome was 177.3±36.9 compared
to a mean of 158.2 ±22.7 in those with good outcome. The mean diastolic blood pressure on
admission was 102.9±22.3 in cases with poor outcome compare to a mean of 94.2±13.3 in cases
with good outcome.

44
TABLE4: SHOWING CLINICAL CHARACTERISTICS ASSOCIATED WITH OUTCOME OF
STROKE
POOR OUTCOME GOOD OUTCOME X2 P-VALUE
n=33 n= 47
Age, years (Mean± SD) (57.6 ±16.5) (57.6 ±13.1) 0.01 0.991
Diabetes N,( %) 9 (27.3) 8 (18.2) 0.34 0.410
Dyslipidemia N( %) 9 (27.3) 11 (24.4) 1.51 0.469
Admission Systolic BP, mmHg (177.3±36.9) (158.2 ±22.7) -2.79 0.007*
(mean±S.D)
Admission Diastolic BP, mmHg (102.9 ±22.3) (94.2 ±13.3) -2.11 0.038*
(mean±S.D)
MAP (mean, SD) 131.4 (23.4) 105.1 (19.9) 5.9 <0.001*
**Temperature0c(Mean ± SD) (37.6 ±0.9) (37.1 ±0.6) -2.82 0.006*
PCV, % (Mean ±SD) (37.6± 5.9) (37.7 ±4.5) -3.04 0.983
Seizures N,( %) 11 (33.3) 16 (34.0) 0.038 0.846
GCS N( %)
3 – 7 14(42.4) 8 (17.0) 19.74 <0.001
8 – 12 13(39.4) 16 (34.0)
13 – 15 6(18.2) 23 (49.0)
Stroke volume, cm3 (Mean± SD (6.5± 4.4) (8.7±6.1) -1.48 0.143
Location N( %) 3.22 0.020*
Cortical 2 (2.5) 5 (6.25)
Subcortical 29(36.25) 36(45.0)
Cortical-Subcortical 2 (2.5) 6(7.5)
Stroke Severity (NIHSS < 20) 7 (21.2) 41(87.2) 40.40 0.001*
Stroke severity (NIHSS > 20) 26(78.8) 6(12.8)
**(Highest temperature within 24hours of admission)

45
4.11. CASE FATALITY RATE IN ACUTE STROKE
The case fatality rate among cases recruited was 5% at 72hours, 16.3 at day 7, 26.3% after 14days and
43.8% at day 30 as shown in Table 5.
TABLE 5: CASE FATALITY RATE IN ACUTE STROKE
72hrs 7days 14days 30days
Alive 76 67 59 45
Dead 4 13 21 35
Case fatality rate (%) (5.0) (16.3) (26.3) (43.8)

46
4.12: EFFECT OF SLOWING ON OUTCOMES AMONG ISCHAEMIC STROKE
PATIENTS
The presence of slowing was seen in 71.4% and 66.7% of patient with good outcome at day 14
and day 30 respectively. While 28.6%and 33.3% of the had no slowing at 14days and 30days
among cases with good outcome.
Among cases with poor outcome, 83.3% had slowing at day14 and 71.4% at day30, while 16.7%
at day14 and 28.6% at day 30 had no slowing.

47
FIGURE 6: SHOWING EFFECT OF SLOWING ON OUTCOMES AMONG ISCHAEMIC STROKE PATIENTS
0
20
40
60
80
100
Poor outcome Good outcome
DAY 14
slowing
No slowing
Sensitivity 83.3%, Specificity 28.6%, PPV : 0.33% NPV: 0.80%
0
20
40
60
80
Poor outcome Good outcome
DAY 30
slowing
No slowing
Sensitivity 71.4%, Specificity 33.3%, PPV : 0.22% NPV: 0.82%

48
4.13: EFFECT OF SLOWING ON OUTCOMES AMONG HAEMORRAGHIC STROKE
PATIENTS
The percentage of cases with slowing was on decline from presentation till day 30 in both group
with good outcome and poor outcome. The percentage of cases without slowing increased from
13.3% at day14 and 46.7% at day 30 among haemorrhagic stroke patients with good outcome.
However, the percentage of cases without slowing increased from 45.5% at day14 and 62.5% at
day 30 among haemorrhagic stroke patients with poor outcome.

49
FIGURE 7: SHOWING EFFECT OF SLOWING ON OUTCOMES AMONG HAEMORRAGHIC STROKE PATIENTS
0
20
40
60
80
100
Poor outcome Good outcome
DAY 14
slowing
No slowing
Sensitivity 54.5%, Specificity 13.3%, PPV : 0.32% NPV: 0.29%
0
10
20
30
40
50
60
70
Poor outcome Good outcome
DAY 30 SLOWING
NO SLOWING
Sensitivity 37.5%, Specificity 46.7%, PPV : 0.27% NPV: 0.58%

50
4.14: TRENDS OF PREDICTIVE VALUE OF SLOWING IN PREDICTING POOR
OUTCOME AMONG STROKE PATIENTS.
Among ischaemic stroke patients, the positive predictive value of slowing decreased from 0.36 at
presentation to 0.33 at day 14 and 0.22 at day 30. The negative predictive value of slowing
increased from 0.57 at presentation to 0.8 at day 14 and 0.82 at day 30.
The positive predictive values among haemorrhagic stroke were 0.46 at presentation,0.32 at day
14 and 0.27 at day 30. The negative predictive values were 0.4, 0.29 and 0.58 at presentation, day
14 and day 30 respectively.

51
FIGURE 8: SHOWING TREND OF PREDICTIVE VALUES OF SLOWING AMONG STROKE PATIENTS.
0
0.1
0.2
0.3
0.4
0.5
0.6
0.7
0.8
0.9
PRESENTATION DAY 14 DAY30
ISCHAEMIC STROKE
PPV NPV
0
0.1
0.2
0.3
0.4
0.5
0.6
0.7
PRESENTATION DAY 14 DAY30
HAEMORRAGHIC
PPV NPV

52
4:15: EFFECT OF ALPHA RHYTHM ON OUTCOMES AMONG ISCHAEMIC
STROKE PATIENTS
At day 14, there was no alpha rhythm among patients with poor outcome while 28.6% of patients
with good outcome had alpha rhythm.
Similarly, at day 30, while 14.3% of patients with poor outcome had alpha rhythm, 29.6% of
patients with good outcome had alpha rhythm.

53
FIGURE 9: SHOWING EFFECT OF ALPHA RHYTHM ON OUTCOMES AMONG ISCHAEMIC STROKE PATIENTS
0
20
40
60
80
100
Poor outcome Good outcome
DAY 14 ALPHA WAVE
OTHER WAVES
Sensitivity 0%, Specificity 71.4%, PPV : 0.0% NPV: 0.63%
0
20
40
60
80
100
Poor outcome Good outcome
DAY 30 ALPHA WAVE
OTHER WAVES
Sensitivity 14.3%, Specificity 70.4%, PPV : 0.11% NPV: 0.76%

54
4.16: EFFECT OF ALPHA ON OUTCOMES AMONG HAEMORRHAGIC STROKE
PATIENTS
At day 14, 9.1% of patients with poor outcome had alpha rhythm while 53.3% of patients with
good outcome had alpha rhythm. At day 30, 37.5% of patients with poor outcome had alpha
rhythm, while 53.3% of rhythm with good outcome had alpha rhythm.

55
FIGURE 10: SHOWING EFFECT OF ALPHA ON OUTCOMES AMONG HAEMORRHAGIC STROKE PATIENTS
0
20
40
60
80
100
Poor outcome Good outcome
DAY 14 ALPHA WAVE
OTHER WAVES
Sensitivity 9.1%, Specificity 46.7%, PPV : 0.11% NPV: 0.41%
0
20
40
60
80
Poor outcome Good outcome
DAY 30 ALPHA WAVEOTHER WAVES
Sensitivity 37.5%, Specificity 46.7%, PPV : 0.27% NPV: 0.58%

56
4.17: TRENDS OF PREDICTIVE VALUE OF ALPHA RHYTHM IN PREDICTING
OUTCOME AMONG STROKE PATIENTS
The positive predictive value of alpha rhythm among ischaemic stroke patients were 0.2 at
presentation, 0 at day 14 and 0.11 at day 30. The negative predictive values were 0.53 at
presentation, 0.63 at day 14 and 0.76 at day 30 respectively.
Among haemorrhagic stroke patient, the positive predictive values were 0.43 at presentation, 0.11
at day 14 and 0.27 at day 30. The negative predictive values of were 0.5 at presentation,0.41 at day
14 and 0.58 at day 30.

57
FIGURE 11: SHOWING TREND OF PREDICTIVE VALUES OF ALPHA RHYTHM AMONG STROKE PATIENTS.
0
0.1
0.2
0.3
0.4
0.5
0.6
0.7
0.8
PRESENTATION DAY 14 DAY30
ISCHAEMIC STROKE
PPV NPV
0
0.1
0.2
0.3
0.4
0.5
0.6
0.7
PRESENTATION DAY 14 DAY30
HAEMORRAGHIC STROKE
PPV NPV

58
4.18: EFFECT OF BETA ON OUTCOMES AMONG ISCHAEMIC STROKE PATIENTS
At day 30, 42.5% of patient with poor outcome had beta rhythm while 33.3% of patient with good
outcome had beta rhythm. The specificity was 80.6%, 82.1%, 66.7% at presentation, day 14, day
30 respectively.
FIGURE 12: SHOWING EFFECT OF BETA ON OUTCOMES AMONG ISCHAEMIC STROKE PATIENTS
0
10
20
30
40
50
60
70
80
90
Poor outcome Good outcome
DAY 14 BETA WAVEOTHER WAVES
Sensitivity 16.7%, Specificity 82.1%, PPV : 0.29% NPV: 0.70%
0
20
40
60
80
Poor outcome Good outcome
DAY 30 BETA WAVEOTHER WAVES
Sensitivity 42.9%, Specificity 66.7%, PPV : 0.17% NPV: 0.81%
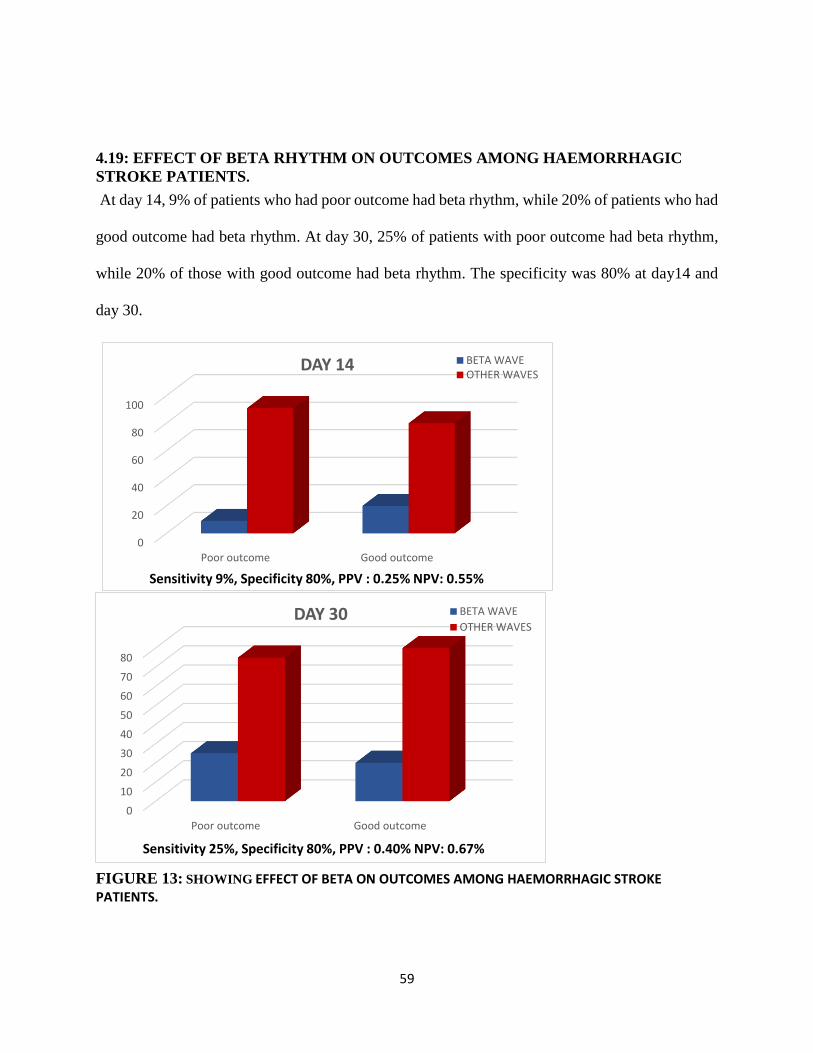
59
4.19: EFFECT OF BETA RHYTHM ON OUTCOMES AMONG HAEMORRHAGIC
STROKE PATIENTS.
At day 14, 9% of patients who had poor outcome had beta rhythm, while 20% of patients who had
good outcome had beta rhythm. At day 30, 25% of patients with poor outcome had beta rhythm,
while 20% of those with good outcome had beta rhythm. The specificity was 80% at day14 and
day 30.
FIGURE 13: SHOWING EFFECT OF BETA ON OUTCOMES AMONG HAEMORRHAGIC STROKE PATIENTS.
0
20
40
60
80
100
Poor outcome Good outcome
DAY 14 BETA WAVEOTHER WAVES
Sensitivity 9%, Specificity 80%, PPV : 0.25% NPV: 0.55%
0
10
20
30
40
50
60
70
80
Poor outcome Good outcome
DAY 30 BETA WAVE
OTHER WAVES
Sensitivity 25%, Specificity 80%, PPV : 0.40% NPV: 0.67%

60
4.20: TRENDS OF PREDICTIVE VALUE OF BETA RHYTHM IN ACUTE STROKE
The positive predictive value of beta rhythm in predicting poor outcome was 0.14 at presentation,
0.29 at day14 and 0.17 at day 30. The negative predictive value however increased from 0.6 at
presentation to 0.7 at day 14 and 0.81 at day 30. In cases with haemorrhagic stroke the positive
predictive was 0.33 at presentation, 0.25 at day 14 and 0.4 at day 30. The negative predictive value
also increased from 0.5 at presentation to 0.55 at day 14 and 0.67 at day 30.

61
FIGURE 14: SHOWING TREND OF PREDICTIVE VALUES OF BETA RHYTHM
AMONG STROKE PATIENTS.
0
0.1
0.2
0.3
0.4
0.5
0.6
0.7
0.8
0.9
PRESENTATION DAY 14 DAY30
ISCHAEMIC STROKE
PPV NPV
0
0.1
0.2
0.3
0.4
0.5
0.6
0.7
0.8
PRESENTATION DAY 14 DAY30
HAEMORRAGHIC STROKE
PPV NPV

62
4.21: SEIZURE TREND IN ACUTE STROKE
Of cases recruited into the study, 66% had no seizures, 24% had early onset seizures were, 10%
had late onset seizures at as shown in Figure 15
FIGURE 15: SHOWING TREND OF SEIZURES FROM PRESENTATION TO 30 DAYS
seizure Absent66%
Early onset seizures
24%
late onset seizures
10%
seizure Absent
Early onset seizures
late onset seizures

63
4.22: RELATIONSHIP BETWEEN EEG WAVE PATTERNS AND SEIZURE TREND
There is a reduction in presence of slowing, alpha rhythm, PLED, RAWOD, while beta rhythm was
increased among patient with early onset seizures from presentation to 14 days.
FIGURE 16: SHOWING RELATIONSHIP BETWEEN EEG WAVE PATTERNS AND
TREND OF SEIZURES FROM PRESENTATION TO 14 DAYS
0
10
20
30
40
50
60
slowing Alpha Rhythm Beta PLED RAWOD
SEIZURES AT PRESENTATIONn =11
0
10
20
30
40
50
60
70
Slowing Alpha Beta PLED RAWOD
SEIZURES WITHIN 14 DAYSn= 19

64
4.23: RELATIONSHIP BETWEEN PLED AND RAWOOD AND EARLY ONSET SEIZURES
There was a significant association between PLED and presence of early onset seizures at
presentation as shown Table 6.
TABLE 6: SHOWING RELATIONSHIP BETWEEN SPECIAL PATTERN AND EARLY ONSET SEIZURES
ABSENT (n=53) PRESENT (n = 19) p value
AT PRESENTATION
PLED 2(3.8) 4(21.1) 0.049*
RAWOD 5 (9.4) 5(26.3) 0.679
14TH DAY EEG SLOWING
PLED 1 (1.9) 2(10.5) 0.105
RAWOD 3(5.7) 4 (5.0) 0.1I0
*Significant

65
CHAPTER FIVE
5.0 DISCUSSION
5.1 SOCIO-DEMOGRAPHIC CHARACTERISTICS OF THE STUDY POPULATION
This study investigated the frequency and prognostic significance of abnormal
electroencephalographic findings in acute stroke patients at the University College Hospital,
Ibadan. A total of 160 participants were recruited into the study comprising 80 cases (stroke
patients) and 80 controls (subjects) with mean age cases at 57.6 years. This implies that stroke
affected middle age group mainly and thus has negative effect on the vibrant group workforce of
the country.
More cases had no formal education when compared with controls and this attained statistical
significance. This may result in poor compliance with instructions relating to medication and
healthy diet habit among cases. Stroke incidence was inversely correlated with years of educations
in a three year population study conducted in Brazil.109 There are previous evidences supporting
higher stroke mortality rates and physical functional limitations among individuals with a low level
of education and by extension low socioeconomic status.110,111 Years of education, age and sex of
patient, have all been linked with educational related differences in stroke incidence.112 Primary
prevention is key in reducing the burden of diseases in countries with minimal resources like
Nigeria.113 To achieve this, high level of education is of utmost importance. It is not surprising that
the participants with no formal educational among cases were more compared to controls in this
present study.
In this study, more of the controls were married compared to cases with higher frequencies of
singles, divorces and widows. The importance of caregivers cannot be underestimated as they help
to improve health seeking behavior in stroke patient. In a study by Malyutina et al, it was observed
that higher education was associated with reduced mortality from all causes, cardiovascular disease

66
and coronary heart disease in both gender.111 Adjustment for coronary risk factor and marital status
substantially reduced relative risk in men and women. The authors also noted that unmarried men
had higher mortality from all causes, cardiovascular and coronary heart disease than married
subjects.111 Even though association between marital status and cardiovascular disease was
inconsistent in the above study. These findings are somewhat similar to the findings obtained in
this present study. Perceptual, social, and behavioral factors contribute to delay in seeking medical
care in acute stroke beyond demographic and clinical variables.114
5.2 RISK FACTORS FOR STROKE
In this present study, 83.8%, 25%, 21.3%, 20% and 2.5% had history of hypertension,
dyslipidemias, diabetes mellitus, alcohol consumption and current smoking respectively. Previous
hypertension or blood pressure greater 140/90mmHg, regular physical activity, apolipoprotein
ratio, diet, waist hip ratio, psychosocial factor cardiac diseases, current smoking, alcohol
consumption, and diabetes mellitus were all associated with stroke in recent INTERSTROKE
study.40 While hypertension was more associated with haemorrhagic stroke than ischaemic,
current smoking, apolipoproteins and cardiac causes were more associated with ischaemic stroke.40
Only 2.5% of cases are current smokers, however, previous study by Bonita, showed that stroke
risks are at 18% in current smokers, 6% in former smokers and 12% in environmental tobacco
exposure.115 Smoking has been proposed to reduce blood vessel distensibility.41 Of all risk factors,
hypertension remains the highest and the leading risk factor for stroke in all types of stroke and
across all age groups.40

67
5.3 STROKE CLASSIFICATION AND PHENOTYPING
Data from Ibadan Stroke Registry between April, 1973 to March 1975 showed that of a total of
318 stroke patients who were entered into the register, 11% had subarachnoid haemorrhage, 16%
cerebral haemorrhage, 49% cerebral infarction while 24% were ill-defined.36
In a more recent study in the south western region of Nigeria (Ogun State) which spanned 10years,
of the 708 stroke patients reviewed, cerebral infarction contributed 49%, while 45% of cases had
intra cerebral haemorrhage and 6% had subarachnoid haemorrhage.4 However, in this present
study, the number of cases who had intracerebral hemorrhage were 36%, 61% had infarct and 3%
subarachnoid bleed. The discrepancies in these results could be due to the differences in diagnostic
criteria used. While the first study classified stroke using WHO criteria and autopsy records in
those cases, the current study recruited only cases that were accurately phenotyped by
neuroimaging.
In the INTERSTROKE study which involved a total of 3,000 cases cutting across Africa, South
America, Asia, North America, 22% of the cases had haemorrhagic stroke while ischaemic stroke
constituted 78%.40 However, coning down to the 323 cases recruited in Africa, 34% had
haemorrhagic stroke while 66% had ischaemic stroke.40 These proportions are quite similar to the
findings obtained in this present study.
Using the Oxfordshire Community Stroke Project Classification (OCSP), this present study
showed that partial anterior circulation infarct and lacunar infarct were more common with
proportions of 27.5% and 26.3% respectively.57 TACI and POCI had 3.8% each.57 These findings
are different from the African subtypes reported in the INTERSTROKE study which had PACI
and TACI as 47% and 19% respectively. The LACI proportion reported in the INTERSTROKE

68
study was smaller than reported in this study. The reason for this disparity could be the difference
in sample size. Across all continents, PACI is the commonest form of ischaemic sub-type of
stroke.54 In Africa it was 47%, S East Asia 57%, South America 33% and high income countries
52%. This trend is comparable to the findings in this study where the proportion of PACI was
higher than other subtypes. However, the PACI value on this study is relatively smaller than that
reported by INTERSTROKE study. The probable reason could be as a result of the smaller sample
size considered in this study.
The proportion reported for cases with small vessel disease in this present study is similar to the
finding by Kolominsky et al who conducted a population based study between 1994 and 1998
involving 583 residents in Germany. The group reported that 25.8% had small artery occlusion,
15.3% had large artery atherosclerosis and 30.2% had cardioembolism.116 Comparing the findings
from this study with that obtained from INTERSTROKE study, small vessel accounted for 44%
of cases, large vessel 19%, cardioembolic 9% and undetermined 22%. Whereas in this present
study, 37.74% of cases with ischaemic stroke had small vessel disease, 35.85% had the large vessel
category, 20.75% had cardio-embolic stroke, 5.72% were of undetermined aetiology. Apart from
the sample size which may account for the significant differences, there is need to ensure other
ancillary investigation in acute management of stroke.
5.4 CASE FATALITY RATE AND FUNCTIONAL OUTCOME IN ACUTE STROKE
The case fatality rate among cases recruited into this study was 5% at 72hours, 16.3% at day 7,
26.3% after 14days and 43.8% at day 30. A previous study aimed at determining the prognosis
and outcome of acute stroke conducted in the University College Hospital by Obiako et al revealed
an overall case fatality rate of 83.3% among stroke patients that were comatose which is eight
times higher than 12% and 19% case fatality rate of people with first ever stroke at 14days and

69
30days.6 The case fatality rate observed in this study (43.8% at 30days and 16.3% at 7 days) is still
relatively higher than that reported in developed countries. In a retrospective study in southwestern
Nigeria, Ogun et al reported a case fatality rate of 28% at 7days and 40% at 30days.4 The case
fatality rate increase by 27.5% between 7days and 30days in this study is of great concern but
value of 43.8 % is relatively similar 40% case fatality rate which has been described as high
previous review to estimate burden of stroke.48 Hospital-based studies have demonstrated a one
month case fatality rate between 27% and 46% in Africa.23,29,117. In the hospital based
INTERSTROKE study, one month stroke case fatality rate was 22% compared to 4% in high
income countries.40 An earlier study in Ibadan community reported a case fatality rate of 35% at
3weeks, and a similar community- based study in Tanzania reported a 28-ssday case fatality rate
of 28.7% and 84.3% at 3years.36.
Low level of education, poor access to imaging facilities, few available facilities for investigation
and treatment and poor documentation are some of the reasons identified for the increased case
fatality in Africa.29,118
5.5 FREQUENCY OF BACKGROUND RHYTHM, SLOWING AND EPILEPTIFORM
DISCHARGE AMONG STROKE PATIENTS.
The comparison of EEG tracing among cases and controls at presentation showed significant
differences between frequency, background, symmetry and epileptiform activities. Background
alpha rhythms and beta rhythm were more common in controls than in cases, while delta rhythm
and theta rhythm were seen more in cases than controls. Fast frequencies were seen in 83.8% of
controls and were observed in only 36.3% of cases. Epileptiform patterns were about 3 times
commoner in cases than controls at presentation. In a similar study, where EEG was performed

70
within 24 hours of admission, focal discharges were seen in 10% of cases of which 6% had
PLED119 whereas, in this present study, 15.2% had focal discharges of which 7.5% had PLED.
These findings underscore the need for EEG monitoring in order to detect purely electrographic
seizures in acute stroke. In a study to determine usefulness of EEG in patients with seizures in
acute phase of stroke, EEG revealed focal slow waves in 90% of which 22.5% were accompanied
by interictal epileptiform discharges.120 However, this present study revealed EEG slowing in
descending order from 61.9% of cases at presentation, 62.4% at 72hours, 51.2% at day 7, 35% by
the 14th day and 12.5% at day 30.
Epileptiform discharges was observed only in 31.6% of cases at presentation, 32.9% at 72hrs,
62.7% at 7days, 57.9% after 14days and in 44.4% at day 30.
The findings from the study above and this present study with regards to epileptiform discharges
at presentation further support the need of EEG monitoring in the acute phase of stroke.120
Neuromonitoring is an important field for the recognition of occurrence of non-convulsive
seizures, the development of quantitative measures to detect regional ischemia, and the
appreciation of electroencephalography phenotypes that is of prognostic value.16,121
Generally, focal epileptiform discharges are the initial EEG abnormality seen in acute stroke.122,123
In this present study, focal abnormalities were reported in 15.2% of cases at presentation which
increased with repeat to EEG ,17.56% at 72hours, 50.75% at day 7, 47.37% at 14days and 35.6%
at day 30. The rate of epilepsy increases with time after stroke and the yield of EEG improves
with repeat and long term studies in detecting epileptiform activity in adults.124 During acute
stroke, intracellular calcium accumulation may lead to depolarization of the transmembrane
potential and calcium mediated effect which may lower seizure threshold.125
The alpha and beta background rhythm were on increase, while delta and theta rhythm were
decreasing in course of 30days. This could be due to improved perfusion with recovery in phase

71
of acute stroke and EEG changes are closely related to cerebral blood flow.16 When normal
cerebral blood flow declines to values like 25-35ml/100g/min, faster frequencies (alpha and beta)
will be lost, then as the CBF decreases to approximately 17-18 ml/100 g/min, slower frequencies
(delta and theta) gradually increase.16 This represents a crucial ischaemic threshold at which
neurons begin to lose their transmembrane gradients, leading to cell death (infarction). However
as the cerebral blood flow continues to decrease toward the infarction threshold (10-12 ml/100
g/min and below), the EEG becomes silent and cellular damage becomes irreversible.16 Again with
improved perfusion and reperfusion fast frequency gradually returns as demonstrated in this
study126. Summarily, the frequency of epileptiform activity, alpha, beta, alpha delta ratio increased
with time, while delta, theta decreased on EEG tracing within 30day duration.
5.6 PREDICIVE VALUE OF EEG WAVE PATTERN IN ISCHAEMIC AND
HAEMORRHAGIC STROKE
The EEG has been shown to improve prediction of functional outcome in patient with severe
neurological deficit in acute stroke.12 In a previous study to evaluate prognostic value of EEG in
ischaemic stroke, Iranmanesh showed significant positive correlation between mild to severe EEG
abnormalities and poor prognosis.15 In this current study, the PPV, which is strength of truly
predicting poor outcome in acute stroke was on decline for slowing. In another study by Su et al
to find out abnormal pattern on EEG in massive cerebral hemispheric infarction and their
correlation with poor outcome dominant alpha without reactivity, RAWOOD, burst suppression,
epileptiform activity and generalized suppression were correlated with poor outcome.127 Overall
there is a decline in PPV of alpha rhythm from presentation till 30days which means that the true
strength of alpha rhythm in predicting poor outcome was maximal at presentation and decreased.

72
The negative predictive value alpha wave in predicting poor outcome was on linear increase from
presentation to 30days meaning that presence alpha rather excluded poor outcome. Beta wave is
however weakly predictive of poor outcome in this current study.
In a study to assess value of clinical and EEG (findings classified into those predicting poor
outcome and good outcome) in acute stroke showed that while EEG (findings predicting good
outcome) predicted good outcome in 6 out of 7 patients (PPV,0.86), while EEG findings predicting
poor outcome predicted correctly poor outcome in 11 out of 13 patients (PPV, 0.85).12 In a
prospective study of patient with sub-arachnoid haemorrhage who had continuous EEG, Claassen
et al showed that periodic epileptiform discharges, electrographic status epilepticus and absent of
EEG reactivity were associated with poor outcome.86 The EEG is a are very useful in prediction
and diagnosis of post subarachnoid haemorrhage ischaemic due to vasospasm.16,86,128,129 Pattern
of prognostic significance in delayed vasospasm include presence of frontally predominant
biphasic delta waves, focal polymorphic delta and presence of unreactive delta.128 In this present
study, seizures was associated poor outcome but epileptiform patterns like sharps, spikes, PLED
were associated with poor outcome. In a similar study to determine prognostic significance of
interictal and periodic epileptiform patterns during acute stroke, the presence of any of the two
was associated poor prognosis with odd ratio of 2.27.130 The use of emergency EEG in acute
ischaemic
stroke can reveal a distinctive EEG pattern that adds value to the selection of patients for
thrombolytic and cerebral oedema treatment.
5.9 CLINICAL CHARACTERISTICS OF CEREBRAL ISCHEMIA AND
INTRACEREBRAL HAEMORRHAGE
As demonstrated in this present study, the median stroke size and interquartile range for
intracerebral hemorrhage was higher than in ischaemic stroke. Acute stroke size has been

73
correlated with modified Rankin scale (MRS) showing that the higher the size, the worse the
functional outcome in stroke.131 Higher values of NIHSS greater than 20 was associated with poor
outcome in 78.8% of cases with poor outcome, while NIHSS less than 20 was associated with
good outcome in 87.2% of cases with good outcome. Mortality was higher in patients with NIHSS
scores of 20 and above in a study to determine the relationship between NIHSS score to 90-day
mortality in Lagos, southwestern Nigeria by Dawodu et al.132 It was however observed that if
initial NIHSS score remained static or worsened, prognosis was worse. Among such patients, all
those with initial NIHSS score of 20 and above died, compared with those with NIHSS score of
less than 20 who had mortality of 70%. Bruno et al showed that the proportion of NIHSS score
change predicted functional outcome in acute stroke.20 Elevated blood pressure is common in acute
ICH, often with markedly elevated levels, and is associated with poor outcomes.133 This is similar
to what was found in this study that higher systolic and diastolic blood pressure were associated
with poor outcome while lower blood pressure was associated with good outcome. Similarly, other
studies like the Antihypertensive Treatment of Acute Cerebral Hemorrhage (ATACH) trial and
Intensive Blood Pressure Reduction in Acute Cerebral Trial (INTERACT) have demonstrated that
systolic BP reduction to 140 mmHg is well tolerated and associated with attenuation of hematoma
expansion.133,134
5.10 POST STROKE SEIZURES
Stroke is the most common cause of seizure and epilepsy in the elderly population.125,135 Post‐
stroke seizure and post‐stroke epilepsy are common causes of hospital admissions, either as a
presenting feature or as a complication after a stroke.136,137 It is described as a late onset seizure,
when it occurs after two weeks of stroke onset. The prevalence of post stroke seizure varies
between 4 – 67%.91,92,123,124 A review of available data to assess related risk factors and predict
74
early- and late-onset seizure after first ever stroke revealed independent risk factors for early- onset
seizure were large lesions, subarachnoid haemorrhage, initial hyponatremia, and cortical
involvement.138 The independent risk factors for late-onset seizures were cortical involvement and
large lesions.138 A review of Oxfordshire stroke project revealed that 20.7% patients suffered a
seizure at stroke onset.92 In the Cincinnati study, overall incidence of acute seizures after stroke
was 3.1%, with a higher incidence seen in younger patients with haemorrhagic stroke.139 The
OCSP revealed that 11.5% of patients with stroke were at risk of developing post‐stroke seizures
within five years.92,140
Hauser and colleagues reported the incidence of epilepsy and all unprovoked seizures from 1935
through 1984 and found that cerebrovascular disease accounted for 11% of cases.136 Camilo
reported estimates of the rate of early post ischaemic stroke seizures to range from 2% to 33% in
acute stroke.140 In this study, at presentation, seizure was present in 11.25% of cases, however, by
day 30, 32.5% of our cases had seizures. Around 45% of early onset post‐stroke seizures have been
said to occur within the first 24 hours. Late onset seizure has a peak within 6 to 12 months after
the stroke and has a higher recurrence rate of up to 90% in both ischaemic and haemorrhagic
stroke. Early onset seizures after stroke were rather common and did not affect outcome and did
not recur even when not treated with anti-epileptics. Late onset seizures were less common but
were associated with recurrent seizures.141 Finding of 11.25% of seizure at presentation and 23.8%
at 14 days suggests relatively common early onset seizure in this study. Also, presence of seizure
did not significantly affect outcome at 30 days but epileptiform discharges like sharps, spike,
PLED were associated with poor outcome regardless of stroke severity.
PLEDs are usually seen in the context of destructive structural lesions of the cortex, more
frequently in acute ischaemic stroke or herpes simplex encephalitis, and their prognostic

75
significance is linked to the underlying etiology.142–144 In this present study, PLED was seen in
7.5% of the population. PLED association with recent seizures are transient manifestations of
increased neuronal excitability, irrespective of the underlying etiology.142 In general, the presence
of periodic EEG patterns in critically ill adult patients mostly carries a poor prognosis possibly
linked to the underlying etiology. Periodic lateralized epileptiform discharges of cortical origin
were found to have more morphologic variability and longer duration than PLEDs of subcortical
origin in a study to assess neuroimaging and neurophysiological of the entity.142,145
Again, the proportion of epileptiform activities seen were more than the cases of seizures in this
study. This brings forth possibility of electrographic seizures and subclinical seizures and its
attending consequences if not detected and treated in stroke patient. An emerging application for
continuous EEG is to detect new or worsening brain ischemia in patients at high risk, especially
those with subarachnoid haemorrhage.146 Post‐stroke epilepsy could pose a clinical dilemma in
terms of diagnosis and its management is controversial, especially with use of prophylactic anti-
epilepsy.120,147

76
CHAPTER SIX
6.0 CONCLUSION AND RECOMMENDATIONS
6.1 CONCLUSION
EEG is highly sensitive in detecting changes in physiological activities of the brain in acute stroke
because of its close correlation with cerebral blood flow. The study showed increase in background
alpha and beta rhythm, but delta and theta rhythm were decrease in the course of 30-day
monitoring. The PPV of alpha rhythm and slowing in both ischaemic and haemorrhagic stroke
were maximal at presentation and decreased within 30 days. However, that of Beta rhythm
increased marginally and was predictive of poor outcome. The NPV of alpha rhythm and beta
rhythm in predicting poor outcome was increased from presentation to 30 days.
The proportion of epileptiform activities seen on EEG were more than the cases of seizures in this
study. This brings forth possibility of electrographic and subclinical seizures and it’s attending
consequence in acute stroke. Clinical characteristics that were associated with poor outcome
include: location of the stroke, increased temperature, NIHSS >20, increased systolic and diastolic
blood pressure.
6.1 RECOMMENDATIONS
1. Changes in EEG wave patterns are reliable marker of the decline in neuronal integrity
associated with a decline in blood flow.
2. EEG monitoring is useful in detecting subclinical and purely electrographic seizures in
acute stroke.
3. There are EEG wave patterns on Emergency and continuous EEG monitoring that may be
useful in predicting functional outcome in acute stroke.

77
6.2 LIMITATIONS OF THE STUDY
1. Quantitative EEG was not available for use during this study.
2. The study was conducted in patient with acute stroke, thus the predictive value of the EEG
wave patterns at more than 30 days could not be determined.
3. The relationship between the late - onset seizures and EEG wave pattern could not be
ascertained because the study was conducted in patient with acute stroke.
4. The BMI was not calculated because special instrument needed to calculate the weight and
height of unconscious patients was not available.

78
REFERENCES.
1. Thorvaldsen P, Kuulasmaa K, Rajakangas AM, et al. Stroke trends in the WHO MONICA
project. Stroke 1997; 28: 500–506.
2. Sacco RL, Kasner SE, Broderick JP, et al. An updated definition of stroke for the 21st
century: a statement for healthcare professionals from the American Heart
Association/American Stroke Association. Stroke 2013; 44: 2064–2089.
3. Bwala SA. Stroke in a subsaharan Nigerian hospital--a retrospective study. Trop Doct 1989;
19: 11–14.
4. Ogun SA, Ojini FI, Ogungbo B, et al. Stroke in south west Nigeria: a 10-year review.
Stroke 2005; 36: 1120–1122.
5. Talabi OA. A 3-year review of neurologic admissions in University College Hospital
Ibadan, Nigeria. West Afr J Med 2003; 22: 150–151.
6. Obiako OR, Oparah SK, Ogunniyi A. Prognosis and outcome of acute stroke in the
University College Hospital Ibadan, Nigeria. Niger J Clin Pract 2011; 14: 359–362.
7. Ogunniyi A, Chandra V, Schoenberg BS. Conditions associated at death with specific types
of completed stroke in patients with and without hypertension: a case-control study.
Neuroepidemiology 1989; 8: 24–31.
8. Jauch EC, Saver JL, Adams HP, et al. Guidelines for the early management of patients with
acute ischaemic stroke: a guideline for healthcare professionals from the American Heart
Association/American Stroke Association. Stroke 2013; 44: 870–947.
9. Morgenstern LB, Hemphill JC, Anderson C, et al. Guidelines for the management of
spontaneous intracerebral haemorrhage: a guideline for healthcare professionals from the
American Heart Association/American Stroke Association. Stroke 2010; 41: 2108–2129.
10. Chalela JA, Kidwell CS, Nentwich LM, et al. Magnetic resonance imaging and computed
tomography in emergency assessment of patients with suspected acute stroke: a
prospective comparison. Lancet Lond Engl 2007; 369: 293–298.
11. Jordan KG. Emergency EEG and continuous EEG monitoring in acute ischaemic stroke. J
Clin Neurophysiol Off Publ Am Electroencephalogr Soc 2004; 21: 341–352.
12. Cillessen JP, van Huffelen AC, Kappelle LJ, et al. Electroencephalography improves the
prediction of functional outcome in the acute stage of cerebral ischemia. Stroke 1994; 25:
1968–1972.

79
13. Faught E. Current role of electroencephalography in cerebral ischemia. Stroke 1993; 24:
609–613.
14. Luu P, Tucker DM, Englander R, et al. Localizing acute stroke-related EEG changes:
assessing the effects of spatial undersampling. J Clin Neurophysiol Off Publ Am
Electroencephalogr Soc 2001; 18: 302–317.
15. Iranmanesh F. Prognostic value of electrocardiography and electroencephalography in
patients with ischaemic stroke. Acta Neurol Taiwanica 2008; 17: 228–232.
16. Foreman B, Claassen J. Quantitative EEG for the detection of brain ischemia. Crit Care
2012; 16: 216.
17. Burghaus L, Liu W-C, Dohmen C, et al. Prognostic value of electroencephalography and
evoked potentials in the early course of malignant middle cerebral artery infarction.
Neurol Sci Off J Ital Neurol Soc Ital Soc Clin Neurophysiol 2013; 34: 671–678.
18. Hossmann K-A. Pathophysiology and therapy of experimental stroke. Cell Mol Neurobiol
2006; 26: 1057–1083.
19. Adams HP, Davis PH, Leira EC, et al. Baseline NIH Stroke Scale score strongly predicts
outcome after stroke: A report of the Trial of Org 10172 in Acute Stroke Treatment
(TOAST). Neurology 1999; 53: 126–131.
20. Bruno A, Saha C, Williams LS. Using change in the National Institutes of Health Stroke
Scale to measure treatment effect in acute stroke trials. Stroke 2006; 37: 920–921.
21. Woo D, Broderick JP, Kothari RU, et al. Does the National Institutes of Health Stroke
Scale favor left hemisphere strokes? NINDS t-PA Stroke Study Group. Stroke 1999; 30:
2355–2359.
22. Owolabi MO, Platz T. Proposing the Stroke Levity Scale: a valid, reliable, simple, and
time-saving measure of stroke severity. Eur J Neurol 2008; 15: 627–633.
23. Connor MD, Walker R, Modi G, et al. Burden of stroke in black populations in sub-Saharan
Africa. Lancet Neurol 2007; 6: 269–278.
24. Schneider AL, Jordan KG. Regional attenuation without delta (RAWOD): a distinctive
EEG pattern that can aid in the diagnosis and management of severe acute ischaemic
stroke. Am J Electroneurodiagnostic Technol 2005; 45: 102–117.
25. Osuntokun BO. Stroke in the Africans. Afr J Med Med Sci 1977; 6: 39–53.
26. Feigin VL, Lawes CMM, Bennett DA, et al. Stroke epidemiology: a review of population-
based studies of incidence, prevalence, and case-fatality in the late 20th century. Lancet
Neurol 2003; 2: 43–53.
27. Nwosu CM, Nwabueze AC, Ikeh VO. Stroke at the prime of life: a study of Nigerian
Africans between the ages of 16 and 45 years. East Afr Med J 1992; 69: 384–390.
80
28. Wahab KW, Kw W, Okubadejo NU, et al. Predictors of short-term intra-hospital case
fatality following first-ever acute ischaemic stroke in Nigerians. J Coll Physicians Surg--
Pak JCPSP 2008; 18: 755–758.
29. Owolabi MO, Akarolo-Anthony S, Akinyemi R, et al. The burden of stroke in Africa: a
glance at the present and a glimpse into the future. Cardiovasc J Afr 2015; 26: S27-38.
30. Longe AC, Osuntokun BO. Prevalence of neurological disorders in Udo, a rural community
in southern Nigeria. Trop Geogr Med 1989; 41: 36–40.
31. Osuntokun BO, Adeuja AO, Schoenberg BS, et al. Neurological disorders in Nigerian
Africans: a community-based study. Acta Neurol Scand 1987; 75: 13–21.
32. Walker RW, Jusabani A, Aris E, et al. Post-stroke case fatality within an incident
population in rural Tanzania. J Neurol Neurosurg Psychiatry 2011; 82: 1001–1005.
33. Walker RW, Jusabani A, Aris E, et al. Correlates of short- and long-term case fatality
within an incident stroke population in Tanzania. South Afr Med J Suid-Afr Tydskr Vir
Geneeskd 2012; 103: 107–112.
34. Connor MD, Thorogood M, Casserly B, et al. Prevalence of stroke survivors in rural South
Africa: results from the Southern Africa Stroke Prevention Initiative (SASPI) Agincourt
field site. Stroke 2004; 35: 627–632.
35. Danesi M, Okubadejo N, Ojini F. Prevalence of stroke in an urban, mixed-income
community in Lagos, Nigeria. Neuroepidemiology 2007; 28: 216–223.
36. Osuntokun BO, Bademosi O, Akinkugbe OO, et al. Incidence of stroke in an African City:
results from the Stroke Registry at Ibadan, Nigeria, 1973-1975. Stroke 1979; 10: 205–207.
37. Danesi MA, Okubadejo NU, Ojini FI, et al. Incidence and 30-day case fatality rate of first-
ever stroke in urban Nigeria: the prospective community based Epidemiology of Stroke in
Lagos (EPISIL) phase II results. J Neurol Sci 2013; 331: 43–47.
38. Matenga J. Stroke incidence rates among black residents of Harare--a prospective
community-based study. South Afr Med J Suid-Afr Tydskr Vir Geneeskd 1997; 87: 606–
609.
39. Omran AR. The epidemiologic transition: a theory of the epidemiology of population
change. 1971. Milbank Q 2005; 83: 731–757.
40. O’Donnell MJ, Chin SL, Rangarajan S, et al. Global and regional effects of potentially
modifiable risk factors associated with acute stroke in 32 countries (INTERSTROKE): a
case-control study. Lancet Lond Engl 2016; 388: 761–775.
41. Elkind MSV. Epidemiology and risk factors. Contin Minneap Minn 2011; 17: 1213–1232.

81
42. Barker-Collo S, Bennett DA, Krishnamurthi RV, et al. Sex Differences in Stroke Incidence,
Prevalence, Mortality and Disability-Adjusted Life Years: Results from the Global Burden
of Disease Study 2013. Neuroepidemiology 2015; 45: 203–214.
43. Markus HS, Alberts MJ. Update on genetics of stroke and cerebrovascular disease 2005.
Stroke 2006; 37: 288–290.
44. Cole JW, Meschia JF. Stroke Genetics Update: 2011. Curr Cardiovasc Risk Rep 2011; 5:
533–541.
45. O’Donnell MJ, Xavier D, Liu L, et al. Risk factors for ischaemic and intracerebral
haemorrhagic stroke in 22 countries (the INTERSTROKE study): a case-control study.
Lancet Lond Engl 2010; 376: 112–123.
46. Owolabi MO, Agunloye AM. Risk factors for stroke among patients with hypertension: a
case-control study. J Neurol Sci 2013; 325: 51–56.
47. Mugwano I, Kaddumukasa M, Mugenyi L, et al. Poor drug adherence and lack of
awareness of hypertension among hypertensive stroke patients in Kampala, Uganda: a
cross sectional study. BMC Res Notes 2016; 9: 3.
48. Wahab KW. The burden of stroke in Nigeria. Int J Stroke Off J Int Stroke Soc 2008; 3: 290–
292.
49. Alkali NH, Bwala SA, Akano AO, et al. Stroke risk factors, subtypes, and 30-day case
fatality in Abuja, Nigeria. Niger Med J J Niger Med Assoc 2013; 54: 129–135.
50. Abegunde DO, Shengelia B, Luyten A, et al. Can non-physician health-care workers assess
and manage cardiovascular risk in primary care? Bull World Health Organ 2007; 85: 432–
440.
51. Norman R, Gaziano T, Laubscher R, et al. Estimating the burden of disease attributable to
high blood pressure in South Africa in 2000. South Afr Med J Suid-Afr Tydskr Vir
Geneeskd 2007; 97: 692–698.
52. Chen C-J, Brown WM, Moomaw CJ, et al. Alcohol use and risk of intracerebral
haemorrhage. Neurology 2017; 88: 2043–2051.
53. Daniel S, Bereczki D. Alcohol as a risk factor for haemorrhagic stroke. Ideggyogyaszati
Szle 2004; 57: 247–256.
54. Larsson SC, Wallin A, Wolk A, et al. Differing association of alcohol consumption with
different stroke types: a systematic review and meta-analysis. BMC Med 2016; 14: 178.
55. Reynolds K, Lewis B, Nolen JDL, et al. Alcohol consumption and risk of stroke: a meta-
analysis. JAMA 2003; 289: 579–588.
56. Casolla B, Dequatre-Ponchelle N, Rossi C, et al. Heavy alcohol intake and intracerebral
haemorrhage: characteristics and effect on outcome. Neurology 2012; 79: 1109–1115.

82
57. Bamford J, Sandercock P, Dennis M, et al. Classification and natural history of clinically
identifiable subtypes of cerebral infarction. Lancet Lond Engl 1991; 337: 1521–1526.
58. Bamford J, Dennis M, Sandercock P, et al. The frequency, causes and timing of death
within 30 days of a first stroke: the Oxfordshire Community Stroke Project. J Neurol
Neurosurg Psychiatry 1990; 53: 824–829.
59. Rosman KD. The epidemiology of stroke in an urban black population. Stroke 1986; 17:
667–669.
60. Walker RW, Rolfe M, Kelly PJ, et al. Mortality and recovery after stroke in the Gambia.
Stroke 2003; 34: 1604–1609.
61. Huff JS. Stroke mimics and chameleons. Emerg Med Clin North Am 2002; 20: 583–595.
62. Ogun SA, Oluwole O, Fatade B, et al. Comparison of Siriraj Stroke Score and the WHO
criteria in the clinical classification of stroke subtypes. Afr J Med Med Sci 2002; 31: 13–
16.
63. Jäger HR. Diagnosis of stroke with advanced CT and MR imaging. Br Med Bull 2000; 56:
318–333.
64. Muir KW, Buchan A, von Kummer R, et al. Imaging of acute stroke. Lancet Neurol 2006;
5: 755–768.
65. Puetz V, Dzialowski I, Hill MD, et al. The Alberta Stroke Program Early CT Score in
clinical practice: what have we learned? Int J Stroke Off J Int Stroke Soc 2009; 4: 354–
364.
66. Demchuk AM, Coutts SB. Alberta Stroke Program Early CT Score in acute stroke triage.
Neuroimaging Clin N Am 2005; 15: 409–419, xii.
67. Barber PA, Demchuk AM, Hudon ME, et al. Hyperdense sylvian fissure MCA ‘dot’ sign: A
CT marker of acute ischemia. Stroke 2001; 32: 84–88.
68. Li Q, Davis S, Mitchell P, et al. Proximal hyperdense middle cerebral artery sign predicts
poor response to thrombolysis. PloS One 2014; 9: e96123.
69. Shetty SK. The MCA Dot Sign. Radiology 2006; 241: 315–318.
70. Hossmann KA. Viability thresholds and the penumbra of focal ischemia. Ann Neurol 1994;
36: 557–565.
71. Back T. Pathophysiology of the ischaemic penumbra--revision of a concept. Cell Mol
Neurobiol 1998; 18: 621–638.
72. Heiss WD. Experimental evidence of ischaemic thresholds and functional recovery. Stroke
1992; 23: 1668–1672.

83
73. Heiss W-D, Sobesky J, Hesselmann V. Identifying thresholds for penumbra and irreversible
tissue damage. Stroke 2004; 35: 2671–2674.
74. Ginsberg MD. Adventures in the pathophysiology of brain ischemia: penumbra, gene
expression, neuroprotection: the 2002 Thomas Willis Lecture. Stroke 2003; 34: 214–223.
75. Pathophysiology of acute Ischaemic stroke : continuum: Lifelong Learning in Neurology.
LWW. DOI: 10.1212/01.CON.0000275639.07451.e7.
76. Xing C, Arai K, Lo EH, et al. Pathophysiologic cascades in ischaemic stroke. Int J Stroke
Off J Int Stroke Soc 2012; 7: 378–385.
77. Olsen TS. Regional cerebral blood flow after occlusion of the middle cerebral artery. Acta
Neurol Scand 1986; 73: 321–337.
78. Hossmann KA. Periinfarct depolarizations. Cerebrovasc Brain Metab Rev 1996; 8: 195–
208.
79. Barrett KM, Meschia JF. Acute ischaemic stroke management: medical management.
Semin Neurol 2010; 30: 461–468.
80. Harris AD, Coutts SB, Frayne R. Diffusion and perfusion MR imaging of acute ischaemic
stroke. Magn Reson Imaging Clin N Am 2009; 17: 291–313.
81. Leira EC, Adams HP, Rosenthal GE, et al. Baseline NIH stroke scale responses estimate the
probability of each particular stroke subtype. Cerebrovasc Dis Basel Switz 2008; 26: 573–
577.
82. Banks JL, Marotta CA. Outcomes validity and reliability of the modified Rankin scale:
implications for stroke clinical trials: a literature review and synthesis. Stroke 2007; 38:
1091–1096.
83. Effect Of Admission Hyperglycaemia On Short-Term Outcome In Adult Nigerians With A
First Acute Ischaemic Stroke.
ResearchGatehttps://www.researchgate.net/publication/272549263_
84. Mustapha AF, Ogunniyi OA, Sanya EO. Acute Stroke at The University College Hospital
Ibadan, Nigeria: Clinical Profile and Predictors of 30-day Mortality. Niger Med Pract; 59.
Epub ahead of print 1 January 2011. DOI: 10.4314/nmp.v59i1-2.67102.
85. Claassen J, Hirsch LJ, Kreiter KT, et al. Quantitative continuous EEG for detecting delayed
cerebral ischemia in patients with poor-grade subarachnoid haemorrhage. Clin
Neurophysiol Off J Int Fed Clin Neurophysiol 2004; 115: 2699–2710.
86. Claassen J, Hirsch LJ, Frontera JA, et al. Prognostic significance of continuous EEG
monitoring in patients with poor-grade subarachnoid haemorrhage. Neurocrit Care 2006;
4: 103–112.

84
87. Poothrikovil RP, Gujjar AR, Al-Asmi A, et al. Predictive Value of Short-Term EEG
Recording in Critically ill Adult Patients. Neurodiagnostic J 2015; 55: 157–168.
88. Abend NS, Dlugos DJ, Clancy RR. A review of long-term EEG monitoring in critically ill
children with hypoxic-ischaemic encephalopathy, congenital heart disease, ECMO, and
stroke. J Clin Neurophysiol Off Publ Am Electroencephalogr Soc 2013; 30: 134–142.
89. García-Morales I, García MT, Galán-Dávila L, et al. Periodic lateralized epileptiform
discharges: etiology, clinical aspects, seizures, and evolution in 130 patients. J Clin
Neurophysiol Off Publ Am Electroencephalogr Soc 2002; 19: 172–177.
90. Asconapé JJ, Penry JK. Poststroke seizures in the elderly. Clin Geriatr Med 1991; 7: 483–
492.
91. Bladin CF, Alexandrov AV, Bellavance A, et al. Seizures after stroke: a prospective
multicenter study. Arch Neurol 2000; 57: 1617–1622.
92. Burn J, Dennis M, Bamford J, et al. Epileptic seizures after a first stroke: the Oxfordshire
Community Stroke Project. BMJ 1997; 315: 1582–1587.
93. Arboix A, García-Eroles L, Massons JB, et al. Predictive factors of early seizures after
acute cerebrovascular disease. Stroke 1997; 28: 1590–1594.
94. Hjort N, Christensen S, Sølling C, et al. Ischaemic injury detected by diffusion imaging 11
minutes after stroke. Ann Neurol 2005; 58: 462–465.
95. Kohno K, Hoehn-Berlage M, Mies G, et al. Relationship between diffusion-weighted MR
images, cerebral blood flow, and energy state in experimental brain infarction. Magn
Reson Imaging 1995; 13: 73–80.
96. Sims JR, Gharai LR, Schaefer PW, et al. ABC/2 for rapid clinical estimate of infarct,
perfusion, and mismatch volumes. Neurology 2009; 72: 2104–2110.
97. Webb AJS, Ullman NL, Morgan TC, et al. Accuracy of the ABC/2 Score for Intracerebral
Haemorrhage: Systematic Review and Analysis of MISTIE, CLEAR-IVH, and CLEAR
III. Stroke 2015; 46: 2470–2476.
98. Kothari RU, Brott T, Broderick JP, et al. The ABCs of measuring intracerebral hemorrhage
volumes. Stroke 1996; 27: 1304–1305.
99. Maeda AK, Aguiar LR, Martins C, et al. Hematoma volumes of spontaneous intracerebral
haemorrhage: the ellipse (ABC/2) method yielded volumes smaller than those measured
using the planimetric method. Arq Neuropsiquiatr 2013; 71: 540–544.
100. Sacco RL, Benjamin EJ, Broderick JP, et al. American Heart Association Prevention
Conference. IV. Prevention and Rehabilitation of Stroke. Risk factors. Stroke 1997; 28:
1507–1517.
85
101. Connolly ES, Rabinstein AA, Carhuapoma JR, et al. Guidelines for the management of
aneurysmal subarachnoid haemorrhage: a guideline for healthcare professionals from the
American Heart Association/american Stroke Association. Stroke 2012; 43: 1711–1737.
102. Expert Panel on Detection, Evaluation, and Treatment of High Blood Cholesterol in Adults.
Executive Summary of The Third Report of The National Cholesterol Education Program
(NCEP) Expert Panel on Detection, Evaluation, And Treatment of High Blood Cholesterol
In Adults (Adult Treatment Panel III). JAMA 2001; 285: 2486–2497.
103. Rosch PJ. Guidelines for diagnosis and treatment of high cholesterol. JAMA 2001; 286:
2401; author reply 2401-2402.
104. Adams HP, Bendixen BH, Kappelle LJ, et al. Classification of subtype of acute ischaemic
stroke. Definitions for use in a multicenter clinical trial. TOAST. Trial of Org 10172 in
Acute Stroke Treatment. Stroke 1993; 24: 35–41.
105. Maganti RK, Rutecki P. EEG and epilepsy monitoring. Contin Minneap Minn 2013; 19:
598–622.
106. Westmoreland BF. Epileptiform electroencephalographic patterns. Mayo Clin Proc 1996;
71: 501–511.
107. Hamer HM. [Seizures and epilepsies after stroke]. Nervenarzt 2009; 80: 405–414.
108. Reith J, Jørgensen HS, Nakayama H, et al. Seizures in Acute Stroke: Predictors and
Prognostic Significance. Stroke 1997; 28: 1585–1589.
109. Cabral NL, Longo A, Moro C, et al. Education level explains differences in stroke
incidence among city districts in Joinville, Brazil: a three-year population-based study.
Neuroepidemiology 2011; 36: 258–264.
110. Avendaño M, Kunst AE, Huisman M, et al. Educational level and stroke mortality: a
comparison of 10 European populations during the 1990s. Stroke 2004; 35: 432–437.
111. Malyutina S, Bobak M, Simonova G, et al. Education, marital status, and total and
cardiovascular mortality in Novosibirsk, Russia: a prospective cohort study. Ann
Epidemiol 2004; 14: 244–249.
112. Löfmark U, Hammarström A. Evidence for age-dependent education-related differences in
men and women with first-ever stroke. Results from a community-based incidence study
in northern Sweden. Neuroepidemiology 2007; 28: 135–141.
113. Wahab KW, Okokhere PO, Ugheoke AJ, et al. Awareness of warning signs among
suburban Nigerians at high risk for stroke is poor: a cross-sectional study. BMC Neurol
2008; 8: 18.
114. Mandelzweig L, Goldbourt U, Boyko V, et al. Perceptual, social, and behavioral factors
associated with delays in seeking medical care in patients with symptoms of acute stroke.
Stroke 2006; 37: 1248–1253.

86
115. Bonita R, Duncan J, Truelsen T, et al. Passive smoking as well as active smoking increases
the risk of acute stroke. Tob Control 1999; 8: 156–160.
116. Kolominsky-Rabas PL, Sarti C, Heuschmann PU, et al. A prospective community-based
study of stroke in Germany--the Erlangen Stroke Project (ESPro): incidence and case
fatality at 1, 3, and 12 months. Stroke 1998; 29: 2501–2506.
117. Walker R, Whiting D, Unwin N, et al. Stroke incidence in rural and urban Tanzania: a
prospective, community-based study. Lancet Neurol 2010; 9: 786–792.
118. Feigin VL, Forouzanfar MH, Krishnamurthi R, et al. Global and regional burden of stroke
during 1990-2010: findings from the Global Burden of Disease Study 2010. Lancet Lond
Engl 2014; 383: 245–254.
119. Mecarelli O, Pro S, Randi F, et al. EEG patterns and epileptic seizures in acute phase
stroke. Cerebrovasc Dis Basel Switz 2011; 31: 191–198.
120. Niedzielska K, Barańska-Gieruszczak M, Kuran W, et al. [EEG value in cases of epileptic
seizures in early phase of stroke]. Neurol Neurochir Pol 2001; 35: 595–603.
121. Rosenthal ES. The utility of EEG, SSEP, and other neurophysiologic tools to guide
neurocritical care. Neurother J Am Soc Exp Neurother 2012; 9: 24–36.
122. Park W, Kwon GH, Kim Y-H, et al. EEG response varies with lesion location in patients
with chronic stroke. J Neuroengineering Rehabil 2016; 13: 21.
123. Cheung C-M, Tsoi T-H, Au-Yeung M, et al. Epileptic seizure after stroke in Chinese
patients. J Neurol 2003; 250: 839–843.
124. Smith SJM. EEG in the diagnosis, classification, and management of patients with epilepsy.
J Neurol Neurosurg Psychiatry 2005; 76 Suppl 2: ii2-7.
125. Silverman IE, Restrepo L, Mathews GC. Poststroke seizures. Arch Neurol 2002; 59: 195–
201.
126. Finnigan SP, Rose SE, Chalk JB. Rapid EEG changes indicate reperfusion after tissue
plasminogen activator injection in acute ischaemic stroke. Clin Neurophysiol Off J Int Fed
Clin Neurophysiol 2006; 117: 2338–2339.
127. Su YY, Wang M, Chen WB, et al. Early prediction of poor outcome in severe hemispheric
stroke by EEG patterns and gradings. Neurol Res 2013; 35: 512–516.
128. Rivierez M, Landau-Ferey J, Grob R, et al. Value of electroencephalogram in prediction
and diagnosis of vasospasm after intracranial aneurysm rupture. Acta Neurochir (Wien)
1991; 110: 17–23.
129. Gaspard N. Current Clinical Evidence Supporting the Use of Continuous EEG Monitoring
for Delayed Cerebral Ischemia Detection. J Clin Neurophysiol Off Publ Am
Electroencephalogr Soc 2016; 33: 211–216.

87
130. Lima FO, Ricardo JAG, Coan AC, et al. Electroencephalography Patterns and Prognosis in
Acute Ischaemic Stroke. Cerebrovasc Dis Basel Switz 2017; 44: 128–134.
131. Bruno A, Shah N, Akinwuntan AE, et al. Stroke size correlates with functional outcome on
the simplified modified Rankin Scale questionnaire. J Stroke Cerebrovasc Dis Off J Natl
Stroke Assoc 2013; 22: 781–783.
132. Dawodu CO, Danesi MA. Relationship of National Institute of Health Stroke Scores
[NIHSS] to 90 days mortality in Africa. Niger Postgrad Med J 2008; 15: 259–263.
133. Manning LS, Robinson TG. New Insights into Blood Pressure Control for Intracerebral
haemorrhage. Front Neurol Neurosci 2015; 37: 35–50.
134. Anderson CS, Huang Y, Wang JG, et al. Intensive blood pressure reduction in acute
cerebral trial (INTERACT): a randomised pilot trial. Lancet Neurol 2008; 7: 391–399.
135. Ogunniyi A, Ogunniyi JO, Bademosi O, et al. Aetiology of status epilepticus in Ibadan: a
neuropathologic study. West Afr J Med 1992; 11: 263–267.
136. Myint PK, Staufenberg EFA, Sabanathan K. Post-stroke seizure and post-stroke epilepsy.
Postgrad Med J 2006; 82: 568–572.
137. Bleck TP. Seven Questions About Stroke and Epilepsy. Epilepsy Curr 2012; 12: 225–228.
138. Wang G, Jia H, Chen C, et al. Analysis of risk factors for first seizure after stroke in
Chinese patients. BioMed Res Int 2013; 2013: 702871.
139. Szaflarski JP, Rackley AY, Kleindorfer DO, et al. Incidence of seizures in the acute phase
of stroke: a population-based study. Epilepsia 2008; 49: 974–981.
140. Camilo O, Goldstein LB. Seizures and epilepsy after ischaemic stroke. Stroke 2004; 35:
1769–1775.
141. Dhanuka AK, Misra UK, Kalita J. Seizures after stroke : a prospective clinical study.
Neurol India 2001; 49: 33–36.
142. Orta DSJ, Chiappa KH, Quiroz AZ, et al. Prognostic implications of periodic epileptiform
discharges. Arch Neurol 2009; 66: 985–991.
143. Hernández-Fernández F, Fernández-Díaz E, Pardal-Fernández JM, et al. Periodic
lateralized epileptiform discharges as manifestation of pneumococcal
meningoencephalitis. Int Arch Med 2011; 4: 23.
144. Neufeld MY, Vishnevskaya S, Treves TA, et al. Periodic lateralized epileptiform
discharges (PLEDs) following stroke are associated with metabolic abnormalities.
Electroencephalogr Clin Neurophysiol 1997; 102: 295–298.

88
145. Kalamangalam GP, Diehl B, Burgess RC. Neuroimaging and neurophysiology of periodic
lateralized epileptiform discharges: observations and hypotheses. Epilepsia 2007; 48:
1396–1405.
146. Friedman D, Claassen J, Hirsch LJ. Continuous electroencephalogram monitoring in the
intensive care unit. Anesth Analg 2009; 109: 506–523.
147. Garibi JM. [Prophylactic antiepileptic treatment of cerebral aggressions]. Rev Neurol 2002;
34: 446–448.
APPENDIX 1
(ETHICAL APPROVAL)

89
APPENDIX 11
INFORMED CONSENT

90
IRB Research approval number: ________________
My name is ………………………, I am a staff of the ……………………., University College
Hospital (UCH), Ibadan. I am carrying out a study on patients with stroke at the UCH to explore
the prognostic role of electroencephalography in acute stroke.
During this exercise, I will need to ask you some questions and carry out physical examination.
This examination will include electroencephalography which involves tiny non-metallic materials
to measure electrical activity of the brain, checking for swallowing difficulty involve touching
back of your throat with a wooden spatula, giving you 10mls of water to drink and attaching pulse
oximeter to your index finger. These procedures will not cause you any harm. Your blood sample
will be taken and sent for random blood glucose, full blood count, genotype, retroviral screening
and blood electrolytes. The process of taking the specimen will not cause any harm but a slight
pain during the introduction of the needle.
These investigations will be at no cost to the patients or their relatives. I also require your
permission to use your brain CT or MRI for the purpose of this study.
All the information obtained will be treated with absolute confidentiality. Appropriate therapy will
be instituted as necessary.
You are free to take part in this study. If you decide not to participate in this study, you will not be
treated differently from any other patients attending this hospital. You have a right to withdraw
from this study anytime you choose. (This will be explained in the vernacular to those who do not
understand English).
Statement of person obtaining informed consent:
I have fully explained this research to ____________________________________and have
given sufficient information, including about risks and benefits, to make an informed decision.
Name: ..................................................... Signature/Date.............................................

91
Statement of person giving consent:
I have read the description of the research or have had it translated into a language I understand.
I have also discussed the doctor to my satisfaction. I understand that my participation is voluntary.
I know enough about the purpose, methods, risks and benefits of the research study to judge that I
want to take part in it. I understand that I may freely stop being part of this study at any time. I
have received a copy of this consent form and additional information sheet to keep for myself.
Name: ................................................. Signature/Date......................................
Witness’s Signature (If Applicable):....................................................................
Witness’s Name (if applicable):...............................................................................
This research has been approved by the Health Research Ethics Committee of the University of
Ibadan and the Chairman of this committee can be contacted at Biode Building, 2nd Floor,
RoomT10, IMRAT, College of Medicine, University of Ibadan. E-mail: [email protected].
In addition, if you have any question about your participation in this research, you can contact the
principal investigator Dr. Luqman Opeoluwa Ogunjimi, College of Medicine, University college
Hospital, Ibadan. Phone number: 07032683222
E-mail: [email protected]
PLEASE KEEP A COPY OF THE SIGNED INFORMED CONSENT
APPENDIX II1:
STUDY QUESTIONNAIRE (To be completed by the investigator)

92
SECTION A:
Please tick the corresponding number provided where applicable
(1) Serial Number: ________________
(2) Hospital Number: __________________________
(3) Name: Surname Other Names:
(4) Age at last Birthday (in Years):_________________
(5) Gender: ( ) Male ( ) Female
(6) Ethnicity: ( ) Hausa ( ) Igbo ( ) Yoruba ( ) Others Specify_______________
(7) Handedness: ( ) Right ( ) Left
(8) Highest Level of Education: ( ) Primary ( ) Secondary ( )Tertiary ( ) Postgraduate.
(9) Level of Monthly Income (N): ( ) ≤ 20,000 ( ) 20,001- 50,000 ( ) 50,001- 100,000 ( ) 100,001-
200,000 ( ) 200,001-500,000 ( )>500,000
(10) Hypertension ( ) Yes ( ) No ( ) Don’t know Treatment ____________________
If yes, please specify the duration ________________________
(11) A. Diabetes Mellitus: ( ) Yes ( ) No ( ) Don’t know Treatment________________________
If yes, please specify the duration _______________________
B. Hyperlipidemia ( ) Yes ( ) No ( ) Don’t know
(12) Alcohol: ( )Yes ( ) No
If yes, please specify type (gram per week) _______________
(13) Smoking ( ) Yes ( ) No
If yes, please specify number of sticks per day (expressed as “pack years”) _________
(14) Background seizure ( ) Yes ( ) No
If Yes, since when_________________________
(15) Family History of Seizures ( ) Yes ( ) No
If yes, (a) Duration___________ (b) Medications ______________
(16) Date of Presentation: Day Month Year
(17) Date of Discharge:\Demise Day Month Year
SECTION B: PHYSICAL FINDINGS
(18) Glasgow Coma Scale Score: ( ) 14 – 15 ( ) 9 - 13 ( ) 3 – 8

93
(19) Dysphasia: ( ) Present ( ) Absent
If present, please specify type ______________________
(20) Dysarthria: ( ) Present ( ) Absent
(21) Cranial nerves: ( ) Normal ( ) Abnormal
(22) If abnormal, please specify ________________________________
(23) Motor weakness: ( ) Hemiparesis ( ) Quadriparesis ( ) Monoparesis ( ) Absent
(24) Coordination: ( ) Normal ( ) Abnormal
(25) Movement Disorder: ( ) Present ( ) Absent
If present, please specify ______________________________
(26) Pulse: _____________________________
(27) Admitting Blood Pressure: ( ) Systolic BP____________ ( )
Diastolic BP ____________
(28) Apex beat: ( ) Displaced ( ) Not displaced
(29) Heart Murmurs: ( ) Present ( ) Absent
If present, please specify _________________________________
(30) Respiratory rate ( ) Normal ( ) Abnormal
If abnormal please specify ________________________________
(31) Chest crackles ( ) Present ( ) Absent
(32) Bronchial breath sound ( ) Present ( ) Absent
(33) Highest Temperature in the last 24hrs ___________________

94
SECTION C: NEUROIMAGING
Date of Neuroimaging
CT/MRI : Yes No
Type of Scan: Without contrast With contrast
Normal findings? Yes No
Stroke type: CI ICH SAH
Subtype of Stroke:
A. OSCP Classification C. TOAST Classification
I. TACI Yes No I. Large vessel Yes No
II. PACI Yes No II. Small vessel/lacunar Yes No
III. POCI Yes No III. Cardioembolic Yes No
IV. LACI Yes No IV. Undetermined Yes No
V. Others: Dissection Yes No
B. ASCO Classification VI. Vasculitis Yes No
I. Atherosclerosis Yes No VII. CVST Yes No
II. Small vessel disease Yes No
III. Cardiac disease Yes No
Arterial Territory ACA MCA PCA
Vertebrobasilar PICA SCA
Ant choroidal Lenticulostriate Watershed
Watershed infarct
1. Cortical: ACA/MCA MCA/PCA
2. Deep: LSA perforators/MCA penetrating branches
OTHER FINDINGS
a. cerebral atrophy
Yes No
b. Periventricular/white matter changes Yes No
c. Aneurysm
d. Arteriovenous malformation
e. Lacunar

95
Location of Lesion
Right Hemisphere Left hemisphere
Size (cm) Volume Age
Size(cm) Volume Age
Cortical
Frontallobe
Temporallobe
Parietallobe
Occipotallobe
Subcortical
Thalamus
Pituitary gland
Internal capsule
Putamenal
Basalganglia (caudate nucleus
globuspallidum putamen)
Cerebellar
Brainstem
Midbrain
Pons
Medulla
Ventricle
Lateral ventricle
3rdventricule
4th ventricle
*Size: Largest dimension in any direction †Volume: Entire volume # Age: 1-Hyperacute; 2- Acute; 3- Subacute; 4- Chronic
*Size: 0-3 3.1-5.0 5.1-7.0 7.1-10.0 >10.0
†Volume: 0.0-3.0 3.1-5.0 5.1-7.0 7.1-10.0 >1

96
D: EEG FINDINGS
1. Voltage/Amplitude
2. Alert/Sleep recording
3. Background
4. Pattern
a. Slowing Diffuse Intermittent
b. PLED
c. BiPED
d. RAWOD
e. TIRDA
f. FIRDA
g. OIRDA
h. BECTS
i. Wicket
j. Sharps
k. Spikes
l. Arterfact
m. Phase reversal
n. Others_____________________________
5. Frequency/Rhythm
6. Symmetry
7. Activation procedures/Results
8. Medications
9. Location
a. Frontal
b. Temporal
c. Parietal
d. Occipital
e. Central
10. Conclusion /Remarks ---------------------------------------------------------------------------------
-----------------------------------------------------------------------------------------------------------

97
SECTION E: Laboratory Results
WBC differentials (%)
Neutrophils Lymphocyte Monocyte
Eosinophils Basophil
Sodium ________ meq/L OR ______ mmol/L MCV_______
Potassium _______ meq/L ______ mmol/L MCH_______
Total Cholesterol _____ mg/dL ______ mmol MCHC/L______
Triglycerides _______ mg/dL ______ mmol/L HbA, C_______
LDL-Cholesterol ______ mg/dL ______ mmol/L ESR________
LDL-C:HDL-C ratio ____ mg/dL ______ mmol/L
Random glucose at admission _____ mg/dL _____ mmol/L
Fasting glucose _____ mg/dL _____ mmol/L
2HPPG _____ mg/dL _____ mmol/L
Urea _____ mg/dL ______ mmol/L
Creatinine _____ mg/dL ______ mmol/L
Uric Acid
Proteinuria: Yes No If ‘Yes’, how much ?____________
Genotype: AA____ AS____ AC _____ SC ____ SS ____ Others ______________
Retroviral Screening: Yes___ No___ If positive, are you currently on medications? Yes____ No____
CD4 Count if known (if positive)___________
Date
INR PCV(%) WBC(/mm3) Platelets(x103/mm)

98
APPENDIX IV
National Institute of Health Stroke Scale (NIHSS)
Date and time DD-MM-YYYY HH:MM (24h) Score
1.a. Level of Consciousness 0: Alert
1: Not alert, but arousable with minimal stimulation
2: Not alert, requires repeated stimulation to attend
3: Coma
1.b. LOC questions (Ask patient the month and her/his age)
0: Answers both correctly
1: Answers one correctly
2: Both incorrect
1.c. LOC commands (Ask patient to open/close eyes & form/release fist)
0: Obeys both correctly
1: Obeys one correctly
2: Both incorrect
2. Best gaze (only horizontal eye movement)
0: Normal
1: Partial gaze palsy
2: Total gaze paresis or Forced deviation
3. Visual Field testing
0: No visual field loss
1: Partial hemianopia
2: Complete hemianopia
3: Bilateral hemianopia (blind including cortical blindness)
4. Facial Paresis (Ask patient to show teeth/ raise eyebrows & close eyes tightly)
0: Normal symmetrical movement
1: Minor paralysis (flattened nasolabial fold, asymmetry on smiling)
2: Partial paralysis (total or near total paralysis of lower face)
3: Complete paralysis of one or both sides (absence of facial movement in the upper and lower face)
5. Motor Function – Arm
0: Normal (extends arms 900 (or 450) for 10 seconds without drift)
1: Drift
2: Some effort against gravity
3: No effort against gravity
4: No movement
9: Untestable (Joint fused or limb amputated) (do not add score)
Right
Left
6. Motor Function - Leg
0: Normal (hold leg in 300 position for 5 sec without drift)
1: Drift
2: Some effort against gravity
3: No effort against gravity
4: No movement
9: Untestable (Joint fused or limb amputated) (do not add score)
Right
Left
7. Limb Ataxia 0: No ataxia
1: Present in one limb
2: Present in two limbs
8. Sensory (Use pinprick to test arms, legs, trunk and face- compare side to side)
0: Normal
1: Mild to moderate decrease in sensation
2: Severe to total sensory loss
9. Best Language (Ask patient to describe picture, name items, read sentences)
0: No aphasia
1: Mild to moderate aphasia
2: Severe aphasia
3: Mute
10. Dysarthria (Ask patient to read several words)
0: Normal articulation
1: Mild to moderate slurring of words
2: Near unintelligible or unable to speak
9: Intubated or other physical barrier (do not add score)
11. Extinction and inattention (Formerly Neglect) (Use visual or sensory double stimulation)
0: Normal
1: Inattention or extinction to bilateral simultaneous stimulation in one of the sensory modalities

99
2: Severe hemi-inattention or hemi-inattention to more than one modality
Total Score

100
APPENDIX V
Modified Rankin Scale (MRS)
MODIFIED RANKIN SCALE
Score Description
0
No symptoms at all
1
No significant disability despite symptoms; able to carry out all usual duties and
activities
2
Slight disability; unable to carry out all previous activities, but able to look after
own affairs without assistance
3
Moderate disability; requiring some help, but able to walk without assistance
4
Moderately severe disability; unable to walk without assistance and unable to
attend to own bodily needs without assistance
5
Severe disability; bedridden, incontinent and requiring constant nursing care and
attention
6
Dead
Total (0-6): ______

101
APPENDIX V1
STROKE LEVITY SCALE (SLS)
0
nil
1 flicker of
movement
2 active
1motion
when
gravity is
eliminated
3 active
motion
against
gravity
4 active motion
against moderate
resistance
5 normal
Best motor
power in
dominant
hand/upper limb
Best motor
power in weaker
lower limb
Speech disorder
(aphasia)
0-nil
1-present
Mobility 1-
bedbound 2-
chairbound
3-walks
with one
helper
4-walks
independently
with aids
(e.g.frame/tripod)
5-walks
unaided
MRC, Motor Research Council.
The score in the lower limb is determined as the maximum MRC power grade across the hip or
ankle joint (whichever is higher). This is tested recumbent with assessment of hip flexion and ankle
dorsiflexion. The power in the distal arm is tested by asking the patient to extend the wrist whilst
making a fist. Aphasia is present if the patient is unable to comprehend and obey commands during
assessment of items (i) and (ii) or unable to name a key.
Stroke Levity Scale = i + ii + iii + iv = maximum MRC power grade in the dexterous hand +
maximum MRS power in the affected lower limb + mobility score – 1 (if aphasia is present).
Minimum = 0, maximum = 15.

102
APPENDIX VI1
Barthel Index
A -
Date and time DD-MM-YYYY HH:MM (24h) Score
Bowels
0=Incontinent (or needs to be given enema)
5=Occasional accident (once/week)
10=Continent
Bladder
0=Incontinent, or catheterized and unable to manage
5=Occasional accident (max once per 24 h)
10=Continent (for more than 7 days)
Grooming
0=Needs help with personal care
5=Independent face/hair/teeth/shaving (implements provided)
Toilet use
0=Dependent
5=Needs some help, but can do something alone
10=Independent (on and off, dressing, wiping)
Feeding
0=Unable
5=Needs help cutting, spreading butter, etc.
10=Independent (food provided in reach)
Transfer
0=Unable, no sitting balance
5=Major help (one or two people, physical), can sit
10=Minor help (verbal or physical)
15=Independent
Mobility
0=Immobile
5=Wheelchair independent, including corners, etc.
10=Walks with help of one person (verbal or physical)
15=Independent (but may use any aid—e.g., stick)
Dressing
0=Dependent
5=Needs help, but can do about half unaided
10=Independent (including buttons, zips, laces, etc.)
Stairs
0=Unable
5=Needs help (verbal, physical, carrying aid)
10=Independent up and down
Bathing
0=Dependent
5=Independent (or in shower)
Total Score ( 0 – 100)

103
APPENDIX VII1: FIGURES AND VALUES
FIGURE 2A: ISCHAEMIC STROKE PHENOTYPING USING OCSP
Classification of Stroke subtypes %
TACI 6.12
PACI 44.89
POCI 6.12
LACI 42.87
B - FIGURE 2B: ISCHAEMIC STROKE PHENOTYPING USING TRIAL OF ORG 10172
IN ACUTE STROKE TREATMENT (TOAST)
Classification of Stroke subtypes %
Large Vessel 35.85
Small Vessel 37.74
Cardio-embolic 20.75
Undetermined 5.72
C- FIGURE 3: BACKGROUND RHYTHM AMONG STROKE PATIENTS
At Presentation 72hrs 7days 14days 30days
Alpha (%) 24.1 26.3 27.5 26.3 31.2
Abnormal (%) 74.6 68.7 56.2 45.0 25.0
D- FIGURE 4: PATTERN OF EEG WAVES FROM ADMISSION TO 30DAYS
At Presentation 72hrs 7days 14days 30days
Alpha (%) 24.1 26.3 27.5 26.3 31.2
Beta (%) 12.7 6.3 5.0 10.0 12.5
Slow waves(%) 61.9 62.4 51.2 35.0 12.5
E- FIGURE 5: EPILEPTIFORM PATTERN AMONG STROKE PATIENTS
At Presentation 72hrs 7days 14days 30days
Absent (%) 68.4 67.1 37.3 42.1 55.6
Present (%) 31.6 32.9 62.7 57.9 44.4
F- FIGURE 6: ASSOCIATION BETWEEN BACKGROND EEG WAVE
PATTERN AND OUTCOME IN ISCHAEMIC STROKE PATIENTS
(Others – Beta, Delta and Theta Waves)
Day 14 Day 30 Good Outcome Poor Outcome Good Outcome Poor Outcome
Slowing 71.4 83.3 66.7 71.4
No Slowing 28.6 16.7 33.3 28.6
p-value:0.095 p-value:0.039

104
G- FIGURE 7:ROLE OF SLOWING IN PREDICTING OUTCOME AMONG
HEAMORRHAGIC STROKE PATIENTS
Day 14 Day 30 Good Outcome Poor Outcome Good Outcome Poor Outcome
Slowing 86.7 54.5 53.3 37.5
No slowing 13.3 45.5 46.7 62.5
p-value:0.047 p-value:0.005
H- FIGURE 8: TREND OF PREDICTIVE VALUES OF SLOWING AMONG STROKE
PATIENTS
At Presentation Day 14 Day 30 PPV NPV PPV NPV PPV NPV
Ischaemic 0.36 0.57 0.33 0.8 0.22 0.82
(Hae 0.46 0.4 0.32 0.29 0.27 0.58
morrhagic)
I- FIGURE 9: SHOWING ROLE OF ALPHA IN PREDICTING THE OUTCOME AMONG
ISCHAEMIC STROKE PATIENTS
Day 14 Day 30 Good Outcome Poor Outcome Good Outcome Poor Outcome
Alpha 28.6 0 29.6 14.3
Others 71.4 100 70.4 85.7
J- FIGURE 10: SHOWING ROLE OF ALPHA IN PREDICTING OUTCOME
AMONG HAEMORRHAGIC STROKE PATIRNTS Day 14 Day 30
Good Outcome Poor Outcome Good Outcome Poor Outcome
Alpha 53.3 9.1 53.3 37.5
Others 46.7 90.9 46.7 62.5
K- FIGURE 11: TREND OF PREDICTIVE VALUES OF ALPHA AMONG STROKE
PATIENTS
At Presentation Day 14 Day 30 PPV NPV PPV NPV PPV NPV
Ischaemic 0.2 0.57 0 0.63 0.11 0.76
(Hae 0.43 0.5 0.11 0.41 0.27 0.58
morrhagic)
L- FIGURE 12: SHOWING ROLE OF BETA IN PREDICTING OUTCOME
AMONG ISCHAEMIC STROKE Day 14 Day 30
Good Outcome Poor Outcome Good Outcome Poor Outcome
Beta 17.9 16.7 33.3 42.9
Others 82.1 83.3 66.7 57.1

105
M- FIGURE 13: ROLE OF BETA IN PREDICTING OUTCOME AMONG
HAEMORRHAGIC STROKE Day 14 Day 30
Good Outcome Poor Outcome Good Outcome Poor Outcome
Beta 20 9 20 25
Others 80 91 80 75
FIGURE 14: SHOWING TREND OF PREDICTIVE VALUES OF BETA WAVE AMONG
STROKE PATIENTS
At Presentation Day 14 Day 30 PPV NPV PPV NPV PPV NPV
Ischaemic 0.14 0.6 0.29 0.7 0.17 0.81
(Hae 0.33 0.5 0.25 0.55 0.4 0.67
morrhagic)

106
APPENDIX IX
( Postive Predictive Value, Negative Predictive Value, Sensitivity, Specificity )
Contingency matrix and measures calculated based on it 2x2 contingency table for displaying
the outcome of predictions. Based on the table it is possible to calculate row and column wise
parameters, PPV and NVP, and sensitivity and specificity, respectively. Positive connotes
presence of specific EEG wave pattern or abnormality and negative connotes absence of
specific EEG wave pattern or abnormality. Accuracy is a measure that is calculated based
on all the four figures in the table.

107