title increasing hybridization rate and sensitivity of ... et al. demonstrated a duplex assay by...
TRANSCRIPT

Title Increasing Hybridization Rate and Sensitivity of Bead-BasedAssays Using Isotachophoresis
Author(s) Shintaku, Hirofumi; Palko, James W.; Sanders, Glenn M.;Santiago, Juan G.
Citation Angewandte Chemie (2014), 126(50): 14033-14036
Issue Date 2014-10-10
URL http://hdl.handle.net/2433/199656
Right
This is the peer reviewed version of the following article:Shintaku, H., Palko, J. W., Sanders, G. M. and Santiago, J. G.(2014), Increasing Hybridization Rate and Sensitivity of Bead-Based Assays Using Isotachophoresis. Angew. Chem., 126:14033‒14036, which has been published in final form athttp://dx.doi.org/10.1002/ange.201408403. This article may beused for non-commercial purposes in accordance with WileyTerms and Conditions for Self-Archiving.; 許諾条件により本文ファイルは2015-10-10に公開.
Type Journal Article
Textversion author
Kyoto University

COMMUNICATION
Increasing hybridization rate and sensitivity of bead based assays using isotachophoresis Hirofumi Shintakua,b, James W. Palkoa, Glenn M. Sandersc, and Juan G. Santiagoa*
Abstract: We present an electrokinetic technique to increase the reaction rate and sensitivity of bead based assays. We use isotachophoresis(ITP) to preconcentrate and co-focus target molecules and beads into a single ITP zone. The process achieves rapid mixing, stirring, and strongly increases binding reaction rate. We demonstrate our assay with quantitative detection of 24 nt single-stranded DNA over a dynamic range of 3 orders of magnitude and multiplexed detection of 10 target species per sample. We show that ITP can achieve approximately the same sensitivity as a well-stirred standard reaction in 60-fold less reaction time (20 min versus 20 h). Alternately, compared to standard reaction times of 30 min, we show that 20 min ITP hybridization can achieve 5.3-fold higher sensitivity.
Probe methods such as planar microarrays[1] and bead-based suspension arrays[2] are attractive for molecular diagnostic applications because of their ability to achieve multiplexing and their customizability. The bead suspension format supports lower levels of multiplexing than planar arrays, with approximately several hundred distinguishable bead codes.[2] This level of multiplexing, however, is sufficient for the vast majority of clinical applications[3], and the format offers a number of practical advantages including lower cost than microarrays[4] and high reconfigurability. (New “array” combinations can be achieved by selecting from and mixing beads from a library).
Beads also possess an intrinsic physical advantage to planar substrates in that they distribute the probe molecule throughout the sample volume, thereby reducing the length scale for target transport. Therefore, in some applications, bead assays offer shorter hybridization duration (~30 min) compared to microarrays (15-24 h).[5] Despite this improved mixing, bead assays nevertheless require similar hybridization duration to achieve comparable limits of detection as microarrays.[6] This implies that accelerating the slow reaction of low abundant target remains a challenge.
Isotachophoresis (ITP) is an electrokinetic technique for producing high concentration factors of ionic analytes using a heterogeneous buffer system, composed of a leading electrolyte (LE), and a trailing electrolyte (TE).[7] In peak-mode ITP[8], multiple analytes (e.g., beads and target) sharply focus at a TE-to-LE interface resulting in dramatic concentration of analytes (up to million-fold increases are possible within 2 min under ideal conditions[9]). This rapid mixing, co-focusing, and preconcentration
can be used to accelerate second order chemical reactions such as DNA hybridization.[10] Bercovici et al. presented a detailed study of the homogeneous DNA hybridization dynamics under ITP focusing and demonstrated 14 000-fold reduction in hybridization time.[11] Bahga et al. demonstrated a duplex assay by integrating ITP based rapid DNA hybridization and capillary zone electrophoresis.[12] ITP can also enhance the surface hybridization reaction between a suspended target and an immobilized probe.[13] Recently, ITP was used to accelerate selective capture (and recovery) in affinity chromatography[14] and to achieve 30 min reactions in a multiplexed surface microarray (20 species and 60 reaction spots).[15] The latter work being to our knowledge the first truly multiplexed (e.g., more than two) reactions accelerated using ITP. There have also been studies showing that nano- and micro-particles can be focused and carried along with an ITP zone.[16] However, we know of no studies combining ITP-enhanced reactions and bead assays by co-focusing target and beads in an ITP zone.
In this paper, we leverage ITP to concentrate dilute target DNA and co-focus it with beads to strongly accelerate DNA hybridization in a bead suspension assay. Figure 1 shows a schematic of our ITP-aided bead hybridization experiment. We use a simple one-inlet, one-outlet channel architecture and three buffers: LE, a buffering leading electrolyte (BLE), and TE (see S-1 for detailed materials and methods). The LE contained the ssDNA targets and initially filled the entire microchannel. We then injected magnetic bead suspension into the near-entrance region of the microchannel, and collected these into the channel with an external magnet. The bead suspension contained ten sets of beads each with a unique immobilized DNA probe sequence. We then loaded TE and BLE into the input and the output wells, respectively, and placed platinum wire electrodes into the each well.
We applied 300 µA of constant current along the channel. ITP focuses all beads within the ITP zone within about 1 min. Target was recruited and focused into the ITP zone and continually accumulated during most of the experiment. Secondary flow in ITP effectively mixes beads and target to achieve accelerated and kinetics-limited reaction (see S-2 of SI for ITP dynamics). We turned off the applied electric field as the ITP zone arrived at the output well and then recovered the solution including processed beads from the output well for off-chip detection of fraction of hybridization.
Figure 1 Schematic of hybridization acceleration by co-focusing beads and target in a single ITP zone. Target is initially mixed into LE and distributed throughout channel. ITP focusing quickly accumulates beads injected at the left, and transports focused beads through channel. ITP zone also recruits target, preconcentrates it, and mixes target and beads, accelerating reactions. Beads collected at downstream reservoir with a standard pipette.
[a] H. Shintaku, J.W. Palko, J.G. Santiago* Department of Mechanical Engineering, Stanford University Stanford, California 94305, United States of America Email: [email protected]
[b] H. Shintaku Department of Micro Engineering Kyoto University Nishikyo, Kyoto 615-8540, Japan
[c] G.M. Sanders SomaLogic, Inc. Boulder, Colorado 80301, United States of America
Supporting information for this article is given via a link at the end of the document.
COMMUNICATION
The short, injected bead zone focuses quickly and bead surfaces offer a finite number of and effective volume concentration of possible binding sites. Meanwhile, ITP recruitment of target results in continuous accumulation of target into ITP zone. This recruitment starts as a linear increase in target concentration, C, but C saturates as the increasing surface reaction rate rises and becomes sufficient to accommodate new influx, resulting in a quasi-steady local target equilibrium. This quasi equilibrium is a balance between influx of target into ITP zone and reaction rate “sink” within it, and we analyze and quantitatively describe this in the SI (c.f. S-4). The essence of this equilibrium is captured by the following relation:
. (1) Here C* is C normalized by the initial target concentration, C0 and α is an acceleration factor determined by ITP chemistry, ITP dynamics, the reaction on-rate constant (kon), and the ITP-volume-averaged concentration of binding sites. Given this quasi-equilibrium, we can then describe the fraction of reacted surface sites (normalized by total surface sites), Γ*, as:
, (2)
where K is the dissociation constant, T* is konC0t, and t is time. We provide detailed derivation and benchmarking of this ITP-reaction relation in S-5 and S-6. (Refer to S-3 for definition of symbols). We also compare it to an equivalent expression for the well-stirred standard (non-ITP) reaction case, for which the hybridization fraction has the form Γ*std=1/(1+K/C0)[1-exp(-(1+K/C0)T*)].
We here highlight two key differences between ITP and the standard, well-stirred reaction case. First, the ITP hybridization fraction contains a prefactor α/(α+K/C0). For the common case of low abundance target where K/C0 is much larger than unity, the prefactor becomes α/(K/C0), and we see that ITP focusing can be interpreted as an increased value of steady state target hybridization fraction (the standard fraction multiplied by α). Second, for the same high K/C0 regime, we see that the internal quasi-equilibrium dynamics are associated with a rate of reaction accelerated by a factor α. We estimate α = 18.3 for our ITP experiments (c.f. S-8 of SI).
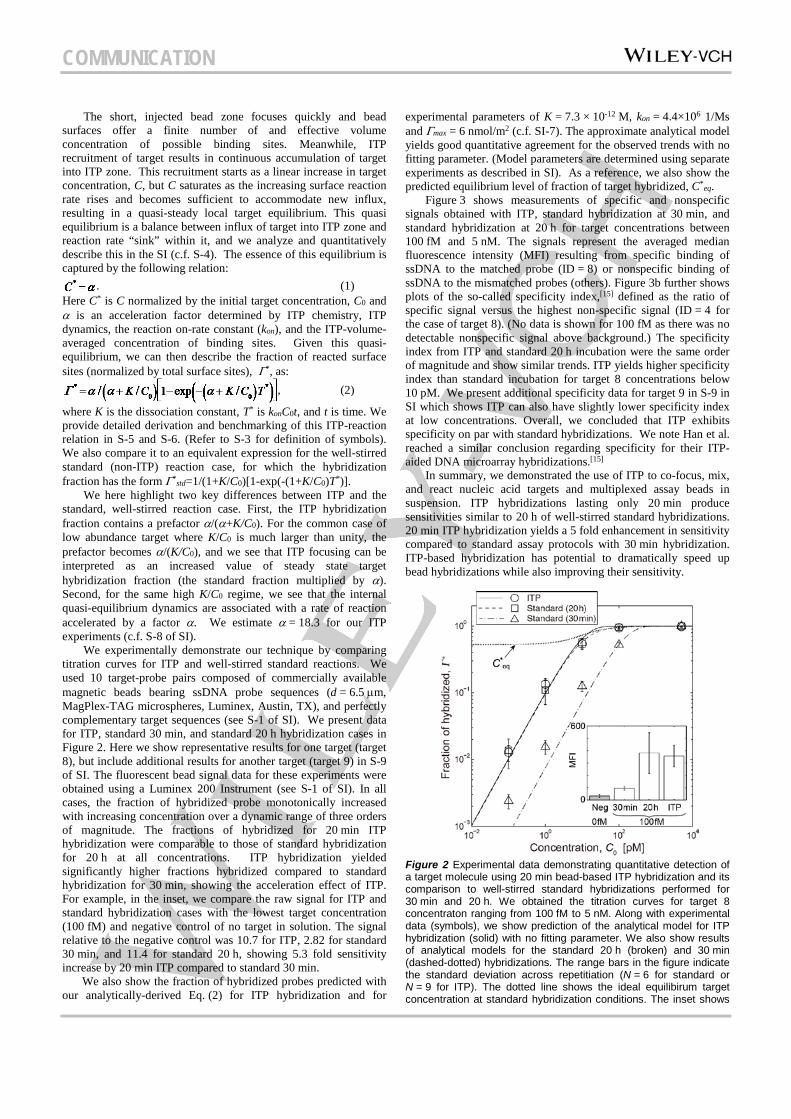
We experimentally demonstrate our technique by comparing titration curves for ITP and well-stirred standard reactions. We used 10 target-probe pairs composed of commercially available magnetic beads bearing ssDNA probe sequences (d = 6.5 µm, MagPlex-TAG microspheres, Luminex, Austin, TX), and perfectly complementary target sequences (see S-1 of SI). We present data for ITP, standard 30 min, and standard 20 h hybridization cases in Figure 2. Here we show representative results for one target (target 8), but include additional results for another target (target 9) in S-9 of SI. The fluorescent bead signal data for these experiments were obtained using a Luminex 200 Instrument (see S-1 of SI). In all cases, the fraction of hybridized probe monotonically increased with increasing concentration over a dynamic range of three orders of magnitude. The fractions of hybridized for 20 min ITP hybridization were comparable to those of standard hybridization for 20 h at all concentrations. ITP hybridization yielded significantly higher fractions hybridized compared to standard hybridization for 30 min, showing the acceleration effect of ITP. For example, in the inset, we compare the raw signal for ITP and standard hybridization cases with the lowest target concentration (100 fM) and negative control of no target in solution. The signal relative to the negative control was 10.7 for ITP, 2.82 for standard 30 min, and 11.4 for standard 20 h, showing 5.3 fold sensitivity increase by 20 min ITP compared to standard 30 min.
We also show the fraction of hybridized probes predicted with our analytically-derived Eq. (2) for ITP hybridization and for
experimental parameters of K = 7.3 × 10⁻¹² M, kon = 4.4×10⁶ 1/Ms and Γmax = 6 nmol/m2 (c.f. SI-7). The approximate analytical model yields good quantitative agreement for the observed trends with no fitting parameter. (Model parameters are determined using separate experiments as described in SI). As a reference, we also show the predicted equilibrium level of fraction of target hybridized, C*eq.
Figure 3 shows measurements of specific and nonspecific signals obtained with ITP, standard hybridization at 30 min, and standard hybridization at 20 h for target concentrations between 100 fM and 5 nM. The signals represent the averaged median fluorescence intensity (MFI) resulting from specific binding of ssDNA to the matched probe (ID = 8) or nonspecific binding of ssDNA to the mismatched probes (others). Figure 3b further shows plots of the so-called specificity index,[15] defined as the ratio of specific signal versus the highest non-specific signal (ID = 4 for the case of target 8). (No data is shown for 100 fM as there was no detectable nonspecific signal above background.) The specificity index from ITP and standard 20 h incubation were the same order of magnitude and show similar trends. ITP yields higher specificity index than standard incubation for target 8 concentrations below 10 pM. We present additional specificity data for target 9 in S-9 in SI which shows ITP can also have slightly lower specificity index at low concentrations. Overall, we concluded that ITP exhibits specificity on par with standard hybridizations. We note Han et al. reached a similar conclusion regarding specificity for their ITP-aided DNA microarray hybridizations.[15]
In summary, we demonstrated the use of ITP to co-focus, mix, and react nucleic acid targets and multiplexed assay beads in suspension. ITP hybridizations lasting only 20 min produce sensitivities similar to 20 h of well-stirred standard hybridizations. 20 min ITP hybridization yields a 5 fold enhancement in sensitivity compared to standard assay protocols with 30 min hybridization. ITP-based hybridization has potential to dramatically speed up bead hybridizations while also improving their sensitivity.
Figure 2 Experimental data demonstrating quantitative detection of a target molecule using 20 min bead-based ITP hybridization and its comparison to well-stirred standard hybridizations performed for 30 min and 20 h. We obtained the titration curves for target 8 concentraton ranging from 100 fM to 5 nM. Along with experimental data (symbols), we show prediction of the analytical model for ITP hybridization (solid) with no fitting parameter. We also show results of analytical models for the standard 20 h (broken) and 30 min (dashed-dotted) hybridizations. The range bars in the figure indicate the standard deviation across repetitiation (N = 6 for standard or N = 9 for ITP). The dotted line shows the ideal equilibirum target concentration at standard hybridization conditions. The inset shows

COMMUNICATION
raw signals at an initial target concentration of 100 fM and compares these to the negative control (no target).
Acknowledgements
We gratefully acknowledge Mr. Y. Sato and Mr. N. Hatano, Kyoto University Machine Shop, for fabricating microfluidic chips. We gratefully acknowledge funding from the National Science Foundation under CBET-1159092. H.S. acknowledges funding from JSPS under 22686021, 26289035, and 26630052. H.S. was supported by fellowships from the John Mung Program of Kyoto University and Marubun Research Promotion Foundation, Japan.
Keywords: isotachophoresis • bead-based assay • multiplexing • DNA analysis • hybridization assay
[1] C. G. Liu, G. A. Calin, S. Volinia, C. M. Croce, Nat Protoc 2008, 3, 563-578.
[2] H. Y. Hsu, T. O. Joos, H. Koga, Electrophoresis 2009, 30, 4008-4019.
[3] H. S. Eng, G. Bennett, P. Bardy, P. Coghlan, G. R. Russ, P. T. Coates, Hum Immunol 2009, 70, 595-599.
[4] J. Q. Yin, R. C. Zhao, K. V. Morris, Trends Biotechnol 2008, 26, 70-76.
[5] M. Schmitt, I. G. Bravo, P. J. Snijders, L. Gissmann, M. Pawlita, T. Waterboer, J Clin Microbiol 2006, 44, 504-512.
[6] a) J. Lu, G. Getz, E. A. Miska, E. Alvarez-Saavedra, J. Lamb, D. Peck, A. Sweet-Cordero, B. L. Ebert, R. H. Mak, A. A. Ferrando, J. R. Downing, T. Jacks, H. R. Horvitz, T. R. Golub, Nature 2005, 435, 834-838; b) S. Kraemer, J. D. Vaught, C. Bock, L. Gold, E. Katilius, T. R. Keeney, N. Kim, N. A. Saccomano, S. K. Wilcox, D. Zichi, G. M. Sanders, PLoS One 2011, 6, e26332.
[7] a) A. Rogacs, L. A. Marshall, J. G. Santiago, J Chromatogr A 2014, 1335, 105–120; b) H. Shintaku, H. Nishikii, L. A. Marshall, H. Kotera, J. G. Santiago, Anal Chem 2014, 86, 1953-1957.
[8] T. K. Khurana, J. G. Santiago, Anal Chem 2008, 80, 6300-6307. [9] B. Jung, R. Bharadwaj, J. G. Santiago, Anal Chem 2006, 78,
2319-2327. [10] a) G. Goet, T. Baier, S. Hardt, Lab Chip 2009, 9, 3586-3593; b)
A. Persat, J. G. Santiago, Anal Chem 2011, 83, 2310-2316; c) M. Bercovici, G. V. Kaigala, K. E. Mach, C. M. Han, J. C. Liao, J. G. Santiago, Anal Chem 2011, 83, 4110-4117; d) C. Eid, G. Garcia-Schwarz, J. G. Santiago, Analyst 2013, 138, 3117-3120.
[11] M. Bercovici, C. M. Han, J. C. Liao, J. G. Santiago, Proc Natl Acad Sci USA 2012, 109, 11127-11132.
[12] S. S. Bahga, C. M. Han, J. G. Santiago, Analyst 2013, 138, 87-90.
[13] a) G. Garcia-Schwarz, J. G. Santiago, Anal Chem 2012, 84, 6366-6369; b) G. Garcia-Schwarz, J. G. Santiago, Angew Chem Int Ed Engl 2013, 52, 11534–11537; c) M. Karsenty, S. Rubin, M. Bercovici, Anal Chem 2014, 86, 3028-3036; d) R. Khnouf, G. Goet, T. Baier, S. Hardt, Analyst 2014, 139, 4564-4571.
[14] V. Shkolnikov, J. G. Santiago, Anal Chem 2014, 86, 6229-6236. [15] C. M. Han, E. Katilius, J. G. Santiago, Lab Chip 2014, 14, 2958-
2967.
[16] a) U. Pyell, W. Bucking, C. Huhn, B. Herrmann, A. Merkoulov, J. Mannhardt, H. Jungclas, T. Nann, Anal Bioanal Chem 2009, 395, 1681-1691; b) G. Goet, T. Baier, S. Hardt, Biomicrofluidics 2011, 5, 014109.
Figure 3 Comparison of specific and nonspecific signal between ITP hybridization and standard incubation (at both 20 h and 30 min). a): Averaged MFI (log scale) for target 8 hybridized with matching probe (bead ID=8) and nine bead types with non-matching probes. The range bars in the figure indicate the standard deviation across N = 3 for standard cases and N = 5 for ITP. b): Specificity index for target 8 (ratio of averaged MFI between specific binding and the highest non-specific binding (bead ID=4). Similar data is provided in the SI for target 9.

COMMUNICATION
Entry for the Table of Contents
COMMUNICATION
A bead-based assay that uses electrokinetic co-focusing of target molecules and beads to speed up reaction. This technique achieves quantification of ssDNA with 100 fM limit of detection and multiplex detection of 10 target species per sample. The technique offers similar sensitivity to a well-stirred standard reaction in 60-fold less reaction time. Alternately, for similar reaction time, it offers 5.3-fold higher sensitivity.
H. Shintaku, J.W. Palko, G.M. Sanders, J.G. Santiago*
Page No. – Page No.
Increasing hybridization rate and sensitivity of bead based assays using isotachophoresis

- S-1 -
Supporting Information
Increasing hybridization rate and sensitivity of bead based assays using isotachophoresis
Hirofumi Shintakua,b, James W. Palkoa, Glenn M. Sandersc, and Juan G. Santiagoa*
aDepartment of Mechanical Engineering, Stanford University, United States of America bDepartment of Micro Engineering, Kyoto University, Japan cSomaLogic, Inc., United States of America * To whom correspondence should be addressed. E-mail: [email protected]
Contents:
S-1 Materials and Methods .................................................................................................................................. 2 ITP hybridization............................................................................................................................................. 2 Buffers and reagents ........................................................................................................................................ 2 ssDNA sequences ............................................................................................................................................ 3 Microfluidic Chip ............................................................................................................................................ 3 On-chip visualization ...................................................................................................................................... 4 Standard hybridization .................................................................................................................................... 4 Off-chip Luminex bead signal readout ............................................................................................................ 4
S-2 Visualization of co-focusing of beads and ssDNA in ITP zone .................................................................... 5
S-3 List of symbols ............................................................................................................................................ 10
S-4 Approximate analytical model .................................................................................................................... 10
S-5 Benchmarking approximate analytical solution with numerical model ...................................................... 12
S-6 Theory for standard incubation hybridization and process of estimating dissociation constant and kinetic
on-rate ................................................................................................................................................................ 14
S-7 Experimental measurements of ITP parameters .......................................................................................... 15
S-8 Predicted gains by approximate analytical model in the fraction of hybridized probes using ITP ............. 16
S-9 Example data from additional titration and specificity experiments .......................................................... 18
References ......................................................................................................................................................... 20

- S-2 -
S-1 Materials and Methods ITP hybridization Our ITP hybridization uses a simple one-inlet, one-outlet channel architecture and three buffers: LE,
BLE, and TE. The LE contained the ssDNA targets and initially filled the entire microchannel
(25 µL) by capillary force. We then injected 0.5 µL of magnetic bead suspension at the entrance of the microchannel. The bead suspension contained ten sets of beads each with a different probe
sequence and approximately 1,450±70 beads in total (145 beads per probe sequence). In this
injection step, we dragged the beads into the channel with a permanent magnet placed below the
microfluidic chip near the entrance. We then loaded 80 µL of TE and BLE into the input and the output wells, respectively, and placed platinum wire electrodes into the each well.
We initiated ITP by applying 300 µA of constant current across the channel with input well grounded using a high voltage sourcemeter (2410, Keithley Instruments, Cleveland, OH). Under
the action of the electric field, beads were focused in the ITP zone, and target was continually
accumulated in the zone as it swept through the channel (see S-2 in SI for ITP dynamics). We
turned off the applied electric field as the ITP zone arrived at the output well and then recovered the
solution including processed beads from the output well. After the ITP hybridization experiment,
we recovered the beads from the output well with a micro-pipette. We estimated the recovery
efficiency of beads including beads lost in the pipetting step as 75±4% (S.E., N = 5).
During ITP, we applied a rotational magnetic field using a magnetic stirrer (Thermix Stirrer
Model 120S, Thermo Fisher Scientific, Waltham, MA) to reduce both bead aggregation and adhesion
to the wall. The ITP was very repeatable, and the assay time was 13,520±60 s.
Buffers and reagents For the hybridization experiments, we used 10 target-probe pairs composed of commercially
available magnetic beads bearing ssDNA probe sequences (d = 6.5 µm, MagPlex-TAG microspheres, Luminex, Austin, TX), and perfectly complementary target sequences. We provide sequences of
target and probe DNA oligonucleotides in the next section. The target sequences were synthesized
with a biotin moiety at the 5’ terminus. We arbitrarily named target-probe pairs with ID numbers
from 1 to 10. Targets and probes had the same length, 24 bases. We purchased targets from
Trilink (San Diego, CA). We also used ssDNA oligo target labeled with Alexa Fluor 488 (AF488,
Integrated DNA Technologies, Coralville, IA) at 5’ terminus for on-chip visualization and for
experimental measurement of capture probe surface concentration, Γmax. For ITP hybridization, the aqueous buffer inside the channel, designated LE, contained 150 mM
HCl, 300 mM Bis-Tris, 5 mM MgCl2, 0.2% w/w 1 MDa poly(vinylpyrrolidone) (PVP), 0.08% w/w
Triton X-100, and varying concentrations of ssDNA target mixtures. The buffer in the output well,

- S-3 -
BLE, was 250 mM HCl, 500 mM BisTris, 5 mM MgCl2, 0.2% w/w 1 MDa poly(vinylpyrrolidone)
(PVP), and 0.08% w/w Triton X-100. The trailing electrolyte buffer, TE, contained 250 mM
HEPES, 500 mM Bis-Tris, 0.2% w/w PVP, and 0.08% w/w Triton X-100. For conventional
hybridization, we mixed target DNA in LE buffer to final concentrations ranging from 100 fM to
5 nM.
We purchased HCl, HEPES, Tris, Bis-Tris, MgCl2, Triton X-100 from Sigma-Aldrich (St. Louis,
MO), and PVP from Polysciences, Inc. (Warrington, PA). We prepared all solutions in UltraPure
DNase free distilled water (GIBCO Invitrogen, Carlsbad, CA).
ssDNA sequences We used ssDNA sequences for targets and probes as listed in Table S1. Targets include a biotin
group at the 5’ terminus. We calculated melting temperatures Tm of each target-probe pair using the
DINAMelt web server (http://mfold.rna.albany.edu/). This estimate took into account the effect of
ionic concentration by using the dissociated Bis-Tris concentration, 150 mM, and substituting this
value for the input Na+ concentration required by the calculation.
Table S1. Probe and target oligonucleotide sequences ID Name Tag sequence (5'→3') Anti-tag sequence (5'→3') Tm
1 MTAG-A012 AGTAGAAAGTTGAAATTGATTATG CATAATCAATTTCAACTTTCTACT 65.8
2 MTAG-A013 AGTGAATGTAAGATTATGTATTTG CAAATACATAATCTTACATTCACT 64.9
3 MTAG-A014 ATTGTGAAAGAAAGAGAAGAAATT AATTTCTTCTCTTTCTTTCACAAT 68.4
4 MTAG-A015 GTTGTAAATTGTAGTAAAGAAGTA TACTTCTTTACTACAATTTACAAC 64.6
5 MTAG-A019 GTGTGTTATTTGTTTGTAAAGTAT ATACTTTACAAACAAATAACACAC 65.6
6 MTAG-A025 GTATGTTGTAATGTATTAAGAAAG CTTTCTTAATACATTACAACATAC 63.3
7 MTAG-A026 TTTGATTTAAGAGTGTTGAATGTA TACATTCAACACTCTTAAATCAAA 67.9
8 MTAG-A027 AAGATGATAGTTAAGTGTAAGTTA TAACTTACACTTAACTATCATCTT 67.2
9 MTAG-A030 GTGTTATAGAAGTTAAATGTTAAG CTTAACATTTAACTTCTATAACAC 62.9
10 MTAG-A055 GAAGATATTGAAAGAATTTGATGT ACATCAAATTCTTTCAATATCTTC 68.0
Microfluidic chip
The microfluidic chip design had a nominal channel depth of 130 µm, a nominal width of 2 mm, and a nominal total channel length of 99 mm as shown in Fig. S1. Each channel corner is an optimized
90° turn to minimize electrokinetic dispersion.[1] The channel contained approximately 25 µL. At
both ends, the microchannel had wells that hold a total volume of 80 µL. We fabricated the microfluidic channel structure on a 2 mm-thick acrylic plate using

- S-4 -
conventional computer numerically controlled milling. We cleaned the plate in DI water with
sonication for 5 min. We sealed the channel with another 500 µm-thick acrylic plate by compression at 105°C for 30 min.
Figure S 1 Schematic of the microchannel.
On-chip visualization For on-chip visualization of bead hybridization, we used an inverted epifluorescence microscope
(IX70, Olympus, Tokyo, Japan) equipped with a 4X objective lens (UPlanApo, NA 0.16, Olympus,
Tokyo, Japan) and a 0.63X demagnification lens (Diagnostic Instruments, Sterling Heights, MI).
To individually and simultaneously observe beads versus targets, we captured simultaneous images
in two separate wavelength bands using an XF53 dual pass filter cube (Omega Optical, Brattleboro,
VT) in combination with a dual-view imager (Micro-Imager, Photometrics, Tucson, AZ). We
captured images using a CCD camera (RTE/CCD-1300-Y/DIF, Roper Scientific, Trenton, NJ) with
2×2 binning. We controlled the camera under double image feature mode and external exposure
control with an exposure time of 125 ms.
Standard hybridization
For standard hybridization experiments, we prepared 50 µL bead suspensions including 5810±290
beads (N = 3) in LE and mixed with 50 µL of target ssDNA solution in a 0.5 mL microtube. We then incubated the mixed solution on a hotplate at 37°C with stirring at 70 RPM by a magnetic hot
stirrer (Isotemp, Fisher Scientific, Pittsburgh, PA). For these conventional comparison cases, we
used two incubation times: 20 h and 30 min. The assay with 20 h incubation provides results near
equilibrium and offers high sensitivity. Multiple assays performed with 30 min incubation, which
Luminex standard protocol recommends, enables a measurement of kon.
Off-chip Luminex bead signal readout Following both microfluidic ITP and standard hybridizations, we used a protocol and bead signal
readout method common to Luminex bead signal analysis. We performed this in order to have a
fair comparison of both hybridization methods. Also, we believe our assay’s main contribution is in

- S-5 -
replacing the mixing and incubation/hybridization reaction steps of the accepted overall assay. To
this end, we performed the following off-chip sample preparation and quantification in the Human
Immune Monitoring Center at Stanford University. We loaded each processed bead suspension into
separate wells of a 96 well plate (655096, Greiner Bio-One, NC, USA). We washed beads with
phosphate buffered saline solution (PBS) including 0.05% Tween 20 (PBST) in an automated washer
(ELx405, Biotek, VT, USA). We then suspended the beads in a buffer (0.2 M NaCl, 0.1 M Tris,
and 0.08% Triton X-100 at pH 8.0) including 0.5 mg/mL bovine serum albumin (Invitrogen,
Carlsbad, CA) for 5 min with shaking. We placed the plate on a magnetic separator for 5 min and
removed the supernatant. We then added a buffer (0.2 M NaCl, 0.1 M Tris, and 0.08% Triton
X-100 at pH 8.0) including 5 µg/mL fluorophore of streptavidin-R-phycoerythrin (SAPE) and incubated at room temperature for 40 min with shaking. We washed beads with PBST in a Biotek
ELx405 washer and re-suspended them in PBS for reading with the Luminex 200 Instrument
(Luminex, Austin, TX). This standard post-reaction protocol with standard equipment resulted in
the most significant loss of reacted beads. In all, the Luminex 200 Instrument quantified about 20
beads per type. We used median fluorescence intensity (MFI) as the representative signal. We
estimated the fraction of hybridized probe by normalizing the negative-control-subtracted
fluorescence signal with the maximum value.
S-2 Visualization of co-focusing of beads and ssDNA in ITP zone We performed on-chip visualization experiments of the ITP hybridization using ssDNA labeled with
AF488. For these hybridization visualizations, we focused beads and ssDNA at 10 nM initial
concentration. Our optimized ITP chemistry allows co-focusing of beads and ssDNA in a single
ITP zone. During focusing, we leverage the strong secondary flow in the ITP zone to mix and
achieve kinetically limited reaction by applying relatively high current. We provide example
visualizations (and velocity measurements) of this random, fluctuating secondary flow in Fig. S2 and
within the multimedia SI. We also observe spanwise non-uniform distribution of target and beads
(vertical direction in Fig. S2). The secondary flow and non-uniformity in the spanwise distribution
became stronger as the ITP zone moved to the output well under our constant current condition.
We attribute this to the effects of increasing electric field (as more of the channel is occupied by
lower conductivity TE zone). As we describe below, increasing electric fields cause stronger
secondary flows associated with non-uniform electroosmotic flow (EOF) and electrokinetic flow
instabilities.
For negligible electroosmotic flow (EOF), low electric fields, and peak mode,[2] ITP zone
shape is well predicted by a balance of electrophoretic focusing gradients and molecular diffusion.[3]
The ITP zone can exhibit “tails” into the TE and LE zones for cases where the focused species

- S-6 -
mobility approaches that of the TE or LE co-ions, respectively.[3] Finite electroosmotic flow can
affect ITP zone shape by causing Taylor-type dispersion near the boundaries between the ITP zone
peak and the TE and LE. At higher electric fields, we have observed distortion of ITP zone shape,
which we attribute to both non-uniform electroosmotic flow and the effects of electric body forces. [3]
At sufficiently high electric fields, we observe three-dimensional fluctuations of analyte
concentrations which we attribute to electrokinetic flow instabilities.[4] The non-dimensional
parameters governing this transition to instability are not well known precisely but Persat and
Santiago present scaling arguments suggesting a modified electric Rayleigh number.[4]
Generally speaking, the result of these complex effects on ITP zone shape can be summarized as
follows. For relatively low electric fields and suppressed EOF, we can assume ITP zone width will
be roughly inversely proportional to current density.[3] At higher values, the dispersive action of
secondary flows and instabilities tends to produce a plateau minimum ITP zone width and strongly
fluctuating scalar flows and mixing within the ITP zone. As part of the current work, we leveraged
these instabilities and secondary flows to effect strong mixing between focused beads and focused
target molecules within the ITP zone. We here present instantaneous scalar images of the ITP zone
and nearly instantaneous velocity measurements using particle image velocimetry.
First, we present scalar images visualized with 24 nt ssDNA end-labeled with AF488 in Fig.S2.
The images in Figs. S2a and b are from a single experiment, recorded at different straight channel
regions indicated as A and B, respectively, in Fig.S1. In Figs. S2a and b, the green color is 24 nt
ssDNA end-labeled with AF488, and the pink dots (black dots in ITP zone) are beads. The spatial
distribution of the scalar is relatively stable within the straight region, while it dramatically changes
at turns (data not shown). The scalar shows span-wise non-uniform distribution, and tends to
accumulate at the outer edge of the channel, which are the top and the bottom edges in Figs. S2a and
b, respectively. Paschkewitz et al. also reported the turn induced outer side scalar accumulation.[5]
Figures S2a and b also show the co-focused beads as pink dots (black dots in the ITP zone). We
observed that the spatial distribution of beads is also relatively stable within straight regions, while
individual beads dynamically move in the ITP zone.
Next, we characterized the secondary flow velocities within the ITP zone using particle image
velocimetry as shown in Fig.S2c. We observed rotational motion of beads in the ITP zone with the
velocity order of 10 µm/s, which was one order of magnitude smaller than that of ITP zone translational migration. To obtain the velocity field in the frame of reference of the moving ITP
interface, we recorded the visualized ITP zone, manually tracking the ITP zone by moving the
microscope stage. For more precise registration of multiple images of the ITP zone, we used the
green channel fluorescence signal image representing the diffuse target signal to track the ITP
interface with the two-dimensional cross-correlation ‘xcorr2’ MATLAB function. This analysis

- S-7 -
yielded the ITP translational shift distances by which we then shifted the red fluorescence channel
images. We analyzed the discrete position of the red fluorescent beads in the frame of reference of
the moving ITP zone (as determined by the green channel). We used the preconditioned red
channel images to analyze the beads’ motion in the ITP zone by micron-resolution particle image
velocimetry.[6] We used 32 by 32 pixel interrogation windows with 50% overlap. As the structure
of secondary flows were approximately steady for time scales of order 100 s and within the straight
region of the microchannel (in the moving frame of reference), we averaged velocity information
within the straight region by ensemble averaging 44 correlation functions (each associated with an
image pair) per velocity calculation.[7] For the experimental data in Fig. S2c, we also show the
averaged green channel image intensity in grayscale to indicate the ITP zone.
We also measured δ as an “effective” ITP zone length. In Fig. S3 we present the ITP zone length (along channel axis) versus peak position. We observed the ITP zone length increased with
the migration of the ITP zone. Our experiments were run at constant current of 300 µA, and this results in an increasing electric field within the TE zone. As mentioned above, the TE zone has
lower conductivity than the LE and progressively occupies more of the channel (resulting in
increasing EOF within the TE zone).[3] We also measured δ at constant current of 200 µA and
observed δ was relatively insensitive to the current in our dispersive regime.
- S-8 -
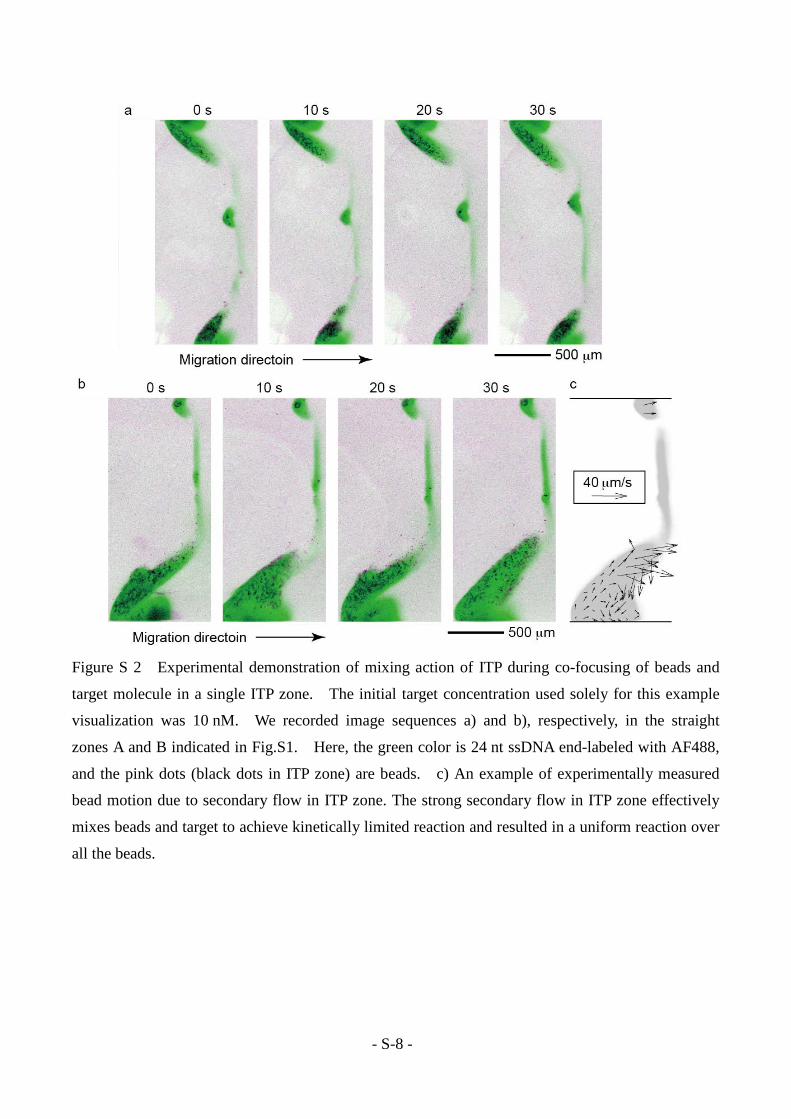
Figure S 2 Experimental demonstration of mixing action of ITP during co-focusing of beads and
target molecule in a single ITP zone. The initial target concentration used solely for this example
visualization was 10 nM. We recorded image sequences a) and b), respectively, in the straight
zones A and B indicated in Fig.S1. Here, the green color is 24 nt ssDNA end-labeled with AF488,
and the pink dots (black dots in ITP zone) are beads. c) An example of experimentally measured
bead motion due to secondary flow in ITP zone. The strong secondary flow in ITP zone effectively
mixes beads and target to achieve kinetically limited reaction and resulted in a uniform reaction over
all the beads.

- S-9 -
Figure S 3 Measurements of ITP zone length as a function of ITP zone position with applied
constant currents of 200 µA (triangles, broken line) and 300 µA (circles, solid line). Each symbol shows the averaged ITP zone length at indicated positions along the 18 mm long straight zone of the
microchannel, where we used the central position, x, as a representative peak position. For this
estimate, we first determined the ITP zone as the region where the fluorescence intensity from the
target molecule is higher than a threshold, Ibk+ σ. Ibk is the mean intensity of the background
fluorescence within the channel and σ is the standard deviation of this background. We then
measured the imaged area of the ITP zone and divided by the width of channel to obtain δ.
- S-10 -
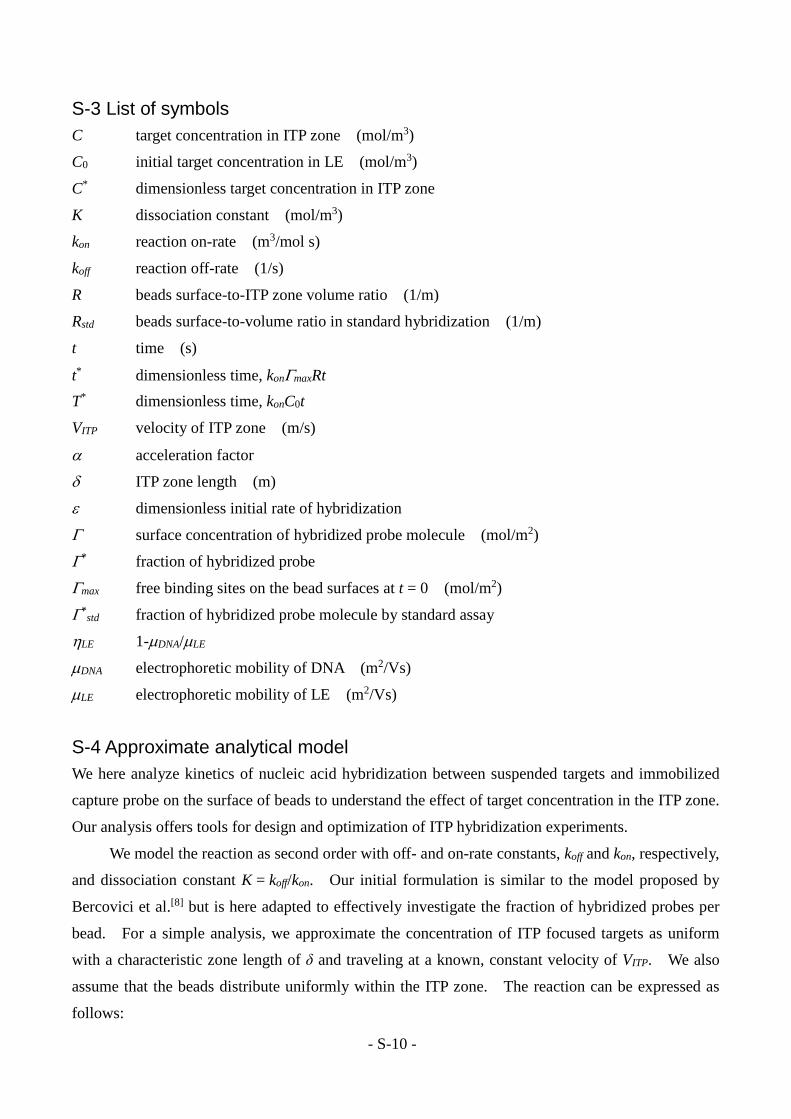
S-3 List of symbols C target concentration in ITP zone (mol/m3)
C0 initial target concentration in LE (mol/m3)
C* dimensionless target concentration in ITP zone
K dissociation constant (mol/m3)
kon reaction on-rate (m3/mol s)
koff reaction off-rate (1/s)
R beads surface-to-ITP zone volume ratio (1/m)
Rstd beads surface-to-volume ratio in standard hybridization (1/m)
t time (s)
t* dimensionless time, konΓmaxRt T* dimensionless time, konC0t
VITP velocity of ITP zone (m/s)
α acceleration factor
δ ITP zone length (m)
ε dimensionless initial rate of hybridization
Γ surface concentration of hybridized probe molecule (mol/m2)
Γ* fraction of hybridized probe
Γmax free binding sites on the bead surfaces at t = 0 (mol/m2)
Γ*std fraction of hybridized probe molecule by standard assay
ηLE 1-µDNA/µLE
µDNA electrophoretic mobility of DNA (m2/Vs)
µLE electrophoretic mobility of LE (m2/Vs)
S-4 Approximate analytical model We here analyze kinetics of nucleic acid hybridization between suspended targets and immobilized
capture probe on the surface of beads to understand the effect of target concentration in the ITP zone.
Our analysis offers tools for design and optimization of ITP hybridization experiments.
We model the reaction as second order with off- and on-rate constants, koff and kon, respectively,
and dissociation constant K = koff/kon. Our initial formulation is similar to the model proposed by
Bercovici et al.[8] but is here adapted to effectively investigate the fraction of hybridized probes per
bead. For a simple analysis, we approximate the concentration of ITP focused targets as uniform
with a characteristic zone length of δ and traveling at a known, constant velocity of VITP. We also
assume that the beads distribute uniformly within the ITP zone. The reaction can be expressed as
follows:

- S-11 -
, (S-1)
, (S-2)
where C and C0, respectively, denote volumetric target concentration in the ITP zone and initial
target concentration in the LE with units of mol/m3. Γ and Γmax respectively denote molar surface concentration of hybrid pairs and free binding sites on the bead surfaces at t = 0 in units of mol/m2.
The variable ηLE is defined as, ηLE=1-µDNA/µLE, where µDNA and µLE are the electrophoretic mobility of targets and leading anions, respectively. R is the ratio between the total surface area of the beads
and the volume of the ITP zone expressed as
R = nS/(whδ), (S-3)
where n, S, w, and h are respectively the number of beads, surface area of a single bead, width, and
depth of the channel. δ is the characteristic streamwise (axial) width of the ITP zone. The governing equations in dimensionless form can be expressed as
, (S-4)
, (S-5)
where dimensional variables relate to dimensionless ones as
. (S-6)
As we discuss in detail later, we term α as the “acceleration factor”. α physically represents the ratio of target influx into the ITP zone to the rate of target consumption by hybridization to beads.
We further introduce a time scale T* defined as T* = εt* = (konC0)t. ε is a dimensionless initial rate
of hybridization. For our experiments, the order of ε varies from order 10-4 to unity (for initial target concentrations of 100 fM~1 nM). We here will focus on the most relevant and challenging
regime of relatively low initial target concentrations where ε << 1, and simplify Eq. (S-4) as follows:
. (S-7)
To explore the dynamics of C*, we consider the common regime of small hybridized fraction of
available binding sites Γ* << 1, and approximate Eq. (S-5) by

- S-12 -
. (S-8)
In this regime, we see Eq.(S-8) is decoupled from Eq.(S-7) and we obtain the analytical solution of
C* as
. (S-9)
Equation (S − 9) indicates that the target concentration in the ITP zone increases and
asymptotically approaches the constant value, α. Physically, this implies a self-limiting, steady-state balance between target accumulation and reaction. ITP focusing recruits and
preconcentrates target into the ITP zone, raising C* in the ITP zone. This has the effect of
increasing reaction rate, and this condition continues until the increased reaction rate exactly
balances target influx. We here note, Dogan and Bercovici very recently used a numerical approach
to show a similar trend.[9] The current analytical model shows explicitly the key parameters and
yields a closed-form solution. For example, the time to reach this stable, internal balance of accumulation and reaction is order . For our experiments, this time is order 50 s.
After this, we can assume a constant target concentration as in Eq. (1). Substituting Eq. (1) into Eq.
(S-7), we obtain an approximate analytical solution of Γ* given by Eq. (2). We provide detailed
benchmarking of Eq. (1) and (2) with numerical modeling in S-5.
S-5 Benchmarking approximate analytical solution with numerical model We presented an approximate analytical model for hybridization using ITP with two key
assumptions: ε is very small, ε << 1, and negligible Γ* for t* of order unity, Γ
* << 1. Here we evaluate the effect of each assumption on the accuracy of the solution by comparing the numerical
and approximate analytical models. To obtain the numerical model, we first substituted Eq. (S-1)
into Eq. (S-2) as:
, (S-10
) We then integrated Eq. (S-10) with initial conditions of Γ(0) = 0 and C(0) =0 as
. (S-11
)
Substituting Eq. (S-11) into Eq. (S-1), we obtained
. (S-12
)
We calculated the numerical model of Γ* by direct numerical integration of Eq. (S-12). We then
calculated C* with Eq. (S-11).
- S-13 -
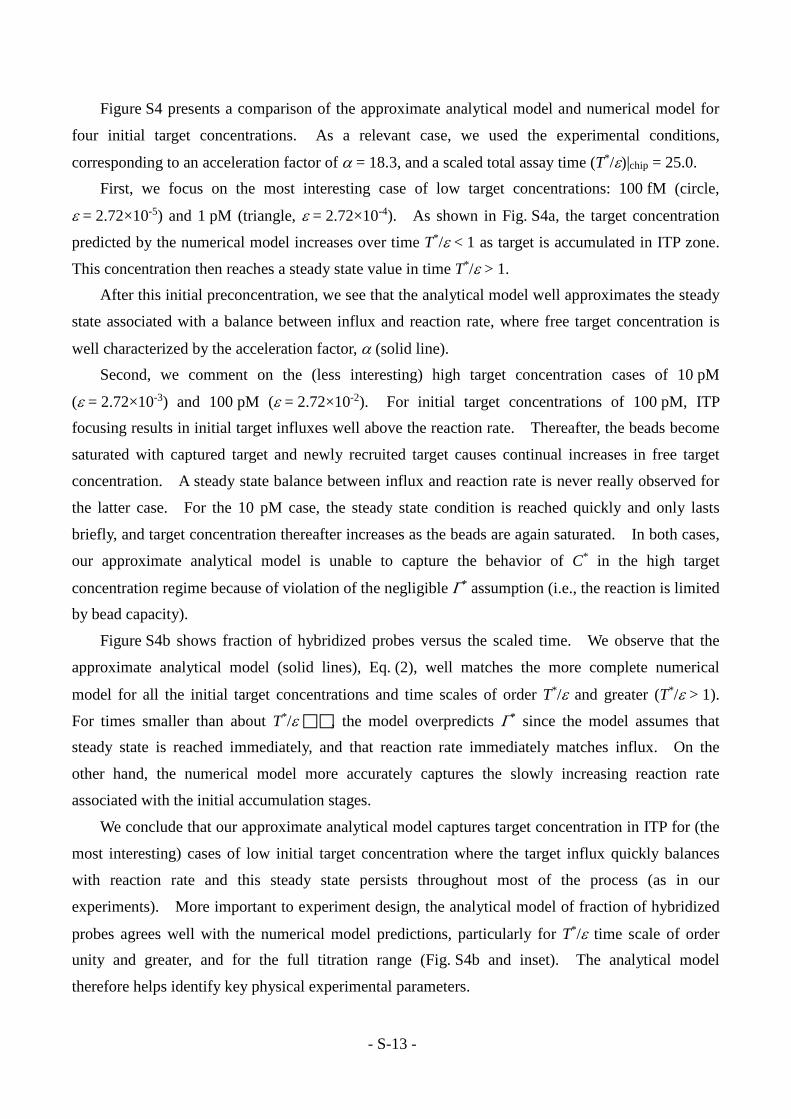
Figure S4 presents a comparison of the approximate analytical model and numerical model for
four initial target concentrations. As a relevant case, we used the experimental conditions,
corresponding to an acceleration factor of α = 18.3, and a scaled total assay time (T*/ε)|chip = 25.0. First, we focus on the most interesting case of low target concentrations: 100 fM (circle,
ε = 2.72×10⁻⁵) and 1 pM (triangle, ε = 2.72×10⁻⁴). As shown in Fig. S4a, the target concentration
predicted by the numerical model increases over time T*/ε < 1 as target is accumulated in ITP zone.
This concentration then reaches a steady state value in time T*/ε > 1. After this initial preconcentration, we see that the analytical model well approximates the steady
state associated with a balance between influx and reaction rate, where free target concentration is
well characterized by the acceleration factor, α (solid line). Second, we comment on the (less interesting) high target concentration cases of 10 pM
(ε = 2.72×10⁻³) and 100 pM (ε = 2.72×10⁻²). For initial target concentrations of 100 pM, ITP focusing results in initial target influxes well above the reaction rate. Thereafter, the beads become
saturated with captured target and newly recruited target causes continual increases in free target
concentration. A steady state balance between influx and reaction rate is never really observed for
the latter case. For the 10 pM case, the steady state condition is reached quickly and only lasts
briefly, and target concentration thereafter increases as the beads are again saturated. In both cases,
our approximate analytical model is unable to capture the behavior of C* in the high target
concentration regime because of violation of the negligible Γ* assumption (i.e., the reaction is limited by bead capacity).
Figure S4b shows fraction of hybridized probes versus the scaled time. We observe that the
approximate analytical model (solid lines), Eq. (2), well matches the more complete numerical
model for all the initial target concentrations and time scales of order T*/ε and greater (T*/ε > 1).
For times smaller than about T*/ε , the model overpredicts Γ* since the model assumes that
steady state is reached immediately, and that reaction rate immediately matches influx. On the
other hand, the numerical model more accurately captures the slowly increasing reaction rate
associated with the initial accumulation stages.
We conclude that our approximate analytical model captures target concentration in ITP for (the
most interesting) cases of low initial target concentration where the target influx quickly balances
with reaction rate and this steady state persists throughout most of the process (as in our
experiments). More important to experiment design, the analytical model of fraction of hybridized
probes agrees well with the numerical model predictions, particularly for T*/ε time scale of order unity and greater, and for the full titration range (Fig. S4b and inset). The analytical model
therefore helps identify key physical experimental parameters.

- S-14 -
Figure S 4 Comparison of (a) the target concentrations in ITP zone and (b) the fraction of hybridized
probes. Plotted are normalized concentration defined as C/C0 versus the normalized time scale
T*/ε, and fraction of hybridized probes Γ* versus the normalized time scale T*/ε. Shown are results for approximate analytical model (solid line) and the numerical model (symbols) at four initial target
concentrations. Acceleration factor and scaled total assay time are set as α = 18.3 and
(T*/ε)|chip = 25.0, respectively. The inset of B shows the predicted titration curve.
S-6 Theory for standard incubation hybridization and process of estimating dissociation constant and kinetic on-rate We here present the following two analytical solutions describing standard incubations: A) an
equilibrium solution taking into account target consumption, and B) a transient model assuming a
constant target concentration C0. Assuming perfect mixing, we use the following governing
equations:
, (S-13
)
, (S-14
)
where Rstd is the surface-to-volume ratio defined as
Rstd=nS/V, (S-15
) where n is number of beads, S is surface area of a bead, and V is the total volume of the solution.
A) At equilibrium, we obtain the following equation:
. (S-16
)

- S-15 -
Eq. (S-16) is a quadratic equation in Γeq, with a solution
. (S-17
)
Assuming ΓmaxRstd/C0 << 1, we simplify the equilibrium solution under the assumption of constant target concentration as:
. (S-18
) B) Under transient conditions, we will assume C maintains a constant value of C0. From Eq. (S-13),
we obtain a solution
. (S-19
) At t→∞, Eq. (S-19) yields Eq. (S-18).
To obtain estimates for K and kon, we used data obtained in standard incubation cases (and then
applied these to predict the ITP dynamics). We first fit data from the standard 20 h incubation to
Eq. (S-17) with a single fitting parameter of K using the ‘nlinfit’ nonlinear fitting function of
MATLAB. We then used this K value and fit data from the standard 30 min incubation to
Eq. (S-19) with a single fitting parameter of kon. We also measured the surface concentration of the
free binding sites on beads, Γmax, as 6 nmol/m2 by measuring the target consumption using a standard incubation and AF488 labeled ssDNA. In Fig. 2 and Fig. S7, we compare predictions from
Eqs. (S-17) and (S-19) to the experimental conditions. We also present the final target
concentration at equilibrium in the standard incubations. The decrease of the target concentration is
significant, especially at low target concentrations, indicating the importance of taking into account
the target consumption in our protocol.
S-7 Experimental measurements of ITP parameters We here describe our procedure for determining key experimental parameters associated with the ITP
process. We used these parameters for our model predictions of ITP-aided focusing and reaction.
Our models require estimates of ITP velocity, VITP, and ITP zone length, δ. For simplicity, we
assumed a time invariant δ in our analysis, and used the time-averaged value of δ resulting in a value
of 103 µm. As our microchannel had seven corners with smaller cross sectional area, the ITP migration velocity was not constant throughout the entire assay. We therefore estimated a
representative velocity from the total assay time and the length of microchannel as
VITP = 670±30 µm/s (N = 7). We obtained mobility of Cl-, µLE = 67×109 m2/Vs using peakmaster
(PeakMaster 5.3)[10] and determined that of ssDNA as µDNA=35×109 m2/Vs based on a report by

- S-16 -
Stellwagon et al.[11] We stress that these are not meant to be precise estimates but rather
engineering estimates useful in assay design and estimation of trends.
S-8 Predicted gains by approximate analytical model in the fraction of hybridized probes using ITP The predictions shown in Figures S5a through S5d summarize the fold gains in signal provided by
ITP. The solid contour lines represent signal gain defined as the ratio of the fraction of hybridized
probes of ITP divided by the fraction hybridized using standard hybridization, i.e. Γ*/Γ*std. A gain
greater than unity represents conditions under which the ITP gives higher fraction of hybridized with
the same assay time. For the limiting (and most interesting) case 1 < α << (K/C0), the fraction
hybridized by ITP, Γ*, scales as
Γ* = α/(K/C0) (1-exp ((-K/C0)T*)) (S-
20)
while the standard fraction hybridized, Γ*std, scales as
Γ*std = 1/(K/C0) (1-exp ((-K/C0)T*)). (S-
21)
This results in the constant gain Γ* / Γ*std = α irrespective of time of the reaction and explains the
gain at the low target concentration cases of 100 fM (K/C0 = 52.8, Fig. S5a) and 1 pM (K/C0 = 5.28,
Fig. S5b). For another (least interesting) limiting case, 1 >> (K/C0), the fraction Γ* scales as
1-exp (-αT*), while Γ*std scales as 1-exp(-T*). This results in a gain of Γ*/Γ*
std = α for small T*/ε
and a gain approaching unity for large T*/ε. This in turn explains qualitatively the trends of gain at high concentrations, 10 pM (K/C0 = 0.528, Fig. S5c) and 100 pM (K/C0 = 0.0528, Fig. S5d). We
here note that we developed our approximate analytical model for predicting the fraction of
hybridized in T*/ε time scale greater than unity, and it overestimates the fraction of hybridized in short time scale due to the simplifying assumption of constant target concentration.
We used measured ITP parameters to obtain the model prediction of the acceleration factor
α = 18.3 and non-dimensional assay time (T*/ε)|chip = 25.0 for our experiments (see SI S-7 for detailed measurement of ITP parameters). We show the predictions with a circular symbol in
Fig. S5. Shown together with the experimental condition is a dashed line describing the values of
(T*/ε)|chip and α which are possible given our beads, chip geometry, and ITP chemistry and conditions. The intersection between contour values and this dashed curve describe the possible
gains achievable in our chip system.

- S-17 -
Figure S 5 Effect of ITP focusing on the fraction of hybridized probes for four initial target
concentrations: a: 100 fM, b: 1 pM, c: 10 pM, and d: 100 pM. Solid contours represent the gain,
Γ*/Γ*
std, defined as fraction of hybridized with ITP to that with standard hybridization assuming well-stirred conditions and constant concentrations. The circular symbol represents the model
prediction for the experimental condition used in Figs. 2 and 3 (α = 18.3, (T*/ε)|chip = 25.0, kon = 4.27×10⁶, and K = 5.28×10⁻¹²). The broken line represents of the locus of possible values of
(T*/ε)|chip versus α for variations associated with only changing the number of beads or electric field.
We also present the fraction of hybridized probes for various acceleration factors by changing
the number of beads, keeping other parameters constant in Fig. S6a. Figure S6a is fraction of
hybridized probes predicted by the approximate analytical model for a constant channel length and a
constant electric field. Higher α corresponds to smaller numbers of beads. The result indicates

- S-18 -
higher α provides higher fraction of hybridized with the same assay time. Figure S6b presents the
final fraction of hybridized probes predicted by the approximate analytical model for varying α due
to varying electric field, assuming a constant δ. In this case, higher α results in shorter assay times. The results indicate that the final fraction of hybridized probes is insensitive to the electric field
strength within the parameter range we explore. This demonstrates that higher electric fields offer
shorter assay times without significant reduction in the final fraction of hybridized probes.
Figure S 6 Final fraction of hybridized from the approximate analytical model for various
acceleration factor and initial target concentrations. a): The final fraction of hybridized probes by
ITP hybridization with various numbers of beads and/or various cross sectional area. b): The final
fraction of hybridized by ITP hybridization at various electric fields under constant channel length
and constant δ assumptions. The dotted lines indicate our experimental conditions.
S-9 Example data from additional titration and specificity experiments We here include and discuss additional analyses of the titration and specificity experiments as shown
in Figs. 2 and 3 of the main paper. In Fig. S7, we present experimental data on fraction of
hybridized probes for ITP (circle) and standard hybridization (squares 20 h and triangles 30 min) for
target 9 as compared to target 8 shown in Fig. 2 of the main paper. Shown with the experimental
data are approximate analytical model predictions for ITP and standard hybridization. Similar to
target 8, we observe good quantitative model agreement with no fitting parameter. We used the
same method to find kinetic parameters and obtained K = 7.27×10⁻¹² and kon = 3.65×10⁶.
In Fig. S8, we present measurements of specific (ID = 9) and nonspecific signal obtained
with ITP and standard hybridization. As with target 8, we observed similar specificity in ITP and

- S-19 -
standard 20 h incubation experiments. Compared to target 8, target 9 shows higher specificity that
reflects the lower melting temperature of the target-probe pair as shown in Table S1. The
specificity index in Fig. S8b is the same order of magnitude as target 8.
Figure S 7 Experimental data demonstrating quantitative detection of a target molecule using 20 min
bead based ITP hybridization and its comparison to well-stirred standard hybridizations performed
for 30 min and 20 h. We obtained the titration curves for target 9 concentraton ranging from 100 fM
to 5 nM. Along with experimental data (symbols), we show prediction of the analytical model for
ITP hybridization (solid) with no fitting parameter. We also show results of analytical models for the
standard 20 h (broken) and 30 min (dashed-dotted) hybridizations. The range bars in the figure
indicate the standard deviation across repetitiation (N = 6 for standard or N = 9 for ITP). The dotted
line shows the ideal equilibrium state target concentration at standard hybridization conditions.

- S-20 -
Figure S 8 Comparison of specific and nonspecific signal between ITP hybridization and standard
incubation (at both 20 h and 30 min). a): Averaged MFI (log scale) for target 9 hybridized with
matching probe (bead ID=9) and nine beads types with non-matching probes. The range bars in the
figure indicate the standard deviation across N = 3 for standard cases and N = 5 for ITP. b):
Specificity index for target 9 (ratio of averaged MFI between specific binding and the highest
non-specific binding (bead ID=3).
References [1] a) L. A. Marshall, A. Rogacs, C. D. Meinhart, J. G. Santiago, J Chromatogr A 2014, 1331, 139-142; b) J. I.
Molho, A. E. Herr, B. P. Mosier, J. G. Santiago, T. W. Kenny, R. A. Brennen, G. B. Gordon, B. Mohammadi,
Anal Chem 2001, 73, 1350-1360.
[2] a) T. K. Khurana, J. G. Santiago, Anal Chem 2008, 80, 6300-6307; b) G. Garcia-Schwarz, A. Rogacs, S. S.
Bahga, J. G. Santiago, J Vis Exp 2012, e3890.
[3] G. Garcia-Schwarz, M. Bercovici, L. A. Marshall, J. G. Santiago, J Fluid Mech 2011, 679, 455-475.
[4] A. Persat, J. G. Santiago, New J Phys 2009, 11, 075026.

- S-21 -
[5] J. S. Paschkewitz, J. I. Molho, H. Xu, R. Bharadwaj, C. C. Park, Electrophoresis 2007, 28, 4561-4571.
[6] a) J. G. Santiago, S. T. Wereley, C. D. Meinhart, D. J. Beebe, R. J. Adrian, Exp Fluids 1998, 25, 316-319; b) C.
D. Meinhart, S. T. Wereley, J. G. Santiago, Exp Fluids 1999, 27, 414-419.
[7] C. D. Meinhart, S. T. Wereley, J. G. Santiago, J Fluids Eng 2000, 122, 285-289.
[8] M. Bercovici, C. M. Han, J. C. Liao, J. G. Santiago, Proc Natl Acad Sci USA 2012, 109, 11127-11132.
[9] O. Dagan, M. Bercovici, Anal Chem 2014.
[10] M. Jaros, K. Vcelakova, I. Zuskova, B. Gas, Electrophoresis 2002, 23, 2667-2677.
[11] N. C. Stellwagen, C. Gelfi, P. G. Righetti, Biopolymers 1997, 42, 687-703.