title: gender effects on technology-mediated speaking tests
TRANSCRIPT

Papers in Language Testing and Assessment Vol. 1, 2012 1
Does gender, test medium, or attitude matter?
Analyzing test takers’ responses to technology-mediated
speaking tests
Eunjyu Yu
State University of New York at Canton, USA
In response to increasing concerns about fairness and justice in
computerized oral proficiency testing, this study investigated
the relationship between test taker attributes and test delivery
media of two different technology-mediated speaking tests.
Two hundred eight non-native English speakers in a major
public US university participated in this study. The results of a
multiple regression analysis showed that test takers’ attitudes
toward the test delivery media was the most influential
predictor of results on the technology-mediated speaking tests,
followed by a gender-test delivery medium interaction effect.
Further analyses of the qualitative information identified the
perceived advantages and disadvantages of two different
technology-mediated modes and a human-interlocutor-
mediated mode. The results indicated that a live face-to-face
interview mode was the most favored in measuring oral
proficiency, followed by a computerized mode and an audio-
tape-mediated mode. Implications are drawn for appropriate
use of technology in measuring oral proficiency.
Key words: validity, computer-mediated oral proficiency
assessment, gender, attitude, test delivery media
Introduction
Since the Foreign Service Institute adopted a performance-based live interview
mode to measure oral proficiency in 1956 (Fulcher, 2000), test developers have
explored different test delivery modes with a view to optimizing performance-
based spoken language testing conditions. In recent years the efficiency and
flexibility of advanced computer technology (Burstein et al., 1996; Fulcher, 2000;
Hawisher & Self, 2000; Roever, 2001; Warschauer, 1999; Xi, 2010), has resulted
in more frequent use of computers to deliver spoken language test items.
Address for correspondence: Eunjyu Yu, Department of English, State University of New York at Canton, 34 Cornell
Drive-FOB 520, Canton, NY 13617, USA; Email: [email protected]

E. Yu
2
With the soaring use of computer technology in the delivery of high stakes
speaking tests comes a growing recognition of the need for data-driven
validation of computerized speaking assessments (Brown, 2004; Burstein et al.,
1996; Chapelle, 2001; Kenyon & Malabonga, 2001; Taylor et al., 1998). It cannot
for example be assumed that such assessments function similarly with different
groups of test takers or whether factors such as gender and attitude towards the
test delivery medium have an impact on performance. This is the focus of the
current study, which explores these issues on a speaking test delivered in
different modalities with non-native speakers of English at a major public
university in the United States.
Such an investigation, it will be argued, has an important role in guiding
language test developers towards appropriate and well-informed use of
technology, particularly computer technology, to measure communicative
competence.
Background
After World War II, the proficiency movement was introduced in foreign
language assessment in the United States in recognition of the importance of
functional language ability for U.S. government employees to perform certain
target language tasks in real-life situations (American Council on the Teaching
of Foreign Languages [ACTFL], 2009). As an outcome of the movement, in 1956,
the Interagency Language Roundtable (ILR) adopted a face-to-face interview
given that this mode situates a test taker in real-time interactions with one or
more human interlocutors. In 1982, the ILR oral proficiency scale was modified
for public use, mostly for academic or business settings, by the ACTFL (Arnett
& Haglund, 2001).
In the 1980s, responding to the need for a speaking test that could be
administered to a large group of people at a relatively low cost, the Center for
Applied Linguistics introduced the Simulated Oral Proficiency Interview (SOPI)
(Kenyon & Malabonga, 2001). Instead of human interlocutors, the SOPI uses an
audio-tape recorder and printed supplements to deliver test items.
Currently, thanks to the computer technology revolution, multiple test modes
can be integrated within a single testing package. This expands the range of
available options for performance-based oral proficiency assessment (Burstein
et al., 1996; Fulcher, 2000; Hawisher & Self, 2000; Roever, 2001; Warschauer,
1999). In addition, technology extends the capacity of test administration
logistics (Alderson, 2000; Educational Testing Service, 1996; Kenyon &
Malabonga, 2001; Norris, 2001). For example, the internet-based TOEFL test is
available round the clock anywhere in the world where the Internet is

Papers in Language Testing and Assessment Vol. 1, 2012 3
accessible although the timing of testing sessions may of course be constrained
for security purposes. For all of the above reasons, the case for using the
computer and the web as test delivery media for oral assessment is compelling.
Nevertheless, the adoption of diverse delivery media for high-stakes tests has
raised concerns that different degrees of familiarity with a particular test
delivery medium might produce unequal opportunities to succeed. Likewise,
many researchers have pointed to the risk that test takers’ affective reactions to
different test delivery media might affect their test performance (Messick, 1989;
Shohamy, 1982; Spolsky, 1995). While early studies of this issue by Scott (1986)
and Shohamy (1982) showed no significant difference among test takers’
affective reactions to different oral testing modes, in Hill’s (1998) study test
takers showed a preference for an audiotape-mediated speaking test over a live
interview mode. More importantly, test takers’ affective reactions to the test
media were reflected in their level of performance on each test modality. In a
subsequent study, Kenyon and Malabonga (2001) found that examinees favored
a computerized oral proficiency test over an audiotape-mediated test because
the computerized test allowed them more control in choosing test tasks, test
levels, and response time. The study’s participants also performed better on the
computerized test.
Since affective factors can be considered a possible source of construct-
irrelevant variance (Elder, Iwashita & McNamara, 2002; Messick, 1989), it is
important that their potential impact on test performance in different delivery
modes be further explored. In addition, in the interests of fairness and social
justice, critical applied linguistic scholars have called for more attention to
possible gender effects in testing (Kunnan, 2000; Pennycook, 2001; Shohamy,
1998, 2001). Underlying this concern is the claim that in our male-dominated
society it is men who have privileged access to certain forms of symbolic capital,
specifically knowledge (Pavlenko, 2001), whereas females have more restricted
access to educational opportunities. Further, it has been argued that a
patriarchal society has educated females to be feminine by channeling them
away from masculine culture, including technology (Gill & Grint, 1995).
Accordingly, during the 1980s and 1990s, females were underrepresented in
computer science (American Association of University Women Educational
Foundation, 1999, 2000). To the extent that such trends prevail in current times,
they might be expected to produce gender-related bias on technology-mediated
assessment.
Despite concerns about gendered technology, research on this issue is scant.
Most gender-related research in oral proficiency testing has focused on test
tasks administered either via live interview or in an audiotape-mediated mode,
without any comparison between modes. Evidence for gender bias is patchy
and the role of the test modality in such bias is unclear. While an early study by

E. Yu
4
Buckingham (1997) revealed that test takers performed better when interviewed
by interlocutors of the same gender during a live interview, this was not the
case in Lumley and O’Sullivan’s (2005) research exploring gender effects on the
tape-based oral component of the GSLPA. The latter authors found limited
evidence for any impact of the gender of the hypothetical interlocutor on task
performance, except in the case of a certain task topic (i.e., horse racing) where a
hypothetical male audience produced a significant advantage for male test
takers. This finding is taken by the authors as suggestive evidence that, even in
a tape-mediated environment, test takers do in certain circumstances respond to
the stimulus as they might do in a real world situation. The results of an
experimental study by O’Loughlin (2002), on the other hand, showed that the
gender of test takers and raters had no impact on their results on the arguably
more interactive face-to-face International English Language Testing System
interview. However, as Brown and McNamara (2004) pointed out such effects
may be difficult to perceive in the interview mode due to the complexity of
interactions among test takers, interlocutors, raters, and their socio-cultural
background.
In sum, while there has been little systematic exploration of the interaction
between gender factors and the mode of testing in the language testing field,
the possibility of inequities arising from such interactions is now widely
recognized. Taking into account the significant social impact of testing as
emphasized by scholars such as Messick (1989) and Shohamy (2001), the need
for attention to this issue in the interests of fairness and justice is paramount.
This is all the more important given that the popularity of computer technology
for oral proficiency assessment purposes is a relatively recent phenomenon,
Thus, it would seem important to further explore the links between affective
factors, gender, and the medium of test delivery, especially with regard to
computer-mediated speaking tests.
Research Questions
The present study investigates the following research questions with a focus on
the fairness and validity of technology-mediated speaking tests:
1. To what extent are test taker characteristics—specifically, the test taker’s
gender and his/her attitude toward test delivery media—related to test
performance on different types of technology-mediated speaking tests?
2. Which mode of oral proficiency testing is preferable to test takers, a
computerized test, an audio-taped test, or a live face-to-face interview?
What are the perceived advantages and disadvantages of each test
mode?

Papers in Language Testing and Assessment Vol. 1, 2012 5
Methodology
Participants
A total of 208 non-native English speakers volunteered to participate in this
study. They were recruited in 2005 across all academic graduate programs in a
major public US university with a large population of international students.
The majority of the participants were between the ages of 21 and 34 years. With
respect to nationality, 75 participants came from China, 33 from India, 33 from
Korea, 41 from European countries, and 26 from other countries.
Approximately half of the participants were females (N=113), and the other half
were males (N=95).
Materials
The SPEAK Test
At the research site, the original version of the SPEAK, rather than the revised
version introduced in the mid-1990s, has been used as a placement test to
identify the oral proficiency of international students over decades.
Accordingly, this audiotape-mediated SPEAK test, originally developed by
Educational Testing Service, was selected to measure the speaking ability of the
participants, the dependent variable of this study. The test consisted of seven
sections including reading aloud and making an announcement (Appendix A).
In order to detect a test delivery medium effect, if any, the same test items were
delivered either by an audiotape recorder or on a computer screen. The use of
the same test items also helped to avoid any confounding error associated with
test items.
As for test item delivery mode, the package of the original SPEAK test was
composed of audio-taped prompts and printed visuals. Following the routine
procedure, a regular audio cassette recorder delivered test items and recorded
each participant’s responses on a regular audio tape via a microphone attached
to a headset. Since the original SPEAK test was available in an audiotape-based
format only, the same test items of the SPEAK test were digitalized for research
purposes. Unlike the taped version, the computerized edition delivered
digitally videotaped test items on a 15 inch LCD screen of a laptop computer
installed with Windows XP. As with a real-time video conference setting, a test
taker could watch the facial expressions and movements of the human
interlocutor on the screen. In addition, a visual digital timer at the bottom of the
screen displayed the allotted time limit for each test item. Reponses were
digitally saved on the computer hard drive.
For this study, two ESL teachers were recruited to rate the responses of the
SPEAK test at the research site. Both of them have taught English language to
non-native speakers for six years or longer. One of the raters has scored the
SPEAK test for more than fifteen years in the ESL program at the research site.
E. Yu
6
According to the protocol for training the SPEAK test raters at the research site,
each rater was trained to compute test scores using response samples at all
levels under the direct supervision of the ESL program director. The two raters
repeated the calibration until the ratings of the two raters and the program
director on dozens of samples matched. The SPEAK scoring key (Appendix B)
were used to grade the responses. This criterion-referenced test has adopted a
partial credit scoring model (Appendix B). The SPEAK total score was
computed in terms of pronunciation, grammar, fluency, and comprehensibility.
This study used the total score as a dependent variable. The highest possible
score on the test was 300.
To estimate inter-rater reliability, 25 response samples were randomly selected
and independently scored by the two trained raters. Not only does the Kappa
statistic effectively identify discrepancies among raters and retraining raters on
a criterion-referenced test (Stemler, 2004), the statistic detects the extent of
agreement with the rubric (Gwet, 2001). Further, the threshold loss agreement
approach is appropriate for a high stake situation since it treats all
misclassifications equally while the squared error loss agreement approach
does not (Berk, 1984). For these reasons, a threshold loss agreement index was
calculated using the kappa coefficient equation (Bachman, 2005, p. 200) as
follows:
coefficient kappa K̂ = )ˆ1(
)ˆˆ(
c
co
P
PP
where oP̂ = the agreement coefficient
cP̂ = the proportion of agreement that is due to chance
A score of 230 was used as the cut-off in computing a threshold loss agreement
index because 230 points was the pass point for the SPEAK test at the research
site and has also been described as high intermediate level by the ETS. Since a
high kappa coefficient of 0.92 and a Spearman rho correlation coefficient of 0.98
were observed between the two raters, each rater randomly selected and
independently graded half of the remaining participant response samples. Each
examinee was evaluated by one rater, aside from those 25 used for computing
inter-rater reliability.
Attitude Questionnaire
Adapted from the work of Hill (1998) and Kirsch et al. (1998), a participant
questionnaire (Appendix C) was specifically developed for the present study to
measure test takers’ attitudes toward the test delivery media. The questionnaire
was available in two versions, one for the computerized test and the taped test
respectively. As can be seen in Table 1, seven items were developed to identify
test takers’ attitudes toward the two different test media. Using a 6-point Likert

Papers in Language Testing and Assessment Vol. 1, 2012 7
scale from 1 (strongly disagree) to 6 (strongly agree), attitude was quantified as
a continuous variable.
Table 1. Attitude indicators
Item Attitude indicator
1. I was comfortable taking a spoken English test on a computer/by an audiotape recorder.
2. The test medium fairly delivered test items.
3. The test medium allowed me to have enough time to prepare my answers.
4. The test medium allowed me to have enough time to give my answers.
5. The test medium delivered the directions clearly.
6. Visual cues of the test medium were helpful.
7. The test medium was an appropriate tool for measuring my current spoken English
ability.
In addition, the following open-ended statement was developed to explore
participants’ preference for one or other test delivery medium and the main
advantages and disadvantages of each mode: Which type of an oral proficiency test
do you prefer to take? A live face-to-face interview, a computerized test, or an audio-
taped test? Please choose only one and specify the reasons for your choice.
Procedure
On a random basis, participants were assigned to take either the taped test or
the computerized one until participants were almost evenly distributed across
the groups. It was not possible to give students tests using both media because
they were volunteers and unwilling to spend the time required to take both
tests. In addition, when asked if they had ever taken any taped oral proficiency
tests, the participants reported that they had taken a tape-mediated spoken
English test (i.e., SPEAK or TSE) once or more before the present study. Since
all participants were already familiar with a taped oral proficiency test format,
it was deemed unnecessary to adopt a counterbalanced design in order to
compare experience with the two different technology-mediated tests. Table 2
presents four sub-groups generated according to the attributes of gender and
test delivery medium.
Table 2. Distribution of participants by gender and a test medium
Gender Test medium N
Female Computerized test 53
Taped test 60
Male Computerized test 50
Taped test 45

E. Yu
8
Before taking a test, all participants took a mandatory tutorial. During the
tutorial session, each participant practiced with the testing equipment at his/her
own pace. After the tutorial, the participants took a test individually in a
controlled condition. The conventional audio-taped SPEAK test was conducted
via an audio-tape recorder and each response on the taped test was recorded on
a regular audio cassette tape. Meanwhile, the computerized test was
administered via a 15 inch laptop computer with Windows XP and each
response on the test was converted to a digital audio file on a computer hard
drive. After taking the test, participants completed a questionnaire. The whole
process took approximately an hour and a half per participant, including
twenty-five minutes to complete the test.
Data analysis procedure
This study used quantitative research methods. Specifically, using a multiple
linear regression model, the analysis focused on identifying the relationships
among variables. In this study, the independent variables were test taker
gender, test delivery medium, and attitude toward test delivery media. The
dependent variable was the total score of either the audio-taped SPEAK test or
its computerized version. The computer software SPSS 15.0 for Windows was
used for data analyses. In addition, the extended-responses to the questionnaire
were analyzed to identify advantages and disadvantages in the test design
features of the two different technology-mediated speaking tests.
Results
Descriptive statistics for attitude toward the test delivery media
Descriptive statistics were undertaken with the use of the computer program
SPSS 15. As shown in Table 3, the attitude scores on Items 3, 4, and 7 were
roughly normally distributed. This meant that the majority of the participants
showed a neutral position with respect to these questions (see Table 1).
However, their responses to Item 1, 2, and 6 were on a negatively-skewed curve.
This implied that the majority of the participants responded to these items with
“agree” or “strongly agree.”
Papers in Language Testing and Assessment Vol. 1, 2012 9
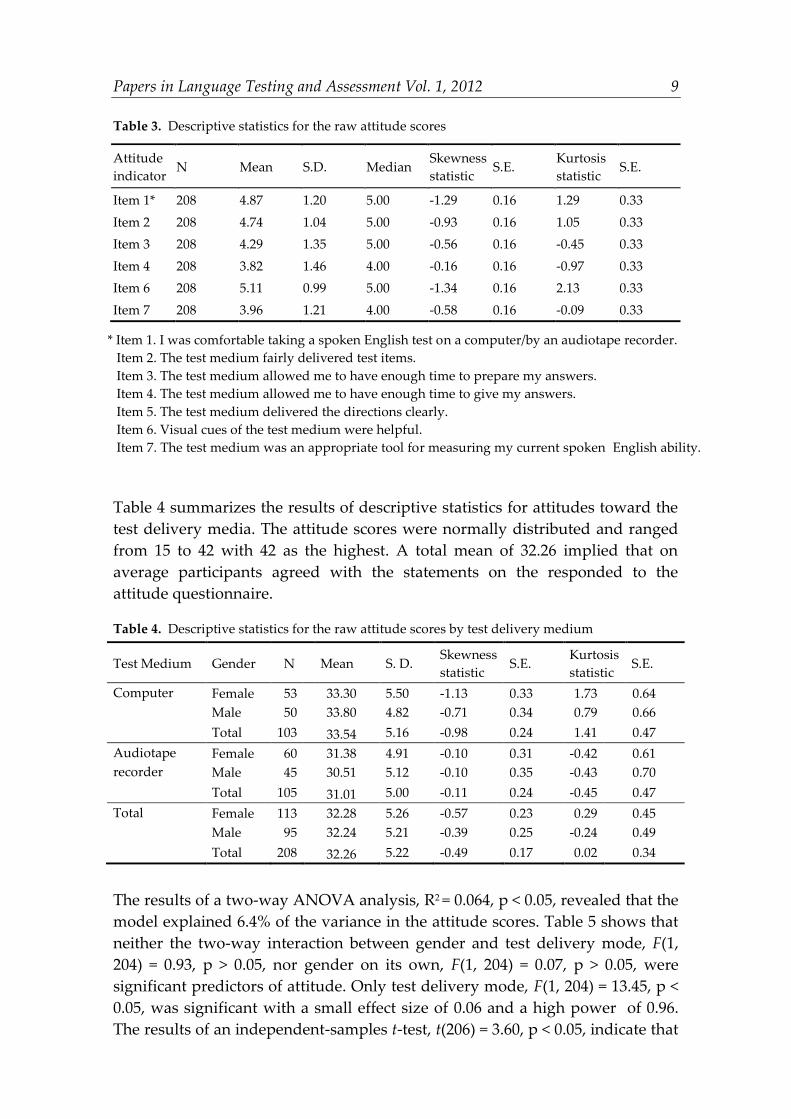
Table 3. Descriptive statistics for the raw attitude scores
Attitude
indicator N Mean S.D. Median
Skewness
statistic S.E.
Kurtosis
statistic S.E.
Item 1* 208 4.87 1.20 5.00 -1.29 0.16 1.29 0.33
Item 2 208 4.74 1.04 5.00 -0.93 0.16 1.05 0.33
Item 3 208 4.29 1.35 5.00 -0.56 0.16 -0.45 0.33
Item 4 208 3.82 1.46 4.00 -0.16 0.16 -0.97 0.33
Item 6 208 5.11 0.99 5.00 -1.34 0.16 2.13 0.33
Item 7 208 3.96 1.21 4.00 -0.58 0.16 -0.09 0.33
* Item 1. I was comfortable taking a spoken English test on a computer/by an audiotape recorder.
Item 2. The test medium fairly delivered test items.
Item 3. The test medium allowed me to have enough time to prepare my answers.
Item 4. The test medium allowed me to have enough time to give my answers.
Item 5. The test medium delivered the directions clearly.
Item 6. Visual cues of the test medium were helpful.
Item 7. The test medium was an appropriate tool for measuring my current spoken English ability.
Table 4 summarizes the results of descriptive statistics for attitudes toward the
test delivery media. The attitude scores were normally distributed and ranged
from 15 to 42 with 42 as the highest. A total mean of 32.26 implied that on
average participants agreed with the statements on the responded to the
attitude questionnaire.
Table 4. Descriptive statistics for the raw attitude scores by test delivery medium
Test Medium Gender N Mean S. D. Skewness
statistic S.E.
Kurtosis
statistic S.E.
Computer Female 53 33.30 5.50 -1.13 0.33 1.73 0.64
Male 50 33.80 4.82 -0.71 0.34 0.79 0.66
Total 103 33.54 5.16 -0.98 0.24 1.41 0.47
Audiotape Female 60 31.38 4.91 -0.10 0.31 -0.42 0.61
recorder Male 45 30.51 5.12 -0.10 0.35 -0.43 0.70
Total 105 31.01 5.00 -0.11 0.24 -0.45 0.47
Total Female 113 32.28 5.26 -0.57 0.23 0.29 0.45
Male 95 32.24 5.21 -0.39 0.25 -0.24 0.49
Total 208 32.26 5.22 -0.49 0.17 0.02 0.34
The results of a two-way ANOVA analysis, R2 = 0.064, p < 0.05, revealed that the
model explained 6.4% of the variance in the attitude scores. Table 5 shows that
neither the two-way interaction between gender and test delivery mode, F(1,
204) = 0.93, p > 0.05, nor gender on its own, F(1, 204) = 0.07, p > 0.05, were
significant predictors of attitude. Only test delivery mode, F(1, 204) = 13.45, p <
0.05, was significant with a small effect size of 0.06 and a high power of 0.96.
The results of an independent-samples t-test, t(206) = 3.60, p < 0.05, indicate that

E. Yu
10
the participants preferred a computer (M=33.54) over a regular audio cassette
recorder (M=31.01) as a test delivery medium.
Table 5. Two-way ANOVA statistics of raw attitude scores by gender and test delivery mode
Source df SS MS F
p-
value 2
p Powera
Test mode 1 348.75 348.75 13.45 0.00* 0.06 0.96
Gender 1 1.80 1.80 0.07 0.79 0.00 0.06
Test mode * Gender 1 24.15 24.15 0.93 0.34 0.01 0.16
Error 204 5288.60 25.92
Total 207 5648.46
R2 = 0.064 (Adjusted R Squared = 0.050)
a. Computed using alpha = 0.05
Descriptive statistics for the SPEAK test scores
As shown in Table 6, the moderate skewness statistic of -0.43 (s0) with the
small kurtosis of -0.67 (k<3) indicated that the test scores were roughly
normally distributed with thick tails and a low peak. With the total mean of
224.09, the spoken English test scores, dependent variable, ranged from 100 to
300, the highest possible score. According to the Educational Testing Service
(1982), a score of 224.09 meant that the response sample was generally
comprehensible with some errors. Overall, the female participants (M=226.99)
outperformed the males (M=220.63). The mean of 227.81 on the taped test was
higher than the mean of 220.29 on the computerized test. Among the four
groups, as presented in Figure 1, the male participants taking the taped test
ranked highest with a mean of 231.11, followed by the female participants
taking the computerized test (M=228.87) and the taped test (M=225.33). The
male participants taking the computerized test ranked lowest with a mean of
211.20. Interestingly, it was the male groups who differed most across delivery
modes.

Papers in Language Testing and Assessment Vol. 1, 2012 11
Table 6. Descriptive statistics for the SPEAK test scores
Test Medium Gender N Mean S. D. Skewness
statistic S.E.
Kurtosis
statistic S.E.
Computer Female 53 228.87 52.93 -0.74 0.32 -0.24 0.64
Male 50 211.20 54.12 0.03 0.33 -0.83 0.66
Total 103 220.29 53.98 -0.34 0.23 -0.78 0.47
Audiotape Female 60 225.33 49.45 -0.54 0.30 -0.48 0.60
recorder Male 45 231.11 47.96 -0.45 0.35 -0.63 0.69
Total 105 227.81 48.67 -0.50 0.23 -0.55 0.46
Total Female 113 226.99 50.91 -0.63 0.22 -0.40 0.45
Male 95 220.63 51.99 -0.20 0.24 -0.85 0.49
Total 208 224.09 51.39 -0.43 0.16 -0.67 0.33
Figure 1. Means plot of the SPEAK test score
Multiple regression analysis
Assumption check
Assumptions for the linear regression model were checked before exploring
relationships among variables. First of all, although the participants in the
study were volunteers, random assignment to the different test delivery
conditions was strictly followed to reduce any potential experimental bias.
Second, in order to avoid a violation of the independence assumption, the
participants took the test individually under controlled conditions. Third, since
the SPEAK test score, the dependent variable of this study, was a continuous
variable, the assumption that dependent variable be interval or ratio data was
met. Fourth, the result of Levene’s test, F(3, 204) = 0.72, p > 0.05, revealed that
the error variances of the test scores were equal across the groups. The residuals
statistics for the test results indicated that the standardized residuals were
normally distributed with the mean of zero and the standard deviation of 0.99.
As shown in Figure 2, the P-P plotted residuals followed the 45-degree line,
confirming that the normality assumption has been satisfied. Last, Table 7

E. Yu
12
indicates that correlations among the three predictors were not significant at the
0.05 level (2-tailed). Further, as presented in Tables 9 and 10 (pages 13 and 14,
respectively), both tolerances and variance inflation factors (VIF) for the
variables were almost 1, suggesting that the regression model did not have any
problem with multicollinearity. Therefore, the data set of this study was
deemed appropriate for the linear regression analysis.
Figure 2. Normal P-P plot of regression standardized residual
Table 7. Correlation coefficients among the three predictors
Gender Attitude Test medium
Gender 1
Attitude 0.01 1
Test medium 0.06 -0.23 1
Hypothesis
The present study hypothesized as follows: There are linear relationships
among test taker gender, test delivery medium, attitude toward a test delivery
medium, and test results on different types of technology-mediated speaking
tests. The statistical model for this study is expressed in the general linear
model as follows (Dean & Voss, 1999):

Papers in Language Testing and Assessment Vol. 1, 2012 13
y = + x + z + w + xz + xw + zw + xzw
where, y = the observed SPEAK test score of an individual
= the constant or intercept
x = gender
z = test delivery medium
w = attitude toward a test medium
xz, xw, zw = two-way interactions
xzw = three-way interaction
, , = regression coefficients for the three predictors
, = regression coefficients for the two-way
interactions
= regression coefficients for the three-way
interaction
Factor analysis of attitude toward the test delivery media
Factor analysis was undertaken to extract factors that explained variance in
attitude effectively. The analysis revealed that the largest eigenvalue of 2.91 was
significantly greater than the second largest eigenvalue of 0.98. This meant that
one dominant factor, attitude toward the test medium, explained
approximately 42% of the variance in responses to the questionnaire. Principal
Axis Factoring was used to look at the common variance shared by the
variables (SPSS Inc., 2007). As presented in Table 8, a factor matrix was
generated to identify factor loadings, the correlation between the items and the
attitude factor. The loadings ranged from 0.40 to 0.66. Since a loading of 0.3 or
higher is interpreted as salient (Brown, 2006), all seven items were used to
compute the factor score as the measure of attitude toward the test media. With
the seven items, a Cronbach alpha coefficient of 0.76 and an odd-even split-half
reliability of 0.81 were computed. The factor scores were used to conduct
multiple regression analysis while the raw attitude scores were used to
undertake descriptive statistics.

E. Yu
14
Table 8. Factor Matrix
Attitude indicator Factor
loading
Factor score
coefficient
1 I was comfortable taking a spoken English test on a computer/
by an audiotape recorder. 0.61 0.22
2 The test medium fairly delivered test items. 0.66 0.26
3 The test medium allowed me to have enough time to prepare
my answers. 0.63 0.23
4 The test medium allowed me to have enough time to give my
answers. 0.59 0.20
5 The test medium delivered the directions clearly. 0.40 0.10
6 Visual cues of the test medium were helpful. 0.46 0.14
7 The test medium was an appropriate tool for measuring my
current spoken English ability. 0.59 0.20
Extraction Method: Principal Axis Factoring.
Multiple regression analysis
Stepwise multiple regression was run to explore the significant predictor(s) of
the technology-mediated speaking test results. As seen in Table 9, 18% of the
variance in the SPEAK test results, R2 = 0.18, p < 0.05, was explained by the
model. The attitude toward the test delivery medium, β = 0.41, p < 0.05 was the
most influential predictor, followed by the two-way interaction between gender
and the test delivery medium, β = -0.20, p < 0.05.
Table 9. Summary of stepwise multiple regression analysis
Model
Unstandardized
Coefficients
Standardized
Coefficients
t p-value
Collinearity
β S.E. β Tolerance VIF
Constant 229.97 3.73 61.66 0.00
Attitude 23.62 3.73 0.41 6.34 0.00* 0.98 1.02
Gr*Tm -24.46 7.68 -0.20 -3.19 0.00* 0.98 1.02
Dependent Variable: SPEAK Test Score
* p < 0.05
R2 = 0.18
Since the two-way interaction between gender and the test delivery media was
significant, forced entry regression was conducted to refit the model with the
three independent variables and the significant two-way interaction. As shown
in Table 10, the results of the multiple regression analysis revealed that the
female participants taking the taped test (M=225.33), β = -28.76, p < 0.05,
significantly outperformed the male participants taking the computerized test

Papers in Language Testing and Assessment Vol. 1, 2012 15
(M=211.20). The unstandardized regression weight of 24.51 for attitude implied
that the more positive the attitudes of participants toward the test delivery
medium being used, the better their performance on the test. Specifically, a one
unit increase in the attitude factor score, β = 24.51, p < 0.05, resulted in an
increase of 24.51 points in the SPEAK test score.
Table 10. Summary results of multiple regression analysis
Model
Unstandardized
Coefficients
Standardized
Coefficients
t p-value
Collinearity
β S.E. β Tolerance VIF
Constant 228.71 6.06 37.76 0.00
Attitude 24.51 3.79 0.42 6.47 0.00* 0.94 1.06
Test Media -4.00 8.89 -0.04 -0.45 0.65 0.53 1.88
Gender 9.35 9.23 0.09 1.01 0.31 0.50 2.01
Gr*Tm -28.76 13.06 -0.24 -2.20 0.03* 0.34 2.97
Dependent Variable: SPEAK Test Score
* p < 0.05
R2 = 0.19
In summary, the significant predictors of the technology-mediated speaking
test results were the attitude toward the test delivery media and the two-way
interaction between gender and the test delivery media. In measuring oral
proficiency, a computer was significantly preferred over a regular audio
recorder.
Advantages and disadvantages of different test delivery media for oral proficiency
assessment
Further analysis was conducted to investigate the main advantages and
disadvantages in using different test delivery media for oral proficiency
assessment. For this purpose, the following open statement was used: Which
type of oral proficiency test do you prefer to take? A live face-to-face interview, a
computerized test, or an audio-taped test? Please choose only one and specify the
reasons for your choice. Although the participants took either the taped test or the
computerized test for the present study, all of the participants had experienced
the three test delivery media at least once during the research process and/or
before. The patterns of extended responses were analyzed in terms of theme
and frequency.
As shown in Table 11, 131 of the 208 participants (63%) preferred a live face-to-
face interview mode over the two technology-mediated tests. Only four percent
of the participants preferred the audio-taped test mode.

E. Yu
16
Table 11. Summary of test delivery medium preference
Test Delivery Mode N %
Audio-taped test 9 4
Computerized test 61 30
Face-to-face interview 131 63
No preference 7 3
Total 208 100
Audio-taped test
Although nine participants chose an audio-taped test as their preferred format,
as shown in Table 12, only eight of the 208 participants mentioned the
advantages of this delivery medium. Seven of these eight reported that the
audio-taped test delivered test items consistently. The comments implied that
the standardized procedure would reduce any possible bias that might be
caused by the variable behavior of human testers. One respondent mentioned,
perhaps paradoxically, that the tension that he felt with regard to the audio-
taped test mode caused him to be more focused on the test.
Table 12. Summary of the advantages of the tape-mediated test
Comments N %
The standardized testing procedure across all test takers would reduce
subjective judgment. 7 87
Tension was helpful in focusing on test. 1 13
Total 8 100
On the other hand, 25 of the 208 participants mentioned the disadvantages of
the audio-taped test. As presented in Table 13, 16 of the 25 respondents (56%)
described the unnatural test setting as the main problem with the audio-taped
test. In other words, the testing context lacked two-way dynamic interactions,
particularly with human beings. In this unnatural situation, they felt
uncomfortable talking to a recorder. In addition, eight percent of the
respondents complained that the linear mechanism of the audio-taped test did
not allow them to clarify test prompts or their responses. Since a timer was not
available for the audio-taped test mode, twelve percent of the participants
reported that they had a hard time completing test tasks within the allotted
time period. They complained that their responses were cut off in the middle of
a sentence and commented that a visual or audible timer would help them with
time management.

Papers in Language Testing and Assessment Vol. 1, 2012 17
Table 13. Summary of the disadvantages of the tape-mediated test
Comments N %
Artificial testing environment 16 56
Low sound quality 3 12
Lack of a timer 3 12
No second chance for clarification 2 8
Discomfort in using a recorder 1 4
Total 25 100
Computerized speaking test
With respect to the computerized speaking test, although 61 participants chose
that format as their preferred delivery medium, 85 of the 208 participants
mentioned the advantages of the computerized test. As presented in Table 14,
41 of the 85 participants (48%) pointed out that visual cues on the computer
screen helped them understand questions better. Particularly, unlike the audio-
taped test, due to the digitalized video clips of the interlocutor delivered on the
computer screen, the participants felt the computerized test mode was more
interactive and similar to real life video conferencing. In addition, the digital
timer on the computer screen helped them complete their responses within the
allotted window period. Thirty-eight percent of the respondents reported that
they felt more comfortable with the computerized test mode than the taped
mode because they used a computer on a daily basis while an audio-taped
recorder was out of date. Finally, eight percent of the respondents mentioned
that the computerized test was implemented for every test taker in the same
way. They claimed that this standardized testing procedure of the
computerized test would measure speaking ability more accurately than a live
interview mode.
Table 14. Summary of the advantages of the computerized test
Comments N %
Effective visual support (e.g., facial expression of the interlocutor, digital
timer)
41 48
More comfortable being tested by a computer 32 38
More controlled testing environment and standardized testing procedure 7 8
Good quality sound 5 6
Total 85 100
On the other hand, ten of the 208 participants listed the disadvantages of the
computerized test. As shown in Table 15, nine of the ten participants (90%)
complained that the linear mechanism of the computerized test did not allow
two-way dynamic interaction. In other words, the situation was not embedded
in a natural conversation environment. Besides, one respondent commented
that it would be good to have a second chance for clarification when needed.

E. Yu
18
Table 15. Summary of the disadvantages of the computerized test
Comments N %
Lack of two-way dynamic interaction 9 90
No second chance for clarification 1 10
Total 10 100
Face-to-face interview
Although 131 participants chose a live interview as their preferred test format,
165 of the 208 participants mentioned the advantages of a live interview. As
shown in Table 16, 112 respondents (68%) described a face-to-face interview
setting as an authentic real world situation.
The following sample response implied that two-way interactions would
efficiently collect authentic speech samples: “Interaction with people helps me
speak more fluently. Considering that a computer does not allow me to interact,
it would not be fair to assume that the test score reflects my daily interactive
communication skills.” Further, unlike the standardized procedure of the
technology-mediated speaking tests, a live interview allowed for relatively
greater flexibility. The respondents reported that they could benefit from
having the flexibility to choose discussion topics (16%) and to ask for
clarification (9%) and feedback (7%) through the interaction with a human
interlocutor.
Table 16. Summary of the advantages of a live interview
Comments N %
Authentic/natural conversation environment 112 68
Flexibility in time and in the choice of topics 26 16
Possible second chance for clarification 16 9
Availability of immediate feedback 11 7
Total 165 100
On the other hand, as presented in Table 17, 26 of the 41 respondents (63%)
reported discomfort when an interviewer was watching them through the
entire interview and judging what they said and how they completed given
tasks. Further, due to its flexibility, 34% of the respondents were concerned
about possible variance that might be caused by different personalities, accents,
bias, and background across human interviewers interacting with an
interviewee.

Papers in Language Testing and Assessment Vol. 1, 2012 19
Table 17. Summary of the disadvantages of a live interview
Comments N %
Discomfort with being judged 26 63
Possible variance across interviewers 14 34
Time consuming 1 3
Total 41 100
Finally, as presented in Table 11, seven of the 208 participants showed no
preference for any test delivery medium. One of the respondents stated, “If I
can speak English very well, I won't care about the test format.”
To summarize, those reporting a preference for a face-to-face interview
outnumbered those favoring the technology-mediated speaking tests. The two-
way interaction with a human interlocutor and its customized test procedure
were reported as the main advantages of a real-time interview. However, there
were concerns about potential variation across human interlocutors. As a
substitute for a live interview, a computerized speaking test was preferred over
an audio-taped test. The controlled test environment and effective visual
support were reported as the main advantages of a computerized test. However,
the respondents suggested that the computerized test should adopt a two-way
dynamic interface rather than a linear procedure. Last, there was not much
comment on the audio-taped test. Although a few participants liked its
consistent testing procedure, they commented on the lack of any visual support
such as a timer.
Discussion
Research question 1
Given concerns about potential gender bias associated with technology, this
study investigated the extent to which test taker gender, test delivery media,
and test taker attitude toward test delivery media were related to test
performance on different types of technology-mediated speaking tests. For this
purpose, the conventional audio-taped SPEAK test and its computerized
version were used.
First of all, as presented in Table 10, the results of the regression analysis
confirmed that test takers’ attitudes toward the test delivery media were the
most significant predictor of their test results. More precisely, if the participants
showed a more positive attitude toward the test delivery medium used in their
test (whether tape or computer), they were more likely to perform better on that
test. This finding about affective impact was consistent with those of Hill (1998)
and Kenyon and Malabonga (2001). While we cannot be sure that it was
attitude that caused the better performance, it may be worth taking steps to
minimize potential resistance to the testing modality by giving plenty of

E. Yu
20
practice opportunities and integrating test taker-friendly features such as replay
function and a timer.
In addition, the two-way interaction between gender and the test delivery
media was also significantly associated with the test results. Interestingly, the
males taking the taped test ranked highest while the males taking the
computerized one ranked lowest, which was significantly lower than the
females’ performance on both tests. Unlike critical applied linguistic scholars’
concerns about gender-related bias on technology-mediated assessment, the
present study found that the male participants reacted more sensitively to the
test modality and males might take advantage in relatively more artificial
testing environment, as the participants pointed out, created by the tape-based
testing mode. These findings, while they do not constitute firm evidence of bias,
given the lack of any independent controls for test taker ability, imply that a
certain test medium might favor a particular group of test takers. Given that
fairness is an essential foundation of test validity, a test should function equally
and appropriately across all groups of test takers. Thus, further research on the
impact of different test delivery media on test outcomes is necessary to enhance
not only comparability across test delivery media but also test validity.
Research question 2
Since test takers’ attitude toward a test delivery medium was significantly
related to test results, further analysis was conducted to identify preference for
a test delivery medium and to investigate the perceived advantages and
disadvantages of an audio-taped speaking test, a computerized test, and a live
face-to-face interview. As shown in Table 11, 63% of the participants preferred a
human interlocutor-mediated oral proficiency test over the two technology-
mediated tests. The main reason for the choice was their belief that a live face-
to-face interview situated a test taker in natural two-way conversation
environment that enabled him or her to have flexible interaction with a human
interlocutor. On the other hand, the standardized test procedure of the
technology-mediated tests restricted these flexibilities. Interestingly, at the same
time, the standardized test procedure was reported as one of the advantages of
the technology-mediated tests. Since test takers perceive testing modalities
differently, a choice of modality should be dictated by the purpose and context
of use. For example, a live interview with human testers may be best if
interaction is a critical feature of target language use situation.
Responses from test takers in this study have implications for optimizing the
testing environment in relation to each test delivery medium. First, with regard
to the computerized test, the artificial aspects of the technology-mediated tests
were reported to be the main problem and most participants believed that their
communicative ability should be measured in a real-life situation. In fact, since
Papers in Language Testing and Assessment Vol. 1, 2012 21
this study was conducted, artificiality may be less of a problem in a computer-
based testing environment. Advances in technology enable integration of
various digital multimedia into a test package and can keep a test more
interactive and live. Including an interactive interface would allow a user to
have more dynamic interaction with the machine and accordingly yield richer
and more authentic speech samples.
Second, there was concern among respondents about the lack of immediate
feedback in the computerized modality. In fact, this problem has been
addressed as a result of advances in speech recognition technology, which
enables automatic scoring (Bernstein, Moere & Cheng, 2010; Franco et al., 2010;
Xi, 2010). The technology would reduce the potential variance in rating that
might occur among human raters. Last, although most of the participants felt
comfortable with using a computer, those who have had limited exposure to a
computer could be assisted with a tutorial on test equipment undertaken before
the test administration. Perhaps as a safeguard, a mandatory tutorial should be
designed for all test takers to reduce possible confounding effects of the testing
medium.
As was the case with the computerized test, lack of interaction was reported as
the main problem of the audio-taped SPEAK test. The participants also
mentioned that having a second chance for clarification would make the testing
procedure interactive. The constraints of the taped test format mean that the
inclusion of “replay” and/or “record again” features is not feasible. A
supplementary test booklet with appropriate visual and text information could,
however, be provided as a resource for a test taker. The inclusion of a timer
would also help a test taker with time management and ultimately, increase the
chances of collecting more ratable response samples. In addition, considering
that some of the participants complained about a shortage of time, the amount
of time allotted for each test item on the SPEAK should be reviewed and
appropriately adjusted. Last, there was concern about misuse of the cassette
tape recorder. Since the recorder is not often used nowadays, some of the
participants felt uncomfortable using the equipment. Thus, a well-developed
tutorial would reduce possible confounding effects of the testing procedure on
speaking performance.
As a live interview was not conducted as part of the current study, participants’
comments about interview formats were based on their various experiences
with that format in the past. Despite inconsistent experiences, as presented in
Table 17, the majority of the respondents mentioned that they felt distressed at
being judged by a human interlocutor during interview. One solution to this
would be to train the interviewer to create a positive relationship with test
takers. Rapport between a human interlocutor and a test taker might reduce
such test anxiety. In addition, there was concern about potential variance across

E. Yu
22
human interviewers. This might be mitigated by the use of a standardized
interview protocol as is standard practice for the ACTFL/ILR Oral Proficiency
Interview and the International English Language Testing System (IELTS). Such
standardization is however potentially at adds with rapport building in the
sense that it might make it difficult for the interviewer to respond
sympathetically to individual interviewees’ anxiety about the face-to-face
encounter.
Limitations
There were four limitations in this study. First, since the participants were
volunteers, the researcher could not ask them to take more than one test.
Accordingly, this study could not adopt counter balanced design, which would
allow for more systematic comparison of the medium of delivery. Furthermore,
any comments on the live interview may be based on inconsistent past
experience from person to person because that format was not adopted for the
current study. In addition, the SPEAK scores were the only available measure
of language ability for this study. Ideally an independent measure of ability
should have been used to ensure that the random assignment of individuals to
different test modes resulted in matched ability groupings. Any group
differences in speaking test performance could then have been more
confidently attributed to bias associated with the medium of test delivery. Third,
as the SPEAK test was used as a placement test for international graduate
students at the research site, participant recruitment was limited to
international graduate students. A study with different groups of people might
yield different research results. Last, because the present study aimed to
investigate the effects of gender and test delivery media, other possible
significant predictors of test takers’ responses were excluded from the model.
Therefore, the findings of this study should be interpreted carefully.
Conclusion
There is a growing awareness of social responsibility among linguists with an
emphasis on the importance of considering how tests are used, as well as how
test results are interpreted (Bachman, 1990; Messick, 1989). Indeed, since a test
may have a significant impact on individuals’ life chances (Shohamy, 1998,
2001), there is urgent need for data-driven research on issues of fairness and
justice in language testing. Responding to this need, the present study
conducted data-driven validation research on technology-mediated speaking
tests with a focus on potential gender effects and their interaction with the test
delivery medium. The present study found that attitude towards a particular
test delivery medium was significantly associated with test results. The two-
way interaction between gender and test delivery medium was also a

Papers in Language Testing and Assessment Vol. 1, 2012 23
significant predictor of test results, suggesting a possible unfair advantage for
males on the tape-based testing mode and vice-versa for females on the
computer-delivered test. Thus, it is important to understand the impact on
performance of a testing modality. A test medium should be selected for a
specific test situation with great caution and an ongoing effort should be made
to control for the possible confounding effects of the test delivery medium.
Acknowledgements
My appreciation goes to many people who joined this journey. Special thanks
go to Catherine Elder and the anonymous reviewers for their constructive
feedback. The dataset used for this manuscript was a part of my unpublished
doctoral dissertation. The preliminary findings of the study were presented at
the Annual Meeting of the American Association for Applied Linguistics and at
the TESOL Convention in 2007.
The author
Eunjyu Yu is an Assistant Professor of English at State University of New York
at Canton. Her research interests include language assessment, computer-
assisted language learning, sociolinguistics, and literacy.
References
Alderson, J. C. (2000). Technology in testing: the present and the future. System,
28, 593-603.
American Council on the Teaching of Foreign Languages. (2009). ACTFL/ILR
Oral Proficiency Interview Tester Training Manual.
American Association of University Women Educational Foundation. (1999).
Gender Gaps: Where Schools Still Fail Our Children. Washington, DC:
AAUW.
American Association of University Women Educational Foundation. (2000).
Tech-savvy: Educating girls in the new computer age. Washington, DC:
AAUW.
Arnett, K. & Haglund, J. (2001). American Council on the Teaching of Foreign
Languages Oral Proficiency Interview. The Canadian Modern Language
Review, 58(2), 312-18.
Bachman, L. (1990). Fundamental considerations in language testing. Oxford:
Oxford University Press.
Bachman, L. (2005). Statistical analyses for language assessment. Cambridge:
Cambridge University Press.

E. Yu
24
Berk, R. (1984). Selecting the index of reliability. In R. A. Berk (Ed.), A guide to
criterion-referenced test construction (pp. 231-266). Baltimore: Johns
Hopkins University Press.
Bernstein, J., Moere, A. & Cheng, J. (2010) Validating automated speaking tests.
Language Testing, 27, 355-377.
Brown, J. D. (2004). For computerized language tests, potential benefits
outweigh problems. Essential Teacher, 1(4), 37-40.
Brown, A. & McNamara, T. (2004). “The Devil Is in the Detail”: Researching
gender issues in language assessment. TESOL Quarterly, 38, 524-538.
Brown, T. (2006). Confirmatory factor analysis for applied research. New York:
Guilford.
Buckingham, A. (1997). Oral language testing: Do the age, status, and gender of the
interlocutor make a difference? Unpublished master’s thesis, University of
Reading, Reading, England.
Burstein, J., Frase, L. T., Ginther, A., & Grant, L. (1996). Technologies for
language assessment. Annual Review of Applied Linguistics, 16, 240-260.
Chapelle, C. (2001). Computer applications in second language acquisition.
Cambridge: Cambridge University Press.
Dean, A. & Voss, D. (1999). Design and analysis of experiments. New York:
Springer.
Educational Testing Service (ETS). (1982). Guide to SPEAK. Princeton, NJ:
Educational Testing Service.
Educational Testing Service (ETS). (1996). TOEFL: Announcing computer-based
testing. NJ: Educational Testing Service.
Elder, C., Iwashita, N. & McNamara, T. (2002). Estimating the difficulty of oral
proficiency tasks: what does the test-taker have to offer? Language Testing,
19, 347-368.
Franco, H., Bratt, H., Rossier, R., Gadde, V. R., Shriberg, E., Abrash, V., &
Precoda, K. (2010). EduSpeak®: A speech recognition and pronunciation
scoring toolkit for computer-aided language learning applications.
Language Testing, 27, 401-418.
Fulcher, G. (2000). The communicative legacy in language testing. System, 28,
483-497.
Gill, R. & Grint, K. (1995). The gender-technology relation: Contemporary theory and
research. Pennsylvania: Taylor & Francis Inc.
Gwet, K. (2001). Handbook of Inter-Rater Reliability: How to Estimate the Level of
Agreement between Two or Multiple Raters. Gaithersburg, Maryland:
STATAXIS.
Hawisher, G. E., & Self, C.L. (Eds.). (2000). Global literacies and the World-Wide

Papers in Language Testing and Assessment Vol. 1, 2012 25
Web. London: Routledge.
Hill, K. (1998). The effect of test-taker characteristics on reactions to and
performance on an oral English proficiency test. In A. Kunnan (Ed.),
Validation in language assessment (pp. 209-229). New Jersey: Lawrence
Erlbaum.
Kenyon, D. M. & Malabonga, V. (2001). Comparing examinee attitudes toward
computer-assisted and other oral proficiency assessments. Language
Learning & Technology, 5(2), 60-83.
Kirsch, I., Jamieson, J., Taylor, C. & Eignor, D. (1998). Computer familiarity
among TOEFL examinees. TOEFL Research Report, 59.
Kunnan, A. (2000). Fairness and justice for all. In A. Kunnan (Ed.), Fairness and
validation in language assessment (pp. 1-14). Cambridge: Cambridge
University Press.
Lumley, T. & O’Sullivan, B. (2005). The effect of test-taker gender, audience and
topic on task performance in tape-mediated assessment of speaking.
Language Testing, 22(4), 415-437.
Messick, S. (1989). Validity. In R.L. Linn (Ed.), Educational measurement (3rd ed.).
(pp. 13-103). New York: Macmillan.
Norris, J. M. (2001). Concerns with computerized adaptive oral proficiency
assessment. Language Learning & Technology, 5(2), 99-105.
O’Loughlin, K. (2002). The impact of gender in oral proficiency testing.
Language Testing, 19(2), 169-192.
Pavlenko, A. (2001). Bilingualism, Gender and ideology. International Journal of
Bilingualism, 5, 117-151.
Pennycook, A. (2001). Critical applied linguistics. New Jersey: Lawrence Erlbaum
Associates.
Roever, C. (2001). Web-based language testing. Language Learning & Technology,
5(2), 84-94.
Scott, M. L. (1986). Student affective reactions to oral language tests. Language
Testing, 3, 99-118.
Shohamy, E. (1982). Affective considerations in language testing. The Modern
Language Journal, 66, 13-17.
Shohamy, E. (1998). Critical language testing and beyond. Studies in Educational
Evaluation, 24(4), 331-345.
Shohamy, E. (2001). The power of tests. England: Pearson Education Limited.
Spolsky, B. (1995). Measured words: the development of objective language
testing. Oxford: Oxford University Press
SPSS Inc. (2007). SPSS for Windows version 15. Chicago, IL: SPSS Inc.
Stemler, S. E. (2004). A comparison of consensus, consistency, and measurement
approaches to estimating interrater reliability. Practical Assessment,
E. Yu
26
Research & Evaluation, 9(4). Retrieved from
http://PAREonline.net/getvn.asp?v=9&n=4.
Taylor, C., Jamieson, J., Eignor, D., & Kirsch, I. (1998). The relationship
computer familiarity and performance on computer-based TOEFL test
tasks. TOEFL Research Report, 61.
Warschauer, M. (1999). Electronic literacies: language, culture, and power in online
education. NJ: Lawrence Erlbaum Associates.
Xi, X. (2010) Automated scoring and feedback systems: Where are we and
where are we heading? Language Testing, 27, 291-300.

Papers in Language Testing and Assessment Vol. 1, 2012 27
Appendix A
THE SPEAK FORMAT AND SECTION DESCRIPTION
Format of the Test
The speaking proficiency test included in SPEAK consists of seven
sections, each requiring a different speaking activity. The first section is an
unscored “warm-up” in which the examinee responds orally to a few brief
biographical questions provided on the test tape.
In the second section, the examinee is allowed time for preliminary silent
reading of a passage of about 125 words and then is instructed to read the
passage aloud. Scoring is based on pronunciation and overall clarity of speech.
In the third section, the examinee is asked to complete a series of 10
partial sentences in a way that conveys meaning and is grammatically correct.
The fourth section of the test consists of six line drawings that tell a
continuous story. After studying the drawings briefly, the examinee is asked to
tell the story that is depicted, using past tense narration.
In the fifth section, the examinee looks at a single line drawing and
answers several spoken questions about the picture.
The sixth section consists of a series of spoken questions intended to
elicit relatively free and somewhat more lengthy responses. Questions requiring
both straightforward descriptions of common objects and fairly open-ended
expressions of opinion are included. The linguistic quality and adequacy of
communication, not the factual content of the responses, are at issue in scoring.
In the seventh and final section, the examinee sees a printed schedule,
such as the outline for a course or a conference, and is asked to describe the
schedule aloud, as though informing a group of listeners.
Scores. Each examinee receives four different scores: an overall
comprehensibility score and scores for each of three diagnostic areas—
pronunciation, grammar, and fluency. Overall comprehensibility scores are
based on a scale ranging from 0 to 300; each of the three diagnostic area scores
is based on a scale ranging from 0.0 to 3.0.
Source: Educational Testing Service. (1982). Guide to SPEAK. Princeton, NJ:
Educational Testing Service, p. 7.

E. Yu
28
Appendix B
The SPEAK Scoring Key
Overall Comprehensibility
0 - 90 Overall comprehensibility too low in even the simplest type of
speech.
100 - 140 Generally not comprehensible because of frequent pauses and /or
rephrasing, pronunciation errors, limited grasp of vocabulary, or
lack of grammatical control.
150 - 190 Generally comprehensible but with frequent errors in
pronunciation, grammar, choice of vocabulary items, and with
some pauses or rephrasing.
200 - 240 Generally comprehensible with some errors in pronunciation,
grammar, choice of vocabulary items, or with pauses or occasional
rephrasing.
250 - 300 Completely comprehensible in normal speech, with occasional
grammatical or pronunciation errors in very colloquial phrases.
Subcategories:
Pronunciation
0 : Frequent phonemic errors and foreign stress and intonation
patterns that cause the speaker to be unintelligible.
1 : Frequent phonemic errors and foreign stress and intonation
patterns that cause the speaker to be occasionally unintelligible.
2 : Some consistent phonemic errors and foreign stress and intonation
patterns, but speaker is intelligible.
3 : Occasional nonnative pronunciation errors, but speaker is always
intelligible.

Papers in Language Testing and Assessment Vol. 1, 2012 29
Grammar
0 : Virtually no grammatical or syntactical control except in simple
stock phrases.
1 : Some control of basic grammatical construction but with major
and /or repeated errors that interfere with intelligibility.
2 : Generally good control in all constructions with grammatical
errors that do not interfere with overall intelligibility.
3 : Sporadic minor grammatical errors that could be made
inadvertently by native speakers.
Fluency
0 : Speech is so halting and fragmentary or has such a nonnative flow
that intelligibility is virtually impossible.
1 : Numerous nonnative pauses and/or a nonnative flow that
interferes with intelligibility.
2 : Some nonnative pauses but with a more nearly native flow so that
the pauses do not interfere with intelligibility.
3 : Speech is smooth and effortless, closely approximating that of a
native speaker.
Comprehensibility
0 : Overall comprehensibility too low in even the simplest type of
speech.
1 : Generally not comprehensible because of frequent pauses and /or
rephrasing, pronunciation errors, limited grasp of vocabulary, or
lack of grammatical control.
2 : Comprehensible with errors in pronunciation, grammar, or choice
of vocabulary items, or infrequent pauses or rephrasing.
3 : Completely comprehensible in normal speech with occasional
grammatical or pronunciation errors.
Source: Educational Testing Service. (1982). Guide to SPEAK. Princeton, NJ:
Educational Testing Service, pp. 8 & 16.

E. Yu
30
Appendix C
ATTITUDE QUESTIONNAIRE
Date of participation: _______________ Code:
Part I. Your Attitude towards a Test Delivery Medium
Please answer ALL questions by circling the response that best describes your
opinion. Do NOT skip any items.
Str
on
gly
Dis
agre
e
Dis
agre
e
Sli
gh
tly
Dis
agre
e
Sli
gh
tly
Ag
ree
Ag
ree
Str
on
gly
Ag
ree
1. I was comfortable taking a spoken English test on a
computer/using an audiotape recorder and printed
materials. 1 2 3 4 5 6
2. The test medium fairly delivered test items. 1 2 3 4 5 6
3. The test medium allowed me to have enough time to
prepare my answers.
1 2 3 4 5 6
4. The test medium allowed me to have enough time to give
my answers.
1 2 3 4 5 6
5. The test medium delivered the directions clearly. 1 2 3 4 5 6
6. Visual cues of the test medium were helpful. 1 2 3 4 5 6
7. The test medium was an appropriate tool for measuring
my current spoken English ability. 1 2 3 4 5 6
8. Which type of an oral proficiency test do you prefer to take? A live face-to-face
interview, a computerized test, or an audio-taped test? Please choose only one and
specify the reasons for your choice.
Part II. Your Background Information
9. Year of birth: _________________
10. Academic major: ______________________________
11. Gender (circle one): Female Male
12. Native language: ______________________________
13. Home country: _______________________________
-- Thank you for your participation --