title: effectiveness of replacing catalytic converters in ... … · title: effectiveness of...
TRANSCRIPT

Title: Effectiveness of replacing catalytic converters in LPG-fueled vehicles in Hong Kong
Author(s): X. P. Lyu et al. MS No.: acp-2015-790
Responses to comments from Anonymous Referee #3
General:
The authors currently consider only the importance of this action (replacing catalytic converters)
for air quality in Hong Kong. It would be valuable, and of wider interest, to include some
discussion on the implications of these results for other regions.
Thanks for the suggestion. The implication of this study for other regions was briefly illustrated:
The findings are of great help to future formulation and implementation of control strategies on
vehicle emissions in Hong Kong, and could be extended to other regions in China and around the
world.
For details, please refer to lines 33-35, page 2 in the revised manuscript.
Past studies have shown that a small number of cars are responsible for a large part of total
mobile emissions. Is there any evidence that the cars in Hong Kong with replaced catalytic
converters are typical (or not) of the entire fleet?
Many thanks for the comment. Table S4 in the Supplementary material provides the detailed
information of registered vehicle number in Hong Kong. Indeed, the LPG-fueled vehicles
accounted for only a small part of the registered vehicles (~3.1%). However, the source
apportionment results in previous studies and this work all indicated the high contribution of
LPG-fueled vehicle exhaust to ambient VOCs. In this study, the LPG related VOCs accounted
for 56.5±2.7 % and 46.0±3.1% of the total VOCs, and 18.7±1.2% and 15.1±1.1% of the total
OH-reactivity of VOCs at MK before and during the program, respectively. That is, the small
number of LPG-fueled vehicles caused significant air pollution in Hong Kong. It is also the
motivation of this LPG program.
On the other hand, within the LPG fleet, the catalytic converters in 80% of taxis and 60% of the
public light buses needed replacement. The replacement of the catalytic converters in these
vehicles significantly reduced emissions of propane, propene, i-butane, n-butane and NO in

LPG-fueled vehicle exhausts by 40.8±0.1%, 45.7±0.2%, 35.7±0.1%, 47.8±0.1% and 88.6±0.7%,
respectively.
For details, please refer to lines 176-179, page 7 and lines 512-529, page 23 in the revised
manuscript and Table S4 in the supplementary material.
Is it possible to estimate the expected reduction from a “bottom-up” approach based on the
known number of cars with new catalytic converters and then compare this with what was
observed in atmospheric concentrations for this study?
Thanks for the good suggestion. We understood that the bottom-up approach is often used to
calculate the total amount of VOCs or NOx reductions (in unit of tons). Unfortunately, we do not
have all data available for the estimation. We may do this in the future.
Specific:
Page 35940, line 24: replace “matters” with “matter”
Accepted with thanks. Please refer to line 39, page 2 in the revised manuscript.
Page 35942, line 21: replace “initialized” with “initiated”
Accepted with thanks. Please refer to line 109, page 4 in the revised manuscript.
Page 35943, line 24: what is meant by “great”? Do you mean “entire”?
Sorry for the typo. The “great Pearl River Delta (PRD)” was revised as “greater Pearl River
Delta (PRD)”.
For details, please refer to line 123, page 5 in the revised manuscript.
Page 35943, line 24: Is HT representative of marine background or continental background?
i.e., does the air tend to come from the ocean or from land?
Thanks for the question. HT is located at the tip of southeastern Hong Kong. It receives air
masses from South China Sea in summer and from continental areas including Hong Kong and
Pearl River Delta in autumn/winter. Therefore, air masses at HT are the mix of marine and

continental air. Whether it is representative of marine background or continental background
depends on seasonality. In the revised manuscript, more introductions were provided about this
site.
HT is a remote site at the tip of southeastern Hong Kong, ~ 25 km from the urban core. It
receives air masses from SCS in summer and from continental areas including Hong Kong and
PRD in autumn/winter. Therefore, air masses at HT are a mix of marine and continental
background air. Indeed, HT has been serving as a background site and is extensively used for air
quality studies in Hong Kong (Wang et al., 2009; Ho et al., 2006; Lee et al., 2002).
For details, please refer to lines 138-142, page 5 in the revised manuscript.
Section 2.2.2: Given the known challenges in making VOC measurements, the stated accuracies
seem very high. The approach used to determine the accuracy of these measurements should be
described in more detail and include in the assessment not just of the stated accuracy of the
calibration standard. Much of the actual uncertainty is due to interferences, peak integrations, etc.
VOC intercomparisons published in the scientific literature typically indicate large differences
(>30%) in the values of VOC reported by different laboratories. The comparison between the
propane data and those from UCI reported here are quite good but are still are beyond the stated
accuracy (i.e. they differ by 14% but the accuracy is 10%). What about more reactive VOC?
Thanks for the comment. The detailed description about the accuracy of the measurements and
the comparison of more reactive VOCs with UCI was provided.
The accuracy and precision of VOC measurements were 1.0-10% and 2.5-20%, respectively. The
accuracy was based on weekly span checks, monthly calibration and annual auto-linearization
using the National Physical Laboratory (NPL) span gas. The precision was based on quarterly
precision check results (the 95% probability limits for the integrated precision based on weekly
precision check results of the latest 3 months). Moreover, the online-measurements of VOCs
were regularly compared with whole-air canister samples collected and analyzed by University
of California at Irvine (UCI). Good agreements were identified for the alkanes (e.g., R2
= 0.95
and 0.85, slope = 1.14 and 0.97 for propane and butanes, respectively), while the agreements for
the more reactive alkenes and aromatics were also reasonable (e.g., R2
= 0.64 and 0.94, slope =
1.34 and 0.86 for propene and toluene, respectively).

For details, please refer to lines 198-208, page 8 in the revised manuscript.
page 35947, statements about fresh emissions in line 5 and 8 are repetitive
Thanks for the comment. The sub-conclusions drawn from the VOC ratios with and without the
backgrounds were integrated.
The ratios of toluene/benzene and xylenes/ethylbenzene at MK were significantly higher than
those at the other three sites (p<0.05). Furthermore, these ratios at MK were even higher after the
background values were deducted. The results suggested that air masses at MK were dominated
by fresh emissions.
For details, please refer to lines 242-245, page 9 in the revised manuscript.
page 35947, line 19: reword to “wind speeds were lower than 2.0 m s-1 more than 95% of the
time”
Accepted with thanks. Please refer to lines 255-256, page 10 in the revised manuscript.
page 35949, line 4: replace “physical” with “transport”
Accepted with thanks. Please refer to line 291, page 11 in the revised manuscript.
section 3.1.1: Some indication of the synoptic scale meteorology in 2013 and 2014 should be
given to demonstrate whether any differences in meteorology might explain any of the observed
change in VOC concentrations.
Thanks for the good suggestion. The influences of the synoptic scale meteorology on the
observed change in the concentrations of LPG-related VOCs and NOx were discussed.
Table 3 shows the mixing ratios of the primarily emitted LPG-related VOCs and NOx before and
during the program. The LPG-related VOCs and NOx were reduced significantly from “before”
to “during the program” (p<0.05). To investigate the meteorological influences on these
reductions, we looked into the average geopotential height (HGT) and wind field on 1000 hPa
for East Asia for the periods of “matched” and “during the program”, as shown in Figure S1 in
the Supplementary material (the “matched” period (October 2012-May 2013) was defined as the
same time span as that “during the program”, but in different years). Noticeably, the
meteorological conditions were fairly similar between the two periods, i.e., the pressure decline
(indicated by the decrease of HGT) from northern China to SCS led to the prevailing
northeasterly winds in Hong Kong, and the differences of HGT and wind speed between the two
periods for Hong Kong were only 0-2 gpm and less than 1 m/s, respectively. Ground monitoring
data also indicated insignificant differences of temperature (“matched”: 21.9±0.5 °C; “during”:
21.2±0.7 °C) between the two periods (p>0.05). However, the mixing ratios of LPG-related
VOCs and NOx during the “matched” period were comparable to those “before” the program,
and absolutely higher than those “during” the program (p<0.05) (see Table 3). Given the similar
meteorological conditions between the “matched” period and “during the program”, the
significant decreases of LPG-related VOCs and NOx were caused by the interventional program,
rather than meteorological variations.
For details, please refer to lines 346-364, pages 14-15, Table 3 and Figure S1 in the revised
manuscript.
Page 35955, lines 1-4: The first two sentences indicate that CO should be low for diesel vehicles.
This contrasts with the following sentence which suggests that CO should be high for diesel
vehicles. I realize that this is discussed in the rest of the paragraph but still the expectation (did
you expect CO to be low or high) is unclear here and should be clarified
Thanks for the comment. We have re-done source apportionment simulation using the observed
ambient concentrations, rather than the concentrations with the backgrounds being deducted in
the original manuscript. Therefore, the source apportionment results were totally changed, which
solved this problem.
For details, please refer to lines 484-506, pages 21-22 and Figure 6 in the revised manuscript.
Page 35955, line 14: what is a “goods” vehicle?
Thanks for the comment. “Goods vehicles” means vehicles used to deliver the goods. However,
due to the substantial changes of this part, it was only used in the Supplementary material of the
revised manuscript.
Page 35956, line 25: was the difference between predicted and observed similar to what the
background values are? This information should be provided here.

Thanks for the comment. Since we replaced the concentrations with the backgrounds being
deducted by the observed ambient concentrations for model simulations according to the
comments of reviewer #2, the differences between the simulated and observed O3 in the revised
manuscript represented the contribution of regional transport. We added the following in the
revised manuscript:
Bearing in mind the uncertainty of the model, the good agreement between the simulated and
observed O3 implied a minor regional contribution at this roadside site.
For details, please refer to lines 564-566, page 25 in the revised manuscript.
Page 35958, line25: How can OH be higher than HO2? This is not realistic and indicates a
problem in the model simulation.
Thanks for the valuable comment. The question was also raised by the other reviewer. The
causes of the problem and revised results of the model simulation were provided in the answer to
question 6 of reviewer #2.
For details, please refer to the answer to question 6 of reviewer #2.
For the revised results and discussion, please refer to lines 595-620, pages 27-28 and Figure 9 in
the revised manuscript.
Page 35962: How does this compare/contrast with similar studies at roadsides in other cities?
Thanks for the comment. To our best knowledge, this is the first attempt to conduct O3-VOCs-
NOx sensitivity analysis at roadside site.
Page 35963, line 5: replace “that” with “the”
Accepted with thanks.
Figures 3 through 12: Increase the size of the font- it is too small to read
Thanks for the suggestion. The fonts in the corresponding figures were increased.

1
Effectiveness of replacing catalytic converters in LPG-fueled vehicles in 1
Hong Kong 2
X.P. Lyu 1, H. Guo
1*, I.J. Simpson
2, S. Meinardi
2, P.K.K. Louie
3, Z.H. Ling
4, Y. Wang
1, M. 3
Liu 1, C.W.Y. Luk
3, N. Wang
5 D.R. Blake
2 4
1 Department of Civil and Environmental Engineering, The Hong Kong Polytechnic University, 5
Hong Kong 6
2 Department of Chemistry, University of California at Irvine, CA, USA 7
3 Environmental Protection Department, Hong Kong Special Administrative Region, Hong Kong 8
4 School of Atmospheric Sciences, Sun Yat-sen University, Guangzhou, China 9
5 Guangdong Provincial Key Laboratory of Regional Numerical Weather Prediction, Institute of 10
Tropical and Marine Meteorology, Guangzhou, China 11
*Corresponding author. Tel: +852 3400 3962; Fax: +852 2334 6389; Email: 12
14
Abstract 15
Many taxis and public buses are powered by liquefied petroleum gas (LPG) in Hong Kong. With 16
more vehicles using LPG, they have become the major contributor to ambient volatile organic 17
compounds (VOCs) in Hong Kong. An intervention program aimed to reduce the emissions of 18
VOCs and nitrogen oxides (NOx) from LPG-fueled vehicles was implemented by the Hong Kong 19
Government in September 2013. Long-term real-time measurements indicated that the program 20
was remarkably effective in reducing LPG-related VOCs, NOx and nitric oxide (NO) in the 21
atmosphere. Receptor modeling results further revealed that propane, propene, i-butane, n-butane 22
and NO in LPG-fueled vehicle exhaust emissions decreased by 40.8±0.1%, 45.7±0.2%, 23
35.7±0.1%, 47.8±0.1% and 88.6±0.7%, respectively, during the implementation of the program. 24
In contrast, despite the reduction of VOCs and NOx, O3 following the program increased by 0.40 25
± 0.03 ppbv (~5.6%). The LPG-fueled vehicle exhaust was generally destructive to OH and HO2. 26
However, the destruction effect weakened for OH and it even turned to positive contribution to 27

2
HO2 during the program. These changes led to the increases of OH, HO2 and HO2/OH ratio, 28
which might explain the positive O3 increment. Analysis of O3-VOCs-NOx sensitivity in ambient 29
air indicated VOC-limited regimes in the O3 formation before and during the program. Moreover, 30
a maximum reduction percentage of NOx (i.e., 69%) and the lowest reduction ratio of VOCs/NOx 31
(i.e., 1.1) in LPG-fueled vehicle exhaust were determined to give a zero O3 increment. The 32
findings are of great help to future formulation and implementation of control strategies on 33
vehicle emissions in Hong Kong, and could be extended to other regions in China and around the 34
world. 35
Key words: LPG; Catalytic converter; VOCs; NOx, Ozone production; PBM-MCM 36
37
1 Introduction 38
Vehicular exhaust is a major source of air pollutants such as particulate matter (PM), volatile 39
organic compounds (VOCs) and trace gases including carbon monoxide (CO), carbon dioxide 40
(CO2), sulfur dioxide (SO2) and nitrogen oxides (NOx) (Xie et al., 2003; Barletta et al., 2002; 41
Ruellan and Cachier, 2001). Apart from primary pollutants, secondary pollutants formed from 42
vehicular exhausts, i.e., ozone (O3) and secondary organic aerosols (SOA) are of high concern 43
due to their detrimental effects on atmospheric environment and human health (Ciccone et al., 44
1998). 45
Fuel substitution is a universal and effective method to constrain vehicular emissions. As 46
relatively clean energy, liquefied petroleum gas (LPG) has been widely used either alone or 47
combined with petrol and diesel (Lau et al., 2011; Lai et al., 2009; Gamas et al., 1999), for the 48
benefit of emission reduction of CO2, fine PMs and VOCs (Chikhi et al., 2014; Myung et al., 49
2012). However, one must bear in mind that maintenance status, conversion method, 50
composition and driving speed all influence the emissions of air pollutants (Schifter et al., 2000; 51
Gamas et al., 1999). Therefore, regular on-site measurements are necessary to monitor traffic 52
emission profiles and rates. Although LPG is a relatively clean fuel, the emission of LPG-related 53
VOCs (i.e., propane, propene, and n- and i-butanes) from evaporation and incomplete 54
combustion cannot be neglected. For example, source apportionment analysis indicated that LPG 55
accounted for a considerable percentage of ambient VOCs in Guangzhou (8 - 16%) (Liu et al., 56

3
2008) and Hong Kong (32.6 ± 5.8%) (Ou et al., 2015). Furthermore, the LPG-related VOCs can 57
contribute to O3 formation and cause photochemical smog. Blake and Rowland (1995) 58
emphasized the importance of LPG leakage in OH reactivity and O3 formation in urban Mexico. 59
Farmer et al. (2011) reported that the increase of LPG-related VOCs led to O3 increments even 60
though the total VOCs (TVOCs) were reduced, as the peroxyl radicals (RO2) generated from 61
VOCs with low vapor pressure had a higher branching ratio leading to NO2 formation from NO, 62
rather than reserving nitrogen in the form of organic nitrates. On the other hand, NO emitted 63
from LPG combustion may titrate O3. Therefore, it still remains undecided whether the LPG 64
usage is contributive or destructive to O3 formation, especially in Hong Kong. 65
Hong Kong has experienced rapid development during the past decades, and increasingly suffers 66
from crowded traffic and population, with nearly 0.7 million vehicles running on the total road 67
length of 2.1 × 10³ km and 7.2 million people living on the territory of 1.1×10
3 km
2. The road 68
usage rate in Hong Kong is among the highest in the world, transporting approximately 1.2 69
million passengers per day. As such, traffic emissions significantly influence the air quality in 70
Hong Kong. Apart from local emissions, air quality in Hong Kong is also affected by regional 71
transport. In autumn and winter, prevailing northerly and northeasterly winds bring 72
anthropogenic emissions from mainland China to Hong Kong, enhancing local pollution burden. 73
In summer, clean oceanic air masses dilute the levels of air pollutants under the influence of 74
southerly winds (Ling et al., 2013; Guo et al., 2009, Wang et al., 2005; So and Wang, 2003; 75
Chan and Chan, 2000). Ling et al. (2013) quantified the contribution of regional transport as 0-76
61% for summer O3 and 0-56% for autumn O3 on high O3 days in Hong Kong. Guo et al. (2006) 77
found that over 45% of VOC samples collected from August 2001 to December 2002 at Tai O, 78
Hong Kong, were influenced by regional transport from inland China. Based on numerical 79
simulations, Wang et al. (2006) quantified regional contributions of 40-90% to O3 formation in 80
Hong Kong, and Huang et al. (2006) indicated that the regional contribution was <50% when a 81
trough was over the South China Sea (SCS), and it increased to >50% in the presence of an 82
anticyclone over mainland China and/or a tropical cyclone over SCS. Furthermore, Wang et al. 83
(2006) revealed that the regional contribution was lower during daytime than that at night, while 84
Lam et al. (2006) found that the contribution decreased from >50% during an O3 episode to 30-85
50% after the episode. In addition, Jiang et al. (2008) reported that the contribution of horizontal 86
transport to surface O3 in Hong Kong was negligible during a typhoon-induced O3 episode. 87

4
However, all the studies focused on the regional contribution at non-roadside sites, and the O3 88
chemistry at roadside sites in Hong Kong was seldom reported. Given high NOx levels, tall 89
buildings and low wind speeds along the main roads in Hong Kong, it is expected that the 90
regional impact on air pollutants in roadside environment is relatively minor, especially during 91
daytime hours on non-O3 episode days. 92
To improve the air quality, the Hong Kong Environmental Protection Department (HKEPD) 93
launched a series of programs including a stepwise LPG replacement program for taxis and light 94
buses from 1997. By the end of 2010, >99% of the registered taxis (i.e., 17,950 vehicles) and 95
51% of the registered public and private light buses (i.e., 3,280 vehicles) were powered by LPG 96
(HKCSD, 2010). Due to the usage of LPG as vehicle fuel, the ambient VOC profile in Hong 97
Kong changed substantially with the most abundant species switching from toluene to propane 98
and n/i-butanes (Ou et al., 2015; Guo et al., 2007; Ho et al., 2004). In addition, studies 99
consistently confirmed an increased contribution of LPG-fueled vehicle emissions to ambient 100
VOC levels, which was 11% at an urban site in 2001 (Guo et al., 2004), 15% at a suburban site 101
during 2002-2003 (Guo et al., 2007), and 26.9 ± 0.6% and 40.8 ± 0.8% at an urban site during 102
2002-2003 and 2006-2007, respectively (Lau et al., 2010). Moreover, O3 has been experiencing 103
an increasing trend in Hong Kong over the last two decades (Wang et al., 2009; Guo et al., 2009). 104
As O3 formation was generally VOC-limited in Hong Kong (Cheng et al., 2010; Zhang et al., 105
2007), the contribution of LPG-fueled vehicle emissions to O3 was not negligible, in view of the 106
dominance of propane and n/i-butanes in ambient air and the high contribution of LPG-fueled 107
vehicle emissions to ambient VOC levels. As such, an intervention program aimed to reduce 108
VOCs and NOx emitted by LPG-fueled vehicles was initiated in September 2013. This subsidy 109
program promoted the replacement of aging catalytic converters in LPG-fueled vehicles, and the 110
catalytic converters in ~75% of LPG-fueled vehicles were replaced by the end of May 2015. 111
Although laboratory studies identified a high removal efficiency of the new catalytic converter 112
on VOCs and NOx emissions (Table S1 in the Supplementary material), the impact of the 113
program on roadside air quality, which is more complex, required investigation. 114
In this study, the effectiveness of the intervention program on the reduction of LPG-related 115
VOCs and NOx, on O3 production, and on the photochemical reactivity driving the O3 formation 116
was evaluated. Furthermore, the sensitivity of O3 variation (i.e., the difference of net O3 117

5
production by LPG before and during the program) relative to the reduction percentage of LPG-118
related VOCs and NOx was studied, and subsequently a maximum NOx reduction percentage and 119
a reasonable reduction ratio of VOCs/NOx were proposed for achieving the best O3 reduction. 120
2 Methodology 121
2.1 Site description 122
Hong Kong, located on the coast of the South China Sea (SCS), constitutes the greater Pearl 123
River Delta (PRD) together with Macao and nine mainland cities in Guangdong Province (i.e., 124
Guangzhou, Shenzhen, Zhuhai, Foshan, Dongguan, Zhongshan, Huizhou, Jiangmen and 125
Zhaoqing). Hong Kong has a typical coastal hilly terrain with large water area (~60%) and large 126
vegetation coverage (~70% of land area). A marine subtropical monsoon climate dominates, and 127
the prevailing winds are north and northeast in winter, east in spring and autumn, and south and 128
southwest in summer. 129
This study involves three roadside sites (Mong Kok (MK, 22.32° N, 114.17° E), Causeway Bay 130
(CWB, 22.28° N, 114.19° E) and Central (22.28° N, 114.16° E)), a general site (Tap Mun (TM, 131
22.47° N, 114.36° E)), and a background site (Hok Tsui (HT, 22.22° N, 114.25° E)). MK, CWB 132
and Central are in mixed residential/commercial areas with heavy traffic and surrounded by 133
dense tall buildings. TM is a rural site surrounded by country parks, and is upwind of Hong 134
Kong in autumn/winter seasons. These four sites have Air Quality Monitoring Stations deployed 135
by Hong Kong Environmental Protection Department (HKEPD) (more details are provided at 136
http://www.aqhi.gov.hk/en/monitoring-network/air-quality-monitoring-stations9c57.html 137
/stationid=81). HT is a remote site at the tip of southeastern Hong Kong, ~ 25 km from the urban 138
core. It receives air masses from SCS in summer and from continental areas including Hong 139
Kong and PRD in autumn/winter. Therefore, air masses at HT are a mix of marine and 140
continental background air. Indeed, HT has been serving as a background site and is extensively 141
used for air quality studies in Hong Kong (Wang et al., 2009; Ho et al., 2006; Lee et al., 2002). 142
Figure 1 shows the geographical location of the sampling sites. 143

6
144
Figure 1 Geographical location of the sampling sites. The yellow line represents the border 145
between Hong Kong and mainland China. 146
147
2.2 Continuous measurements 148
2.2.1 Trace gases 149
Five trace gases (i.e., CO, SO2, NO, NO2 and O3) were continuously measured at all the sites 150
from 2011 to 2014. The analyzers were deployed in the air quality monitoring stations with a 151
height of 3.0 m (MK and CWB), 4.5 m (Central), 11.0 m (TM) and 20.0 m (HT) above the 152
ground level. Air samples were drawn through a perfluoroalkoxy (PFA) Teflon tube with outside 153
diameter (OD) of 12.7 mm and inside diameter (ID) of 9.6 mm. The inlet of the tube was 154
approximately 0.5 m above the rooftop of the monitoring station, and the outlet was connected to 155
a PFA manifold with a bypass pump drawing air into the analyzers at a rate of 5 L/min. Details 156
about the analyzers are provided elsewhere (HKEPD, 2014; So and Wang, 2003). 157
Briefly, CO was analyzed using the method of non-dispersive infra-red absorption with gas filter 158
correlation (TECO 48C/API 300); SO2 was detected with UV fluorescence analyzers (TECO 159
43A/API 100E/TECO 43I); NO-NO2-NOx were measured by chemiluminescence technique (API 160
200A); and O3 was monitored with the UV absorption method (API 400/API 400A). The 161
detection limits for CO, SO2, NO, NO2 and O3 were 50.0, 1.0, 0.5, 0.5 and 2.0 ppbv, respectively. 162

7
2.2.2 VOCs 163
Thirty C2-C10 non-methane hydrocarbons (NMHCs) including eleven alkanes, ten alkenes and 164
nine aromatics were continuously measured at MK and HT from 2011 to 2014. The VOC 165
samples were collected and analyzed every 30 minutes with an online analytical system (Syntech 166
Spectra GC 955, Series 600/800, the Netherlands). The data were averaged into hourly values. 167
The detection limits varied by VOC species and were in the range of 0.002-0.787 ppbv. 168
Table S2 summarizes average mixing ratios of the main VOCs and trace gases, and their OH-169
reactivity at the roadside (MK) and background site (HT) before (October 2012-September 2013) 170
and during the program (October 2013-May 2014) in Hong Kong. The much higher OH-171
reactivity at MK (“before”: 86.6±6.0 s-1
; “during”: 77.9±6.1 s-1
) than at HT (“before”: 5.0±0.3 s-1
; 172
“during”: 4.9±0.1 s-1
) meant that the OH lifetime was much shorter at MK (~0.01 s) than at HT 173
(0.2 s), and even shorter than that at an urban site in New York (0.05 s) (Ren et al., 2003), 174
indicating that reactive species were extremely abundant in the roadside environment of Hong 175
Kong. The LPG-related VOCs (i.e., propane and n/i-butanes) contributed 56.5±2.7 % and 176
46.0±3.1% to total VOCs, and 18.7±1.2% and 15.1±1.1% to the total OH-reactivity of VOCs at 177
MK, before and during the program, respectively. These fractional contributions suggest the 178
importance of LPG-related VOCs in the budgets of VOCs and O3 in Hong Kong. Consistent with 179
the decreases of fractional contributions once the program started, the mixing ratios (29.4±3.3 180
and 21.0±2.2 ppbv for before and during the program, respectively) and OH-reactivity 181
(1.12±0.04 and 0.79±0.02 s-1
before and during the program, respectively) of LPG-related VOCs 182
significantly declined at MK (p<0.05), while at HT their mixing ratios increased from 1.5±0.1 183
ppbv to 1.9±0.04 ppbv, and the OH-reactivity increased from 0.06±0.004 s-1
to 0.07±0.003 s-1
. 184
The minor variation of background LPG-related VOCs relative to the decreases at MK (4.8% in 185
mixing ratios and 3.0% in OH-reactivity of VOCs) indicated that the influences of the 186
background concentrations on the variations of LPG-related VOCs and O3 at MK were minimal 187
and can be neglected. 188
2.2.3 Quality assurance and control (QA/QC) 189
To guarantee the quality of the data acquired from the online monitoring systems, the 190
instruments and QA/QC procedures for trace gases measurements were identical to those in the 191
US air quality monitoring program (http://epic.epd.gov.hk/ca/uid/airdata). The measurements 192

8
have been accredited by the Hong Kong Laboratory Accreditation Scheme (HOKLAS). All the 193
instruments were regularly calibrated, tested and audited by standards with known traceability 194
for trace gases measurements. According to HOKLAS criteria, a quality system was established 195
to control the accuracy and precision within the limits of ±15% and ±20%, respectively (HKEPD, 196
2014). For VOC analysis, a built-in computerized program, including auto-linearization, auto-197
calibration and calibration with span gas, was adopted to control the quality. The accuracy and 198
precision of VOC measurements were 1.0-10% and 2.5-20%, respectively. The accuracy was 199
based on weekly span checks, monthly calibration and annual auto-linearization using the 200
National Physical Laboratory (NPL) span gas. The precision was based on quarterly precision 201
check results (the 95% probability limits for the integrated precision based on weekly precision 202
check results of the latest 3 months). Moreover, the online-measurements of VOCs were 203
regularly compared with whole-air canister samples collected and analyzed by University of 204
California at Irvine (UCI). Good agreements were identified for the alkanes (e.g., R2 = 0.95 and 205
0.85, slope = 1.14 and 0.97 for propane and butanes, respectively), while the agreements for the 206
more reactive alkenes and aromatics were also reasonable (e.g., R2 = 0.64 and 0.94, slope = 1.34 207
and 0.86 for propene and toluene, respectively). 208
209
2.3 Theoretical calculation and model description 210
2.3.1 Primary emissions of VOCs and NOx 211
The measured concentrations of VOCs and trace gases were composed of the backgrounds, 212
primary emissions and secondary formation (applicable to O3 and NO2). To obtain the 213
concentrations of LPG-related VOCs and NOx emitted from primary sources at the roadside sites, 214
the background concentrations and the concentrations elevated by the secondary formation (if 215
applicable) in this study were excluded using equations (1) - (5) (Takekawa et al., 2013): 216
(Equation (1)) 217
(Equation (2)) 218
(Equation (3)) 219
9
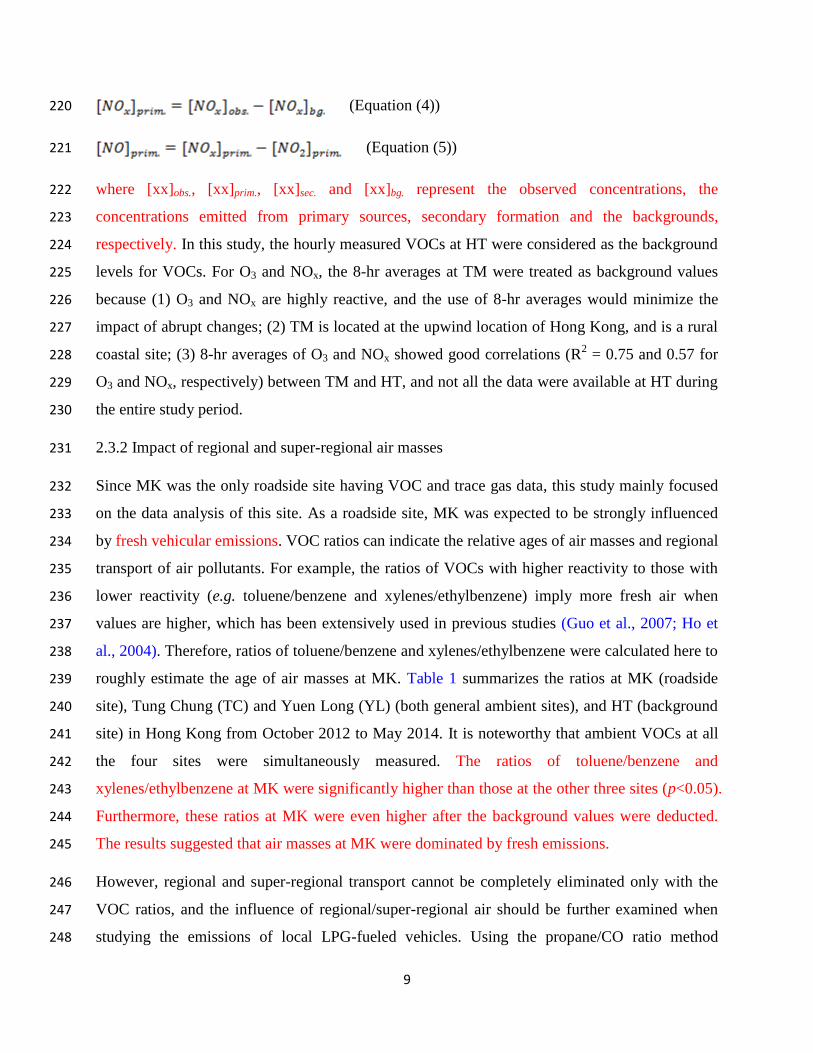
(Equation (4)) 220
(Equation (5)) 221
where [xx]obs., [xx]prim., [xx]sec. and [xx]bg. represent the observed concentrations, the 222
concentrations emitted from primary sources, secondary formation and the backgrounds, 223
respectively. In this study, the hourly measured VOCs at HT were considered as the background 224
levels for VOCs. For O3 and NOx, the 8-hr averages at TM were treated as background values 225
because (1) O3 and NOx are highly reactive, and the use of 8-hr averages would minimize the 226
impact of abrupt changes; (2) TM is located at the upwind location of Hong Kong, and is a rural 227
coastal site; (3) 8-hr averages of O3 and NOx showed good correlations (R2 = 0.75 and 0.57 for 228
O3 and NOx, respectively) between TM and HT, and not all the data were available at HT during 229
the entire study period. 230
2.3.2 Impact of regional and super-regional air masses 231
Since MK was the only roadside site having VOC and trace gas data, this study mainly focused 232
on the data analysis of this site. As a roadside site, MK was expected to be strongly influenced 233
by fresh vehicular emissions. VOC ratios can indicate the relative ages of air masses and regional 234
transport of air pollutants. For example, the ratios of VOCs with higher reactivity to those with 235
lower reactivity (e.g. toluene/benzene and xylenes/ethylbenzene) imply more fresh air when 236
values are higher, which has been extensively used in previous studies (Guo et al., 2007; Ho et 237
al., 2004). Therefore, ratios of toluene/benzene and xylenes/ethylbenzene were calculated here to 238
roughly estimate the age of air masses at MK. Table 1 summarizes the ratios at MK (roadside 239
site), Tung Chung (TC) and Yuen Long (YL) (both general ambient sites), and HT (background 240
site) in Hong Kong from October 2012 to May 2014. It is noteworthy that ambient VOCs at all 241
the four sites were simultaneously measured. The ratios of toluene/benzene and 242
xylenes/ethylbenzene at MK were significantly higher than those at the other three sites (p<0.05). 243
Furthermore, these ratios at MK were even higher after the background values were deducted. 244
The results suggested that air masses at MK were dominated by fresh emissions. 245
However, regional and super-regional transport cannot be completely eliminated only with the 246
VOC ratios, and the influence of regional/super-regional air should be further examined when 247
studying the emissions of local LPG-fueled vehicles. Using the propane/CO ratio method 248

10
proposed by Guo et al. (2006), i.e., the ratio range of 5.0-300 pptv/ppbv for air masses in Hong 249
Kong, the influence of regional/super-regional air masses on local air was evaluated. Figure 2 250
shows the ratios of propane/CO at MK from 2011-2014. The propane/CO ratios of ~96% air 251
masses were between 5.0 and 300 pptv/ppbv. Further inspection of the values of LPG-related 252
VOCs and NOx with ratios of 5.0-300 showed insignificant differences (p>0.1) from those with 253
ratios beyond 5-300, suggesting that the air masses at MK were seldom influenced by 254
regional/super-regional air. Moreover, wind speeds were lower than 2.0 m/s for more than 95% 255
of the time (i.e., calm or light air according to the Beaufort Wind Scale) 256
(http://www.spc.noaa.gov/faq/tornado/beaufort.html), and the values of LPG-related VOCs and 257
NOx in all air masses were not different from those in the air masses with wind speeds lower than 258
2.0 m/s (p>0.1), confirming a minor impact of regional/super-regional pollution on air at MK. 259
Indeed, the prevailing wind direction was from the east, where local urban areas located. 260
Table 1 Ratios of toluene/benzene and xylenes/ethylbenzene at MK and other sites in Hong 261
Kong from October 2012 to May 2014 (unit: ppbv/ppbv) 262
toluene/benzene xylenes/ethylbenzene
MK (roadside site) 4.1 ± 0.04 3.0 ± 0.02
MK* (roadside site) 11.3 ± 0.9 5.7 ± 0.2
TC (general site) 0.7 ± 0.1 -
YL (general site) 3.7 ± 0.04 2.4 ± 0.02
HT (background site) 2.5 ± 0.1 1.8 ± 0.03
MK* refers to VOCs at MK with the background values being removed. 263

11
264
Figure 2 Hourly ratio of propane/CO at MK during 2011-2014 265
2.3.3 PMF model 266
Positive matrix factorization (PMF) is a receptor model for source apportionment and has been 267
extensively used in many fields (i.e., PM, VOCs and sediment) (Brown et al., 2007; Lee et al., 268
1999). Based on the principle of mass balance, it decomposes the matrix of measurement (X) 269
into the matrices of factor contributions (G) and factor profiles (F) in p sources, as shown in 270
equation (6) (Paatero, 1997; Paatero and Tapper, 1994): 271
(Equation (6)) 272
where is the measured concentration of j species in i sample, represents the contribution 273
of kth source to i sample, indicates the fraction of j species in kth source, and is the residual 274
for j species in i sample. 275
The matrices of G and F are obtained in the case of the minimum of objective function Q, as 276
shown in equation (7): 277
(Equation (7)) 278
where m and n represent the number of species and samples, respectively, and is the 279
uncertainty of j species in i sample. Q (robust) is automatically calculated by excluding the 280

12
points not fit by the model, and the run with lowest Q (robust) value is selected as the optimum 281
solution by the model. 282
2.3.4 PBM-MCM model 283
The photochemical box model incorporating the master chemical mechanism (PBM-MCM) is a 284
computing model based on the chemical reactions of observed species. It has been introduced 285
and successfully applied in many previous studies in reproducing the observed values, describing 286
the production and destruction mechanisms, and simulating the photochemical reactivity (Ling et 287
al., 2014; Lam et al., 2013; Cheng et al., 2010). Briefly, the observations of VOCs, trace gases 288
and meteorological parameters are input to construct and constrain the model, which consists of 289
5,900 reactions and 16,500 species in the latest version (MCM 3.2). However, it is noteworthy 290
that the heterogeneous reactions are not included, and the model does not consider the transport 291
processes (i.e., horizontal and vertical transport). 292
In this study, CO, SO2, NO, NO2, O3, twenty-seven VOCs and two meteorological parameters 293
(i.e., temperature and relative humidity) were used to construct and constrain the model. Hourly 294
data were used as input (i.e. 24 hours per day) and the outputs were from 07:00 to 19:00 by each 295
hour. To better describe the photochemical reactions in Hong Kong, the model was modified, i.e., 296
the photolysis rates were calibrated using the photon fluxes from the Tropospheric Ultraviolet 297
and Visible Radiation (TUV-v5) Model (Madronich and Flocke, 1997) according to the location 298
of Hong Kong and the modeling period, and the height of mixing layer was set as 300-1400 m. 299
The concentrations of some species in the free troposphere, which may influence the mixing 300
ratios of air pollutants in the lower troposphere with the development of boundary layer, were set 301
according to the real conditions in Hong Kong (Lam et al., 2013). 302
A base case was established to simulate O3 and the photochemical reactivity (i.e., the formation 303
and loss pathways of OH and HO2 listed in Table 2). The observed VOCs and trace gases were 304
input to construct the base case, and the simulated O3 was compared with the observed levels to 305
validate the model and check the influence of regional transport during daytime hours. At low 306
wind speed (1.3±0.01 m/s) and high NOx (223.2±1.8 ppbv) at MK, the majority of regional O3 307
would be completely consumed before being detected by measurement instruments. In fact, the 308
PBM-MCM model considered the regionally-transported concentrations of O3 precursors, as the 309
observed concentrations input into the model included the regional fractions. Moreover, since O3 310

13
levels were higher at night (8.1±0.2 ppbv) than that during daytime (5.9±0.1 ppbv) at MK, it 311
suggests the existence of nocturnal regional transport. Hence, the observed O3 at 07:00 was input 312
into the model to initiate the simulation for daytime hours, i.e., the nocturnal regional transport 313
of O3 was also considered. 314
Table 2 Formation and loss pathways of OH and HO2 considered in this study 315
OH HO2
Formation pathways HO2 + NO RO2 + NO
HONO + hv OH + CO
O (1D) + H2O OH + HCHO
O3 + alkenes HCHO + hv
O3 + alkenes
Loss pathways OH + VOCs HO2 + NO
OH + NO2
OH + CO
OH + NO
316
To simulate the contribution of LPG source to O3 formation, the following approach was adopted 317
to avoid altering the real ambient environment for atmospheric chemistry. Briefly, the 318
concentration of species X in the whole air and in the assigned LPG source was defined as Xwhole-319
air and XLPG, respectively. Hence, the concentration of “Xwhole-air - XLPG” was the input for the 320
constrained cases while Xwhole-air was the input for the base case. The three constrained cases 321
were i) only VOCs in the LPG source were excluded from the whole-air; ii) only NOx in the LPG 322
source was excluded; and iii) both VOCs and NOx were removed simultaneously. As such, the 323
differences of the outputs between the base case and the three constrained cases were the 324
contributions of i) VOCs, ii) NOx and iii) VOCs + NOx in the LPG source to the O3 formation, 325
respectively. The changes of these contributions from before to during the program represented 326
the impact of the intervention program on O3 formation. Table S3 in the Supplementary material 327
lists the configurations of the model input for the base case and the three constrained cases. 328
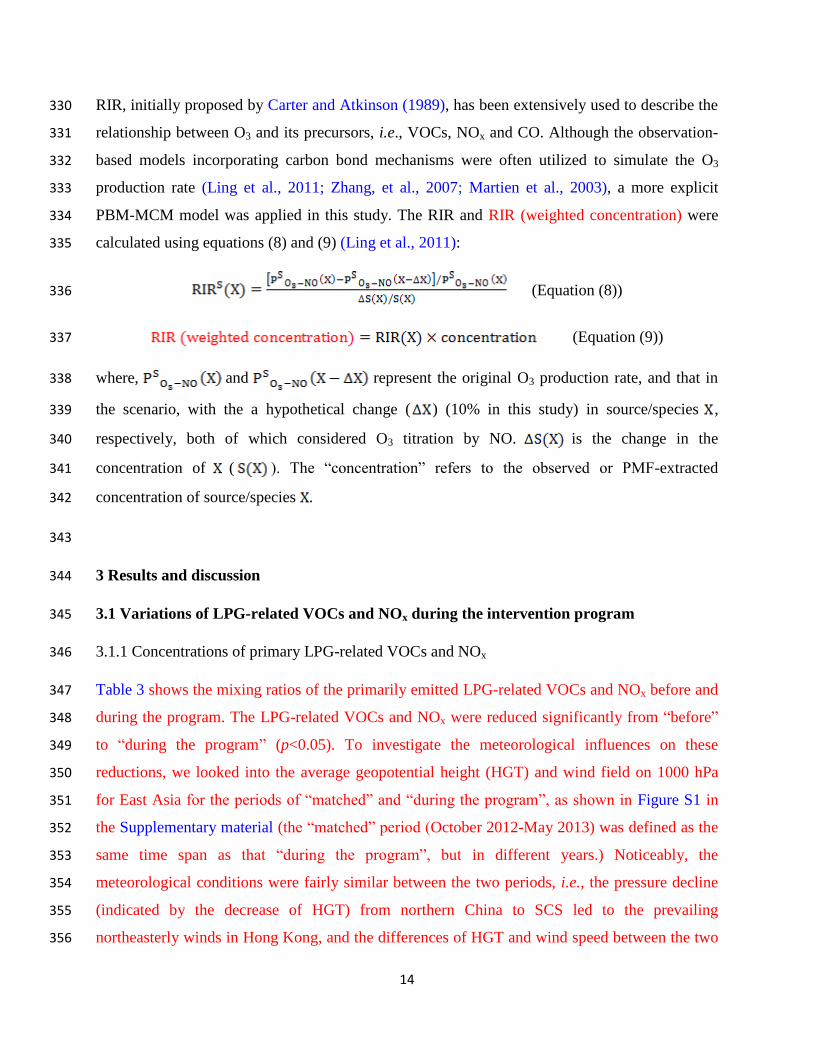
2.3.5 Relative incremental reactivity (RIR) 329
14
RIR, initially proposed by Carter and Atkinson (1989), has been extensively used to describe the 330
relationship between O3 and its precursors, i.e., VOCs, NOx and CO. Although the observation-331
based models incorporating carbon bond mechanisms were often utilized to simulate the O3 332
production rate (Ling et al., 2011; Zhang, et al., 2007; Martien et al., 2003), a more explicit 333
PBM-MCM model was applied in this study. The RIR and RIR (weighted concentration) were 334
calculated using equations (8) and (9) (Ling et al., 2011): 335
(Equation (8)) 336
(Equation (9)) 337
where, and represent the original O3 production rate, and that in 338
the scenario, with the a hypothetical change ( ) (10% in this study) in source/species , 339
respectively, both of which considered O3 titration by NO. is the change in the 340
concentration of ( ). The “concentration” refers to the observed or PMF-extracted 341
concentration of source/species . 342
343
3 Results and discussion 344
3.1 Variations of LPG-related VOCs and NOx during the intervention program 345
3.1.1 Concentrations of primary LPG-related VOCs and NOx 346
Table 3 shows the mixing ratios of the primarily emitted LPG-related VOCs and NOx before and 347
during the program. The LPG-related VOCs and NOx were reduced significantly from “before” 348
to “during the program” (p<0.05). To investigate the meteorological influences on these 349
reductions, we looked into the average geopotential height (HGT) and wind field on 1000 hPa 350
for East Asia for the periods of “matched” and “during the program”, as shown in Figure S1 in 351
the Supplementary material (the “matched” period (October 2012-May 2013) was defined as the 352
same time span as that “during the program”, but in different years.) Noticeably, the 353
meteorological conditions were fairly similar between the two periods, i.e., the pressure decline 354
(indicated by the decrease of HGT) from northern China to SCS led to the prevailing 355
northeasterly winds in Hong Kong, and the differences of HGT and wind speed between the two 356

15
periods for Hong Kong were only 0-2 gpm and less than 1 m/s, respectively. Ground monitoring 357
data also indicated insignificant differences of temperature (“matched”: 21.9±0.5 °C; “during”: 358
21.2±0.7 °C) between the two periods (p>0.05). However, the mixing ratios of LPG-related 359
VOCs and NOx during the “matched” period were comparable to those “before” the program, 360
and absolutely higher than those “during” the program (p<0.05) (see Table 3). Given the similar 361
meteorological conditions between the “matched” period and “during the program”, the 362
significant decreases of LPG-related VOCs and NOx were caused by the interventional program, 363
rather than meteorological variations. 364
Table 3 Mixing ratios of LPG-related VOCs and NOx during the periods of “before”, “matched” 365
and “during the program” (Unit: ppbv) 366
Species “before” “during” “matched”
Propane 8.5±0.1 5.8±0.1 9.1±0.1
i-Butane 6.6±0.1 4.7±0.1 6.9±0.1
n-Butane 13.2±0.2 8.4±0.1 13.7±0.2
NO 201.7±2.1 172.0±2.7 201.9±2.7
NO2 25.9±0.3 23.8±0.4 26.8±0.4
NOx 229.4±2.3 197.7±3.0 231.2±2.9
367
To further understand the effectiveness of the program, the monthly reductions of LPG-related 368
VOCs after the commencement of the converter replacement were calculated and compared with 369
those before the program (Figure 3). Since the program was initiated in October 2013, the 370
averages of VOC species in September in each year were taken as the baselines for the 371
calculation of monthly reduction. Briefly, the monthly reductions of LPG-related VOCs were the 372
differences between their averages in September and those in the other months. Hence, positive 373
and negative values indicate reductions and increments of the corresponding species, 374
respectively. It was found that the monthly averages of LPG-related VOCs consistently 375
decreased from September 2013 to May 2014 except for n-butane in October 2013 when the 376
program was just initiated. Compared to those before the program (i.e. September 2013), the 377
mixing ratios of propane, i-butane and n-butane decreased 3.2 ± 0.2, 2.8 ± 0.2 and 4.9 ± 0.2 ppbv 378
by May 2014, respectively, when 99.2% of catalytic converters participating in the program had 379
been exchanged. Furthermore, the monthly reductions correlated well with the cumulative 380
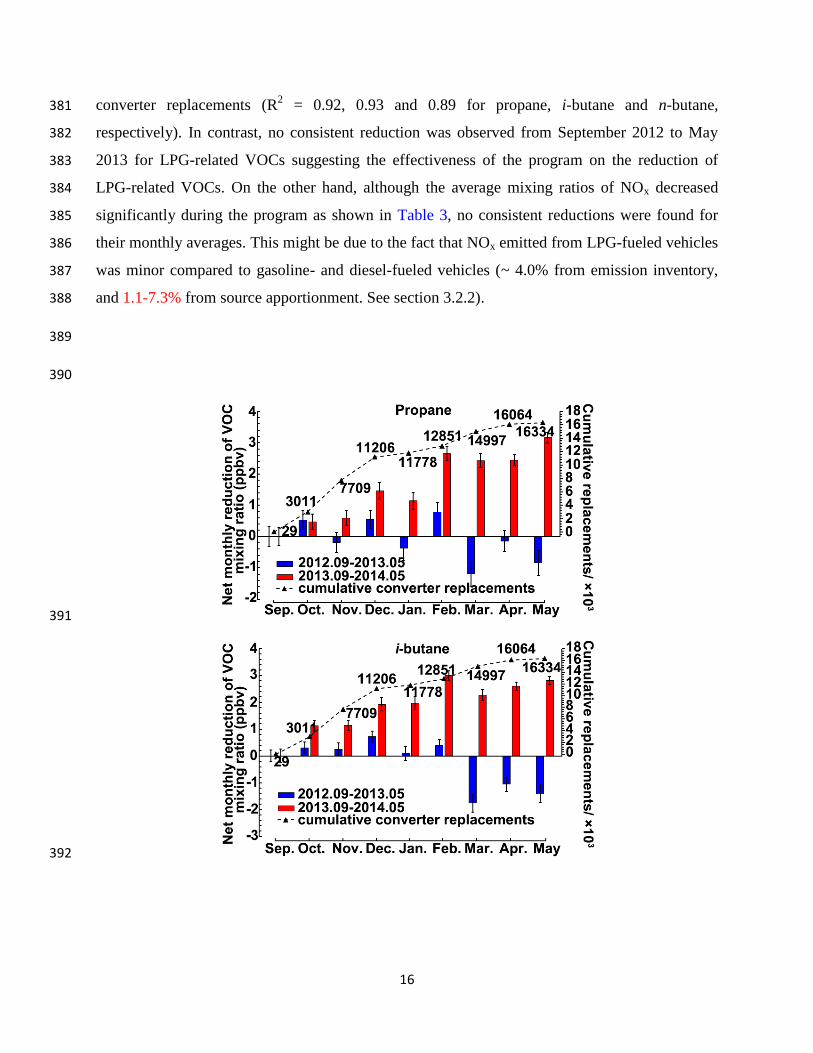
16
converter replacements (R2 = 0.92, 0.93 and 0.89 for propane, i-butane and n-butane, 381
respectively). In contrast, no consistent reduction was observed from September 2012 to May 382
2013 for LPG-related VOCs suggesting the effectiveness of the program on the reduction of 383
LPG-related VOCs. On the other hand, although the average mixing ratios of NOx decreased 384
significantly during the program as shown in Table 3, no consistent reductions were found for 385
their monthly averages. This might be due to the fact that NOx emitted from LPG-fueled vehicles 386
was minor compared to gasoline- and diesel-fueled vehicles (~ 4.0% from emission inventory, 387
and 1.1-7.3% from source apportionment. See section 3.2.2). 388
389
390
391
392

17
393
Figure 3 Monthly reductions of LPG-related VOCs at MK “before” (blue bar) and “during” (red 394
bar) the program (the average value of VOC species in September is the baseline. The values 395
along the dot line were the cumulative numbers of converters replaced. The bars above and 396
below the X axis refer to the reduction and increase of VOC mixing ratio, respectively) 397
3.1.2 Temporal variations of primary LPG-related VOCs and NOx 398
Figure 4 presents the temporal variations of propane and n/i-butanes at MK from June 2013 to 399
May 2014 covering the periods of both before (i.e., June 2013-September 2013) and during the 400
intervention program (i.e., October 2013-May 2014). The abnormally low alkane levels in late 401
June 2013 might be caused by the anti-cyclone over southern China and a tropical storm over the 402
SCS, leading to extremely high temperature on June 18-20 (i.e., favorable for photochemical 403
reactions), and stronger winds (i.e., conducive to atmospheric dispersion) on the following days, 404
respectively. In contrast, Hong Kong was strongly influenced by an active ocean flow and a low 405
pressure trough over the SCS in late July 2013. The consequently heavy rain and low 406
temperature suppressed the photochemical reactions and caused the unusually high levels of 407
VOCs (Figure S2 in the Supplementary material illustrates these events). Generally, the LPG-408
related VOCs experienced a significant (p<0.05) reduction throughout the year. The daily 409
changing rates of LPG-related VOCs in two periods, i.e., September-December and January-May, 410
in different years at MK are shown in Table 4. It is noteworthy that the two periods were selected 411
based on data availability each year, and the minimized influence of meteorological parameters 412
in the same month of different years. The LPG-related VOCs decreased from September to 413
December in 2011 and 2013, but there was no significant difference in 2012. In general, the 414
levels of VOCs in the atmosphere are associated with source emissions, photochemical reactions 415

18
and regional transport. As the regional influence was excluded in this study, source emissions 416
and photochemical reactions became the main factors determining the ambient concentrations of 417
VOCs. The decreasing and unchanged trends in 2011 and 2012 respectively might be related to 418
the integrated influence of reduced photochemical degradation (which increases ambient VOC 419
levels) and temperature decrease (which reduces evaporative emissions of VOCs) from 420
September to December. It is noticeable that the LPG-related VOCs had the highest decreasing 421
rates in September-December 2013, compared to those in previous years. The higher decreasing 422
rates of LPG-related VOCs in September-December 2013 implied the possible effectiveness of 423
the interventional program on VOCs reduction. For the period of January-May, the LPG-related 424
VOCs increased in January-May 2013, except for propane which did not show significant change 425
from January to May. However, significant decreasing trends (p<0.05) were observed for 426
propane and n/i-butanes during the same period in 2014, which was likely owing to the 427
continuous replacement of catalytic converters on LPG-fueled vehicles. By comparison, the 428
reduction rates of LPG-related VOCs in January-May 2014 were all lower than those in 429
September-December 2013. This was mainly attributable to the fact that a large portion (i.e. 430
~69%) of the converter replacements were completed by the end of December 2013, and the 431
replaced converters were much fewer (i.e. ~31%) in January-May 2014. 432
433

19
Figure 4 Variation trends of the daily average propane and n/i-butanes at MK from June 2013 to 434 May 2014. In the equation label x has units of days. 435
436
Table 4 Changing rates of propane and n/i-butanes in September-December and January-May in 437
different years (ppbv/day) 438
Time period Sep. - Dec. Jan. - May
Site Species 2011 2012 2013 2013 2014
MK
Propane -0.015 -0.004* -0.017 0.004
* -0.014
i-Butane -0.010 -0.008* -0.021 0.012 -0.005
n-Butane -0.023 -0.009* -0.039 0.016 -0.028
* The changing rate insignificant (p>0.05); the bold numbers are changing rates during the 439
implementation of the program. 440
441
Figure 5 shows the temporal variations of primary NOx, NO, NO2 and secondary NO2 at MK 442
from June 2013 to May 2014. The primary NOx and NO mixing ratios decreased significantly 443
(p<0.05), implying the possible effectiveness of the intervention program on NO/NOx reduction. 444
However, the secondary NO2 levels increased, while there was no significant change (p>0.05) 445
for primary NO2. To explore the reasons of NO-NO2-NOx variations, the changing rates of 446
primary NOx, NO, NO2 and secondary NO2 during the same period (i.e., June in the previous 447
year to May in the following year) in different years were compared. Table 5 shows the statistics 448
of changing rates of NOx-NO-NO2 at the roadside sites (i.e., MK, CWB and Central) from June 449
2011 to May 2014. Taking MK as an example, the primary NOx and NO decreased much faster 450
(i.e., 91 and 94 pptv/day, respectively) from June 2013 to May 2014 than those during the same 451
period in 2011-2012 and 2012-2013, suggesting the effectiveness of the program in reducing 452
NOx and NO. Compared to the decreasing rate in June 2012-May 2013 (i.e., 13 pptv/day), no 453
significant change (p>0.05) was observed for primary NO2 from June 2013 to May 2014. 454
However, it cannot be concluded that the program caused the increase of primary NO2, in view 455
of the same insignificant variation in June 2011-May 2012 and the fact that LPG-fueled vehicles 456
emit negligible NO2 (see section 3.2.2). In contrast, secondary NO2 significantly increased (with 457
a rate of 13 pptv/day) from June 2013 to May 2014, which was also observed in June 2011-May 458
2012 (i.e., increasing rate of 20 pptv/day). Since secondary NO2 is formed by NO reacting with 459
O3, inspection of the O3 production would provide more comprehensive interpretation on the 460

20
secondary NO2 increment during the program. Similar variations were observed at CWB and 461
Central, where primary NOx and NO showed significant decreasing trends, whereas the 462
variations of primary and secondary NO2 were insignificant (p>0.05). 463
464
465
466
Figure 5 Variation trends of the daily average primary NOx, NO and NO2 and secondary NO2 at 467 MK from June 2013 to May 2014. In the equation label x has units of days. 468
469
Table 5 Changing rates of primary NOx, NO, NO2 and secondary NO2 (ppbv/day) 470
Site Species Jun. 2011-May 2012 Jun. 2012-May 2013 Jun. 2013-May 2014
MK
[NOx]prim -0.004 0.040* -0.091
[NO]prim 0.004* 0.053 -0.094
[NO2]prim 0.008* -0.013 0.003
*
[NO2]sec 0.020 -0.002* 0.013
CWB
[NOx]prim -0.055* 0.089
* -0.121
[NO]prim -0.048* 0.081
* -0.127
[NO2]prim -0.010* 0.004
* 0.006
*
[NO2]sec 0.014 -0.001* 0.006
*

21
Central
[NOx]prim -0.041* 0.180 -0.187
[NO]prim -0.045* 0.161 -0.188
[NO2]prim 0.005* 0.018 0.002
*
[NO2]sec 0.011* -0.004
* -0.001
*
* The changing rate is insignificant (p>0.05); the bold numbers are changing rates during the 471
implementation of the program 472
473
In summary, the LPG-related VOCs were significantly lowered during the program with monthly 474
reductions of 3.2 ± 0.2, 2.8 ± 0.2 and 4.9 ± 0.2 ppbv for propane, i-butane and n-butane by the 475
end of this study, respectively. Continuous decreasing trends were observed for LPG-related 476
VOCs, and the reduction rates were almost unprecedented, e.g. 39 pptv/day for n-butane. 477
Furthermore, the mixing ratios of NO and NOx decreased as well during the program. The 478
reduction rates of NO and NOx during June 2013-May 2014 at the three roadside sites were 479
much higher than those in previous years. Overall, the field measurement data indicated that the 480
program was effective in reducing emissions of LPG-related VOCs and NOx. 481
482
3.2 Variations of LPG contributions to VOCs and NOx 483
3.2.1 Source identification 484
To investigate the change of the contributions of LPG-fueled vehicles to VOCs and NOx, the 485
online data of 15 VOCs and 3 trace gases at MK before (i.e., 8,753 samples during October 486
2012-September 2013) and during the intervention program (i.e., 5,833 samples during October 487
2013-May 2014) were separately applied to PMF for source apportionments. It is noteworthy 488
that the whole-air ambient concentrations of VOCs and trace gases rather than those with the 489
backgrounds being deducted were used here, in order to keep consistency with the simulations of 490
whole-air ambient O3 and photochemical reactivity. Figure 6 shows the source profiles of the 491
four factors that best reproduced the concentrations of the input species before and during the 492
intervention program, respectively. The first factor had high loadings of C3-C5 hydrocarbons and 493
toluene, and was dominated by CO, NO and NO2, which are all main components of vehicle 494
exhaust (Guo et al., 2011a; Ho et al., 2009). The n/i-pentanes and toluene indicated emissions 495

22
from gasoline vehicles, while the high NOx loading was a signature of diesel exhaust. Since 496
propane and n/i-butanes were not prominent, this factor was assigned as gasoline and diesel-497
fueled vehicle exhaust. Factor 2 was closely associated with LPG-fueled vehicle exhaust, with 498
the dominance of propane, n/i-butanes and propene, the major components and combustion 499
product of LPG (Guo et al., 2011b; Blake and Rowland, 1995). Factor 3 was distinguished by 500
NO2 and the long-lived species, i.e., ethane, ethyne, benzene and CO. The long-lived species 501
were the indicators of aged air masses, in which NO2 was accumulated due to photochemical 502
reactions. Hence, this factor represented aged air masses. Indeed, this profile highly coincided 503
with the aged air in Hong Kong identified by Lau et al. (2010). The last factor explained most of 504
the TEX compounds (toluene/ethylbenzene/xylenes), the tracers of solvent usage (Guo et al., 505
2007; Borbon et al., 2002). Therefore, factor 4 was identified as solvent usage. 506
507
Figure 6 Source profiles resolved by PMF before (red bar) and during (green bar) the program. 508 The standard errors are estimated with the bootstrap method in the model. 509
510
3.2.2 Source contribution 511

23
Based on the VOC loadings in each source, Table 6 summarizes the mass and percentage 512
contributions of the sources to VOCs at MK. LPG-fueled vehicle exhaust was the greatest 513
contributor to VOCs at MK, with the mass contribution of 114.2 ± 0.1 μg/m3 (51.51 ± 0.05%) 514
and 64.8 ± 0.1 μg/m3 (39.07 ± 0.05%) before and during the program, respectively. These 515
contributions were higher than those quantified at other sites in Hong Kong, i.e., suburban TC 516
(32.6±5.8%) (Ou et al., 2015), urban TW (21±2%) (Ling and Guo, 2014) and suburban YL (15%) 517
(Guo et al., 2007). It is noteworthy that factors such as study period, chemical species, source 518
profiles and models used all influence the source apportionment. Bearing these factors in mind, 519
the higher contributions of LPG-fueled vehicle exhaust in this study were likely due to the fact 520
that MK was a roadside site closer to the emission sources. On the other hand, though 521
gasoline/diesel vehicles emitted considerable VOCs (i.e., 60.5 ± 0.1 and 56.8 ± 0.2 μg/m3 before 522
and during the program, respectively), they were significantly lower than those emitted by LPG-523
fueled vehicles (p<0.05), particularly before the replacement of the catalytic converters. While 524
LPG-fueled vehicles accounted for only a small amount of the registered vehicles (~3.1%) in 525
Hong Kong (Table S4 in the Supplementary material), it was not unreasonable that LPG made 526
the highest contribution to VOCs, in view of low vapor pressure of the LPG component and 527
high-density flow of the LPG-fueled vehicles at MK. Apart from vehicular exhaust, the aged 528
VOCs and solvent usage also contributed ~24% to VOCs at MK. 529
Table 7 lists the reduction of individual species from LPG-fueled vehicles due to the intervention 530
program. Propane (“before”: 21.15 ± 0.02 μg/m3; “during”: 12.53 ± 0.01 μg/m
3), n-butane 531
(“before”: 57.96 ± 0.01 μg/m3; “during”: 30.27 ± 0.02 μg/m
3) and i-butane (“before”: 27.20 ± 532
0.02 μg/m3; “during”: 17.50 ± 0.01 μg/m
3) all decreased remarkably throughout the study period 533
(p<0.05). Meanwhile, the concentrations of CO and NO were also reduced from 248.4 ± 1.3 and 534
18.2 ± 0.1 μg/m3 to 228.9 ± 0.6 and 2.08 ± 0.04 μg/m
3, respectively. However, NO2 apportioned 535
in LPG exhaust was extremely minor (i.e., 0.6 ± 0.2 μg/m3 and nil before and during the program, 536
respectively), which might explain the insignificant decrease or even increase of NO2. During the 537
study period, the LPG-related VOCs and NO increased by ~1.4 and ~2.9 μg/m3, respectively, at 538
the background site, only respectively accounting for 3.0% and 1.3% of the decreased LPG-539
related VOCs (~46.1 μg/m3) and NO (~226.8 μg/m
3) in LPG-fueled vehicle exhaust. Therefore, 540
it is believed that the reductions of VOCs and NO in LPG-fueled vehicle exhaust benefited from 541
the intervention program. 542

24
Table 6 Mass concentration and percentage contribution of the four sources to VOCs at MK 543
before and during the program 544
Source “before” “during”
Mass (μg/m3) Percentage (%) Mass (μg/m
3) Percentage (%)
Gasoline/ diesel
vehicle exhaust
60.5 ± 0.1 27.30 ± 0.05 56.8 ± 0.2 34.3 ± 0.1
LPG-fueled
vehicle exhaust
114.2 ± 0.1 51.51 ± 0.05 64.8 ± 0.1 39.07 ± 0.05
Aged air masses 19.8 ± 0.2 8.9 ± 0.1 24.6 ± 0.1 14.8 ± 0.1
Solvent usage 27.30 ± 0.04 12.31 ± 0.01 19.6 ± 0.1 11.84 ± 0.04
545
Table 7 VOCs and trace gases emitted from LPG-fueled vehicles before and during the 546
intervention program (unit: μg/m3 unless otherwise specified). The standard errors are estimated 547
with the bootstrap method in the PMF model. 548
“before” “during”
Ethane 1.192 ± 0.001 1.19 ± 0.01
Ethene 1.327 ± 0.005 0.431 ± 0.004
Ethyne 0.0000±0.0004 0.000 ± 0.001
Propane 21.15 ± 0.02 12.53 ± 0.01
Propene 2.860 ± 0.004 1.553 ± 0.001
n-Butane 57.96 ± 0.01 30.27 ± 0.02
i-Butane 27.20 ± 0.02 17.50 ± 0.01
n-Pentane 0.251 ± 0.003 0.039 ± 0.002
i-Pentane 1.04 ± 0.01 0.786 ± 0.002
Benzene 0.00 ± 0.01 0.000 ± 0.001
Toluene 0.66 ± 0.02 0.50 ± 0.01
Ethylbenzene 0.000 ± 0.001 0.000 ± 0.004
m,p-Xylene 0.416 ± 0.003 0.00 ± 0.01
o-Xylene 0.144±0.001 0.006 ± 0.001
CO 248.4 ± 1.3 228.9 ± 0.6
NO 18.2 ± 0.1 2.08 ± 0.04
NO2 0.6 ± 0.2 0.00 ± 0.08
Sum of VOCs 114.2 ± 0.1 64.8 ± 0.1

25
Contribution to
VOCs (%) 51.5 ± 0.1 39.1 ± 0.1
549
3.3 Impact of the intervention program on O3 production 550
3.3.1 O3 Simulation 551
As VOCs and NOx are key O3 precursors, it is essential to examine the impact of the reduction of 552
VOCs and NOx during the program on the O3 production. Figure 7 compares the observed and 553
simulated O3 during daytime (07:00-19:00 local time (LT)) in base case. 554
555
Figure 7 Hourly simulated and observed O3 during daytime hours (07:00-19:00 LT) at MK. 556
To quantitatively evaluate the performance of the model, the index of agreement (IOA) was 557
introduced to test the agreement between the simulated and observed O3. Ranging from 0 to 1, 558
higher values of IOA indicate better agreement between the simulation and observation. The 559
IOA was calculated using equation (10) (Huang et al., 2005): 560
IOA = (Equation (10)) 561
where and are the hourly observed and simulated values, and represents the average of 562
observations. In this study, the IOA reached 0.75, and the accuracy of the simulation was 16.7 ± 563
2.1%, suggesting good performance of the model in O3 simulation. Bearing in mind the 564
uncertainty of the model, the good agreement between the simulated and observed O3 implied a 565
minor regional contribution at this roadside site. 566
26
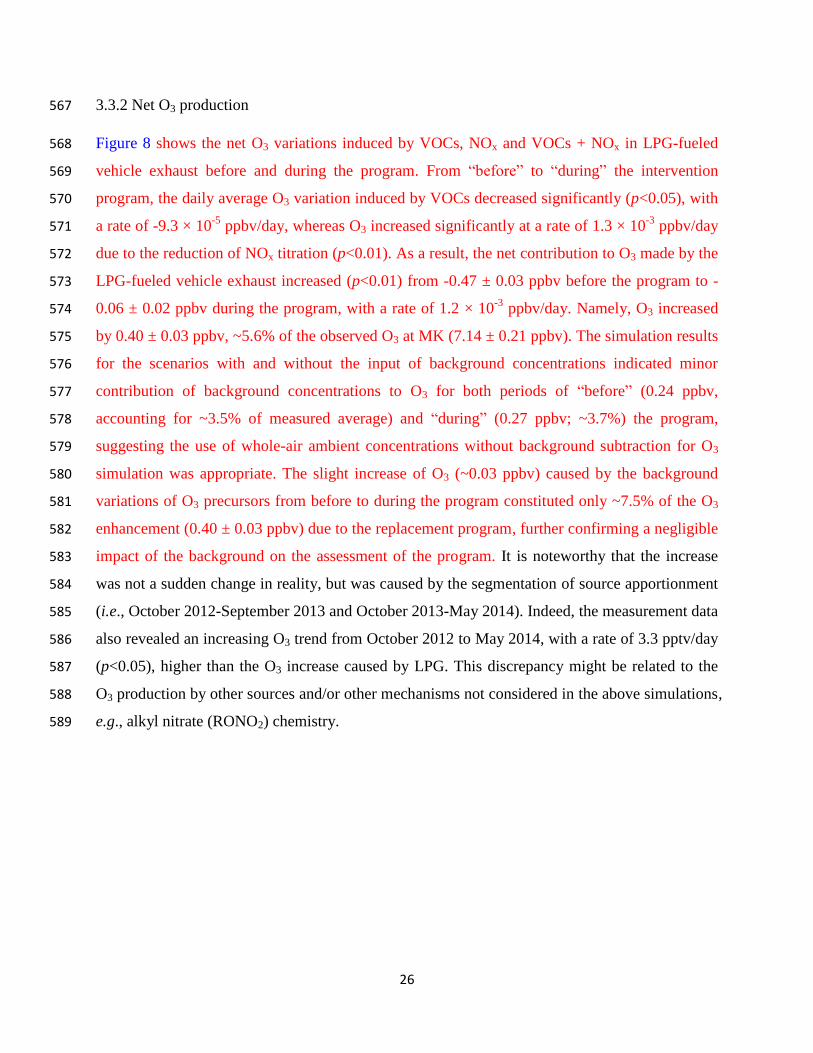
3.3.2 Net O3 production 567
Figure 8 shows the net O3 variations induced by VOCs, NOx and VOCs + NOx in LPG-fueled 568
vehicle exhaust before and during the program. From “before” to “during” the intervention 569
program, the daily average O3 variation induced by VOCs decreased significantly (p<0.05), with 570
a rate of -9.3 × 10⁻⁵
ppbv/day, whereas O3 increased significantly at a rate of 1.3 × 10⁻³
ppbv/day 571
due to the reduction of NOx titration (p<0.01). As a result, the net contribution to O3 made by the 572
LPG-fueled vehicle exhaust increased (p<0.01) from -0.47 ± 0.03 ppbv before the program to -573
0.06 ± 0.02 ppbv during the program, with a rate of 1.2 × 10⁻³
ppbv/day. Namely, O3 increased 574
by 0.40 ± 0.03 ppbv, ~5.6% of the observed O3 at MK (7.14 ± 0.21 ppbv). The simulation results 575
for the scenarios with and without the input of background concentrations indicated minor 576
contribution of background concentrations to O3 for both periods of “before” (0.24 ppbv, 577
accounting for ~3.5% of measured average) and “during” (0.27 ppbv; ~3.7%) the program, 578
suggesting the use of whole-air ambient concentrations without background subtraction for O3 579
simulation was appropriate. The slight increase of O3 (~0.03 ppbv) caused by the background 580
variations of O3 precursors from before to during the program constituted only ~7.5% of the O3 581
enhancement (0.40 ± 0.03 ppbv) due to the replacement program, further confirming a negligible 582
impact of the background on the assessment of the program. It is noteworthy that the increase 583
was not a sudden change in reality, but was caused by the segmentation of source apportionment 584
(i.e., October 2012-September 2013 and October 2013-May 2014). Indeed, the measurement data 585
also revealed an increasing O3 trend from October 2012 to May 2014, with a rate of 3.3 pptv/day 586
(p<0.05), higher than the O3 increase caused by LPG. This discrepancy might be related to the 587
O3 production by other sources and/or other mechanisms not considered in the above simulations, 588
e.g., alkyl nitrate (RONO2) chemistry. 589
27
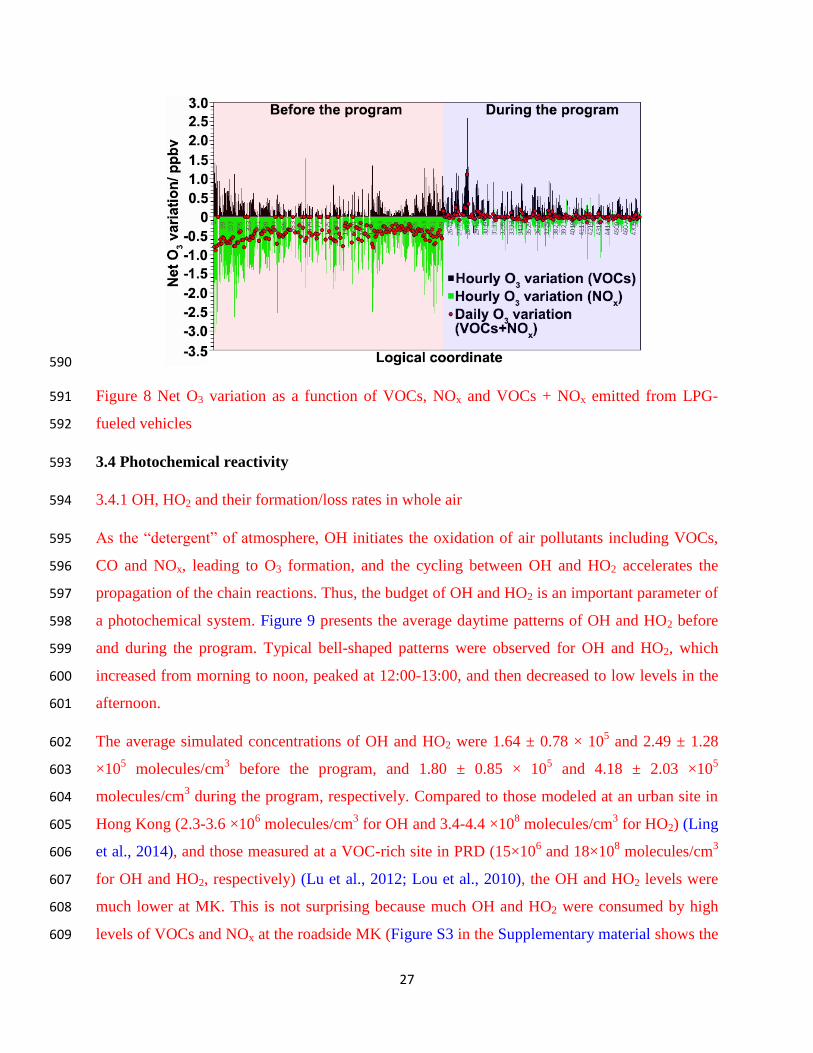
590
Figure 8 Net O3 variation as a function of VOCs, NOx and VOCs + NOx emitted from LPG-591
fueled vehicles 592
3.4 Photochemical reactivity 593
3.4.1 OH, HO2 and their formation/loss rates in whole air 594
As the “detergent” of atmosphere, OH initiates the oxidation of air pollutants including VOCs, 595
CO and NOx, leading to O3 formation, and the cycling between OH and HO2 accelerates the 596
propagation of the chain reactions. Thus, the budget of OH and HO2 is an important parameter of 597
a photochemical system. Figure 9 presents the average daytime patterns of OH and HO2 before 598
and during the program. Typical bell-shaped patterns were observed for OH and HO2, which 599
increased from morning to noon, peaked at 12:00-13:00, and then decreased to low levels in the 600
afternoon. 601
The average simulated concentrations of OH and HO2 were 1.64 ± 0.78 × 10⁵ and 2.49 ± 1.28 602
×105 molecules/cm
3 before the program, and 1.80 ± 0.85 × 10
5 and 4.18 ± 2.03 ×10
5 603
molecules/cm3 during the program, respectively. Compared to those modeled at an urban site in 604
Hong Kong (2.3-3.6 ×10⁶ molecules/cm
3 for OH and 3.4-4.4 ×10
8 molecules/cm
3 for HO2) (Ling 605
et al., 2014), and those measured at a VOC-rich site in PRD (15×106 and 18×10
8 molecules/cm
3 606
for OH and HO2, respectively) (Lu et al., 2012; Lou et al., 2010), the OH and HO2 levels were 607
much lower at MK. This is not surprising because much OH and HO2 were consumed by high 608
levels of VOCs and NOx at the roadside MK (Figure S3 in the Supplementary material shows the 609

28
simulated OH and HO2 at different sites with the PBM-MCM model). In addition, this study 610
covered different seasons of the study years, rather than the O3 episodes in Ling et al. (2014) and 611
summer only in Lu et al. (2012) and Lou et al. (2010) when photochemical reactivity was usually 612
stronger. Apart from the increase of OH and HO2 from before to during the program, the ratio of 613
HO2/OH was significantly higher during the program (i.e., 3.7 ± 0.5) than that before (i.e., 1.9 ± 614
0.3) (p<0.05), which might partly explain the increase of O3 throughout the study period. 615
Nevertheless, since the OH, HO2 and HO2/OH were simulated using the whole-air concentrations 616
of O3 precursors, whether their increases were mainly caused by the intervention program 617
requires further investigation, as shown below. 618
619
Figure 9 Daytime patterns of OH and HO2 (a) before and (b) during the program. 620
Since the changes in the formation/loss rates from before to during the program were minor for 621
each pathway of OH and HO2, Figure 10 presents their average pathway-specific formation and 622
loss rates over the whole study period. The total formation/loss rates of OH and HO2 were 5.8 ± 623
2.4 ×10⁶ and 2.6 ± 1.0 ×10
6 molecules/cm
3/s, respectively. The reaction of HO2 with NO, HONO 624
photolysis, O3 photolysis and ozonolysis of alkenes were the main sources of OH, with 625
contributions of 56.7 ± 11.6%, 31.7 ± 10.7%, 6.6 ± 3.3% and 5.0 ± 1.7%, respectively. On the 626
other hand, OH was consumed by reaction with NO (36.5 ± 5.5%), NO2 (35.1 ± 4.6%), VOCs 627
(14.8 ± 1.2%) and CO (13.6 ± 1.0%). For HO2 formation, the reaction between RO2 and NO was 628
the most predominant pathway (54.8 ± 8.8%), followed by the reaction of OH with CO (23.3 ± 629
3.9%), HCHO photolysis (13.1 ± 4.6%), ozonolysis of alkenes (7.9 ± 2.1%) and the reaction of 630

29
OH with HCHO (0.8 ± 0.2%). Meanwhile, HO2 was almost exclusively consumed by reacting 631
with NO. 632
633
Figure 10 Average formation and loss pathways of OH and HO2 at MK during the study period 634
3.4.2 Influence of the program on photochemical reactivity 635
The differences between the simulation outputs of the scenarios with and without LPG VOCs 636
and NOx inputs determined the contributions of LPG-fueled vehicle exhaust to the formation/loss 637
rates of OH and HO2, as summarized in Table 8. Generally, the formation/loss rates of OH and 638
HO2 contributed by the LPG source decreased from before to during the program, which was 639
caused by the reduction of VOCs and NOx in the LPG source. Furthermore, since the sum of the 640
formation rates were lower than the loss rates for OH for both before and during the program, but 641
for only HO2 before the program, the net effects of the LPG source to OH and HO2 were 642
destructive. However, the HO2 formation rate exceeded its loss rate for the period of during the 643
program, indicating a net production of HO2 by the LPG source. 644
Figure 11 (a) shows the net effects of the LPG source on the production of OH and HO2. From 645
before to during the program, the destruction rate of OH decreased, while the destruction of HO2 646
switched to production. These variations led to the increases of OH and HO2 from before to 647
during the program, as shown in Figure 11 (b). Different from the increases of OH and HO2 in 648
the whole air as shown in Figure 9, the increases here were caused by the intervention program. 649
The OH and HO2 levels increased by 6.9±1.1 ×10³ molecules/cm
3 and 3.4±1.2 ×10
4 650

30
molecules/cm3, respectively. The higher increase of HO2 than OH led to a higher ratio of 651
HO2/OH during the program, resulting in a consequent O3 increment. 652
Table 8 Contributions of LPG-fueled vehicle exhaust to the formation and loss of OH and HO2 653
before and during the program 654
Reaction “Before”
(molecules/cm3/s)
“During”
(molecules/cm3/s)
OH
formation
HO2 + NO (1.8 ± 0.8) × 105 (2.8 ± 1.2) × 10
4
O3 + alkenes (3.3 ± 1.2) × 104 (3.1 ± 1.2) × 10
4
Sum of OH formation (2.2 ± 0.9) × 105 (5.2 ± 1.9) × 10
4
OH loss OH + CO (1.4 ± 0.6) × 104 (1.5 ± 0.6) × 10
5
OH + NO2 (5.0 ± 2.0) × 103 -
OH + NO (1.9 ± 0.02) × 105 (2.4 ± 1.0) × 10
4
OH + VOCs (2.3 ± 0.02) × 105 (1.5 ± 0.6) × 10
5
Sum of OH loss (5.7 ± 1.6) × 105 (3.2 ± 1.4) × 10
5
Net OH formation - (3.6 ± 0.8) × 105 - (2.7 ± 1.2) × 10
5
HO2
formation
RO2 + NO (8.1 ± 3.4) × 104 (1.3 ± 0.5) × 10
4
O3 + alkenes (3.3 ± 1.2) × 104 (3.1 ± 1.2) × 10
4
Sum of HO2 formation (1.1 ± 0.4) × 105 (3.6 ± 1.3) × 10
4
HO2 loss HO2 + NO (1.8 ± 0.8) × 105 (2.8 ± 1.2) × 10
4
Sum of HO2 loss (1.8 ± 0.8) × 105 (2.8 ± 1.2) × 10
4
Net HO2 formation - (7.0 ± 3.1) × 104 (7.8 ± 3.1) × 10
3
655
656
31
Figure 11 (a) Net production of OH and HO2 by LPG-fueled vehicle exhaust (negative values 657
indicate net destruction); and (b) increases of OH and HO2 from before to during the program. 658
3.5 Improvement of the intervention program 659
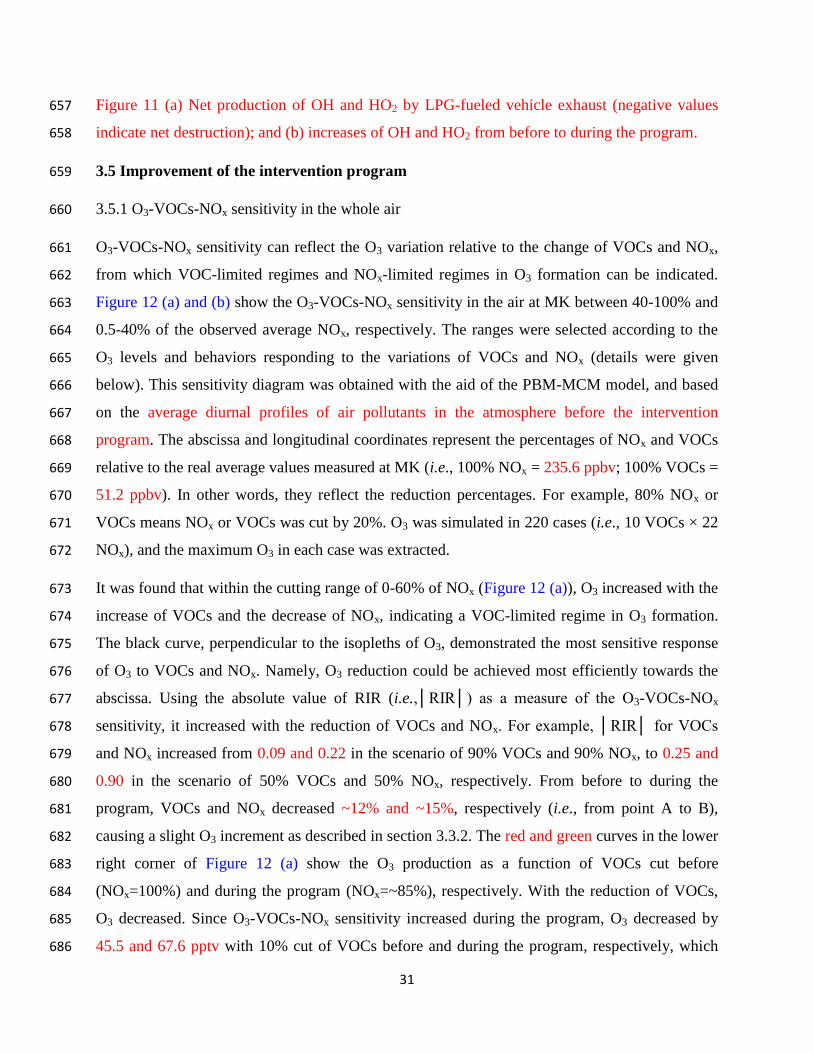
3.5.1 O3-VOCs-NOx sensitivity in the whole air 660
O3-VOCs-NOx sensitivity can reflect the O3 variation relative to the change of VOCs and NOx, 661
from which VOC-limited regimes and NOx-limited regimes in O3 formation can be indicated. 662
Figure 12 (a) and (b) show the O3-VOCs-NOx sensitivity in the air at MK between 40-100% and 663
0.5-40% of the observed average NOx, respectively. The ranges were selected according to the 664
O3 levels and behaviors responding to the variations of VOCs and NOx (details were given 665
below). This sensitivity diagram was obtained with the aid of the PBM-MCM model, and based 666
on the average diurnal profiles of air pollutants in the atmosphere before the intervention 667
program. The abscissa and longitudinal coordinates represent the percentages of NOx and VOCs 668
relative to the real average values measured at MK (i.e., 100% NOx = 235.6 ppbv; 100% VOCs = 669
51.2 ppbv). In other words, they reflect the reduction percentages. For example, 80% NOx or 670
VOCs means NOx or VOCs was cut by 20%. O3 was simulated in 220 cases (i.e., 10 VOCs × 22 671
NOx), and the maximum O3 in each case was extracted. 672
It was found that within the cutting range of 0-60% of NOx (Figure 12 (a)), O3 increased with the 673
increase of VOCs and the decrease of NOx, indicating a VOC-limited regime in O3 formation. 674
The black curve, perpendicular to the isopleths of O3, demonstrated the most sensitive response 675
of O3 to VOCs and NOx. Namely, O3 reduction could be achieved most efficiently towards the 676
abscissa. Using the absolute value of RIR (i.e.,│RIR│) as a measure of the O3-VOCs-NOx 677
sensitivity, it increased with the reduction of VOCs and NOx. For example, │RIR│ for VOCs 678
and NOx increased from 0.09 and 0.22 in the scenario of 90% VOCs and 90% NOx, to 0.25 and 679
0.90 in the scenario of 50% VOCs and 50% NOx, respectively. From before to during the 680
program, VOCs and NOx decreased ~12% and ~15%, respectively (i.e., from point A to B), 681
causing a slight O3 increment as described in section 3.3.2. The red and green curves in the lower 682
right corner of Figure 12 (a) show the O3 production as a function of VOCs cut before 683
(NOx=100%) and during the program (NOx=~85%), respectively. With the reduction of VOCs, 684
O3 decreased. Since O3-VOCs-NOx sensitivity increased during the program, O3 decreased by 685
45.5 and 67.6 pptv with 10% cut of VOCs before and during the program, respectively, which 686
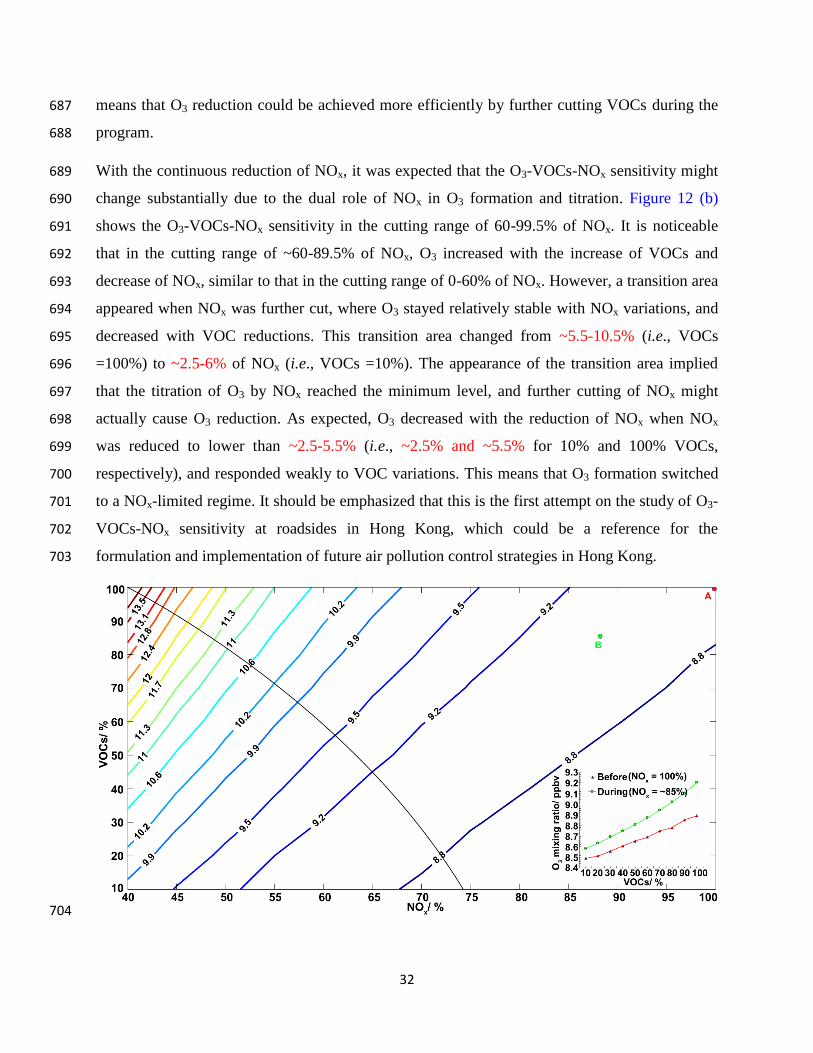
32
means that O3 reduction could be achieved more efficiently by further cutting VOCs during the 687
program. 688
With the continuous reduction of NOx, it was expected that the O3-VOCs-NOx sensitivity might 689
change substantially due to the dual role of NOx in O3 formation and titration. Figure 12 (b) 690
shows the O3-VOCs-NOx sensitivity in the cutting range of 60-99.5% of NOx. It is noticeable 691
that in the cutting range of ~60-89.5% of NOx, O3 increased with the increase of VOCs and 692
decrease of NOx, similar to that in the cutting range of 0-60% of NOx. However, a transition area 693
appeared when NOx was further cut, where O3 stayed relatively stable with NOx variations, and 694
decreased with VOC reductions. This transition area changed from ~5.5-10.5% (i.e., VOCs 695
=100%) to ~2.5-6% of NOx (i.e., VOCs =10%). The appearance of the transition area implied 696
that the titration of O3 by NOx reached the minimum level, and further cutting of NOx might 697
actually cause O3 reduction. As expected, O3 decreased with the reduction of NOx when NOx 698
was reduced to lower than ~2.5-5.5% (i.e., ~2.5% and ~5.5% for 10% and 100% VOCs, 699
respectively), and responded weakly to VOC variations. This means that O3 formation switched 700
to a NOx-limited regime. It should be emphasized that this is the first attempt on the study of O3-701
VOCs-NOx sensitivity at roadsides in Hong Kong, which could be a reference for the 702
formulation and implementation of future air pollution control strategies in Hong Kong. 703
704

33
Figure 12 (a) O3-VOCs-NOx sensitivity within the cutting range of 0-60% of NOx. The black 705
curve demonstrates the most sensitive response of O3 to VOCs and NOx. Points A and B 706
represent the O3-VOCs-NOx relationship “before” and “during the program”, respectively. The 707
red and green curves in the small legend show the O3 production as a function of VOC cuts 708
before and during the program, respectively. 709
710
Figure 12 (b) O3-VOCs-NOx sensitivity within the cutting range of 60-99.5% of NOx 711
712
3.5.2 O3-VOCs-NOx sensitivity in LPG 713
Figure 13 shows the net O3 increment (i.e., positive and negative values indicate the increase and 714
decrease of O3, respectively) as a response of the reduction of VOCs and NOx in LPG-fueled 715
vehicle exhaust. It was found that the net O3 increment uniformly increased with the increase of 716
NOx cut and the decrease of VOCs cut. To ensure that O3 would not increase during the program, 717
the reduction of VOCs and NOx should be within the highlighted area. That is, the highest 718
cutting percentage of NOx should be less than 68.9% (i.e., point A). Furthermore, when the 719
cutting percentage of VOCs increased from 20% to 100%, the maximum cutting percentage of 720
NOx for zero O3 increment was between 18.2% and 68.9%, and the cutting ratio of VOCs/NOx 721
increased from 1.1 to 1.45, suggesting that the cutting ratio of VOCs/NOx should be > 1.1 in 722

34
order to maintain zero O3 increment. During the program, VOCs and NOx in LPG-fueled vehicle 723
exhaust were cut by ~43% and ~89% (i.e., point B), respectively. According to the cutting ratios 724
of VOCs/NOx (~1.45) in the high cutting range of NOx, the minimum reduction percentage of 725
VOCs should be ~129% when NOx was cut by ~89%. In other words, O3 would inevitably 726
increase in this case. 727
Indeed, NO2 experienced an overall increase from 1999 to 2013 at the roadsides in Hong Kong 728
(HKEPD, 2014). According to this study, secondary NO2 might be more responsible for the 729
increase. Considering nil-emission of NO2 (section 3.2.2) and low emission of NO from LPG 730
usage (i.e., 4.0% and 1.1-7.3% based on the emission inventory and source apportionment, 731
respectively), an alternative scheme was proposed. Namely, reasonable cutting ratio of 732
VOCs/NOx was used to fulfill zero O3 increase when VOC and NOx were cut. Although the O3 733
production increase was minor (i.e., 0.4 ppbv or 5.6%) in this study, this scheme could be 734
applicable in future programs. Moreover, since the reactivity and concentration of VOCs 735
influenced their O3 formation potential, the relative incremental reactivity (RIR) and RIR 736
(weighted concentration) of LPG-related VOCs were calculated. Table 9 shows the RIR and 737
RIR-weighted concentration of propane, propene and n/i-butanes. Propene had the highest RIR 738
(i.e., 5.21×10⁻²
), suggesting the highest sensitivity of O3 production to propene. However, n-739
butane in LPG was found to have the highest RIR (weighted concentration) (2.61 μg/m3), 740
indicating that cutting n-butane in LPG source was optimal for O3 pollution control. 741
742
Figure 13 Net O3 increment as a function the reduction percentages of VOCs and NOx in LPG-743
fueled vehicle exhaust 744

35
Table 9 RIR and RIR (weighted concentration) of LPG-related VOCs 745
RIR (%/%×10-2
) RIR (weighted concentration) (μg/m3)
Propane 3.47 1.04
Propene 5.21 0.30
i-butane 3.47 1.33
n-butane 3.47 2.61
746
4 Conclusions 747
In this study, an intervention program, initiated in September 2013 and aimed to reduce 748
emissions of VOCs and NOx from LPG-fueled vehicles in Hong Kong, was evaluated. The 749
results indicated that LPG-related VOCs and NOx decreased significantly during the program, 750
when higher reduction rates were observed for LPG-related VOCs and NOx compared to those in 751
previous years. Source apportionment revealed that propane, n/i-butanes and NO in LPG-fueled 752
vehicle emissions were significantly lower during than before the program. It was therefore 753
concluded that the program was remarkably effective in reducing VOCs and NOx. To evaluate 754
the program more comprehensively, the variation of O3 production was simulated with the PBM-755
MCM model. It was found that LPG-fueled vehicular emission was generally O3 destructive at 756
the roadside MK site, and the O3 destruction decreased from 0.47 to 0.06 ppbv due to the 757
intervention program, causing an hourly average O3 increase of 0.40 ppbv (~5.6%). The LPG-758
fueled vehicle exhaust generally made negative contributions to the production of OH and HO2. 759
During the program, the destructive effect weakened and even turned to a positive contribution 760
to HO2 production, resulting in the increases of OH, HO2 and HO2/OH. This was in line with the 761
fact that O3 increased slightly during the implementation of the program. To improve the 762
program for future application, an O3-VOCs-NOx sensitivity analysis was conducted for ambient 763
air that is not partitioned to sources, and the individual source of LPG-fueled vehicle exhaust. 764
The NOx-limited regime in O3 formation was only found when NOx was reduced to less than 765
5.5%. Furthermore, for the emission reductions in LPG-fueled vehicle exhaust, the maximum 766
NOx cutting percentage of 68.9% and the lowest cutting ratio of VOCs/NOx (i.e., 1.1) were 767
determined to maintain zero O3 increment. 768
769

36
Acknowledgements 770
This study was supported by the Research Grants Council of the Hong Kong Special 771
Administrative Region via grants PolyU5154/13E and PolyU152052/14E, and the Hong Kong 772
Polytechnic University Ph.D. scholarships (project #RTUP). This study is partly supported by 773
the Public Policy Research Funding Scheme (2013.A6.012.13A), Hong Kong PolyU internal 774
grant (87UB) and the National Natural Science Foundation of China (No. 41405112). 775
References 776
Barletta, B., Meinardi, S., Simpson, I.J., Khwaja, H.A., Blake, D.R., and Rowland, F.S.: Mixing 777
ratios of volatile organic compounds (VOCs) in the atmosphere of Karachi, Pakistan, Atmos. 778
Environ., 36, 3429-3443, 2002. 779
Blake, D.R. and Rowland, F.S.: Urban Leakage of Liquefied Petroleum Gas and Its Impact on 780
Mexico City Air Quality, Science, 269, 953-956, 1995. 781
Borbon, A., Locoge, N., Veilerot, M., Galloo, J.C., and Guillermo, R.: Characterization of 782
NMHCs in a French urban atmospheric: overview of the main sources, Sci. Total Environ., 292, 783
177-191, 2002. 784
Brown, S.G., Frankel, A., and Hafner, H.R.: Source apportionment of VOCs in Los Angeles area 785
using positive matrix factorization, Atmos. Environ., 41, 227-237, 2007. 786
Carter, W.L., and Atkinson, R.: Computer modeling study of incremental hydrocarbon reactivity, 787
Environ. Sci. Tech., 23, 864-880, 1989. 788
Chan, C.Y., and Chan, L.Y.: Effect of meteorology and air pollutant transport on ozone episodes 789
at a subtropical coastal Asian city, Hong Kong, J. Geophys. Res., 105, 20,707-20,724, 2000. 790
Cheng, H.R., Guo, H., Wang, X.M., Saunders, S.M., Lam, S.H.M., Jiang, F., Wang, T., Ding, A., 791
Lee, S.C., and Ho, K.F.: On the relationship between ozone and its precursors in the Pearl 792
River Delta: application of an observation-based model (OBM), Environ. Sci. Pollut. Res., 17, 793
547-560, 2010. 794
Chikhi, S., Boughedaoui, M., Kerbachi, R., and Joumard, R.: On-board measurement of 795
emissions from liquefied petroleum gas, gasoline and diesel powered passenger cars in Algeria, 796
J. Environ. Sci., 26, 1651-1659, 2014. 797
Ciccone, G., Forastiere, F., Agabiti, N., Biggeri, A., Bisanti, L., Chellini, E., Corbo, G., 798
Dell'Orco, V., Dalmasso, P., Volante, T.F., Galassi, C., Piffer, S., Renzoni, E., Rusconi, F., 799
Sestini, P., and Viegi, G.: Road traffic and adverse respiratory effects in children, J. Occup. 800
Environ. Med., 55, 771-778, 1998. 801
37
Farmer, D.K., Perring, A.E., Wooldridge, P.J., Blake, D.R., Baker, A., Meinardi, S., Huey, L.G., 802
Tanner, D., Vargas, O., and Cohen, R.C.: Impact of organic nitrates on urban ozone production, 803
Atmos. Chem. Phys., 11, 4085-4094, 2011. 804
Gamas, E.D., Diaz, L., Rodriguez, R., Lopez-Salinas, E., and Schifter, I.: Exhaust emissions 805
from gasoline- and LPG-powered vehicles operating at the altitude of Mexico city, J. Air 806
Waste Manage., 49, 1179-1189, 1999. 807
Guo, H., Cheng, H.R., Ling, Z.H., Louie, P.K.K., and Ayoko, G.A.: Which emission sources are 808
responsible for the volatile organic compounds in the atmosphere of Pearl River Delta?, J. of 809
Hazard. Mater., 188, 116-124, 2011a. 810
Guo, H., Jiang, F., Cheng, H.R., Simpson, I.J., Wang, X.M., Ding, A.J., Wang, T.J., Saunders, 811
S.M., Wang, T., Lam, S.H.M., Blake, D.R., Zhang, Y.L., and Xie, M.: Concurrent observations 812
of air pollutants at two sites in the Pearl River Delta and the implication of regional transport, 813
Atmos. Chem. Phys., 9, 7343-7360, 2009. 814
Guo, H., So, K.L., Simpson, I.J., Barletta, B., Meinardi, S., and Blake, D.R.: C1-C8 volatile 815
organic compounds in the atmosphere of Hong Kong: Overview of atmospheric processing and 816
source apportionment, Atmos. Environ., 41, 1456-1472, 2007. 817
Guo, H., Wang, T., and Louie, P.K.K.: Source apportionment of ambient non-methane 818
hydrocarbons in Hong Kong: Application of a principal component analysis/absolute principal 819
component scores (PCA/APCS) receptor model, Environ. Pollut., 129, 489-498, 2004. 820
Guo, H., Wang, T., Blake, D.R., Simpson, I.J., Kwok, Y.H., and Li, Y.S.: Regional and local 821
contributions to ambient non-methane volatile organic compounds at a polluted rural/coastal 822
site in Pearl River Delta, China, Atmos. Environ., 40, 2345-2359, 2006. 823
Guo, H., Zou, S.C., Tsai, W.Y., Chan, L.Y., and Blake, D.R.: Emission characteristics of non-824
methane hydrocarbons from private cars and taxis at different driving speeds in Hong Kong, 825
Atmos. Environ., 45, 2711-2721, 2011b. 826
HKCSD (Hong Kong Census and Statistics Department), 2010. Hong Kong Energy Statistics: 827
Annual Report. http:// www.censtatd.gov.hk. 828
HKEPD (Hong Kong Environmental Protection Department) (2014). Air quality in Hong Kong 829
2013. (Available at http://www.aqhi.gov.hk/en/download/air-quality-reportse469.html?showall 830
=&start=1). 831
Ho, K.F., Lee, S.C., Cao, J.J., Chow J.C., Watson, J.G., and Chan, C.K.: Seasonal variations and 832
mass closure analysis of particulate matter in Hong Kong, Sci. Total Environ., 355, 276-287, 833
2006. 834
Ho, K.F., Lee, S.C., Guo, H., and Tsai, W.Y.: Seasonal and diurnal variations of volatile organic 835
compounds (VOCs) in the atmosphere of Hong Kong, Sci. Total Environ., 322, 155-166, 2004. 836

38
Ho, K.F., Lee, S.C., Ho, W.K., Blake, D.R., Cheng, Y., Li, Y.S., Ho, S.S.H., Fung, K., Louie, 837
P.K.K., and Park, D.: Vehicular emission of volatile organic compounds (VOCs) from a tunnel 838
study in Hong Kong, Atmos. Chem. Phys., 9, 7491-7504, 2009. 839
Huang, J.P., Fung, J.C.H., Lau, A.K.H., and Qin, Y.: Numerical simulation and process analysis 840
of typhoon-related O3 episodes in Hong Kong, J. Geophys. Res., 110, D05301, 841
doi:10.1029/2004JD004914, 2005. 842
Huang, J.P., Fung, J.C.H. and Lau, A.K.H.: Integrated processes analysis and systematic 843
meteorological classification of ozone episodes in Hong Kong, J. Geophys. Res., 111, D20309, 844
doi:10.1029/2005JD007012, 2006. 845
Jiang, F., Wang, T.J., Wang, T.T., Xie, M., and Zhao, H.: Numerical modeling of a continuous 846
photochemical pollution episode in Hong Kong using QRF-chem, Atmos. Environ., 42, 8717-847
8727, 2008. 848
Lam, K.S., Wang, T.J., Wu, C.L., and Li, Y.S.: Study on an ozone episode in hot season in Hong 849
Kong and transboundary air pollution over Pearl River Delta region of China, Atmos. Environ., 850
39, 1967-1977, 2005. 851
Lam, S.H.M., Saunders, S.M., Guo, H., Ling, Z.H., Jiang, F., Wang, X.M., and Wang, T.J.: 852
Modelling VOC source impacts on high ozone episode days observed at a mountain summit in 853
Hong Kong under the influence of mountain-valley breezes, Atmos. Environ., 81, 166-176, 854
2013. 855
Lai, C.H., Chang, C.C., Wang, C.H., Shao, M., Zhang, Y.H., and Wang, J.L.: Emissions of 856
liquefied petroleum gas (LPG) from motor vehicles, Atmos. Environ., 43, 1456-1463, 2009. 857
Lau, A.K.H., Yuan, Z.B., Yu, J.Z., and Louie, P.K.K.: Source apportionment of ambient volatile 858
organic compounds in Hong Kong, Sci. Total Environ., 408, 4138-4149, 2010. 859
Lau, J., Hung, W.T., and Cheung, C.S.: On-board gaseous emissions of LPG taxis and estimation 860
of taxi fleet emissions, Sci. Total Environ., 409, 5292-5300, 2011. 861
Lee, E., Chan, C.K., and Paatero, P.: Application of positive matrix factorization in source 862
apportionment of particulate pollutants in Hong Kong, Atmos. Environ., 33, 3201-3212, 1999. 863
Lee, S.C., Chiu, M.Y., Ho, K.F., Zou, S.C., and Wang, X.M.: Volatile organic compounds 864
(VOCs) in urban atmosphere of Hong Kong, Chemosphere, 48, 375-382, 2002. 865
Ling, Z.H. and Guo, H.: Contribution of VOC sources to photochemical ozone formation and its 866
control policy implication in Hong Kong, Environ. Sci. Policy, 38, 180-191, 2014. 867
Ling, Z.H., Guo, H., Cheng, H.R., and Yu, Y.F.: Sources of ambient volatile organic compounds 868
and their contributions to photochemical ozone formation at a site in the Pearl River Delta, 869
southern China, Environ. Pollut. 159, 2310-2319, 2011. 870

39
Ling, Z.H., Guo, H., Lam, S.H.M., Saunders, S.M., and Wang, T.: Atmospheric photochemical 871
reactivity and ozone production at two sites in Hong Kong: Application of a Master Chemical 872
Mechanism-photochemical box model, J. Geophys. Res. Atmos., 119, 10,567-10,582, 873
doi:10.1002/ 2014JD021794, 2014. 874
Ling, Z.H., Guo, H., Zheng, J.Y., Louie, P.K.K., Cheng, H.R., Jiang, F., Cheung, K., Wong, L.C., 875
and Feng, X.Q.: Establishing a conceptual model for photochemical ozone pollution in 876
subtropical Hong Kong, Atmos. Environ. 76, 208-220, 2013. 877
Liu, Y., Shao, M., Lu, S.H., Chang, C.C., Wang, J.L., and Fu, L.L.: Source apportionment of 878
ambient volatile organic compounds in the Pearl River Delta, China: Part II, Atmos. Environ., 879
42, 6261-6274, 2008. 880
Lou, S., Holland, F., Rohrer F., Lu, K., Bohn, B., Brauers, T., Chang, C.C., Fuchs, H., Haseler, 881
R., Kita, K., Kondo, Y., Li, X., Shao, M., Zeng, L., Wahner, A., Zhang, Y., Wang, W., and 882
Hofzumahaus, A.: Atmospheric OH reactivities in the Pearl River Delta - China in summer 883
2006: measurement and model results, Atmos. Chem. Phys., 10, 11243-11260, 2010. 884
Lu, K.D., Rohrer F., Holland, F., Fuchs, H., Bohn, B., Brauers, T., Chang, C.C., Haseler, R., Hu, 885
M., Kita, K., Kondo, Y., Li, X., Lou, S.R., Nehr, S., Shao, M., Zeng, L.M., Wahner, A., Zhang, 886
Y.H., and Hofzumahaus, A.: Observation and modelling of OH and HO2 concentrations in the 887
Pearl River Delta 2006: a missing OH source in a VOC rich atmosphere, Atmos. Chem. Phys., 888
12, 1541-1569, 2012. 889
Madronich, S., and Flocke, S.: Theoretical estimation of biologically effective UV radiation at 890
the Earth’s surface, In: Zerefos, C. (Ed.), Solar Ultraviolet Radiation-Modeling, Measurements 891
and Effects, NATO ASI Series, vol. I52. Springer-Verlag, Berlin, 1997. 892
Martien, P.T., Harley, R.A., Milford, J.B., and Russell, A.G.: Evaluation of incremental 893
reactivity and its uncertainty in Southern California, Environ. Sci. Technol., 37, 1598-1608, 894
2003. 895
Myung, C.L., Kim, J., Choi, K., Hwang, I.G., and Park, S.: Comparative study of engine control 896
strategies for particulate emissions from direct injection light-duty vehicle fueled with gasoline 897
and liquid phase liquefied petroleum gas (LPG), Fuel, 94, 348-355, 2012. 898
Ou, J.M., Guo, H., Zheng, J.Y., Cheung, K., Louie, P.K.K., Ling, Z.H., and Wang, D.W.: 899
Concentrations and sources of non-methane hydrocarbons (NMHCs) from 2005 to 2013 in 900
Hong Kong: A multi-year real-time data analysis, Atmos. Environ., 103, 196-206, 2015. 901
Paatero, P., and Tapper, U.: Positive matrix factorization: A non-negative factor model with 902
optimal utilization of error estimates of data values, Environmetrics, 5, 111-126, 1994. 903
Paatero, P.: Least squares formulation of robust non-negative factor analysis, Chemom. Intell. 904
Lab. Sys., 37, 23-35, 1997. 905

40
Ren, X.R., Harder, H., Martinez, M., Lesher, R.L., Oliger, A., Simpas, J.B., Brune, W.H., 906
Schwab, J.J., Demerjian, K.L., He, Y., Zhou, X.L., Gao, H.L.: OH and HO2 chemistry in the 907
urban atmosphere of New York City, Atmos. Environ., 37, 3639-3651, 2003. 908
Ruellan, S. and Cachier, H.: Characterisation of fresh particulate vehicular exhausts near a Paris 909
high flow road, Atmos. Environ., 35, 453-468, 2001. 910
Schifter, I., Diaz, L., Lopez-Salinas, E., Rodriguez, R., Avalos, S., Guerrero, V.: An evaluation 911
of the LPG vehicles program in the metropolitan area of Mexico city, J. Air Waste Manage., 50, 912
301-309, 2000. 913
So, K.L. and Wang, T.: On the local and regional influence on ground-level ozone 914
concentrations in Hong Kong, Environ. Pollut., 123, 307-317, 2003. 915
Takekawa, H., Chatani, S., and Akiyoshi, I.: A new approach for estimation of the effect of NOx 916
emission reduction on roadside NO2 concentration in Tokyo, Atmos. Environ., 68, 92-102, 917
2013. 918
Wang, T., Guo, H., Blake, D.R., Kwok, Y.H., Simpson, I.J., and Li, Y.S.: Measurements of trace 919
gases in the inflow of South China Sea background air and outflow of regional pollution at Tai 920
O, southern China, J. Atmos. Chem. 52, 295-317, 2005. 921
Wang, T., Wei, X.L., Ding, A.J., Poon, C.N., Lam, K.S., Li, Y.S., Chan, L.Y., and Anson, M.: 922
Increasing surface ozone concentrations in the background atmosphere of Southern China, 923
1994-2007, Atmos. Chem. Phys., 9, 6217-6227, 2009. 924
Wang, T.J., Lam, K.S., Xie, M., Wang, X.M., Carmichael, G., and Li, Y.S.: Integrated studies of 925
a photochemical smog episode in Hong Kong and regional transport in the Pearl River Delta of 926
China, Tellus B, 58, 31-40, 2006. 927
Xie, S.D., Zhang, Y.H., Li, Q., and Tang, X.Y.: Spatial distribution of traffic-related pollutant 928
concentrations in street canyons, Atmos. Environ., 37, 3213-3224, 2003. 929
Zhang, J., Wang, T., Chameides, W. L., Cardelino, C., Kwok, J., Blake, D. R., Ding, A. J., and 930
So, K. L.: Ozone production and hydrocarbon reactivity in Hong Kong, Southern China, Atmos. 931
Chem. Phys., 7, 557-573, 2007. 932