title : a study of multicultural practices in sri lankan...
TRANSCRIPT

Title : a study of multicultural practices in Sri Lankan secondary schools and an English comparator school Name: Lanka Nilmini Priyadarshani Wedikandage
This is a digitised version of a dissertation submitted to the University
of Bedfordshire.
It is available to view only.
This item is subject to copyright.

A STUDY OF MULTICULTURAL PRACTICES IN SRI LANKAN
SECONDARY SCHOOLS AND AN ENGLISH COMPARATOR SCHOOL
Lanka Nilmini Priyadarshani Wedikandage
A thesis submitted to the University of Bedfordshire, in partial fulfilment of
the requirements for the degree of Doctor of Philosophy
2014

iii
Abstract
This study investigated stakeholders’ views of multicultural policies and practices in
multicultural secondary schools in Sri Lanka and a comparator school in England, in
order to elicit what new insights could be gained that could lead to educational
improvements in Sri Lankan schools. Specifically, students and staff in five Sinhala-
medium secondary schools in the Colombo region, all with reputations for good
multicultural education practice, together with local community leaders and national
policy makers, were interviewed. A series of questionnaires was designed to examine a
wide range of stakeholder perspectives across these five schools, using as a conceptual
framework Banks’s (1986, 1989 and 2004) international work on multicultural policy and
practice in schools and teacher education. A similar interview schedule and questionnaire
were used to elicit views and experiences of multicultural education in a comparator
school in an urban area of the East of England. There were a number of reasons for this.
The modern school system of Sri Lanka had its beginnings during the British colonial
administration. Now that there is peace in Sri Lanka after a long period of civil war, the
government is focusing on ways to develop the curriculum to integrate multicultural
education into its peace education curriculum in order to foster intercultural
understandings. England has a longer tradition in multicultural education and policies in
its education system. Using Banks’s work (op. cit.) for analysis, there may therefore be
lessons to be drawn from the Sri Lankan schools identified as having good multicultural
practice and the English experience that are of use in Sri Lanka.
Major findings from this research project include the need for careful consideration of
ways to foster greater multilingual competence among both teachers and students if Sri
Lanka is to reach its goal of greater intercultural understandings and communication
between the various ethnic groups. It seems from this study that, in Sri Lanka, whilst
there were some differences in the strength of perception of different ethnic groups of
students, overall they felt comfortable and safe in school, which is a testament to
government efforts to achieve harmony in schools and, thus, social cohesion in society.
However, some groups of students are more advantaged than others in the same schools
in their access to the acquisition of languages and, therefore, access to the curriculum and
to further and higher education and future enhanced life chances. The teachers
acknowledged that language was a major concern in multicultural classrooms, partly
because some students could not communicate effectively in Sinhala medium, and partly
because they themselves were not always fluent in both national languages. Further,

iv
despite central government policy that all secondary teachers in Sri Lanka should be
trained to degree level and should be qualified in their profession, the highest
qualification that nearly one half possessed was A-level General Certificate of Education.
All teachers in both Sri Lankan, and the English comparator, schools expressed a wish for
training in multicultural practices.

v
Declaration I declare that this thesis is my own unaided work. It is being submitted for the degree of Doctor of Philosophy at the University of Bedfordshire.
It has not been submitted before for any degree or examination in any other University.
Name of Candidate: Lanka Nilmini Priyadarshani Wedikandage
Signature:
Date: 24-10-2014

vi
Contents
Abstract iii
Acknowledgements ix
Chapter 1: Introduction 1
1.0 Introduction 1
1.1 Why examine multicultural education? 1
1.2 The purpose of the study 12
1.3 Research questions 13
1.4 Participants 13
1.5 Research instruments 14
1.6 Structure of thesis 14
Chapter 2: Background Information 15
2.0 Introduction 15
2.1 Sri Lanka 15
2.2 England 28
2.3 Chapter summary 32
Chapter 3: Literature review 33
3.0 Introduction 33
3.1 Social cohesion 33
3.2 Multicultural education 36
3.3 Education for social cohesion in multicultural societies in Sri Lanka 38
3.4 Multicultural education policies in Sri Lanka from 1948 to the present 39
3.5 Concerns about Sri Lankan multicultural policy and practice 53
3.6 Multicultural education policy in England 55
3.7 Criticism of multicultural education 61
3.8 Chapter summary 62
Chapter 4: Research Methodology 63

vii
4.0 Introduction 63
4.1 Participant sample 63
4.2 Areas investigated 68
4.3 Research design 73
4.4 Data Analysis 85
4.5 Ethical considerations 86
4.6 Chapter summary 87
Chapter 5: Results and analysis. Part 1: teacher training, professional development and
language issues 89
5.0 Introduction 89
5.1 Students’ backgrounds 89
5.2 Teachers’ backgrounds 90
5.3 Teacher attitudes and professional development 91
5.4 Language issues 98
5.5 Chapter summary 107
Chapter 6: Results and analysis. Part 2: multicultural education and inclusion in schools
109
6.0 Introduction 109
6.1 School ethos 109
6.2 Classroom practices 127
6.3 Feelings of belonging 130
6.4 Support for students 131
6.5 Equity and fairness 134
6.6 Attainment and progression 136
6.7 Curriculum 138
6.8 Challenges in maintaining effective multicultural education 147
6.9 Chapter summary 148

viii
Chapter 7: Recommendations and conclusions 149
7.0 Introduction 149
7.1 Sri Lanka 149
7.2 England 152
7.3 Recommendations 154
7.4 Conclusion 166
7.5 Contribution to knowledge 166
7.6 Evaluation of research 169
7.7 Conclusion 171
References 173
Appendices 182
Appendix A: Background information on Sri Lanka and England 182
Appendix B: Information on the education systems of Sri Lanka and England 196
Appendix C: Templates for data collection tools 200
Appendix D: Statistical analysis of students’ data in five schools in Sri Lanka 220
Appendix E: Statistical analysis of student data by gender in Sri Lanka 245
Appendix F: Statistical analysis of student data by age in Sri Lanka 254
Appendix G: Statistical analysis of student data in England 259
Appendix H: Statistics analysis of student data by gender in England 266
Appendix J: Statistical analysis of teacher data in Sri Lanka 268
Appendix K: Statistical analysis of teacher data in England 286

ix
Acknowledgements
It would not have been possible to write this doctoral thesis without the help and
support of the kind people around me, to only some of whom of it is possible to
give particular mention here.
This thesis would not have been possible without the support and patience of my
Director of Studies, Professor Janice Wearmouth, and my Co-Supervisor
Professor Uvanney Maylor. The good advice, support and friendship of them have
been invaluable on both an academic and personal level, for which I am extremely
grateful.
I would like to acknowledge the financial support of the National Centre for
Advanced Studies in Humanities and Social Science (NCAS), the University of
Colombo and the University of Bedfordshire that provided the necessary financial
support for this research.
I want to express my gratitude to all respondents in Sri Lanka and England.
I would like to thank my father Piyadasa Wedikandage and my mother
Amarawathi Midigaspege for their personal support and great patience at all
times.
Finally, I would like to dedicate this thesis to my only son, Chalana Bingusara
Ranasinghe and my husband Ramesh Ranasinghe.

1
Chapter 1: Introduction
1.0 Introduction
Pluralist societies have diverse ethnic, religious, linguistic and cultural groups living
together. Colonization, immigration, regionalization and travel for education and
employment purposes have resulted in increasingly multicultural societies in many
countries over the past decades. Hixson (1991) explains that students bring to school
racial and ethnic heritage with a wide range of histories, perspectives, experiences,
expectations and approaches to learning. Multicultural educational policies have
therefore become a regular part of education for many countries in the world. Abdullah
and Ghaffar (undated) comment that multicultural education is an approach to teaching
and learning that is based on democratic values and beliefs. Multicultural education
programmes should demonstrate understanding and respect students’ differences in the
school (Abdullah and Ghaffar, undated). Some writers Gay, (1994), for example in the
USA, have identified challenges arising from efforts to create a national education system
that offers equality of access and opportunity whilst simultaneously maintaining respect
for religious, linguistic and cultural difference. For many groups with different ethnic and
cultural backgrounds who live together in close proximity, the maintenance of cultural
identity is a high priority for all concerned. At the same time the maintenance of cultural
identities within a society, without the emergence of mutually accepted values, pushes
towards separation and not unity, for example, as seen in the instances of civil unrest
between different ethnic groups in England in Notting Hill in 1958
(http://news.bbc.co.uk/1/hi/uk/4270010.stm, accessed 12th November 2012; Sabater and
Finney 2010). Promoting such mutually accepted values is one of the reasons why
multicultural education was promoted in the first place.
1.1 Why examine multicultural education?
When planning multicultural educational programmes for schools, it is important to
consider different conceptions of what this comprises. Table 1.1 below shows the most
commonly used definitions of multicultural education.

2
Table 1.1: Definitions of multicultural education
Considering these definitions we can surmise that multicultural education should
incorporate all students, regardless of their ethnic, racial, cultural, gender and social class
and all should have an equal opportunity to learn and achieve in school.
1.1.1 Multicultural education in the United States of America This study sets out to examine multicultural education in two countries that have
experienced issues of inter-group conflict associated with immigration, colonialism settler
policies, and so on. In this circumstance it can be very instructive to investigate the
development of education policies designed to facilitate social cohesion in a country, the
United States that has a long history of grappling with many of the same issues. In the
United States, for example, numbers of educators (see below) have developed
frameworks for establishing principals for evaluating the effectiveness of multicultural
education, curriculum development and so on.
A large number of African Americans moved to northern and western cities of America
to obtain jobs in war-related industries in the period of World War 11. Many southern
Whites and Mexicans also settled in the U.S.A. in the same period. Conflict developed
among African Americans and Whites and Mexican Americans and Anglo Americans,
who competed for housing and jobs. The result was that thirty four people were killed in a
Detroit riot in 1943 and a ‘zoot suit’1 riot occurred in Los Angeles among Mexican
Americans and Anglo Americans in the same year. These racial incidents stunned
American leaders to such an extent that they decided something had to be done to reduce
the tensions in American society. Racial tensions that led education to try to reduce
1 ‘Zoot suit’ refers to the type of suit popular amongst African-American men at the time.
Policies and practices that show respect for cultural diversity through educational philosophy,
staffing composition and hierarchy, instructional materials, curricular, and evaluation ( Frazier,
1977; Grant, 1977)
An approach to teaching and learning based upon democratic values that foster cultural
pluralism; in its most comprehensive form, it is a commitment to achieving educational
equality, developing curricula that build understanding about ethnic groups, and combating
oppressive practices (Bannett, 1990)
An ongoing process that requires long term investments of time and effort as well as carefully
planned and monitored actions (Banks and Banks, 1993)
Adapted from Gay (1994, p.2)

3
tension through multicultural education in Sri Lanka and England are outlined in chapter
2 below.
Educators in the U.S.A. responded to politicians by creating a movement to improve race
relations through schools, colleges and university programmes that became known as
‘inter-group or intercultural education’ in the 1940s (Taba and Van Til, 1945). Grant and
Chapman (2008) explained that a major goal of inter group education was to reduce racial
and ethnic prejudice with interventions such as teaching units about minority groups,
assemblies and cultural get-togethers and the banning of books considered stereotypical
and that knowledge about ethnic groups would help students to develop more positive
racial attitudes. However, inter-group education did not succeed in the USA at the time
because it was not institutionalized in the mainstream of American education (Grant and
Chapman, op. cit.).
The civil rights movement of the 1960s and 1970s directly influenced multicultural
educational movements in the USA.Taba and Van Til, (1945) noted that many of the
approaches and techniques used in prejudice-reduction activities in multicultural
education are closely linked to experiences that were part of inter-group education.
Schools, universities, and textbook publishers implemented a number of reforms in
response to demands made by the African American community and schools hired more
black teachers and administrators. The movement in civil rights continued to expand in
the USA. As a result, multicultural education has also increased in the field of education.
Banks (1989, 1994, and 2006) is well-known across the world for his work in
multicultural education. He formulated guidelines for multicultural education which
identify and clarify principles as a basis for decisions by teachers in their schools and
classrooms about the shape and content of a systemic whole school approach to
multicultural education. Banks’s guidelines, cited by Lynch (1986, pp. 90-91) for
multicultural education are as follows:
1. Permeation of the total school environment in ethnic pluralism; 2. School policies and procedures which foster positive multi-ethnic interactions
and understanding among students, teachers and other staff; 3. Reflection in the school staff of the ethnic pluralism of society; 4. Systematic, comprehensive, mandatory and continuing staff development
programmes; 5. Inclusion of learning styles of the students in the curriculum; 6. Provision of opportunities for students to develop a better sense of self; 7. Assistance with understanding the experience of ethnic groups; 8. Awareness of the conflict between ideals and realities in human societies; 9. Exploration and clarification of the ethnic alternatives and options within
society; 10. Promotion of values, attitudes and behaviours that support ethnic pluralism;
4
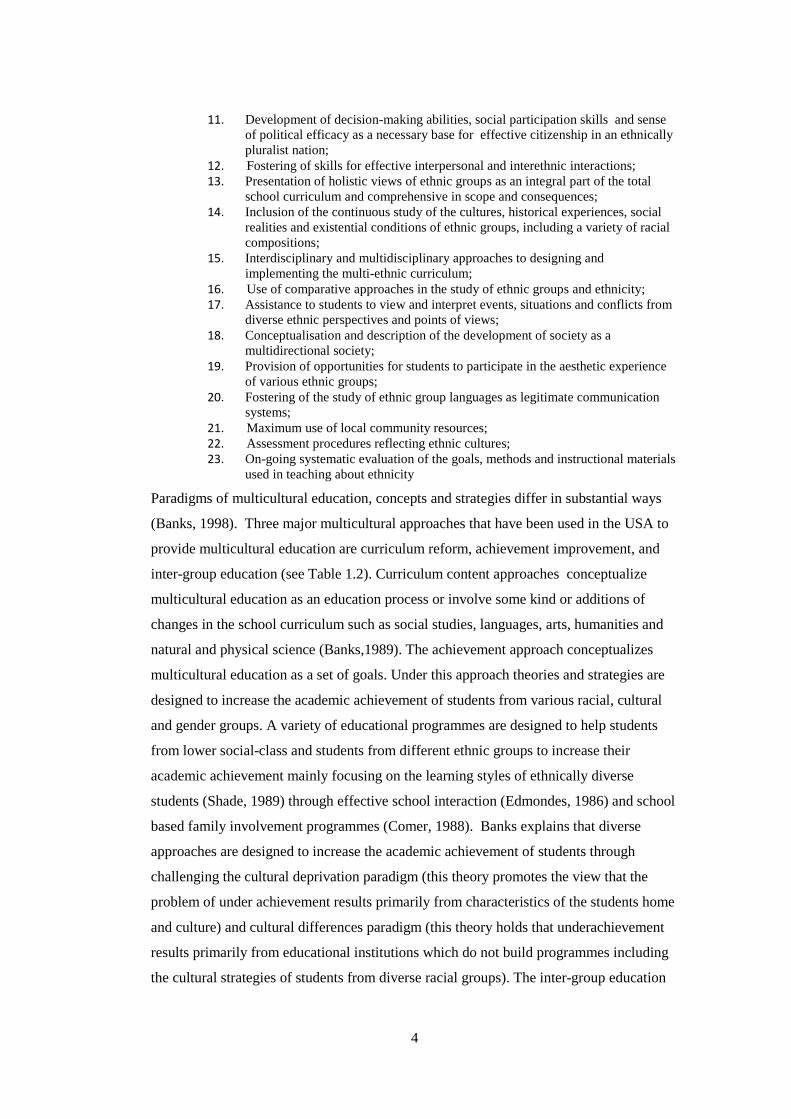
11. Development of decision-making abilities, social participation skills and sense of political efficacy as a necessary base for effective citizenship in an ethnically pluralist nation;
12. Fostering of skills for effective interpersonal and interethnic interactions; 13. Presentation of holistic views of ethnic groups as an integral part of the total
school curriculum and comprehensive in scope and consequences; 14. Inclusion of the continuous study of the cultures, historical experiences, social
realities and existential conditions of ethnic groups, including a variety of racial compositions;
15. Interdisciplinary and multidisciplinary approaches to designing and implementing the multi-ethnic curriculum;
16. Use of comparative approaches in the study of ethnic groups and ethnicity; 17. Assistance to students to view and interpret events, situations and conflicts from
diverse ethnic perspectives and points of views; 18. Conceptualisation and description of the development of society as a
multidirectional society; 19. Provision of opportunities for students to participate in the aesthetic experience
of various ethnic groups; 20. Fostering of the study of ethnic group languages as legitimate communication
systems; 21. Maximum use of local community resources; 22. Assessment procedures reflecting ethnic cultures; 23. On-going systematic evaluation of the goals, methods and instructional materials
used in teaching about ethnicity
Paradigms of multicultural education, concepts and strategies differ in substantial ways
(Banks, 1998). Three major multicultural approaches that have been used in the USA to
provide multicultural education are curriculum reform, achievement improvement, and
inter-group education (see Table 1.2). Curriculum content approaches conceptualize
multicultural education as an education process or involve some kind or additions of
changes in the school curriculum such as social studies, languages, arts, humanities and
natural and physical science (Banks,1989). The achievement approach conceptualizes
multicultural education as a set of goals. Under this approach theories and strategies are
designed to increase the academic achievement of students from various racial, cultural
and gender groups. A variety of educational programmes are designed to help students
from lower social-class and students from different ethnic groups to increase their
academic achievement mainly focusing on the learning styles of ethnically diverse
students (Shade, 1989) through effective school interaction (Edmondes, 1986) and school
based family involvement programmes (Comer, 1988). Banks explains that diverse
approaches are designed to increase the academic achievement of students through
challenging the cultural deprivation paradigm (this theory promotes the view that the
problem of under achievement results primarily from characteristics of the students home
and culture) and cultural differences paradigm (this theory holds that underachievement
results primarily from educational institutions which do not build programmes including
the cultural strategies of students from diverse racial groups). The inter-group education

5
approach helps all students to develop more positive attitudes towards different racial,
gendered and disabled groups (Lynch, 1986). Table 1.2 shows a summary of the aims and
practices of the three approaches adapted from the work of Banks (1994).

6
Table 1.2: Summary of aims and practices of three multicultural approaches in the USA
(Adapted from Banks, 1994, p.9)
Approach Description Major goals Examples of practice
Curriculum Reform Revision of curriculum
content or addition of
new content
Inclusion of content on
different cultural groups
in the curriculum in
order to develop the
ability of viewing
curriculum content from
a new perspective
Important dates and
celebrations to honour
heroes in a culture.
Preparation of multi-
cultural handbooks and
multi-cultural content.
Workshops for teachers
and administrators.
Addition of multi-
cultural content to
textbooks.
Achievement Students from lower
social classes, girls and
disabled students.
Presentation of
application of theories
and strategies to
improve academic
achievement of these
groups.
Improvement of
academic achievement
levels of different groups
that vary according to
ethnicity, cultural and
gender status
Programmes prepared to
suit different learning
styles, bi-lingual, bi-
cultural education
programmes.
Programmes
incorporating languages
and culture of Afro-
American children.
Special Science and
Mathematics
programmes for girls.
Inter-group education Preparation of
knowledge, subject
content and procedures
to develop democratic
inter-group attitudes and
values.
Supporting development
of positive attitudes in
students towards
different ethnic, cultural
and gender groups.
Appointment of
members of opposed and
discriminated groups to
develop positive
attitudes towards their
own cultural groups.
Projects to eliminate
prejudice towards each
other. Programmes like
the ‘Changing World’.
Integrated classrooms
and programmes
following techniques to
develop mutual
cooperation.

7
Banks (1989) identified that multicultural education consists of at least three elements:
(a) an idea or concept
(b) educational reform movement, and
(c) a process.
As an idea, multicultural education espouses the notion that male and female students,
students from diverse racial, ethnic and social class groups and students with disabilities,
should have an equal opportunity to learn in schools, colleges and universities. As an
educational reform movement multicultural education tries to create better equal
educational opportunity for all students by changing the school environment and
reflecting the different cultures and ethnic groups in a society and in the classroom. This
understanding led Banks to the view that achieving an equal opportunity to learn from
diverse backgrounds requires reform of the education system. Multicultural education is
also a process whose major aim is to change the social structure and culture of
educational institutions, so that students from all groups will have an equal opportunity to
experience academic success.
Over the years Banks has proposed a number of goals in multicultural education for
example:
• to increase the academic achievement of all students, aid students in developing a
more positive attitude toward different cultural, racial, ethnic, and religious
groups, assist students from victimised groups develop confidence in their
academic ability and influence upon societal institutions, and encourage all
students to consider the perspectives of other groups (Riskowski and Olbricht,
2010, p.2).
• to help individuals from diverse racial, cultural, language and religious groups to
acquire the knowledge, attitudes, and skills needed to function effectively within
their cultural communities, the national civic, their regional culture and global
community (Banks, 1994). However, historically most nation-states have
required their citizens to experience cultural assimilation into the national culture
(see Table 1.3).
• to provide all students with the skills and knowledge needed to function within
students’ communities, cultures, the mainstream and other ethnic cultures (Banks,
1994).

8
• to help individuals gain greater self-understanding by viewing themselves from
the perspectives of other cultures and providing students with cultural, ethnic, and
language alternatives and, to reduce the discrimination that members of the same
ethnic groups experience because of their racial and cultural characteristics
(Banks, 2008).
• to helps students gain knowledge, skills, and values needed to function
effectively within their cultural communities and global community (Banks,
2008).
In multicultural societies, educators have looked at various ideologies underpinning
approaches to national policy approaches to education. Banks (1981) tabulated three of
these. His summary reveals some issues which education policy makers and educators in
schools have wrestled with at different times and places:
Table 1.3: Ideologies associated with education in multi-ethnic societies (Adapted from
Banks, 1981, p.123)
Cultural pluralist ideology Multi-ethnic ideology Assimilationist ideology
Separatism Open society multiculturalism Total integration
Primordial particularistic Universalized-primordialism Universalistic
Minority emphasis Minorities and majorities have
rights
Majoritarian emphasis
Group rights are primary Limited rights of the group and
the individual
Individual rights are primary
Common ancestry and
heritage unifies
Ethnic attachments and
ideology of common civic
culture complete for
allegiances of individuals
Ideology of the common
culture unifies
A comparison between two of these ideologies, cultural pluralist and assimilationist,
indicates very clearly some of the conflicts between them. For example, should all pupils
be integrated into one common system with common approaches that reflect the culture
of the majority, or separately, in their own cultural groups, where their own cultural
concerns are dominant?

9
As well as ideologies Banks identified a range of research assumptions associated with
education in multicultural societies. Research assumptions, curricula consequent on these
assumptions, and the attributes of teachers that follow from these assumptions serve to
exemplify why it is important to recognise the particular ideology underpinning particular
approaches to education in a multi- ethnic society.
Table 1.4: Research assumptions associated with education in multi-ethnic societies
(Adapted from: Banks, 1981, p.123)
Ethnic pluralistic ideology (Research Assumption)
Multi-ethnic ideology (Research Assumption)
Assimilationist ideology (Research Assumption)
Ethnic minority cultures are well-ordered, highly structured but different (language, values, behaviour, etc.)
Ethnic minority cultures have some unique cultural characteristics; however minority and majority groups share many cultural traits, values and behaviour styles
Sub cultural groups with characteristics that make its members function unsuccessfully in the common culture are deprived, pathological, and lack needed functional characteristics
Cultural difference research model
Multicultural research model Social pathology research model and/or genetic research model
Minorities have a unique learning style
Minorities have some unique learning style but share many learning characteristics with other groups
Human learning style and characteristics are universal
Curriculum Curriculum Curriculum
Use materials and teaching styles that are culture specific. The goal of the curriculum should be to help students function more successfully within their own ethnic cultures and help liberate their ethnic groups from oppression
The curriculum should respect the ethnicity of the child and use it in positive ways; the goal of the curriculum should be to help students learn how to function effectively within the common culture, their ethnic culture and other ethnic cultures
Use material and teaching styles related to the common culture; the curriculum should help the students develop a commitment to the common civic culture and its idealized ideologies
Teacher Teacher Teacher
Minority students need skilled teachers of their same race and ethnicity for role models, to learn more effectively and to develop more positive self-concepts and identities
Students need skilled teachers who are very knowledgeable about, and sensitive to, their ethnic cultures and cognitive styles
A skilled teacher who is familiar with learning theories and is able to implement those theories effectively is a good teacher for any group of students regardless of their ethnicity, race or social class. The goal should be to train good teachers of students.
It is clear from this tabulated summary of ideologies and assumptions that
assimilationism (as mentioned in Table 1.4) derives from a pathological view of
perceived deficiencies in minority groups that need to be rectified by reference to the
dominant group(s) in society. This is in opposition to a cultural pluralist ideology that
views each group as having its own structure and order and has, as a prime function, a

10
goal of liberating minorities from the oppression of dominant groups. The latter requires
teachers from the same ethnic backgrounds as students to support the development of
positive cultural identities. Assimilationism requires teachers skilled and knowledgeable
about learning theory generally.
What Banks (1981) calls a ‘multi-ethnic’ ideology, however appears to attempt to
reconcile aspects of the other two ideologies (see Table 1.3). Overall, this ideology
provides one useful means of analysing some of the policies, and curriculum and
practices apparent in Sri Lanka and England.
Following Banks, Lynch (1986, p. 83) formulated principles that staff would need to
follow when formulating multicultural education policies and developing anti-racist
policies, in order to achieve racial harmony, for example in London schools:
1. All pupils and staff should be treated with dignity and should feel that their particular culture is valued by the school.
2. All pupils should be given equal opportunities to develop their potential. 3. School life should reflect the different backgrounds of the pupils. 4. The curriculum should reflect the various communities of Britain; 5. There should be open discussion about living in a multi-ethnic community and
this should include discussion about the causes of racism, 6. All racial incidents and attacks, whether physical or verbal, should be dealt with
according to the clear school policy, 7. Distribution of racist literature and the use of school premises by racist groups
should not be allowed.
(Lynch 1986, p. 83).
Banks (1993) also identified five dimensions of multicultural education to develop
courses, programmes and projects in multicultural education. The five dimensions are
shown in figure 1.1 below.

11
Figure 1.1: Five Dimensions of Multicultural Education (Source: Banks, 1993, p.5)
Multicultural
Education
Content integration Content integration deals with the extent to which teachers use examples and content from a variety of cultures and groups to illustrate key concepts, principles, generalizations, and theories in their subject area or discipline.
The knowledge construction process
The knowledge construction process relates to the extent to which teachers help students understand, investigate, and determine how the implicit cultural assumptions, frames of reference, perspectives, and biases within a discipline influence the ways in which knowledge is constructed within it.
An equity pedagogy An equity pedagogy exists when teachers modify their teaching in ways that facilitate the academic achievement of students from diverse racial, cultural, and social class groups. This includes using a variety of teaching styles that are consistent with the wide range of learning styles within various cultural and ethnic groups.
Prejudice reduction
This dimension focuses on the characteristics of students’ racial attitudes and how they can be modified by teaching methods and materials.
An empowering school culture and social structure
Grouping and labelling practices, sports participation, disproportionality in achievement, and the interaction of the staff and the students across ethnic and racial lines are among the components of the school culture that must be examined to create a school culture that empowers students from diverse racial, ethnic, and cultural groups.

12
According to Banks’ views schools with rich multicultural backgrounds need to focus on
these five dimensions. Content integration is focused on expanding the curriculum to
acknowledge the experience and contributions of diverse groups. Knowledge construction
helps students to understand how people’s beliefs are based in their own cultural
background. Equity pedagogy refers to the use of strategies that lead to higher
achievement for students of all races. Prejudice reduction helps students develop more
positive attitudes about people of different races and ethnicities. An empowering school
culture examines the impact of school policies, such as academic streaming and
discipline, on students from different backgrounds to enable those students to have some
decision-making in their own education.
When considering Banks’s multicultural education theories through the USA context,
there is a close link with peace education attempts in Sri Lanka and different types of
multicultural education attempts in England. As discussed below, the data collection tools
for the current study are based largely on his work.
1.2 The purpose of the study
The purpose of this study was to investigate stakeholders’ views of multicultural policies
and practices in secondary schools with good multicultural practices in Sri Lanka and a
comparator school in England. Banks’s (1986, 1989 and 2004) international work on
multicultural policy and practices in education was used as a conceptual framework
against which to elicit what new insights can be gained that can lead to educational
improvements in Sri Lankan schools.
England was an important 19th century colonial power in Sri Lanka and British traditions
in education structures and policies predominated until the introduction of new education
policies in the independence era from 1948. In England, and Britain in general,
immigration from ex-colonial countries, which includes Sri Lanka, has highlighted the
need for multicultural schools’ policies. Today both countries are ethnically diverse and
share problems related to integration in a new society concerning, language, religious and
cultural differences. Whilst post-war immigration to England consisted of labour migrants
from the Caribbean, Africa, and South-East Asia and refugees came from all over the
world, the colonised period in Sri Lanka prior to its colonisation by Europeans consisted
of labour migrations from the southern Indian colonies. The issue of Sri Lankan
colonisation by European powers and the consequence of this for its current multicultural
population are explored in-depth in Chapter 2 below.

13
There are several reasons for comparing multicultural education in Sri Lanka and
England. The modern school system of Sri Lanka had its beginnings during the British
colonial administration. Currently, Sri Lanka is trying to integrate multicultural education
into its peace education curriculum (see chapter 2). Now that there is peace in Sri Lanka,
the government is focusing on ways to develop the curriculum to foster intercultural
understandings. England has a longer tradition in multicultural education and policies in
its education system. There may be lessons to be drawn from the Sri Lankan schools with
good multicultural practices and from the English school that are of use in Sri Lanka.
1.3 Research questions
1. What have been the background to, and policies of, multicultural education in Sri
Lanka and England over the period of Sri Lankan National independence from 1948,
and the post 1945 2nd World War period in England?
2. What are some of the important issues associated with schools of multicultural
background in each country and what are the similarities and differences?
3. Do students of all ethnic backgrounds feel included in these schools and are
relationships between them and with staff harmonious?
4. To what extent are local communities involved in the life of the school?
5. What is known about educational performance and exclusion disparities between
students of various ethnic groups in the two countries?
1.4 Participants
To address these questions, a pilot study was conducted in both countries to test the data
collection instruments. Subsequently a sample of students, teachers and principals from
five Sinhala medium schools predominantly Buddhist, in Sri Lanka responded to
questionnaires and interviews in the main study. These schools were chosen as they were
recognised as schools of good practice (ESCP, 2008) and included students from
different ethnicities. In addition five policy makers also contributed to the study. In
England one school, local to the University in which the study was located, was used as a
comparator. This school is ethnically diverse, has been identified as having good
multicultural practice and is funded in part through the Anglican Church with its
associated Christian values. Students with different ethnic backgrounds, teachers and the
head teacher of this school participated in the study.

14
1.5 Research instruments
The questionnaire and interview schedules were adapted from Banks (1981, 1989, 2008)
His research encompasses policy and practice at international, national and school levels,
with both policy makers and practitioners’ across the world, including the UK and Indian
subcontinent and is probably the best known work in the area of multicultural education
internationally.
1.6 Structure of thesis
Chapter 2 collates information on the historical, socio-economic and educational context
in which multicultural education of Sri Lanka and England takes place.
Chapter 3 summarises existing theories of multicultural education and indicates the
relationship between social cohesion and multicultural education in Sri Lanka. There is a
review of Banks’s work in multicultural education in the United States of America which
is the basis of the questionnaires and interview schedules in the current study. Then there
is an overview of multicultural educational policies in Sri Lanka and England from 1945
to the present in chapter 3.
Details of the research methodology are included in chapter 4. Due to the sensitive nature
of a topic such as multicultural education, both qualitative and quantitative research
methods were chosen. This included questionnaires and interviews. The research
fieldwork took place in Colombo in Sri Lanka and Bedfordshire in England which are
inhabited by different ethnic communities. Data were collected on the perceptions and
actions of students, teachers, principals/head teachers and policy makers to enable deeper
understanding of the framework and context regarding multicultural education in Sri
Lanka and England from the perspective of the stakeholders.
Findings are analysed in the next two chapters. An analysis of the findings in relation to
teacher training, professional development and language issues can be found in chapter 5.
Chapter 6 focuses on issues of inclusion, feelings of belong, equity and the curriculum,
and students’ attainment. Similarities and differences between the |Sri Lankan schools
and the English comparator school are examined.
Chapter 7 highlights recommendations and conclusions of the study.

15
Chapter 2: Background Information
2.0 Introduction
This chapter elaborates on the geographical, historical, socio-economic, political and
educational context of Sri Lanka and England in which multicultural education in schools
takes place. Potentially the scope is broad, so the focus will be confined to contextual
factors relevant for the research. First there is an overview of geographical and historical
factors, in relation to Sri Lankan and English society. Finally, an overview of the
education system is provided, highlighting those elements relevant to multicultural
education.
2.1 Sri Lanka
2.1.1 Geography and history Sri Lanka is a small island in the Indian Ocean, 25,332 square miles in area. It is
separated from the Indian subcontinent by the Gulf of Mannar and Palk Strait. The
maximum length from north to south is about 270 miles and the maximum breath from
east to west is about 140 miles. Sri Lanka is divided into nine provinces for
administrative and educational purposes as shown in Figure 2.1 in Appendix A.
Nubin (2002) explains that, according to Asian poets, the geographical location of the
island and its beauty gave it the name the ‘Pearl upon the brow of India’. After the 1980s,
it was called India’s ‘fallen tears’ as a result of the thirty years war.
There is clear evidence of a flourishing civilization in Sri Lanka over 2000 years. The
remains of ancient art and sculpture show evidence of Buddhist civilization. The great
reservoirs and canal system, which enabled the agro-economic mode of living to flourish,
give testimony that this civilization was highly developed. According to Coparahewa
(2009) in the late 6th century B.C. the Sinhalese arrived in Sri Lanka. Most people believe
they came from northern India. Buddhism arrived from India in the 3rd century B.C. in the
person of the son of the Mauran emperor, Ashoka, and a great civilization developed
around the cities of Anuradhapura and Polonnaruwa. The Buddhist kingdom of Sri Lanka
maintained a large number of Buddhist schools and monasteries. In ancient society
education was associated with Buddhist temples. However, ‘By the 13th century, a south
Indian dynasty seized power in the north and established a permanent Tamil kingdom’
(Da Silva cited in Cardozo, 2006, p.34), so, by this time, power in the island was already

16
divided between Tamil and Sinhalese. The island’s coastal region fell under Portuguese
influence in 1505 and was later occupied by the Dutch in the 17th century. Finally the
Dutch were replaced by the British in 1796. It became a British Crown colony in 1802,
and was united under British rule by 1815.The British sponsored a large number of
‘Indian Tamils’ from the south of India (Estate Tamils) to work in Sri Lanka on the newly
established tea plantations in the hill country of Sri Lanka (Ruberu, 1962). The Island
became independent in 1948, and in 1972 its name was changed from Ceylon to Sri
Lanka (Cardozo, 2006).
The population of Sri Lanka currently enjoys long life expectancy, low levels of infant
mortality, and the highest literacy rates in the area in a low income economy. According
to data from the Central Bank in Sri Lanka (2011) real GDP Growth Rate is 8.0%, life
expectancy (2007) is seventy four years, basic literacy level is 91.4% (2009) and annual
population growth is 1.0% (2010). Many scholars believe that such statistics reflect the
benefits of government intervention in social welfare (Gunathilake et al., 1992) over
recent years.
2.1.2 Ethnic composition In the current study it is particularly important to understand the current ethnic mix of the
country. Sri Lanka is a multi-ethnic and multi-religious country. The distribution of
different ethnic groups is shown in Table 2.1 in Appendix A.
Table 2.1 shows that Sinhalese are the majority of the island’s population. Sinhalese
account for nearly 75% of the population. Sri Lankan Tamils account for 12% of the
population. Sri Lankan Tamils live in the northern and eastern provinces and a
considerable percentage of the Sri Lankan Tamil population live among the Sinhalese in
the south, where the Sinhala provinces are predominant. In addition, there is another
group of Tamils who are known as Indian Tamils (4%). Central and Uva provinces reflect
the strong presence of the Indian Tamil population who, as already noted, were brought to
Sri Lanka in the British colonial period. Moors (commonly known as Muslims) form 9%
of the population. Ceylon Moors are the Muslims, who have been in residence in Sri
Lanka for several centuries.
The Muslim community originally arrived in Sri Lanka as traders, from the Arabic world (Moors) and from other origins such as parts of India and the Malayan archipelago (Malays). The term ‘Muslim’ is used in Sri Lanka to give a common name to these various groups
(Perera et al, 2004, p.384).

17
Muslims live throughout almost all parts of the country. However, there are several
Muslim-dominant areas, especially in the east. Other groups such as Burghers and Malay,
comprise a further 1% of the population. The Burghers are descendents of Euro-Asian
cultural groups of colonists from the 16th to 20th centuries. The Malays of Sri Lanka
originated in Southeast Asia. Their ancestors arrived when both Sri Lanka was a Dutch
colony. A second wave came from the Malay Peninsula when both Sri Lanka was part of
the in British Empire (1796-1998).
Table 2.2 in Appendix A shows the distribution of population by religion. In Sri Lanka
religions are very important. The economy, professional interests, education and way of
life are associated with religious affiliations. According to the Population and Housing
Data (2012), out of the total population 70.2 % are Buddhist with the majority of
Sinhalese being Buddhist. 12.6% are Hindu with most of the Tamils Hindus. 9.7% are
followers of Islam. About 7.4% of the population from the major ethnic groups are
Roman Catholics or Christians who were converted to the faith during the regime of the
Portuguese, the Dutch or the British.
There are two main languages spoken in Sri Lanka. Sinhala is the mother tongue of the
Sinhalese and Tamil is the mother tongue of the Tamils. Sri Lanka is the only country
where the Sinhala language is spoken (Coparahewa, 2009). The majority of Muslims
speak Tamil as their mother tongue. However, some Muslim students study in schools
where the medium of instruction is Sinhala. Sinhala and Tamil are the official languages
of Sri Lanka. English is the official link language according to the Official Language Act
of 1990 (Perera et al, 2004: see related discussion section 2.1.6).
2.1. 3 The nature of civil war in Sri Lanka Coparahewa (2009) explains that, from 1970, the democratic political system and the
territorial integrity of Sri Lanka came under threat from Janatha Vimukthi Peramuna
(JVP), the People’s Liberation Front, an armed struggle by a youth group of the Sinhala
community. In 1971 and again in 1988-1989 there was an attempt to capture state power.
In the north of the island at this time there were Tamil militant activities by a group
known as the Liberation of Tigers of Tamil Elam (LTTE), commonly referred to as Tamil
Tigers (Harries and Lewer, 2008).
The civil war between the Sri Lankan government and the Liberation Tigers of Tamil
Elam (LTTE) lasted nearly thirty years. It began to campaign in northern and eastern Sri
Lanka where most of the island’s Tamil reside and in 1981 killed thirteen soldiers. The

18
riot erupted first in Colombo and quickly spread to other parts of the country. 2,500
Tamils died at this time.
The event became known as ‘Black July’ and significantly swayed international opinion in favour of the Tamil cause […] In the course of Black July, there was a mass exodus of Tamils seeking refugee status from the south of the Island to the north, and to destinations overseas, particularly to neighbouring India and countries in the western world such as the United Kingdom, Canada, Australia and the United States. This event effectively tarnished the image of the Sinhalese and Sinhala state as no other single event in the history of the conflict has
(Perera et al, 2004, p 388).
During the war, the LTTE engaged as a feared terrorist organisation. Several high-
ranking ministers and political figures were attacked in both Sri Lanka and India,
including the Indian Prime Minister Rajive Ghandhi, and several guerrilla attacks were
made on public buses and trains and on key government installations including the
national airport and central bank in the commercial capital Colombo. After years of
fierce fighting, up to 40,000 civilians were dead and over 250, 000 displaced. The LTTE
was defeated and its chef Velupillai Prabhakaran killed in 2009.
In war children are the most affected group. Children from the north and east of Sri
Lanka were seriously affected by the war. UNICEF estimated that there were 900,000
(1998) children in the northeast who had a lack of education, food, shelter or were
injured. An estimated 380,000 children had been displaced; of these, 250,000 remain
displaced. Not only in the North and East but thousands of children living in all parts of
the country suffered the loss of a parent or parents, and family members. With children
from outside the north east, which include Sinhalese children, a rough estimate of one
million-war affected children can be presumed (Sri Jayantha, 2002, Perera et al, 2004).
Perera et al (2004) explain that the generations of children in the north and east have
known nothing but war. They learned fear, prejudice, hatred and violence and came to
demonise the enemy and idealise martyrdom. Children living in the other parts of Sri
Lanka, even those unaffected directly by the war, learned some of those same lessons.
Now Sri Lanka has peace. Therefore, multicultural education is important to Sri Lanka to
maintain peace. School education can help to change students’ attitudes regarding how to
live in a multicultural society. There are different types of programme initiatives
developed by the Government of Sri Lanka with Non-Government Organisations to
improve the education of the northern part of Sri Lanka. Most of the children who were
born after the 1980s do not have any experience regarding the other ethnic groups that
live in Sri Lanka. Therefore, the National Institute of Education and the Ministry of

19
Education started a peace education unit with the help of foreign funds. The Social
Cohesion and Peace Unit of the Ministry of Education created a National Policy and a
Comprehensive Framework of Actions on Education for Social Cohesion and Peace in
2008. In 2007 a new curriculum was introduced for Life Competences and Citizenship
Education and Citizenship Education and Governance (see Chapter 3).
2.1.4 Education system in Sri Lanka The system of education in Sri Lanka evolved over centuries, (Buddhism came in the 3rd
century B.C.) with an indigenous system provided in Buddhist temples and Pirivenas
(pansala). At a time when printing was not known knowledge was transmitted through
the generations verbally, and was memorized by pupils. Later, texts were written on Ola
leaf and these manuscripts were collected in libraries at Buddhist Temples. An overviews
of the indigenous system of education in ancient Sri Lanka is included in 2a in Appendix
A.
The Portuguese arrived in Sri Lanka in 1505 and captured maritime areas of Sri Lanka,
especially in the west, north and south of the country. The aim of education during the
Portuguese period was limited to the spreading of the Catholic religion and teaching
reading and writing. Under the Portuguese, the system of education was in the hands of
the missionaries who established missionary schools with the sole intention of
propagating the Roman Catholic religion. During the sixteenth century, Portuguese
missionaries established up to 100 schools designed to foster a Roman Catholic culture
among the growing Christian community in the low country.
The Dutch occupied Sri Lanka from 1658 -1796. On realization that the establishment of
schools assisted the civil administration and trade, they took steps to expand the
opportunity of education by increasing the number of schools. Their system of education
was based on promoting religion through the Dutch reformed church. Free compulsory
education was enforced by law in order to ensure conversion to the Dutch Reformed
church. They started Parish schools in each village. There was not a single village without
its own schools.
The British succeeded the Dutch in the early 19th century in 1802 with the fall of the
Kandyan Kingdom in 1815, the last native kingdom, the British managed the entire
country (Gunawardana et al, 2004) and the modern school system of Sri Lanka was
introduced during the British colonial administration. The government assisted the
Christian Reformed church to establish schools. A dual system of schools was started

20
during this period where the government assisted English medium schools and religious
(temple) schools (Pirivena) (Hewawasam, 1958).
Historical evidence shows that European powers privileged some groups at the expense
of others for the purpose of establishing colonial rule. The conquest of Sri Lanka by the
British had a direct influence on the educational opportunities available to different ethnic
groups in Sri Lanka. The major aim of the British was to exploit the economic resources
of the country. As a result, they entrusted the responsibility of providing education in
different parts of the country to different missionary groups. Five missionary groups
arrived in Sri Lanka during the early decades of the 19th century. They were:
• London Mission – 1805
• Baptist Mission – 1812
• American Mission – 1816
• Church mission – 1818
• Wesleyan Mission – 1841.
The Baptist Mission was a small mission and mainly catered for the Burgher population.
Other missionary groups worked in the north and the south of the country and supervised
English schools. Most of these missionaries had native schools which provided free
vernacular education including instruction in religion and language and English schools,
which charged fees in the main towns. The American Missionary Society in the north of
the country was the most efficiently organized and had the most resources. This led to a
position of greater advantage for the ethnic groups resident in that part of the country over
other ethnic groups. As a result, participation in education and the level of educational
achievement was generally higher for the Tamil people in the north (Gunawardana et al,
2004).
The European powers employed a ‘divide and rule’ tactic in Sri Lanka, privileging the Tamil minority with access to education so that they could act as local functionaries. After independence this resulted in a relatively large group of highly educated and well employed Tamils (Bush & Saltrelli 2000:10). Ethnic differences were emphasised by the British. By favouring the Tamil minority, the colonial power hoped to reduce the power of the Sinhalese majority
(Sprang 2003 cited in Cardozo, 2006 p: 35).
There was no aid given to start Buddhist, Hindu or Muslim schools. However, the first
Buddhist school was opened in Dodanduwa in 1869. Gradually Buddhist schools came to
be opened in villages and English schools were established in main cities such as
Colombo, Kanndy and Galle. In the north a parallel movement emerged under
Arumugam Nawalar, who started English and Tamil medium Hindu schools. Dr.C.W.W.

21
Kannangara, became the first minister of education in Sri Lanka. The country moved
forward with a wealth of achievements during the fifteen-year period 1931-1947, during
which Dr.Kannangara held office:
• Democratization of education
Establishment of a network of central schools
• The free education system
• Diversification of the curriculum
• school midday meal
• Improvement of the status of teachers
• Establishment of the University of Ceylon
In 1945, local languages were introduced as the medium of instruction in primary classes
and from 1950 this policy was extended to secondary and tertiary levels (Jayasuriya,
1969).
As Thilakaratna (2006) notes the ‘Universal Free Education Policy’ was introduced in
1945. As a result of this policy Sri Lanka has achieved a high level of literacy and school
enrolment rates. To reach this situation the government initiated several programmes for
the education sector. The Free School Textbook Programme was introduced in 1980 to
increase quality and improve learning outcomes. This was targeted at poor families.
Under this programme, all students from Grades One to Eleven were provided with the
required textbooks free of charge by the government. This programme has been
expanded twice: first a policy to improve the physical quality of textbooks in 1999 (for
example paper, layout, illustration, and colour), second the Multiple - Book Operation
Programme was introduced in 2003 (multiple textbooks were introduced for each selected
subject). Then the Free School Uniform Programme was introduced in 1993. This
programme provides free uniform materials for all students in Grades One to Thirteen in
government schools, and free uniform materials for student monks studying in Pirivenas
(temple schools). Two other important policies are the provision of subsidised transport
facilities (bus and / or train) for students, and the Grade five scholarship programme,
aimed at access to good quality schools and financial support for children from poor
families. In addition to these policies a universal mid-day meal programme was
introduced during 1989 -1994 and a targeted nutrition programme was introduced to
provide a morning meal for students in Grade one classes in selected schools in 2000.
Since 1945 there have been attempts to broaden access to education at university level
also. In the 1970s a new admissions policy was introduced to the admission procedure.

22
One reason for introducing this change was opposition to the over-representation of
Tamil students in Science-oriented faculties. During the period from 1973 -75 several
amendments were introduced to the admissions policy of the universities:
1973 – Standardization of marks
1974 – Standardization of marks with modifications and district quarters
1975 – Standardization of marks and district quarters
According to Gunawardana et al., (2004) some believed that the standardization of marks
reduces disparities. There was a difference between the marks obtained by students sitting
the examinations in the different areas, even though students’ ability and intelligence was
similarly distributed in all geographical areas and across all social class groups. Some
believed the most important criterion in selecting students to the university should be
merit. However, others thought that standardization of marks by language medium might
lead to disadvantage for Tamil students who had been gaining higher marks than
Sinhalese. The objection to standardization came mainly from the Tamil minority group.
2.1.5 Current education system in Sri Lanka The current education structure of Sri Lanka is shown in figure 2.2 in Appendix A.
According to the New Education Act for General Education in Sri Lanka (2009), most of
the schools in Sri Lanka are maintained by the government as a part of the free system of
education. With the establishment of the provincial council system in the 1980s the
central government handed control of most schools to local governments.
Sri Lanka has wide differences in its school system:
(a) Type three schools - Primary schools with classes from Grade One to Grade Five.
(b) Type two schools - Junior schools with classes from Grade One to Grade Eleven
(c) 1C schools - Senior secondary schools with classes from Grade One to Grade
Thirteen, or Grade Six to Grade Thirteen, with only Arts and Commerce streams of
G.C.E. Advanced Level.
(d) 1AB schools – Senior secondary schools with classes from Grade One to Grade
Thirteen with all four streams at G.C.E. Advanced Level.
There were 9,905 government schools in Sri Lanka in 2012. Table 2.3 in Appendix A
shows the number of schools by type.
In Sri Lanka a National School is a school that is funded and administered by the
Ministry of Education of the Central Government as opposed to provincial schools run by

23
the local provincial council. Both types of schools provide secondary education with
primary education. This division into national and provincial began in 1985 with eighteen
schools becoming National Schools. These schools were very-well-known schools in the
country (including a few in the provincial capitals being designated as National Schools).
The criteria for selecting National Schools were as follows.
(a) The total school enrolment in the school should be 2000 or more.
(b) The school should have a well-established collegiate section with a sufficient number of students in the science arts and commerce streams.
(c) The GCE A/L results of the school should indicate a reasonable academic standard.
(d) The buildings, furniture, equipment and other facilities should match the student numbers of the school.
(e) The school should be in a position to obtain adequate financial support from the school development society, past pupils’ association and other sources in the community.
(f) The school should be generally accepted by the community as one of the best in the region.
(De Silva, 2009,http://www.island.lk/2009/10/20/features4.html)
With the decentralization of the government administration following the establishment
of provincial councils from the 13th Amendment to the Constitution in 1987 the
responsibility for the supervision and management of all schools, other than National
Schools, passed on to the provincial councils. The responsibility for supervising and
managing the National Schools remained with the central Ministry of Education.
However, in the following five years (1989) only five schools met the initial criteria of
the National Schools. Therefore, the criteria were revised in 1990 as follows:
1. The school should have 2000 or more students.
2. The school should have 200 or more students in the GCE A/L science classes.
3. Of the number of students appearing for the GCE A/L examination during the previous three years, one third should have qualified for admission to universities each year.
4. There should be adequate buildings, desks and chairs for all students.
5. There should be adequate facilities for teaching technology related subjects.
6. Laboratory facilities should be adequate to meet the requirements of all GCE O/L and A/L students.
7. Annual income from facilities and services’ fees should exceed Rs. 15,000.
8. Residents should consider the school to be one of the leading schools in the locality.
9. The school should have an effective School Development Society.
10. The school should have an active Past Pupils’ Association

24
(De Silva, 2009, http://www.island.lk/2009/10/20/features4.html).
De Silva, (2009) commented that politicians stepped in to get more and more schools in
their electorates upgraded as National Schools but only changed the name-board of the
school. The Ministry of Education granted its approval in contravention of its own
criteria. Therefore, the number of National Schools went up to thirty seven by 1992 and
increased to 165 by 1994. During the period 1994 to 2000, it reached the figure of 317.
As mentioned before, all National Schools are funded by the Government. Some of them
have access to other resources also. For example, there are national schools in Sri Lanka
which are given money and other resources by old girl or old boy associations. This
means some schools are quite rich as a result of donations that they have received from
the local community while others do not, and so are poor in comparison.
All other secondary schools (except Pirivenas) are provincial. There are several non-
government schools in Sri Lanka. Private schools follow the local curriculum set up by
the Ministry of Education in the local language mediums of Sinhala, Tamil or English. In
the early 1960s the establishment of new private schools had been prohibited by law. As a
result of this law the number of public schools was increased. However, recently a few
private schools have been introduced. There were thirty-seven fee levying and thirty-six
non fee levying private schools in 2012. According to the 2010 school Census Report,
there were twenty-four fee levying and two non-fee levying special education schools in
Sri Lanka. International schools started in the late 1980s. They offer foreign curricula
and prepare students to take foreign examinations.
Table 2.4 in Appendix A shows the number of students by type of schools. In the
education system, 95% of primary and secondary education is dominated by the
government sector. Overall approximately four million school children were enrolled in
about 9,905 government schools, around 125,669 students were enrolled in private
schools and approximately 64,608 students were enrolled in Pirivenas (temple schools) in
2012. In 2012 there were about 340 National Schools and about 9,563 Provincial Schools
in Sri Lanka. Of these over two-thirds of National and Provincial Schools delivered the
curriculum through the Sinhala language (this is discussed further in the section on
multiculturalism in education). Table 2.5 in the Appendix A shows the number of school
students by medium of instruction in 2012. There were 2,971,098 Sinhala medium
schools and 1,032,988 Tamil medium schools in 2012.

25
2.1.6 Language policy in Sri Lanka before independence to present Coperahewa (2009) explained that language is a ‘social instruction’. Language serves a
variety of non-linguistic purposes such as political, literary, economic, educational,
religious, nationalistic and social. Citing Harvard anthropologist Thambiah (1986, p.73)
Coperahewa contends that language has been a more important issue than religion in the
Sinhala-Tamil conflict.
English was the official language of the country from 1815 to 1956. Though a colonial
language, English continued to be the official language even after Sri Lanka gained
independence in 1948 as English was still widely used in government, administration, and
higher education (Coperahewa, 2009).
During English rule Christian missionaries established English language schools in Sri
Lanka to anglicise the indigenous population. Missionaries controlled most of the English
educational institutions in the country until 1831. However, these schools conducted
instruction bilingually in Sinhala or Tamil and English. A few private schools provided
instruction in English. Local language schools were established under Dutch colonial
rulers and were expanded by the British. The curricula of those schools used local
languages rather than English. Most of Sri Lankan students were taught in vernacular
schools and used either Sinhala or Tamil in the late nineteenth century. There were
approximately 4000 vernacular schools during the colonial period. However, there were
only 225 English schools at that time.
Instruction in English came to the secondary and tertiary levels, whereas primary
education was conducted in the vernacular languages. The result was only a few school
children were taught in English schools. At the height of the colonial era (1914) only
37,500 students attended English-medium schools, while 347,500 were in vernacular
schools. On the eve of independence 180,000 pupils were found in English schools, while
720,000 attended vernacular schools. A limited number of qualified teachers, with limited
resources teaching English tended to be located in urban schools. Whereas vernacular
education was provided free, English school required tuition fees that most could not
afford (Kularathna, 2002).
According to the Colebrook Commission (1829) government administration should be
centralized in the colony and English should be the official language. A further report
recommended that English be the primary medium of education in secondary school and
university. At the time Government positions were open to local people who had an
education background and proficiency in English. New English schools were established

26
in Colombo, Kandy and Galle to fulfil the colonial aim of cultivating a native class fluent
in English and learning Western culture. The English education offered more advantages
for Sri Lankans to establish themselves in occupations based on education. A localized
professional class emerged through the English education system. However, Sinhala and
Tamil were used in communicating with elders, servants and monks whilst lower-middle
and working class Sri Lankans, both Sinhala and Tamil, did not have access to learning
English. Colonial administrations believed that access to the social mobility English
education afforded must be restricted for rural youths because it was believed that even
rudimentary English education would have disastrous effects, because it would lead to
expectations of employment in areas other than manual labour when maintained labour
was needed to maintain the plantations (Kularathna, 2002). However, this led to much
resentment:
A large number of youth, especially those who came from the rural areas, expressed their resentments against continuing domination by the English speaking, western- oriented elites living in Colombo and other urban centres. This sense of anger is best described by the term ‘Kaduwa’or sward; a sense that English speaker always has class power in our society ‘to cut down’ the Sinhala and Tamil speaking majority
(The Report of the Presidential Commission on Youth, 1990, p.79).
The recommendation of the Special Committee on Education in 1943 was that the
medium of instruction in the primary school be the mother tongue and English introduced
as a language subject in all primary schools where it was not the medium of instruction.
From 1950 this change was gradually extended beyond the primary level to the secondary
level.
The high standing afforded the English language came increasingly under attack as Sri
Lankans raised their political voice after independence. Consequently the native
languages (Sinhala and Tamil) of the country’s majority and minority population were
reintroduced as official languages. The 1956 Language Act established Sinhala only as
the nation’s official language. In 1978 a legislative amendment amended the 1956 Act
and Tamil became an official language too. This was strengthened by the 13th
Amendment to the Constitution which made Sinhala and Tamil official languages of Sri
Lanka and English the link language (ESCP, 2008, p.48) (See section 3.4.5 for more
details). In the 1990s when the Liberation Tigers of Tamil Eelam (LTTE) established a
separate state in the northern and eastern provinces of Sri Lanka, it too declared an
official language policy, of Tamil only.
Despite Sinhala and Tamil being official languages English speakers had greater
advantages. For example, when the private sector economy opened to foreign investment

27
in 1977 first language speakers of English and those who received private English
education were in privileged positions in multinational corporations.
The historical inequality of Sri Lankan language policy can be summarised as follows:
The inequalities created by the dual language policy of the colonial era caused many frustrations and led to agitation for reforms in education. A recommendation made by a special committee to introduce Sinhala/Tamil as the medium of instruction at primary level was accepted by the British and enforced in the 1940’s. With independence gained in 1948, this decision was extended to the secondary level in the 1950’s and later to the universities. Thus the country experienced two extreme language policies ‘English only’ in the colonial era and ‘Sinhala/Tamil only’ during post-independence
(New Educational Act for General Education in Sri Lanka, 2009, p.69).
2.1.7 Teacher training in Sri Lanka According to Balasooriya (2012) currently all teachers are recruited by the government
for both National schools and schools managed by the Provincial Public Service
Commission (PPSC). Most of the teachers graduated from National Colleges of
Education (NCoE) and recognised universities. Under the rules of recruitment and
deployment of teachers it is compulsory for all of them to serve in an under resourced
rural area school for a period of three years. The National Institute of Education (NIE)
also functions as a teacher training centre. The main purpose of creating the NIE was to
establish a unique institute for capacity building of educational managers, teacher
educators and teachers, design and develop school curricula and conduct policy research
on education (http://www.nie.lk/pages/gen1.asp).
Table 2.6 in Appendix A shows the numbers of teachers by qualifications in government
schools in 2010. 40,062 teachers were untrained in 2010 and there are almost three times
as many highly qualified female teachers compared to their male counterparts. However,
the number of untrained teachers reduced in 2012. The Education Minister Susil
Premajayantha formulated a national policy on teacher recruitment making a first degree
mandatory for the recruitment of teachers from 2009. Table 2.7 below shows teachers by
qualification in 2012.

28
Table 2.7: Teacher by qualification (Source: Ministry of Education Information-Sri Lanka
2012)
Graduate teachers 86,751 38.8%
Trained teachers 128,152 57.4%
Untrained teachers 5,833 2.6%
Trainee teachers 2,597 1.2%
Total 223,333 100%
Balasooriya (2012) has criticised the teacher training programme in the country.
‘Although the NCoEs and universities provide most of the teachers to the school system,
it is apparent that teacher trainee intake to NCoEs or universities does not meet the
country’s real teacher recruitment’ needs’ (p.144). Therefore, over the last few decades,
there has been a teacher shortage for subjects like science, mathematics, technical
subjects, English and aesthetics in Grades Six to Eleven.
2.2 England
2.2.1 Geography The United Kingdom of Great Britain is located off the north western coast of continental
Europe. It lies between latitudes 49° N and 59° N and longitudes 8° W to 2° E. England
is the largest country that is part of the United Kingdom, at 130,410 square kilometres. It
shares land borders with Scotland to the north, Wales to the west, the Irish Sea to the
north west, the Celtic sea to the south west, North Sea to the east and the English Channel
to the south that separates it from continental Europe. A map of the UK and an overview
of natural resources is included figure 2.3 in Appendix A.
2.2.2 Population history settlement According to the 2011 census, the total population of the United Kingdom was
53,012,456. Indigenous Britons are descended from the peoples that settled the region
prior to the 12th century (for example the pre-Celtic, Celtic, Roman, Anglo-Saxon,
Norman, Huguenot and Viking). Indigenous British people comprise several nations and
ethnic groups: the English, Scots, and Gaels of Northern Ireland. The Irish are the largest
minority in the United Kingdom. From the independence of the Republic of Ireland in
1922 until 1949 citizens of that country retained their status as British subjects. They still

29
maintain legal rights to settle in the United Kingdom
(http://mighealth.net/uk/index.php/Indigenous_and_Non_Indigenous_Group,
06/12/2010).
Today though most of the population is White British, England is considered an
ethnically diverse society. The vast majority of England’s minority ethnic groups arrived
after World War II when there was shortage of workforce labour. During this period large
numbers of immigrants from Africa, the Caribbean and the Indian subcontinent arrived.
Table 2.8 in Appendix A shows the population of England by ethnic group in 2011.
2.2.3 Ethnicity and religion Jews arrived in England in 1070 from Rouen following the Norman Invasion but the vast
majority of today’s Jewish community arrived from Eastern Europe in the late 19th and
early 20th centuries. The dominant religion in England is Christianity. Table 2.9 in
Appendix A shows the most recent census data (2011) regarding religious affiliation.
2.2.4 Education system in England The history of state education in England can be divided roughly into the following
phases.
1800 –1870: towards state education 1870 – 1902: the first stages of elementary schooling 1902 – 1944: establishing secondary schools and local education authorities 1944 – 1965: universal secondary education 1965 – 1988: comprehensive schooling 1988 – present day: diversity and competition
(Bartlett and Burton, 2007, p. 59).
Large numbers of children in the newly developed urban areas in 1800 -70 were working
in factories and most of the children from rural areas were working in agriculture or
cottage industries. In this period the Christian church provided primary education for poor
children within charity schools and orphanages. These schools were voluntary and funded
by philanthropist and religious groups. A small number of children received privileged
formal education within monasteries and public schools. Urban working class children
studied in ‘drill’ schools and were given strict training in literacy and numeracy. In
between 1870 -1902 more literate and numerate workers were needed in England as an
industrial society. Working class men were granted the right to vote in 1867 and it was a
crucial turning point to ensure that their education enabled them to understand the value
of their voting. The Education Reform Act of 1870 made provision for elementary
education for all up to the age of thirteen. In 1902, the Balfour Education Act helped the

30
development of grammar and secondary schools. Then under the Fisher Education Act, in
1918 Secondary Education became compulsory up to the age of fourteen. The Butler
Education Act in 1944 created a universal system of secondary education. The Act
enabled a tripartite hierarchical system of grammar, technical and secondary modern
schools as proposed by the Norwood Committee in 1943. Later, beginning in the 1960s,
the system of comprehensive schooling was introduced, in part to counter what was seen
by some as the divisiveness of the tripartite system, although comprehensive schools have
never been introduced universally across England. In 1988 an Education Act aimed at
creating a ‘market’ approach to education whereby schools completed with each other for
‘customers’ and a traditional subject-based National Curriculum was made compulsory
for all pupils in state maintained schools (Bartlett and Burton, 2007). Later, in 1992,
based on the same market principles, a new inspection service, the Office for Standards in
Education (Ofsted) was introduced to evaluate standards in schools and ensure the
implementation and maintenance of central government policy in schools.
Children’s education in England is conventionally divided into two separate stages.
Primary education is compulsory between the ages of five and eleven. Primary schools
are usually of mixed sex and usually located close to the child’s home. Secondary
education is compulsory for pupils between the ages of eleven and sixteen. Most
secondary schools cater for both sexes. Nearly 88% of secondary school pupils in
England go to comprehensive schools. There are Grammar schools in England, which
offer academically oriented general education. Entrance is based on a test of ability,
usually at 11+. After compulsory education pupils often attend two more years of regular
or vocational technical education (Bartlett and Burton, 2007).
There are two types of school systems in England.
• State schools that are free to all children between the ages of five to sixteen. In
England around 90% of children attend sate schools that are funded from taxes.
• Independent schools (Private/Public Schools). Here parents pay for their
children’s education. Around 10% of students in England attend independent
private schools and public schools (see Table 2.10).
Table 2.10 in Appendix A describes the most common patterns for schooling in the state
sector in England.
Recently the system has become more complex and includes schools that are funded by
central government but do not have to follow National Curriculum requirements:
academies and free schools. For example, Academies are publically- funded independent

31
schools. Academies have freedom from local authority control, the ability to set their own
pay and conditions for staff, freedoms around the diversity of the curriculum and the
ability to change the lengths of terms and school days. The schools’ sponsors come from
a wide range of backgrounds including successful schools, businesses, universities
charities and faith bodies. Academies receive their funding directly from the education
funding agency rather than from local authorities (Department of Education, 2012,
www.education.gov.uk accessed 12-8-2012). Table 2.11 in Appendix A, shows the
different types of schools in England at present.
According to statistics from the Department of Education in England, there were around
8.2 million pupils in all schools in January 2013. Table 2.12 in Appendix A, shows
number of schools by type of schools from 2011 - 2013. Table 2.13 in Appendix A shows
numbers and percentages for all ethnic backgrounds. Table 2.14 in Appendix A shows the
number and percentages of schools of all religious backgrounds. Table 2.15 in Appendix
A shows the number and percentage of pupils by first language in 2013.
2.2.5 Teacher training in England The basic qualification for teacher recruitment in England is a degree and initial teacher
training (ITT). ITT courses cover the principles of teaching along with practical
experience in the classroom. As well as a degree, teachers need qualified teacher status
(QTS) to become a teacher. In England, QTS include passing skills tests in numeracy,
literacy and information and communications technology (ICT). In addition, teachers
must have the equivalent of at least GCSE at grade C in English and Mathematics. If
teachers need to teach in primary or secondary up to the age fourteen teachers need the
equivalent of at least GCSE grade C in Science.
A Bachelor of Education (B.Ed.) is an honours degree course in education. Course
content varies according to the university or college, but successful B.Ed. graduates gain
QTS in addition to their degree. A BA or BSc with QTS is a degree course that
incorporate teacher training. These programmes allow students to study for an honours
degree and initial teacher training at the same time. The Postgraduate Certificate in
Education (PGCE) is one of the most popular ways into teaching for postgraduate
students. To start PGCE course teachers must have a UK undergraduate degree or an
equivalent qualification. For primary level teaching, a degree can be any subject but for
secondary level teaching, a degree must be related to the secondary subjects the teacher
wants to teach (hhtp://www.skill.org.uk/page.aspx?c=265&p=384).

32
2.3 Chapter summary
The point of this chapter was to identify contextual factors in both Sri Lanka and
England. There is a difference between the two countries, geographically, physically,
historically and economically. Both countries have ethnically and religiously diverse
populations but England has a more diverse population and the total population is also
higher when compared with Sri Lanka. Sri Lanka was a former British colony. Therefore,
the current education systems of both countries have similarities. After independence Sri
Lanka faced thirty years of civil war among Sinhalese and Tamils and the education
system of Sri Lanka also helped to create the war through the inequalities encountered.
England has also found conflict as a result of ethnic tensions. In both countries attempts
have been made to reduce tensions at school level through multicultural education.
England has an established system for training teachers and ensuring they are qualified to
degree level, but this requirement has only recently being introduced into Sri Lanka.

33
Chapter 3: Literature review
3.0 Introduction
The previous chapter elaborated on the geographical, historical, socio-economic, political
and educational context of Sri Lanka and England in which multicultural education in
schools takes place. In addition, it explained the civil war in Sri Lanka. This chapter
elaborates the role of education within social cohesion. It then examines multicultural
education in Sri Lanka (after independence) and, after the Second World War, in
England.
3.1 Social cohesion
3.1.1 What is social cohesion? According to the Directorate General of Social Cohesion of the Council of Europe, social
cohesion:
is a concept that includes values and principles which aim to ensure that all citizens, without discrimination and on an equal footing, have access to fundamental social and economic rights. Social cohesion is a flagship concept which constantly reminds us of the need to, be collectively attentive to and aware of, any kind of discrimination, inequality, marginality or exclusion
(Jenson 2010, p.5).
Jenson (2010) explains that social cohesion became a key term in policy in the European
Union (EU) pointing out that the economic and social cohesion of Europe is a main
policy goal. However, the meaning of the concept of social cohesion can differ according
to the social and political environment. Berger-Schmitt, (2002) split the concept of social
cohesion into two dimensions:
1. The first dimension can be shortly denoted as the inequality dimension. It concerns aspect the goal of promoting equal opportunities and reducing disparities and divisions within a society. This also includes the aspect of social exclusion.
2. The second dimension can be shortly denoted as the social capital dimension. It concerns the goal of strengthening social relations, interactions and ties and embraces all aspects which are generally considered as the social capital of a society
(Berger-Schmitt, 2002, p. 404-405).
A cohesive society needs to work well for all its members, minimising disparities and
avoiding marginalization. Cohesion can be fostered by building networks of relationships
among members, trust and identity between different groups, fighting discrimination,
exclusion and excessive inequalities and enabling upward social mobility (OECD, 2011).

34
‘A cohesive society is a mutually supportive community of free individuals pursuing
these common goals by democratic means’ (European Committee for Social Cohesion,
2004 cited by Norton and Haan, 2013, p. 11). Social cohesion is a set of social processes
that help instill in individuals the sense of belonging to the same community and the
feeling that they are recognized as members of the community (French Commissariat
General du Plan 1997, cited by Norton and Haan, 2013, p. 11). On the other hand, ‘social
cohesion is viewed as a characteristic of a society dealing with the relations between
societal units such as individuals, groups, associations as well as territorial units’
(McCracken 1998, cited by Norton and Haan, 2013, p.11). The Council of Europe (2001)
explains that social cohesion needs to ensure every citizen has the opportunity to access:
• the means to secure their basic needs;
• progress;
• protection and legal rights; and
• dignity and social confidence.
However, ‘Lack of access to these fields operates against social cohesion’ (Council of
Europe 2001, p.5). Easterly et al (2006, cited by Norton and Haan, 2013 p. 11) also see
the lack of social cohesion as based on the nature and extent of social and economic
divisions within society such as income, ethnicity, political party, caste, language and so
on which create societal cleavages.
According to Jenson (2010) little attention was paid to social cohesion in Britain until
1997 with the election of the Labour government, when a Social Exclusion Unit was
established to provide a broad overview of issues of social challenges. Cheong, et al
(2007:28) noted that a number of government reports mention that there was a need to
build a ‘successfully integrated society’ and increase ‘community cohesion’ particularly
amongst communities that experienced the most serious civil disturbances. Citizenship
Education was introduced in schools in 2002, following the outbreak of civil disturbances
in Northern England in 2001. Policy discourse identified insufficient social cohesion as a
danger (Hulse and Stone, 2007, Home office 2001). Similar concerns were raised after
the July 7th (2005) bomb attack on the tubes in London
(http://www.guardian.co.uk/july7 accessed 07-07-2013) and in 2011 following the
summer riots. Increasing ethnic diversity in schools has exacerbated the need for better
understanding and privatising of community cohesion (DFES, 2007, Rhamie, Bhopal and
Bhatti, 2012).

35
3.1.2 Education and social cohesion Education is considered one of the key factors for social cohesion (Kantzara, 2011).
According to the Encyclopedia of Education (2002) education contributes to social
cohesion in four ways. Firstly schools need to teach the rules that govern interpersonal
and political action. They consist of the social and legal principle attached to good
citizenship, obligations to political leaders and behaviour expected of citizens. Schools
can facilitate a student’s appreciation for the complexity of issues related to historical and
global current events. Secondly, schools are expected to provide an understanding of and
experience of citizenship principles, in effect decreasing the distance between individuals
of different origins. The education experience derives from the classroom, the hallway,
schoolyard, playground or bus. However, how the school does this depends on its ability
to design the formal curriculum, its culture and the social capital of the surrounding
community. Thirdly, school systems are expected to provide equity of opportunity for all
students. Fourthly schools are expected to incorporate the interests and objectives of
many different groups and attempt to provide a common underpinning for citizenship.
Schools can accomplish this through many mechanisms such as public school boards,
professional councils, parent-teacher associations and public support.
3.1.3 Models of cohesion in schools Education is linked to social cohesion in two broad ways, internally and externally.
Internally it helps to build students’ personalities and externally it helps individuals to
link to society and participate meaningfully (Kantzara, 2011). According to Fernando
(2010) there can be three models of cohesion where ethnic groups exist in a Sri Lankan
context.
Cohesive Model
In the cohesive model visibility of differences is low in terms of language, dress or
practices. Medium of instruction is the same (English) for all students. The multi-ethnic
classroom is the norm. Teachers are from different ethnicities but not vocal about their
identity. Level of interaction is high in class and outside, in terms of friendships and
extracurricular activities. Students eat together and live together in hostels or boarding
places. Cohesion among staff is reflected in joint research and papers by multi-ethnic
groups.

36
Neutral Model
In the neutral model ethnic differences are visible but moderate in terms of language,
dress and practices. Students may be physically separated by the medium of instruction.
The multi-ethnic class is rare unless consciously organized. Bilingual teaching may occur
but is usually rare. Students interact with teachers across ethnic barriers but with effort.
There is no tension. Different ethnic groups exist side by side. Staffs interact across
boundaries but keep close friendships within their respective groups.
Non-Cohesive Model
In the non-cohesive model ethnic differences are clearly visible in respect of language,
dress and practices. Students are formed into clear ethnic groups. Even if there are
common classes, the students immediately separate themselves into their own enclaves. A
non-cohesive situation could exist irrespective of a common medium of instruction. Often
there are instigators to exacerbate mistrust and misunderstanding (Fernando, 2010).
3.2 Multicultural education
The size of the multi-ethnic society in the world has substantially increased and this has
had an overwhelming impact on people’s lives. Education often is seen as one of the main
instruments to socialise different people in society to co-exist with each other. Talcott
Parsons explained that culture is the motivational input behind society and education is
the process by which individual members of society are brought to ‘know’, ‘command’,
and/or become ‘committed to’ important elements of the cultural traditions of the society’
(Parsons, 1970:201). May (1994) explained that while society is seen as a system of roles,
schools are seen as agencies which require that students become successful performers of
future roles. Therefore, the curriculum is seen unproblematically as selections of
culturally universal features including common value orientation and specialised aspects
of culture concerned with training students for specific roles. Parsons also argues that
schools establish differences between individuals, albeit through the premised equal
opportunity. ‘It is fair to give differential rewards for levels or achievement, so long as
there has been fair access to opportunity……’ (cited by May 1994, p.14). It is clear, in
both May and Parsons’ view, that schools as a neutral institution are designed to provide
students with knowledge and skills that they need in the wider society. Multicultural
education is the one of main key factors to develop knowledge, skills and attitudes among

37
students who live in a plural society. Grant and Chapman (2008) also explain that multi-
cultural education has been employed as a strategy to manage problems arising in
pluralist societies.
There has been an increase, in past years, of activities such as multicultural education,
inter cultural education, human rights education, peace education, education for tolerance
and citizenship education (Osler and Starkey, 2013). The International Commission on
Education for Twenty-First Century (Delors Report, 1996) identifies four pillars of
education. ‘Learning to live together’ is one of them. The meaning of this pillar is
developing an understanding of other people and an appreciation of interdependence,
carrying out joint projects and learning to manage conflicts, in a spirit of pluralism,
mutual understanding and peace. Educators in many Western countries have been
concerned with the implementation of multicultural programmes since the 1970s. The
programmes use different names such as ‘Multi-ethnic education, Multi-racial education,
Multicultural education. Normally these names are used by the USA and the UK (Banks,
1981).
3.2.1 Teacher training for multicultural education Teachers play a key role in schools. The quality of teachers appears to be the most
important within-school factor affecting students’ performance. Teachers who teach in
the multicultural classroom need to develop more teaching strategies relevant to
multicultural backgrounds in the school. Sharma (2005) explains teaching strategies
which teachers have to develop when they teach in the multicultural classroom.
Pre service teachers need to become reflective practitioners and learn to apply observational, empirical, and analytical skills to monitor, evaluate and revise their own teaching styles. They need to develop awareness of their own cultural perspectives, beliefs and behaviours and to be aware that their own cultural perspective is not the universal perspective and only right one. Pre service teachers need to acquire multicultural competence, the ability to function in cross-cultural settings, and be able to interact and communicate effectively with diverse students and their parents
(Sharma, 2005 p. 54-5).
Gorski (2000) argued that all teachers must be trained in multicultural education to be
able to provide effective education for an increasingly diverse student population.
Blackwell et al (2003) working in an American context, have suggested that to support
diversity through multicultural education, some significant changes in the teacher
education curriculum are needed. Courses related to culture, linguistics, diversity, gender,
race and equity need to be included in the teacher training curriculum. Indeed, as Sharma
(op cit.) went on to explain, global knowledge and cross-cultural experience must be

38
influenced through teacher education programmes. Gorski (2000) also recommends that
educators must continue to practice multicultural education inside and outside of the
classroom.
Gay (1994) and Ladson-Billings (1994, 1995) suggested, also from an American point of
view, that the teacher education curriculum must develop a theoretical and practical
connection between cultural relevance and academic success of students from different
cultural backgrounds. Further, they suggested that the teacher education curriculum
should provide pre-service teachers with practical experience, and an opportunity to learn
to apply diversity education through their training. Munn (1996) also noted that teacher
educators should be trained in cultural diversity so as to be able to educate teachers to
teach with cultural sensitivity.
3.3 Education for social cohesion in multicultural societies in Sri
Lanka
In Sri Lanka schools were set up as individualized institutions by different religions as a
result of colonial influence. These schools were set up often on a competitive basis with a
religious motive, and contributed to the disintegration of colonial and post-independent
Sri Lankan society along religious and ethnic lines.
In 1956, with the enactment of the Sinhala language as the official language, the inter-
ethnic relations in Sri Lanka started to change. After introducing Swabasha (mother
tongue) in the 1950s and 1960s, a large number of students of the majority community
entered the education system of Sri Lanka.
Today there are Sinhala, Tamil, Muslim, Buddhist, Hindu, Catholic, and Christian
schools, a situation that encourages ethnic and religious segregation of children in
schools. In 2010, ethnically there were 6760 Sinhala schools, 2115 Tamil schools and 810
Muslim schools in Sri Lanka. There is therefore a threefold segregation of society
according to language, religion and ethnic origin.
3.3.1 Social integration in Sri Lanka Social integration is a key goal in Sri Lanka. Recently the Ministry of National Language
and Social Integration introduced the ‘National Policy Framework for Social Integration’
(MNLSI, 2013). This document identified that access to education is fundamental to
achieving social cohesion. MNLSI are expected to work in collaboration with the

39
Ministry of Education, Ministry of Higher Education and Ministry of Youth Affairs and
Skills Development to adopt a five-pronged strategy:
• the proposed Apex Body should take the necessary steps to guarantee the right to
education, being proactively mindful of and cautious against any marginalization,
particularly on the grounds of socio-economic disparities, ethnicity or religion
throughout the education process.
• the effectiveness of existing national policies on education should be appraised
within the comparative action on Education for Social Cohesion and Peace
(ESCP) (2008) and national education action plans for peace and sustainable
development (2012).
• special emphasis should be placed on the mode of delivery of learning, the
medium of instruction on offer and schooling experience in a cohesive
environment.
• the school curriculum should promote social cohesion with special focus on
learning of a second national language, English as a link language and
comparative learning of religious, ethnic, civic and human values.
• teaching techniques and the syllabus shall reflect and value diversity and unity,
and strengthen capacities for interaction and integration through core-curricular
activities.
• The MNLSI intends to conduct a special programme on the principles of social
integration for school principals, teachers, and non-academic staff.
3.4 Multicultural education policies in Sri Lanka from 1948 to the
present
3.4.1 Background (Sri Lanka) There were two main drivers for multicultural education in Sri Lanka. Perera et al. (2004)
and Colenso (2005) describe how, after independence, management of the education
system in Sri Lanka had privileged the Sinhalese majority. In 1956, with the enactment of
the Sinhala language as the official language, (Official Language act, No. 33), inter-
ethnic relations in Sri Lanka between Sinhala, Tamil and Muslim communities started to
change. In the 1970s with the new admissions policy (Standardisation Policy) to the
universities, there was a further deterioration of inter-ethnic relations. These policies were
later changed (see Chapter 2). The Report of the Presidential Commission on Youth
(1990) explains that ‘the Sinhala-only Act of 1956 and the policies of standardisation of

40
the 1970’s were presented as the major political reasons leading first to the demand for
federalism and then to a separate state’ (p.87).
3.4.2 Multicultural education attempts through educational reforms The goals of multicultural education (as identified by Banks 2008), peace building, good
citizenship and social cohesion are compatible with the goals of Sri Lankan education
policy documents. The school curriculum of Sri Lanka does not have multicultural
education as a separate subject. However, the first report of the National Education
Commission, (1992) focused on multicultural education among the national educational
goals.
• The achievement of a functioning sense of national cohesion, national integrity and national unity.
• The establishment of a pervasive pattern of social justice and active elimination of inequalities.
• The evolution of a sustainable pattern of living a sustainable lifestyle. • Seeking a livelihood and work opportunities that are, at one and the same time,
productive and give avenues of self-fulfilment. • Participation in human development that will support socio-economic growth of the
country. • Involvement in nation building activities, learning to care. • Cultivating an element of adaptability to change, learn and adapt developing
competency to guide change. • Coping with the complex and the unforeseen; and achieve a sense of security and
stability. • Securing an honourable place in the international community
(NEC Report, 1992, cited by ESP Report, 2008, p.3).
The National Education Commission (1992) introduced sets of basic competencies of
education in Sri Lanka. Among the basic competencies, the third set of competencies is a
focus on values and attitudes which argue that it is essential for the individual to
assimilate values which are consistent with the ethical, moral and religious modes of
conduct, rituals, practices in everyday living, selecting that which is most appropriate.
Nevertheless the Report of the General Education Reforms (1997) criticised the education
system in Sri Lanka at that time. It explained that the education system did not produce
the knowledge and understanding and the skills and attitudes appropriate for successful
living. Further it explained that the development of the students’ total development,
creativity, initiative, discipline, team spirit, respect and tolerance for other people and
other cultures was not being achieved. Therefore, educational reform was an urgent
priority. This reform in 1997 gave more priority to enable all people to access knowledge
and information. It gave more attention to Sri Lankan values education and national
integration. As values and morals cannot be taught through separate subjects, the reform
suggested they should be learned continuously through all subjects and through all the

41
years of schooling. For example, the teaching of religion can contribute to building
appropriate values and morals. The policy makers believed that, during this process,
students will learn to understand religious practices, values of other groups of children,
understand other cultures and pay respect to them.
The Report of General Education Reforms (1997) covered the entire spectrum of general
education from primary to junior and senior secondary levels, with the expected outcome
of achieving the national goals and the five competencies. Changes were proposed in:
• the system of teaching-learning;
• student guidance and counseling;
• subject curricular at all levels of schooling;
• the design, production, and provision of textbooks;
• school-based evaluation processes;
• teacher education; and
• procedures for the effective management of schools to facilitate the
implementation of reform.
The National Education Commission (2003) also identified that education has failed to
promote nation building by fostering mutual understanding and tolerance and respect for
the rich cultural diversity of Sri Lankan society and that the education process has made
little contribution to ensuring social cohesion.
The new Education Act for general education in Sri Lanka (2009) includes two national
goals relevant to multicultural education in Sri Lanka:
• Developing a Sri Lankan citizen with love and dedication to the motherland through fostering national cohesion, national integrity and national unity.
• Respecting human dignity, recognizing the pluralistic nature and cultural diversity in Sri Lanka, and upholding tolerance and reconciliation
(The new Education Act for general education in Sri Lanka, 2009, p.9).
Every child should have the right to education. Therefore, the state ensures free education
from kindergarten to university. The same education Act suggested Mother Tongue
(Sinhala-Tamil) should continue to be the medium of instruction at primary and
secondary levels. Bilingual or English medium is an option at the Secondary level. Then
the Act suggested the Sinhala language and Tamil language should be taught to every
child to build social cohesion and social harmony in society and produce an individual
committed to ethical values. For the same reason all children should learn about their
religion. Considering this view, the New Education act (2009) suggested giving a
compulsory period of education in school for religion. It concentrated on promoting
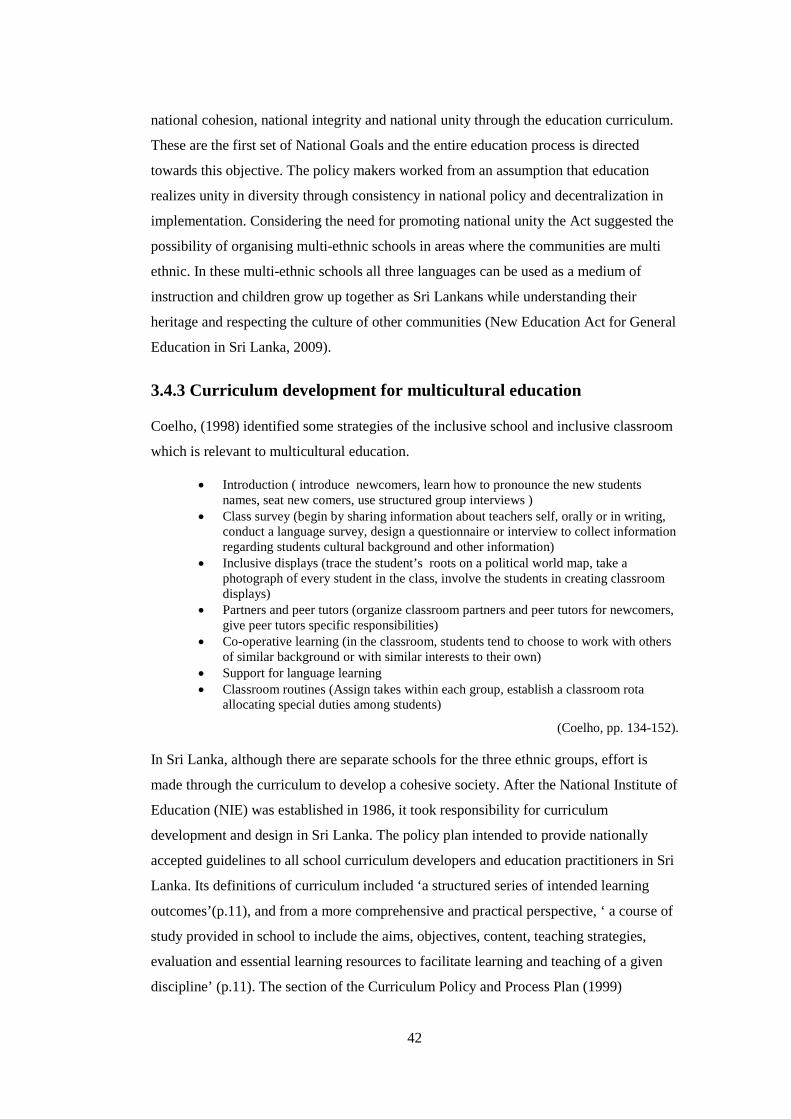
42
national cohesion, national integrity and national unity through the education curriculum.
These are the first set of National Goals and the entire education process is directed
towards this objective. The policy makers worked from an assumption that education
realizes unity in diversity through consistency in national policy and decentralization in
implementation. Considering the need for promoting national unity the Act suggested the
possibility of organising multi-ethnic schools in areas where the communities are multi
ethnic. In these multi-ethnic schools all three languages can be used as a medium of
instruction and children grow up together as Sri Lankans while understanding their
heritage and respecting the culture of other communities (New Education Act for General
Education in Sri Lanka, 2009).
3.4.3 Curriculum development for multicultural education
Coelho, (1998) identified some strategies of the inclusive school and inclusive classroom
which is relevant to multicultural education.
• Introduction ( introduce newcomers, learn how to pronounce the new students names, seat new comers, use structured group interviews )
• Class survey (begin by sharing information about teachers self, orally or in writing, conduct a language survey, design a questionnaire or interview to collect information regarding students cultural background and other information)
• Inclusive displays (trace the student’s roots on a political world map, take a photograph of every student in the class, involve the students in creating classroom displays)
• Partners and peer tutors (organize classroom partners and peer tutors for newcomers, give peer tutors specific responsibilities)
• Co-operative learning (in the classroom, students tend to choose to work with others of similar background or with similar interests to their own)
• Support for language learning • Classroom routines (Assign takes within each group, establish a classroom rota
allocating special duties among students)
(Coelho, pp. 134-152).
In Sri Lanka, although there are separate schools for the three ethnic groups, effort is
made through the curriculum to develop a cohesive society. After the National Institute of
Education (NIE) was established in 1986, it took responsibility for curriculum
development and design in Sri Lanka. The policy plan intended to provide nationally
accepted guidelines to all school curriculum developers and education practitioners in Sri
Lanka. Its definitions of curriculum included ‘a structured series of intended learning
outcomes’(p.11), and from a more comprehensive and practical perspective, ‘ a course of
study provided in school to include the aims, objectives, content, teaching strategies,
evaluation and essential learning resources to facilitate learning and teaching of a given
discipline’ (p.11). The section of the Curriculum Policy and Process Plan (1999)

43
document indicating main principles and considerations states that the broad curriculum
framework should serve the needs of a multicultural, pluralistic, but nationally integrated
society, in addition to learning varying from home and community environments. In
content, there can be no bias in relation to ethnicity, religion, gender, or economic
deprivation. In addition there is a provision for local adaptation of such variations in the
primary curriculum and selected subjects in the secondary curriculum which are
permitted only with the approval of the NIE. The Curriculum Policy and Process Plan
further specifies that the national curriculum should be designed to recognise that
children are unique, and that they come from different communities and backgrounds.
Reference is made to a Quality Control Mechanism, with units to be set up at the NIE and
the Education Publication Department to ensure that there is no bias in the curriculum
against ethnicity, religion, gender and social and economically disadvantaged groups and
the curriculum is to be pretested among groups where different languages and ethnicities
are represented.
Perera et al (2004) explain that the NIE engages a similar process for the design of totally
new curricula as it does for revisions of already existing curriculum. Ethnic, religious and
gender representation is ensured in drawing up subject committees. This representative
resource group then designs the curriculum. For some subjects such as language and
religion, the respective groups would proceed to develop the curricular in the different
language media, within the agreed-upon common curriculum structure.
The Education for Social Cohesion Project (2005 - 2009) (Perera et al., 2004) identified,
however, that the quality of classroom instruction in Sri Lankan schools is generally poor
and that there is inequality in access to education between rural and urban areas. The
decisive factor is often one’s ethnic and language affiliation. Therefore, Sri Lanka needs
sustainable education not only in former war regions in the North and East but also in the
rural areas of the country. Classroom lessons may not be suitable to harness the potential
of the children and youth. The chance to fulfill the preconditions for a peaceful
coexistence of a multi-ethnic, multicultural and multilingual society through education
may be missed. The Ministry of Education of Sri Lanka has tried since 1997 to introduce
reforms in the education system, but to implement changes to this system is difficult with
a lack of competent and experienced human resource at all levels.
Textbooks The education publication department (EPD) has responsibility for producing national
textbooks. The EPD has its own programme for promoting social cohesion and multi-

44
ethnic understanding under two aspects: producing texts in the two national languages
and ensuring that textbooks reflect Sri Lanka’s pluralistic society (Perera et al, 2004). In
Sri Lanka, the government’s provision is of one standard textbook for each subject.
Textbooks are produced nationally in the three languages: Sinhala, Tamil and English. In
addition, language textbooks are produced in the three languages, with English texts
provided for each grade. However, as of 2004, and beginning with Grade Six, schools and
students were given the option of selecting from among multiple textbooks to be used in
parallel with the prescribed text. It is worth noting also that, under the free textbook
policy, the Education Publication Department (EPD) has produced textbooks for Tamil
and Sinhala as a Second Language (Grades Six to Eleven).
Since the 1980s school textbooks have been reviewed to identify biases in the on-going
conflict between the different ethnic groups. The National Integration Programme Unit
(NIPU), a semi-public government organisation also attempted to build ethnic unity and
understanding through educational and cultural programmes. They conducted a content
analysis of school textbooks to revision and raise awareness among the education sector
concerning the need for sensitivity criteria to guide textbook writing. In addition, they
conducted seminars, issued publications and training to resource persons in peace
education. A number of concerns have been identified:
One outcome is that review of social studies and history, language, religion, environmental studies, and science textbooks have on the subject been available since the 1980s, with an increased number of reports and articles as a result of more intensive and academic and public security in the 1990s, pointing out that school texts contained a series of biases. Mono ethnic and mono religious biases, gender biases, an imbalanced portrayal of cultural heritages and many factual and contextual errors were documented as having been committed in the process of writing school texts. Both language groups have complained about factual, grammatical and spelling mistakes in textbooks, alleging that even in spite of wide publicity, the errors have not been corrected. In addition, process issues such as the ethnic composition of the advisory boards and panels that write and review textbooks, and the practice of translating texts from Sinhala to Tamil, have been considered discriminatory and non-conformity with processes being advocated globally
(Perera et al, 2004, p. 339).
3.4.4 Multicultural education through peace education in Sri Lanka Peace education is a new phenomenon in Sri Lanka, developed from the 1990s by the
governmental National Institute of Education (NIE) in collaboration with UNICEF. The
programme named ‘Education for Conflict Resolution’ (ECR). The ECR programme was
integrated into the entire curriculum. For example, Buddhism, one of the major religions
in Sri Lanka, emphasised the importance of taking the middle path. Sri Lankan village
life has traditionally operated on cooperative principles, so educators suggested

45
cooperative behaviour. The Buddhist and Hindu emphasis on harmony with the natural
environment is also joined with this approach. Similarly, Hinduism and Buddhism make
extensive use of mediation. ECR aim is to create a sense of inner peace. A typical lesson
for primary school children, for example, starts with meditation and covers issues such as
decision making and conflict resolution. Role-playing is an important part of the approach
and children are encouraged to express emotions through stories, songs and poetry
(UNICEF 1996).
According to Perera et al (2004) peace education is based on peace, positive thinking,
empathy, inner peace, cooperation, assertiveness, critical thinking, and decision making,
conflict resolution, non-violence, community peace building, caring for the planet and
inter cultural understanding. UNICEF provided funding support and at the same time
worked against the recruitment of children by the LTTE. Later peace education was
integrated within the Ministry of Education. The NIE prepared several teacher guides,
syllabus and learning articles in the form of a book. These materials were widely
distributed to all provinces. The guide was based on the themes of peace, positive
thinking, empathy, inner peace, cooperation, assertiveness, critical thinking and decision
making, conflict resolution, non-violence, community peace building, caring for the
planet, and intercultural understanding. Peace education was delivered through the cross-
curricular integration of the formal subjects in the schools. At the same time schools were
encouraged to implement co-curricular projects such as organising intellectual events,
inter school friendship camps, peace seminars, and peace dreams to peace education.
In the 1990s a special unit of the Ministry of Education in Sri Lanka focused on a number
of peace awareness programmes among school children. They introduced National
Peace Week in all schools in the country. Furthermore they organised various
programmes such as a support programme for war affected children, arranging
community development activity programmes and seminars on civic themes. They
organised education programmes on peace, active non-violence, national integration,
students leadership development, intercultural appreciation programmes, art exhibitions
on peace themes and school link programmes to bring children of different communities
together. Then they published resource materials for resource persons (ninety two zonal
education officers) in provinces.
Perera et al (2004, p. 411) explored how the above initiatives for peace education through
the curriculum have taken effect. They found evidence of co-curricular projects on the
themes of peace education being undertaken in schools and efforts to build connections

46
between different ethnic groups and religious groups through playful activities,
organising multi-ethnic cultural events and students exchange programmes (between the
north, the east, and provinces in the south). They also examined the extent to which
cross-curricular integration and raising teachers’ awareness as peace educators has been
affected, by reorienting teacher education programmes to ensure the professionalization
of every teacher and teacher educator as a peace teacher.
The social cohesion and peace education unit in the Ministry of Education started the
student parliament programme under the 2008/15 circular. This programme seeks to
provide experience on responsibility and duties to future citizens through creating
awareness and values of parliamentary democracy and brotherhood, by listening to others
and tolerating the view of others (Circular, 2008/15). There is another programme
conducted by the peace education unit in the Ministry of education called ‘Pals of two
cities - experience exchange’ to develop broad social cohesion by building mutual
understanding and friendship among students in the north and south of the country.
3.4.5 Multicultural education through language As previously explained Sri Lanka has two official languages: Sinhala, the language of
the majority Sinhalese, and Tamil, the language of the minority group of Tamils. English
is also widely used in government, administration and higher education. All government
documents are published in Sinhala, Tamil, and English and these languages are used in
the media (Coperahewa, 2009).
Historically, at the end of the 1960s Sinhala teachers were recruited to the Tamil medium
schools to teach the Sinhala language. A 1962/03/21 circular explains that students have
to learn Sinhala or Tamil or English as a second language and select one subject to study
at ‘O’ Level.
Currently Sri Lanka students’ media of education are Sinhala, Tamil and English. Table
3.1 shows the schools by Medium of Instruction:

47
Table 3.1: School by medium of instruction (Source- Ministry of Education in Sri Lanka
2012)
Medium of Instruction No. %
Sinhala only 6,368 64.3
Tamil only 2,914 29.4
Sinhala and Tamil 39 0.4
Sinhala and English 403 4.1
Tamil and English 152 1.5
Sinhala, Tamil and English 29 0.3
Total 9,905 100
According to Table 3.1, there is a large number of Sinhala medium schools in Sri Lanka
and smaller number of Tamil medium and bi-and tri-lingual medium schools.
The Report of the Presidential Commission on Youth (1990) identified that there is
widespread discrimination against those who are monolingual, whether they be Sinhala or
Tamil. Therefore, the Commission thought it was important immediately to prevent this
kind of linguistic discrimination. For this reason the Commission suggested Sinhala and
Tamil literature should be introduced into the school curriculum and teaching of Tamil to
Sinhala students and Sinhala to Tamil students from Years Three to Six. The purpose of
this would be to expose the children to the language and culture of the other community.
The commission also identified that the English language can bridge the big gap between
the rural and urban communities. So they recommended teaching English as a
compulsory subject from Grade three onwards.
In 2000 English medium was introduced for GCE (A/L) Science students and in 2002
English medium instruction was introduced at the junior secondary level (Science and
Mathematics at grade six and later to Social Studies and Health and Physical Education).
With more pressure to allow English medium instruction to more subjects of the
curriculum, bilingual education became the policy of the government in 2008 (New
Educational Act for General Education in Sri Lanka, 2009). Yet in 2012 little had
changed.
One implication from the above information is that the second language is viewed as very
important to develop inter-cultural understanding among students in Sri Lanka. Teaching
and learning of the second national language is crucial to Sri Lanka’s national integration
and cohesion, as the first of the national education goals outlines (NER, 2003). Being a
multicultural society it is very important for every Sri Lankan to learn a national language

48
other than his or her own. However, the Population and Census report of Sri Lanka
(2001) indicate that the number of Sri Lankans who are competent in the two National
Languages as well as in the link language (English) is minimal.
There is often a distance between Sinhalese and Tamils in Sri Lanka because of the
language barriers. Long term social cohesion in Sri Lanka requires the creation of
political, legal, educational, and cultural institutions which serve to foster a pluralistic and
multi-ethnic environment.
However, the push and pull factors that motivate or demotivate the teaching and learning
of the official languages in schools need to be recognised and addressed. Perera et al
(2004) identify the following factors as being among the principal ones to consider:
• the political will and determination to sustain the initiative of teaching both official languages to all children;
• the incentive and directives given to the school system and students that would influence the preference a student might have for learning the ‘other’ official language;
• the nature of the school climate for teaching and learning in these languages; and • the motivation of teachers to teach the languages
(Perera et al, 2004, p.403).
The New Education Act for General Education in Sri Lanka (2009) saw education as a
means of engineering social change in particular, social harmony, national cohesion,
national integrity and national unity in Sri Lanka. Therefore, a significant potential for the
achievement of national cohesion and national unity was identified as strengthening the
position of English as a link language between communities. A common means of
communication might then play its part in promoting genuine understanding among
different groups. In particular, for English to serve as a link language between children of
different ethnic groups, the students must coexist on the same school premises and come
together during English periods and during other subjects as well if they are offered in the
English medium. The government school system initiated the teaching of advanced
(senior secondary) subjects in the English medium, beginning with science and
mathematics, which provides another opportunity for a multi- ethnic composition of
students in these classes.
3.4.6 Life competency and citizenship education The Curriculum Policy and Process Plan (1999) considered several aspects related to the
present situation. Among these aspects some are related to students’ multicultural
backgrounds. The plan explained that ‘unity in diversity’ will be one of the main

49
characteristics of an inter-dependent world. Therefore, human cooperation and moving
from the national level to the world level are important.
The world has become an irreversibly inter-linked and interrelated entity. There is an expanding process of international production sharing and global redistribution of labour and industry. Instantaneous communication is breaking down the walls of seclusion and isolation. The reality of the inter linked world is vividly manifest in the problems, which have no cultural or political boundaries, such as environmental pollution, ecological imbalance and spreading of diseases. Cultural differences will remain and the global citizen will have to learn to appreciate cultural pluralism instead of being hostile towards it. ‘Unity in diversity’ will be the main characteristic of the emerging inter-dependent world. The form of human cooperation for mutual enrichment as well as survival is moving from the national to world level. All human achievements are a common heritage of mankind to be shared and participated in by each generation.
Curriculum Policy and Process Plan (1999, p.4-5)
This curriculum policy leads the way to all education practitioners in Sri Lanka including
school curriculum developments. Therefore, these policies are consistent with the
national goals as recommended by the NEC while promoting personal growth and
preparing for a multicultural society.
In January 2007 a new curriculum was introduced for Life Competencies and Citizenship
Education (Grades from Six to Nine) and Citizenship Education and Governance (Grades
from Ten to Eleven).This curriculum contains many peace related concepts (ESCP,
2008). For example, Life Competencies and Civic Education grade eight subject goals
part II includes the following:
• Develop competencies that enable individuals to live in harmony in a multicultural society.
• Produce citizens to protect human qualities and social values. • Develop competencies to produce a disciplined and law-abiding citizen to the society • Mutual co-operation in personal and social activities. • Education on the systems of government in Sri Lanka and the world. • Build up society that works in accordance with democratic principles and the Charter
of Human Rights. • Develop strengths to face effectively the unexpected and complex situations of the
ever changing world. • Build up a society that mutually respects responsibilities and duties. • Get social institutions and organizations involved in the well-being of the society
(Teachers Instructional Manual, 2008, p.3).
In Sri Lanka, the existing school system can be used to promote integration for social
cohesion in a number of ways. To maintain equity for every ethnic group the Ministry of
Education and Higher Education gave permission for Muslim Girls to attend schools
attired in their traditional Punjabi costume, if they so desire under Circular No 37/1995.

50
Further:
a. There are schools where students from different communities learn together peacefully. Their language backgrounds may differ but they study in one language, apparently without discrimination (for example, Tamil children learning in Sinhala in a Sinhala medium school, and more rarely, Sinhala children learning in Tamil in a Tamil medium school). The process of these schools and the student’s experiences need to be studied and good practice disseminated to other schools.
b. There are schools that have two or three language media side by side, and principals of these schools have said that this creates social cohesion and harmony among different ethnic groups, through different cultural events, sports activities aesthetic activities etc. One tri-media school in fact caters for four religions, with shrines for each. There is however no accepted and official way to establish this kind of school in the system. Girls’ schools with three language mediums are rare. These schools are not able to be established in mono-lingual areas of Sri Lanka. There are debates about the degree of harmony and balance in the bi or tri-media schools, and whether there can be tension between groups or imbalance in terms of who is in control.
c. ‘Amity schools’ (children from all races and religions aiming at building communal harmony among them) were established to bring together high achieving students from different ethnic groups studying and working together, with all students to be trilingual at graduation
(ESCP, 2008, p.17).
3.4.7 School subjects and their potential for social cohesion History According to Perera et al (2004) history as a subject has significant potential in
facilitating social cohesion and integrity. However, he identified weaknesses with the
curriculum delivery in schools because the history of Sri Lanka and its people and land is
not portrayed objectively in the texts, and that such partiality and imbalance goes against
the grain of cultivating social cohesion. They have also critiqued how history has been
conceptualised, interpreted, and portrayed in textbooks, enumerating the following
shortcomings:
• It has been written in a narrative style that is focused on tracing continuity from pre historic times to the present;
• It is event centered rather than problem centered; • It is prescriptive rather than encouraging of a multiplicity of possible interpretations; • It disregards the fluidity of identities and fails to maintain the lack of certainty about
categories in presenting all cultural identities; • It does not discuss objectively the complex dynamics that created the ethno- cultural
mosaic of contemporary Sri Lanka; and • It avoids issues such as ethnicity, ethnic conflict, and war
Perera et al. (2004, p. 406).
The National Policy Framework on General Education in Sri Lanka (2003) called for

51
reverting to History, Geography and Civic Education in place of Social Studies and History. Both History and Civic Education were reported to have been undervalued and neglected in the attempt to integrate these subject areas since the 1970s and there was a strong demand during public consultations, seminars and studies that the Social Science component of the curriculum should have separate subjects as is the practice in most countries
(The National Policy Framework on General Education in Sri Lanka, 2003, p. 142).
Religion
There is special demand on the subject of religion in the school curriculum in terms of its
potential for social cohesion. The report of the Presidential Commission (1990)
recommended that awareness of other religions and practices should be introduced into
the school curriculum from the beginning of school. They suggested that all textbooks in
two languages (Sinhala and Tamil) should be re-examined and should include stories
which relate to national harmony and they suggested Arabian Islam be made available in
all Muslim schools. Perera et al (2004) explain that a content analysis of the textbooks
used for the subject of religion at the secondary level which was undertaken as part of an
on-going research project at national level for the National Education Commission,
clearly indicates the nature of the transformation that is needed if the subject of religion is
to be effectively enlisted in the case of forging social cohesion.
3.4.8 Teacher training and professional development to promote multicultural education and social inclusion Teacher training and professional development are other areas that have been targeted to
support education for social cohesion. In 2001, The Centre for the Study of Human
Rights (CSHR) entered into an agreement with the Human Rights Research and
Education Centre of the University of Ottawa and the chief executive of the Governance
and Institutional Strengthening (GISP). GISP provide a contribution to the CHSR to
enhance awareness of teacher trainees on human rights in Colleges of Education in Sri
Lanka. The aim of the programme was to enhance the capacity of the teacher trainees to
assist secondary level students in their human rights projects and give knowledge
regarding teachers’ responsibility to protect the rights of others and the values and
attitudes necessary for them to assist in creating a more civic conscious society. The Sri
Lankan Human Rights Commission conducted a project with the collaboration of CSHR
to develop curricula that would be introduced to the formal education sector. Modules
have been developed for the training of principals, teachers, preschool teachers, primary
and secondary students in the formal education sector with NIE collaboration.

52
The Ministry of Human Resource Development Department (MHRD) and Education &
Cultural Affairs (E&CA) have also made efforts for social cohesion through collaboration
with the German Technical Cooperation (GTZ). The German government funds through
the GTZ, The Basic Education Sector Programme (BESP), MHRD, E&CA, and eight
principal ministers work together within the context of the recent education reforms
designed by the government of Sri Lanka. Cardozo (2006 p.65) stated according to the
interviewed GTZ officers, ‘for research on peace education Sri Lanka is like a
laboratory’. Since 1999, BESP had been concerned about quality improvement in
primary education through pre-service and in-service training of primary teachers
supporting the peace process among Sinhala, Tamil and Muslim communities in the
country. In addition the programme focused attention on children and youth who were
enabled to complete their primary education and changing attitudes in the target groups
by incorporating peace concepts and rehabilitation of the education system in the North
East and disadvantaged areas. Furthermore the programme has focused on developing a
new primary service Teacher Education course paying attention to language curricular
instruction in five subjects such as mother tongue Sinhala, mother tongue Tamil, second
national language Sinhala, second national language Tamil and English. The second
importance of the teacher in-service projects was education educating practicing teachers
about the Sri Lankan education system. To achieve its purpose they used five manuals
relevant for social cohesion such as conflict transformation and understanding how to
protect the child. This started in the northeast and the central province in 1999 and was
gradually extended to other provinces in the country.
To assist new teachers in teaching in delivering a socially cohesive society teacher
education was an area that was considered to need revising. According to Perera et al
(2004) the 1997 reform proposed that the curriculum for teacher education be revised for
teachers with the necessary competencies for effective delivery of the school curriculum.
Teacher education is expected to include education for human values, human rights,
national cohesion, gender rights, and the environment. Student teachers are provided with
facilities to improve their competency in the official languages and in the link language
(English). Furthermore, the reforms suggested the integration of concepts of national
cohesion, peace, and conflict resolution into teacher education programmes focusing on
the principles of education, classroom management, sociology of education, counselling
and guidance. These concepts also contributed to enrich the general education subjects of
life competencies, religion, and culture.

53
The NIE provides pre-service peace education training to teacher training students and
the Ministry provides in-service training to principals and teachers. It also provides books
related to peace education (Sinhala and Tamil) to the 10,000 Sri Lankan schools free but
it is unclear how all these schools have received and used them since (Cardozo, 2006).
However, Cardozo, (2006) criticized the Ministry of Education works with zonal peace
education co-ordinators, providing in-service training and funding for extra-curricular
activities while the NIE provides pre-and in-service training. These governmental
institutions do not co-operate in their training efforts. Cardozo (2006) identifies some
challenges related to the programme: lack of resources, both material-wise and person-
wise, wastage of resource and overlapping work, lack of co-operation and co-ordination
in the field of peace education initiatives and a national plan, lack of suitability, lack of
evaluation and monitoring, a segregated school system and the need to overcome the
region-wise inequalities within schooling, language barriers and monoculture textbooks.
Further he found that religion plays a more prominent role in Sri Lankan peace education,
both at the policy and the programme level. According to the respondents of his research
at the policy and programme level, co-operation and co-ordination through a national plan
for peace education is needed.
3.4.9 Education guidance and counselling for community cohesion
As a result of the Educational Reforms in 1997, all schools have provided education and
vocational guidance to students and planned to get help from parents for better decision
making with regard to children’s further education. The LLRC Report (2011) notes that
there are children who suffer from psychological disorders as they have been exposed to
violent conflict and have lost their parents and therefore special attention should be
provided to these children including counselling where necessary.
3.5 Concerns about Sri Lankan multicultural policy and practice
Despite all the attempts to bring about reform in the middle 2000’s there still remained
some concerns. The National Education Research and Evaluation Centre (NEREC)
(2004), (Perera et al., 2004) and World Bank documents (Colenso, 2005, p.420) indicated
a number of key research findings of concern in relation to multicultural policy and
practice in schools in Sri Lanka. Some related to issues of communication with people
from other ethnic groups:

54
• 18% of fourteen year olds had never or rarely had a chance to learn the second
national language.
• 49% of fourteen year olds reported that they had no close friends from other
ethnic groups.
Some conclusions were related to differences in educational opportunities and
achievement:
• Under-representation of the minority groups in national-level education
institutions weakens public confidence in the ability of these institutions to take
account of minority concerns.
• Fourteen year old students in the North Eastern Province scored 8% below the
national average in ‘civic knowledge’ tests.
Sensitivities in multicultural education had to be handled with care, however:
• Focus group discussions showed that ‘history’ and ‘citizenship’ have the
potential to divide groups, rather than unite them, if an inclusive, multicultural
approach is not adapted.
Teachers had specific ideas about how to promote multicultural practices. For example:
• Teachers listed the following priorities for civics: training in subject matter and
teaching methods, better materials/textbooks, special projects, and resources for
co-curricular activities.
However, there was a strong feeling among some that initiatives have to be clear, focused
and adequately resourced:
• Focus group with ‘Life Competencies’ teachers revealed a lack of clarity over
objectives and curriculum content, insufficient training, under-resourcing and
lack of system-wide support.
Colenso (2005) explained that the theoretical base for understanding education and social
cohesion is limited. So there is a gap between the practical tools for education policy
makers, assessment of the impact of policies and investments and plans for future reform.
Nevertheless there was some optimism about the potential of schools to support peace-
making processes and greater inter-cultural understandings. For example:
• Action research in a teacher training college had shown that structured
opportunities for inter cultural collaboration can help reduce ethno-centric

55
attitudes in student teachers, and also help them to handle effectively the concept
of ‘social cohesion’ in the classroom.
• Measures to promote respect for diversity in textbooks had achieved some
success.
• There were islands of excellence at school level, due in large part to the
leadership of committed and organised principals.
• 90% of fourteen year olds felt that schools should contribute to activities to bring
about peace.
3.6 Multicultural education policy in England
In the early post-war period, schools in England had no multicultural education policies
as they tried to assimilate immigrants into the national culture (Bleich, 1998). Thousands
of migrants had come to Great Britain from former British colonies such as the
Caribbean, and the Indian subcontinent in response to the demands of industry and the
labour needs of the service sector of the economy. At the time the education system in
England showed a complex picture (Lynch, 1986; Verma and Pumfrey, 1988) and ‘race
relations’ become an important issue within British society and government in the post-
World War II era (Nazir, 1995 p.4).
Since the 1960s researchers have analysed the different phases of multicultural education
policy efforts in England in slightly different ways. Some writers have conceptualised
that multicultural education was implemented across five-six phases, for example:
Lynch (1986) scheduled the periods:
• The ‘laissez- fair’ phase
• The immigrant and English as Second Language (ESL) phase
• The deficit phase
• The multicultural phase
• The anti-racist phase.
Brandt (1986) considers that ‘race relations’ in Britain can be divided between periods of
assimilation, integration, cultural pluralism, multiculturalism and anti-racism which
challenged exiting power relations in schools and society. Gillborn (2001) however
identified the following stages:
• Ignorance and neglect (1945 to late 1950s)
• Assimilation (late 1950 to mid – 1960s)

56
• Integration (mid 1960s to late 1970s)
• Cultural pluralism and multiculturalism (late 1970s late 1980s)
• Thatcherism (mid-1980 to 1997)
• Naïve multiculturalism: New labour, old inequalities 1997 onwards).
This contrasts with Arora (2005) who suggests that multicultural education occurred in
three overlapping phases of assimilation, integration and cultural pluralism. According to
Gillborn in the ‘ignorance and neglect’ (1945 to late 1950s) period the social and cultural
phenomena of minority ethnic communities were neglected (Bartlett and Burton, 2007).
The other stages identified by Gillborn are explored below.
3.6.1 Assimilation During the 1960s when there was an especially huge level of immigration from British
Commonwealth countries assimilationist theories and policies took precedence in
England (Maylor, et al, 2006). ‘During the first part of this period it was assumed that any
immigrants would become part of British society and should not have their cultural
differences highlighted. It was expected that ‘they’ would dress, talk and live like ‘us’
(Bartlett and Burton, 2007 p.170) that is like the indigenous population. However, the
result of assimilation was often racism experienced by minority ethnic communities
(Carby, 1982; Wright, 1987).
3.6.2 Integration In 1966 it emerged that assimilationist philosophy had been a failure. Roy Jenkins, Home
Secretary at the time, defined integration as a ‘Not a flattering process of assimilation but
as equal opportunity, accompanied by cultural diversity, in an atmosphere of mutual
tolerance’ (NCCI, 1966 from Arora, 2005, p 21). The main character of this perspective
was a focus on reducing the prejudice against minority groups. Teaching about culture
was intended to promote a positive self-image among Black people and tolerance and
sympathetic understanding among White people (Arora, 2005). Emphasis was placed on
integrating minority ethnic communities into the British society rather than assimilation.
3.6.3 Multiculturalism In between the late 1970s and the late 1980s some minority ethnic groups experienced
social unrest, high unemployment, poor housing and lack of opportunities. The result of
this was that among some minority ethnic groups, problems grew in the form of difficult
and disruptive behaviour by youths at school (Bartlett and Burton, 2007). Therefore,
assimilationist and integrationist policies could not control the situation and there was a
new focus on multiculturalism. ‘Multicultural theories propose that individuals can

57
maintain their individual ‘minority’ identity whilst at the same time becoming part of the
wider society. Minority groups were encouraged to speak for themselves’ (Maylor et al,
2006, p 16). The aim of multicultural education was to understand and celebrate
difference through education. This difference was reflected in the curriculum by
educating about different cultures (Bartlett and Burton, 2007). In its simplest form
multicultural education incorporated an awareness of the music, clothes, food and
festivals of minority ethnic groups into the curriculum (Gardner, 2004).
The Labour Government’s Green Paper on education (1977) clearly explains that UK
society is a multicultural and multi-racial one. Therefore, the school curriculum should
reflect a sympathetic understanding of the various cultures and races that make up the UK
society (DES, 1977, p.14). The Department of Education and Science (1981) also stated
clearly that learning in a multicultural society should help students to develop religious
values, tolerance of other communities and life styles and understanding of the
interdependence of individuals and nations. In 1977 the Multicultural Education Centre
was established in Bristol which supported schools to develop a multicultural curriculum.
At the time British educationalists believed that it was not enough to just incorporate
various cultural traditions within the curriculum as there are discriminatory structures
which affects all students in the education system that must be recognized and addressed,
and teachers need to counter racial bias in learning materials in the curriculum and school
policies, for example school policies on community languages and meals which should be
culturally acceptable to all students:
We started with a concern for the special needs of minority ethnic groups children (and, of course, the language and other educational needs of these, as of all children, ought to be catered for). Then came the recognition that some multicultural education issues are relevant to all children in all schools-issues such as those of racial bias in learning materials and of ethnocentricity in the curriculum
(Leicester (1989, p.3).
Between 1981-85, Sir Keith Joseph’s period of office as Secretary of State for Education
set up CATE (Council for the Accreditation of Teacher Education) which included some
requirement that all student teachers should have some training for teaching in a
multicultural society. He reserved grants for in-service training for teachers covering
teaching a curriculum about multi-ethnic society and this training assumed a national
priority in 1986 and 1987. Another crucial development was that under the umbrella of
education for a multi-ethnic and non-racist society some schools and Local Education
Authorities (LEAs) started to create written policy documents in the 1980s (Tomlinson,
2008).

58
During the 1980s people tended to think of multicultural education as an extra subject.
More recently scholars have considered effective multicultural practice in terms of
‘permeation’. Multicultural education should permeate the whole of school life and
educational experience. At the same time all school staff should be involved with this
process. Multicultural education should mean working as a team with the overall ethos,
policies, attitudes and objectives of the school (Leicester, 1989).
3.6.4 The Swann Report (1985) In 1985 the report of the Committee of Enquiry in the Education of Children from Ethnic
Minority Groups was published. Leicester (1989) explains that this report has been
influential and identified many issues related to multicultural education. It should be the
responsibility of the government to ensure equality of treatment and opportunity to all
pupils. Black Caribbean students were underachieving at school while Asian students’
performance overall was comparable with White students. Ethnic minority groups faced
discrimination in terms of employment, housing, bullying at school, racism, and negative
teacher stereotyping which in turn affected minority ethnic students’ educational
performance. Ethnic minority education can be improved through introducing educational
policies against racism, introducing a multicultural curriculum, implementing ‘Education
for all’ and maintaining statistics of minority students’ educational performance.
Multiculturalism should be introduced through teaching practice, the curriculum. At the
same time pluralist values and attitudes can be developed through teaching and learning.
Gardner (2004, p.12) explains that the advance made by multicultural initiatives in
schools included in the Swann Report involves:
• treating cultural diversity as a central feature in a broad and balanced curriculum;
• the appointment in each LEA of an adviser for multicultural education who would be responsible for the development of a pluralist approach and countering racism;
• the development of materials designed to reflect a pluralist approach.
Arora (2005) explains that the document ‘Better Schools’ in 1985 builds on Swann and
recommended that all students should develop positive attitudes regarding different ethnic
groups in British society and it should be a major curriculum objective in specified
subject areas and the ethos of all schools.
3.6.5 Antiracist education Despite these various initiatives multicultural educational policies were criticised in the
late 1980s for not addressing issues of racism in schools and its negative impact on

59
teacher and pupil attitudes, and minority ethnic pupil attainment. Anti-racist educational
policies were then favoured for the emphasis they placed on equal educational
opportunities/outcomes and for encouraging teachers and students to think critically about
any racist attitudes/action (Bartlett and Burton, 2001; Gillborn, 1995) they might hold and
to challenge racist pupil attitudes in the class.
Another reason for focusing on antiracist education was the Burnage Report which was
released in 1989 as a result of the murder of Ahmed Ullah, a thirteen year- old
Bangladeshi student, by Darren Coulburn, a thirteen year-old White student, on the
playing fields at Burnage High School, South of Manchester (MacDonald Inquiry).
Within its investigations Burnage pointed to: management styles, teacher-student
relations and student-student relations, and types of anti-racism. The Burnage Report
pointed out within the general British schooling context, the experience highlighted in
Manchester it will be the same experience in most British schools. School management
styles, teacher-student and student relations as well as types of anti-racism may be similar
to those found within Burnage. This report also challenged anti-racism (Nazir, 1995).
The works of Gillborn (1990), Mac an Ghail (1992), Mirza (1992), Troyna & Carrington
(1990) Troyna & Hatchet (1992), Troyna & Williams (1986), among others also suggest
that the situations in other British schools are similar.
Government education statistics (See Table 3.2 in Appendix B) show that when compared
with the majority ethnic group, only Chinese and Indian achievement is high with Indian
and Chinese students generally having greater success than White British pupils
(Gillborn,2005). Table 3.3 in Appendix B shows the disparity among ethnic groups of
period exclusions. Exclusion means that pupils are prevented from accessing the school
curriculum and are hindered from progressing in the same way as other pupils. (See also
Tomlinson, 2008).
3.6.6 Institutional racism In 1993, Stephen Lawrence a Black teenager was murdered by White young people in
London. This incident, investigated through the Macpherson Inquiry, led to the
introduction into official acceptance in the UK of the term ‘institutional racism’ (Parsons,
2008). The term was first coined by Carmichael in the USA in 1967. The Macpherson
Report clearly mentioned that there was a need for institutional racism to be examined in
detail and tackled all levels (including within education). Macpherson’s (1999: 28)
definition of institutional racism is:

60
The collective failure of an organisation to provide an appropriate and professional service to people because of their colour, culture, or ethnic origin. It can be seen or detected in processes, attitudes and behaviour which amount to discrimination through unwitting prejudice, ignorance, thoughtlessness and racist stereotyping which disadvantage minority ethnic people.
Macpherson opposed racism in all organisations including education (Parsons, 2008).
Following Macpherson, the Race Relations (Amendment) Act 2000 was passed. The Act
made it unlawful to discriminate on the grounds of race, colour, nationality ethnic or
national origin’ (Maylor et al, 2006). However, despite the Act requiring schools to
monitor incidents of racism it is argued that policy makers failed to state what exactly
schools, local authorities and the government should be doing to escape the charge of
institutional racism (Parsons, 2008).
3.6.7 National Curriculum (1988) Britain’s ethnic diversity was acknowledged in the National Curriculum in 1988. The
National Curriculum explained how the learning process helps students to develop
personal, moral, values, respect for religious diversity, values and tolerance of other races
whilst understanding the world in which they live including individual groups and nations
(Arora, 2005). The National Curriculum encompasses material from a range of cultures
in the subjects of English, history, geography, art, music and physical education. Specific
grants (for example, Section 11 funding which ended early 2000s) were provided to local
education authorities for innovative work in schools related to meeting the educational
needs of minority ethnic children, promoting racial harmony and in other ways preparing
pupils for life in a multicultural society. The Teacher Training Agency in England also
provided funding to address student teachers’ fears of being inadequately prepared to
educate people from minority ethnic communities (TDA 2005, 2007). A new curriculum
introduced for trainee teachers in 1998/99 stressed multiculturalism, whilst grants for the
in-service training of teachers for teaching in a multi-ethnic society were also made
available (Davies and Issitt, 2005). However, research in 2007 that investigated if
teachers were aware that the National Curriculum was flexible and allowed teachers to
include different cultures in the curriculum, found that many teachers still lacked
knowledge of minority ethnic communities so only students in multi-ethnic schools
experienced a diverse curriculum (Maylor et al, 2006).
Subjects such as History, Religious Education, Drama and English have been found to be
conducive to exploring issues associated with social inclusion (Maylor et al, 2006).

61
3.6.8 Citizenship education (2002) Compulsory Citizenship Education was introduced in England in 2002 (Key Stages Three
and Four). Citizenship Education indicates three key requirements:
Teaching should ensure that knowledge and understanding about becoming informed citizens are acquired and applied when developing skills of enquiry and communication, and participation and responsible action
(DfEE/QCA, 1998, p.13 from (Davies and Issitt, 2005).
According to Maylor et al (2006) Citizenship Education aims to promote diversity and
equality. The goal of Citizenship Education is to develop students’ social and moral
responsibility, political literacy and support the development of active citizens (Davies
and Issitt, 2005). Such understanding is important as Blunkett (2003) observes
As we live in a society with a diversity of cultures, what we need both to bind us together and to enable us to respect our differences are common beliefs in the democratic practices of citizenship itself and the rights and duties that go with it
(Blunkett, 2003, p.8).
Maylor et al, (2006) further noted that Citizenship Education is concerned with social
cohesion and highlights ‘the world as a global community’ that is promoted by the
European Union, the Commonwealth and the United Nations. Therefore, this view
supports the inclusion of British citizens and refugee and asylum seeking students in
Britain.
3.7 Criticism of multicultural education
In 2007 there was an educational policy shift away from multiculturalism to recognition
Britain’s ethnically diverse nation (DCSF, 2007). Recently there has been criticism of
multiculturalism at a government level that appears to signal a wish to return to practice
conceptualised through assimilationist ideology. Since the early 2000s, across Europe the
number of political views highlighting the condemnation of multiculturalism as a concept
has increased. The German Chancellor’s comments in 2010 reversed her previous support
for multiculturalism within Germany. In England, Prime Minister David Cameron also
provided more evidence of a backlash against multiculturalism. At a security conference
speech in Munich (February 2011) Cameron suggested that the state must confront, and
not consort with violent Muslim groups that are ambiguous about British values such as
equality between the sexes, democracy, and integration. He criticised ‘state
multiculturalism’ on the grounds that it radicalised young Muslims, was a cause of
terrorism by young Muslim men drawn to an extremist ideology and undermined state

62
attempts to create a sense of (British) belonging among minority ethnic communities. He
therefore suggested three practical steps to address what he regarded as a British identity
crisis amongst minority ethnic groups in Britain. These included ensuring that:
immigrants’ speak the language of their new home (that is, English), people are educated
in elements of a common culture and curriculum (introduction of national citizen service
for sixteen-year-olds from different backgrounds to live and work together) and,
encouraging participation in society by shifting the balance of power away from the state
and the people (http://www.ekklesia.co.uk/nods/14271/22-07-2013).
Race (2012) however explains that since a policy focus on multicultural education has not
been visible in England since 1985 there is scope for improvement in the way English
schools encourage their pupils to reflect upon the principles on which British
multicultural society is based, or ought to be based.
3.8 Chapter summary
The purpose of this chapter was to review the literature associated particularly
multicultural education. Firstly the literature reviewed what social cohesion is. After the
experience of war, the Sri Lankan education system has focused on building social
cohesion through multicultural and peace education. Social cohesion can be fostered by
building relationships among members and trust and identity between different groups
(OCED, 2011). Kantzara (2011) also explains that education is one of the key factors for
social cohesion.
Peace education which is being implemented in Sri Lankan schools is compatible with
multicultural education.
The chapter has also reviewed how, since the 1960s researchers have analysed
multicultural education across five-six phases in England: assimilation, integration,
multiculturalism, antiracist education and institutional racism. Currently the National
Curriculum requires important aspects of multicultural education to be integrated across
the curriculum. Antiracist policies are designed to monitor the achievement of all ethnic
groups to ensure equity, and the frequency of racist incidents to guard against
victimisation of minority groups. Though criticised for failing to address issues of racism
in schools, multicultural education has more recently come under attack from the British
government for undermining social cohesion.

63
Chapter 4: Research Methodology
4.0 Introduction
The purpose of this study was to analyse stakeholders’ views of multicultural policies and
practices in secondary schools in Sri Lanka with good multicultural practices with a
comparator school in England against Banks’s (1086, 1989 and 2004) work , in order to
elicit what new insights can be gained that can lead to educational improvements.
This is related to a number of secondary questions:
1. What have been the background to, and policies of, multicultural education in Sri
Lanka and England over the period of Sri Lankan National independence from
1948, and the post 1945 2nd World War period in England?
2. What are some of the important issues associated with schools of multicultural
background in each country and what are the similarities and differences?
3. Do students of all ethnic backgrounds feel included in these schools and are
relationships between them and with staff harmonious?
4. To what extent are local communities involved in the life of the school?
5. What is known about educational performance and exclusion disparities between
students of various ethnic groups in the two countries?
4.1 Participant sample
4.1.1 Schools in Sri Lanka Five Sri Lankan government Sinhala medium schools located in the Colombo region
were included in this research. Included were two girls, two boys and one mixed school.
These schools were incorporated in this research, because multicultural initiatives were
actively put into practice here. The ESCP Report (2008) explained:
There are schools where students from different communities learn together peacefully. Their language backgrounds may differ but they study in one language, apparently without discrimination (for example, Tamil children learning in Sinhala in a Sinhala medium school, and more rarely, Sinhala children learning in Tamil in Tamil medium school). The processes of these schools and the students’ experiences need to be studied and good practice disseminated to other schools.
(p.17)
The five schools in the current research were named in this report.

64
The Mixed School is a National School which has Science, Mathematics, Commerce and
Art streams for Advanced Level students. Girls’ School 1, Girls’ School 2, Boys’ School
1 and Boys’ School 2 are 1C schools which have only Commerce and Arts for Advanced
level students. All students from all five schools in Year Eleven take Ordinary Level
examinations. The Ordinary Level (O-level) is a General Certificate of Education (GCE)
qualification conducted by the Department of Examinations of the Ministry of Education.
The examination is held in three media: Sinhala, Tamil and English. In these five schools
all students take examinations in Sinhala medium except the Mixed School which has
some students who choose English medium. Advanced level (A-level) is a General
Certificate of Education (GCE) conducted by the Department of Examinations of the
Ministry of Education. It is usually taken by students during Years Twelve and Thirteen.
In this sample all students from Year Twelve and Thirteen in 1C schools have Arts and
Commerce streams in Sinhala medium. However students in the Mixed School have Art,
Commerce, Science and Maths. Some students in this school study in English medium.
However, for this research only students from Years Six to Thirteen (Arts and Commerce
streams) who studied in Sinhala medium were selected.
Mixed School
The Mixed School has both Sinhala and English medium classes. The examination results
were average for the whole country. There were 1000 students in this school. Some
National Schools are quite wealthy as a result of donations from old girl/boy associations
and local communities. However, this particular school did not receive donations because
it is located in a low socioeconomic area.
Girls’ School 1
Girls’ School 1 has 20% of Muslim, Tamil and other and 80% of Sinhala students. The
principal of this school said that the ratio of students’ ethnic population was decided by
the government in 1964 when this school was handed over to the government. The
current school population is nearly 1000. Parents of students were from a medium socio
economic background. Examination results were average.
Girls’ School 2
Girls’ School 2 is a one C school with a proportion of 60% of Sinhala, 25% of Muslim
and Malay, 10% of Tamil and 5% of other students. Current student population is
approximately 800. Parents of students had medium socio economic backgrounds.
Examination results were average.
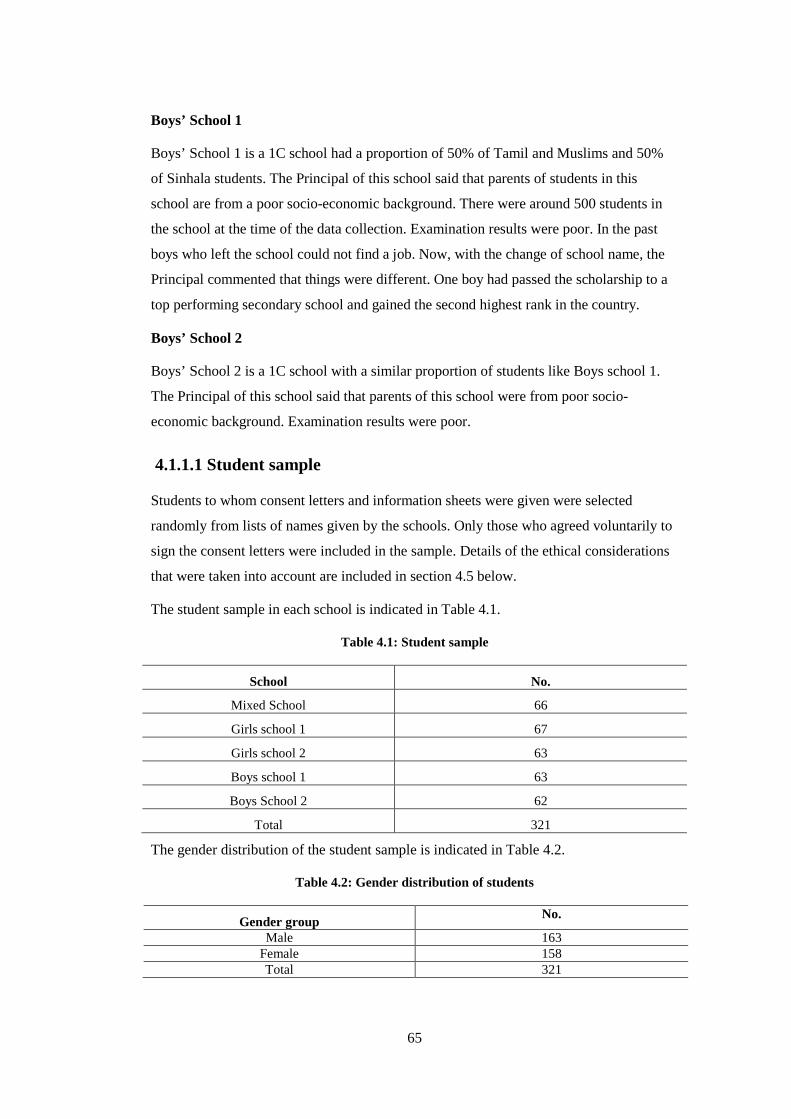
65
Boys’ School 1
Boys’ School 1 is a 1C school had a proportion of 50% of Tamil and Muslims and 50%
of Sinhala students. The Principal of this school said that parents of students in this
school are from a poor socio-economic background. There were around 500 students in
the school at the time of the data collection. Examination results were poor. In the past
boys who left the school could not find a job. Now, with the change of school name, the
Principal commented that things were different. One boy had passed the scholarship to a
top performing secondary school and gained the second highest rank in the country.
Boys’ School 2
Boys’ School 2 is a 1C school with a similar proportion of students like Boys school 1.
The Principal of this school said that parents of this school were from poor socio-
economic background. Examination results were poor.
4.1.1.1 Student sample
Students to whom consent letters and information sheets were given were selected
randomly from lists of names given by the schools. Only those who agreed voluntarily to
sign the consent letters were included in the sample. Details of the ethical considerations
that were taken into account are included in section 4.5 below.
The student sample in each school is indicated in Table 4.1.
Table 4.1: Student sample
School No.
Mixed School 66
Girls school 1 67
Girls school 2 63
Boys school 1 63
Boys School 2 62
Total 321
The gender distribution of the student sample is indicated in Table 4.2.
Table 4.2: Gender distribution of students
Gender group No.
Male 163 Female 158 Total 321

66
The distribution of the student sample by age is shown in Table 4.3.
Table 4.3: Student sample by age
Years Total
No. %
12 Years 50 15.6
13 Years 49 15.3
14 Years 48 15.0
15 Years 50 15.6
16 Years 50 15.6
17 Years 38 11.8
18 Years 36 11.2
Total 321 100
4.1.1.2 Teacher sample
Teachers were invited to participate in the research by letter and were given an
information sheet to outline what participation would entail.
The number of teachers in the teacher sample is indicated in Table 4.4.
Table 4.4: Teacher participants
School No.
Mixed school 22
Girls school 1 21
Girls school 2 25
Boys school 1 25
Boys school 2 23
Total 116
4.1.1.3 Principal sample
All five principals agreed to participate.
4.1.1.4 Sample of policy makers
There were four policy makers who agreed to participate from the Ministry of Education,
National Institute of Education and Education Commission in Sri Lanka. The policy
makers attached to the National Institute of Education were theose who made decisions
about text books for second national languages (Tamil and Sinhala). The policy maker

67
attached to the Ministry of Education engaged with the peace education unit and the
policy maker from the Education Commision in Sri Lanka was a decision maker at
national level in relation to the education system in Sri Lanka.
4.1.2 Schools in England After several approaches had been made to a number of schools in the East of England
that had been identified as having good multicultural practices through inspection reports,
only two schools (one for the pilot study and another for the main study) agreed to
participate in the study. These schools were located in an ethnically diverse urban area in
Bedfordshire. The English school in the main study was associated with the Anglican
Church. It was in a relatively deprived urban area and had a multi-ethnic student
population of around 750. External examination results had been below the national
average for a number of years prior to the current study, but had been improving. It is
noteworthy that the local area had a history of inter-ethnic conflict stretching back over
some twenty years or so.
The descriptions of the samples below relate to the main study only.
4.1.2.1 Student and teacher sample
Students in the sample were selected randomly by the deputy head teacher of the school
and invited to participate. Distribution of the student sample by gender is indicated in
Table 4.5.
Table 4.5: Student sample by gender
Gender group No.
Male 22 Female 19 Total 41
Student sample according to age is shown in Table 4.6.
Table 4.6: Student sample by age
Years Total
13 Years 13
14 Years 10
15 Years 10
16 Years 3
17 Years 5
Total 41

68
All teachers in the school were invited by letter to participate. The number of teachers
who volunteered and their ethnic backgrounds in the teacher sample is indicated in Table
4.7 below.
Table 4.7: Number and ethnic background of teachers in English school
Ethnic group No.
White British 9
White Irish 1
Mixed (White and Black Caribbean) 1
Asian British (Pakistani) 1
Asian British (Bangladeshi) 1
Not mention 1
Total 14
The head teacher volunteered to participate also.
4.2 Areas investigated
It was important to investigate issues that are very important in the literature related to
multi-ethnic education. The content areas were as follows:
Personal information
Details of age, gender, ethnicity and religion were gathered from students and staff.
Additionally, from the teachers their subjects taught, their number of years’ teaching
experience, the year group the teachers taught, the teachers’ higher educational
qualifications and the ethnic groups students in their classroom belonged to, were also
included.
Cultural differences
Issues of acceptance, respect and personal values in school are factors that contribute to
positive engagement in learning (Banks, 2008). The hidden curriculum is the curriculum
that no teacher explicitly teaches but that all students learn. Questions were designed to
assess the extent to which students had positive experiences in relation to their own
cultural identity in the school and whether they felt respected as members of their own
culture and, therefore, whether they were likely to feel accepted and valued in the school.

69
This included whether or not the students were encouraged to eat together and thus to
preserve, or not, their individual culturally-specific eating patterns. In Sri Lanka, in
January 2007, a new curriculum was introduced for Life Competences and Citizenship
Education (grade six to nine) and Citizenship Education and Governance (grade ten to
eleven). This curriculum consisted of many peace related concepts (ESCP, 2008). The
school’s learning materials are required to be anti-racist and culturally diverse in order to
support multicultural curriculum development (Leicester, 1989, p. 61). The policy makers
were asked whether or not the school had made a deliberate attempt to use textbooks in
classrooms to foster a deep understanding of the background and culture of different
groups in the school. In addition, questions included whether the content of the textbooks
spoke about people from different backgrounds in a positive way.
A conducive ethos in a school can be recognized as a harmonious blending of the natural
physical and human aspects which promote a culture of peace, reflected in the school
atmosphere. It refers to the whole school climate and its sense of compassion. On a visit
to a school, one may be able to see or feel an atmosphere of peace in terms of the
environment, relationship and discipline (ESCP, 2008, p 15). For example, through their
research in England, Verma et al. (1994) showed that head teachers felt that assemblies
should be about sensitising all to diversity and should be moral rather than religious in
content. Therefore, a question was asked about school assemblies in the questionnaire.
Display materials in classrooms and around the school can communicate messages about
which languages and cultures are valued in the school community. The visual images
presented to students’ parents and teachers as they move around the school equitably and
positively represent the presence and the experience of all the groups in the school and
reflect a variety of cultural perspectives (Coelho, 1998 p.95). Therefore, a question was
asked about signs, notices, bulletin boards and classroom displays.
Teacher attributes
Teacher attributes are also very important to students’ learning and engagement. If
teachers know and understand their students, and that the students are aware of this, then
students will have the confidence to study and engage. The extent to which teachers can
facilitate group work among students from diverse backgrounds is very important.
Questions about the teacher attributes focused on this aspect. In a multicultural school,
teachers and managers have high academic expectations for all students and believe that
all students can learn (Ladson-Billings, 1994). Questions about the teachers’ expectations
focused on this aspect.

70
Language
In England the focus at national policy level is on speaking and writing English in
schools. On the other hand, Sri Lanka is officially a tri-lingual country. Being a multi-
ethnic, multi-religious, pluralistic society, it is incumbent upon every Sri Lankan to learn
a national language, other than his/her own.
The National Education Commission in Sri Lanka sees education as a means of
engineering social change and in particular, social cohesion. Perera et al (2004) explain
that there is significant potential for the achievement of national cohesion and national
unity by strengthening the position of English as a link language between communities. A
common means of communication might then play its part in promoting genuine
understanding among different groups. The questions to students about languages focused
not only on their linguistic profile, but also on which languages they speak with their
friends, which languages they can read, which language they can read best, which
language students use at home and the languages in which they felt competent, both in
speaking and in expressing complicated ideas.
Customs
It is important to understand the extent to which the customs of all ethnic groups in the
school are respected and openly celebrated. The intention is that all students should
recognise the value of others from different ethnic groups. It is important to celebrate the
major holidays of all the cultural groups in the school, and to accord them equal
importance in the life of the school, whether these are public holidays or not. Questions
about customs explored underlying values, as well as superficial aspects of culture such
as food and dance (Coelho, 1998, p. 103). The questions focused on whether or not the
school celebrated different festivals, special events and special days associated with the
various groups and if the school library stocked books about people from different
cultures. In addition, it is important to ask whether students were allowed to wear their
own traditional clothes; in other words, whether the school attached importance both to
the symbols and other deeper religious and other meaning of the different cultures. The
Ministry of Education and Higher Education Circular No. 37/1995 permitted Muslim
girls to attend schools attired in the traditional Punjab costume in Sri Lanka. In England,
Muslim girls are allowed to cover their body with tracksuits and leotards for athletics and
swimming and at secondary level girls may wear ‘shalwar’ or trousers in place of a skirt
(Jenkins, 1993). Therefore, questions focused on whether students were allowed to wear
traditional clothes and hairstyles that are culturally important.

71
Co/extra curricula activities
The question about co/extra curricula activities sought to understand whether or not
students from all ethnic groups were given opportunities to participate in additional
activities outside the classroom, and work together regardless of ethnic background.
According to Coelho (1998) different cultural groups have different expectations of the
extracurricular activity programme in the school. What is important is that activities need
to match students’ interests and lifestyles.
Co-curricular activities can help to develop a knowledgeable student population who can
take the peace message across to other areas of their lives. Through work in the
community and beyond they can help produce a citizen who practices sustainable
development and actively promotes peace (ESCP, 2008 p. 14). Under this theme
questions were designed to find out information regarding the students’ school activities
and/or sport teams. One part asked whether or not they got involved in school activities
and the other asked them for the name of the event with which they were involved.
Policy
As one of the initial research questions of this research project is related to policy and
practice in individual schools it was therefore important to understand if the schools had
an anti-racist policy which students were aware of and familiar with the content.
The maintenance of racial harmony is a clear focus for schools interested in enabling
students to work and study together. This is particularly the case where the country has
experienced civil unrest. It is very important, therefore, that students are confident that
issues of racism associated with bullying and violence should be addressed. It is also
important that students have the opportunity to work together in co-operative learning
situations in classrooms under the supervision of the teacher, and to help each other
through peer-tutoring. This set of questions probed whether students had experience of
co-operative partnerships with peers in the class and whether students were allowed to
study subjects of their choosing.
Issues of safety
Feeling safe in a multicultural school is very important. According to Maslow’s
Hierarchy of Needs (1970), basic, low level needs such as physiological requirements and
safety must be satisfied before higher level needs such as self- fulfillment are pursued.
Questions about issues focused on whether or not the school had formal mechanisms in
place to address problems should they arise, and whether or not they worked in practice.

72
It is also important that students feel that teachers sort out problems associated with
different racial groups fairly. Leicester (1989) explains that the racial incidents, racial
graffiti, racist abuse and so on should never be ignored by a school.
The importance of safe school environments is another important topic. Therefore,
questions were designed to find out students’ feelings regarding the safety of their school,
if they were comfortable talking about their own culture at school and their feelings
regarding their first arrival at school. Coelho (1998) explains that the ‘ first impression
that the new arrival receives is very important from this first day the student will form
expectations about the school and how well he or she will fit in to it’ (1998, p.55). Coelho
goes on to say ‘All students feel more secure if there is somebody in the building who
understands their needs, especially if they are newcomers, second language learners, or
members of a cultural minority in the school’ (p. 104).
Support for individual differences
Banks (2008) links the degree of effectiveness of multicultural approaches in schools
with the extent to which the school provides for individual differences between children
in terms of their learning needs. Questions about support for individual differences
therefore relate to equal access for all students to support acquisition of basic skills as
well as pastoral support. Coelho (1998) explains that effective schools monitor the
progress of all students, and provide academic and social support to those who may need
such support. Career counselling programmes are also important. In an effective
multicultural school, a counsellor can help students from different cultures, racial, ethnic
and language groups to make effective career choices and find the courses needed to
pursue those choices (Sue, 2004). ‘Culturally responsive counsellors also help students to
reach beyond their grasp, to dream, and to actualize their dreams’ (Banks, 2008, p.38). In
addition, counseling can give important service to students from multicultural background
in the school. ‘Counseling may also be of a personal nature and assist students in their
adjustment to a new culture by organizing peer support programs or putting students and
their families in touch with personal and agencies that are able to provide culturally
sensitive services’(Coelho, 1998, p.108).
Routines and order
There is a lot of evidence that good order and regular routines in a school are a
prerequisite of any effective multicultural or inclusive policy (Banks, 2008). The
questions about school routines therefore related to the degree to which students
experienced regular routines in classrooms.

73
Suggestions
Finally, students and teachers were able to offer their views on the school in general, and
their experiences. Teachers were asked for their views about the challenges involved in
multicultural policy and practice and asked to offer suggestions about improving teacher
training to enable teachers to teach culturally diverse students effectively.
4.3 Research design
The purpose of this section is to explain the choice of suitable research methods to
address the research focus and the content areas outlined above. The selection of research
methods was based on qualitative and quantitative research approaches and comparative
research designs, as well as the type of methods available within these broad approaches.
According to Hatch and Lazartion (1991) cited in Zhang (2008) there is never a single
best way to carry out research. Research approaches can be flexible according to the
researcher’s preference in relation to the research focus.
4.3.1 Mixed methods research Newby (2010) explained that mixed methods research (the combined use of quantitative
and qualitative method in the same study) is becoming an increasingly popular approach
in the fields of sociology, psychology, education and health science. Further, according to
Cresswell and Plano Clarck (2007), the combination of both qualitative and quantitative
approaches may provide a better understanding of research problems and complex
phenomena than either approach alone.
Qualitative research is ‘any kind of research that produces findings not arrived at by
means of statistical procedures or means of qualifications’ (Strauss and Corbin, 1990,
p.17).
Qualitative methods produce detailed and non-quantitative accounts of small groups, seeking to interpret the meanings people make of their lives in natural settings, on the assumption that social interactions from integrated set of relationships are best understood by inductive procedures
(Payne and Payne, 2004, p.175).
Qualitative methods in the current study include interviews and focus group discussions.
Payne and Payne (2004) noted quantitative methods can cover different types of research:
Quantitative methods seek regularities in human lives, by separating the social world into empirical components called variables which can be represented numerically as frequencies or rate, whose associations with each other can be explored by statistical

74
techniques, and accessed through researcher- introduced stimuli and systematic measurement
(Payne and Payne, 2004, p.180).
In the current research it was important to be able to research and compare the views of
different groups of stakeholders at different levels in two education systems both across
and within groups. It was important, therefore, to design data collection tools that would
enable quantification of similarity and difference. A number of bespoke questionnaires
were therefore developed and trialled for each group separately, with responses to be
entered on a pre-determined quantifiable format. The questionnaires also included open-
ended questions where qualitative data could be analysed through thematic analysis. All
the questions on the questionnaires related to areas identified as significant in the review
of literature associated with multicultural education (see discussion of content areas
above).
4.3.1.1 Questionnaires
As Cohen et al. (2007) commented, the researcher can select several types of
questionnaire, from highly structured to unstructured. ‘The larger the size of the sample,
the more structured, closed and numerical the questionnaire may have to be, and the
smaller the size of the sample, the structured, more open and word-based the
questionnaire may be’ (Cohen et al., 2007, p.320). There are several kinds of question
and response modes in questionnaires. Oppenhein (1992) explained the importance of the
closed question:
Closed questions prescribe the range of responses from which the respondent may choose. Highly structured, closed questions are useful in that they can generate frequencies of response amenable to statistical treatment and analysis. They also enable comparisons to be made across groups in the sample
(Oppenheim, 1992, p.115).
Closed questions are quick to complete and straight forward to code; open-ended
questions are useful to enable respondents to answer as much as they wish in the
investigation of complex issues to which simple answer cannot to be provided. Open-
ended questions enable respondents to write a free account to explain their ideas in their
own terms (Cohen et al,2007).
Both closed and open-ended questions were used in the student and teacher
questionnaires in this research.
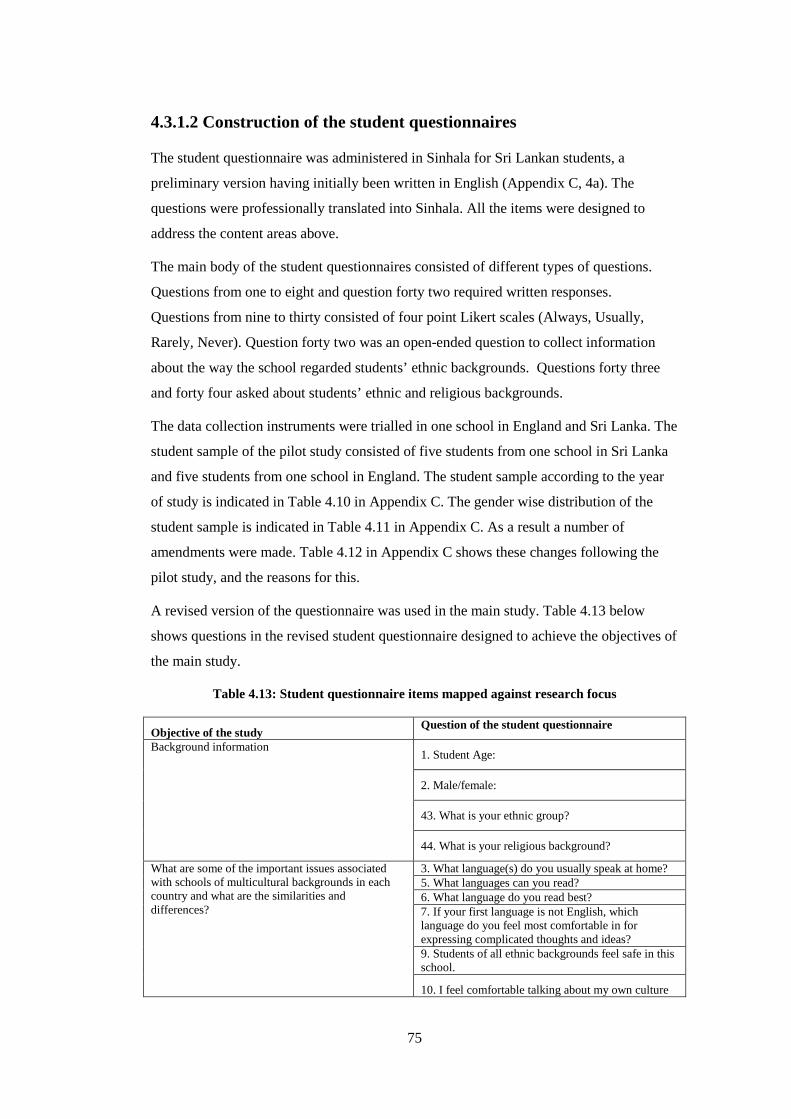
75
4.3.1.2 Construction of the student questionnaires
The student questionnaire was administered in Sinhala for Sri Lankan students, a
preliminary version having initially been written in English (Appendix C, 4a). The
questions were professionally translated into Sinhala. All the items were designed to
address the content areas above.
The main body of the student questionnaires consisted of different types of questions.
Questions from one to eight and question forty two required written responses.
Questions from nine to thirty consisted of four point Likert scales (Always, Usually,
Rarely, Never). Question forty two was an open-ended question to collect information
about the way the school regarded students’ ethnic backgrounds. Questions forty three
and forty four asked about students’ ethnic and religious backgrounds.
The data collection instruments were trialled in one school in England and Sri Lanka. The
student sample of the pilot study consisted of five students from one school in Sri Lanka
and five students from one school in England. The student sample according to the year
of study is indicated in Table 4.10 in Appendix C. The gender wise distribution of the
student sample is indicated in Table 4.11 in Appendix C. As a result a number of
amendments were made. Table 4.12 in Appendix C shows these changes following the
pilot study, and the reasons for this.
A revised version of the questionnaire was used in the main study. Table 4.13 below
shows questions in the revised student questionnaire designed to achieve the objectives of
the main study.
Table 4.13: Student questionnaire items mapped against research focus
Objective of the study Question of the student questionnaire
Background information 1. Student Age:
2. Male/female:
43. What is your ethnic group?
44. What is your religious background?
What are some of the important issues associated with schools of multicultural backgrounds in each country and what are the similarities and differences?
3. What language(s) do you usually speak at home? 5. What languages can you read? 6. What language do you read best? 7. If your first language is not English, which language do you feel most comfortable in for expressing complicated thoughts and ideas? 9. Students of all ethnic backgrounds feel safe in this school.
10. I feel comfortable talking about my own culture

76
at school.
11. There are signs and notices in my language around the school. 15. All students know what is in our school’s antiracist policy.
16. Students in this school are allowed to wear traditional clothes and hairstyles that are important in their own cultures.
19. I feel very comfortable at this school. 21. Do your class textbooks talk about people from different backgrounds?
22. Do the textbooks in class talk about people from your background in a positive way?
23. Does the range of topics covered in your lessons help you to understand people from different backgrounds? 29. Classroom routines are clearly organised and responsibilities are shared out fairly between all students. 31. When you first arrived at your school, did you feel very welcome? 34. If you have talked to a school counsellor, do you feel that she/he understood you as a person? 35. Have you ever complained to a teacher about being bullied because of your ethnic background? 36. If you have complained, was something done about it? 37. Do students from different backgrounds ever get into an argument or a fight? 38. If students from different backgrounds get into an argument or a fight do teachers sort it out fairly? 39. Does the school library have lots of books about people from different cultures? 40. Have you studied some of the history of your own culture? 41. Is any student in your school allowed to study any subject?
42. Is there anything else you would like to tell me about the way your school treats students’ ethnic backgrounds?
Do students of all ethnic backgrounds feel included in these schools and are relationships between them and with staff harmonious?
4. What language do you usually speak with your friends? 8. Are you involved in school activities and/or sport teams? 12. Our school concerts and other special events include all the cultures in the school 13. Sometimes the school has special events to celebrate festivals that are important to particular ethnic groups 14. Important festivals and special days of all the ethnic groups in this school are celebrated. 17. At lunch time all students are encouraged to eat their lunch together. 18. After lunch all students are encouraged to mix with other ethnic groups in their free time. 20. School assemblies are often about different cultures and races. 24. Do classroom displays include the work of students from different backgrounds?

77
25. Can you tell from the bulletin boards around the school that students in your school come from a range of different ethnic backgrounds? 26. Students often work with partners or in a peer tutoring relationship 27. Students often work in co-operative learning groups 28. The teacher knows some expressions in the languages used by different students. 30. The teacher helps students to manage group work and share responsibilities. 31. When you first arrived at your school, did you feel very welcome? 32. Are your religious festivals celebrated in your school? 33. Have you ever talked to a school counsellor?
4.3.1.3 Construction of the teacher questionnaires
The teacher questionnaire was administered in Sinhala for Sri Lankan teachers, a
preliminary version having initially been written in English (see Appendix C, 4b). The
questions were professionally translated into Sinhala. All the items were designed to
address the content areas above.
The main body of the teacher questionnaires consisted of different types of questions.
Questions from a to e and twenty five, twenty six, twenty seven and twenty eight required
written answers. Questions from one to twenty three consisted of four point Likert scales
(Agree somewhat, Strongly disagree, Strongly disagree and Disagree somewhat).
Question twenty four was multiple choices and related to opportunities of multicultural
education training of teachers. Questions twenty nine and thirty asked about teachers’
ethnic and religious backgrounds.
As noted above, the questionnaire for the teachers, like the other data collection
instruments, was trialled during the pilot study.The teachers’ sample in the pilot consisted
of three teachers from Sri Lanka and two teachers from England. Table 4.14 in Appendix
C shows the subject wise specialise of the teachers. As a result of the pilot a number of
amendments were made to the teacher questionnaire. Table 4.15 in Appendix C shows the
summary of changes for main study questionnaire and the reasons for this. A revised
version of the questionnaire was used in the main study. Table 4.16 below shows
questions in the revised version mapped against the research focus.
Table 4.16: Teachers questionnaire items mapped against research focus
Objectives of the study Questions
Background information a. What is your age range? b. What is your highest educational qualification?

78
c. Which subject(s) do you teach? d. Number of years of teaching experience?
e. Which year groups do you teach?
f. Which minority ethnic groups of students do you have in your own classrooms? 29. What is your ethnic group?
30. What is your religious background?
What have been some of the important issues associated with schools of multicultural backgrounds in each country and what are the similarities and differences?
2. It is very important to make a special effort to raise the achievement of students from minority ethnic backgrounds. 4. Teachers should make a special effort for students with learning difficulties. 22. There is in the schools’ professional library a good collection of multicultural materials. 23. Teachers prefer to teach students of the same background as themselves 24. Do you have opportunity to participate in workshops for multicultural education? 25. What kind of personal experiences have affected your perception of teaching culturally diverse students? 26. What do you perceive as the challenges of multicultural education? 27. What recommendations would you suggest to teacher education programmes or teacher training to prepare teachers to teach culturally diverse students? 28. Is there anything specific to your own subject area that you wish to explain here in relation to multiculturalism in your school?
Do students of all ethnic backgrounds feel included in these schools and are relationships between them and with staff harmonious?
1. This school should offer multicultural education.
3. I expect students of all ethnic backgrounds to behave well. 5. Teacher should respect the cultural, racial and ethnic differences of their students. 6. Teachers should be aware of the ethnic and cultural backgrounds of all students in their classrooms. 7. It is important to understand that body language and speech mean different things in different cultures. 8. It is possible to plan lessons and choose resources with different languages of the various student groups in mind 9. Every student feels valued in my classroom. 10. There is a planned programme of induction and orientation for all students and parents in this school. 11. There is a variety of extra-curricular activities that are designed specifically for minority ethnic groups. 12. Rules and regulations of the school are designed to take account of cultural differences

79
14. The school takes appropriate action when a specific group of students appears to be having social or academic difficulty. 15. The school provides counselling services related to students’ academic needs. 16. The school provides counselling services related to students’ social needs. 17.Counsellors serving in that capacity have the knowledge and skills required for effective cross-cultural counselling. 18.Teachers have the knowledge and skills required for effective cross-cultural counselling. 19. There is a procedure for conflict mediation when students experience ethnic or cultural harassment in the school or beyond.
To what experts are local communities involved in the life of the school?
20. The school has established mutually supportive relationships with community groups and agencies. 21. There is a peer mediation programme in the school.
What is known about educational performance and exclusion disparities between students of various ethnic groups in the two countries?
13. The school monitors the progress of all groups of students by ethnicity.
Table 4.8 in Appendix C indicates how the content areas discussed relate to the teacher
and student questionnaires and to the Head Teacher/Principal’s interview schedule.
It is important to note that questions for teachers and pupils were similarly framed.
4.3.1.4 Interview
In order to probe the views of individuals and groups more deeply, a number of interview
schedules were designed, again related to significant aspects of multicultural education.
The interview is a flexible tool for data collection. Newby (2010) explains the benefits of
interviews below.
Interview can range from asking different respondents a series of common questions to a conversation around a topic. There most important characteristic is flexibility. If a question is misunderstood, it can be rephrased. If a point is made that throws new light on an aspect of interest, then we can explore it further. It is this ability to re-ask questions that helps researchers establish whether they are being told the truth or a version of the truth that places the interviewee in a good light
(Newby, 2010, p.285).

80
4.3.1.5 Construction of the interview with school principals/head
teacher
The interview schedule for principals in Sri Lanka and the head teacher of the English
school consisted of sixteen structured questions which were relevant to multicultural
policies and practices and the nature of the teaching learning process in the school. It
included questions under six main categories. There are:
• Cultural differences
• Languages
• Policy
• Issues
• Support for individual difference
• School routines (see 4c in Appendix C)
A justification for including these areas has been discussed above (section 4.2).
There was one principal from Sri Lanka and one head teacher from England who
participated in the pilot study. The pilot of the interview schedule was used for the main
study without any changes because all questions appeared to be understood and covered
focus areas for the research. Table 4.17 shows questions of the principal/head teacher
interview schedule mapped against the objectives of the main study.
Table 4.17: Principal/head teacher interview schedule items mapped against research focus
Objective of the research Question
What have been some of the important issues associated with schools of multicultural backgrounds in each country and what are the similarities and differences?
2. What do you see as the main issues and needs of minority ethnic students living in your area? Do you do anything in particular to raise the achievement of minority ethnic students?
14. Do you ever have any incidents of bullying or abuse you think might be racial? If so how you do deal with racist behaviour?
15. Do you have a policy for dealing with racist incidents or discriminatory behaviour?
16. Is there anything else you can tell me about multi-cultural work in this school?
Do students of all ethnic backgrounds feel included in these schools and are relationships between them and with staff harmonious?
3. What are the principles driving your multicultural policy in this school?
4. How does your school promote inter-racial understanding among school staff and the different

81
ethnic student groups?
5. Are parents, relatives and friends of minority ethnic pupils involved in the work of school? If so, how?
6. Do you encourage the use of minority ethnic languages in your school? If so, how do you do it?
7. When announcements are made in the school, for example in assemblies, which language are they made in?
8. Which languages are signs, posters and notices written in around in the school?
9. Is there any form of planned programme for students to learn English/Sinhala as an additional language?
10. How do you assess students with special needs who do not speak English/Sinhala well?
11. Do you have any classroom policy about including material and activities from all the cultural backgrounds of your students?
12. Is communication with students’ families and friends who do not speak English/Sinhala an issue for the school? If so, how do you deal with it?
To what extent are local communities involved in the life of the school?
13. Do you think it is important for minority ethnic community groups and/or their leaders to be involved in this school? If so, why? What can they do?
What is known about educational performance and exclusion disparities between students of various ethnic groups in the two countries?
1. What different minority ethnic groups do you have among the students at your school? Do you monitor student performance by ethnic group?
Interview process Before conducting interviews with all principals and the head teacher an official letter
outlining the purpose of the research and interview schedule was sent to them. After
obtaining permission to conduct interviews, the interviews were then conducted. Each
interview took place between thirty to forty minutes. All interviews in the schools in Sri
Lanka were conducted in Sinhala and the interview with the head teacher of school of
England was conducted in English and digitally recorded.

82
4.3.1.6 Construction of the interview schedule with policy makers in Sri
Lanka
There were sixteen structured questions in the policy makers’ interview schedule which
were relevant to multicultural education in Sri Lanka.
It included questions under five main categories. These are:
• Cultural differences
• Languages
• Policy
• Issues
• Support for individual difference (see 4d in Appendix C).
The issue of school routines discussed in the principals’/head teachers’ interviews was
not pertinent here.
The interview schedule for policy makers was piloted by one policy maker in Sri Lanka.
Subsequently no changes were made for the main study. Table 4.18 below shows
questions in the policy maker interview schedule in relation to the objectives of the main
study.
Table 4.18: Policy maker interview schedule items mapped against research focus
Objective of the research Question
What are some of the important issues associated with schools of multicultural backgrounds each country and what are the similarities and differences?
10) What national policies have been initiated to respond to the increasing level of cultural diversity in school?
Do students of all ethnic backgrounds feel included in these schools and are relationships between them and with staff harmonious?
1) What do you think about the claim that education is an effective doorway for assimilation into mainstream society for people from diverse cultural heritages, ethnic groups, social classes and points of origin?
2) Should the curriculum reflect the different backgrounds of minority ethnic students in England / Sri Lanka?
3) Should schools provide for the teaching of minority languages within the normal school curriculum?
4) Would you expect school textbooks to reflect multicultural society?
Should they recognize cultural diversity?
Should they value this diversity?

83
Should they show ‘other’ religions, languages, lifestyles as valuable?
5) Should textbooks show equal regard for and acceptance of different ethnic?
6) Do you think that minority groups have a right to see their cultures positively and prominently represented in the curriculum?
7) How can policy makers work to change people’s stereotypical attitudes towards people of the other backgrounds by using the school curriculum?
8) Is it government policy that school curricula should help students to understand other people around the world?
9) Do you have a policy for assessing children in languages other than Sinhala if Sinhala is not their first language?
11) What / Who have been the driving forces behind these initiatives?
What results have been observed, if any?
12) Please describe the process for to designing policies concerning the integration of immigrant students / minority students into school?
13) Is your Local Authority involved in designed your multicultural policy?
14) What role does each person have?
15) How is the policy put in to operation?
16) What is national policy and practice on the education of immigrant children? If this the policy and practice same in the Local Authority? Please describe it?
Interview process Before conducting interviews with policy makers an official letter outlining the purpose
of the research and interview schedule was sent to them. Each interview took place
between forty minutes to one hour. These polcy makers had requested that their
interviews should not be recorded, so all key points were written down by the researcher.
4.3.1.7 Focus group interviews
Focus group interviews were carried out with both staff and students. All teachers were
selected randomly and the students randomly by ethnic group. There were twenty five
students (five from each school) in five groups arranged by year group, and fifteen

84
teachers in three groups who participated in the focus group interviews in Sri Lanka.
Fourteen teachers together with all the students who completed the questionnaires also
participated in the focus group interviews in England. Focus groups are a form of group
interview that uses communication between research participants to generate data. They
rely on group interaction as part of the method. The method is particularly useful for
exploring people’s knowledge and experiences and can be used to examine not only what
people think but how they think and why they think that way. Group processes can help
people to explore and clarify their views in ways that would be less easily accessible in
one to one interview. Group discussion is particularly appropriate when the interviewer
has a series of open ended questions and wishes to encourage research participants to
explore the issues of importance to them, in their own words (Newby, 2010), such as in
the current study. Tapping into such interpersonal communication is also important
because this can highlight (sub) cultural values or group norms such as those associated
with groups of teachers or students. Focus groups are particularly sensitive to cultural
variables-which is why it is so often used in cross cultural research and work with ethnic
minorities.
The disadvantage of such group dynamics is that the expression of group norms may
silence individual voices. The presence of other research participants also compromises
confidentiality. However, group discussion can actively facilitate the discussion of topics
because more confident members of the group can support them to share their ideas
(Arthur et al., 2012).
Tolich (2009) and Halcomb et al (2007) identify many ethical dilemmas peculiar to focus
groups. These include issues to do with confidentiality and fully informed consent. They
argue that it is not possible to ensure confidentiality because all participants hear the
discussion in a group. Tolich comments that viewing focus groups as a kind of public
meeting rather than a private meeting is more helpful to participants in enabling them to
decide what to say. If members are to move beyond stating their positions into explaining,
justifying and judging others, then the group has to develop a collective sense of trust.
Cohen et al. (2007) explain that the group interview is often more useful than individual
interviews with children. Children differ from adults in cognitive and linguistic
development, attention and concentration span, ability to recall, and life experience what
they consider to be important, status and power (Arksey and Knight, 1999, p.116).
Arksey and Knight also explain that it is important to build trust with children, make the
interview non-threatening and enjoyable, use children’s language and straightforward

85
language, ask questions that facilitate concentration for age of the child, to ensure that
children can understand abstract questions and allow them to think.
Focus group interviews of students and teachers considered selected questions from
student and teacher questionnaire. Student focus group interviews discussed questions
related to language, culture, extra/co curricular activities, co-operative learning, religious
festivals, subjects and text books. Teacher focus group interview discussed attitudes about
multicultural education, extra help for students, school curriculm, text books and
challenges in multicultural classrooms.
Table 4.9 in Appendix C summarises the affordances of interview and questionnaire
techniques.
4.4 Data Analysis
4.4.1 Descriptive statistics The quantitative aspects of the questionnaires were analysed using descriptive statistics.
Descriptive statistics are used to present quantitative descriptions on a manageable form. In a research study we may have lots of measures. Or we may measure a large number of people on any measure. Description statistics help us simply large amounts of data in a sensible way
(Trochim, 2006 p.1).
Trochim explained that one of the common ways to describe a single variable is with a
frequency distribution. In this research frequency distributions were shown as tables.
Distributions are displayed using percentages of student responses and teacher responses
in five schools of Sri Lanka. Further, appropriate chi square (χ²) statistics were calculated
to investigate whether there were significant differences between responses of groups by
ethnicity and gender in Sri Lanka. Distributions were displayed using raw numbers of
student responses and teacher responses in the school of England because the number of
students and teachers were small.
4.4.2 Thematic Analysis Cohen et al (2011) explain that thematic analysis is an important approach to data
analysis. According to Daly, Killehear, and Gliksman (1997) thematic analysis is a search
for themes that emerge as being important to the description of the data that has been
collected. The process of thematic analysis involves the identification of themes through
‘careful reading and re-reading of the data’ (Rice and Ezzy, 1999, p.258). ‘It is a form of

86
pattern recognition within the data, where emerging themes become the categories for
analysis’ (Fereday and Muir-Cohrance, 2006, p.4).
The qualitative data for the current study comprised transcripts of student and teacher
focus groups in five schools in Sri Lanka and in the English school, and interviews with
school principals and policy makers in Sri Lanka and the head teacher in the English
school, and also open-ended responses to the questionnaires for both students and
teachers in the two countries. The process of data coding and identification of themes was
undertaken as outlined by Cohen et al. below. At each stage the transcripts were re-read
to ensure familiarisation and trustworthiness in the final interpretation of the data.
The thematic analysis for the current study incorporated several stages outlined by Cohen et al (2011, p. 255) as:
• generating broad categories of meaning; • classifying, categorizing and ordering material within these categories of
meaning; • structuring narratives to describe the contents; • interpreting the data.
The broad categories of meaning were informed predominantly by Banks’s (1981, 1989,
1993, 1994, 2006 and 2008) work as outlined in the literature review. The process at the
first stage involved reading each transcript, listening to each recording and summarizing
the raw data within each broad category. The data were further interrogated to identify
any emerging themes not compatible with the broad categories.
Within each broad category the data were interrogated for similarities and differences
within and across respondent groups, and these data were classified and refined as a
result. In this way sub-sets of themes were created within each broad category.
Once the sub-themes had been identified they were re-structured into broader
conceptualisations that enabled the overarching narrative to be written. The sub-themes
provided further organisational layers to the narrative.
This rigorous qualitative analysis enabled a richer understanding and interpretation of the
quantitative data also.
4.5 Ethical considerations
Ethical issues that could potentially arise throughout the data collection from all
participants were taken into consideration. Ethical Guidelines for Educational Research
(BERA, 2011) to protect research participants including with respect to confidentiality

87
issues were followed. The BERA guidelines explain ‘Individuals should be treated fairly,
sensitively, with dignity and within an ethic of respect’ (p.5).
Specifically, the following actions were taken:
1. Relevant permission was obtained to conduct surveys and interviews from
principals, specific teachers within the schools, relevant officers in local
authorities in England and Sri Lanka.
2. Research was conducted on the basis of anonymity for the respondents. All
interviews were carried out with agreement of the interviews. No individual
school was identified by name.
3. Information was given in written form to all school participants explaining the
purpose of the research. Initial contact with government officers was made by
means of a written explanation of the purpose of the research. Interview
questionnaires were sent prior to interview. All correspondence to schools,
institutions and individuals taking part in this research was submitted to the
Ethics Committee of the Institute for Research in Education (IRED) at the
University of Bedfordshire for prior approval. Likewise all interview questions
and questionnaires for the pilot studies were submitted for prior approval by
IREd (See 4e in Appendix C).
4. All completed questionnaires were held securely in password-protected files
within the university as well as electronic files on the university computer.
5. Care was taken to ensure that no respondents were stressed during the surveys
and interviews which were conducted by the researcher. All participation in the
study was voluntary and participants were informed that they might withdraw
from the project at any time up to the end of data collection.
4.6 Chapter summary
The purpose of this chapter has been to provide a picture of research methods used in this
study. This research was based on qualitative and quantitative research approaches and
comparative research design. The research followed Bray and Thomas’s (1995)
framework for comparative analysis. However, this research focused on only level five,
schools, level six, classrooms and level seven, individuals. For aspects of education and
society, the focus was curriculum, teaching methods and political change. For locational
demographic groups, research concentrated on ethnic groups, age groups, religious
groups and gender groups.

88
The sample included students, teachers and principals/head teacher in Sri Lanka and
England. In addition policy makers in Sri Lanka also participated in the research.
Interviews and questionnaires were used to collect data from the sample. Documentary
analysis, descriptive statistics and thematic analysis were used for the data analysis of the
research.

89
Chapter 5: Results and analysis. Part 1: teacher training,
professional development and language issues
5.0 Introduction
This study was undertaken in two different countries with very different historical,
cultural and geographical backgrounds, but with a particular focus on Sri Lanka.
Essentially the focus of this research is on multicultural education in Sri Lanka, and on
such education in one school in England with the outcomes thrown into sharp relief and
discussed against a framework drawn from Banks’s (1984, 1989 and 2004) work.
This chapter presents the results of a part of the analysis of the main study as it relates to
the details of participants and key findings associated with language issues. Where
appropriate a chi square (X2) statistic has been calculated to investigate whether there is a
significant difference between the responses of different ethnic and gender groups. In
some cases this difference was between responses indicating ‘Always’, and those
indicating less than ‘Always’.
This chapter begins by outlining the backgrounds of the students and teachers who
participated in the research and focuses on important differences that are seen to
contribute to the development of multicultural understanding in teaching and learning in
schools, in particular issues of qualifications, training and experience. It continues by
highlighting the main issue of language which is the issue of prime concern in the
findings and which also has particular relevance for teacher training, qualifications and
professional development in multicultural schools.
5.1 Students’ backgrounds
In Sri Lanka, all five principals reported that there were Sinhala, Muslim, Tamil and some
Burgher and Malay students in their schools. In the sample of 321 students’ the majority
were either Sinhala (46.9%) or Muslim (39.3%). A much smaller proportion was Tamil
(12.5%). Burgher (1.9%: six students) and Malay (1.6%: six students) were even fewer.
All five schools individually had approximately the same proportions of ethnicities,
except Girls’ School 2 that had a bigger proportion of Muslims (42.9%) than other ethnic
groups (Table 1, Appendix D).
Overall, the biggest proportions of students were from Islamic backgrounds (41.1%) with
a slightly smaller proportion being Buddhist (36.4%). A small number were either

90
Christian (11.8%) or Hindu (10.6%). In both girls’ schools Buddhist students represented
approximately 30% of the total, with proportionately more Muslims (around 45%). In one
boys’ school there were more Buddhist than Muslim (approximately 48%: 33%). In
Boys’ School 2 it was the reverse (approximately 36%: 40%) (Table 2, Appendix D).
In the sample from the English school the majority of students, twenty six, were White
British (63.4%). Five were Asian British, five were Black Africans, two White East
Europeans, two Mixed (White and Black African, White and Asian) students and one
Black Caribbean (Table 1, Appendix G). Overall, the biggest proportion of students,
twenty, had no religious backgrounds (48.8%). However, fifteen students (36.6%) were
Christians, two were Muslims, two Hindus and two Buddhist (Table 2, Appendix G).
In Sri Lanka roughly similar numbers of male and female students were in the sample
(Table 3, Appendix D). Similar numbers of students were in each age group from twelve
years to sixteen years, with a smaller number from seventeen to eighteen years (Table 4,
Appendix D). In England, there were slightly more males than females in the sample
(Table 3, Appendix G). There were more students aged thirteen than students’ aged
fourteen and fifteen, and smaller numbers still aged sixteen and seventeen (Table 4,
Appendix G).
5.2 Teachers’ backgrounds
There were 114 teachers in total in the five schools in Sri Lanka, and fourteen in the
English school. All teachers were from a Sinhala background in Sri Lanka, except for one
teacher in Boys’ School 1(Table 1, Appendix J). There were teachers from different
ethnic backgrounds in England: White British, White Irish, Mixed (White and Black
Caribbean), Asian British (Pakistani) and Asian British (Bangladeshi) (Table 1, Appendix
K). Almost all teachers were from Buddhist backgrounds in Sri Lanka (Table 2, Appendix
J). In England the majority of teachers were from Christian backgrounds, four teachers
did not mention a religious group, two had no religion and two were Muslim (Table 2,
Appendix K).
In both Sri Lanka and England the majority of teachers were female (Table 3, Appendix J)
and (Table 3, Appendix K). Overall, the biggest proportion was between thirty one to
forty years old in both countries (Table 4, Appendix J) and (Table 4, Appendix K). In
terms of teaching experience, in Sri Lanka 56% of teachers had between zero to ten years’
teaching experience (Table 5, Appendix J), while in England the majority had between
zero to ten to fifteen years teaching experience (Table 5, Appendix K).

91
The qualifications of teachers were dissimilar in Sri Lanka and England. In Sri Lanka
nearly half the teachers were not qualified to degree level. A high proportion (45.7%) had
only A-level GCE (Table 6, Appendix J). Those with less experience tended to have
higher qualifications. More teachers with over twenty one years teaching experience
(sixteen) have only A-level GCE (Table 7, Appendix J). More teachers who were newly
recruited had a degree. Kaleel (2008) explained that the Ministry of Education formulated
a national policy on teacher recruitment making a first degree mandatory for teacher
recruitment from 2009. The results of this research reflect this policy and show that more
newly recruited teachers had a degree than teachers who were recruited more than a
decade ago. However, the fact that almost half the teachers in the sample were not
graduates implies that there is a great need to improve the qualifications of many serving
teachers also.
In England all the teachers had a degree and a teacher training qualification (Table 6,
Appendix K).
5.3 Teacher attitudes and professional development
The majority of teachers in the schools in Sri Lanka and England agreed that their school
should offer multicultural education. However, qualifications and experience seem to be
related to teachers’ feelings in this regard. Pre-service teachers need observational,
empirical and analytical skills to monitor and evaluate to their own teaching style and
develop as reflective practitioners (Sharma, 2005). Teachers need to develop awareness of
their own cultural perspectives, belief and behaviours. Teacher education programmes
must include global knowledge and cross-cultural experience (Sharma, 2005)). Teachers
need to be aware that their own cultural perspective is not the universal perspective. In Sri
Lanka the highest proportion of those who strongly agreed that their school should offer
multicultural education was teachers with postgraduate teaching qualifications. Some
teachers felt that it was easy to build social cohesion in a multicultural school where
Buddhist, Christian, Muslim and Hindu students and Sinhala, Muslim and Tamil students
studied together in one class without problems, and that this needed to spread all over the
country. Teachers in Girls’ School 1 said that in their school all students were treated the
same irrespective of cultural background and when talking about Sinhala values in lessons
they discussed Muslim and Tamil cultural values also. Some teachers in Girls’ School 2
commented that their school taught its students to respect each other’s religions and
culture. However, in every experience category over 20% disagreed to some degree with

92
the view that their school should offer multicultural education (Table 8, Appendix J).
Over one quarter of those with no postgraduate teaching qualifications disagreed (Table 9,
Appendix J). In Sri Lanka it may be, therefore, that level and recency of qualifications
makes a difference to perceptions here. In England, by contrast, where teachers were
qualified graduates, all teachers from all ethnic, educational and experience categories
agreed that the school should offer multicultural education.
Linked with the issues of levels of teacher qualifications is the issue of teacher’s beliefs
about ethnic matching. In Sri Lanka, overall over 50% of teachers in all schools agreed to
some extent that teachers prefer to teach children of the same background as themselves
(Table 10, Appendix J). The biggest proportions of teachers who agreed with the
statement were those with degrees or postgraduate teacher training qualifications (71.4%
and 79%) with a considerably lower proportion of teachers with A-level. Nearly 40% of
those with A-levels disagreed to some degree (Table 11, Appendix J). In the open-ended
questions on the questionnaire some teachers explained that teachers tried to teach
students according to the teachers’ own backgrounds. Therefore, it was difficult to
develop good teaching and learning processes between teachers and students with
different backgrounds without additional training to do so.
In England where all the teachers were trained graduates the majority of teachers
disagreed somewhat or strongly disagreed with the statement about teachers preferring to
teach students of the same background as themselves (Table 7, Appendix K). The
majority of teachers from all experience categories disagreed strongly or disagreed
somewhat with the statement (Table 8, Appendix K). Only two teachers with a
Postgraduate Diploma in Education and one teacher with a teaching certificate strongly
agreed or agreed somewhat (Table 9, Appendix K).
Linked also with the level of teachers’ experience and training in multicultural education
is the issue of understanding the difference between the meaning of body language and
speech in cultural contexts. Teachers in both Sri Lanka and England expressed the belief
that it was important to understand that body language and speech mean different things in
different cultures. In Sri Lanka all the teachers in all five schools strongly agreed or
agreed somewhat. The highest proportion of those who strongly agreed was in the
Postgraduate Diploma category (Table 12, Appendix J). In England almost all the
teachers in all ethnic groups strongly agreed with the statement (Table 10, Appendix K).

93
The majority of teachers in the schools in Sri Lanka believed teachers should show
respect for the cultural, racial and ethnic differences of their students (Table 13,
Appendix J) and (Table 14, Appendix J).
In Sri Lanka the teachers’ questionnaire and the focus group interview indicated the
majority of teachers from all five schools felt that teachers need to respect the cultural,
racial and ethnic differences of their students (Table, 15 Appendix J). It may be
significant here that the students’ questionnaire indicated that the overwhelming majority
of students from all ethnic groups felt that their teacher knew some expressions in the
languages used by different students. The highest proportions of teachers with the most
positive perceptions were those with six to ten years teaching experience and teachers
with graduate teacher training or a degree (Table 16, Appendix J) and (Table 17,
Appendix J).
The majority of teachers in the five schools in Sri Lanka also believed in the importance
of awareness of the ethnic and cultural backgrounds of all students in their classrooms
(Table 18, Appendix J). However, it seemed that teaching experience and qualifications
were important factors here too. Teachers who were more recent recruits to the profession,
those with between twenty one to twenty five years’ experience and teachers with a
PGDE and a degree were more likely to agree strongly than other groups. Around 60% of
teachers with a PGDE and a degree strongly agreed with the statement with a slightly
lower proportion of teachers with A/L. One teacher with a Masters of Education also
strongly agreed with the statement (Table 19 and 20, Appendix J).
In England all teachers in all ethnic groups agreed strongly or agreed somewhat with the
statement ‘Teachers should be aware of the ethnic and cultural backgrounds of all students
in their classrooms’ (Table 11, 12 and 13, Appendix K). The student questionnaire
indicated a difference in views about whether teachers knew some expressions in the
language used by different students. The majority of students from all ethnic groups
agreed that their teachers knew some expressions in the language used by different
students. Sixteen students had negative views. When both the pilot and fourteen students
in the main study felt that their teachers did not know expressions in the languages used
by different students there may be some concern.
Teachers who participated in the focus group interview in the English school said there
was an awareness of the cultural backgrounds of all pupils in the classroom, and that this
understanding was informed in various ways. For example, teachers had all students’ data.
Teachers tended to really look at the children themselves rather than look at the cultural

94
background. All students were included in teachers’ planning regardless of the cultural
background even if there was an EAL and SEN issue. For example, teachers would not
use a pig’s heart if they had Muslim students in the classroom. Not in the classroom
though. A focus group participant said: ‘For example, the issue with the pig heart, it’s
not done as a, I’ve got a Muslim in my class, I mustn’t use … it’s just a standard
practice’. Teachers were aware that some were fasting at certain points of the year and
that this might affect students’ energy levels through the day. One teacher had
experience in her last school; she had a large proportion of Gypsy/Roma Travellers.
There was an intervention pack specifically set up for the Gypsy/Roma Traveller students
because their attendance was always poor. As one teacher in the focus group
commented:
In my last school I had a large proportion of Gypsy Travellers and one of the things that we had to be aware of, we usually had a pack for them because their attendance was always poor and they tend to not really come in much during the last year of school. So there would be intervention packs specially set up for the Gypsy/Roma students.
However, some teachers explained through question twenty five in the teacher
questionnaire that they did not think about students’ cultural backgrounds. In
all probabilities this reflected teachers’ views about being fair to all students:
• One teacher said that s/he did not think about students’ ethnic backgrounds and
was personally aware of difference and tended to treat all as equal. Teaching
was designed to progress learning not because of students’ cultural
backgrounds.
• One teacher said that s/he went to school with culturally diverse students.
Teacher attitudes regarding multicultural education are very important to students’
learning and engagement. The majority of teachers in school in Sri Lanka and the English
school expressed a belief that it was possible to plan lessons and choose resources with
different languages of the various students’ groups in mind. In Sri Lanka nearly 80% of
teachers with a degree strongly agreed with a slightly lower proportion of teachers with a
postgraduate diploma (63.2%) (Table 21, Appendix J). In England also the majority of
teachers strongly agreed or agreed somewhat with the statement.
However, a number of challenges were raised in relation to teaching and learning in
multicultural classrooms. In the focus group interviews and questionnaires in England
staff mentioned a number of challenges including curriculum design, time, and knowledge
to plan multicultural teaching. One teacher said that finding time to create resources for
example mathematics and finding the balance for each student were challenging. Another

95
teacher said that the challenge depends on content and what the students want.
Stereotyping and misconceptions could occur. One teacher suggested that all students
regardless of cultural differences should be taught using the same teaching tools.
Stereotyping of students by peers/staff should be non-acceptable.
No particular challenges and issues were identified across the schools in Sri Lanka.
Nevertheless it is clear that these teachers had a sense that they needed training to teach in
the multicultural school because, in the open-ended section of the questionnaire, they
suggested they would benefit from a range of types of training, including:
• training in the practice of how to teach in a multicultural classroom;
• how to use teaching aids in a multicultural classroom;
• how to create a child friendly school environment;
• child psychology training, counselling training and training in human rights;
• aesthetic and creative skills;
• computer skills and administrative knowledge;
• training in Tamil and English language training.
This last point is particularly interesting given that, as Perera et al. (1994) explain,
according to the 1997 reforms, and to the national language policy, student teachers must
be provided with facilities to improve their official languages and link language
(English). As teachers in the focus group commented in Girls’ School 1, ‘We need Tamil
and English language training. If we have good communication skills we can make better
inter relationships with Tamil and Muslim students’.
Interestingly teachers from Girls’ School 1 also commented that school inspectors needed
greater knowledge about multicultural classrooms.
The teachers in the English school also commented on what they saw as requirements for
teacher training about multicultural education, for example:
• processes to share ideas and resources, for example a teaching and learning folder in
the school virtual learning environment;
• training in the area to provide resources and support materials;
• visits to as many different schools and classrooms as possible during initial, teacher
education programmes or teacher training to prepare teachers to teach culturally

96
diverse students by providing examples and best practice to offer practical
experience, for example observations and small group work;
• activities designed to develop understanding of how cultures and ethnic background
can affect education so teachers can consider that in their planning and teaching. One
teacher suggested that s/he believed teachers tend to learn depending on the type of
school teachers teach in. Contact is the best learning to promote awareness of
cultures and/or their disposition in the school system. There is rarely a school with an
even spread. Another suggested that teacher education programmes should prepare
teachers to teach culturally diverse students by making experience of working in
schools of diverse backgrounds compulsory;
• the dispersion of minorities is different in different areas and, within an area,
different schools have different minority groups. Therefore, teacher training should
depend on the type of school a trainee is going to work in.
Teachers’ views about the kind of teacher training and/or professional development that
would enable them to teach more effectively in multicultural classrooms seemed clear.
However, the majority of teachers in both schools in Sinhala and the English school
reported that they never had an opportunity to participate in workshops for multicultural
education. In Sri Lanka, for example, over 50% of all teachers across all five schools
replied that they never had the opportunity to participate in workshops for multicultural
education (Table 22, Appendix J). The only category of teachers where nearly 50%
responded that they had any opportunity at all was those between sixteen to twenty years
teaching experience, but even here 42.9% responded ‘occasionally’ (Table 23, Appendix
J). In England teachers’ ratings of whether there was an opportunity to participate in
workshops for multicultural education were also low. The majority of teachers from all
teaching experience and qualifications categories replied ‘Never’ (eight) that they never
had the opportunity to participate in workshops for multicultural education (Table 14 and
15, Appendix K).
5.3.1 Comparison between Sri Lanka and England As a number of educators have commented, qualifications and effectiveness of teachers is
a large part of the success of education reforms initiatives. Teacher education should be a
major focus of reform initiatives (Corcorran, 1995; Corcoran, Shields and Zuckewr,
1998). It is therefore a concern that, whereas in the English school all the teachers had a
degree and a teacher training qualification, across the five schools in Sri Lanka, a high
proportion (45.7%) had only A-level GCE. In England teaching is considered to be a

97
profession. One common definition of professionalism is having expert knowledge of
theory and practice in the particular area (Leaton and Whitty, 2010). In England teachers
are expected to have such knowledge through their required qualification. In Sri Lanka,
however, many do not yet consider teaching to be a profession. Many teachers were not
qualified in the same way and to the same level as teachers in England. The outcome in
that some teachers in Sri Lanka are not able to carry out some of the activities that, as De
Silva (2009) say are crucial to the effectiveness of multicultural education. This is
reflected in the schools in this piece of research. Having said that, however, recruits are
now more highly qualified, as is also reflected here. Further professional development for
multi-cultural education is much more limited, however.
Some teachers in all schools in Sri Lanka expressed a wish for professional development
in how to teach well in multicultural classrooms, how to use resources, gain better
understanding of children from different cultures, how to develop relationships with
parents of different backgrounds, and how to teach Sinhala to non- Sinhala speaking
students. As reported by teachers in the five schools in the current study, access to such
professional development is lacking, however.
In the English school some teachers wanted training to understand diverse pupils, cultures
and backgrounds so they could use this in their planning for lessons. However, the
majority of teachers reported that they never had the opportunity to participate in
professional development for multi-cultural education. One teacher felt the issues should
be addressed in initial teacher training. It is interesting that the current standards for
Qualified Teacher Status (QTS) have reduced this emphasis and instead relocates it in
relation to supporting British values that is adopting an assimilationist position rather than
recognising difference. The issue here, clearly, is that of whether, at an early stage, trainee
teachers will understand the importance to teaching and learning of acknowledging
children’s cultural backgrounds, as at least one teacher in this sample felt was important.
In Sri Lanka the 1997 reform suggested that the curriculum for teacher education be
rearranged for teachers with the necessary competencies to teach the school curriculum.
The reform expected to include education for human values, human rights, national
cohesion, gender rights and the environment from the teacher education in Sri Lanka. It
also proposed the integration of concepts of national cohesion, peace, and conflict
resolution into teacher education programmes focusing on the principles of education,
classroom management, sociology of education, counselling and guidance because these
concepts included the general education subjects of life competencies, religion, and

98
culture (Perera et al (2004). The NIE provides pre-service peace education training to
teacher training students and the Ministry also provides in-service training to principals
and teachers to spread peace education in Sri Lanka. The literature review outlined a
number of initiatives that had taken place in teacher professional development to support
multicultural practice in Sri Lanka (see chapter 3). It is clear from the current research that
there is a great need for many more such programmes in Sri Lanka especially given that
the teachers in the current study reported that they never had access to such professional
development. The teacher questionnaire and focus group interview shows over half of
teachers (61.2%) from all teaching experience categories reported that they never had the
opportunity to participate in workshops for multicultural education.
Similarly in England access to training for multicultural education has been made
available from time to time. The literature shows that the requirement that all student
teachers should have some training for teaching in a multicultural society began between
1981-1985 when, during Sir Keith Joseph’s period of office as Secretary of State for
Education, CATE (Council for the Accreditation of Teacher Education) was established.
However, the data from the teacher questionnaire indicated that the majority of teachers
from all ethnic groups, all teaching experience categories and education qualification
categories never had the opportunity to participate in workshops for multicultural
education.
5.4 Language issues
Banks (1976) explained that multicultural education needs to foster the study of ethnic
group languages as legitimate communication systems. In the context of Sri Lankan
schools, the implications of what he says here are that all students’ languages would be
considered a legitimate form of communication, not simply Sinhala, Tamil and English.
Cummins (2000) confirms the importance of language use in the multicultural classroom
in relation to student academic achievement in his reference to student interactions. ‘ The
interactions that bilingual students experience in schools create the conditions for
academic success or failure’ (p.33).
While English is the only official language in England and, as such, students are taught in
English in the English school, Sri Lanka is officially a tri-lingual country. As discussed in
chapters 2 and 3, from Independence there has been a policy in Sri Lanka in the
Government schools that Sinhala as the official language and English as the link language
should be taught to all children, as part of the school curriculum. However, in the 1970s

99
Tamil was also accepted as a national language with the expectation that students would
become competent in either Sinhala and English, or Tamil and English. To reduce the
language differences among ethnic groups at upper secondary level in 2000
English medium was introduced for GCE (A/L) science students and in 2002 English
medium instruction was introduced at the junior secondary level (Science and
Mathematics at grade 6 and later to Social Studies and Health and Physical Education).
However, this period was also marked by a civil war that disrupted the education of many
students. During the war NER (2003) recommended that teaching two languages is very
important to Sri Lankan’s national integration and cohesion because it helps to develop
inter-cultural understanding among students from different ethnic groups in Sri Lanka.
Therefore, from 2004 every school began to allocate two timetabled periods in the junior
secondary grades to the teaching of the two national languages. Further, for more than
thirty years a free textbook policy has existed in Sri Lanka. As a further effort to promote
national unity, and through this free textbook policy, the education publication department
(EDP) has produced textbooks for Tamil and Sinhala as a second language. The EDP has
its own programme for promoting social cohesion and multi- ethnic understanding under
two aspects: producing texts in the two national languages and ensuring that textbooks
reflect Sri Lanka’s pluralistic society. The EDP and the National Institute of Education
(NIE) are concerned that the school curriculum should promote social cohesion with a
special focus on learning the culture of other ethnic groups though the learning of a
second national language, English as a link language and learning of religious, ethnic,
civic and human values. The EDP proposed that teaching techniques and the syllabus
should reflect and value diversity and unity, and strengthen capacities for interaction and
integration through core-curricular activities. Currently there is a proposal that the
Ministry of National Language and Social Integration (MNLSI) is going to conduct a
special programme on the principles of social integration for school principals, teachers,
and non-academic staff through languages (MINLSI, 2013).
From the discussion above one might expect, given that government policy related to the
learning of the two national languages with English as the link language has been in
existence from the late 2000s, all secondary students such as those in the five schools at
the centre of this research would be reasonably competent in speaking and writing their
own language, the second national language and English, and that the teachers in these
schools would be well trained in the use of two languages at least and would be
competent languages users themselves. All the policy makers that were interviewed
argued that, in Sri Lankan schools, every student can learn Tamil as a second language

100
and Sinhala as a second language, together with English as a link language. As one
commented:
In our schools our students can learn three languages. Every Sinhala medium student should learn Tamil language and every Tamil medium student should learn Sinhala language and every student needs to learn English as a link language.
They thought that learning all three languages is an important way to successfully
implement multicultural education. However, during this period it is also very clear that
civil war has disrupted much of the education system and that, as a consequence, renewed
focus is being placed on strategies to improve social cohesion through greater multi-
lingual competency.
5.4.1 Differences in language competency across ethnic groups The student questionnaire shows Muslims and Tamils were more likely than Sinhalese to
speak more than two languages at home. Overall, more Sinhala students spoke Sinhala at
home in Sri Lanka. More than a quarter of students from Muslim and Tamil backgrounds
spoke both Sinhala and Tamil at home. Tamil and Muslim students were more likely to
speak Sinhala, than Sinhala to speak Tamil, therefore (Table 5, Appendix D). A chi
square indicated that there was a significant difference between the groups in terms of
language spoken at home (p < 0.001) (Table 5a, Appendix D). Therefore, Muslim and
Tamils could sharpen their language skills at home more than Sinhalese. The student
focus group interview in Girls’ School 1 confirms that Muslim and Tamil students could
speak Sinhala well because low (Table 5, Appendix G). The majority of students spoke
only English at home. There were no White British students who spoke two languages at
home. However, minorities could speak more than one language at home.of their family
background and the help of their friends.
There was no significant difference between Tamil and Muslim students in terms of
language use at home (p = 0.101) (Table 5b, Appendix D).
In England the number of students who spoke more than two languages was
Gender-wise there was no difference between males and females in language spoken at
home.
The Sri Lankan schools in which the research was conducted encouraged students to
speak Sinhala at school because these schools are Sinhala medium schools. The principals
of all five schools confirmed that they encouraged all students to speak in Sinhala in the
school. Most students spoke Sinhala with their friends in the schools in Sri Lanka. Less
than a quarter of Sinhala, Muslim and Tamil students spoke both Sinhala and Tamil with

101
friends. In the five schools, most students spoke Sinhala only with their friends in school,
in particular Sinhala students (86 %), with around 65% of Muslim and Tamil students
(Table 6, Appendix D). A chi square calculation indicated a significant difference
between ethnic groups in terms of speaking the national language that was not that of their
own group (p < 0.001) (Table 6a, Appendix D).
The results imply that, if more students communicated in Sinhala language with their
friends, this may further help Muslims and Tamils to develop their Sinhala day-to-day
language skills. Therefore, Muslims and Tamils had a greater opportunity to make
friendships across ethnic groups than Sinhalese. This is an important finding, given that
friendship groups are a very important consideration in supporting national cohesion and
reducing misunderstanding among ethnic groups. This issue did not pertain in the English
school where all students spoke only English with their friends.
When comparing male and female students’ responses more female students spoke only
Sinhala language (c 82%) with their friends than male students (c 66%) in the five
schools. More male students spoke Sinhala and Tamil (c 23%) than female (c 8%)
students (Table 1, Appendix E).
In terms of competence in reading, around 80% of Sinhalese reported that they could read
two languages, but over 50% of Muslims and Tamils could read three languages (Table 7,
Appendix D). To reduce distance between Sinhalese and Tamils in Sri Lanka all
government schools teach two National languages and English as a link language.
However, these findings indicated that more Sinhala students could read up to two
languages and more minorities could read three languages. All policy makers also agreed
with bilingual education and thought it would help to encourage social cohesion in Sri
Lanka.
The majority of students from all ethnic groups in the five Sri Lankan schools could also
read Sinhala best, an unsurprising result given that the medium of instruction was Sinhala
(Table 8, Appendix D); for both male and female students see Table 2, Appendix E.
Around 90% of students from all age groups could read Sinhala best across all five
schools (Table 1 Appendix F). A chi square calculation of the difference between ethnic
groups’ ability to use the national language that is not of their group indicates a highly
significant difference (p < 0.001) (Table 8a, Appendix D). There was no significant
difference between age groups (p < 0.2) (Table 1a, Appendix F).
In terms of the language in which students felt the most comfortable for expressing
complicated ideas when their first language was not Sinhala, both Tamil (53%) and

102
Muslim (65%) students felt most comfortable in Tamil (Table 9, Appendix D). However,
35% of Tamils and 21% of Muslims were most comfortable using Sinhala. Numbers of
those who felt comfortable in English were very small. The implication here reflects what
has already been discussed above, that both Tamil and Muslim students report themselves
as having a fair degree of competence in both national languages.
Albeit there are differences between ethnic groups in terms of multilingual competence,
the findings with regard to the development of language competence over time appear to
be quite positive. Across the five schools, it was noticeable that at twelve years old
students spoke only either Sinhala (90%) or Tamil (10%) with friends. By thirteen years
old the proportions had changed and 10.2% spoke in two languages. This percentage rose
to 28% by age sixteen. At eighteen years old the percentage speaking two languages was
22.2%. This overall pattern was repeated in all five schools (Table 2, Appendix F). The
difference between those aged twelve in their first year at school and those aged eighteen
in their last year is highly significant (p < 0.001) (Table 2a, Appendix F). Equally, in
terms of reading, the proportion of those reading multiple languages changed as students
grew older. 20% of students aged twelve, could read only Sinhala (18%) or Tamil (20%)
in the five schools. By age eighteen, the proportions had changed. Only one student could
read one language and the proportion of those reading three languages had risen to nearly
one half (47.2%) (Table 3, Appendix F). More senior, rather than junior, students reported
that they could read three languages best. This result indicates the perceptions of students
of all ethnicities that they continued to develop their trilingual skills as they matured.
In the English school a summary of languages spoken with friends shows all students
used English to communicate with their friends (Table 6, Appendix G; Table 1, Appendix
H; Table 1, Appendix I). Unlike Sri Lanka, England has only one national language.
Leicester (1989) explained that bilingual education was rejected by the Swann Committee
(1985) that encouraged education through the medium of the English language only. This
has been the situation since that time. That being said, currently the Department for
Education has an expressed intention to support children for whom English is an
additional language: ‘The Government is committed to supporting pupils for whom
English is not a first language’
(http://www.education.gov.uk/schools/pupilsupport/inclusionandlearnersupport/ea l),
accessed 09.01.14). Data from the student questionnaire indicate almost all the students
spoke only English at home, with ten speaking other languages (one Romanian, two
Polish, five Asian-British speaking Bengali and English [2], English and Tamil [one],
English and Thai [one], two Black Africans speaking Kikuyu and Swahili [one, Twi and

103
English [one], one mixed Black and White African speaking Portuguese.). There were no
White British students who spoke anything other than English at home. All students used
English to communicate with their friends. As noted above in relation to the Sri Lankan
context, this is a very important point because talking with friends helps to develop
English language skills and break down the barriers between students because they can
understand each other well.
The languages students reported that they could read largely reflected those they said they
used at home. Fourteen out of forty one students in England could read only English.
More minority ethnic students could read more than two languages than English students
(Table 7, Appendix G). Additionally, however, some students reported that they could
read the languages that are specifically taught at school that is French and Spanish.
Almost all the students said that the language they could read best was English except for
two White British students who said they could read French best, two Eastern Europeans
(one Polish, one Romanian), one mixed Black and White African who read Portuguese
best, one Black African who read both Swahili and English best (Table 8, Appendix G).
More males could read only English than females (Table 2, Appendix H). The majority
of students from all age groups could read only English or English and French (Table 2,
Appendix I). In England, the language students felt most comfortable for expressing
complicated thoughts and ideas where their first language was not English shows four
students used English and two students used Portuguese and Polish. However, there were
nine students who did not answer this question. Almost all students for whom English was
not the first language, regardless of ethnicity, felt most comfortable expressing
complicated ideas in English (Table 9, Appendix G).
The implication here seems to be that, in the English school, there appeared from the
students’ reports to be little problem with communicating and learning in one common
language, English. As the head teacher interview of the pilot study had indicated, schools
in England encouraged spoken English in the classroom for minority ethnic students.
However, in England the use of other languages tends not to be encouraged in classrooms
except for curriculum access when students with English as an Additional Language
(EAL) first arrive. Many schools have an EAL department and teaching resources which
help EAL students to improve their English.
5.4.2 Concerns about language acquisition and use In both Sri Lanka and England there are policies stemming from central government that
are designed to promote the acquisition of the national language(s) in schools, In Sri

104
Lanka, for example, all five principals commented that every student was required to
study a second language and English as a link language. Policy Maker One said that in
Sri Lankan schools, every student could learn Tamil as a second language and Sinhala as
a second language together with English as a link language. In addition students could
learn German, Japanese, French, Arabic, Malay, Hindi, Pali and Sanskrit in school also.
Policy Makers Two and Four confirmed that the common curriculum ensured second
language learning for all students which meant that if students’ mother tongue was
Sinhala they had to learn Tamil as a second language. If students’ mother tongue was
Tamil, they could learn Sinhala as a second language. As an international language
students learnt English from primary to senior secondary level in the normal school
system. The school system provided for language teaching from Grade Three, although
children learnt to speak some English words through different activities from Grades One
and Two. Policy Maker Three explained that learning all three languages was perceived
as an important way to successfully implement multicultural education, and he said this
challenge deserved more attention at the policy level.
In England there is a funding stream for English as an additional language in schools, and
a number of initiatives operate at local level to support students for whom English is not
their first language to acquire competency in curriculum subjects in part through the
medium of their own language with the intention that they will gradually be inducted into
education through English full time.
Despite official policy about language learning in schools, some of the comments made
by policy makers and a summary of responses to teacher questions twenty five, twenty six
and twenty seven shows one of the main issues and challenges raised by teachers and
policy makers was language in all the schools in the current research. In Sri Lanka
teachers’ perceptions about students’ language competence differed from the students’
reports to some degree. A number of concerns in relation to language issues were raised
by teachers in all five schools in the questionnaire responses and focus group interviews.
They reported that the main challenge was language in the multicultural classroom, for
example:
• There was a serious issue with regard to the availability of suitably qualified staff. The
policy makers pointed out ‘We don’t have permanent qualified teachr trainers to train
teachers for second language teachers. Therefore we don’t have qualified teachers to
teach Tamil language in the school.’ Some teachers in the five schools commented
on their lack of Tamil language knowledge that meant they could not understand the

105
languages spoken by Tamil and Muslim students. ‘It is difficult to understand when
Tamils and Muslims use Tamil language. Sometimes it makes me uncomfortable.’
Some teachers could not understand the language spoken by students. When students
did not speak or understand Sinhala either, this affected their relationships with
students and their ability to communicate with them effectively.
• In their school curriculum, students could learn Tamil as an additional language.
However, Sinhala language teachers in all five schools, in particular Economics,
Buddhism, Science, Maths, Science, Agriculture, Sinhala literature and Food
Technology teachers, felt that some of their students did not have basic knowledge
regarding grammar, and had difficulties with understanding difficult Sinhala words.
Sometimes students’ language issues related to pronunciation, or understanding of
Sinhala language. This issue could sometimes be a disadvantage, for example,
teachers in the Mixed School and Girls’ School 1 said some students who were not
Sinhala first language speakers could not do so well on written tests. ‘When some
students, especially Muslims and Tamils, do not have proper Sinhala language skills,
it is difficult to face written tests well’. Some non-Sinhala students were reported to
have pronunciation issues in Sinhala which also affected Sinhala students, some of
whom started to copy other students’ mispronunciation. ‘When some Muslims did
bad pronunciation some Sinhala students also use the same pronunciation.
• Principals in the five schools commented that teachers helped students who had low
achievements individually after school or during school time to develop their Sinhala
language levels. ‘All teachers in my school help students with low achievement to
develop their skills. Sometime it will be after school. Teachers individually help
students who can not speak or write well’. However, some teachers in the Mixed
School and Girls’ School 1 felt that they had to give disproportionate amounts of
energy to teach students for whom Sinhala was an additional language.
• There were comments from some teachers that a few students could not speak any
language properly whether they were Sinhala, Muslim or Tamil. These issues are
very important in schools because, as Banks (1988) explains, communication
breakdowns between teachers and students can lead to larger problems of student
alienation, discontent and academic failure. On the one hand those students who were
competent in more than one language clearly would have an advantage in the longer
term. However, for some whose first language was not Sinhala and who found

106
learning through the medium of Sinhala difficult, there was a serious disadvantage
because they could not do so well on written tests.
Not all teachers expressed negative comments, however. Some teachers in Girls’ School 1
indicated that some students had good language skills and others did not, therefore it was
not possible to generalise. Some teachers across all five schools reported that they learnt
different languages from students.
In England, data from the teacher questionnaire indicates that language issues were also
perceived as one of the challenges in the school, but that this view was not universally
held:
• Two teachers mentioned language and body language, one ‘understanding the
students and their communication skills’, and one understanding students’ speaking
ability and use of the English language.
• Whilst one teacher felt that homophones created problems for some students, other
thought that EAL students’ command of English tended to be very good. One teacher
said that sometimes s/he felt that students’ language problems related to the fact that
‘sometimes a language creates barriers, for example words and terms that have more
than one different meaning’ However, according to the focus group interview, dance
and music teachers said the command of English among students with EAL in their
school commands of English was very good. In any case there was special provision
for EAL students’ language difficulties in English. ‘I only have two students with
EAL; however their command of English is very, very good.
• Problems could arise with the unplanned arrival of non-English speaking students, as
the interview with the head teacher interview indicated. The head teacher explained
that unplanned arrival of foreign nationals not speaking English could be a serious
issue. There was not necessarily a person in school who spoke their language. There
were no families in the local communities involved very much with the school who
could assist in this situation. It was not always possible to access support in minority
languages from the local authority.
It’s the unplanned arrival at school of, let’s say one or two. So, for example, there’s a girl and forgive me, I don’t know her ethnicity, but she’s non-speaking African, her family’s just arrived in Britain. They’re trying to get into a neighbouring school, they can’t, it’s full. We’ve got a space in Year 10, but we don’t have a national speaker of her language. If she arrives, it’s going to be very difficult to actually, we’d have to take some advice as to how we could her the support, so it’s the unplanned arrival of non-speaking British, non-speaking foreign nationals for whom we don’t necessarily have a

107
person in school who speaks their language. And, I said ‘unplanned’ because they’ve just arrived, and because we have spaces very often they’re directed towards us.
• As Gardner (2004) explains, the Swann Report had recommended the appointment in
each local education authority (LEA) (now local authority) of an adviser for
multicultural education who would be responsible for the development of pluralist
approaches to counter racism and also ensure the provision of resources for EAL.
These resources and support were not always available in the short term, however.
In summary, teachers in schools in both countries reported that communicating with
students whose first language was not Sinhala (Sri Lanka) and English (England) could be
problematic as they themselves tended not to be competent in speaking more than one
language. Relationships between teachers and students and between students could be
jeopardised by inability to communicate verbally competently. However, the majority of
students from all ethnic groups in the schools in Sri Lanka had positive perceptions that
the teacher knew some expressions in the languages used by different students. In Sri
Lanka the biggest proportion who replied ‘Always’ was Tamil (50%) (Table 10,
Appendix D). More White British had positive perceptions with some minority students in
the English school. Half of the White British (fourteen), all Mixed (two) (White and
Black African, White and Asian), one White East European and one Black African
student were positive in their perceptions. However, eight White British, three Black
African, three Asian British, one White East European and one Black Caribbean student
were very negative in their response (Table 10, Appendix G).
5.5 Chapter summary
In summary, there were Sinhala, Tamil and Muslim students in the samples in the Sri
Lankan schools with a small number of Burghers and Malays. In the English school
sample there were more White British students with some minorities who belong to
different ethnic groups. All teachers in England had a degree and a teacher qualification,
but nearly half of the teachers were not qualified beyond A-level GCE in Sri Lanka,
despite government policy. Most teachers in both countries believed their school should
offer multicultural education. In Sri Lanka, however, the level of qualifications appeared
to be associated with attitudes towards educating students of other cultures than their
own. Half of the teachers in Sri Lanka thought that teachers prefered to teach students of
the same backgrounds as themselves, for example. The majority of teachers in Sri Lanka
and England believed that it was possible to plan lessons and choose resources with
different languages of various students’ groups in mind. However, the majority of

108
teachers in both countries did not have access to the kind of multicultural education
training from which they felt they would benefit.
Language was a main issue and challenge in both countries in terms of communicating
with, and between, students and teachers, and of privileging some students over others.
More Muslim and Tamil students could read three languages than Sinhalese. In England
the majority of students could read only English.

109
Chapter 6: Results and analysis. Part 2: multicultural education
and inclusion in schools
6.0 Introduction
This chapter provides an understanding of multicultural education polices and the
different strategies employed in including ethnically diverse students in classrooms and
the wider school in the Sri Lankan and English schools. The chapter is divided into three
sections covering school ethos, classroom practices and student attainment and
progression, and concludes with an overview of challenges identified in achieving
effective multicultural classrooms.
6.1 School ethos
6.1.1 Multicultural education policies A key aspect informing an inclusive and effective multicultural school ethos is the
adoption of multicultural education policies in school which set out the approaches
schools should implement in order to recognise and educate ethnically diverse students.
The policy makers interviewed explained that Sri Lanka had a language policy and there
were no special policies to respond to the increasing level of cultural diversity in a school.
Normally in Sri Lanka most schools were segregated along ethnic and religious lines. But
they also had multicultural schools. Therefore the national education policy responded to
these situations. In contrast to England which has a history of making educational
provision for ethnically diverse students, Sri Lanka does not have specific policies for
integrating minority or immigrant students as normally they have separate schools for
different ethnic groups, and national educational goals give equal rights to every student.
Minority students also had the same rights as in other schools. Sri Lanka has a separate
school system. The government schools were maintained separately and they did not have
as many immigrant students like England, and of the few most were studying in an
international or a private school. In some schools in mixed ethnic areas, students were
studying in Sinhala medium while the students came from different backgrounds, and
there was a national policy for them. One policy maker said schools with mixed
ethnicities had a peaceful environment and were non–violent and that they produce self–
disciplined law abiding students.

110
According to the policy makers the national educational goals of Sri Lanka explained
the overall approach, including the need for students to be patient and respect each
other. One commented: ‘Everything is explained through the national educational
goals, especially, being patient and respecting each other’. They pointed out that the
Ministry of Education, the National Education Commission and the National Institute
of Education (NIE) were the key forces behind the initiatives implemented in school
and that the Ministry of Religion and Cultural Affairs also helped these initiatives. For
example, the Ministry of Education was involved in the design of multicultural
policies, whilst the education policy documents included duties of the provincial and
Zonal authorities, and the 13th amendment allowed the provincial council to make
policies. Sri Lanka has policies regarding minority students and this policy and practice
is the same in the provincial council also. Policies which were related to the
multicultural backgrounds of students were the same all over the country and the
Quality Control Mechanism within the NIE and the Education Publication Department
were there to ensure that there was no bias in the curriculum against ethnicity, religion,
gender and those from social and economically disadvantaged groups.
The policy makers stated that their role was to make policies match multicultural, multi-
religious and mixed groups in Sri Lanka, and in doing this it was important to understand
the national background and needs in order to develop a coherent nation at the
international level. Through the education policy, as one policy maker said, they tried to
‘build a person with a complete personality’ and that to become a ‘person he/she needed
to acquire every quality’. Policy makers needed to make policies which helped to get
benefits for the country. However, he added, ‘the problem is putting these policies into
practice’.
In England, multicultural policies for schools have been in existence since the late 1970s.
These policies are reflected in curriculum content requirements of which teachers in the
school were aware. According to the head teacher multicultural policy in the English
school was underpinned by principles of equity and cultural diversity (discussed later in
the chapter). Anti-racist policies have been implemented starting from the 1980s, as
discussed in the literature review. These policies were further enhanced by the Race
Relations Amendment Act in 2000 which imposed a public duty on schools to be aware
of the ethnic background of their students, the requirement to address issues of racism
and the monitoring of instances of racism. One of the implications of the monitoring of
racism is that schools should record whether any disciplinary action taken against
students is related to racism and their peers’ ethnic background and whether such racism

111
is fostered by the school environment, teacher attitudes, other teaching and learning
process so that teachers can avoid any suggestion of racism or exclusion as a result of
ethnic difference. Most recently the Equality Act 2010 has strengthened the requirement
on schools not to discriminate on the grounds of race, ethnicity, religious belief or other
kinds of difference.
6.1.2 Perceptions that all students know what is the school’s antiracist policy In this study a key factor in ascertaining students’ knowledge about the existence of
inclusive multicultural education policies is their knowledge of the content in their
school’s antiracist policy. The majority of students in all ethnic groups in both the
schools in Sri Lanka and the English school had positive perceptions that all students
know what is in the school’s antiracist policy. Across the five schools almost all the
students except for eleven Muslim students and one Tamil replied ‘Always’ or ‘Usually’
to the statement ‘All students know what is in school’s antiracist policy’ (Table 11,
Appendix D). However, a chi square calculation indicated there is a significant difference
between ethnic groups (p = 0.005) (Table 11a, Appendix D). There was a significant
difference between Sinhalese and Muslims (p < 0.0001) (Table 11b, Appendix D) but no
difference between Sinhalese and Tamils (p = 0.183) (Table 11c, Appendix D).
All students in the English school said they were aware of the anti-racist policy of the
school and knew what was in it.
6.1.3 Signs, notices and bulletin boards in students’ language As noted already in the literature review, display materials in classrooms and around the
school can communicate messages about the value of particular languages and cultures in
the school. Visual images represent the presence and the experience of all the groups and
cultural perspectives in the school (Coelho, 1998). Data from the student questionnaire in
Sri Lanka show that most Sinhalese had positive perceptions about these visual images,
but that Tamils and Muslims had more negative perceptions (Table 12, Appendix D). A
chi square calculation of the difference indicates a highly significant difference between
ethnic groups (p < 0.001) (Table 12a, Appendix D).
The majority of students of all ethnic groups had generally positive perceptions about
bulletin boards around the school indicating that students in the school come from a
range of ethnic backgrounds. However, a chi square calculation shows a significant
difference between ethnic groups in Sri Lanka with proportionately more minority ethnic
than majority ethnic students having negative views.

112
The interviews conducted with the Sri Lankan principals helps to inform our
understanding of some of these negative perceptions. Principals’ interviews in all five Sri
Lankan schools indicated that they used Sinhala language for signs and notices with the
justification that these were Sinhala medium schools. This finding is important for a
number of reasons. Firstly, if Tamil as one of the national languages is not represented
this may be seen as undermining national policy both to do with the promotion of bi- and
tri-lingualism and also multi-lingualism as a way to promote national unity and cohesion.
Secondly, Tamil and Muslim students who speak Tamil may feel that their language and
cultures are not valued and that they themselves are devalued as a human being. Besides
this, Sinhala students who might have benefited from developing their understanding of
Tamil through such signs and notices are deprived of this possibility.
In England, perceptions that the bulletin boards around the school indicate that students
in the school come from a range of different ethnic backgrounds reflect both positive
and negative views (Table 11, Appendix G). Half of the White British students had
positive perceptions with some minority students. Another half of the White British
students had negative perceptions with some minority students.
The outcome of the student questionnaire in relation to perceptions of signs, notices and
bulletin boards around the school in England therefore reflects that of Sri Lankan
students. The majority of minority ethnic students had a negative perception and the
majority of White British students had positive perceptions about signs and notices in
different languages around the school. It has to be said, however, that the English school
was trying to increase English language skills among all their students and this outcome,
therefore, reflects the school language policy. Having said that it is noticeable that in the
pilot there seemed to have been a greater attempt to reflect the presence of different
cultures through the signs and notices prevalent in the school, and that the same
argument discussed above in relation to schools in Sri Lanka might pertain in relation to
the detrimental effects of the invisibility of some ethnicities and cultures.
6.1.4 Perceptions that sometimes schools concerts and special events included all cultures In Sri Lanka, perceptions that school concerts and other special events included all the
cultures shows considerable variability. In both Sri Lanka and England the perception
that school concerts and other special events include all the cultures was rather negative.
Over 50% of Sinhalese replied ‘Always’ and below 50% of students from minorities
replied similarly (Table 13, Appendix D). However, more Tamils in the Mixed School
and Girls’ School 1 replied ‘Always’ than other ethnic groups. In the Boys’ schools and

113
Girls’ School 2 there were more Sinhalese who replied in a similar vein. A chi square
calculation indicates that there was a significant difference between the groups (p =
0.017) (Table 13a, Appendix D).
In England, while nine out of twenty six White British students were very positive
that school concerts and other special events include all the cultures in the school
others felt different (Table 12, Appendix G).
Tin Sri Lanka the students’ questionnaire indicated that the majority from all ethnic
groups felt that they did have the opportunity to celebrate special events important to
their ethnic groups. However, a quarter of Tamil and Muslims disagreed. This finding
challenges the comments about effective multi-cultural education. It is important to
celebrate the major holidays of all the cultural groups in the school, and to accord them
equal importance in the life of the school, whether these are public holidays or not
(Coelho, 1998, p. 103).
In England, according to the students of Year Twelve, there had been an Africa Day, but
not any other ethnic days. The students felt that they needed to celebrate other days once
a year. Every year it should be different. A student from Ghana felt happy about the
Africa day because her uncle came to the school and told the story of how people got
their names. He explained how that particular student got her name because she had a lot
of names.
Africa day was basically about Ghana and one of my uncles came in as well. He taught about how we get our names, so he was telling the story. He told one of my classes how I got my name because I have loads of names, yeah because obviously when people hear my name, they are just like, why? But obviously it’s important to me why I have so many names and what my names mean, so if someone else can explain it in a way that I can, then it makes me feel good inside, that they’d know instead of me having to be like… .This means this and then that means that, but if they tell a story about it then it makes me feel better.
The head teacher confirmed that there was an Africa Day in the school two years
before. It was an expression of exploring different cultures like African drumming,
geography, flags of Africa and the history of Africa. There was also a link with a school
in China and twelve students went to China for a week and some Chinese visitors came
to England.
In Sri Lanka overall, perceptions that the important festivals and special days of all the
ethnic groups in their school are celebrated were positive. The students’ questionnaire
indicated that the majority of students from all ethnic groups in the five schools had
some experience that important festivals and special days of all ethnic groups in their
schools were celebrated (Table 14 Appendix D). A chi square calculation indicated there

114
was no significant difference between ethnic groups (p = 0.064) (Table 14a, Appendix
D). However, there was an important difference among schools. While more Muslims
had positive perceptions in the Mixed School there were more Sinhalese with positive
perceptions in Girls’ School 1. Nearly 90% of Tamils replied had positive perceptions in
Girls’ School 2. When considering the boys’ schools, around 50% of all ethnic groups
had positive perceptions in Boys’ School 1 and around 80% of Sinhalese and Muslims in
Boys’ School 2.
In terms of perceptions by ethnicity of religious festivals celebrated more Sinhala
students had more positive perceptions than Muslims and Tamils about religious
festivals celebrated in their schools in Sri Lanka (Table 15, Appendix D). A chi square
calculation indicated a significant difference between ethnic groups (p < 0.001) (Table
15a, Appendix D).
The qualitative data helps to illuminate some of the findings of the questionnaire data.
Discussion in focus group interviews of students and teachers shows that most of the
research schools gave priority to celebrating Buddhist festivals. The teachers’ focus
group interview indicated that all students decorated their school for the Wesak
(Buddhist) festival without any ethnic difference. ‘In our school Tamil and Muslim
students help to decorate classrooms for Wesak festivals’. In focus groups interviews,
students of the Mixed School said that they celebrated Wesak and Poson festivals.
‘Normally in our school we celebrate Wesak and Poson poya days more than other
festivals’ The same festivals were celebrated in Girls’ School 1. In the Mixed School
teachers also confirmed through focus group interviews that the school celebrated Wesak
and Poson Poya days. All students decorated classrooms for these festivals. Students
shared sweets in the festival season. As one teacher commented, ‘All students without
any ethnic and religious differences share sweets in their festival seasons, for example,
Sinhala and Hindu New Year and Ramadan’.
The Lessons Learnt and Reconciliation (2011) report highlighted the importance of
teaching of comparative religions and ethnicity in schools, and that education must
focus on values which are common to faiths and the potential of those values to enrich
life in a diverse society. In light of this the principals of the five schools said that their
schools celebrated various religious festivals, which supports Girls’ School 2’s
contention that they celebrated different types of festivals which are relevant to Sri
Lankan multicultural society. ‘We celebrate different festivals in our school. If we
don’t have time to do it largly, at least, we mention it in the morning assembly, like

115
today is an important day because of this reason’. The principals of all five schools also
agreed that in their schools, daily routine recognition of Buddhist cultural practices
fostered multicultural understanding. Teachers in the focus group in Girls’ School 1
also acknowledged the same point:
We follow Buddhist cultural practices in our daly routins but we do not ignore others. When Sinhala Buddhist students observe the eight principles (Sill) during Poson Poya day at school, Muslim and Tamil students help them. Similarly, when Muslim and Tamil students have their Ramadan and Sivarathri celebrations Sinhala students attend to their needs.
This support for other religions was evident in the policy makers’ interview which
indicated that Muslim students could go early on Friday for their prayers. However,
despite attending schools which recognised the Muslim religion Muslim boys felt that it
was difficult to get permission go to the Mosque on Fridays.
A key aspect undermining diverse religious understanding in some Sri Lankan
schools was highlighted by teachers in Boys School 1 who explained that they
celebrated festivals which were approved by the Ministry of Education, but they did not
have cultural exchange programmes with other schools. ‘Normally our school celebrates
festivals which are approved by the Ministry of Education’. Moreover, some teachers
from Boys school 1suggested that if they had a cultural exchange programme that it
would help to build up social harmony between the different communities.
We do not have cultural exchange programmes but I saw on programme through the television news there were some cultural exchange programmes between schools in Jafna and Colombo. If we have this type of programme it will help to build a better intercultural understanding among students with different ethnic groups. Here we have Tamil students. We have good relationship with them. Therefore, Tamil students who come from Jaffna can get experience from them about how Sinhalese treat Tamils in Colombo.
Unlike the Sri Lankan schools studied, the school in England was underpinned by a
particular Christian denomination - Church of England. Though interestingly, despite
being a church-sponsored academy the head teacher did not consider the school to be a
Christian faith school because it did not exclude other religions from the religious
education curriculum provided, and although the school used a chaplain as a resource,
his assemblies were not religious. The head teacher explained the chaplain’s approach
as ‘He’ll have a time for reflection; he won’t say ‘Time for prayers’. He will say, ‘If
you’ve got a god, you might want to pray to your god’.
The head teacher’s perspective that the school was not a Christian faith school was
somewhat contradicted by the opening of the school by an Archbishop and the number
of clergy present at the time who did not want to listen to the message that the school

116
was not a faith school. The head teacher’s contention was further challenged by Year
Nine and Twelve focus group students who commented that their school was a Christian
school, and that every student was treated in the same way. As a faith school religious
education was compulsory in the school, but it was not restricted to the teachings of
Christianity. Students in Year Nine, Eleven and Twelve focus groups commented that
they studied various different faiths and beliefs across the world. For example one
student said,
When we did RE in Year Nine, we learnt a lot about Islam and we touched on quite a few other religions. We focused a lot on Islam, and we did a little bit of Christianity, but it was mainly about other religions’. [There were some debates about faith.] ‘So it would usually be Christians against atheists and then there’ll be, sometimes a heated argument, but it all resolves itself, because we’re still old friends, even though we have that difference between us.
Students had some knowledge about Hindu from RE lessons and some books in the
library. However, students in a Year Eleven focus group said that they did not celebrate
religious festivals that were not Christian. This might explain why minority ethnic students
in the English school had less positive perceptions than White British students about diverse
religious education in school (Table 13, Appendix G). It does not however explain why some
students (Asian British) had negative feelings and were uncomfortable with learning about
Christianity at school.
6.1.5 Perceptions that the students were allowed to wear traditional clothes and hairstyles The students’ questionnaire indicated that the majority of students agreed that they
were allowed to wear traditional clothes and hairstyles that were important in their
own culture (Table 16, Appendix D). However, a chi square calculation indicated
there was a significant difference between the gender groups (p < 0.0001) (Table 3a,
Appendix E). More females felt that they had the opportunity than males and this was
supported by the policy makers’ interview which indicated that Muslim girls were
allowed to wear their traditional dress in the school. As one commented, ‘We allow
Muslim girls to wear their traditional dresss in the school and Muslim students can go
early from the school on Fridays for their prayers’
Like the Sri Lankan students, in England the majority of students from all ethnic groups
replied ‘Always’ or ‘Usually’ to the statement ‘Students in this school are allowed to
wear traditional clothes and hairstyles that are important in their own culture’ (Table 14,
Appendix G). Similarly, there was a significant difference between the gender groups
(Table 3, Appendix H). There were more females who had the opportunity than males.
The evidence of the student questionnaire reflected established government policy. The

117
Ministry of Education and Higher Education gave permission for Muslim girls to wear
traditional Panjabi costume under Circular No 37/1995.
6.1.6 Perceptions that the school assemblies included different cultures
Banks (1988) suggested that ethnic diversity in the school should be reflected through
assembly programmes. Grant and Chapman (2008) explain that a major goal of inter
group education was to reduce racial and ethnic prejudice with intervention such as
teaching units on minority groups, assemblies and cultural get-togethers and the banning
of books considered stereotypical and that knowledge about ethnic groups would help
students to develop more positive racial attitudes. The principals of all five schools
indicated that they used Sinhala language in assemblies and some special days and for
some parts of assemblies that they used the English language. Their comments were
reflected in the students’ questionnaires which noted that the majority of student school
assemblies were often about different cultures and races with most of the Sinhalese and
Tamil students having positive views (Table 17, Appendix D). A chi square calculation
indicated there was a significant difference between ethnic groups (p = 0.006) (Table
17a, Appendix D). The difference was between the Muslims and the other groups, forty
percent of whom replied ‘Rarely’ or ‘Never’.
According to the ESCP Report (2008) morning assembly provides a good stage for
developing peace vision and attitudes in the school community. Included among the
suggestions were: presenting a day’s peace thought (by student or teacher), reading a
portion from world literature that appeals to noble thought, listening to a peace song,
presentation of world news of the week, drama with a moral sense, guest speech,
record radio programme/or a programme produce by students, session of devotional
songs, presentation of life stories of great men and women (ESCP Report, 2008).When
forty per cent of one cultural group felt their culture was not represented in assemblies
in the five schools there may be some concern. However, this forty per cent needs to be
considered against the student and staff views derived from the focus groups
conducted in the five Sri Lankan schools.
Focus groups interviews indicated that at morning assemblies the students prayed to Lord
Buddha but were given time to pray other gods also. Girls’ School 1 and Girls’ School 2
had different types of assemblies. However teachers in Boys’ School 1 said that the
school did not have religious assemblies. Morning assembly was open for all students
from different faiths.

118
The principal of Girls’ School 1 said, ‘During the morning assembly the children
practise their own prayers. After the prayers, all children start to sing the school song
together. Therefore, all feel the same then’
Interestingly, the lack of inclusion of diverse cultures in school assemblies is not confined
to Sri Lankan schools. In England a large number of students (twenty five) from all ethnic
groups replied ‘Rarely’ or ‘Never’ to the statement ‘School assemblies are often about
different cultures and races’ (Table 15, Appendix G). As with the Sri Lankan findings, the
student questionnaire data differs markedly from that obtained in the staff focus groups.
For example, History and ICT teachers disagreed with the majority student view. They
explained through focus group interviews that there were a lot of different types of
assemblies. Occasionally assemblies had a religious aspect but it was never prayer. They
were assemblies with a religious dimension. One teacher commented ‘Certainly coming
up to Christmas we have remembrance assembly which the chaplain conducts and he does
a lot of the power points that we show in assemblies’. The teacher had experience of
Roman Catholic schools where most of the teachers were Roman Catholic as were the
majority of students. There the religious study was just Roman Catholic. The current
school had not picked up festival days because RE had come through quite a lot in the
school. However, teachers of business studies, science and PE explained that assemblies
picked out some traditions. ‘We may be Church of England, if you like, but are all faith
and no faiths. So if you break it down it’s the morals, truth, honesty, integrity, as opposed
to […..]. You’d expect that here.’
One of the goals in the new Education Act for general education in Sri Lanka (2009) is
‘Respecting human dignity, recognizing the pluralistic nature and cultural diversity in Sri
Lanka, and upholding tolerance and reconciliation’. As Perera et al. (2004) commented,
history as a subject has significant potential in facilitating social cohesion and integrity.
There is a special demand on the subject of religion in the school curriculum. Perera et al
(2004) explain that a content analysis of the textbooks used for the subject of religion at
the secondary level which was undertaken as part of an on-going research project at
national level for the National Education Commission, clearly indicates the nature of the
transformation that is needed if the subject of religion is to be effectively enlisted in the
case of forging social cohesion.
Many people believed that youth unrest directly influenced Sri Lanka’s ethnic conflict.
Youth of all communities need to live together in harmony in a multi-ethnic, multi-
religious society. The report of the Presidential Commission (1990) recommended that

119
awareness of other religions and practices should be introduced into the school
curriculum from the beginning of school. Then they suggested that all textbooks in two
languages (Sinhala and Tamil) should be re-examined and should include stories which
relate to national harmony and they suggested Arabian Islam be made available in all
Muslim schools. The Report of General Education Reforms (1997) criticized the
education system in Sri Lanka at that time. It explained that the education system did
not produce the knowledge and understanding and the skills and attitudes appropriate
for successful living. Further it explained that the development of the students’ total
development, creativity, initiative, discipline, team spirit, respect and tolerance for other
people and other cultures was not being achieved at the time.
The National Education Commission (1992) introduced sets of basic competencies of
education in Sri Lanka. Among the basic competencies, the third set of competencies is a
focus on values and attitudes which argue that it is essential for the individual to
assimilate values which are consistent with the ethical, moral and religious modes of
conduct, rituals, practices in everyday living, selecting that which is most appropriate.
The Report of the General Education Reforms (1997) gave more attention to values
education and national integration. As values and morals cannot be taught through
separate subjects, the reform suggested they should be learned continuously through all
subjects and through all the years of schooling. For example, the teaching of religion can
contribute to building up appropriate values and morals. The five schools of the centre of
the current study were identified as including high proportions of students with
multicultural backgrounds. We might expect therefore that they would demonstrate
many of the attributes identified here. A chi square calculation indicated there was no
significant difference between ethnic groups with over 95% of students from all ethnic
backgrounds in the five schools replying ‘Yes’ to the question ‘Have you studied some of
the history of your own culture?’ (Table 18, Appendix D). This therefore is an important
finding in the context of Sri Lanka’s multiethnic history.
The main characteristic of an integration perspective on multi-cultural education is a
focus on rejecting the prejudice against minority groups. In England teaching about
culture is intended to promote a positive self-image among Black people, and tolerance
and sympathetic understanding among White people (Arora, 2005). So the issue of who is
able to study the history of their own culture is an important one. The students’
questionnaire in England indicated that White British and some minority students were
more likely to say that they had studied some of the history of their own culture.
However, Out of five Asian British, three replied ‘No’ with five White British, one White

120
East European, one Black Caribbean and one Black African student (Table 16, Appendix
G).
6.1.7 Perceptions that the library had books about people from different cultures It is very important to provide library facilities that support students to develop an
understanding of all cultures in the school and elsewhere. The students’ questionnaire
indicated most of the students from all ethnic groups felt that their school library had lots
of books about people from different cultures (Table 19, Appendix D). However, there
was a significant difference between Sinhala and Muslim students (Table 19a, Appendix
D) who felt there were few books about their culture in school. When Muslims felt that
there was a lack of books about their culture in the five schools there may be some
concern. Added to this, focus group interviews in Boys’ School 2 show that students felt
that there was not a good collection of books in the school library to study multicultural
societies in the world. Paradoxically, students had a rich collection of books in the library
about ethnic backgrounds in the World in the Mixed school.
There may also be a concern that a small proportion of teachers in all five schools had
positive perceptions about library facilities in their schools. Teachers’ perceptions of
whether school libraries had a good collection of multicultural materials show only
small proportions of teachers agreed strongly with the statement across all five
schools. Girls’ School 2 (88%) and Boys’ School 2 (87%) had the largest proportions
of those who agreed to some degree. Around one quarter to one third disagreed
somewhat in the Mixed school, Girls’ School 1 and Boys’ School 1 (Table 16,
Appendix J).
In England almost all students from all ethnic groups replied ‘Yes’ to the question
‘Does the school library have lots of books about people from different cultures?’
(Table 17, Appendix G). Year Twelve students said through focus group interview
their school’s openness to cultures was evident in a range of books in the library.
Teachers’ ratings of whether the school library had good multicultural materials shows
one White British and one White Irish teacher agreed strongly with the statement across
all teachers. Two White British, one Asian British (Pakistani) and Asian British
(Bangladeshi) agreed to some degree. Five White British, one Mixed (White and Black
Caribbean) and a teacher who did not mention their ethnic group disagreed somewhat or
strongly disagreed with the statement (Table 16, Appendix K).

121
6.1.8 Perceptions of feeling safe, secure and comfortable at school The importance of safe school environments is another important topic in multicultural
education. According to Maslow’s Hierarchy of Needs (1970) each person is motivated
by needs. Maslow’s Hierarchy of Needs states that after physical and emotional needs
are satisfied people need to feel safe. Banks (2006) also said a major goal of
multicultural education is to reduce the pain and discrimination that members of the
same ethnic and racial groups experience because of their racial and cultural
characteristics. Further, Banks (2008) said a key goal of multicultural education is to
help individuals gain greater self-understanding by viewing themselves from the
perspectives of other cultures and providing students with cultural, ethnic, and language
alternatives, thus creating an environment where mutual understanding brings with it
safety and security for all.
In all five schools in Sri Lanka, over 90% of all students replied ‘Always’ or ‘Usually’ to
the statement ‘I feel very comfortable at this school’ (Table 20, Appendix D). The
majority of students in all five schools also replied ‘Always’ or ‘Usually’ to the
statement ‘I feel comfortable talking about my own culture at school’ (Table 21,
Appendix D). More male students had more positive perceptions than females.
However, a chi square calculation of the difference between ethnic groups’ feelings of
comfort in school in talking about their own ethnicity was highly significant (p < 0.001)
(Table 21a, Appendix D). A large proportion of Sinhala (76.2%) students replied
‘Always’ to the statement with around 50% of Muslim and Tamil students. Students’
focus group interview in all five schools also gave strong evidence that students
generally felt safe in their school. In Boys’ School 2 students commented in one of their
focus groups, ‘We don’t have any ethnic harassment in our school. We are boys, so we
have some fights but for different reasons. Not for ethnic or religious purposes’. A
bigger proportion of Tamil students had positive perceptions about safety than other
ethnic groups in the five schools, however. (Table 22, Appendix D). The Tamil students
from the Mixed School, Girls’ school 1 and 2 and Boys’ School 1 had the highest
positive perception. In Boys’ School 2, both Tamil and Sinhalese had similar
perceptions. Fewer Muslims felt safe than other groups. There was no real difference
among males and females. However, the eighteen year olds had the least positive
perception about safety in the five schools, except in Boys’ School 2. There were more
males who had positive perceptions than females in the Mixed School.
The number of students who got into an argument or fight because of different
backgrounds was reported as low in the schools in Sri Lanka. Perceptions of whether

122
students from different backgrounds ever got into an argument or a fight were low in the
English school also. However, in the Sri Lankan schools there were more Sinhala and
Tamil students who had arguments or fights than other ethnic groups. There were more
males who had experience of fights or arguments than females. There was a little
difference between the five schools. In the Mixed School more Sinhalese had experience
of fights or arguments and more females had the same experience than males. In the
boys’ schools more Tamils had this experience than other ethnic groups. Similarly, in
Girls’ School 1 proportionately more Sinhalese and Tamils and in Girls’ School 2 more
Sinhalese and Muslims, had experience of fights or arguments. A few teachers reported
some experience of arguments but this was seldom related to ethnicity.
As in Sri Lanka, in the English school, overall, perceptions of whether students from
different backgrounds ever got into an argument or a fight were low. The majority of
students from all ethnic groups had no experience about arguments or fights about
ethnicity. More females had experience than males.
As with the Sri Lankan schools, students in the English school felt safe and secure. It
would seem that such safety was fostered through various mechanisms. For example,
teachers walked the corridors and the outside areas. There were security gates outside
the buildings. There were very few arguments. Issues were sorted out quickly if there
were any arguments. Within the classroom there were rules on the walls about being
polite when someone else is speaking, putting hands up to talk, and so on. Students of
Year Eleven also added there was a sense of feeling safe because frequently the Head
patrolled quite a lot, as did teachers who monitored behaviour around the school. As a
Year Nine student commented,
There are always teachers in all the wings. There is always a teacher standing there, so if anything does happen you can just walk up to them and tell them, or if they see something they’ll sort it out.’ Teachers were seen as always there to help students. There were good relationships with teachers with whom students felt they could interact. ‘With teachers in this school, they are so open to you and you can talk to them.
The atmosphere was ‘really nice’. Students had strong friendship groups, they could
socialise with anyone and, as noted above, there had been no cases of bullying.
In the English school in the Year Twelve focus group one student reported that she had
been bullied a bit in her previous school in Year Nine, but it was resolved within two
months when she came to the current school.
That person (a boy in year 11) lives around my area, they live the same street as me as well, so it would carry on, on the walk home from school, so sometimes my mum would have to come pick me up, because I was really upset. When that boy bullied me, my friends tried to stop it.

123
Teachers in the study schools were reported by the prefects as treating everyone the
same way. As one of the male prefects remarked:
The school has a policy of zero tolerance for bad behaviour. I’ve never had to deal with anyone that’s had an issue with anybody else, a different race or religion, and, as far as I’m aware, none of that goes on. ‘Students have to get on with each other, have to get their work done, and I think that helps. I wouldn’t say it breaks down the barriers because I wouldn’t say there are barriers, but it certainly prevents the barriers from forming.
Another prefect said: ‘There is no tension. Friendship groups keep to themselves but it is
not an issue because no one is left out’.
In the focus group interviews history and ICT teachers also agreed with the
students’ comments. Students ‘have a strong sense of trust, safety’ and felt there was
‘a lovely environment’ for them. All students had some opportunities to meet the
chaplain and discuss any issues in private. There was an anti-bullying week. There
were a lot of principles and values in the school.
Overall, therefore, students from all ethnic groups in the English school had positive
perceptions of personal safety in the school. There were no male and female-, or age-
related, differences. Teacher focus group interviews indicated that the teachers also had a
strong sense about student safety at school. These findings differ widely from the Burnage
Report in (1989) which was released as a result of the murder of a Bangladeshi student by
a White student and reported that student-student relations and teacher-student relations
and types of anti-racism were similar in other schools that were like Burnage High School
in which the boy was killed. It is interesting that the Burnage study took place twenty five
years ago, policy has changed considerably since then, and that the current study school
was in an area that had been subject to racial tension over the previous year. However,
this tension did not seem to have spilled over into the school according to the pupils’
perceptions.
The International Commission on Education for the Twenty-First Century (Delors Report,
1996) identifies ‘Learning to live together’ as one of the pillars of education. The
meaning of this pillar is developing an understanding of other people and an appreciation
of interdependence, carrying out joint projects and learning to manage conflicts, in a spirit
of pluralism, mutual understanding and peace. The Council of Europe (2001) explains
that social cohesion needs to ensure every citizen has the opportunity to access their basic
needs, protection and legal rights. It is therefore important that the students’ questionnaire
in Sri Lanka shows that the majority of students for all ethnic groups did not complain
about bullying at school because of their ethnic background (Table 23, Appendix D).

124
The questionnaire data was supported by the focus group data in Sri Lanka. In the focus
group interviews students commented that ‘We don’t have arguments for ethnic reasons’.
In Girls’ School 1 there had been little bullying experienced and if they had experienced it
teachers sorted it out quickly. There was no experience of bullying except for one student
who had one experience in Boys’ School 2. Students had fights in the school but, as they
said in their focus groups, ethnicity was not the reason, and where fights occurred
teachers ‘sorted out every fight quickly’.
Teachers’ focus groups and the principals of all five schools said that they did not have
experience of any racial incidents of bullying or abuse for ethnic or religious reasons,
and that there was a procedure for conflict mediation if students experienced ethnic or
cultural harassment in their respective schools. If they were to have racist incidents they
would follow the Government rules and regulation. The principal of Girls’ School 2
explained that Sri Lanka did not have racial problems. Further, she explained that
children sometimes argued with friends from the same ethnic groups and different
groups but this was not a racism issue but rather related to, as the Vice Principal in Girls’
School 2 said, arguments about foods, but he sorted them out quickly. In the fasting
period Muslim students spitting everywhere was reported as an issue. Teachers advised
them not to do it again in the Mixed School.
The majority of Sinhala and Tamil students had positive perceptions about whether
complaints about being bullied were resolved in the schools in Sri Lanka. A high
proportion of female students (80%) replied ‘Yes’ to the question with nearly 75% of
male students in the five schools (Table 4, Appendix E). Across the five schools overall
perceptions that students saw results for their complaints were positive. More Sinhala
and Muslim students had positive perceptions with a slightly small proportion of Tamils.
There was a little difference among males and females with a significant difference in
the Mixed school. While all males had positive perceptions only 65% of females felt the
same. However, individually there was little difference among schools. In the Mixed
School more Muslims had positive perceptions.
The teacher questionnaire indicated that teachers in all five schools felt that students of all
ethnic backgrounds should behave well. However, teachers in Boys school 2 were less
positive about this than teachers in the other four schools. The highest proportion of
teachers who felt positively were those from zero to five years teaching experience and
trained graduate teachers. In other words it was the newest teachers and those with the
highest qualification who had the most positive expectations of student behaviour in all
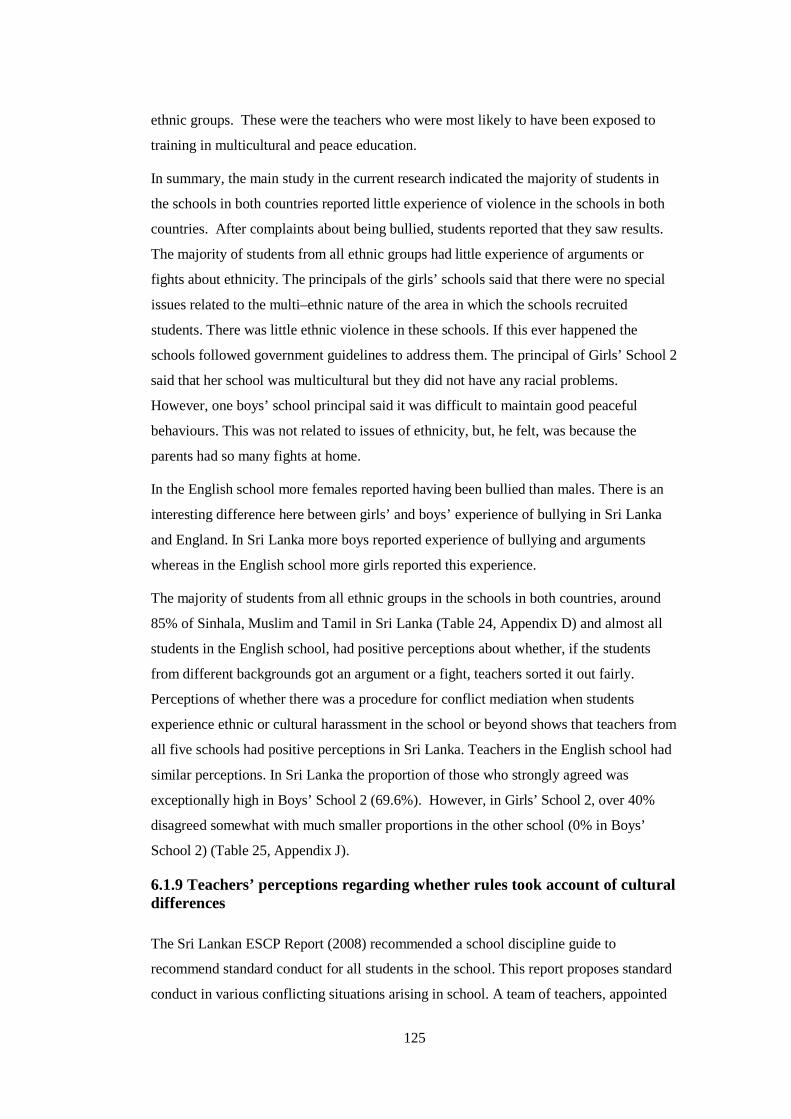
125
ethnic groups. These were the teachers who were most likely to have been exposed to
training in multicultural and peace education.
In summary, the main study in the current research indicated the majority of students in
the schools in both countries reported little experience of violence in the schools in both
countries. After complaints about being bullied, students reported that they saw results.
The majority of students from all ethnic groups had little experience of arguments or
fights about ethnicity. The principals of the girls’ schools said that there were no special
issues related to the multi–ethnic nature of the area in which the schools recruited
students. There was little ethnic violence in these schools. If this ever happened the
schools followed government guidelines to address them. The principal of Girls’ School 2
said that her school was multicultural but they did not have any racial problems.
However, one boys’ school principal said it was difficult to maintain good peaceful
behaviours. This was not related to issues of ethnicity, but, he felt, was because the
parents had so many fights at home.
In the English school more females reported having been bullied than males. There is an
interesting difference here between girls’ and boys’ experience of bullying in Sri Lanka
and England. In Sri Lanka more boys reported experience of bullying and arguments
whereas in the English school more girls reported this experience.
The majority of students from all ethnic groups in the schools in both countries, around
85% of Sinhala, Muslim and Tamil in Sri Lanka (Table 24, Appendix D) and almost all
students in the English school, had positive perceptions about whether, if the students
from different backgrounds got an argument or a fight, teachers sorted it out fairly.
Perceptions of whether there was a procedure for conflict mediation when students
experience ethnic or cultural harassment in the school or beyond shows that teachers from
all five schools had positive perceptions in Sri Lanka. Teachers in the English school had
similar perceptions. In Sri Lanka the proportion of those who strongly agreed was
exceptionally high in Boys’ School 2 (69.6%). However, in Girls’ School 2, over 40%
disagreed somewhat with much smaller proportions in the other school (0% in Boys’
School 2) (Table 25, Appendix J).
6.1.9 Teachers’ perceptions regarding whether rules took account of cultural differences
The Sri Lankan ESCP Report (2008) recommended a school discipline guide to
recommend standard conduct for all students in the school. This report proposes standard
conduct in various conflicting situations arising in school. A team of teachers, appointed

126
by the principal, school should develop the document. The team is expected to study the
factors about problem behaviour in the school by interviewing teachers, student prefects,
students and parents and examining past school records.
The majority of teachers agreed that rules and regulations of their school are designed to
take account of cultural differences in Sri Lanka whereas the questionnaire findings in
the English school were mixed with seven teachers viewing the statement positively, and
five negatively. This outcome might reflect either a misunderstanding of the question, or
differences in views about whether rules and regulations should be different for different
groups. Without interviewing the teachers it would be difficult to know.
6.1.10 Teachers’ views that all students should behave well The majority of teachers in Sri Lanka and England had positive views that students of
all ethnic backgrounds should behave well.
In Sri Lanka the majority of teachers in all schools strongly agreed or agreed somewhat
with the statement ‘I expect students of all ethnic backgrounds to behave well’. Around
80% of teachers in the Mixed school, Girls’ School 1, Boys’ School 1, and Boys’ School 2
strongly agreed with the statement with a slightly lower proportion of teachers from Girls’
School 2 (72%) (Table 26, Appendix J). Of those who agreed strongly the highest
proportion of teachers had between zero to five (87.2%) years’ experience. The smaller
proportions are the teachers with eleven to fifteen years’ experience (50%) (Table 27,
Appendix J). All teachers in all five schools from all highest education qualification
categories strongly agreed or agreed with the statement. The highest proportion was those
who had been trained as graduate teachers (89.5%) (Table 28, Appendix J).
The teacher questionnaire indicated that teachers in all five schools felt that students of all
ethnic backgrounds should behave well. However, teachers in Boys school 2 were less
positive about this than teachers in the other four schools. The highest proportion of
teachers who felt positively were those from zero to five years teaching experience and
trained graduate teachers. In other words it was the newest teachers and those with the
highest qualification who had the most positive expectations of student behaviour in all
ethnic groups. These were the teachers who were most likely to have been exposed to
training in multicultural and peace education.

127
6.2 Classroom practices
6.2.1 Co-operation between students The National Education Commission (2003) identified that education has failed to
promote nation building by fostering mutual understanding and tolerance and respect for
the rich cultural diversity of Sri Lankan society and that the education process has made
little contribution to ensuring social cohesion. It is therefore important that students have
the opportunity to work together in co-operative learning situations in classrooms under
the supervision of the teacher.
Data from the student questionnaire indicated most students from all ethnic groups
agreed that after lunch all students are encouraged to mix with other ethnic groups in
their free time in the five schools (Table 25, Appendix D). A chi square calculation
indicates that there was no significant difference between the groups’ perceptions by
ethnicities (p = 0.121) (Table 25a, Appendix D) or by gender groups (p = 0.341) (Table
5a, Appendix E). The majority of students from all ethnic groups also agreed that
students often work with partners or in a peer tutoring relationship in the five schools
(Table 26, Appendix D). A chi square calculation indicated there was no significant
difference between ethnic groups’ perceptions (p = 0.315) (Table 26a, Appendix D). A
higher proportion of female (74.7%) students were very positive than with male students
nearly 60% (Table 6, Appendix E). A chi square calculation indicated there is a
significant difference between perception of the gender groups (p = 0.004) (Table 6a,
Appendix E). This finding reflects Cohelho’s (1998) conclusion that peer tutoring is one
of the strategies of an inclusive school. However, there was a difference between
schools. There was a significant difference between Girls school 1 and 2 and Boys school
1 and 2 (p = 0.003) (Table 7a, Appendix E).
The majority of students from all ethnic groups agreed that students often work in co-
operative learning groups in the five schools and that the teachers helped students to
manage group work and share responsibilities. According to students in the focus group
interviews ‘teachers are the very best thing in the school’. Teachers treated everyone the
same way in the Girls’ School 2 and the Boys’ schools. Teachers in the Mixed School
said every student was equal in the classroom.
The majority of male and female students in all five schools replied ‘Always’ or
‘Usually’ to the statement ‘Students often work in co-operative learning groups’ . These
positive views were reflected in students’ individual comments. One Muslim student
said that she learned how to work as a team member and developed her leadership skills

128
in the Girls’ School 1. Two Sinhala and three Muslim students in Girls’ School 2 replied
that they learn team work from their school. One Muslim student felt that she has good
friends with different backgrounds in Girls’ School 1.
According to the focus group interviews all ethnic groups mixed together for every event
in the Mixed school. Students had strong friendship among ethnic groups, and students
liked teachers’ friendly behaviour. Students also had good relationships with teachers.
There was a view that every student gets treated equally in Girls’ School 1. Friends were
the very best thing in the school. There was strong friendship with students from different
groups in Boys’ School 1. Friends and teachers were the very best thing in the school. All
students work together in the classroom. However, selection of the members of student
groups in the classroom might depend on the subject and attitude of the teacher in Boys’
School 2.
In the focus groups, teachers in all five schools said that students always mixed in the
school. However, some teachers in Boys’ schools 1 said that the big challenge was
that students always got on with their own ethnic groups and there were difficulties
with cooperation with students with different characters, likes, dislikes and habits.
Some students did not respect Sinhala cultural values and teachers needed to think
carefully about teaching aids. The principal of the Mixed School said his school staff
are cooperative. A lot of students were Buddhist and Muslim. Some were Christian,
Tamils and Hindu. The atmosphere was friendly and all study together, peacefully.
Data from the English school shows that students from different backgrounds had a good
relationship. For example: One fifteen year old Asian British female student said that she
liked school because she could communicate with others, one seventeen year old White
British male student said that the majority of them particularly in the sixth form, were a
close community, no matter what their background/beliefs and they feel comfortable to
talk about them to one another, and one thirteen year old White British student said that
she was new to the school and feels settled.
The students also felt their classroom environment was friendly. For example, Year Nine
focus group students worked in groups collaboratively in most lessons. Students were
allowed to work together with friends if they behaved well. However these lessons were
set by attainment level. Students had the freedom to be themselves, to go around with
their friends. They are treated more like adults. They socialised across different year
groups and with students from different backgrounds. In mixing with people from
different backgrounds they could find out more about different people.

129
Year Eleven focus groups said the school really supported its students with whatever
they wanted to do. There was a climate for learning with procedures put in place. One
student said: ‘They have this thing called ‘Climate for Learning’. You have to follow it
or you get sanctioned in a way. [ … ] so I work my hardest, and they actually push you
as well. [The climate for learning] makes everyone work together.’ The school had an
online reward system and awards nights where everyone received an award if they were
good at something. The students liked to come to the school.
Year Twelve focus group students said teaching was the best thing in the school.
Teaching quality is ‘really good’. Students had positive attitudes to the school. Teachers
treated everyone fairly and equally. Students felt different in a good way in the school.
There had been no arguments in the school but had some experience outside of school.
Students at the school had strong friendships with people of different backgrounds. One
commented: ‘We have got a friend of ours, she’s Hindu’.
Teachers explained group selection depended on the task or the year group, for example
random selection, ability, or certain skill sets. At the beginning of the task or beginning
of the year students worked with whom they felt comfortable in making them feel
confident. Group selection which was used in both dancing and music teacher was quite
similar behaviour or outcomes for the tasks that the teacher asked them to do. Asking
everyone as a group to share their work and then depending on the size of the group or
the personality of the whole group collectively, they would both put their hands up and
ask if they can play their music.
Those that don’t I then pick out students that I have. Usually it’s three or six groups and those are the weaker ones, the middle range and the higher abilities, so we listen to all types of music and we assess using the positives about the music, [highlighting] the improvement that can be made but never the negatives.
Students were friendly with each other and they understood each other really well.
Students could work with each other and work with groups where they felt comfortable.
Therefore the best work was produced by them. Challenges came in how teachers dealt
with the students in the class and the behaviour of students. Getting students to work
together was a challenge for the teacher in the classroom and, as one teacher said, an
even greater challenge is that ‘I don’t notice it [non-co-operative behaviour] in the
school’.

130
6.2.2 Perceptions that classroom routines were clearly organized and responsibilities shared out fairly The majority of students from all ethnic backgrounds in the schools in Sri Lanka and the
English school had positive perceptions about whether the classroom routines were
clearly organized and responsibilities were shared out fairly between all students.
The Sri Lankan students’ questionnaire indicated the majority of students from all
ethnic groups felt that classroom routines were organized and responsibilities were
shared out fairly between all students in the five schools. Cohelho (1998) noted that
classroom routines are one of the strategies of an inclusive school, so this finding across
the schools is important.
The students’ questionnaire in England indicated that the majority of students felt that
classroom routines were clearly organized and responsibilities were shared out fairly
between all students. There were no differences between males and females. Year Nine
and Twelve focus group students said there was also a strong ethic of fairness whereby
teachers treated all students equitably. The outlook of the school was quite good and
teachers were positive towards all the students. The schools’ main theme every year was
‘community’. There was a sense of feeling of togetherness.
6.3 Feelings of belonging
The Council of Europe (2001) explains that social cohesion needs to ensure every citizen
has the opportunity to experience dignity and social confidence. It is important in
evaluating the success of multicultural policies that more teachers in both Sri Lanka and
England suggested that every student felt valued in the classroom. However, there was a
significant difference among Sri Lankan schools. Nearly 40% of teachers of Boys’
School 1 and over three quarters of teachers of Girls’ School 2 and Boys’ School 2 felt
students felt valued. Of those who agreed strongly over 60% of teachers had between six
to ten and sixteen to twenty years’ experience.
In England the majority of teachers from all ethnic groups agreed strongly that students
felt valued. Examples of teachers’ perceptions include for example one teacher who said
that all students were valued and respected regardless of ethnicity/religion, and another
who commented that teachers had to be mindful of feelings and emotions whilst trying to
ensure that every student felt as valued as the next. As part of this in teaching teachers
observed that they tackled lots of different topics which can be difficult.

131
6.3.1 The students’ feelings of being welcome Induction and orientation programmes can be a vital ingredient in this. The majority of
teachers from all schools in both countries agreed that these schools had a planned
programme of induction and orientation for all students and parents. Most students from
the Sri Lankan schools including the highest proportion of Tamils reported that they had
felt welcome when they first arrived at school (Table 27, Appendix D). There was no
significant difference between ethnic groups. However, a chi square calculation indicated
there was a significant difference between the gender groups (p < 0.001) (Table 8a,
Appendix E). More males and fewer females than would be expected said ‘Yes’.
de Garine (1979) said that eating habits are one of the factors important to social
cohesion. It is a daily routine (Jastran et al., 2009). However, food habits are one way in
which individuals or groups show their social or cultural backgrounds (Noyongoyo,
2011). Data from the student questionnaires in both countries (Table 28, Appendix D and
Table 18, Appendix G) indicated that all students were encouraged to eat their lunch
together in the five Sri Lankan and English schools. There was no great difference
among schools and genders. This is important because eating habits can provide mutual
understanding between everyone. Sheridan (2000) explains that a national diet is like any
construction of national identity. According to de Garine (1979) through socialisation
individuals learn the eating pattern from their society. However, migrants require
strategies of acculturation that either function to maintain their original culture or
integrate with the new culture. Eating habits will change according to some factors such
as culture, socio-cultural environment, period of time spent in a city, town or country
(Pan, Dixon, Himburg & Huffman, 1999). Eating habits can include what is eaten, the
quantity eaten, the quality of foods, the ways that food is obtained and cooked or
prepared. They are based on social, cultural, psychological, religious, economic,
environment, political and individual factors (Noyongoyo, 2011).
6.4 Support for students
6.4.1 Perceptions of whether the students ever talked to a school counsellor ‘Culturally responsive counsellors also help students to reach beyond their grasp, to
dream, and to actualize their dreams’ (Banks, 2008, p.38). In addition, counselling can
give an important service to students from multicultural backgrounds in the school.
‘Counselling may also be of a personal nature and assist students in their adjustment to
a new culture by organizing peer support programs or putting students and their

132
families in touch with personel and agencies that are able to provide culturally sensitive
services’(Coelho, 1998, p.108). The Report of General Education Reforms (1997)
covered the entire spectrum of general education from primary to junior and senior
secondary levels, with the expected outcome of achieving the national goals and the
five competencies. There were some changes that were proposed, and one of them was
student guidance and counselling. The LLRC Report (2011) in Sri Lanka notes that
there are children who suffer from psychological disorders as they have been exposed
to violent conflict and have lost their parents and special attention should be provided
to these children including counselling where necessary.
The student questionnaire indicated a larger proportion of Sinhala students had talked to a
school counsellor than Muslims and Tamils in the schools in Sri Lanka (Table 29,
Appendix D). However, a chi square calculation indicated there was no significant
difference between ethnic groups in terms of whether students ever talked to school
counsellor (p = 0.300) (Table 29a, Appendix D). Across the five schools, a higher
proportion of female students (67.7%) replied ‘Yes’ to the statement with a slightly
smaller proportion of male students (58.9%) (Table 9, Appendix E), but a chi square
calculation indicated there was no significant difference between the gender groups (p =
0.239) (Table 9a, Appendix E). The majority of students from all ethnic groups felt that
counsellors understood them as a person (Table 30, Appendix D).
Over 60% of teachers from all five schools reported that schools provide counselling
services related to students’ academics needs and social needs. The proportion of
teachers in all five schools who agreed strongly with the statement ‘The school
provides counselling services related to students’ social needs’ was very small, with
none in the Mixed School with the total proportion of those agreeing being less than
60%. The lowest proportion was in the Mixed School (40.9% total). Up to 50%
across all schools disagreed to some degree (Table 29, Appendix J). Only a very
small number of teachers from all five schools strongly agreed that school counsellors
serving in that capacity had the knowledge and skills required for effectively
supporting students’ academic needs, and none at all in the Mixed School (Table 30,
Appendix J). Up to 50% disagreed to some degree regarding perceptions of whether
counsellors have knowledge and skills for effective cross-cultural counselling (Table
31, Appendix J). These counsellors clearly needed appropriate training in the view of
the teachers.

133
Unlike Sri Lanka, in England the data indicated that students from all backgrounds had
talked to a school counsellor. But the number of students who talked to the counsellor
was small (five of them were males and two females). Of those, most students had
feelings that their counsellor understood them.
Teachers in England reported that their school provided counselling services related to
students’ academic needs and social needs (Table 17 and 18, Appendix K). However,
they disagreed about whether counsellors serving in that capacity had the knowledge and
skills required for effective cross-cultural counselling (Table 19, Appendix K). There
may be a need to consider whether, and what kind of, training might be appropriate here.
Only a small proportion of teachers in schools in Sri Lanka (but none in the Mixed
school) and the English school agreed that teachers themselves had the knowledge and
skills required for effective cross-cultural counselling.
Nearly two thirds of teachers in the schools in Sri Lanka and all teachers in the English
school agreed that the school took action when a specific group of students appears to be
having social or academic difficulty. In Sri Lanka, the principal of both Girls’ schools
reported that students are given additional help for their learning where required,
irrespective of ethnicity.
In England, Year Eleven focus group students said that the school helped students
who struggle with academic requirements. The head teacher of the school also
explained that the Church of England donated £75,000 to the academy a year for ten
years as an endowment. The interest can be used for the purpose of helping under-
privileged children. However, the head teacher liked to spend that on buildings as
well as under-privileged students.
In terms of peer mediations programmes, the majority of teachers in the schools in Sri
Lanka and the English school were unsure as to whether they had such programmes in
their schools.
6.4.2 Teachers’ perceptions of whether the schools had established mutually supportive relationships with community groups and agencies
Sixty-eight per cent of teachers in Girls’ School 2 in Sri Lanka strongly agreed their
schools have established mutually supportive relationships with community groups and
agencies. In other schools most teachers responded that they ‘agree somewhat’. The
biggest percentage of ‘disagree responses’ was in Boys’ School 2 (34.8%) (Table 32,
Appendix J). However, this is at variance with teacher focus group interviews in Boys’

134
School 2 where there was a perception ‘We have a good relationship with parents at our
school’.
The principals of all five schools said parents of their students always helped with
school activities except the principal of Boys’ School 1, who mentioned that parents
of students of his school found it difficult to help because of their poor economic
background. The principal of Girls’ School 2 explained that they allowed parents into
the school to see their children’s work. In Boys school 1 the principal said. ‘We
don’t have an old boy association. We started thinking about it last year. I am
expecting to do some work with it in the near future.’
The principals of all five schools explained that the involvement of minority ethnic
community groups or their leaders in the school was very important in different
ways. This includes: delivering speeches for special occasions, to building new
buildings, giving gifts and money for the prize giving, and to developing school
facilities.
6.5 Equity and fairness
One of the principles of multicultural education is that school systems are expected to
provide equity of opportunity for all students. Parsons (1970) also argues that issues of
fairness are important in responses to differences between individuals. ‘It is fair to give
differential rewards for levels of achievement, so long as there has been fair access to
opportunity……’ (cited by May 1994 p.14). Teacher attitudes are very important to
students’ learning and engagement. If teachers know and understand their students, and
the students are aware of this, then students are more likely to have the confidence to
study and engage.
The majority of students and teachers in the schools in Sri Lanka agreed with the
importance of making a special effort to raise the achievement of students from
minority ethnic backgrounds. The biggest proportion of teachers who ‘strongly agreed’
(nearly 40%) was in Girls’ School 1. The strongest disagreement came from Boys’
School 1 where nearly 30% of teachers disagreed somewhat (Table 33, Appendix J)
that they should make a special effort to raise the achievement of students from
minority ethnic backgrounds.
In terms of years of teaching experience the biggest proportion of those who strongly
agreed was the most recent teachers (25.6%). Teachers with a lot of teaching

135
experience (sixteen to twenty years) were the most likely to disagree (Table 34,
Appendix J). Teachers with degrees or postgraduate teaching qualifications were most
likely to strongly agree (Table 35, Appendix J).
In England all teachers in all teaching experience categories strongly agreed or agreed
somewhat agreed that they should make a special effort to raise the achievement of
students from minority ethnic backgrounds (Table 20, Appendix K).
6.5.1 Perceptions that the students could study any subject Across the five Sri Lankan schools, a big proportion of Sinhala (87.4%) students replied
‘Yes’ to the question ‘Is any student in your school allowed to study any subject?’
However, around 65% of Muslim students replied ‘No’ and a half of Tamil students
(Table 31, Appendix D). A chi square calculation indicated a significant difference
between Sinhala, Muslim and Tamil (p < 0.001) (Table 31a, Appendix D). This
significance difference was between the perceptions of Sinhala students on the one hand,
and Tamil and Muslim on the other (see Tables 31b-d, Appendix D). Across the five
schools, a high proportion of males and females (around 60%) replied ‘Yes’ to the
question (Table 10, Appendix E).
Sometimes differences in perception will happen with different religions that students
wish to study. Focus group interviews indicated that Muslim students did not have the
chance to learn their religion in the Boys’ schools and that the Buddhist religion was all
around the schools. As a students in Boys school 1 commented: ‘I am Muslim but I don’t
have a chance to study Islam in my classroom.’When more Muslim and Tamil students felt
they were not allowed to study any subject there may be some concern. However, this
finding may be explained by the fact that it is common practice for teachers of minority
religions to be hired by schools. Sometimes schools do not have the resources to continue
the contract (verbal discussion with a vice principal).
The head teacher of the school in England said that there was an agreed syllabus in the
school and that the agreed syllabus had space for gender, ethnicity, race and so on. He
did not think teachers should overtly teach multiculturalism. The more important thing
‘is to teach values, for example tolerance’.
The students’ questionnaire in the English school indicated the majority of students from
all ethnic groups reported that they were allowed to study any subject. Clearly there is a
difference here between student perceptions in Sri Lanka and England.

136
6.6 Attainment and progression
In an effective multicultural school, teachers and managers have high academic
expectations for all students and believe that all students can learn (Ladson-
Billings, 1994). The achievement approach conceptualizes multicultural education
as a set of goals. Under this approach theories and strategies are designed to
increase the academic achievement of students from various racial, cultural and
gender groups (Banks, 1989).
Banks (2008) links the degree of effectiveness of multicultural approaches in schools
with the extent to which the school provides for individual differences between children
in terms of their learning needs. Coelho (1998) explains that effective schools monitor
the progress of all students, and provide academic and social support to those who may
need such support.
Around 75% of teachers in schools in Sri Lanka and the majority of teachers in the
English school agreed their school has a system for monitoring the progress of all
groups of students by ethnicity.
Over three quarters of teachers in the Mixed school, Girls’ School 1, Girls’ School 2 and
Boys’ School 1 in Sri Lanka agreed somewhat with the statement ‘The school monitors
the progress of all groups of students by ethnicity’ with a slightly lower proportion of
teachers in Boys’ School 2 (65.2%). Just over 20% teachers of Girls’ School 1 and just
over 15% teachers in Boys’ School 1 strongly agreed with the statement. Around 20% of
teachers in Boys’ School 2 disagreed somewhat with the statement (Table 36, Appendix
J).
All the principals commented that they had a system for monitoring the performance
of students but that this did not record students’ performance by ethnicity but if
someone needed the information they could provide it. The principals of the Mixed
School and Girls’ School 2 said that all ethnic groups contain both clever students and
those whose performance was poor. In their opinion ethnicity did not relate to
performance. In Boys’ School 1 there was a confidential record of achievement by
ethnicity. This record was maintained to identify issues related to the particular
ethnic groups that can be addressed.
In England out of nine White British teachers only three teachers strongly agreed with
the statement ‘The school monitors the progress of all groups of students by ethnicity’.
Four teachers from White British, White Irish, Asian British (Pakistani) and Asian

137
British (Bangladeshi) agreed somewhat. Three White British and one Mixed (White and
Black Caribbean) disagreed somewhat or strongly disagreed (Table 21, Appendix K).
In England more teachers from all groups said it was important to make a special effort
to raise the achievement of students from minority ethnic backgrounds. Teachers had
common expectations to make sure that everybody achieved to the maximum level of
education. The literature also shows that the Office of Standards in Education
(OFSTED), the Government’s Office for inspecting schools, published a report in 1996
called ‘Recent Research on Achievements of Ethnic Minority Pupils’. That research
identified that social class and gender both clearly affected school performances, but
among African-Caribbean students both sexes achieve below the level of other groups
while Asian pupils achieve better than Whites of the same class and gender. The head
teacher commented that that the school is required by law to monitor students’
performance by ethnicity in an attempt to ensure that greater focus is put on helping
lower achieving students to raise their attainment. They also had a system for those on
free school meals and those with disabilities. The average 5A*-C GCSEs for the whole
school was 48%. The figure was down to 34% for those on free school meals. 5A*-C
attainment was much lower than for those who do not have free school meals and it was
worse for boys. This is become most of the teachers believed it was important to make a
special effort for students with learning difficulties.
A large proportion of teachers in school in Sri Lanka and the English school agreed with
the importance of making a special effort for students with learning difficulties. The
largest proportion of teachers in all five schools (96.3%) in Sri Lanka strongly agreed or
agreed somewhat with the statement ‘Teachers should make a special effort for students
with learning difficulties’. Most teachers in all five schools from all highest education
qualification categories strongly agreed or agreed somewhat with the statement. A
higher proportion of teachers from nil-five and six to ten years’ teaching experience
categories and teachers with a postgraduate diploma in education - nearly 90% of
teachers were in the postgraduate diploma category (Table 37, Appendix J) - had more
positive perceptions about this than other categories.
A large number of teachers from all ethnic groups in the English school agreed strongly
with the same statement. The exception was one Asian British (Pakistani) teacher who
agreed somewhat with the statement (Table 22, Appendix K).

138
6.7 Curriculum
Issues of acceptance respect and personal values in school are factors that contribute to
positive engagement in learning (Banks, 2008). Banks (2004) noted that a very important
multicultural education goal is to help individuals from diverse racial, cultural, language
and religious groups to acquire the knowledge, attitudes, and skills needed to function
effectively within their cultural communities, their regional culture and global
community.
6.7.1 Goals of a multicultural curriculum Banks (1981) explains that the curriculum should respect the ethnicity of the child and
use it in positive ways. The goal of the curriculum should be to help students learn how
to function effectively within the common culture, their ethnic culture and other ethnic
cultures. Further Banks (1994) identified three multicultural approaches. Curriculum
reform is one of them. He explained that the major goal of curriculum reform is
inclusion of content about different cultural groups in a curriculum in order to develop a
new practice. For example he suggested including important dates and celebration to
honour heroes in a culture as a new practice in the USA.
May (1994) explained that while society can be seen as a system of roles, schools are seen
as agencies which require that students become successful performers of future roles.
Therefore the curriculum can be seen as selections of culturally universal features
including common value orientation and specialised aspects of culture concerned with
training students for specific roles.
Over a long period of time there has been an expectation in England that the curriculum
should reflect a sympathetic understanding of the various cultures and races that make up
UK society. For example, The Labour Government’s Green Paper on education (1977)
explained that UK society is multicultural and multi-racial. Leicester (1989) concluded
that British educationalists believed in the multicultural period in England that teachers
must recognize and address racial bias in learning materials. The National Curriculum in
the 1988 encompassed material from a range of cultures in the subjects of English,
history, geography, art, music and physical education. Specific grants (for example
Section 11 funding which ended early in 2000) were provided to local education
authorities for innovative work in schools related to meeting the educational needs of
minority ethnic children, promoting racial harmony and in other ways preparing pupils for

139
life in a multicultural society. Findings from the English schools indicated that they
incorporated such materials across the curriculum.
The literature review noted that the aim of multicultural education is to understand and
celebrate difference through education. This difference can be reflected in the curriculum
through acknowledging all cultures in the classroom and through education about different
cultures (Bartlett and Burton, 2001) as is apparent in the data collected for the English
school study. For example, the history teacher commented, ‘In the National Curriculum,
multiculturalism is integrated completely through the history curriculum to GCSE level’.
In the English Baccalaureate the students had to study multiculturalism as was also
evident in the history course. If multiculturalism was not taught in the history subject
‘students can get it through geography’. Students ‘look at a lot of different cultures within
geography’, but ‘from a slightly different perspective’.
In order to achieve social cohesion, there is a view that every citizen should have the
opportunity to access progress (Council of Europe (2001). The section of the Curriculum
Policy and Process Plan (1999) document in Sri Lanka indicates the main principles for
the curriculum and states that the broad curriculum framework should serve the needs of
a multicultural, pluralistic, but nationally integrated society, in addition to learning from
home and community environments. The Curriculum Policy and Process Plan further
specifies that the national curriculum should be designed to recognise that children are
unique, and that they come from different communities and backgrounds. Reference is
made to a Quality Control Mechanism, with units to be set up at the National Institute of
Education (NIE) and the Education Publication Department to ensure that there is no bias
in the curriculum against ethnicity, religion, gender and social and economically
disadvantaged groups and the curriculum is to be pretested among groups where different
languages and ethnicities are represented. This was implemented in the Presidential
Commission on Youth Unrest Report (1990) that highlighted some of the systemic
features that had not been addressed in the educational system.
This became the basis for both the 1992 and 1994 National Education Commission
Reports and the 1997 reforms. The overall education policy of Sri Lanka is consistent
with nine national goals. Among these goals three are relevant to social cohesion and
peace. The goals reflect the expectations of the nation.
• The achievement of national cohesion, national integration and national unity.
• The establishment of a pervasive system for social justice.

140
• The active partnership in nation-building activities to ensure the continuous nurturing of a deep and aboding concern for one another.
(NEC Report 1992 cited by ESCP report (2008) p.3).
The views of all the policy makers that were interviewed reflected these goals. All policy
makers said that minority groups have a right to see their cultures positively reflected.
One said, for example: ‘Yes in my view all minorities have a right to see their cultures
acknowledged’. To change people’s stereotypical attitudes towards people of other
backgrounds they use the school curriculum, and textbooks to include information about
minority ethnic groups. They also use the curriculum to increase the activities students
who come from different backgrounds can participate in to build a strong foundation.
One policy maker said that, in Sri Lankan history, there is evidence that Sri Lankan
people may have positive attitudes about different ethnic groups. For example
Dutugamunu a Sinhala and Elara a Tamil fought a war but came to respect each other as
people. Therefore, this policy maker emphasised the value of positive attitudes and he
hoped it would be effective in building good ethnic understanding among different ethnic
groups in the country.
6.7.2 Perceptions about class textbooks
All four policy makers expected school textbooks to reflect a multicultural society and
every culture in Sri Lankan society and to value cultural diversity. For example, Policy
Maker Three explained that the Grade Eight ‘Life Competencies and Civic Education’
textbook includes the cultural diversity of Sri Lanka under ethnic type, languages and
religions and that it includes diverse habits such as Buddhist habits and traditions,
Hindu habits and traditions, Islam habits and traditions, Christian habits and traditions,
habits pertaining to localized areas and habits related to diverse communities. Policy
Maker One explained that Tamil culture is highlighted in the ‘Second Language’ Tamil
textbooks and those textbooks did not criticize any religious beliefs such as concepts of
gods in some religions. Some books include some translated stories from Tamil
literature in the teachers’ guide. For example ‘Thennali Raman he is like Andare who is
close to Sinhala children in Sinhala literature’. He also said that students from every
ethnic group can happily read textbooks. Policy Maker Two also said citizenship
education and religious education value the diversity of the country.
All four policy makers said that the textbooks showed different religions, languages and
lifestyles as valuable. Policy Maker One said that the students could see different
historical places which are relevant to different ethnic groups during field trips and these

141
pay special attention to sharing cultural festivals and any other things people who are
living in the South and North value.
In the context of the five schools, the Sri Lankan students’ questionnaire indicated very
high proportions of students from all ethnic groups had positive perceptions about class
textbooks talking about people from different backgrounds in a positive way (Table 32,
Appendix D). This was also reflected in the school principal interviews. For example,
the principal of Girls’ School 1 in Sri Lanka said,‘In our textbooks we don’t criticise
others’ culture’.
Students’ perceptions about the content of textbooks reflect Banks’s (1988) and others’
views about what is required in the curriculum for peace education. Banks (1988) also
added to his theory that the multi-ethnic curriculum should promote values, attitudes, and
behaviours that support ethnic pluralism. Kodituwakku and Keppetigoda (2010) identify
vertical integration of the concept of peace embedded in the curricular material
(Textbooks and Teacher instruction Manuals-TIMs) of the subject of Life Competencies
(grade ten and eleven) and understand the way of teaching peace concepts during
classroom episode. They found that the peace concepts ‘Human Rights and Obligations’,
Conflict Resolution’, Community Creation and Democracy’, are addressed in textbooks
of all grades. In the TIM the main themes of peace are not directly addressed. However,
these are integrated with other peace concepts. Teachers most frequently emphasized the
concept ‘cooperation’. The Report of General Education Reforms (1997) covered the
entire spectrum of general education from primary to junior and senior secondary levels,
with the expected outcome of achieving the national goals and the five competencies.
There were some changes that were proposed to it. One of the changes is the design,
production, and provision of textbooks. Under the free textbook policy, the Education
Publication Department (EPD) has produced textbooks for Tamil and Sinhala as a Second
Language (Grades six to eleven). The EPD has its own programme for promoting social
cohesion and multi-ethnic understanding under two aspects: producing texts in the two
national languages and ensuring that textbooks reflect Sri Lanka’s pluralistic society.
The students’ questionnaire in the English school indicated that the majority of students
from all ethnic groups felt that class textbooks talked about people from different
backgrounds and that this was in a positive way, and the range of topics covered in
lessons helped students understand people from different backgrounds. Students agreed
that their school had a lot of books about people from different cultures. Almost all
students from all ethnic groups agreed that the school library had lots of books about

142
people from different cultures. The teachers’ questionnaires in the main study indicated a
difference of views among teachers, however. Seven teachers had a negative perception
and six teachers had a positive perception about whether the school libraries had a good
collection of multicultural materials by ethnicity.
6.7.3 Perceptions that classroom lessons help students understand people from different backgrounds The majority of students in the schools in Sri Lanka (Table 33, Appendix D) had positive
perceptions about the range of topics covered in lessons which help students to
understand people from different backgrounds. However, more Sinhalese and Muslims
had positive perceptions than Tamils in Boys’ School 1.
Coelho (1998) identified that an inclusive classroom needs to involve all the students in
creating classroom displays. It is very important for schools to understand the importance
of visual displays of culture. The Sri Lanka questionnaire results suggest that some
schools were more successful than others in doing this (Table 34, Appendix D). The
student questionnaire indicated that classroom displays included the work of students
from different backgrounds in Sri Lanka. However, over 30% of students from all ethnic
groups had negative perceptions about this. There were more Muslim and Tamil students
in the Mixed school, Girls’ School 1 and 2 who had negative perceptions than Sinhalese
and over 50% of students from all ethnic groups had negative perceptions in the Boys’
schools. However, a chi square calculation indicated there was no significant difference
between the views of ethnic groups (p = 0.465) (Table 34a, Appendix D).
6.7.4 Curriculum policy Despite the expressed inclusive intentions of the Sri Lankan curriculum, the policy
makers interviewed thought that in a short term curriculum they would not achieve
anything. The curriculum needed a long term plan. In the long term curriculum they
could educate the students to think and understand how others behave and how to
accommodate others. One policy maker believed that ‘people’s stereotypical attitudes
will automatically change’. This has already has been attempted through the curriculum
but he said it had to be emphasised more. Part of the problem is that, while the
curriculum includes all ethnic and religious groups who live in Sri Lankan society,
Sinhala Buddhist culture is highlighted more than other cultures in the curriculum of Sri
Lankan schools, a comment supported by the questionnaire findings from Tamils in
Boys’ School 1. As policy makers they were concerned about students’ cultural
backgrounds when preparing teachers’ guides. This comment related to not only

143
language education but also other subjects such as history, religion and civic curricula
which reflect the different backgrounds of people in Sri Lanka.
These policy makers felt that the curriculum should reflect the different backgrounds of
minority ethnic students in Sri Lanka and consciously give special attention to minority
ethnic backgrounds in Sri Lanka at primary and junior secondary levels. The citizenship
education curriculum in years six to nine was seen as important and information and
activities were added to develop students’ knowledge, skills and feelings about different
ethnic and religious backgrounds in Sri Lanka. They provided some evidence to how the
curriculum already includes ‘multicultural concepts’ in the subject goals of Life
Competencies and Civic Education in Grade seven. The literature review also provides
evidence of Life Competences and Citizenship Education (grade six to nine) and
Citizenship Education and Governance (grade ten and eleven) curriculum contains many
peace related concepts (ESCP, 2008).
The Ministry of Education implemented its plan for social cohesion and peace based on
the National Education policies for general education in Sri Lanka. The subject of
education for social cohesion and peace was not examination oriented but it included the
goal of national building through the promotion of broad national cohesion and
harmony. One policy maker who was attached to the Ministry of Education had
introduced a different type of programme through the informal curriculum, for example
education exchange between schools and school parliaments.
The national educational goals clearly emphasised students needing to understand
people around the world and the value of cooperation and international collaboration.
However, as Colenso (2005) commented, the theoretical base for understanding
education and social cohesion is limited in Sri Lanka. Therefore there is a gap between
the practical tools for education policy makers, assessment of the impact of policies and
investments and plans for future reform. The Curriculum Policy and Process Plan (1999)
in Sri Lanka considered several aspects related to the present situation of the country.
The plan explained that ‘unity in diversity’ will be one of the main characteristics of an
inter- dependent world and human cooperation moving from the national level to the
world level are important. Therefore the plan suggested equality, co-operation between
students and with staff across schools and within classrooms is very important in
achieving cohesion in schools. The school curriculum developments show the way to all
education practitioners in Sri Lanka. These policies are consistent with the national
goals as recommended by the NEC while promoting personal growth and preparing for

144
a multicultural society without bias in relation to ethnicity, religion, gender or economic
deprivation to serve the needs of a multicultural pluralistic but nationally integrated
society (The Curriculum Policy and Process Plan, 1999).
Another difficulty, as one policy maker observed, is that, although Sri Lanka had a
language policy, because of the segregated school system there were no direct
multicultural policies to respond to the increasing level of cultural diversity in a school
and no policies for integrating minority or immigrant students. Furthermore, students
studying in the Sinhala medium came from different backgrounds, and there was a
national policy for them. Therefore, as one policy maker commented, ‘the national
education policy responds to this situation’. Sri Lanka also had multicultural schools in
the mixed areas. The policy maker said mixed ethnic schools were peaceful and non–
violent and tended to produce self–disciplined law abiding students. Government
policy documents include duties of the provincial and Zonal authorities to support
peace education in schools. National educational goals give equal rights to every
student. Majority and minority students also have the same rights in schools. Some
schools used Sinhala, Tamil and English media in the same school. Further the
government schools did not have as many immigrant students as in England, and of the
few they had they were studying in an international or a private school.
All policy makers commented that the Ministry of Education, the National Education
Commission and the National Institute of Education were the key forces behind the
initiatives and the Ministry of Religion and Cultural Affairs also supported these
initiatives.
Sri Lanka had policies regarding minority students and this policy and practice was the
same in the provincial council also. Policies which were related to the multicultural
backgrounds of students were the same all over the country. However, according to the
13th amendment the provincial council can amend policies. The Quality Control
Mechanism within the NIE and the Education Publication Department were there to
ensure that there was no bias in the curriculum against ethnicity, religion, gender and
those from social and economically disadvantaged groups.
The policy makers indicated that their role was to make education policies match
multicultural, multi-religious and mixed groups in Sri Lanka. Through the education
policy, as one policy maker noted, policy makers try to ‘build a person with a complete
personality’ and that to become a ‘person he [sic] needs to develop every quality’ with an
understanding as the national background and needs in order to develop a nation that is

145
respected at the international level. Further, policy makers needed to make policies which
help to bring benefits for the country.
6.7.5 School activities As Banks (1988), explains, activities such as cheerleading, booster clubs, societies and
athletics teams provide opportunities to students from different ethnic backgrounds to
learn and play together. Therefore, as Banks suggested, these activities should be open to
all students. Provision of opportunities for students to participate in the aesthetic
experience of various ethnic groups is indicated among his guidelines for multicultural
education (Banks, 1976).
School activities have the potential to enable all students to interact together in activities
that have common purpose and to be integrated, into that wider curriculum in school in
ways that reflect many of the principles of social cohesion. The OECD (2011) highlighted
that cohesion derived from the classroom, the hallway, school yard and playground or bus
helps to build networks of relationships among members, trust and identity between
different groups, thus fighting discrimination, exclusion and excessive inequalities and
enabling upward social mobility.
The teachers of all five schools in Sri Lanka had positive perceptions that their schools
had a variety of extra-curricular activities that were designed specifically for minority
ethnic groups. ‘This school has different types of extra-curricular activities for all
students. For example, the Tamil language society, Sinhala language days and English
language days’ were some of the comments made in the focus group interviews in
Girls school 1. The students’ focus groups also identified that all students had the
opportunity to participate in different types of activities in all the five schools. These
included activities such as, in the Mixed school, different events of the annual Sport
meet (athletics, volleyball, house caption), Scouts for boys and Guides for girls,
school prefect duties including head prefect or class monitor, Vice Presidency of the
Sinhala A ssociation and presidency of the school computer unit.
Examples given in Girls’ School 1 were different events of the school annual sport
meet, Girl Guides. Students might be members of the school environment force and of
the school netball team, members of the school music band (western and eastern),
school prefects, classroom monitors, and participants in dancing, members of Sinhala
and English language associations and participants in inter-school and all-island singing
competitions.

146
However, Muslim girls from Girls’ School 2 did not participate in sports events.
Reports of Muslim participation in fewer activities was supported by the questionnaire
data which indicated that across the five schools 62.9% of Sinhala students were
involved in school activities and sport teams in all five schools with a slightly smaller
proportion of Tamils (55%) (Table 35, Appendix D). A chi square calculation indicates
that there was a significant difference between the groups in terms of engagement in
school activities/or sports teams (p < 0.001) (Table 35a, Appendix D) with Muslim
students (39.7%) participating in fewer activities.
In summary, more Sinhala students were engaged school activities and sports team in all
the five schools except Girls’ School 2 where more Tamil students engaged. Fewer
Muslims participated. However, more male students participated in school activities and
sports teams than females but there were no significant differences among age groups.
The majority of teachers in the schools in Sri Lanka agreed that their school designed
extra-curricular activities specifically for minority ethnic groups. However, the
majority of teachers and students in the English school disagreed that their school
designed extra-curricular activities specifically for minority ethnic groups. In the Year
Nine and Eleven focus group interview students in the English school said that
everyone had the chance to take part in different teams. As one commented: ‘Everyone
gets an equal chance to play, even if you’re not the best at running or something’.
Findings in the Sri Lankan schools generally seem to reflect a perception that co-
curricular activities are important to promote cohesion. The questionnaire indicated that
the majority of students engaged in school activities and sports teams in all schools.
However, there was a significant difference between groups (Table 35a, Appendix D).
The results suggest that the issue was with the Muslims who engaged less than other
students. This may be the result of religious expectations and Muslim girls’ wish to
wear traditional clothes. This is surmise because no specific question about this was
asked on the questionnaire. Some teachers however, certainly commented that Muslim
girls tended to be shy, and were unwilling to engage in sporting activities. One said,
‘Normally Muslim girls are a little bit more shy than Sinhalese and Tamils. They don’t
like to show their skills in front of an audience’. Another remarked, ‘Muslim girls do
not attend sports and extra activities after they become teenagers’.

147
6.8 Challenges in maintaining effective multicultural education
The study illuminated some challenges which serve to undermine students learning in
an effective multicultural environment in the Sri Lankan schools studied. In an
effective multicultural school, teachers and managers have high academic
expectations for all students and believe that all students can learn (Ladson-
Billings, 1994). In the Sri Lankan schools the teachers’ questionnaire and focus
group interviews indicated a number of challenges in relation to students achieving
a high standard. One of the main challenges was cultural issues in the multicultural
school. For example teachers in the boys’ schools and the Mixed School felt that it
was a challenge to maintain lesson continuity because Muslim boys go to the
mosque every Friday. Teachers in the Mixed School and Boys’ School 1 felt that
their main challenge was some religious difference in the classrooms and the
participation rate in religious celebration was low. This affected co-operation
among different religious groups and Friday Muslim student absenteeism
contributed to low academic expectations.
In the Mixed School and the girls’ schools some Muslim girls did not participate
in field trips, practical work and sports. This situation affected all students in the
classroom. Some cultural practices also conflicted with the teaching- learning
process in a multicultural classroom. For example the multicultural situation
directly affected their subject when doing practical work with Muslim students.
One teacher in Girls’ School 1 felt that some Muslim students did not like to
wear traditional costumes for dancing because their parents did not approve of
dancing. Early marriages of clever Muslim girls also halted their education and
their contribution to society. There were some mismatches with health science
and some religious beliefs were also a challenge for Health science teachers in
Girls’ School 1. In Girls’ School 2 there were problems with a lack of teachers
and a lack of facilities including classrooms and prayer facilities. These findings
directly affected the teaching and learning experiences of the students.
Citizenship Education teachers in the Mixed School suggested that the curriculum
already included information about multicultural society but they suggested there needed
to be more.

148
However, some teachers felt there were no special challenges in the multicultural
classrooms in the five schools, and, they commented that it was easy to transfer the
knowledge and positive attitudes to the students in a multicultural classroom.
6.9 Chapter summary
This chapter has reviewed findings in relation to school ethos, classroom practices,
students’ feelings of belonging, equity and fairness, the curriculum, and some of the
challenges in maintaining effective multicultural practices in the study schools in both Sri
Lanka and England. Overall the picture is positive, although in some respects some
minority ethnic student groups felt there was room for a more determined approach to
include all students of all backgrounds. Practical ways to approach this are discussed
below in Chapter 7.

149
Chapter 7: Recommendations and conclusions
7.0 Introduction
This chapter presents a summary of the findings of this study as detailed in previous
chapters. Recommendations are discussed for changes and developments to enhance
teaching and learning in multicultural contexts. In particular Gay’s (2010) work on
culturally responsive pedagogy and practice is proposed as one potentially effective
approach to address some of the key issues raised in the current study. Finally, the
contributions to knowledge together with strengths and limitations of the research are
identified.
7.1 Sri Lanka
A summary of the findings in Sri Lanka indicate how it is clear from the teacher
questionnaires that nearly half of the teachers across the five schools were not qualified to
degree level. This is a very important issue for a number of reasons. Firstly being a
professional implies having a body of expert knowledge in both theory and practice that
is specialist to the particular field (Freidson, 1994). In 2009 the Minister of Education
(Balasuriya, 2012) acknowledged this point and stated that teachers with no degree
should no longer be recruited into the profession. However, this intention has yet to be
put fully into effect. Secondly, without such professional knowledge it is difficult to see
how teachers can respond appropriately to the learning needs of students generally
(Whitty, (2006); Menter, 2009) let alone the more complex needs of students in
multicultural contexts. Ensuring that appropriate higher education and training is
available for teachers in multicultural contexts as well as for teachers generally should be
a government priority. Teacher qualifications were quite low that is a proportion did not
have a degree. However, there was evidence that younger members of staff and more
recent recruitments were more highly qualified.
The majority of teachers felt that schools should offer multicultural education. Newly
recruited teachers and those with a degree agreed it is possible to plan lessons and choose
resources for the various student groups. However, most teachers reported that they did
not have the opportunity to participate in multicultural education training which would
enable them to respond more appropriately and effectively to the different student groups.
Most felt that they wanted some training about multicultural education to enable them to
understand their students’ backgrounds and cultures. The literature on multicultural

150
education suggests all teachers should be aware of all students’ ethnic backgrounds and
cultures. Developing this awareness seems to be what Sri Lankan teachers were
requesting. Provision for such professional development appears therefore to be an
obvious necessity.
Language issues are highly problematic. Whatever the literature and public policy might
say about the strengths of a policy that recommends multi-lingualism to enable all
students to participate fully in Sri Lankan society, this was far from being achieved in the
schools that were researched. Tamil and Muslim students tended to be more competent in
using more languages. However, Sinhala students seemed to develop multi-lingual skills
the longer they had been at these schools. It is clear here that there is a need for more
highly trained teachers specially in relation to supporting their students to become
competent multi-linguals.
In these schools Buddhism was the dominant religion. Although non-Buddhist students
reported that they were able to celebrate some aspects of their beliefs and cultures,
minority ethnic cultures were not in evidence in school displays. Further, some students
reported that they did not have opportunity to study all subjects in the school curriculum.
The particular issue here is that of religion. Minority students felt unable to study their
own religion. One implication of this is that, even though these five schools were
Buddhist and the mode of education was Sinhala medium, there should be much greater
opportunity for minority ethnic students to study their own religion in these schools.
Further, the multicultural literature also suggests that the range of ethnic backgrounds
should be visible around the school so that all students feel included.
The majority of students engaged in school activities and sports teams in all schools.
However, the participation rate of Muslims was low even though schools had a variety of
extra-curricular activities that were designed specifically for minority ethnic students.
One suggestion here might be that schools should consider very carefully how Muslims
might be encouraged to take part in more extra-curricular activities. Perhaps the Muslim
community might be consulted about this issue.
There are clear indications that students often associate positively with peers from
different ethnic backgrounds. For example, students were encouraged to eat their lunch
together. They often worked with partners or in peer tutoring relationships and with co-
operative learning groups in the classroom. Teachers supported this peer group
collaboration by helping students to manage group work and share responsibilities. There
were a very few racist incidents reported in all five schools and rules and regulations were

151
designed to take account of cultural differences. Students were allowed to wear traditional
clothes that were important in different cultures, for example. This finding reflects central
government policy (see chapter 3).
Different races and cultures were accommodated to different degrees in these five
schools. For example, classroom displays included the work of students from different
backgrounds and classroom routines were clearly organized and responsibilities were
shared out fairly between all students. The majority of Sinhala and Tamil students felt
school assemblies were often about different cultures and races. However, only a small
proportion of Muslims agreed with this particular view. This may mean that there should
be a consideration of the balance between cultures and ethnicities when schools
assemblies are organized. Both teachers and students agreed that class textbooks and the
curriculum helped students understand people from different backgrounds. Most students
from all ethnic groups reported that they were able to study some of their own history.
Students reported that school libraries had lots of books about people from different
cultures in general. However, some teachers reported a lack of library facilities. It may be
relevant here to suggest that the government might require schools to carry out an audit of
their library facilities and the range of books available to schools in relation to different
cultures and ethnicities.
Generally, the majority of teachers were of the opinion that teachers in general liked to
teach students with the same backgrounds. However, teachers with higher level
qualifications and training were more likely to say that their peers had no preference for
teaching students from the same backgrounds as themselves. Most students were satisfied
that their teachers knew some expressions in the languages of different students. This is
an important finding given that the teachers themselves felt that they should respect the
cultural, racial and ethnic differences of their students and be aware of the ethnic and
cultural backgrounds of all students in their classroom.
Students reported that they knew school anti-racist policies. However, the principals
commented that their schools did not have such policies. It may be that the students had
misunderstood the question and assumed that anti-racist policies were the overall school
policies. This issue may link to the principals’ views of whether or not schools should
monitor the achievement of their students by ethnicity. Teachers felt that their school had
a system for monitoring the progress of all groups of students by ethnicity. However, all
principals said that they did not have this type of system. In a personal conversation
between a member of the Ministry of Examinations and the researcher it was made clear

152
that the policy of central government was not to report examination results by ethnicity.
There seems to be a view among the principals and from central government that such
overt recognition of ethnic difference and acknowledgement of the possibility of racism
might be counterproductive and divisive. There were reports of a mutually supportive
relationship between these five schools and community groups and agencies that should
be fostered.
All students appeared to feel valued. For example they reported that they were valued in
the classroom and experienced a warm welcome when they first arrived at the school.
Both teachers and students commented that their schools had a planned programme
induction and orientation for all students. When students talked with counselors they felt
that these counsellors understood them as people. However, there may be an issue here
that requires some serious consideration. Although students seemed happy with the
response they experienced from counsellors, teachers felt that the counselling services did
not match students’ academic and social needs because counsellors did not have the
requisite training. Neither counsellors nor teachers had the knowledge and skills required
to provide cross-cultural counselling. If counselors and teachers are to provide such
support for their students, clearly there is a need here for high level diversity-awareness
and counselling training.
7.2 England
Unlike Sri Lanka, all teachers in the English schools were qualified to degree level and all
had teacher training qualifications. Even so, they reported that they did not have sufficient
expert knowledge of the cultural backgrounds of their students and what this implied for
appropriate pedagogy. They all expressed a need for further continual professional
development in the area of multicultural education.
Some teachers felt there should be more discrete support for students for whom English is
an additional language that is tailored specifically for their own school’s student
population. Both head teachers reported that this problem is particularly acute when non-
English students arrived unexpectedly with no prior support arrangements in place. The
importance of EAL support has been recognized by central government for many years
through national policy requirements, for example all the legislation associated with
multi-culturalism through Section 11 funding, the Ethnic Minority Achievement Grant
that operated under the previous Labour government and that required schools to monitor
minority ethnic language skills, and so on. One implication here seems to be that this kind

153
of initiative needs to originate from central government, be disseminated through local
government and reinforced through legislation.
The majority of teachers reported that their schools did not have a variety of extra-
curricular activities that were designed specifically for minority ethnic students. Extra-
curricular activities were available for everyone, but a number of students did not
participate. Albeit the numbers of students were small, the majority of Asian and mixed-
race students did not participate. There may be an implication here that the school might
carry out an audit of who participates in which extra-curricular activity so that the needs
of all can be addressed.
There were very few racist incidents reported in the school. Students knew what was in
the school anti-racist policy. Teachers, however, seemed to be uncertain whether this
included having a peer mediation programme. There was also a mixed response among
teachers about whether the school rules and regulations were designed to take account of
cultural differences. There may be a number of implications here. It may be that the rules
were written at a level of generality that meant they could be adapted in practice to meet
all students’ needs. For example the issue of respect for everyone applies regardless of
ethnic background. It may be for this reason that the school allowed their students to wear
traditional clothes that were important in different cultures.
There is evidence that in some respects the school paid close attention to including issues
of culture in the curriculum but not in other respects. For example, although students
seemed relaxed in the schools and reported that they felt included, overall, the ethnic
background of some of the members of the school was invisible in the displays around the
buildings. There had been one ‘Africa Day’ some time previously in the school, but
students reported that this acknowledgement of some students’ background was scanty.
They commented in general that they would like to see more events of this sort. Further,
the majority of students disagreed that school assemblies were often about different
cultures and races and it may be that this aspect should be audited and reconsidered.
However, both students and teachers agreed that class textbooks talked about people from
different backgrounds in a positive way. The majority of White British students had the
opportunity to study some of the history of their own culture but this was not necessarily
the case for others. When the school curriculum at secondary level is examination-
oriented it is not easy to see how every student’s cultural history could be included in the
school curriculum. However, students were allowed to study any subject.

154
The majority of students felt that their teachers respected and understood their ethnic
backgrounds and their cultural, racial and ethnic differences, although they perceived that
these teachers did not necessarily know expressions in the languages used by different
students. All the teachers responded that they understood the importance of being aware
that body language and non-verbal communication mean different things in different
cultures. In general, too, teachers reported that their peers liked to teach students with
different backgrounds. It is not surprising, therefore that every student reported feeling
valued in the classroom and commented on the warm welcome when they first arrived at
the school. Both schools had a planned programme of induction and orientation for all
students.
Students who had met the school counsellor reported that s/he understood them as a
person. School counselling services gave support to students’ social and academic needs
and they had the skills required for effective cross-cultural counselling. However,
teachers agreed that they themselves did not have such skills. This point reiterates the
concern about insufficient access to continual professional development programmes for
multicultural education.
There seemed to be a very positive attitude to multicultural education in the school. The
schools had mutually supportive relationships with community groups and agencies, for
example.
Almost all teachers felt that the school should offer multicultural education and that it
was possible to plan lessons and choose resources to reflect students with different
backgrounds. Classroom routines were clearly organized and responsibilities were shared
out fairly between all students. Students were encouraged to eat their lunch together and
students work in co-operative learning groups. Both teachers and the head teacher
reported that their school had a system for monitoring the progress of all groups of
students by ethnicity so that issues of underachievement by particular groups could be
highlighted and addressed. This is a legal requirement in English schools.
7.3 Recommendations
Educational programmes and practices in multicultural classroom must acknowledge all
ethnic groups and their contribution to the development of Sri Lankan’s history, life and
cultures in order that all students can acquire the knowledge, values, and skills that they
need to use effectively as citizens of the multicultural society of Sri Lanka. If intellectual
ability and different ways of knowing within the cultures of the students in the school are

155
recognized and used in the school instructional process for ethnically diverse students,
educational achievement of all can improve (Banks, 1993).
One effective approach to supporting all students within multicultural classroom in Sri
Lanka to achieve involves the practice of what some (Gay, 2010, p.31; Bishop and
Berryman, (2010) call ‘culturally responsive pedagogy’. Culturally responsive teaching
incorporates curriculum content, learning context, classroom climate, student-teacher
relationships, instructional techniques, classroom management and performance
assessments, using different frames of reference and representation of ‘various ethnic and
cultural groups in teaching academic subjects, processes and skills’ (Gay, ibid.). Spring’s
(1995) definition of a cultural frame of reference is useful in considering what culturally
responsive pedagogy may comprise. He defines it as ‘those elements that cause a cultural
group to interpret the world….in a particular manner’ (p.5), or the filter through which
impressions of, experiences with, and knowledge of the outside world are ordered and
made meaningful. Such a pedagogy engages with high-status, accurate cultural
knowledge about diverse groups in to subjects and skills taught. At the same time as
academic achievement, culturally responsive pedagogy promotes social consciousness,
and critique, cultural affirmation, competence in social exchange, community building
and personal connections, individual self-worth and abilities and an ethic of caring (Gay,
2010). Further it develops cooperation, collaboration, reciprocity and mutual
responsibility among students and between students and teachers, attributes that are
crucial to the Sri Lankan government’s drive towards peace education. It is the
behavioural expressions of knowledge, beliefs and values that recognize the importance
of racial cultural differences in learning and therefore teachers to the strength of all these
students. Culturally responsive teaching can therefore harness the higher learning
potential of students with different ethnic background and at the same time help to
develop their social abilities.
In practice, and in terms of the multicultural curriculum, Teel and Obidah (2008)
emphasise that cultural differences, such as those that are apparent in Sri Lankan schools,
should be seen as assets, and culturally different individuals and heritages valued. The
cultural knowledge of ethnically diverse cultures, families, and communities should guide
curriculum development, classroom climates, teaching strategies, and relationships with
students racial and cultural stereotypes, prejudices, racism, and other forms of intolerance
should be challenged so that the pedagogy that is developed can contribute to change in
the direction of social justice and academic equity. Culturally responsive teachers teach
the whole child and encourage intellectual, social, emotional and political learning by

156
using cultural resources to teach knowledge, skills, values and attitudes. As Hollins
(1996) explains, education for students with different backgrounds should incorporate
‘culturally’ mediated cognition, culturally appropriate social situations for learning, and
culturally valued knowledge in curriculum content’ (p.13). In this way, culturallu
responsive teaching can help to maintain identity with students’ own ethnic groups and
communities and also develop a sense of community and camaraderie with students of
different backgrounds. These skills should be integrated with all curriculum and
classroom routines so that students can learn from one another and internalize the value
that learning is communal, reciprocal and interdependent and demonstrate it in their
behaviour.
The role of teachers is clearly crucial as the implementers of culturally responsive
pedagogy, Gentemann and Whitehead (1983) termed teachers cultural brokers. More
specifically, Diamond and Moore (1995) categorized teachers’ roles under three major
headings that are relevant to the Sri Lankan context, cultural organizers, cultural
mediators, and orchestrators of social context for learning:
• As organizers of social contexts for learning in Sri Lanka, teachers need to make
the teaching process consistent with the social cultural context and frames of
reference of students with different cultural backgrounds. The goal in Sri Lanka
would be to create communities of Sinhala, Tamil, Muslim and other culturally
diverse learners who affirm one another and work collaboratively for everyone’s
mutual success.
• As cultural mediators teachers can provide opportunities for students in Sri Lanka
to understand conflicts among cultures and disparities between different cultural
systems. Teachers can help all Sinhala, Tamil, Muslim, Burgher, and Malay
students to interpret their ethnic identities, respect other cultures, develop positive
intercultural relationships, and avoid prejudice, stereotyping and racism. This
curriculum should include multi-ethnic components that are integrated across the
whole curriculum and cover a wide range of attitudes and experiences and
positive and invisible (values, beliefs) aspects of culture (Banks, 2010). In
particular, textbooks used by the teachers, the cultural mediators, as the most
prominent teaching resources should be seen as ‘cultural artefacts’ (Byrne, 2001,
p. 299) implicit in which are the values, norms, disciplines and society’s
approved knowledge that students acquire as part of their school knowledge and
understanding. Students need to learn about the many different ethnic groups in
Sri Lanka. Educators should therefore ensure that curriculum content about

157
different Sri Lankan cultural groups is accurate, real and complete (Banks, 1991,
2003; Gay, 1988, 1995, 2002).
• As orchestrators of social contexts for learning, Sri Lankan teachers must
recognize the important influence students’ cultures have on learning and make
teaching processes compatible with the sociocultural context and frames of
reference of their students.
Gay (2010) notes that, to be culturally responsive, teachers themselves must accept that
teaching and learning are holistic and therefore be involved in students’ lives so that they
can teach knowledge and skills students need to negotiate in the society, which is Sri
Lanka in the case of the current study, that currently exists and that may exist in the
future. For students to acquire confidence in themselves teachers must always place
students in learning environments and relationships that imply a belief in their potential
for achievement. The implication here is that culturally responsive approaches can be
seen broadly as encompassing two aspects, the affective, where teachers are concerned
with the emotions, confidence, self worth and so on, and the academic focused on
subject-specific pedagogy. Gay describes a profile of what culturally responsive caring
means in action and that could be used as an audit of skills and attributes to be achieved
in teachers’ professional development in Sri Lanka. It include teachers
• providing spaces and relationships where ethnically diverse students feel recognized, respected, valued, seen and heard;
• fostering warmth, intimacy, continuity, safety and security;
• knowing culturally diverse students thoroughly personally and academically;
• cultivating a sense of kindredness and reciprocal responsibility among culturally diverse students;
• responding to the needs of diverse students for friendship, self-esteem, autonomy, self- knowledge, social competence, personal identity, intellectual growth, and academic achievement;
• being academic, social, and personal confidantes, advocates, resources, and facilitators for culturally diverse students;
• acquiring knowledge of and accepting responsibility for culturally diverse students that go beyond the school day and its organizational parameters;
• helping students of colour develop a critical consciousness of who they are, their values and beliefs, and what they are capable of becoming;
• enabling ethnically and culturally diverse students to be open and flexible in expressing their thoughts, feelings, and emotions, as well as being receptive to new ideas and information;
• building confidence, courage, courtesy, compassion and competence among students from different ethnicities and cultural communities;
• being academically demanding but personally supportive and encouraging;

158
• allowing for the active assertion of student interest and curiosity;
• creating habits of inquiry, a sense of criticalness, and a moral edit among students to care for self and others;
• treating everyone with equal human worth;
• acknowledging social, cultural, ethnic, racial, linguistic, and individual differences among students without pejorative judgments;
• promoting cultural, communal, and political integrity and solidarity among different ethnic and cultural groups;
• dealing directly and bluntly with the vicissitudes of racism, and the unequal distribution of power and privilege among diverse groups;
• preparing students to understand and deal realistically with social realities (what is), along with possibilities for transformation (what can be);
• teaching ethnic, racial, and cultural knowledge, identity, and pride;
• providing intellectually challenging and personally relevant learning experiences for socially, ethnically, racially, and culturally diverse students (pp.51-52).
Teachers need clear guidelines to carry out multiculturally responsive teaching (Gay,
2010). Culturally responsive pedagogy has all of the following components that, again,
might be used in a deliberate manner in teacher training and professional development in
Sri Lanka:
• It is a part of all subjects and skills taught at all grade levels.
• It has to be deliberate and explicit, systematic and sustained. This is not something that happens only as notations of special events; it must characterize children’s learning opportunities and experiences at all times.
• It simultaneously addresses development of academic, psychological, emotional, social, moral, political, and cultural skills; it cultivates school success without compromising or constraining students’ ethnic identity and cultural affiliations.
• It uses comprehensive and integrative approaches to teaching and learning all of which are informed by the context and content of the cultures and lived experiences of different groups.
• It cultivates an ethos of academic success as well as a sense of community, camaraderie, kindredness, and reciprocity, among students who work collaboratively for their mutual personal wellbeing and academic achievement.
• It requires a combination of curriculum content, school and classroom learning climates, instructional strategies, and interpersonal interactions that reflect the cultures, experiences, and perspectives of different ethnic groups.
• It encompasses concepts and principles, patterns and trends that apply to all ethnic groups and the ways in which these are uniquely manifested in the cultures and experiences of specific ethnic groups and individuals.
• It includes accurate information about the cultures and contributions of different ethnic groups, as well as moral and ethical dilemmas about the redistributions of power and privilege, and the deconstructions of academic racism and hegemony.

159
• It teaches students the ‘cultural capital’ (i.e., the informal tacit knowledge, skills, and behaviours needed to negotiate the rules, regulations, protocols, and demands of living within educational institutions) needed to succeed in schools.
• It demonstrates genuine caring and concern of students of different groups by demanding high levels of performance and facilitates their living up to these expectations.
• It creates cultural bridges, or scaffolds, between academic learning in school and the sociocultural lives and experiences of different groups outside of school.
• It teaches students to imagine and develop the skills needed to construct more desirable futures and to be integral, active participants in these creations.
• It requires staff development of teachers that includes cultural knowledge and instructional skills, in content with personal self-reflection and self-monitoring techniques for teaching to and about ethnic diversity.
• It commits institutional and personal resources, along with creative imagination, to facilitating maximum achievement for students of different cultural groups
(pp.149-250)
It is essential for teachers as, cultural mediators, to acquire skills in developing
multicultural curriculum content in improving the school achievement of ethnically
diverse students because
• Curriculum content is crucial to academic performance and is an essential component of culturally responsive pedagogy.
• The most common source of curriculum content used in classrooms is textbooks. Therefore, the quality of textbooks is an important factor in student achievement and culturally responsive teaching.
• Curriculum content that is meaningful to students improves their learning.
• Relevant curriculum content for teaching all students including information about the histories, culture, contributions, experiences, perspectives, and issues of their respective ethnic groups.
• Curriculum content is derived from various sources, many of which exist outside the formal boundaries of schooling.
• There are many different kinds of curricula; they offer different, but important, challenges, opportunities, and entrees for doing culturally responsive teaching (p.128).
Curriculum sources and content that provide accurate presentations of ethnic and cultural
diversity offer several other benefits for improving student achievement. First, they
provide those who never had close personal contact with members of ethnic groups other
than their own with opportunities to communicate and engage with diverse people as well
as to confront themselves. This experience alone will calm some fears, dispel some
myths, and produce some learning that cannot be obtained from books and other media
sources. Removing the threat and intimidation from new knowledge enhance receptivity

160
toward and mastery of it. Second students are actively involved in their own learning.
Participatory engagement tends to have positive effects on achievement. Third, students
have real power to help structure their own learning. They thus have some real control
over their own academic destinies. Surely students will learn better that which is of their
own creation. Consequently, all sources of curriculum content, both within and outside of
cultural diversity, should be kept under regular review to evaluate the extent to which
they fit the concept of fitness for purpose here. Good information is a necessary element
of culturally responsive teaching and the improvement in student achievement.
In summary, therefore, culturally responsive teaching is an appropriate approach to
consider for extending the inclusivity of Sri Lankan multicultural schools because it
would be both validating and affirming of students as culturally located individuals (Gay,
2010; Bishop & Berryman, 2010). It would acknowledge the legitimacy of the cultural
heritages of students’ own ethnic groups, both as influences over students’ dispositions,
attitudes, and approaches to learning and as content to be taught in the formal curriculum.
It would build bridges of meaningfulness between home and school experiences that are
between students’ lived realities and the academic abstractions implicit in school
learning, using a wide variety of teaching approaches that are connected to different
cultural frames of references. It would encourage students to know and praise their own
and one another’s cultural heritages by incorporating multicultural information, resources,
and materials across all the subjects and skills routinely taught in school.
Culturally responsive teaching involves teachers, counsellors, administrators, and support
staff in classrooms and schools in a formal way such as policies programme and practices
and in an informal way such as extra-curricular activities, school image and community
relations. However, it does not directly address two very important issues that emerged
from the current study and are consonant with the outcomes of other recent studies in Sri
Lanka. These may be seen as interlinked and relate firstly to teacher qualifications, and
secondly to the level of teachers’ language competence. In this study there seemed to be a
relationship between qualifications and teachers’ attitudes towards teaching pupils of all
cultures in multicultural classrooms. Beyond the question of whether the teachers in the
study were highly enough qualified professionals with both the skills and the necessary
knowledge and experience to teach secondary pupils to a high level was the issue of the
association between lower qualifications and more negative attitudes towards the
inclusion of all students. Related to the concern about teacher qualifications is that of
teachers’ competence (or lack of competence) in the languages commonly used by
students across the five schools in addition to Sinhala. It is outside the remit of this study

161
to do more than recommend that central government looks again at teacher qualifications
for both existing teachers and new recruits and prioritises teacher training, in-service
professional development and the acquisition of competence in both national languages at
the very least.
Teacher training and professional development
Understanding and developing their roles as cultural organizers, cultural mediators, and
orchestrators of social context for learning (Diamond &Moore, 1995) within a
deliberately culturally responsive approach to pedagogy in multicultural classrooms in Sri
Lanka will require a renewed effort in professional development at national level to
enable teachers to develop the necessary practices.
Changes in the curriculum of teacher education may be needed to support diversity. For
example Blackwell et al (2003) suggested that the teacher training curriculum needs to
include culture, linguistics, diversity, gender, race and equality. Writing in an American
context, Gay (1994) and Ladson-Billings (1994-1995) concluded that the teacher
education curriculum needs a theoretical and practical connection between cultural
relevance and academic success of students with diverse backgrounds. The teacher
education curriculum for pre-service teachers needs to include practical experience and
the opportunity to apply multicultural education through training. Munn (1996) has also
suggested that teacher educators in the UK need to train teachers in cultural diversity
education to teach in a culturally sensitive way.
In Sri Lanka Balasooriya (2012) explains that teachers have a special role to act in
preparing young people to face future challenges with confidence and build them up with
purpose and responsibility. To fulfill this aim well, teachers must have qualifications in
their profession. However, as Table 2.7 in chapter 2 indicated that there were 40,062
untrained teachers in Sri Lankan schools in 2010.According to educational information in
the Ministry of Education in 2012 there were 5,833 untrained teachers in the Government
schools, 2.6% of the whole teacher population in 2012. Over 40% of teachers had no
teacher training. Nearly 40% (86,751) of teachers had a degree (Table 2.8 in chapter 2).
The findings of the current study broadly reflect the same proportions of trained to
untrained teachers. Currently all teachers are recruited by the central government for both
National schools and schools by Provincial Public Service Commission (Balasooriya,
ibid). Both National Collage of Education (NCoE) and universities provide most of the
teachers to school system. However, teacher training intakes to NCoEs and universities
did not match the country’s real teaching recruitments. The last twenty years have

162
witnessed a subject-specific teacher shortage. Today also there are shortages in subjects
such as science, mathematics, technical subjects, English and aesthetic subjects in grades
six to eleven especially in schools in remote areas. This situation is made worse by the
fact that, as Balasooriya (2012) comments, some professionally qualified Sri Lankan
teachers emigrate to Canada, the UK, Australia, New Zealand and the USA. The majority
of them do not return to Sri Lanka.
The current research indicates a very strong view among all the teachers surveyed in the
five schools in Sri Lanka, and also in the English school but to a lesser extent, that access
to the kind of professional development that might assist them to audit their current skills
and competencies in teaching in multicultural classrooms and acquire others is lacking.
Developing the ability and courage needed to apply culturally responsive teaching should
begin in pre-service teacher education programmes and further continue in in-service
professional development. Pre-service teacher training programmes should involve
information about cultural characteristics and contributions, pedagogical principles, and
methods and materials for ethnic and cultural diversity. Gay (2010, p. 246) reflects the
views of some of the teachers in the English school who commented on the importance of
learning about multicultural practices in real life contexts of school classrooms in
commenting that theoretical information
… should be supplemented with supervised practices in designing and implementing replacement models, for example, determining what ‘authentic assessment’ means within the context of ethnic diversity and, culturally responsive teaching. How might professional assessment be modified to better accommodate the component of the learning styles of different ethnic groups? Or what changes are needed in structured academic controversy (SAC) approaches to problem solving to make them illuminate culturally responsive teaching ideologies and methodologies?
Overall a number of components need to be created to support in service teacher training
programmes to implement culturally responsive teacher training in Sri Lanka. These
include:
• staff development to acquire knowledge of ethnic diversity and culturally responsive teaching;
• availability of necessary instructional materials;
• systematic ways in which teachers can receive constructive feedback on their efforts and recognition for their accomplishments in implementing culturally responsive teaching;
• activities in other aspects of the educational enterprise, such as administration, counselling, curriculum design, performance evaluation, and extracurricular activities, comparable to (but jurisdictionally appropriate) culturally responsive classroom teaching; and
• clearly defined techniques for meeting the opposition that culturally diverse people and programmes may encounter in both the school and the community

163
(Gay, 2010, p.246).
Language
In the current study a major finding was the concern about the language competence of
many of the teachers and students, despite the focus on language from central
government. If students lack communication skills and teachers do not understand their
students, it is obvious that students’ academic performance is likely to be reduced. Boggs
(1985) commented: ‘The attitudes and behaviour patterns that have most important effect
upon children….[are] these involved in communication’ (p.301). The communication of
multicultural classrooms is multidimensional and multipurposed. It includes verbal and
nonverbal, direct and tacit, literal and symbolic, formal and informal, grammatical and
discourse component. ‘Language is at the very heart of teaching’ (Smith, 1971,
p.24).Teachers use language through their whole teaching process, for example devising
assignments, giving directions, explaining events, interpreting words and expressions,
proving propositions, justifying decisions and actions, making promises, dispersing praise
and criticism, or assessing capability. It is clear that the potential and realized
achievement of students with different cultural backgrounds depends to a large extent on
the communication skills both of themselves and their teachers. ‘Teachers have the power
to shape the future, if they communicate with their students, but those who cannot
communicate are powerless’ (Dandy, 1991, p.10). At a very basic level, therefore in Sri
Lanka all should be offered the opportunity to acquire competence in the two national
languages, at least, and also in English, the link language as well.
The ‘principle of linguistic relatively’ (Whorf, 1952, 1956; Carroll, 1956) contends that
the structures of various languages reflect different cultural patterns and values, and in
turn, affect how people understand and respond to social phenomena. Whorf (1952)
explains that ‘a language is not merely a producing instrument for voicing ideas but rather
is itself the shaper of ideas’ (p.5). Vygotsky (1962) also recognized the reciprocal
relationship among language, culture and thought in his argument that the development
thought is determined by language as well as sociocultural experience. Embedded within
language and communication styles are systems of cultural notations and the means
through which thoughts and ideas are expressively embodied. Embedded, too, are cultural
values and ways of knowing that strongly influence how students engage within learning
tasks and demonstrate mastery of them. Teachers who do not know or value these
communicative frames of reference, procedural protocols, and rules of etiquette of their
students will not be able to fully access, facilitate, and assess most of what these students

164
know and can do because the two sides will not be able to genuinely understand one
another nor will students be able to fully convey their intellectual ability.
In Sri Lanka, the 13th Amendment defines Sinhala and Tamil as the national and official
languages and English as the link language. As a multi-ethnic, multi-religious, pluralistic
society, it is incumbent upon every Sri Lankan to learn a national language, other than
his/her own. In the 1900s the Report of the Presidential Commission on Youth stressed
the importance of students speaking each other’s languages in order to encourage social
cohesion. More recently the Official Language Commission (OLC) (2012) has made a
recommendation to create a position of a bilingual officer in every government office in
order to implement the official language policy. There is a strong implication here of
central government’s view that multi-lingualism should extend throughout Sri Lankan
society and Tamils and Sinhalese should learn each other’s language.
Perera et al (2004) identify some factors as being the principal ones to consider about
language teaching: the political will and determination to sustain the initiative of teaching
both official languages to all children, the incentive and directives given to the school
system and students that would influence the preference a student might have for learning
the ‘other’ official language, the nature of the school climate for teaching and learning in
these languages and the motivation of teachers to teach the languages.
In relation to the need for promoting national unity further, and subsequent to the civil
war, the New Education Act for General Education in Sri Lanka (2009) suggested the
possibility of organizing multi-ethnic schools in areas where the communities are multi-
ethnic. The government’s expectation is that, in these multi-ethnic schools, all three
languages can be used as a medium of instruction and children grow up together as Sri
Lankans while understanding their heritage and respecting the culture of other
communities. The researcher’s personal experience is that such multicultural schools
were in existence prior to 2009, but that the focus on multi-culturalism in schools has
been brought into sharp relief by deliberate moves to finding solutions to inter-ethnic
conflict.
As reported by the policy makers in the current study, government language policy is in
place as are the resources and the study hours in schools to support-tri-lingualism.
However, findings from the five schools as outlined imply that central government policy
was undermined by a number of complex but inter-related factors. Firstly some ethnic
groups appear to be advantaged in terms of language learning and competency in relation
to the majority group. This immediately implies that the expressed intention to bring

165
about social cohesion through tri-lingualism and ensure equality across all ethnic groups
is threatened. Secondly, there appears to be a lack of competency in multi-lingualism that
would be required to sustain government policy among the teachers who were
interviewed. To address this issue would require consideration of some of the points
made by Perera et al (2004).
Thus Tamil and Muslim students had an advantage in developing day-to-day language
skills that are important both in sustaining friendships across different ethnic groups, in
receptive and expressive language in classrooms in Sinhala medium schools, and, in
terms of future life chances, in job and educational opportunities. For example, as noted
above the Official Language Commission (OLC) 2012 recommended creating a position
of bilingual officer in every government office and without competency in everyday
language use obtaining such a position is not possible. Further, enhanced multi-lingual
skills can privilege Tamil and Muslims fostering greater national relationships, as well as
educational opportunities in foreign countries. Such international relationships and
opportunities are significant at a national, as well as personal level because they help to
grow the economy and develop the social status of Sri Lankans. The findings of the
students’ questionnaire about speaking different languages at school and competent
reading of languages reflect this first finding. While more Sinhalese could read only two
languages, and these were Sinhala and English and did not include Tamil, more Muslims
and Tamils could read more than two languages (Sinhala, Tamil and English). A chi
square calculation indicated a significant difference between ethnic groups in terms of
speaking different languages at school. A chi square calculation of the difference between
ethnic groups that was not of their group indicates a highly significant difference (p <
0.001) (Table 6a, Appendix D).
There is a considerable difference between the national language contexts of Sri Lanka
and England. Sri Lanka is officially a tri-lingual country. England is officially mono-
lingual. In terms of government policies related to first language learning in schools, in
Sri Lanka Sinhala and Tamil are donated as the official national languages with English
as the link language. In England, whilst English is the only recognized official language,
there is a history of support in schools for those students for whom English is an
additional language.

166
7.4 Conclusion
There are some recommendations for both countries. Recommendations for Sri Lanka
related to the development of culturally responsive pedagogy among the teachers in
multicultural classroom: professional development for teachers, opportunity for minority
ethnic students to study their own religion in these schools, encouragement to Muslims to
take part in more extra-curricular activities, balance between cultures and ethnicities
when school assemblies are organized, audit of library facilities, a range of books
available to schools in relation to different cultures and ethnicities and high level
diversity-awareness and counselling training. Above all there is an over-riding need to
consider how to improve the teaching of additional languages.
Schools in England need to be aware of the extra-curricular activities for minority
students. Schools assemblies should be balanced. There should be professional
development programmes for multi-cultural education for teachers. Funding and
resources should be readily available for new non-English speaking students who arrive
in schools unexpectedly.
7.5 Contribution to knowledge
It seems, from this research, that Banks’s (1989) framework is a useful tool to evaluate
the range and qualities of multicultural curricula, pedagogy and practices from the
viewpoints of teachers and student groups across continents.
It is possible to identify some distinct contributions to knowledge that have come out of
this research. This study supports the work on multicultural education, specifically in Sri
Lanka, where limited research had been conducted. The findings help to identify the
specific areas that might be considered in schools where these are applicable and
transferable to their practice. These findings have the potential to help policy makers,
principals, teachers, and researchers to know which aspects of multicultural education
work well, and which require change.
The review of the literature shows that the language policies in education encourage the
acquisition of three languages among students in Sri Lanka. However, research findings
show that, overall, the majority of Sinhala students across the five schools have limited
language competence in relation to students from other ethnic groups. Therefore, there
needs to be serious consideration of how to ensure equity in language competence among
all students. At the same time, teachers in these multicultural schools wanted language

167
training to build a good intercultural relationship between teachers and students. This
same issue did not apply in the school in England where English is the only designated
language and support has been given to non-English speaking to minority students to
increase their English language skills for many years.
The results have shown that training opportunities for CPD in multicultural education was
low. Therefore it is important to consider ways to provide opportunities to multicultural
educational training for teachers in both countries.
The research makes clear how extra/co-curricular activities are important to promote
social cohesion in Sri Lanka. The key findings indicated that the majority of Sinhala and
Tamil students were engaged in the school activities but Muslim students less so. How to
increase the participation rate of Muslim students in the co-curricular activities should be
considered carefully. In addition, all five schools had a variety of extra-curricular
activities that were designed for minority ethnic groups. This is a good example for other
multicultural schools in Sri Lanka. The schools in England did not have a variety of
extra-curricular activities that were designed for minority ethnic students, so this issue
may raise a concern about co-curricular activities for minorities. Schools in both countries
perhaps should carry out an audit of whether concerts and special events include all
cultures.
Research outcomes also highlight equity issues. For example, there was a perception that
rules and regulations were designed to take account of cultural differences in schools in
Sri Lanka. Teachers had mixed responses about whether the school rules and regulations
were designed to take account of cultural differences in the schools in England, however.
This may be because the school had adopted rules that were applicable to all cultures.
Schools in both countries allowed students to wear traditional clothes that were important
in different cultures, indicating that the schools showed respect to all cultures. Having
said that schools might need to consider the balance between cultures and ethnicities
when schools assemblies are organised, so that all students’ backgrounds are represented.
There were very few racist incidents reported in schools in both countries. Overall it
seems that, in these schools with the reputation of good practice in multicultural
education practices were successful in maintaining peaceful interactions between ethnic
groups.
The research outcomes indicated that the national policy in both countries of ensuring
class textbooks and the curriculum help students understand people from different
backgrounds is successful. The research also confirms the implementation of national

168
policy guidelines that students from all ethnic groups should be able to study some of
their own history in Sri Lanka. Sri Lanka has three major ethnic groups. Therefore, it is
straightforward to include some of the histories in the syllabus. However, in England, the
majority of White British students had the opportunity to study some of the history of
their own culture but it was not easy to include every student’s cultural history in the
school curriculum, especially when numbers were small and the numbers of different
ethnic groups were considerable.
This study has indicated that, in these schools at least, there was a feeling among the
teachers themselves that they should respect the cultural, racial and ethnic differences of
their students and be aware of the ethnic and cultural backgrounds of all students in their
classroom in both countries. Most students in the schools in Sri Lanka thought that their
teachers knew some expressions in the languages of different students. However, teachers
did not necessarily know expressions in the languages used by different students in
England. This may be one reason why teachers said they would like the opportunity for
further professional development.
The finding that, generally, the majority of teachers in Sri Lanka reported that their peers
would like to teach students with the same backgrounds and that teachers with higher
level qualifications and training were more likely to say that their peers had no preference
for teaching students from the same backgrounds as themselves is an important one. This
evidence implies that teachers with training may have more positive attitudes about
multicultural education. All teachers reported that their peers were comfortable teaching
students with different backgrounds in England.
The issue of whether academic results should be published by ethnic groups is a
contentious one. In Sri Lanka all principals said that they did not have this type of system
in order to avoid misunderstandings about ethnic attainment. The Department of
Examinations does not publish examination results according to the different ethnic
groups. However, they publish results by language medium. Schools in England had a
system for monitoring the progress of all groups of students by ethnicity that was
requested by law in an attempt to expose the underperformance of particular groups and
highlight where additional resources and effort should be focused to ensure equity.
The research has indicated quite a lot of evidence that, in these schools, students are
encouraged to engage in peaceful interactions with peers from other cultures. This may be
one contributory factor in ensuring that there is little reporting of racism and bullying.
Students in both countries were encouraged to eat their lunch together. They often work

169
with partners from different ethnic groups or in peer tutoring relationships and with co-
operative learning groups in the classroom. Teachers supported this peer group
collaboration by helping students to manage group work and share responsibilities.
The research has highlighted a degree of need for training in counselling in multicultural
needs. Teachers in Sri Lanka felt that the counselling services did not match students’
academic and social needs. Counsellors and teachers did not have the knowledge and
skills required to provide cross-cultural counselling. Therefore, both teachers and
counsellors need proper training. In England school counselling services gave support to
students’ social and academic needs and they had the skills required for effective cross-
cultural counselling. Teachers, however, agreed that they did not have such skills. This
might also be an area that requires further consideration.
7.6 Evaluation of research
7.6.1 Limitations This study set out to be a comparative study of multicultural education in Sri Lanka and
England. However, after reviewing the relevant literature it became clear that it is
difficult to compare the two countries because of their different physical, historical, social
and economic backgrounds and their implementation of multicultural education policies.
Despite these acknowledged difficulties, initially the researcher planned to select five
multicultural schools with good multicultural practice in Sri Lanka and five multicultural
schools with good multicultural practice in England. However, it was difficult to get
permission from the schools in England to collect the necessary data. Therefore, the
sample selection for the study in England was restricted as only two schools gave
permission for data collection (one pilot school and one school which was used for the
main study).
This study only targeted secondary level students, who were studying in the Sinhala
medium in multicultural schools in Colombo district in Sri Lanka. In Sri Lanka schools
are separated according to the medium of language, ethnicity and sometimes religion. In
the ethnically mixed areas of Sri Lanka there are schools with students from different
ethnic backgrounds who are studying through the Sinhala language medium. For this
research five schools were selected from among these schools that had a large
multicultural student population and were Sinhala and Buddhist medium schools.
Therefore, it is difficult to generalise the findings to the whole country and to all types of
schools. In England two schools were selected from ethnically diverse areas in

170
Bedfordshire. The English school in the main study was an academy that followed the
Anglican tradition. As with the Sri Lankan schools, the findings from this English school
cannot be generalised to all schools in Bedfordshire or England as a whole.
Four policy makers in Sri Lanka contributed to the main study but in England no policy
makers participated. Therefore, it was not possible to gain an insight of the perspectives
of policy makers in England.
In this study there were different types of data collection instruments. Sometimes the
same question was asked of different people (for example, students, teachers and
principals). However, sometimes their responses were at opposite ends of the scale.
Therefore, it was difficult to arrive at a definitive answer. This may be because they did
not fully understand the questions asked.
A key limitation of this study is that it focused solely on some of the perceptions of the
key stakeholders in the teaching and learning process in the schools in Sri Lanka and
England. One of the limitations of such a study is that it is limited to reported perceptions
and the findings could not be triangulated through any other method beyond the
interviews and questionnaires. The study may have been strengthened considerably
through the addition of observations and documentary analysis that would have enabled
cross comparison between perceptions and other kinds of evidence.
7.6.2 Strengths One of the strengths of the findings is the deliberate use of a single framework which has
been tried and tested over a number of years, and adapted from work carried out
multiculturally. This framework enabled a conclusion to be drawn that the teachers in the
five Sri Lankan schools are generally aware of the importance of understanding their
students’ ethnicities and cultural backgrounds, but that they know that they do not have
enough knowledge to respond appropriately to all their students in their multicultural
classrooms. This is in contrast to the teachers in the English school who had a wealth of
multicultural knowledge on which they were able to draw in their teaching.
Another salient strength of the study is that there are a number of areas where the
activities and curriculum in the Sri Lankan and English schools reflected what Banks
includes in his framework as being essential in effective multicultural schools.
The mixed methods approach of this study, using both questionnaires and interviews,
meant that issues could be studied in breadth across the relevant participants in the
schools, and also probed in depth. Results from one set of research instruments could be

171
compared with the other to add trustworthiness to the findings. All teachers and students
who completed the questionnaires participated in the focus group interviews in England
which supports this view of the richness of the data that was collected. All instruments
were piloted and refined in light of the pilot and in advance of the main study to ensure
that they were fit for purpose. Research participants in both countries used their own
language for questionnaires and interviews to add to confidence in the trustworthiness of
the study.
Finally, to add to the uniqueness of the study, policy makers in Sri Lanka contributed
information about new programmes that have not yet been published.
7.7 Conclusion
This study was conducted to elicit the views of stakeholders about multicultural education
in five Sinhala-medium schools in Sri Lanka, and a comparator school in England. In a
small-scale project such as this it is not possible to generalise from the outcomes.
However, there are some important findings that warrant further research.
Firstly, the fact that Sinhala students in the five Sri Lankan schools seem generally to be
disadvantaged in relation to the other ethnic groups in acquisition of multilingualism is
ironic when so much focus is placed on such multilingualism by central government.
Moving towards Sinhala-medium only after Independence threw the clear linguistic
disadvantage of other groups into sharp relief. However, moving again into a national
context of the acceptance of two national languages seems to have disadvantaged Sinhala
students in these schools because, overall, they have linguistic skills in one language
only, whereas other groups in Sinhala-medium schools tend to be bi- or multilingual.
Having said that, however, the reported multilingual competence of students appears to
increase with age in these schools. The importance of really good multilingual skills and
teaching cannot be overestimated.
Secondly, although generally students of all ethnic groups reported feeling comfortable
and safe at school, there seems to be an issue with the (in)visibility of some cultures in
special events and public displays in these schools. There may be a need to investigate the
effect of this on students’ sense of belonging and social inclusion amd, ultimately,
attainment.
Further, there is an issue of the basic qualifications of teachers at secondary level, and
their access to the training in multicultural pedagogies that they wanted and that are

172
essential to engender multicultural understandings. The higher the qualifications the more
teachers appeared to understand the issues.

173
References
Abdullh, S. N. S. & Ghaffar M. N. A. (undated) Multicultural Education in Malaysian Perspective: Instruction and Assessment, University of Technology of Malaysia.
Alexander, R. J., (2000) Culture and Pedagogy: International Comparison in Primary Education, Oxford: Blackwell Publisher.
Alexander, R. J., (2001) ‘Border Crossing: Towards a Comparative Pedagogy’, Comparative Education, Vol. 37, No. 4.
Arksey, H. & Knight, P. (1999) Interviewing for social scientists, London: Sage.
Central Bank of Sri Lanka (2011) Annual report, Colombo: Central Bank of Sri Lanka.
Anthis, F. and Yuval-Davies, N (1992) Racialised Boundaries: Race, Nation, Gender, Colour and Class and the Anti-Racist Struggle, London: Routledge.
Arora, R. (2005) Race and ethnicity in Education, England: Ashgate Publishing.
Arthur, J., Waring, M., Coe, R. & Hedges, L. (2012) Research methods and methodologies in education, London: Sage
Balasoriya, B.M.J. (2012) Teacher recruitment and teacher mobility in Sri Lanka, http://www.cedol.org/wp-content/uploads/2013/09/Teacher-recruitment-and-teacher-mobility-Balasorriya.pdf
Banks J. A. (1981) Multiethnic Education: Theory and Practice, 2nd ed. Boston, MA: Alleyn and Bacon.
Banks, J. A. (2006) Race, Culture, and Education, Boston : Alleyn and Bacon
Banks, J.A. & Banks, C.A.M. (Eds.) (2010) Multicultural education: Issues and perspectives (7th ed.) New York: Wiley.
Banks, J.A. (1989) Multicultural education: characteristics and goals. In Banks, J.A. Banks and Banks, C.A. Banks (Eds). Multicultural education: Issues and Perspectives. Boston, MA: Allyn and Bacon.
Banks, J.A. (1993) Multicultural Education in the United States, Inquiry International, Philadelphia.
Banks, J.A. (2008) An Introduction to Multicultural Education, Boston : Allyn and Bacon.
Banks,J. A (1991) ‘A curriculum from empowerment, action and change’, in C.E. Sleeter (Ed.) Empowerment through multicultural education (pp.125-141) Albany: State University press New York.
Banks,J. A (1993) Teaching strategies for ethnic studies (7th Ed.) Boston: Alleyn & Becon.
Banks,J. A (1994) Handbook of research on multicultural education, John Wicky and Sons, San Francisco.
Banks,J. A. (1994) Multiethnic education: Theory and practice, Boston : Allyn and Bacon.
Banks,J. A. (1994) Teaching strategies for ethnic studies, Boston : Alleyn and Bacon.
Bartlett,S. and Burton, D.( 2007) Introduction to Education Studies, London: SAGE Publication.

174
Baruth, L. G. & Manning, M.L. (2004) Multicultural Education of Children and Adolescents, New York: Pearson Education Inc.
BERA, (2011) Ethical Gudlines for Educational Research, https:www.bera.ac.uk/wp.content.
Bereday G.Z.F., (1964) Comparative Method in Education, New York: HoH, Rinehart and Winston.
Berger-Schmitt, R (2002). ‘Considering Social Cohesion in Quality of Life Assessments: Concepts and Measurement’, Social Indicators Research, 58(3), pp. 404–405.
Bishop, R. & Berryman, M. (2010) Te Kotahitanga: Culturally responsive professional development for teachers. London: Routledge
Blackwell, P. J. Futrell, M.H. &. Imig, D.G (2003) ‘Burnt water paradoxes of schools of education’, Phi Delta Kappan, 84, pp. 356-361
Bleich, E. (1998) From International Ideas to Domestic Policies: Educational Multiculturalism in England and France, Comparative Politics, Vol. 31, No. 1 (Oct., 1998), pp. 81-100
Blunkett, D. (2003) Active citizens, strong communities: Progressing civil renewal (London, Home Office).
Boggs, S. T. (1985) The meaning of questions and narratives to Hawaiian children, In C. B.Cazden, V.P.Johon, & D.Hymes (Eds.), Functions of language in the classroom (pp.299-327) Prospect Heights, IL: Waveland.
Brandt, G.L. (1986) The Realisation of Anti-Racist Teaching, Lewes: Falmer Press.
Bray, M., and Thomas, Plurray R., (1995) ‘Levels of Comparison in Educational studies, Different Insights from Different Literatures and value of Multicultural Analysis’, Harvard Educational Review, Vo/65, No. 3. Pp. 472-490
Byrne, M.M.(2001) Uncovering racial bias in nursing fundamentals textbooks, Nursing and health care perspectives, 22(6), pp. 299-303.
Canen, A., (1995) ‘Teacher Education in an Intercultural Perspective: A parallel between Brazil and the UK, Compare: A Journal of Comparative Education, 25(3), pp.227-238.
Cardozo, L.T.M.L (2006) The State of Peace Education in Sri Lanka: in Pease or in Pieces? Amsterdam: University of Amsterdam and International School for Humanities and Social Science.
Carrim, N. (1998) Anti racism and the ‘New’ South African Educational Order, Cambridge Journal of Education, 28:3, pp. 301-320.
Carroll, J.B. (ed.) (1956) Language, thought and reality: Selected writing of Benjamin Lee Whorf, Cambridge, MA: MIT Press.
Cohelho, E. (1998) Teaching and learning in multicultural schools. England: Multicultural Matters.
Coheng,L., Maninon, L. and Morrison, K. (2011) Research Methods in education, London and New York: Routledge Taylor & Francis Group.
Colenso, P. (2005) ‘Education and social cohesion: developing a framework for education sector reform in Sri Lanka’, Compare, 35(4), December 2005, pp. 411-428.
Comer, J.P. (1988)’ Educating poor minority children’, Scientific American, 259, pp. 42-48.

175
Coperahewa, S. (2009) The Language Planning Situation in Sri Lanka, Current Issues in Learning Planning, 10 (1), pp. 69-150.
Council of Europe (2001) ‘Promoting the Policy Debate on Social Exclusion from a Comparative Perspective’, Strasbourg: Trends in Social Cohesion, no.1.
Cresswell, J.W., & V.L.Plano Clark (2007) Designing and Conducting Mixed Methods Research, Thousand Oaks, CA: Sage Publications
Cummins J. (2000) Language, Power and Pedagogy- Bilingual Children in the Crossfire, Frankfrurt, UK.
Daly, J., Kellehear, A. & Gliksman, M. (1997) The public health researcher: A methodological appoarch. Melbourne, Australia: Oxford University Press.
Dandy, E.B. (1991) Black communications: breaking down the barriers, Chicago: African American Images.
Davies, I and Issitt, J. (2005) Reflections on citizenship education in Australia, Canada and England, Comparative Education, Vol. 41, No. 4, November 2005, pp. 389-410.
De Silva, E. (2009) The Story of the National Schools, http://www.island.lk/2009/10/20/features4.html
Delors, J. (1996) Learning: Treasure within, Report to UNESCO of the International Commission on Education for the 21st century.
Department for Education and Skills (DfES) 2007, Curriculum Review: Diversity and Citizenship, London: DfES.
(DES) Department of Education and Science (1977) Education in Schools: consultative document, London: HMSO.
Diamond, B.J., & Moore, M.A.(1995) Multicultural literacy: Mirroring the reality of the classroom, New York: Longman.
Edmonds, R. (1986) Characteristics of effective schools, In U. Neisser (Ed.), The school achievement of minority children: New Perspectives, Hillside, NJ: Lawrence Erlbaum Associates.
ESCP (2008) National Policy and a Comprehensive Framework of Actions on Education for Social Cohesion and Peace, Social Cohesion and Peace Education Unit, Ministry of Education, Sri Lanka.
Fereday, J., & Muir-Cochrane, E. (2006) The role of performance feedback in the self-assement of competence: A research study with nursing clinicians, Collegian, 13 (1), 10-15.
Fernando, L., (2010) Promoting Ethnic Cohesion in Universities: Possible Activities, A workshop document, University of Colombo.
Freidson, E. (1994) Professionalism Reborn: Theory, Prophecy and Policy, Cambridge: Polity Press,
Gardner,P. (2004) Teaching and Learning in Multicultural Classrooms, David Fulton Publishers, London.
Garine, I. de (1979) ‘Approaches to the study of food and prestige in Savannah tribes’, Current Anthropology, 19, pp. 39-78
Gay, G. (1994) A Synthesis of Scholarship in Multicultural Education (available-http://.ncrel.org/sdrs/areas/issues/educatrs/leadrshp/le0gay.htm

176
Gay, G. (2010) Culturally Responsive Teaching: Theory, Research and Practice, Teacher College Press, New York.
Gay. G. (1988) Designing relevant curricular for divers learners, Education and Urban society, 2(4), 327-340.
Gay. G. (1995) Bridging multicultural theory and practice, Multicultural Education, 3 (1), 4-9.
Gay. G. (2002) Preparing for cultural responsive teaching, Journal of Teacher Education, 53 (2), 106-116.
Gentemann, K. M. and Whitehead, T.L. (1983) The cultural broker concept in bicultural education, Journal of Negro Education, 52 (2) pp. 118-129.
Gilborn, D. (1990) ‘Race’, Ethnicity and Education: teaching and learning in multi-ethnic schools, London, Unwin Hyman/Routledge.
Gillborn, D (2001) ‘Racism policy and the (mis)education of Black children, in R. Majors (ed) Educating Black children, London: Routledgefalmer.
Gillborn, D. (1995) Racism and Antiracism in Real Schools, Buckingham: Open University Press.
Gillborn, D. (2005) Education policy as an act of White supremacy: Whiteness, critical race theory and education reform, Journal of Education Policy 20 (4):485-505.
Gorski, P. (2000) ‘The challenge of defining a single ‘multicultural education’’ Multicultural education, retrieved from http:www.mhhe.com/socinece/education/multi/define.html.
Grambs, J.D., and Carr, J.C. (1972) Black image: Education copies with color. Dubuque, IA: William C. Brown.
Grant, C.A. and Chapman, T.K. (2008) History of multicultural Education, New York: Routledge.
Gunatillake, G., Perera, M., Wanigaratne, R.A.M.C., Fernando, R.E., Lakshman, W.D., Chandrasiri,J.K.M.D., et al. (1992)The poverty discourse and the poor in Sri Lanka: Rural poverty in Sri Lanka: Priority issues and policy measures, Asian Development Review, 10, 164-198.
Gunawardana, G.I.C., Rupasinghe, S., De Zoysa T.S.V., (2004) Comparative Education and Problems, Unit 1, The Open University of Sri Lanka.
Halcomb, E., Gholizadeh, L. et al. (2007) ‘Literature review: Considerations in undertaking focus group research with culturally and linguistically diverse groups’, Journal of Clinical Nursing, 16(6), pp.1000-1011.
Hans, N., (1999) Comparative Education: A study of Educational Factors and Traditions, London: Routledge and Kegan Paul.
Harris S and Lewer N. (2008) Peace education in conflict zones-experience from northern Sri Lank, Journal of Peace Education, Vol. 5, No 2, September 2008, 127-140.
Hewawasam, P. B. J. (1988) ‘Education in Ancient Cyclone’ Journal of the National Education Society of Sri Lanka, 7:4.
Hixson, J (1991) Multicultural contexts for teacher education: Meeting the challenge of student diversity. Paper presented at the meeting of the American Education Research Association, Chicago.

177
Hollins, E. R. (1996) Culture in school learning: Revealing the deep meaning, Mahwah, N.J: Erlbaum.
Home Office (2001) Community Cohesion: A report of the Independent Review Team (chaired by Ted Cantle), London: The Home Office.
Hulse, K and Stone, W. (2007) ‘Social Cohesion, Social Capital and Social Exclusion’, Policy studies, 28 (2): 109-128.
Jastran, M. M., Bisogni, C. A., Sobal, J., Blake, C., & Devine, C. M. (2009) ‘Eating routines: Embedded, value based, modifiable, and reflective’, Appetite, 52(1), 127-136
Jayasuriya, J.A. (1969) Education in Ceylon before and after independence, Associated Education Publisher, Sri Lanka.
Jenkins, M.P.(1993) Educating Muslim Children, Resources Centre, School of Education, University of Nottingham.
Jenson J. (2010) Defining and Measuring Social Cohesion, Commonwealth Secretariat and United Nations Research Institute for Social Development.
Kandel. I. L., (1933) Studies in Comparative Education, Boston: Houghton Mifflin.
Kantzara,V.,(2011) The Relation of Education to Social Cohesion, Social Cohesion and Development, 2011 6 (1), 37-50.
Kodituwakku, G., and Keppetigoda D., (2010) Vertical Integration of Peace Concepts, Indian Ocean Comparative Education Society (IOCES), University of Peradeniya, Sri Lanka.
Kularathna, W.G. (2002) Sri Lankan education system in the British period, Sara publication, Sri Lanka.
Ladson-Billings, G. (1994) The dream keepers: Successful teacher of African American children, San Francisco: Jossey-Bass.
Leaton G S & Whitty G (2010) ‘Social trajectories or disrupted identities? Changing and competing models of teacher professionalism under New Labour’, Cambridge Journal of Education, 40(1): 5-23
Leicester, M. (1989) Multicultural Education from Theory to Practice, The NFER-NELSON Publishing Company Ltd, England.
Life Competencies and Civic Education, Grade 8, Teachers Instructional Manual (2008), Department of Social Science, National Institution of Education, Maharagama.
Lynch, J. (1986) Multicultural Education Principles and Practice. Eggleston, J. ed. London: Roulledge and Kegan Paul.
Mac an Ghaill, M. (1988) Young, Gifted and Black, Milton Keynes, Open University Press.
Macpherson, W. (1999) The Lawrence Inquire Report by William Macperson of Cluny, London: HMSO.
Manzon, M., (2007) Comparing Places, Comparative Education Research Approaches and Methods, Ed: Bray M., Adamson B., and Manson, M., Comparative Education Research Centre, The University of Hong Kong, China.
May, S. (1994) Making multicultural education work, In Corson, D (ed) Bristol: London Press.

178
Maylor, U., Ross, A. Hutchings, M., Rollock, N. & Williams, K. (2006) Teacher Education Addressing Multiculturalism in Europe England: Country Report 2 (Available at http://cice.londonmet.ac.uk).
Menter, I. (2008) ‘Teacher Education Institutions’, in: T.G.K. Bryce, and W.M. Humes, (eds.) Scottish Education: Beyond Devolution, Edinburgh University Press, Edinburgh, pp. 817-825
Ministry of Education and Higher Education Circular No. 37 / 1995, Collection of circulars: Ministry of Human Resource, development, Education and Cultural Affairs, Vol 1 (1993-2003).
Mirza, H.S. (1992) Young, Female and Black, London, Routledge.
Munn, G. C. (1996) Preparing teachers for a culturally diverse classroom: Multicultural education for preservice teachers, unpublished doctoral dissertation, East Carolina University, Greeenville, North Carolina.
National Policy Framework for Social Integration, (2013) Ministry of National Languages and Social Integration, Sri Lanka.
NEC (2003) ‘Proposals for a New National Policy Framework on General Education in Sri Lanka’, Colombo, National Education Commission.
New Education Act for General Education in Sri Lanka, Context, Issues and Proposals, Final Report (2009) national Committee for Formulating a New Education Act for General Education, Education Commission, Sri Lanka.
Newby, P. (2010) Research Methods for Education, London: Pearson.
Norton, A. and Haan, A. (2013) Social cohesion: Theoretical Debates and Practical Applications with Respect to Job, Background Paper for the World Development Report 2013.
Nubin W. (2002) Sri Lanka Current Issues and Historical Background, New York: Nova Science Publishers Ink.
OECD Development Centre (2011) Perspectives on Global Development: Social Cohesion in a Shifting World, Paris.
Oppenhim, A. N., (1992) Questionnaire Design, Interviewing and Attitude Measurement, London: Pinter.
Osler, A. and Starkey, H. (2013) Mandorin translation of changing citizenship, Asia: McGraw Hill.
Pan, Y.,Dixon, Z. Himburg, S. & Huffman, F. (1999) ‘Asian students change their eating patterns after living in the United States’, Journal of the American Dietetic Association, 99(1), pp. 54-57
Parsons, T. (1970) Some considerations on the comparative sociology, In Fischer, J. (ed) The social science and comparative study of education systems. Scranton, PA: Intern Textbook co.
Payne, G. and Payne, J. (2004), Key Concepts in Social Research, London: Sage.
Peace, R., Spoonley, P., Butcher, A. and O’ Neill, D. (2005) ‘Immigration and Social Cohesion: Developing an Indicator Framework for Measuring the Impact of Settlement Policies in New Zealand’, Working paper 01/05, Ministry of Social Development, Wellington, New Zealand.

179
Perera, L., Wijethunga,S., Balasooriya A. S.(2004) Education Reform and Political Violence in Sri Lanka, Education, Conflict and Social Cohesion, UNESCO International Bureau of Education.
Persons, C. (2008) Singled out for exclusion?, The Guardian, Tuesday, 22, 2008.
Race, R. (2012) ‘Multiculturalism and the impacts on education policy in England’, in Garner, S., Kavak, S. (Eds.) Debating Multiculturalism 2, London, Dialogue Society, 243-258
Commission of Inquiry on Lessons Learnt and Reconciliation (2011) Report of the Commission, Sri Lanka.
Report of the Presidential Commission on Youth (1990) Sessional Paper No 1- 1990, The department of government printing, Sri Lanka.
Rhamie, J., Bhopal; K. and Bhatti, G. (2012) Stick to your own kind: Pupils' experiences of identity and diversity in secondary schools, British Journal of Educational Studies, pp. 171-191.
Noyongoyo, B. (2011) International students in us colleges and universities: eating habits, cultural identity, and dietary acculturation, Unpublished MA thesis, East Carolina University
Rice, P., & Ezzy, D. (1999) Qualitative research methods: A health focus. Melbourne, Australia: Oxford University Press.
Riskowsi, L. and Olbricht, G. (2010) Mathematics Teaching in the Middle school, The Council, Pennsylvenia State University.
Ruberu, R. (1962) Education in Colonial Ceylon, Kandy Printers Ltd, Sri Lanka.
Shade, B.J.R. (Ed.) (1989) Culture, style, and the educative process, Springfield, IL: Charles C Thomas.
Sharma, S. (2005) Multicultural Education: Teacher’s Perceptions and preparation, Journal of College Teaching and Learning, Volume 2 (5, pp. 53-63).
Sheridan, S. (2000) ‘Eating the Other: Food and cultural difference in the Australian Women's Weekly in the 1960s’, Journal of Intercultural Studies, 21(3), pp. 319-329
Sleeter, C.E., and Grant, C.A. (1987) An analysis of multicultural education in the United States, Harvard Educational Review, 57(4), pp. 421-445,.
Smith, A & Robinson, A (1992) Education for mutual understanding: Perception and Policy, University of Ulster, Centre for the Study of Conflict.
Smith, A & Robinson, A (1996) Education for mutual understanding: the initial statutory years, University of Ulster, Centre for the Study of Conflict.
Smith, B.O. (1971) On the anatomy of teaching, In R.T. Hyman (Ed.) Contemporary thought on teaching (pp. 20-27) Englewood Cliffs, NJ: Prentice-Hall.
Spring, J.(1995) The intersection of cultures: Multicultural education in the United States, New York: McGraw-Hill.
SRI LANKA: Giving Child Soldiers an Escape Route, Helping Girl Soldiers Overcome Trauma, http://www.trust.org/alertnet/news/sri-lanka-giving-child-soldiers-an-escape-route-helping-girl-soldiers-overcome-trauma/ accessed 21-10-2012
Sri-Jayantha, A. (2002) Impact of War on children in Ari Lanka, http://www.sangam.org/ANALYSIS/Children_1_28_03.htm, accessed 21-10-2012

180
Strauss, A. and Corbin, J. (1990) Basis of qualitative Research: Grounded Theory procedures and Techniques, Newbury Park CA: Sage.
Sue, D.W. (2004) Multicultural counselling and therapy (MCT) theory, In J.A. Banks & C.A.M.Banks (Eds) Handbook of research on multicultural education (2nd ed., pp.813-827) San Francisco:Jossey-Bass.
Taba, H., and Van Til, W. (Eds.) (1945) Democratic human relations: Promising practices in intergroup and intercultural education in the social studies (16th year book) Washington, DC: National Council for Social Studies.
Taylor, Sandre, Rizvi, Fazal, Lingard, Bob and Henry, Miriam (1997) Educational Policy and the Politics of Change, London: Roulledge.
Teel, K.M. and Obidah, J.E. (Ed.) (2008) Building racial and cultural competence in the classroom, New York: Teachers’ College Press.
Thilakaratna,G.M.(2006) Policy Brief 11, Inter- Regional Inequality Facility, sharing ideas and policies across Africa, Asia and Latin America -2006, Research Economist at the Institute of Policy Studies of Sri Lanka, Colombo, Sri Lanka.
Tolich, M. (2009) ‘The principle of caceat emptor: Confidentiality and informed consent as endemic ethical dilemmas in focus group research’, Journal of Bioethical Inquiry, 6(1), pp. 99-108
Tomlinson, H.(2008) International Perspective on Education: The Response of the Mother Country, Global Constructions of Multicultural Education- Theories and Realities, edited by Grant, C.A. and Lei, J.L., Lawrence Erlbaum Associates, Inc Publishers, New Jersey.
Trochim, W.M.K. (2006) Research Methods Knowledge Base, Mason, Ohio: Atomic Dog Publishers
Troyna, B. & Carrington, B. (1990) Education, Racism and Reform, London, Routledge.
Troyna, B. & Hatcher, R. (1992) Racism in Children’s Lives: a study of mainly white primary schools, Beckenhem, Croom Helm.
Troyna, B. & Williams, J. (1986) Racism, Education and the State, Beckenhem, Croom Helm.
UNICEF (1996) How Sri Lanka educates children for peace (1996) http://www.unicef.org/sowc96/fsrlanka.htm last accessed on the 30th of September 2012.
Verma, G.K. & Pumphrey, P. (1988) Educational attainments, London: Falmer Press
Verma, G., Zec, P. & Skinner, G.(1994) The Ethnic Crucible – Harmony and Hostility in Multi-Ethnic Schools, Graphicraft Typesetters Ltd., Hong Kong.
Vygotsky, L.S. (1962) Thought and Language, Cambridge: MIT Press
Whitty, G. (2006) ‘Education(al) research and education policy making. Is conflict inevitable?’, British Education Research Journal, 32(2), pp. 159-76
Whorf, B. L. (1952) Collected papers on metalinguistics, Washington, DC: Department of State, Foreign Service Institute.
Whorf, B. L. (1956) Language, mind, and reality. In J. B. Carroll (Ed.) Language, thought and realty: Selected writing of Benjamin Lee Whorf, pp.246-270, Cambridge, MA: MIT Press.

181
Zhang, Q., (2008) Understanding Change in Chinese Undergraduate students’ language learning motivation: During the transition to UK Higher Education, Unpublished Doctoral Thesis, University of Bedfordshire.

182
Appendices
Appendix A: Background information on Sri Lanka and England
Geography and history of Sri Lanka Sri Lanka lies between latitudes 5.55°-9.5 1° N and longitudes 79.41°-81.53° E. Its
nearest neighbours, beside the Indian subcontinent, are the Maldives Islands to its west
and the Nicobar and Andaman Islands to its east and north east, respectively. As a result
of its location in the centre of the Indian Ocean the climate of Sri Lanka includes tropical
monsoon rains. The average yearly temperature of Sri Lanka is around 28-30℃ in the
lowlands and 10-20℃ in the central highlands.
The country is famous for the production and export of coffee, coconut, rubber and
cinnamon. In the last few decades, the country has moved away from a traditional
agriculture to an open mixed economy. Sri Lankan’s most dynamic sectors are now the
processing of rubber, tea, coconuts and other agricultural commodities,
telecommunications, insurance and banking, tourism, shipping, clothing, textiles,
jewellery and gems and information technology. About 800,000 Sri Lankans work
abroad, 90% of whom were in the Middle East in 2011 (Central Bank in Sri Lanka, 2011)

183
Figure 2. 1: Map of Sri Lanka showing the nine provinces
(Source: http://geology.com/world/sri-lanka-satellite-image.shtml)

184
Table 2.1 Percentage Distribution of Population by Ethnicity (Source: Population and housing data 2012, Department of Census and Statistics, Sri Lanka)
Ethnic group No. %
Sinhala 15,173,820 74.9
Sri Lankan Tamil 2,270,924 11.9
Indian Tamil 842,323 4.2
Sri Lankan Moor 1,869,820 9.2
Burgher 37,061 0.2
Malay 40,189 0.2
Sri Lankan Chetty 6,075 0.0
Bharatha 1,688 0.0
Other 21,823 0.1
Total 20,263,723 100
Table 2.2: Percentage Distribution of Population by Religion (Source: Population and
housing data 2012, Department of Census and Statistics, Sri Lanka)
Religious group No. %
Buddhist 14,222,844 70.2
Hindu 2,554,606 12.6
Islam 1,967,227 9.7
Roman Catholic 1,237,038 6.1
Other Christian 272,568 1.3
Other 9, 440 0.0
Total 20,263,723 100

185
Indigenous system of education in Sri Lanka The indigenous system of education in ancient Sri Lanka was organized at three distinct
levels:
• The Village school (Guru gedara), the primary stage
• Temple school, the secondary stage, and
• The Pirivena, the stage of higher education.
The village schools imparted a rudimentary type of instruction which was restricted to
reading and writing. The venue was the teacher’s home. The majority of children in a
village went to the village school for their primary education. Very few children
continued beyond the primary level. Those who did not continue were trained as befitted
their caste by their parents. These schools continued till western schooling was introduced
in Sri Lanka. Those who continued into secondary education entered a temple school and
from among them the majority aspired to become monks or learn particular professions
such as medicine or astrology. Professional subjects such as astrology, and medicine,
aesthetic subjects such as sculpture and painting, and languages such as Pali and Sanskrit
also assumed importance. The teachers were Buddhist monks and these schools relied
heavily on royal patronage in the form of gifts such as for their maintenance. The
Pirivenas which were open to both monks and lay people represented the highest level of
education in ancient Sri Lanka, for example the Mahavihara Privena (412 A.D.). The
majority of teachers in Pirivenas were Buddhist monks but lay scholars also joined the
Pirivenas as teachers. The wide and comprehensive curriculum in Pirivenas included
religious knowledge, vedas, comparative religion, Sinhala, Pali and Sanskrit languages,
history, grammar, logic, cultural knowledge, astronomy, medicine, architecture and
painting. Royal patronage and support of the people were important factors in the running
of the Pirivenas. This level of education was open to a small minority of the population
who were trained largely as Buddhist monks (Ruberu, 1962).

186
Current education system in Sri Lanka
Figure 2.2: Current structure of Education system in Sri Lanka (Source: http://www.fulbrightsrilanka.com/?page_id=609)
Table 2.3: Schools by type (Source- Ministry of Education 2012)
School type No. %
1 AB Schools 753 8
1C Schools 2,013 20
Type 2 Schools 3,869 39
Type 3 Schools 3,270 33
Total 9,905 100

187
Table 2.4: Students by type of schools (Source- Ministry of Education, 2012)
Type of School No. of school students % of total number of school
students
1 AB schools 1,426,358 36
1C schools 1,250,115 31
Type 2 schools 876,409 22
Type 3 schools 451,204 11
Total 4,004,086 100
Table 2.5: Number of school students by medium of instruction (Source: Ministry of
Education 2012)
Students by Medium of Instruction No. of school students % of total number of
school students
Sinhala medium 2,971,098 74
Tamil medium 1,032,988 26
Total 4,004,086 100
Table 2.6: Number of teachers by qualifications in the government schools in 2010 (Source:
MoE (2010)
Category Number of teachers
Male Female Total
Untrained 10,561 29,501 40,062
Teaching certificate or equivalent 24,229 71,258 95,487
Teaching diploma and equivalent 14,219 26,484 40,703
Teaching diploma: NCoE 9,661 20,604 30,265
Bed/First degree or equivalent 1,400 2,444 3,844
Postgraduate diploma in
education
1,149 2,044 3,193
MEd/MPhil/MA in
Education/Msc or equivalent
1,024 1,437 2,461
PhD or equivalent 2 1 3
Total 62,245 153,773 216,081

188
Geography of England The map of England is shown in figure 2.3 below.
Figure 2.3: The map of the United Kingdom
(http://straycatmedia.com/Travel/England/England.html accessed 12-08-2013)
The United Kingdom has a number of natural resources such as coal, oil, natural gas, tin,
limestone, iron, ore, salt, clay, chalk, gypsum, lead and silica. Of gross domestic product
(GDP) in 2011:

189
• 0.6 % came from the agricultural sector (cereals, oilseed, potatoes, vegetables, cattle, sheep, poultry and fish);
• 21.9% from Industry (steel, heavy engineering and metal manufacturing, textiles, motor vehicles and aircraft, construction and electronic chemicals);
• 77.4% from services (financial, business, distribution, transport, communication, hospitality).
Population of England Table 2.8: Population of England based on ethnicity (2011) (Source: 2001 Census KS06
Ethnic group: Key Statistics for local Authorities and 2011 Census: KIS201EW Ethnic
group: local authorities in England and Wales)
Ethnic group No. %
White: British 42,279,236 79.8
White: Irish 517,001 1.0
White: Irish Traveller/Gypsy 54,895 0.1
White: Other 2,430,010 4.6
White: Total 45,281,142 85.4
Asian or Asian British: Indian 1,395,702 2.6
Asian or Asian British: Pakistani 1,112,282 2.1
Asian or Asian British: Bangladeshi 436,514 0.8
Asian or Asian British: Chinese 379,502 0.7
Asian or Asian British: Asian Other 819,403 1.6
Asian or Asian British: Total 4,143,403 7.8
Black or Black British: Caribbean 591,016 1.1
Black or Black British: African 977,741 1.8
Black or Black British: Other 277,857 0.5
Black or Black British: Total 1,846,614 3.5
Mixed: White and Caribbean 415,616 0.8
Mixed: White and African 161,550 0.3
Mixed: Asian Other 332,708 0.6
Mixed: Other Mixed 283,005 0.3
British Mixed Total 1,192,879 2.0
Other: Arab 220,985 0.4
Other: Any Other Ethnic Group 327,433 0.6
Other: Total 548,418 1.0
Total 53,012,456 100

190
Religions in England Table 2.9: Religious belief by number and percentage in England (Source: 2011 Census –
KS209EW Religion, local authorities in England and Wales)
Religion No. %
Christian 31,479,876 59.4
Muslim 2,660,116 5.0
Hindu 806,199 1.5
Sikh 420,196 0.8
Jewish 261,282 0.5
Buddhist 238,626 0.4
Other Religion 227,825 0.4
No Religion 3,114,232 24.7
Not Stated 3,804,104 7.2
School system in England Table 2.10: School system in the state sector in England (Source: http:www.intense.co.uk/doc-
pic/system/England.htm)
Age (Years)
State Sector Private sector
2.5 Nursery / Kindergarten
Nursery / Kindergarten
3 4 5 Infant / First School National
Curriculum Year 1 Key Stage 1
6 Year 2 7 Year 3 Preparatory School
Lower 1st 8 Year 4 Key Stage 2 1st Form 9 Middle School Upper 1st
Year 5 10 Year 6 2nd Form 11 Secondary / Upper
School Key Stage 3 Senior School
Year 7 1st Form Lower 3rd 12 Year 8 2nd Form Upper 3rd 13 Year 9 Secondary / Upper School
3rd Form Lower 4th 14 Year 10 Key Stage 4 4th Form Upper 4th 15 Year 11 5th Form 16 Year 12 Lower 6th 17 Year 13 Upper 6th

191
Table 2.11: Different types of schools in England (Source: Department of Education in England, 2013)
School Type Descriptions Comprehensive schools: Takes all pupils, usually regardless of their ability, aptitude or whether they have
been selected for a place at a selective school, includes schools operating pupil banding admission
arrangements.
Secondary morden: Takes pupils regardless of their ability or aptitude, including those who have not been
selected for a place at a local selective school.
Selective: Admit pupils wholly or mainly with reference to ability. These schools are formally designated as
grammar schools.
Academic Sponsor -Led: Sponsored Academies are all-ability, state funded schools established and
managed by sponsors from a wide range of backgrounds, including high performing schools and colleges,
universities individual philanthropists, businesses, the voluntary sector, and the faith communities.
Academic Converter: Schools that have chosen through Governing Body Resolution and application to the
Secretary of State Education, to become an Academy under the Academies 2010.
Free Schools: Free schools are state funded schools that have greater freedoms than local authority
maintained schools. They are run by teachers and have freedom over the length of the school day and time,
the curriculum and how they spend their money.
City Technology Colleges: Independent all ability, non-fee-paying schools offering pupils the opportunity to
study a curriculum geared, with the help private sector sponsors, towards the world of work.
Local Authority maintained schools: Schools fully or partially under local authority controlled that state-
funded, mainly by the Dedicated Schools Grant.
Registered independent schools: Any school which provides full time education for five or more pupils of
compulsory school age, which is not state-funded or a non-state-funded special school.
Independent special school: Approved by the Secretary of State for Education. They are run on a not-for-
profit basis by charitable trusts and normally cater for children with severe and/or low incidence special
educational needs.
State-funded school: Includes Local Authority maintained mainstream schools, Academies, Free Schools
and City Technology Colleges and state-funded special schools9excluding hospital schools, Pupil Referral
Units, Alternative Provision and independent schools).
State-funded mainstream: Includes Local Authority maintained mainstream schools, Academies, Free
Schools and City Technology Colleges (excluding all special schools, Pupil Referral Units, Alternative
Provision and independent schools).
All independent: Includes independent schools, independent special schools and non-state-funded special
schools.

192
Table 2.12: Number of schools by type of schools (Source: Department of Education in
England, 2013)
Type
of
schools
Nursery State-funded
primary(1)(2)*
State-funded
secondary(1)(3)*
State-
funded
special(4)*
and non-
maintained
Pupil
referral
units(5)*
Independent Total
2011 425 16,884 3,310 1,046 427 2,415 24,507
2012 424 16,818 3,268 1,039 403 2,420 24,327
2013 418 16,784 3,281 1,032 400 2,413 24,328
1. Includes middle schools as deemed. 2. Includes all primary academies, including free schools. 3. Includes city technology colleges and secondary academies, including free schools, university technical colleges
and studio schools. 4. Includes general hospital schools and special academies. 5. Includes academy and free school alternative provision.

193
Table 2.13: Number and Percentage of Pupils by Ethnic group in English schools in 2013
(Source: Department of Education in England)
Pupils of compulsory school age and above
State-funded
primary
schools(1)*(2)*
State-funded
secondary schools
(1)*(3)*
State-funded
special schools
(4)*
Pupil referral
units (6)*
Local authority
alternative
provision (7)*
No. %
(8)
No. %
(8)
No. %
(8)
No. %
(8)
No. %(8)
White 2,580,390 76.3 2,531,925 79.0 71,670 78.4 9,955 76.9 13,890 65.2
White British 2,394,560 70.8 2,531,925 74.7 68,510 74.9 9,225 71.3 12,710 59.7
Irish 10,045 0.3 11,325 0.4 275 0.3 60 0.5 95 0.5
Traveller of Irish
heritage
3,200 0.1 1,095 0.0 105 0.1 55 0.4 100 0.5
Gypsy/Roma 10,575 0.3 5,625 0.2 250 0.3 95 0.7 190 0.9
Any other White
background
162,010 4.8 121,580 3.8 2,535 2.8 515 4.0 795 3.7
Mixed 171,195 5.1 129,595 4.0 4,120 4.5 940 7.3 1,040 4.9
White and Black
Caribbean
48,580 1.4 41,620 1.3 1,410 1.5 455 3.5 440 2.1
White and Black
African
21,470 0.6 14,575 0.5 460 0.5 85 0.6 140 0.7
White and Asian 39,295 1.2 28,385 0.9 705 0.8 80 0.6 140 0.7
Any other Mixed
background
61,850 1.8 45,015 1.4 1,550 1.7 320 2.5 325 1.5
Asian 352,850 10.4 290,655 9.1 7,790 8.5 565 4.3 845 4.0
Indian 89,820 2.7 83,510 2.6 1,470 1.6 45 0.3 190 0.9
Pakistani 146,550 4.3 111,535 3.5 3,845 4.2 245 1.9 360 1.7
Bangladeshi 58,585 1.7 47,310 1.5 1,160 1.3 150 1.1 115 0.5
Any other Asian
Background
57,890 1.7 48,305 1.5 1,315 1.4 125 1.0 180 0.8
Black 187,995 5.6 158,095 4.9 5,470 6.0 960 7.4 1,395 6.6
Black Caribbean 44,200 1.3 43,740 1.4 1,470 1.6 485 3.8 560 2.6
Black African 120,010 3.5 96,650 3.0 3,165 3.5 355 2.8 605 2.8
Any other Black
background
23,785 0.7 17,705 0.6 835 0.9 120 0.9 230 1.1
Chinese 12,390 0.4 13,290 0.4 245 0.3 10 0.1 40 0.2
Any other ethnic
group
54,845 1.6 44,440 1.4 1,095 1.2 165 1.3 315 1.5
Classified (5)* 3,359,670 99.3 3,168,005 98.9 90,400 98.8 12,595 97.3 17,52
5
82.3
Unclassified (9)* 23,230 0.7 36,035 1.1 1,060 1.2 350 2.7 3,775 17.3
Minority Ethnic
Pupils (10)*
965,110 28.5 775,710 24.2 21,890 23.9 3,365 26.0 4,820 22.6
All pupils (11)* 3,382,900 100 3,204,040 100 91,455 100 12,945 100 21,30
5
100

194
Table 2.14: Number and Percentage of Pupils by Religious group in English schools in 2010
(Source: DFE)
State Schools
Religious No. %
Christian 32 0.16
Church of England (C of E) 4599 22.89
C of E/Free Church 1 0.01
C of E/Methodist 37 0.18
C of E/RC 20 0.1
Greek Orthodox 1 0.01
Hindu 1 0.01
Jewish 38 0.19
Methodist 26 0.13
Muslim 11 0.05
Quaker 1 0.01
Roman Catholic 2010 10.0
Seventh Day Adventist 1 0.01
Sikh 4 0.02
United Reformed Church 1 0.01
Academies
Christian 25 12.31
C of E 19 9.35
C of E/Christian 1 0.49
Roman Catholic 2 0.98

195
Table 2.15: Number and percentage of pupils by first language in 2013 (Source: Department
of Education in England)
Pupils of compulsory school age and above
State-funded
primary
schools(1)*(2)*
State-funded
secondary schools
(1)*(3)*
State-funded
special schools
(4)*
Pupil referral
units (6)*
No. % (8) No. % (8) No. %(8) No. %(8)
First language is known or believed to
be other than English
612,160 18.1 436,150 13.6 11,570 12.7 1,130 8.7
First language is known or believed to
be English
2,765,735 81.8 2,759,655 86.1 79,655 87.1 11,635 89.9
Unclassified 5,005 0.1 8,230 0.3 230 0.3 180 1.4
Total (9) 3,382,900 100 3,204,040 100 91,455 100 12,945 100

196
Appendix B: Information on the education systems of Sri Lanka and England
Table 3.2: State funded primary, state-funded secondary and special schools. Number of fixed period exclusions by ethnic group and gender. England 2011/12 (Source: Department of Education in England, 2013) Fixed Period Exclusions
Boys Girls Total
Number Percentage of school
Population (7)
Number Percentage of school
population (7)
Number Percentage of school
Population (7)
White 180,920 6.86 64,190 2.53 245,110 4.74
White British 172,170 6.94 761,250 2.57 233,420 4.80
Irish 800 7.30 310 2.89 1,110 5.12
Traveller of Irish heritage 530 23.90 170 8.21 690 16.31
Gypsy/Roma 1,520 20.72 660 9.28 2,180 15.11
Any other White background 5,900 4.39 1,810 1.40 7,710 2.93
Mixed 12,780 8.81 4,360 3.06 17,140 5.96
White and Black Caribbean 6,260 14.30 2,310 5.23 8,570 9.75
White and Black African 1,320 7.98 400 2.42 1,720 5.19
White and Asian 1,470 4.51 420 1.34 1,890 2.96
Any other Mixed background 3,730 7.15 1,230 2.44 4,960 4.83
Asian 10,860 3.39 2,030 0.66 12,890 2.06

197
Indian 1,460 1.67 250 0.30 1,710 1.01
Pakistani 5,960 4.62 1,020 0.83 6,980 2.77
Bangladeshi 1,630 3.74 400 0.79 2,330 2.27
Any other Asian background 1,510 2.89 360 0.73 1,870 2.84
Black 15,470 9.13 4,840 2.88 20,320 6.02
Black Caribbean 6,250 13.86 2,010 4.53 8,270 9.23
Black African 7,260 6.99 2,220 2.14 9,480 4.56
Any other Black background 1,960 9.60 610 3.07 2,570 6.40
Chinese 90 0.74 20 0.16 120 0.45
Any other ethnic group 2,460 4.93 520 1.12 2,980 3.09
Unclassified (8) 3,230 . 1,640 . 4,300
Minority Ethnic Pupils (8) 50,410 5.92 14,720 1.78 65,120 3.88
All pupils 225,810 6.71 77,030 2.38 302,840 4.59

198
Table 3.3: Achievements at GCSE and equivalent for pupils at the end of Key Stage 4 by ethnicity, free school meal eligibility and gender Years: 2005/06 to 2009/10 (provisional). Coverage: England, maintained schools (including academies and CTC
Pupils known to be eligible for free school meals Pupils not eligible for free school meals All pupils
Number of eligible pupils Percentage achieving 5+ A*-C
Grades inc. English & mathematics GCSEs
Number of eligible pupils Percentage achieving 5+ A*-C
Grades inc. English & mathematics GCSEs
Number of eligible pupils Percentage achieving 5+ A*-C
Grades inc. English & mathematics GCSEs
Boys Girls Total Boys Girls Total Boys Girls Total Boys Girls Total Boys Girls Total Boys Girls Total
All pupils 39,368 38,040 77,408 27.8 34.2 30.9 255,214 245,597 500,811 54.7 62.4 58.5 294,617 283,658 578,275 51.1 58.6 54.8
White 26,658 25,920 52,578 23.3 28.4 25.8 216,605 208,277 424,882 54.8 62.2 58.4 243,264 243,197 477,461 51.3 58.4 54.8
White British 25,090 24,376 49,466 22.8 27.9 25.3 207,699
199,560 407,259 55.0 62.4 58.6 232,790 223,936 456,726 51.5 58.6 55.0
Irish 193 146 285 28.8 29.5 29.1 849
857 1,724 66.4 71.7 69.1 988 1,021 2,009 61.1 65.6 63.4
Traveller of Irish Heritage
30 36 66 13.3 19.4 16.1 27 31 58 33.3 22.61 27.6 57 67 124 22.8 20.9 21.8
Gypsy / Roma 109 84 193 5.5 7.1 6.2 188 158 346 5.9 13.9 9.5 297 242 593 5.7 11.6 8.3
Any other White background
1,290 1,278 2,568 34.5 39.5 37.0 7,842 7,653 15,495 49.0 56.7 52.8 9,132 8,931 18,063
47.0 54.3 50.6
Mixed 1,821 1,773 3,594 31.7 38.3 34.9 7,241 7,216 14,457 55.7 63.3 59.5 9,062 8,989 18,051 50.8 58.3 54.6
White and black 783 745 1,528 28.4 31.7 30.0 2,380 2,524 4,904 45.8 54.0 50.0 3,163 3,269 6,432 41.5 48.9 45.3

199
Caribbean
White and Black African
184 173 357 33.7 42.2 37.8 697 657 1,336 58.2 62.7 60.4 863 830 1,693 53.0 58.4 55.6
White and Asian 225 256 511 34.9 42.2 38.6 1,507 1,501 3,008 65.5 73.9 69.7 1,762 1,757 3,519 61.1 69.3 65.2
Any other mixed background
599 599 1,198 34.1 43.7 38.9 2,657 2,534 5,209 58.3 66.3 62.2 3,274 3,133 6,407 53.8 62.0 57.8
Asian 5,424 5,049 10,473 41.5 50.2 45.7 16,610 15,394 32,004 57.6 66.8 62.0 22034 20,443 42,477 53.6 62.7 58.0
Indian 708 640 1,348 51.0 59.5 55.0 6,101 5,654 11,755 69.6 77.0 73.2 6,809 6,294 13,103 67.7 75.2 71.3
Pakistani 2,617 2,461 5,078 36.6 44.8 40.6 5,739 5,474 11,213 49.3 56.8 53.0 8,356 7,935 16,291 45.3 53.1 49.1
Bangladeshi 1,507 1,455 2,962 46.8 54.0 50.3 1,175 1,763 3,538 51.6 61.6 56.6 3,282 3,218 6,500 49.4 58.1 53.7
Any other Asian background
592 493 1,085 37.8 54.4 45.3 2,995 2,503 5,498 52.6 69.0 60.1 3,587 2,996 6,583 50.2 66.6 57.6
Black 3,688 3,708 7,395 33.6 44.6 39.1 8,221 8,570 16,791 46.6 59.5 53.2 11,909 12,278 24,187 42.6 55.0 48.9
Black Caribbean 895 894 1,789 27.6 38.7 33.1 3,078 3,171 6,249 39.8 52.9 46.5 3,973 4,065 8,038 37.0 49.8 43.5
Black African 2,370 2,455 4,825 36.1 47.8 42.1 4,142 4,419 8,561 52.4 64.9 58.8 6,512 6, 874 13,386 46.4 58.8 52.8
Any other Black background
423 359 782 32.9 37.3 34.9 1,001 980 1,981 43.8 56.5 50.1 1,424 1,339 2,763 40.5 51.4 45.8
Chinese 109 106 215 60.6 76.4 68.4 1,003 1,018 2,021 70.6 80.9 75.8 1,112 1,124 2,236 69.6 80.5 75.1
Any other ethnic group
1,108 1,009 2,117 39.3 49.6 44.2 2,424 2,095 4,519 50.3 59.4 54.5 3,532 3,532 6,636 46.8 56.2 51.2

200
Appendix C: Templates for data collection tools
Information sheet for pupils A comparative study of the impact of multicultural policies and practices on the nature of the
teaching and learning process in multicultural secondary schools in Sri Lanka and England
Ms Wedikandage is a student from Sri Lanka who is studying for her PhD at the University of Bedfordshire. She is currently carrying out a study of multicultural education in secondary schools in Sri Lanka and England.
In schools this will involve her in questionnaires and interviews with pupils and staff. Questionnaires will take around 20 minutes to complete, and interviews 30 minutes.
All data that is collected will be confidential and anonymised to protect the names of schools and individuals.
You will be able to see her research thesis when it is complete. This will probably be in 2013.
Any queries about this research may be addressed to:
Professor Janice Wearmouth, email: [email protected], tel: 01234 793153
Dr Uvanney Maylor, email: [email protected], tel: 01234 793378
Thank you for your participation in this study.
Consent letter for pupils Ms Wedikandage is a student from Sri Lanka who is studying for her PhD at the University of Bedfordshire. She is currently carrying out a study of multicultural education in secondary schools in Sri Lanka and England. In schools this will involve her in questionnaires and interviews with head teachers or their deputies, pupils and staff. Questionnaires will take around 20 minutes to complete, and interviews 30 minutes. All data that is collected will be confidential and anonymised to protect the names of schools and individuals. Data will be held in password-protected electronic files and will be made available only to the supervisors, Professor Janice Wearmouth and Dr Uvanney Maylor. Participants in interviews will be informed that they can withdraw from the interview at any time without prejudice, or withdraw their interview transcript from the research project at any time up to the end of data collection. If you are willing to take part in this project please complete the proforma below.
...................................................... Name: Year group: Signature: Date: Any queries about this research may be addressed to: Professor Janice Wearmouth, email: [email protected], tel: 01234 793153 Dr Uvanney Maylor, email: [email protected], tel: 01234 793378
Thank you for your participation in this study.

201
Information sheet for parents and families A comparative study of the impact of multicultural policies and practices on the nature of the
teaching and learning process in multicultural secondary schools in Sri Lanka and England
Ms Wedikandage is a student from Sri Lanka who is studying for her PhD at the University of Bedfordshire. She is currently carrying out a study that aims to compare the impact of multicultural policies and practices on the nature of the teaching and learning process in multicultural secondary schools in Sri Lanka and England, in order to glean new insights that can lead to educational improvements. Specifically, she is examining policy and practice in teaching and learning processes in multicultural schools in both countries.
In schools this will involve her in questionnaires and interviews with pupils and staff. Questionnaires will take around 20 minutes to complete, and interviews 30 minutes.
All data that is collected will be confidential and anonymised to protect the names of schools and individuals.
The research thesis will be made available to the schools participating in the study. The anticipated date for completion of the project is 2013.
Any queries about this research may be addressed to:
Professor Janice Wearmouth, email: [email protected], tel: 01234 793153
Dr Uvanney Maylor, email: [email protected], tel: 01234 793378
Thank you for your child’s participation in this study.
Consent letter for parents and families Ms Wedikandage is a student from Sri Lanka who is studying for her PhD at the University of Bedfordshire. She is currently carrying out a study of multicultural education in secondary schools in Sri Lanka and England. In schools this will involve her in questionnaires and interviews with head teachers or their deputies, pupils and staff. Questionnaires will take around 20 minutes to complete, and interviews 30 minutes. All data that is collected will be confidential and anonymised to protect the names of schools and individuals. Data will be held in password-protected electronic files and will be made available only to the supervisors, Professor Janice Wearmouth and Dr Uvanney Maylor. Participants in interviews will be informed that they can withdraw from the interview at any time without prejudice, or withdraw their interview transcript from the research project at any time up to the end of data collection. If you would prefer your child not to take part in this project please complete the proforma below.
...................................................... Name: Child’s name: Signature: Date: Any queries about this research may be addressed to: Professor Janice Wearmouth, email: [email protected], tel: 01234 793153 Dr Uvanney Maylor, email: [email protected], tel: 01234 793378
Thank you for your participation in this study.

202
Template for student questionnaire Please answer the following questions:
1. Student Age:
2. Male/female:
3. What language(s) do you usually speak at home? ................................................
4. What language do you usually speak with your friends? ......................................
5. What languages can you read? ……………………………
……………………………
6. What language do you read best? …………………………..
7. If your first language is not English, which language do you feel most comfortable in for expressing complicated thoughts and ideas? ………………………….
8. Are you involved in school activities and/or sport teams?
Yes …….. No ………
If yes please give some examples …………………………………….
Now please answer the following by putting a tick in the relevant box:
Always Usually Rarely Never
9. Students of all ethnic backgrounds feel safe in this school
10. I feel comfortable talking about my own culture at school
11. There are signs and notices in my language around the school
12. Our school concerts and other special events include all the cultures in the school
13. Sometimes the school has special events to celebrate festivals that are important to particular ethnic groups
14. Important festivals and special days of all the ethnic groups in this school are celebrated.
15. All students know what is in our school’s antiracist policy.

203
16. Students in this school are allowed to wear traditional clothes and hairstyles that are important in their own cultures.
17. At lunch time all students are encouraged to eat their lunch together.
18. After lunch all students are encouraged to mix with other ethnic groups in their free time.
19. I feel very comfortable at this school.
20. School assemblies are often about different cultures and races.
21. Do your class textbooks talk about people from different backgrounds?
22. Do the text books in class talk about people from your background in a positive way?
23. Does the range of topics covered in your lessons help you to understand people from different backgrounds?
24. Do classroom displays include the work of students from different backgrounds?
25. Can you tell from the bulletin boards around the school that students in your school come from a range of different ethnic backgrounds?
26. Students often work with partners or in a peer tutoring relationship
27. Students often work in co-operative learning groups
28. The teacher knows some expressions in the languages used by different students
29. Classroom routines are clearly organised and responsibilities are shared out fairly between all students.
30. The teacher helps students to manage group work and share responsibilities
Yes No
31. When you first arrived at your school, did you feel very

204
welcome?
32. Are your religious festivals celebrated in your school?
33. Have you ever talked to a school counsellor?
34. If you have talked to a school counsellor, do you feel that she/he understood you as a person?
35. Have you ever complained to a teacher about being bullied because of your ethnic background?
36. If you have complained, was something done about it?
37. Do students from different backgrounds ever get into an argument or a fight?
38. If students from different backgrounds get into an argument or a fight do teachers sort it out fairly?
39. Does the school library have lots of books about people from different cultures?
40. Have you studied some of the history of your own culture?
41. Is any student in your school allowed to study any subject?
42. Is there anything else you would like to tell me about the way your school treats students’ ethnic backgrounds?
..........................................................................................................................................
..........................................................................................................................................
..........................................................................................................................................
..........................................................................................................................................
43. What is your ethnic group?
Choose one section from A to E, then tick one box to best describe your ethnic group or background
(A) White
English / Welsh / Scottish / Northern Irish / British
Irish
Gypsy or Irish Traveller

205
Any other White background, write in
……………………………………………
(B) Mixed / multiple ethnic groups
White and Black Caribbean
White and Black African
White and Asian
Any other Mixed/multiple ethnic backgrounds, write in
…………………………………………….
(c) Asian / Asian British
Indian
Pakistani
Bangladeshi
Chinese
Any other Asian background, write in
………………………………………….
(D) Black / African / Caribbean / Black British
African
Caribbean
Any other Black / African / Caribbean background,
write in
……………………………………………
(E) Other ethnic group
Arab
Any other ethnic group, write in
……………………………………..

206
44. What is your religious background?
Christian
Muslim
Hindu
Sikh
Jewish
Buddhist
Other religion
No religions
THANK YOU VERY MUCH FOR YOUR TIME. I APPRECIATE IT VERY MUCH.

207
Information sheet for head teachers and staff A comparative study of the impact of multicultural policies and practices on the nature of the
teaching and learning process in multicultural secondary schools in Sri Lanka and England Ms Wedikandage is a student from Sri Lanka who is studying for her PhD at the University of Bedfordshire. She is currently carrying out a study that aims to compare the impact of multicultural policies and practices on the nature of the teaching and learning process in multicultural secondary schools in Sri Lanka and England, in order to glean new insights that can lead to educational improvements. Specifically, she is examining policy and practice in teaching and learning processes in multicultural schools in both countries. In schools this will involve her in questionnaires and interviews with the head teacher or his/her deputy, teachers, students from Years 9-13 and members of staff involved in links between schools and minority ethnic communities. The template for questionnaires and the interview schedule will be sent to schools in advance of data collection. Questionnaires will take around 20 minutes to complete, and interviews 30 minutes. All data that is collected will be confidential and anonymised to protect the names of schools and individuals. It will be made available only to Ms Wedikandage’s supervisors, will be kept in a password-protected electronic file, and will be destroyed at the end of the research project, that is when the thesis has been completed. The research thesis will be made available to the schools participating in the study. The anticipated date for completion of the project is 2013. Any queries about this research may be addressed to: Professor Janice Wearmouth, email: [email protected], tel: 01234 793153 Dr Uvanney Maylor, email: [email protected], tel: 01234 793378
Thank you for your participation in this study.
Consent letter for head teachers and staff
Ms Wedikandage is a student from Sri Lanka who is studying for her PhD at the University of Bedfordshire. She is currently carrying out a study of multicultural education in secondary schools in Sri Lanka and England. In schools this will involve her in questionnaires and interviews with head teachers or their deputies, pupils and staff. Questionnaires will take around 20 minutes to complete, and interviews 30 minutes. All data that is collected will be confidential and anonymised to protect the names of schools and individuals. Data will be held in password-protected electronic files and will be made available only to the supervisors, Professor Janice Wearmouth and Dr Uvanney Maylor. Participants in interviews will be informed that they can withdraw from the interview at any time without prejudice, or withdraw their interview transcript from the research project at any time up to the end of data collection. If you agree to take part in this project please complete the proforma below.
...................................................... Name: Role in the school: Signature: Date: Any queries about this research may be addressed to: Professor Janice Wearmouth, email: [email protected], tel: 01234 793153 Dr Uvanney Maylor, email: [email protected], tel: 01234 793378
Thank you for your participation in this study.

208
Template for teacher questionnaire 1. Background information
a. What is your age range?
20 -30
31 – 50
50+
b. What is your highest qualification?
……………………………………………………………………………………………………………………………………………………………………………………
c. Number of years of teaching experience?
…………………………………………………………………………………………
d. Which year groups do you teach?
…………………………………………………………………………………………..
e. Which minority ethnic groups of students do you have in your own classrooms?
……………………………………………………………………………………………………………………………………………………………………………………
Now please answer the following by putting a tick in the relevant box:
Strongly
agree
Agree
somewhat
Disagree
somewhat
Strongly
Disagree
1. This school should offer multicultural education.
2. It is very important to make a special effort to raise the achievement of students from minority ethnic backgrounds
3. I expect students of all ethnic backgrounds to behave well
4. Teachers should make a special effort for students with learning difficulties
5. Teacher should respect the cultural, racial and ethnic differences of their students

209
6. Teachers should be aware of the ethnic and cultural backgrounds of all students in their classrooms
7. It is important to understand that body language and speech mean different things in different cultures
8. It is possible to plan lessons and choose resources with different languages of the various student groups in mind
9. Every student feels valued in my classroom
10. There is a planned programme of induction and orientation for all students and parents in this school
11. There is a variety of extra curricular activities that are designed specifically for minority ethnic groups
12. Rules and regulations of the school are designed to take account of cultural differences
13. The school monitors the progress of all groups of students by ethnicity
14. The school takes appropriate action when a specific group of students appears to be having social or academic difficulty
15. The school provides counselling services related to students’ academic needs
16. The school provides counselling services related to students’ social needs
17.Counsellors serving in that capacity have the knowledge and skills required for effective cross-cultural counselling
18.Teachers have the knowledge and skills required for effective cross-cultural counselling
19. There is a procedure for conflict mediation when students experience ethnic or cultural harassment in the school or beyond

210
20. The school has established mutually supportive relationships with community groups and agencies
21. There is a peer mediation programme in the school
22. There is in the schools’ professional library a good collection of multicultural materials
23. Teachers prefer to teach students of the same background as themselves
24. Do you have opportunity to participate in workshops for multicultural education?
Sometimes Occasionally Never
25. What kind of personal experiences have affected your perception of teaching culturally diverse students?
………………………………………………………………………………………………………………………………………………………………………………………………………………………………………………………………………………………………………………………………………………………………………………………………………………………………
26. What do you perceive as the challenges of multicultural education?
………………………………………………………………………………………………………………………………………………………………………………………………………………………………………………………………………………………………………………………………………………………………………….
27. What recommendations would you suggest to teacher education programmes or teacher training to prepare teachers to teach culturally diverse students?
…………………………………………………………………………………………………………………………………………………………………………………………………………………………………………………………………………………………………………………………………………………………………………
28. Is there anything specific to your own subject area that you wish to explain here in relation to multiculturalism in your school?
…………………………………………………………………………………………………………………………………………………………………………………………………………………………………………………………………………………………………………………………………………………………………………

211
29. What is your ethnic group?
Choose one section from A to E, then tick one box to best describe your ethnic group or background
(A) White
English / Welsh / Scottish / Northern Irish / British
Irish
Gypsy or Irish Traveller
Any other White background, write in
……………………………………………
(B) Mixed / multiple ethnic groups
White and Black Caribbean
White and Black African
White and Asian
Any other Mixed/multiple ethnic background, write in
…………………………………………….
(c) Asian / Asian British
Indian
Pakistani
Bangladeshi
Chinese
Any other Asian background, write in
……………………………………….
(D) Black / African / Caribbean / Black British
African

212
Caribbean
Any other Black / African / Caribbean background,
write in
……………………………………………
(E) Other ethnic group
Arab
Any other ethnic group, write in
……………………………………..
30. What is your religious background?
Christian
Muslim
Hindu
Sikh
Jewish
Buddhist
Other religion
No religions
THANK YOU VERY MUCH FOR YOUR TIME. I APPRECIATE IT VERY MUCH.

213
Topic items mapped against questions in teacher and student questionnaires
Table 4.8: Topic areas in questionnaires in relation to question items Criteria Student Questionnaire Teacher Questionnaire Principal/Head
teacher interview schedule
Question Numbers Personal information
1,2,43,44 a, b,c,d,e,f,29,30
Cultural differences
10,12,17,18,20,21,22,23,24,25,32,40
2,5,6,7, 1,4
Teacher 28,30 8,9,23,25,28 Languages 3,4,5,6,7 6,7,8,9,12 Customs 13,14,16,39 22 Extra/Co-curricular activities
8 11,
Policy 15 1,12,13,14,20 3,5,11,13,14,15 Issues 9,11,19,26,27,31,34,35,36,
37,38,41 19,21,24,26 2,
Suggestions 26,27, Support for individual difference
33 3,4,15,16,17, 10
School routines 29 10, 16 Other 42 24,25

214
Head Teachers’/Principals’ Interview Schedule 1. What different minority ethnic groups do you have among the students at your school? Do you
monitor student performance by ethnic group? 2. What do you see as the main issues and needs of minority ethnic students living in your area?
Do you do anything in particular to raise the achievement of minority ethnic students? 3. What are the principles driving your multicultural policy in this school? 4. How does your school promote inter-racial understanding among school staff and the different
ethnic student groups? 5. Are parents, relatives and friends of minority ethnic pupils involved in the work of school? If
so, how? 6. Do you encourage the use of minority ethnic languages in your school? If so, how do you do it? 7. When announcements are made in the school, for example in assemblies, which language are
they made in? 8. Which languages are signs, posters and notices written in around in the school? 9. Is there any form of planned programme for students to learn English as an additional
language? 10. How do you assess students with special needs who do not speak English well? 11. Do you have any classroom policy about including material and activities from all the cultural
backgrounds of your students? 12. Is communication with students’ families and friends who do not speak English an issue for
the school? If so, how do you deal with it? 13. Do you think it is important for minority ethnic community groups and/or their leaders to be
involved in this school? If so, why? What can they do? 14. Do you ever have any incidents of bullying or abuse you think might be racial? If so how you
do deal with racist behaviour? 15. Do you have a policy for dealing with racist incidents or discriminatory behaviour? 16. Is there anything else you can tell me about multi-cultural work in this school?
THANK YOU VERY MUCH FOR YOUR TIME. I APPRECIATE IT VERY MUCH.

215
Policy Makers Interview Schedule 1) What do you think about the claim that education is an effective doorway for assimilation into mainstream society for people from diverse cultural heritages, ethnic groups, social classes and points of origin?
2) Should the curriculum reflect the different backgrounds of minority ethnic students in England / Sri Lanka?
3) Should schools provide for the teaching of minority languages within the normal school curriculum?
4) Would you expect school text books to reflect multicultural society?
Should they recognize cultural diversity?
Should they value this diversity?
Should they show ‘other’ religions, languages, lifestyles as valuable?
5) Should text books show equal regard for and acceptance of different ethnic?
6) Do you think that minority groups have a right to see their cultures positively and prominently represented in the curriculum?
7) How can policy makers work to change people’s stereotypical attitudes towards people of the other backgrounds by using the school curriculum?
Do you do this?
8) Is it government policy that school curricula should help students to understand other people around the world?
9) Do you have a policy for assessing children in languages other than English if English is not their first language?
If so, what is it?
10) What national policies have been initiated to respond to the increasing level of cultural diversity in school?
11) What / Who have been the driving forces behind these initiatives?
What results have been observed, if any?
12) Please describe the process for to designing policies concerning the integration of immigrant students / minority students into school?
13) Is your Local Authority involved in designed your multicultural policy?
14) What role does each person have?
15) How is the policy put in to operation?
16) What is national policy and practice on the education of immigrant children? If this the policy and practice same in the Local Authority? Please describe it?

216
Affordances of interview and questionnaire techniques
Table 4.9: Summary of affordances of interview and questionnaire techniques (Source:
Tuckman 1972 cited by Cohen et al, 2007, p.352)
Consideration Interview Questionnaire
Personal need to collect data Requires interviewers Requires a secretary
Major expense Payment to interviewers Postage and printing
Opportunities for response-
keying (personalization)
Extensive Limited
Opportunities for asking Extensive Limited
Opportunities for probing Possible Difficult
Relative magnitude of data
reduction
Great (because of coding) Mainly limited to rostering
Typically, the number of
respondents who can reached
Limited Extensive
Rate of return Good Poor
Sources of error Interviewer, instrument,
coding, simple
Limited to instrument and
sample
Overall reliability Quite limited Fair
Emphasis on writing skill Limited Extensive
Pilot study student and teacher samples Table 4.10: Pilot student sample by year of study
Year Group England Sri Lanka Year 13 3 3 Year 12 2 2 Total 5 5
Table 4.11: Pilot student sample by gender
Gender England Sri Lanka Mail 2 2 Female 3 3 Total 5 5

217
Changes to student questionnaire following pilot study
Table 4.12: Summary of changes for main study student questionnaire
Pilot questionnaire items Main study questionnaire Reasons for changing
8. What do you like the most
about school?
Deleted No suitable answer. Therefore
this question asked from
students’ focus group
interview.
16. Our school has anti-racist
policy.
Deleted Students did not understand
properly.
32. Classroom routines are
predictable and explicit.
33. There is a rota for
classroom routines and
responsibilities.
29. Classroom routines are
clearly organised and
responsibilities are shared out
fairly between all students.
Question 32 and 33 combined
and made one question
concerning students answer.

218
Teacher sample in pilot study Table 4.14: Subject specialisms of teachers
Subject England Sri Lanka Mathematics 2 1 Science 1 English 1 Total 2 3
Changes to teacher questionnaire following pilot study Table 4.15: Summary of changes for main study questionnaires
Pilot questionnaire items Main study questionnaire Reasons for changing No item a. What is your age range?
This item adds to the main questionnaire to compare age range and the teacher attitudes.
No item c. Which subject(s) do you teach?
This item adds to the main questionnaire to know about teacher background.
No item
28. Is there anything specific to your own subject area that you wish to explain here in relation to multiculturalism in your school?

219
Ethical approval letter

220
Appendix D: Statistical analysis of students’ data in five schools in
Sri Lanka
Table 1: Ethnic background of students Type of school
Ethnic background
Sinhala Muslim Tamil Burgher Malay Total No. % No. % No. % No. % No. % No. %
Mixed School
31 46.9 26 39.3 8 12.1 0 0 1 1.5 66 100
Girls’ School 1
28 41.8 28 41.8 7 10.4 2 3.0 2 3.0 67 100
Girls’ School 2
25 39.7 27 42.9 7 11.1 2 3.2 2 3.2 63 100
Boys’ School 1
30 47.6 21 33.3 10 15.2 2 3.2 0 0 63 100
Boys’ School 2
29 46.8 24 38.7 8 12.9 0 0 1 1.6 62 100
Total 143 44.5 126 39.3 40 12.5 6 1.9 6 1.6 321 100
Table 2: Religious backgrounds of students Type of school
Religious background
Buddhist Islam Hindu Christian Total No. % No. % No. % No. % No. %
Mixed School
24 36.4 27 40.9 5 7.6 10 15.2 66 100
Girls’ School 1
22 32.8 30 44.8 7 10.4 8 11.8 67 100
Girls’ School 2
19 30.2 29 46.0 7 11.1 8 12.7 63 100
Boys’ School 1
30 47.6 21 33.3 9 14.3 3 4.8 63 100
Boys’ School 2
22 35.5 25 40.3 6 9.7 9 14.5 62 100
Total 117 36.4 123 41.1 34 10.6 38 11.8 321 100
Table 3: Student sample by gender
Ethnic group Male Female Total No. % No. % No. %
Sinhala 77 53.8 66 46.2 143 100 Muslim 61 48.4 65 51.6 126 100 Tamil 21 52.5 19 47.5 40 100 Burgher 2 33.3 4 66.7 6 100 Malay 2 33.3 4 66.7 6 100 Total 163 50.8 158 49.2 321 100

221
Table 4: Age of student sample
Years Sinhala Muslim Tamil Burgher Malay Total No. % No. % No. % No. % No. % No. %
12 Years 22 15.4 18 14.3 6 15.0 3 50.0 1 16.7 50 15.6 13 Years 20 14.0 19 15.1 10 25.0 0 0 0 0 49 15.3 14 Years 19 13.3 20 15.9 7 17.5 0 0 2 33.3 48 15.0 15 Years 23 16.1 19 15.1 5 12.5 2 33.3 1 16.7 50 15.6 16 Years 25 17.5 21 16.7 4 10.0 0 0 0 0 50 15.6 17 Years 18 12.6 14 11.1 5 12.5 1 16.7 0 0 38 11.8 18 Years 16 11.2 15 11.9 3 7.5 0 0 2 33.3 36 11.2 Total 143 100 126 100 40 100 6 100 6 100 321 100
Table 5: Languages students usually spoken at home
Languages Sinhala Muslim Tamil Burgher Malay Total No. % No. % No. % No. % No. % No. %
Sinhala 131 91.6 22 17.5 13 32.5 3 50.0 0 0 169 52.6 Tamil 1 0.7 43 34.1 9 22.5 0 0 0 0 53 16.5 Sinhala and Tamil
4 2.8 47 37.3 14 35.0 0 0 1 16.7 66 20.6
Sinhala, Tamil and English
1 0.7 5 4.0 1 2.5 0 0 0 0 7 2.2
Sinhala and English
6 4.2 5 4.0 1 2.5 3 50.0 0 0 15 4.7
Tamil and English
0 0 4 3.2 2 5.0 0 0 0 0 6 1.9
Sinhala, Tamil, English and Malay
0 0 0 0 0 0 0 0 5 83.3 5 1.6
Total 143 100 126 100 40 100 6 100 6 100 321 100

222
Table 5a: Comparison of numbers of students who spoke the other national language at home
r × c Contingency Table: Results
The results of a contingency table X2 statistical test performed at 09:57 on 9-JAN-2014
data: contingency table A (Sinhala) B (Muslim) C (Tamil) 1 1 22 13 36 speaking other national language 2 131 43 9 183 speaking own national language 3 4 47 14 65 speaking both national languages 136 112 36 284 expected: contingency table A B C 1 17.2 14.2 4.56 speaking other national language 2 87.6 72.2 23.2 speaking own national language 3 31.1 25.6 8.24 speaking both national languages
chi-square = 123. degrees of freedom = 4 probability = 0.000

223
Table 5b: Comparison of numbers of students of Muslim and Tamils who spoke the other national language at home
r × c Contingency Table: Results
The results of a contingency table X2 statistical test performed at 03:57 on 17-JAN-2014
data: contingency table A (Muslim) B (Tamil) 1 22 13 35 speaking other national language 2 43 9 52 speaking own national language 3 47 14 61 speaking both national languages 112 36 148 expected: contingency table A B 1 26.5 8.51 speaking other national language 2 39.4 12.6 speaking own national language 3 46.2 14.8 speaking both national languages
chi-square = 4.58 degrees of freedom = 2 probability = 0.101
Table 6: Language(s) students spoke with friends
Languages Sinhala Muslim Tamil Burgher Malay Total No. % No. % No. % No. % No. % No. %
Sinhala 123 86.0 80 63.5 27 67.5 4 66.7 3 50.0 237 73.8 Tamil 1 0.7 17 13.5 4 10.0 0 0 0 0 22 6.9 Sinhala and Tamil
16 11.2 25 19.8 6 15.0 0 0 2 33.3 49 15.3
Sinhala and English
3 2.1 1 2.4 2 5.0 2 33.3 0 0 8 2.5
Tamil and English
0 0 0 0 1 2.5 0 0 0 0 1 0.3
Sinhala, Tamil and English
0 0 3 2.4 0 0 0 0 1 16.7 4 1.2
Total 143 100 126 100 40 100 6 100 6 100 321 100

224
Table 6a: Comparison of numbers of students who spoke the other national language with friends at school
r × c Contingency Table: Results
The results of a contingency table X2 statistical test performed at 04:16 on 13-JAN-2014
data: contingency table A (Sinhala) B (Muslim) C (Tamil) 1 1 80 27 108 speaking other national language 2 123 17 4 144 speaking own national language 3 16 25 6 47 speaking both national language 140 122 37 299 expected: contingency table A B C 1 50.6 44.1 13.4 speaking other national language 2 67.4 58.8 17.8 speaking own national language 3 22.0 19.2 5.82 speaking both national language
chi-square = 181. degrees of freedom = 4 probability = 0.000
Table 7: Languages students could read
Languages Sinhala Muslim Tamil Burgher Malay Total No. % No. % No. % No. % No. % No. %
Sinhala 37 25.9 8 6.3 5 12.5 1 16.7 0 0 51 15.9 Tamil 0 0 1 0.8 1 2.5 0 0 0 0 2 0.6 Sinhala and Tamil
13 9.1 14 11.1 6 15.0 0 0 0 0 33 10.3
Sinhala, Tamil and English
26 18.2 68 54.0 19 47.5 1 16.7 5 83.3 119 37.1
Sinhala and English
67 46.9 33 26.2 6 15.0 4 66.7 1 16.7 111 34.6
Tamil and English
0 0 0 0 1 2.5 0 0 0 0 1 0.3
Sinhala and Malay
0 0 1 0.8 0 0 0 0 0 0 1 0.3
No answer 0 0 1 0.8 2 5.0 0 0 0 0 3 0.9 Total 143 100 126 100 40 100 6 100 6 100 321 100

225
Table 8: Language(s) students could read best
Languages Sinhala Muslim Tamil Burgher Malay Total No. % No. % No. % No. % No. % No. %
Sinhala 140 97.9 111 88.1 34 85.5 4 66.7 6 100 295 91.9 Tamil 2 1.4 3 2.4 1 2.5 0 0 0 0 6 1.9 English 0 0 6 4.8 2 5.0 2 33.3 0 0 10 3.1 English and Sinhala
1 0.7 3 2.4 0 0 0 0 0 0 4 1.2
Tamil and English
0 0 1 0.8 0 0 0 0 0 0 1 0.3
No answer 0 0 2 1.6 3 7.5 0 0 0 0 5 1.6 Total 143 100 126 100 40 100 6 100 6 100 321 100
Table 8a: Comparison of numbers of students who read the other national language best
r × c Contingency Table: Results
The results of a contingency table X2 statistical test performed at 10:02 on 9-JAN-2014
A (Sinhala) B (Muslim) C (Tamil) 1 2 111 34 147 reading other national language 2 140 3 1 144 reading own national language 3 1 3 0 4 reading both national language 143 117 35 295 expected: contingency table A B C 1 71.3 58.3 17.4 reading other national language 2 69.8 57.1 17.1 reading own national language 3 1.94 1.59 0.475 reading both national language chi-square = 270. degrees of freedom = 4 probability = 0.000

226
Table 9: Language students felt most comfortable in for expressing complicated thoughts and ideas where first language was not Sinhala
Languages Sinhala Muslim Tamil Burgher Malay Total No. % No. % No. % No. % No. % No. %
Sinhala 0 0 27 21.4 14 35.0 2 33.3 1 16.7 44 13.7 Tamil 0 0 82 65.1 21 52.5 0 0 2 33.3 105 32.7 English 0 0 5 4.0 2 5.0 3 50.0 0 0 11 3.4 Sinhala and Tamil
0 0 2 1.6 0 0 0 0 2 33.3 4 1.2
Malay 0 0 2 1.6 0 0 1 16.7 1 16.7 4 1.2 Not applicable
143 100 0 0 0 0 0 0 0 0 143 44.5
No answer 0 0 8 6.3 3 7.5 0 0 0 0 11 3.3 Total 143 100 126 100 40 100 6 100 6 100 321 100
Table 10: Perceptions that the teacher knows some expressions in the languages used by different students
Ethnic group
Always Usually Rarely Never No answer Total No. % No. % No. % No. % No. % No. %
Sinhala 64 44.8 71 49.7 4 2.8 3 2.1 1 0.7 143 100 Muslim 57 45.2 62 49.2 3 2.4 3 2.4 1 0.8 126 100 Tamil 20 50.0 16 40.0 4 10.0 0 0 0 0 40 100 Burgher 2 33.3 4 66.7 0 0 0 0 0 0 6 100 Malay 2 33.3 4 66.7 0 0 0 0 0 0 6 100 Total 145 45.2 157 48.9 11 3.4 6 1.9 2 0.6 321 100
Table 11: Perceptions that all students know what is in the school’s antiracist policy
Ethnic group
Always Usually Rarely Never No answer Total No. % No. % No. % No. % No. % No. %
Sinhala 70 49.0 64 48.4 9 6.3 0 0 0 0 143 100 Muslim 38 30.2 77 61.7 6 4.8 5 4.0 0 0 126 100 Tamil 14 35.0 23 57.5 1 2.5 0 0 2 5.0 40 100 Burgher 0 0 6 100 0 0 0 0 0 0 6 100 Malay 1 16.7 5 83.3 0 0 0 0 0 0 6 100 Total 123 38.3 175 54.5 16 5.0 5 1.6 2 0.6 321 100

227
Table 11a: Perceptions that all students know what is in the school’s antiracist policy
r × c Contingency Table: Results
The results of a contingency table X2 statistical test performed at 06:17 on 13-JAN-2014
data: contingency table
A (always) B (usually-never) A B 1 70 73 143 Sinhala 2 38 90 128 Muslim 3 14 24 38 Tamil 122 187 309 expected: contingency table A B 1 56.5 86.5 Sinhala 2 50.5 77.5 Muslim 3 15.0 23.0 Tamil chi-square = 10.6 degrees of freedom = 2 probability = 0.005
Table 11b: Perceptions that all students know what is in the school’s antiracist policy (Sinhala and Muslim)
r × c Contingency Table: Results The results of a contingency table X2 statistical test performed at 05:49 on 13-FEB-2014 data: contingency table A (always) B (usually-never) A B 1 70 73 143 Sinhala 2 38 90 128 Muslim 108 163 271 expected: contingency table A B 1 57.0 86.0 Sinhala 2 51.0 77.0 Muslim chi-square = 10.5 degrees of freedom = 1 probability = 0.001

228
Table 11c: Perceptions that all students know what is in the school’s antiracist policy (Sinhala and Tamil)
r × c Contingency Table: Results
The results of a contingency table X2 statistical test performed at 05:52 on 13-FEB-2014
data: contingency table
A (always) B (usually-never) A B 1 70 73 143 Sinhala 2 14 24 38 Tamil 84 97 181 expected: contingency table A B 1 66.4 76.6 Sinhala 2 17.6 20.4 Tamil chi-square = 1.77 degrees of freedom = 1 probability = 0.183
Table 12: Proportions of signs and notices in students’ language by ethnicity
Ethnic group
Always Usually Rarely Never No answer Total No. % No. % No. % No. % No. % No. %
Sinhala 95 66.4 44 30.8 2 1.4 2 1.4 0 0 143 100 Muslim 41 32.5 37 29.4 32 25.4 15 11.9 1 0.9 126 100 Tamil 18 45.0 10 25.0 8 20.0 2 5.0 2 5.0 40 100 Burgher 3 50.0 1 16.7 2 33.3 0 0 0 0 6 100 Malay 1 16.7 3 50.0 2 33.3 0 0 0 0 6 100 Total 158 49.2 95 29.6 46 14.3 19 5.9 3 0.9 321 100

229
Table 12a: Proportions of signs and notices in students’ language
r × c Contingency Table: Results
The results of a contingency table X2 statistical test performed at 05:06 on 13-JAN-2014
data: contingency table A (always) B (usually-never) A B 1 95 48 143 Sinhala 2 41 84 125 Muslim 3 18 20 38 Tamil 154 152 306 expected: contingency table A B 1 72.0 71.0 Sinhala 2 62.9 62.1 Muslim 3 19.1 18.9 Tamil
chi-square = 30.3 degrees of freedom = 2 probability = 0.000
Table 13: Perceptions by ethnicity that school concerts and other special events include all the cultures
Ethnic group
Always Usually Rarely Never No answer Total No. % No. % No. % No. % No. % No. %
Sinhala 80 55.9 52 36.4 4 2.8 4 2.8 0 0 143 100 Muslim 46 36.5 47 37.3 29 23.0 1 0.8 3 2.4 126 100 Tamil 19 47.5 10 25.0 8 20.0 1 2.5 2 5.0 40 100 Burgher 2 33.3 3 50.0 1 16.7 0 0 0 0 6 100 Malay 3 50.0 3 50.0 0 0 0 0 0 0 6 100 Total 150 46.7 115 35.8 42 13.1 6 1.9 5 2.5 321 100
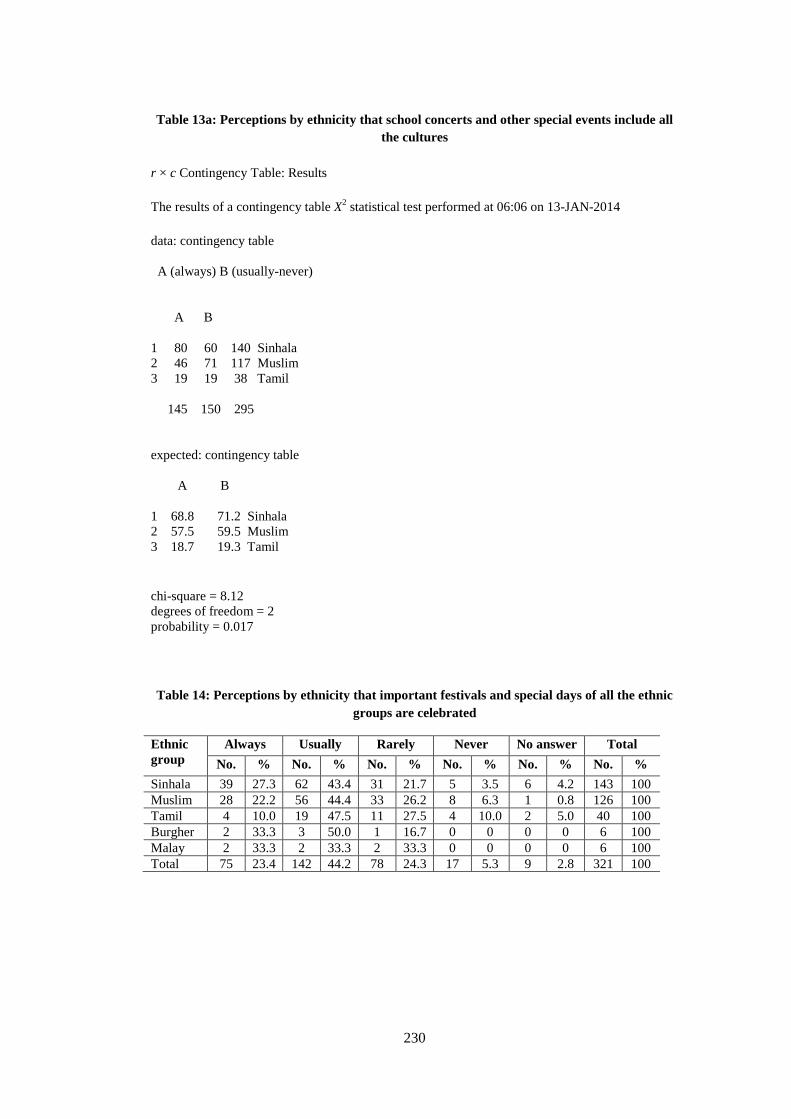
230
Table 13a: Perceptions by ethnicity that school concerts and other special events include all the cultures
r × c Contingency Table: Results
The results of a contingency table X2 statistical test performed at 06:06 on 13-JAN-2014
data: contingency table A (always) B (usually-never) A B 1 80 60 140 Sinhala 2 46 71 117 Muslim 3 19 19 38 Tamil 145 150 295 expected: contingency table A B 1 68.8 71.2 Sinhala 2 57.5 59.5 Muslim 3 18.7 19.3 Tamil
chi-square = 8.12 degrees of freedom = 2 probability = 0.017
Table 14: Perceptions by ethnicity that important festivals and special days of all the ethnic groups are celebrated
Ethnic group
Always Usually Rarely Never No answer Total No. % No. % No. % No. % No. % No. %
Sinhala 39 27.3 62 43.4 31 21.7 5 3.5 6 4.2 143 100 Muslim 28 22.2 56 44.4 33 26.2 8 6.3 1 0.8 126 100 Tamil 4 10.0 19 47.5 11 27.5 4 10.0 2 5.0 40 100 Burgher 2 33.3 3 50.0 1 16.7 0 0 0 0 6 100 Malay 2 33.3 2 33.3 2 33.3 0 0 0 0 6 100 Total 75 23.4 142 44.2 78 24.3 17 5.3 9 2.8 321 100

231
Table 14a: Perceptions by ethnicities that important festivals and special days of all the ethnic groups are celebrated
r × c Contingency Table: Results
The results of a contingency table X2 statistical test performed at 06:14 on 13-JAN-2014
data: contingency table A (always) B (usually-never) A B 1 39 98 137 Sinhala 2 28 97 125 Muslim 3 4 34 38 Tamil 71 229 300 expected: contingency table A B 1 32.4 105. Sinhala 2 29.6 95.4 Muslim 3 8.99 29.0 Tamil
chi-square = 5.49 degrees of freedom = 2 probability = 0.064
Table 15: Perceptions by ethnicity of religious festivals celebrated
Ethnic group
Yes No No answer Total No. % No. % No. % No. %
Sinhala 125 87.4 18 12.6 0 0 143 100 Muslim 28 22.2 98 77.8 0 0 126 100 Tamil 8 20.0 32 80.0 0 0 40 100 Burgher 3 50.0 3 50.0 0 0 6 100 Malay 1 16.7 5 83.3 0 0 6 100 Total 165 51.4 156 48.6 0 0 321 100

232
Table 15a: Perceptions by ethnicity of religious festivals celebrated
r × c Contingency Table: Results
The results of a contingency table X2 statistical test performed at 07:27 on 13-JAN-2014
data: contingency table A (yes) B (no) A B 1 125 18 143 Sinhala 2 28 98 126 Muslim 3 8 32 40 Tamil 161 148 309 expected: contingency table A B 1 74.5 68.5 Sinhala 2 65.7 60.3 Muslim 3 20.8 19.2 Tamil
chi-square = 133. degrees of freedom = 2 probability = 0.000
Table16: Perceptions by ethnicity that students in the school are allowed to wear traditional clothes and hairstyles that are important in their own culture
Ethnic group
Always Usually Rarely Never No answer Total No. % No. % No. % No. % No. % No. %
Sinhala 71 49.7 46 32.2 17 11.9 8 5.6 1 0.7 143 100 Muslim 55 43.7 43 34.1 20 15.9 7 5.6 1 0.8 126 100 Tamil 20 50.0 14 35.0 3 7.5 2 5.0 1 2.5 40 100 Burgher 3 50.0 2 33.3 1 16.7 0 0 0 0 6 100 Malay 3 50.0 2 33.3 1 16.7 0 0 0 0 6 100 Total 152 47.4 107 33.3 42 13.1 17 5.3 3 0.9 321 100

233
Table 17: Perceptions by ethnicity that school assemblies are often about different cultures and races
Ethnic group
Always Usually Rarely Never No answer Total No. % No. % No. % No. % No. % No. %
Sinhala 53 37.1 72 50.3 13 9.1 5 3.5 0 0 143 100 Muslim 25 19.8 49 38.9 36 28.6 15 11.9 1 0.8 126 100 Tamil 15 37.5 18 45.0 4 10.0 3 7.5 0 0 40 100 Burgher 1 16.7 5 83.3 0 0 0 0 0 0 6 100 Malay 2 33.3 2 33.3 2 33.3 0 0 0 0 6 100 Total 96 29.9 146 45.5 55 17.1 23 7.2 1 0.3 321 100
Table 17a: Perceptions by ethnicity that school assemblies are often about different cultures and races
r × c Contingency Table: Results
The results of a contingency table X2 statistical test performed at 06:30 on 13-JAN-2014
data: contingency table A (always) B (usually-never) A B 1 53 90 143 Sinhala 2 25 100 125 Muslim 3 15 25 40 Tamil 93 215 308 expected: contingency table A B 1 43.2 99.8 Sinhala 2 37.7 87.3 Muslim 3 12.1 27.9 Tamil
chi-square = 10.4 degrees of freedom = 2 probability = 0.006

234
Table 18: Proportions of students who studied some of the history of their own culture
Ethnic group Yes No Total No. % No. % No. %
Sinhala 137 95.8 6 4.2 143 100 Muslim 123 97.6 3 2.4 126 100 Tamil 39 97.5 1 2.5 40 100 Burgher 6 100 0 0 6 100 Malay 5 83.3 1 16.7 6 100 Total 310 96.6 11 3.4 321 100
Table 19: Perceptions that the school library has lots of books about people from different cultures
Ethnic group Yes No Total No. % No. % No. %
Sinhala 139 97.2 4 2.8 143 100 Muslim 109 86.5 17 13.5 126 100 Tamil 37 92.5 3 7.5 40 100 Burgher 6 100 0 0 6 100 Malay 3 50.0 3 50.0 3 100 Total 294 91.6 27 8.4 321 100
Table 19a: Perceptions that the school library has lots of books about people from different cultures (Sinhala and Tamil)
r × c Contingency Table: Results
The results of a contingency table X2 statistical test performed at 08:56 on 22-JAN-2014
data: contingency table A B 1 139 4 143 Sinhala 2 109 17 126 Muslim 248 21 269 expected: contingency table A B 1 132. 11.2 Sinhala 2 116. 9.84 Muslim
chi-square = 10.6 degrees of freedom = 1 probability = 0.001

235
Table 20: Perceptions by ethnicity that students feel very comfortable at this school
Ethnic group
Always Usually Rarely Never No answer Total No. % No. % No. % No. % No. % No. %
Sinhala 71 49.7 66 46.2 4 2.8 0 0 2 1.4 143 100 Muslim 61 48.4 54 42.9 9 7.1 2 1.6 0 0 126 100 Tamil 27 67.5 12 30.0 1 2.5 0 0 0 0 40 100 Burgher 3 50.0 3 50.0 0 0 0 0 0 0 6 100 Malay 3 50.0 3 50.0 0 0 0 0 0 0 6 100 Total 165 51.4 138 43.0 14 4.4 2 0.6 2 0.6 321 100
Table 21: Students’ feelings of comfort in talking about their own culture by ethnicity in the five schools
Ethnic group
Always Usually Rarely Never No answer Total No. % No. % No. % No. % No. % No. %
Sinhala 109 76.2 32 22.4 0 0 0 0 2 1.4 143 100 Muslim 56 44.4 53 42.1 16 12.7 1 0.8 0 0 126 100 Tamil 20 50.0 15 37.5 3 7.5 1 2.5 1 2.5 40 100 Burgher 4 66.7 2 33.3 0 0 0 0 0 0 6 100 Malay 1 16.7 5 83.3 0 0 0 0 0 0 6 100 Total 190 59.2 107 33.3 19 5.9 2 0.6 3 0.9 321 100
Table 21a: Students’ feelings of comfort in talking about their own ethnicity
r × c Contingency Table: Results
The results of a contingency table X2 statistical test performed at 04:46 on 13-JAN-2014
data: contingency table A (always) B (usually-never) 1 109 32 141 Sinhala 2 56 70 126 Muslim 3 20 19 39 Tamil 185 121 306 expected: contingency table A B 1 85.2 55.8 Sinhala 2 76.2 49.8 Muslim 3 23.6 15.4 Tamil
chi-square = 31.6 degrees of freedom = 2 probability = 0.000

236
Table 22: Students’ feelings of safety in school by ethnicity (Five schools)
Ethnic group
Always Usually Rarely Never No answer Total No. % No. % No. % No. % No. % No. %
Sinhala 101 70.6 40 20.8 0 0 0 0 2 1.4 143 100 Muslim 74 58.7 52 41.3 0 0 0 0 0 0 126 100 Tamil 31 77.5 6 15.0 0 0 1 2.5 2 5.0 40 100 Burgher 3 50.0 3 50.0 0 0 0 0 0 0 6 100 Malay 5 83.3 1 16.7 0 0 0 0 0 0 6 100 Total 214 66.7 102 31.8 0 0 1 0.3 4 1.2 321 100
Table 23: Proportions of students who complained to a teacher about being bullied because of ethnic background
Ethnic group
Yes No No answer Total No. % No. % No. % No. %
Sinhala 21 14.7 120 83.9 2 1.4 143 100 Muslim 27 21.4 99 78.6 0 0 126 100 Tamil 9 22.5 31 77.5 0 0 40 100 Burgher 1 16.7 5 83.3 0 0 6 100 Malay 0 0 6 100 0 0 6 100 Total 58 18.1 261 81.3 2 0.6 321 100
Table 24: Perceptions that if students from different backgrounds get an argument or a fight teachers sort it out fairly
Ethnic group Yes No Total No. % No. % No. %
Sinhala 42 82.4 9 17.6 51 100 Muslim 29 87.8 4 12.1 33 100 Tamil 11 84.6 3 15.4 14 100 Burgher 0 0 1 100 1 100 Malay 1 100 0 0 1 100 Total 83 83 17 16 100 100
Table 25: Perceptions by ethnicity that after lunch all students are encouraged to mix with other ethnic groups in their free time in the five schools
Ethnic group
Always Usually Rarely Never No answer Total No. % No. % No. % No. % No. % No. %
Sinhala 97 67.8 29 20.3 14 9.8 2 1.4 1 0.7 143 100 Muslim 75 59.5 38 30.2 11 8.7 2 1.6 0 0 126 100 Tamil 21 52.5 16 40.0 1 2.5 2 5.0 0 0 40 100 Burgher 4 66.7 1 16.7 1 16.7 0 0 0 0 6 100 Malay 3 50.0 1 16.7 2 33.3 0 0 0 0 6 100 Total 200 62.3 85 26.2 29 9.0 6 1.9 1 0.3 321 100

237
Table 25a: Perceptions by ethnicity that after lunch all students are encouraged to mix with other ethnic groups in their free time in the five schools
r × c Contingency Table: Results
The results of a contingency table X2 statistical test performed at 06:25 on 13-JAN-2014
data: contingency table A (always) B (usually-never) A B 1 97 45 142 Sinhala 2 75 51 126 Muslim 3 21 19 40 Tamil 193 115 308 expected: contingency table A B 1 89.0 53.0 Sinhala 2 79.0 47.0 Muslim 3 25.1 14.9 Tamil
chi-square = 4.23 degrees of freedom = 2 probability = 0.121
Table 26: Perceptions that student often work with partners or in a peer tutoring relationship
Ethnic group
Always Usually Rarely Never No answer
Total
No. % No. % No. % No. % No. % No. % Sinhala 101 70.6 37 25.9 5 3.5 0 0 0 0 143 100 Muslim 78 61.9 43 34.1 1 0.8 4 3.2 0 0 126 100 Tamil 27 67.5 12 30.0 0 0 1 2.5 0 0 40 100 Burgher 4 66.7 2 33.3 0 0 0 0 0 0 6 100 Malay 5 83.3 1 16.7 0 0 0 0 0 0 6 100 Total 215 67.0 95 29.6 6 1.9 5 1.6 0 0 321 100

238
Table 26a: Perceptions that student often work with partners or in a peer tutoring relationship
r × c Contingency Table: Results
The results of a contingency table X2 statistical test performed at 06:46 on 13-JAN-2014
data: contingency table A (always) B (usually-never) A B 1 101 42 143 Sinhala 2 78 48 126 Muslim 3 27 13 40 Tamil 206 103 309 expected: contingency table A B 1 95.3 47.7 Sinhala 2 84.0 42.0 Muslim 3 26.7 13.3 Tamil
chi-square = 2.31 degrees of freedom = 2 probability = 0.315
Table 27: Students’ feeling of being very welcome of their arrival
Ethnic group
Yes No No answer Total No. % No. % No. % No. %
Sinhala 132 92.3 9 6.3 2 1.4 143 100 Muslim 121 96.0 5 4.0 0 0 126 100 Tamil 40 100 0 0 0 0 40 100 Burgher 6 100 0 0 0 0 6 100 Malay 5 83.3 1 16.7 0 0 6 100 Total 304 94.7 15 4.7 2 0.6 321 100

239
Table 28: Perceptions by ethnicities that at lunch time students are encouraged to eat their lunch together
Ethnic group
Always Usually Rarely Never No answer Total No. % No. % No. % No. % No. % No. %
Sinhala 101 70.6 41 28.7 1 0.7 0 0 0 0 143 100 Muslim 75 59.5 45 35.7 4 3.2 2 1.6 0 0 126 100 Tamil 29 72.5 10 25.0 1 2.5 0 0 0 0 40 100 Burgher 4 66.7 2 33.3 0 0 0 0 0 0 6 100 Malay 3 50.0 1 16.7 2 33.3 0 0 0 0 6 100 Total 212 66.0 99 30.8 8 2.5 2 0.6 0 0 321 100
Table 29: Students ever talked to school counselor in the five schools
Ethnic group
Yes No No answer Total No. % No. % No. % No. %
Sinhala 99 69.2 39 27.3 5 3.5 143 100 Muslim 75 59.5 44 34.9 7 5.6 126 100 Tamil 23 57.5 13 32.5 4 10.0 40 100 Burgher 3 50.0 2 33.3 1 16.7 6 100 Malay 3 50.0 3 50.0 0 0 6 100 Total 203 63.2 101 31.5 17 5.3 321 100
Table 29a: Students ever talked to school counselor in the five schools
r × c Contingency Table: Results
The results of a contingency table X2 statistical test performed at 07:29 on 13-JAN-2014
data: contingency table A (yes) B (no) A B 1 99 39 138 Sinhala 2 75 44 119 Muslim 3 23 13 36 Tamil 197 96 293 expected: contingency table A B 1 92.8 45.2 Sinhala 2 80.0 39.0 Muslim 3 24.2 11.8 Tamil
chi-square = 2.41 degrees of freedom = 2 probability = 0.300

240
Table 30: Students’ feelings regarding whether counsellors’ understand them
Ethnic group
Yes No No answer Total No. % No. % No. % No. %
Sinhala 84 84.8 13 13.2 2 2.0 99 100 Muslim 62 84.9 8 10.9 1 4.2 71 100 Tamil 24 88.8 2 7.4 1 3.8 27 100 Burgher 3 100 0 0 0 0 3 100 Malay 3 100 0 0 0 0 3 100 Total 176 85.8 23 11.2 4 2.9 203 100
Table 31: Perceptions that students are allowed to study any subject
Ethnic group
Yes No No answer Total No. % No. % No. % No. %
Sinhala 125 87.4 17 11.9 1 0.7 143 100 Muslim 45 35.7 81 64.3 0 0 126 100 Tamil 20 50.0 20 50.0 0 0 40 100 Burgher 2 33.3 4 66.7 0 0 5 100 Malay 3 50.0 3 50.0 0 0 7 100 Total 195 60.7 125 38.9 0.3 0 321 100
Table 31a: Perceptions that students are allowed to study any subject
r× c Contingency Table: Results
The results of a contingency table X2 statistical test performed at 07:47 on 13-JAN-2014
data: contingency table A (yes) B (no) A B 1 125 17 142 Sinhala 2 45 81 126 Muslim 3 20 20 40 Tamil 190 118 308 expected: contingency table A B 1 87.6 54.4 Sinhala 2 77.7 48.3 Muslim 3 24.7 15.3 Tamil
chi-square = 80.0 degrees of freedom = 2 probability = 0.000

241
Table 31b: Perceptions that students are allowed to study any subject (Sinhala and Muslim students)
r × c Contingency Table: Results
The results of a contingency table X2 statistical test performed at 10:40 on 22-MAR-2014
data: contingency table
A(Yes) B(No)
1 125 17 142 Sinhala
2 45 81 126 Muslim
170 98 268
expected: contingency table
A B
1 90.1 51.9 Sinhala
2 79.9 46.1 Muslim
chi-square = 78.8 degrees of freedom = 1 probability = 0.000
Table 31c: Perceptions that students are allowed to study any subject (Sinhala and Tamil students)
r × c Contingency Table: Results
The results of a contingency table X2 statistical test performed at 10:42 on 22-MAR-2014
data: contingency table
A(yes) B(No)
1 125 17 142 Sinhala
2 20 20 40 Tamil
145 37 182
expected: contingency table
A B
1 113. 28.9 Sinhala
2 31.9 8.13 Tamil
chi-square = 27.9 degrees of freedom = 1 probability = 0.000

242
Table 31d: Perceptions that students are allowed to study any subject (Muslim and Tamil students)
r × c Contingency Table: Results
The results of a contingency table X2 statistical test performed at 10:44 on 22-MAR-2014
data: contingency table A(Yes) B(No) 1 45 81 126 Muslim 2 20 20 40 Tamil 65 101 166 expected: contingency table A B 1 49.3 76.7 Muslim 2 15.7 24.3 Tamil
chi-square = 2.60 degrees of freedom = 1 probability = 0.107
Table 32: Perceptions that class textbooks talk about people from different backgrounds
Ethnic group
Always Usually Rarely Never No answer Total No. % No. % No. % No. % No. % No. %
Sinhala 94 67.5 44 30.8 1 0.7 1 0.7 3 2.1 143 100 Muslim 75 59.5 42 33.3 7 5.6 2 1.6 0 0 126 100 Tamil 24 60.0 14 35.0 1 2.5 1 2.5 0 0 40 100 Burgher 3 50.0 2 33.3 1 16.7 0 0 0 0 6 100 Malay 5 83.3 1 16.7 0 0 0 0 0 0 6 100 Total 201 62.6 103 32.1 10 3.1 4 1.2 3 1.0 321 100
Table 33: Perceptions that the range of topics covered in lessons helps students understand people from different backgrounds
Ethnic group
Always Usually Rarely Never No answer Total No. % No. % No. % No. % No. % No. %
Sinhala 79 55.2 55 38.5 4 2.8 2 1.4 3 2.1 143 100 Muslim 62 49.2 54 42.9 7 5.6 3 2.4 0 0 126 100 Tamil 28 70.0 9 22.5 3 7.5 0 0 0 0 40 100 Burgher 3 50.0 3 50.0 0 0 0 0 0 0 6 100 Malay 5 83.3 1 16.7 0 0 0 0 0 0 6 100 Total 177 55.1 122 38.0 14 4.4 5 1.6 3 0.9 321 100
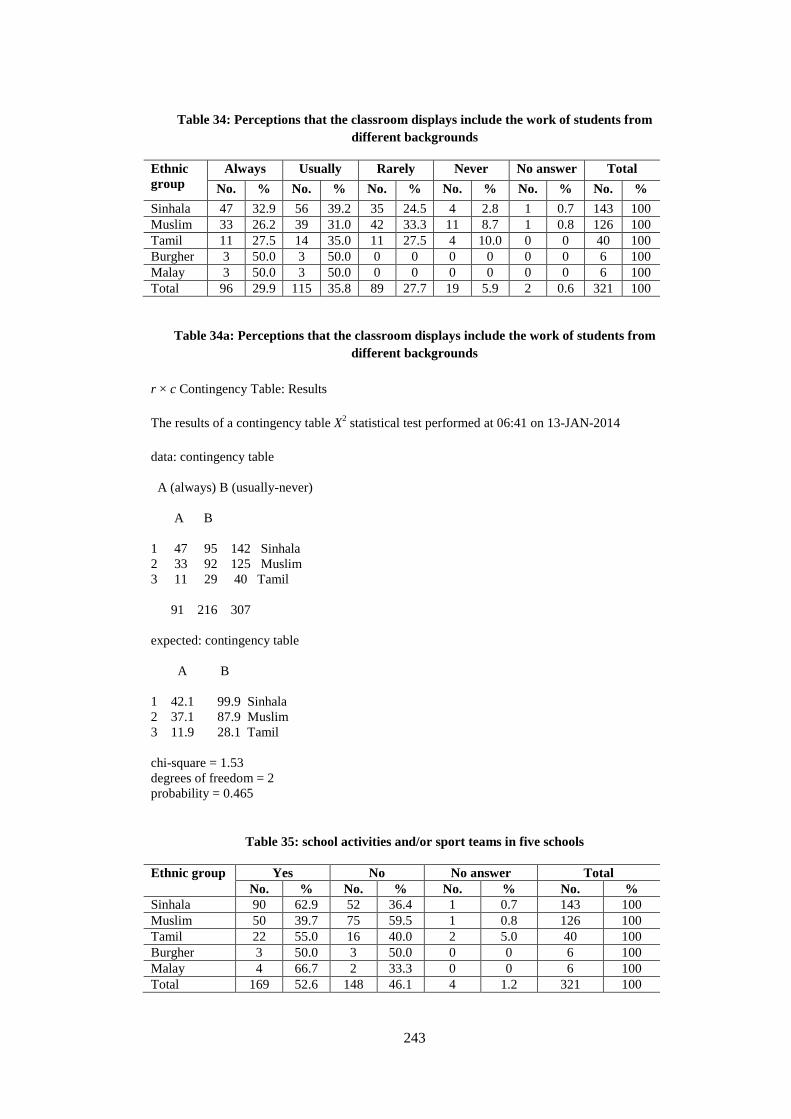
243
Table 34: Perceptions that the classroom displays include the work of students from different backgrounds
Ethnic group
Always Usually Rarely Never No answer Total No. % No. % No. % No. % No. % No. %
Sinhala 47 32.9 56 39.2 35 24.5 4 2.8 1 0.7 143 100 Muslim 33 26.2 39 31.0 42 33.3 11 8.7 1 0.8 126 100 Tamil 11 27.5 14 35.0 11 27.5 4 10.0 0 0 40 100 Burgher 3 50.0 3 50.0 0 0 0 0 0 0 6 100 Malay 3 50.0 3 50.0 0 0 0 0 0 0 6 100 Total 96 29.9 115 35.8 89 27.7 19 5.9 2 0.6 321 100
Table 34a: Perceptions that the classroom displays include the work of students from different backgrounds
r × c Contingency Table: Results
The results of a contingency table X2 statistical test performed at 06:41 on 13-JAN-2014
data: contingency table A (always) B (usually-never) A B 1 47 95 142 Sinhala 2 33 92 125 Muslim 3 11 29 40 Tamil 91 216 307 expected: contingency table A B 1 42.1 99.9 Sinhala 2 37.1 87.9 Muslim 3 11.9 28.1 Tamil chi-square = 1.53 degrees of freedom = 2 probability = 0.465
Table 35: school activities and/or sport teams in five schools
Ethnic group Yes No No answer Total No. % No. % No. % No. %
Sinhala 90 62.9 52 36.4 1 0.7 143 100 Muslim 50 39.7 75 59.5 1 0.8 126 100 Tamil 22 55.0 16 40.0 2 5.0 40 100 Burgher 3 50.0 3 50.0 0 0 6 100 Malay 4 66.7 2 33.3 0 0 6 100 Total 169 52.6 148 46.1 4 1.2 321 100

244
Table 35a School activities and/or sports teams
r × c Contingency Table: Results
The results of a contingency table X2 statistical test performed at 04:39 on 13-JAN-2014
data: contingency table A (Yes) B (No) 1 90 52 142 Sinhala 2 50 75 125 Muslim 3 22 16 38 Tamil 162 143 305 expected: contingency table A B 1 75.4 66.6 Sinhala 2 66.4 58.6 Muslim 3 20.2 17.8 Tamil
chi-square = 15.0 degrees of freedom = 2 probability = 0.001

245
Appendix E: Statistical analysis of student data by gender in Sri
Lanka
Table 1: Language(s) students spoke with friends by gender
Languages Male Female Total No. % No. % No. %
Sinhala 107 65.6 130 82.3 237 73.8 Tamil 15 9.2 7 4.4 22 6.9 Sinhala and Tamil 37 22.7 12 7.6 49 15.3 Sinhala, Tamil and English
2 1.2 2 1.3 4 1.2
Sinhala and English
1 0.6 7 4.4 8 2.5
Tamil and English 1 0.6 0 0 1 0.3 Total 163 100 158 100 321 100
Table 2: Language(s) students could read best by gender
Languages Male Female Total No. % No. % No. %
Sinhala 147 90.2 148 93.7 295 91.9 Tamil 4 2.5 2 1.3 6 1.9 English 6 3.7 4 2.5 10 3.1 Sinhala and English
2 1.2 2 1.3 4 1.2
Tamil and English 1 0.6 0 0 1 0.3 No answer 3 1.8 2 1.3 5 1.6 Total 163 100 158 100 321 100
Table 3: Perceptions by gender that students in the school are allowed to wear traditional cloths and hairstyles that are important in their own culture
Gender group
Always Usually Rarely Never No answer Total No. % No. % No. % No. % No. % No. %
Male 60 36.8 47 28.6 37 22.7 16 9.8 3 1.8 163 100 Female 92 58.2 60 38.0 5 3.2 1 0.6 0 0 158 100 Total 152 47.4 107 33.3 42 13.1 17 5.3 3 0.9 321 100
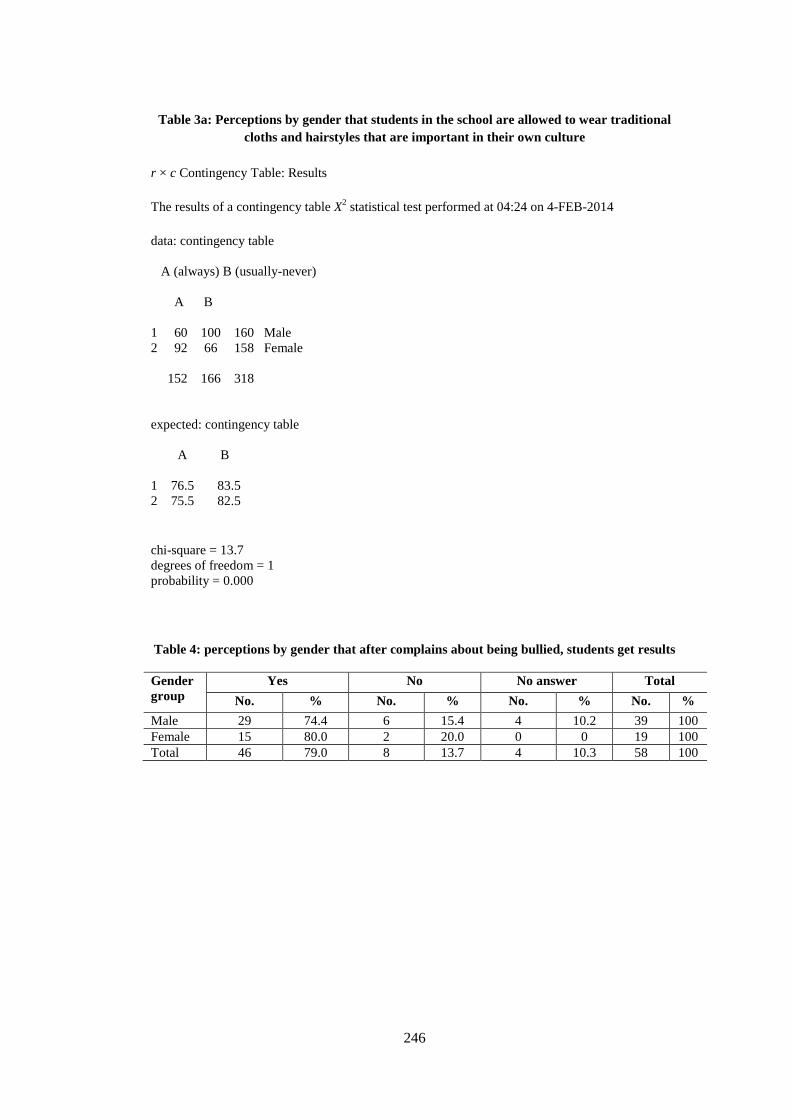
246
Table 3a: Perceptions by gender that students in the school are allowed to wear traditional cloths and hairstyles that are important in their own culture
r × c Contingency Table: Results
The results of a contingency table X2 statistical test performed at 04:24 on 4-FEB-2014
data: contingency table A (always) B (usually-never) A B 1 60 100 160 Male 2 92 66 158 Female 152 166 318 expected: contingency table A B 1 76.5 83.5 2 75.5 82.5
chi-square = 13.7 degrees of freedom = 1 probability = 0.000
Table 4: perceptions by gender that after complains about being bullied, students get results
Gender group
Yes No No answer Total No. % No. % No. % No. %
Male 29 74.4 6 15.4 4 10.2 39 100 Female 15 80.0 2 20.0 0 0 19 100 Total 46 79.0 8 13.7 4 10.3 58 100

247
Table 4a: perceptions by gender that after complains about being bullied, students get results
r × c Contingency Table: Results
The results of a contingency table X2 statistical test performed at 08:16 on 13-JAN-2014
data: contingency table A (yes) B (no) A B 1 29 6 35 Male 2 15 2 17 Female 44 8 52 expected: contingency table A B 1 29.6 5.38 Male 2 14.4 2.62 Female
chi-square = 0.254 degrees of freedom = 1 probability = 0.614
Table 5: Perceptions by gender that after lunch all students are encouraged to mix with other ethnic groups in their free time
Gender group
Always Usually Rarely Never No answer Total No. % No. % No. % No. % No. % No. %
Male 106 65.0 42 25.8 12 7.4 3 1.8 0 0 163 100 Female 94 59.5 43 27.2 17 10.8 3 1.9 1 0.6 158 100 Total 200 62.3 85 26.5 29 9.0 6 1.9 1 0.3 321 100

248
Table 5a: Perceptions by gender that after lunch all students are encouraged to mix with other ethnic groups in their free time
r × c Contingency Table: Results
The results of a contingency table X2 statistical test performed at 07:56 on 13-JAN-2014
data: contingency table A (always) B (usually-never) A B 1 106 57 163 Male 2 94 63 157 Female 200 120 320 expected: contingency table A B 1 102. 61.1 Male 2 98.1 58.9 Female
chi-square = 0.908 degrees of freedom = 1 probability = 0.341
Table 6: Perceptions that student often work with partners or in a peer tutoring relationship by gender
Gender group
Always Usually Rarely Never No answer Total No. % No. % No. % No. % No. % No. %
Male 97 59.5 56 34.4 6 3.7 4 2.5 0 0 163 100 Female 118 74.7 39 24.7 0 0 1 0.6 0 0 158 100 Total 215 67.0 95 29.6 6 1.9 5 1.6 0 0 321 100

249
Table 6a: Perceptions that student often work with partners or in a peer tutoring relationship by gender
r × c Contingency Table: Results
The results of a contingency table X2 statistical test performed at 08:06 on 13-JAN-2014
data: contingency table A (always) B (usually-never) A B 1 97 66 163 Male 2 118 40 158 Female 215 106 321 expected: contingency table A B 1 109. 53.8 Male 2 106. 52.2 Female
chi-square = 8.35 degrees of freedom = 1 probablity = 0.004
Table 7: perceptions that student often work with partners or in a peer tutoring relationship by gender (Mixed school)
Gender group
Always Usually Rarely Never No answer Total No. % No. % No. % No. % No. % No. %
Male 19 50.0 18 47.4 1 2.6 0 0 0 0 38 100 Female 16 57.1 12 42.9 0 0 0 0 0 0 28 100 Total 35 53.0 30 45.5 1 1.5 0 0 0 0 66 100

250
Table 7a: Perceptions that student often work with partners or in a peer tutoring relationship by gender (Girls school 1 & 2 and Boys school 1 & 2)
r × c Contingency Table: Results
The results of a contingency table X2 statistical test performed at 07:15 on 27-JAN-2014
data: contingency table A (always) B (usually-never) A B 1 102 28 130 Girls school 1&2 2 77 48 125 Boys school 1&2 179 76 255 expected: contingency table A B 1 91.3 38.7 Girls school 1&2 2 87.7 37.3 Boys school 1&2 chi-square = 8.66 degrees of freedom = 1 probability = 0.003
Table 8: Students’ feeling of being very welcome of their arrival by gender
Gender group
Yes No No answer Total No. % No. % No. % No. %
Male 160 98.2 1 0.6 2 1.2 163 100 Female 144 91.1 14 8.9 0 0 158 100 Total 304 94.7 15 4.7 2 0.6 321 100

251
Table 8a: Students’ feeling of being very welcome of their arrival by gender
r × c Contingency Table: Results
The results of a contingency table X2 statistical test performed at 08:12 on 13-JAN-2014
data: contingency table A (yes) B (no) A B 1 160 1 161 Male 2 144 14 158 Female 304 15 319 expected: contingency table A B 1 153. 7.57 Male 2 151. 7.43 Female
chi-square = 12.1 degrees of freedom = 1 probability = 0.001
Table 9: Students ever talked to school counselor by gender
Gender group
Yes No No answer Total No. % No. % No. % No. %
Male 96 58.9 55 33.7 12 7.4 163 100 Female 107 67.7 46 29.1 5 3.2 158 100 Total 203 63.2 101 31.5 17 5.3 321 100

252
Table 9a: Students ever talked to school counselor by gender
r × c Contingency Table: Results
The results of a contingency table X2 statistical test performed at 08:13 on 13-JAN-2014
data: contingency table A (yes) B (no) A B 1 96 55 151 Male 2 107 46 153 Female 203 101 304 expected: contingency table A B 1 101. 50.2 Male 2 102. 50.8 Female
chi-square = 1.38 degrees of freedom = 1 probability = 0.239
Table 10: Perceptions by gender that students are allowed to study any subject
Gender group
Yes No No answer Total No. % No. % No. % No. %
Male 103 63.2 60 36.8 0 0 163 100 Female 92 58.2 65 41.1 0 0 158 100 Total 195 60.7 125 38.9 1 0.3 321 100

253
Table 10a: Perceptions by gender that students are allowed to study any subject
r × c Contingency Table: Results
The results of a contingency table X2 statistical test performed at 08:19 on 13-JAN-2014
data: contingency table A (yes) B (no) A B 1 103 60 163 Male 2 92 65 157 Female 195 125 320 expected: contingency table A B 1 99.3 63.7 Male 2 95.7 61.3 Female
chi-square = 0.708 degrees of freedom = 1 probability = 0.400

254
Appendix F: Statistical analysis of student data by age in Sri Lanka
Table 1: Language(s) students could read best by age
Languages Age
12 13 14 15 16 17 18 Total
No. % No. % No. % No. % No. % No. % No. % No. %
Sinhala 47 94.0 43 87.8 45 93.8 46 92.0 43 86.0 36 94.7 35 97.2 295 91.9
Tamil 0 0 2 4.1 1 2.1 0 0 2 4.0 0 0 1 2.8 6 1.9
English 3 6.0 2 4.1 2 4.2 1 2.0 1 2.0 1 2.6 0 0 10 3.1
Sinhala and
English
0 0 1 2.0 0 0 0 0 2 4.0 1 2.6 0 0 4 1.2
Tamil and
English
0 0 0 0 0 0 1 2.0 0 0 0 0 0 0 5 1.6
No answer 0 0 1 2.0 0 0 2 4.0 2 4.0 0 0 0 0 1 0.3
Total 50 100 49 100 48 100 50 100 50 100 38 100 36 100 321 100
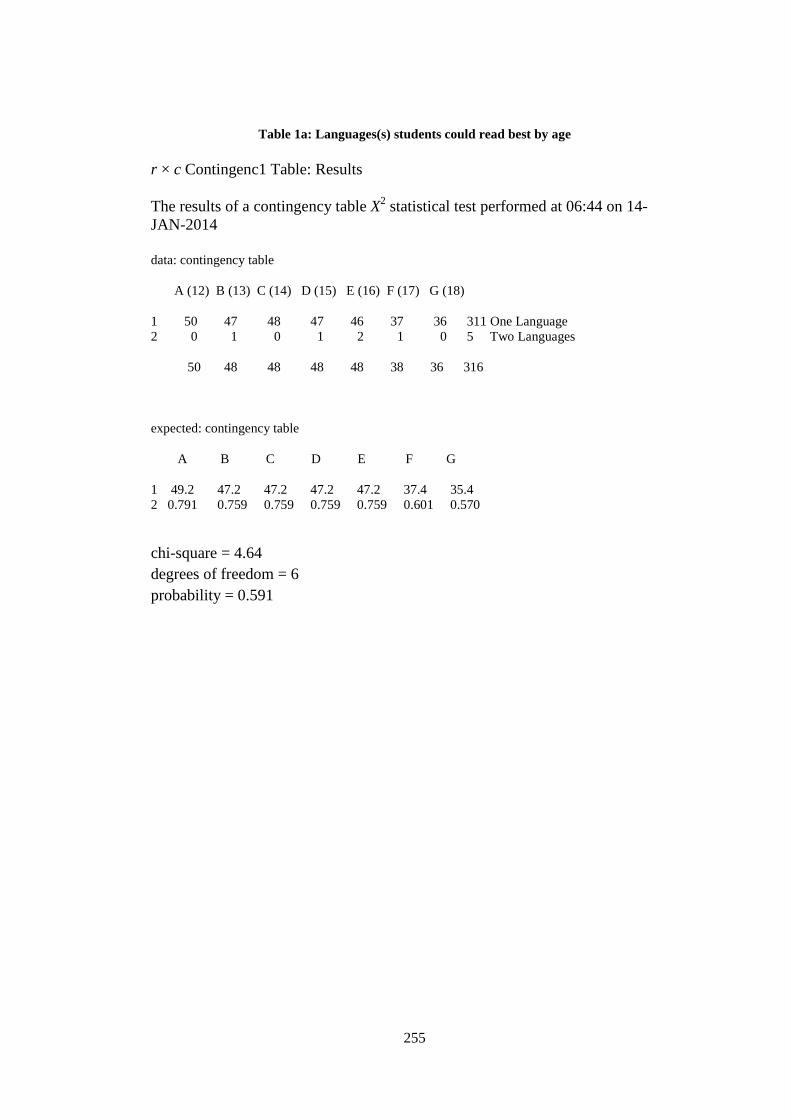
255
Table 1a: Languages(s) students could read best by age
r × c Contingenc1 Table: Results
The results of a contingency table X2 statistical test performed at 06:44 on 14-JAN-2014
data: contingency table A (12) B (13) C (14) D (15) E (16) F (17) G (18) 1 50 47 48 47 46 37 36 311 One Language 2 0 1 0 1 2 1 0 5 Two Languages 50 48 48 48 48 38 36 316 expected: contingency table A B C D E F G 1 49.2 47.2 47.2 47.2 47.2 37.4 35.4 2 0.791 0.759 0.759 0.759 0.759 0.601 0.570
chi-square = 4.64 degrees of freedom = 6 probability = 0.591

256
Table 2: Language(s) students spoke with friends by age
Languages Age 12 13 14 15 16 17 18 Total
No. % No. % No. % No. % No. % No. % No. % No. % Sinhala 45 90.0 37 75.5 32 66.7 33 66.0 32 64.0 32 84.2 26 72.2 237 73.8 Tamil 5 10.0 4 8.2 6 12.5 2 4.0 3 6.0 2 5.3 0 0 22 6.9 Sinhala and Tamil
0 0 5 10.2 9 18.8 11 22.0 14 28.0 2 5.3 8 22.2 49 15.3
Sinhala, Tamil and English
0 0 0 0 0 0 3 6.0 1 2.0 0 0 0 0 4 1.2
Sinhala and English
0 0 2 4.1 1 2.1 1 2.0 0 0 2 5.3 2 5.6 8 2.5
Tamil and English
0 0 1 2.0 0 0 0 0 0 0 0 0 0 0 1 0.3
Total 50 100 49 100 48 100 50 100 50 100 38 100 36 100 321 100

257
Table 2a: Language(s) students spoke with friends by age
r × c Contingency Table: Results
The results of a contingency table X2 statistical test performed at 11:24 on 17-JAN-2014
data: contingency table A B 1 50 0 50 2 26 10 36 76 10 86 expected: contingency table A B 1 44.2 5.81 2 31.8 4.19
chi-square = 15.7 degrees of freedom = 1 probability = 0.000

258
Table 3: languages students could read by age
Languages Age 12 13 14 15 16 17 18 Total
No. % No. % No. % No. % No. % No. % No. % No. % Sinhala 9 18.0 6 12.2 7 14.6 11 22.0 12 24.0 5 13.2 1 2.8 51 15.9 Tamil 1 2.0 0 0 1 2.1 0 0 0 0 0 0 0 0 2 6.0 Sinhala and Tamil
4 8.0 8 16.3 6 12.5 5 10.0 4 8.0 4 10.5 2 5.6 33 10.3
Sinhala, Tamil and English
11 22.0 17 34.7 24 50.0 18 36.0 15 30.0 16 42.1 17 47.2 118 36.8
Sinhala and English
25 50.0 16 32.7 10 20.8 15 30.0 18 36.0 12 31.6 15 41.7 111 34.6
Tamil and English
0 0 1 2.0 0 0 0 0 0 0 1 2.6 0 0 2 0.6
Sinhala, Malay
0 0 1 2.0 0 0 0 0 0 0 0 0 0 0 1 0.3
No answer 0 0 0 0 0 0 1 2.0 1 2.0 0 0 1 2.8 3 0.9 Total 50 100 49 100 48 100 50 100 50 100 38 100 36 100 321 100

259
Appendix G: Statistical analysis of student data in England
Table 1: Ethnic background of students
Ethnic group No. % White British 26 63.4 White East European 2 4.9 Mixed (White and Black African, White and Asian)
2 4.9
Asian British 5 12.2 Black Caribbean 1 2.4 Black African 5 12.2 Total 41 100
Table 2: Religious backgrounds of students
Religious group No. % Christian 15 36.6 Muslim 2 4.9 Hindu 2 4.9 Buddhist 2 4.9 No religious 20 48.8 Total 41 100
Table 3: Student sample according to gender
Ethnic group
Gender Total Male Female
No. % No. % No. % White British 17 65.4 9 34.6 26 100 White East European
0 0 2 100 2 100
Mixed(White and Black African, White and Asian)
1 50.0 1 50.0 2 100
Asian British 1 20.0 4 80.0 5 100 Black Caribbean
0 0 1 100 1 100
Black African
3 60.0 2 40.0 5 100
Total 22 53.7 19 46.3 41 100

260
Table 4: Age of student sample
Years White British
White East European
Mixed (White and
Black African,
White and Asian)
Asian British
Black Caribbean
Black African
Total
No. % No. % No. % No. % No. % No. % No. % 13 Years
8 30.8 1 50.0 1 50.0 2 40. 1 100 0 0 13 31.7
14 Years
7 26.9 0 0 0 0 2 40.0 0 0 1 20.0 10 24.4
15 Years
6 23.1 0 0 1 50.0 1 20.0 0 0 2 40.0 10 24.4
16 Years
1 3.8 1 50.0 0 0 0 0 0 0 1 20.0 3 7.3
17 Years
4 15.4 0 0 0 0 0 0 0 0 1 20.0 5 12.2
Total 26 100 2 100 2 100 5 100 1 100 5 100 41 100
Table 5: Languages students usually speak at home
Language White British
White East European
Mixed (White and
Black African,
White and Asian)
Asian British
Black Caribbean
Black African
Total
No. No. No. No. No. No. No. English 25 0 1 1 1 3 31 Romanian 0 1 0 0 0 0 1 Bengali and English
0 0 0 2 0 0 2
Portuguese 0 0 1 0 0 0 1 English and Tamil
0 0 0 1 0 0 1
Kikuyu and Swahili
0 0 0 0 0 1 1
English and Thai
0 0 0 1 0 0 2
Polish 1 1 0 0 0 0 1 English and TWI
0 0 0 0 0 1 1
Total 26 2 2 5 1 5 41

261
Table 6: Language(s) students spoke with friends.
Language White British
White East European
Mixed (White and
Black African,
White and Asian)
Asian British
Black Caribbean
Black African
Total
No. No. No. No. No. No. No. English 26 2 2 5 1 5 41 Total 26 2 2 5 1 5 41
Table 7: languages students could read
Language White British
White East European
Mixed (White and
Black African,
White and Asian)
Asian British
Black Caribbean
Black African
Total
No. No. No. No. No. No. No. English 9 0 1 2 0 2 14 English and French
11 0 0 1 1 1 14
English, French and Spanish
4 0 0 0 0 0 4
English, French and Twi
0 0 0 0 0 1 1
English and Tamil
0 0 0 2 0 0 2
English and Romanian
0 1 0 0 0 0 1
English, Spanish and Portuguese
0 0 1 0 0 0 1
English, Kikuyu and Swahiu
0 0 0 0 0 1 1
English and Polish
1 1 0 0 0 0 2
English and Spanish
1 0 0 0 0 0 1
Total 26 2 2 5 1 5 41

262
Table 8: Language(s) students could read best
Language White British
White East
European
Mixed (White and Black
African, White and Asian)
Asian British
Black Caribbean
African Total
No. No. No. No. No. No. No. English 23 1 1 5 1 4 35 French 2 0 0 0 0 0 2 Portuguese 1 0 1 0 0 0 2 English and Swahiu
0 0 0 0 0 1 1
Polish 0 1 0 0 0 0 1 Total 26 2 2 5 1 5 41
Table 9: Language students felt most comfortable in for expressing complicated thoughts and ideas where first language was not English
Language White British
White East
European
Mixed (White and Black African,
White and Asian)
Asian British
Black Caribbe
an
Black African
Total
No. No. No. No. No. No. No. English 0 1 1 1 0 1 4 Portuguese 0 0 1 0 0 0 1 Polish 0 1 0 0 0 0 1 Not applicable
26 0 0 0 0 0 26
No answer 0 0 0 4 1 4 9 Total 26 2 2 5 1 5 41
Table 10: Perceptions that the teacher knows some expressions in the languages used by different students
Ethnic group Always Usually Rarely Never No answer
Total
No. No. No. No. No. No. White British 6 8 7 1 4 26 White East European 1 0 1 0 0 2 Mixed (White and Black African, White and Asian)
0 2 0 0 0 2
Asian British 1 0 2 1 1 5 Black Caribbean 0 0 1 0 0 1 Black African 0 1 3 0 1 5 Total 8 11 14 2 6 41

263
Table 11: Perceptions that the bulletin boards around the school that students come from a range of different ethnic backgrounds
Ethnic group Always Usually Rarely Never No answer
Total
No. No. No. No. No. No. White British 7 5 9 2 3 26 White East European 1 1 0 0 0 2 Mixed (White and Black African, White and Asian)
1 1 0 0 0 2
Asian British 1 0 2 2 0 5 Black Caribbean 0 0 1 0 0 1 Black African 2 2 1 0 0 5 Total 12 9 13 4 3 41
Table 12: Perceptions by ethnicity that school concerts and other special events include all the cultures
Ethnic group Always Usually Rarely Never No answer
Total
No. No. No. No. No. No. White British 12 7 7 0 0 26 White East European 0 1 1 0 0 2 Mixed (White and Black African, White and Asian)
0 0 2 0 0 2
Asian British 0 0 2 3 0 5 Black Caribbean 0 1 0 0 0 1 Black African 1 0 4 0 0 5 Total 13 9 16 3 0 41
Table 13: Perceptions by ethnicity of religious festivals celebrated
Ethnic group Yes No No answer Total No. No. No. No.
White British 19 6 1 26 White East European 1 1 0 2 Mixed (White and Black African, White and Asian)
0 2 0 2
Asian British 1 3 1 5 Black Caribbean 1 0 0 1 Black African 3 1 1 5 Total 25 13 3 41

264
Table 14: Perceptions by ethnicity that students are allowed to wear traditional cloths and hairstyles that are important in their own culture
Ethnic group Always Usually Rarely Never No answer
Total
No. No. No. No. No. No. White British 9 9 2 2 4 26 White East European 1 0 1 0 0 2 Mixed (White and Black African, White and Asian)
0 1 1 0 0 2
Asian British 4 1 0 0 0 5 Black Caribbean 0 0 1 0 0 1 Black African 1 1 1 2 0 5 Total 15 12 6 4 4 41
Table 15: Perceptions by ethnicity that school assemblies are often about different cultures and races
Ethnic group Always Usually Rarely Never No answer
Total
No. No. No. No. No. No. White British 3 8 13 1 1 26 White East European 1 1 0 0 0 2 Mixed (White and Black African, White and Asian)
0 0 2 0 0 2
Asian British 0 1 3 1 0 5 Black Caribbean 0 0 0 1 0 1 Black African 0 1 3 1 0 5 Total 4 11 21 4 1 41
Table 16: Proportions of students who studied some of the history of their own culture
Ethnic group Yes No No answer Total No. No. No. No.
White British 20 5 1 26 White East European 1 1 0 2 Mixed(White and Black African, White and Asian)
2 0 0 2
Asian British 2 3 0 5 Black Caribbean 0 1 0 1 Black African 3 1 1 5 Total 28 11 2 41

265
Table 17: Perceptions that the school library has lots of books about people from different cultures
Ethnic group Yes No No answer Total No. No. No. No.
White British 22 1 3 26 White East European 2 0 0 2 Mixed (White and Black African, White and Asian)
2 0 0 2
Asian British 4 1 0 5 Black Caribbean 1 0 0 1 Black African 5 0 0 5 Total 36 2 3 41
Table 18: Perceptions by ethnicities that at lunch time students are encouraged to eat their lunch together
Ethnic group Always Usually Rarely Never No answer
Total
No. No. No. No. No. No. White British 12 5 5 3 1 26 White East European 1 0 1 0 0 2 Mixed(White and Black African, White and Asian)
0 1 1 0 0 2
Asian British 1 2 1 0 1 5 Black Caribbean 1 0 0 0 0 1 Black African 2 2 1 0 0 5 Total 17 10 9 3 2 41

266
Appendix H: Statistics analysis of student data by gender in
England
Table 1: Language(s) students spoke with friends by gender
Languages Male Female Total No. No. No.
English 22 19 41 Total 22 19 41
Table 2: languages students could read by gender
Languages Male Female Total No. No. No.
English 10 4 14 English and French 6 8 14 English, French and Spanish 4 0 4 English, French and Twi 0 1 1 English and Tamil 0 2 2 English and Romanian 0 1 1 English, Spanish and Portuguese 1 0 1 English, Kikuyu and Swahiu 0 1 1 English and Polish 1 1 2 English and Spanish 0 1 1 Total 22 19 41
Table 3: Perceptions by gender that students in the school are allowed to wear traditional cloths and hairstyles that are important in their own culture
Gender group
Always Usually Rarely Never No answer Total No. No. No. No. No. No.
Male 6 8 3 3 2 22 Female 9 4 3 1 2 19 Total 15 12 6 4 4 41

267
Appendix I: Descriptive statistics and further analysis (chi squares) of student data by age in England
Table 1: Language(s) students spoke with friends by age
Languages Age 13 14 15 16 17 Total No. No. No. No. No. No.
English 12 10 10 3 5 41 Total 12 10 10 3 5 41
Table 2: languages students could read by age
Languages Age 13 14 15 16 17 Total No. No. No. No. No. No.
English 4 3 5 0 2 14 English and French 4 5 4 0 1 14 English, French and Spanish 2 0 1 0 1 4 English, French and Twi 0 0 0 1 0 1 English and Tamil 1 1 0 0 0 2 English and Romanian 1 0 0 0 0 1 English, Spanish and Portuguese
1 0 0 0 0 1
English, Kikuyu and Swahiu1
0 1 0 0 0 1
English and Polish 0 0 0 1 1 2 English and Spanish 0 0 0 1 0 1 Total 13 10 10 3 5 41

268
Appendix J: Statistical analysis of teacher data in Sri Lanka
Table 1: Ethnic background of teachers
School Type Ethnic Group Sinhala Other No answer Total
No. % No. % No. % No. % Mixed school 22 100 0 0 0 0 22 100 Girls school 1 21 100 0 0 0 0 21 100 Girls school 2 25 100 0 0 0 0 25 100 Boys school 1 23 92.0 1 4.0 1 4.0 25 100 Boys school 2 23 100 0 0 0 0 23 100 Total 114 98.3 1 0.9 1 0.9 116 100
Table 2: Religious backgrounds of teachers School Type Religious Group
Buddhist Islam Catholic/Christian No answer Total No. % No. % No. % No. % No. %
Mixed school 22 100 0 0 0 0 0 0 22 100 Girls school 1 21 100 0 0 0 0 0 0 21 100 Girls school 2 23 92.0 0 0 2 8.0 0 0 25 100 Boys school 1 22 88.0 1 4.0 0 0 2 8.0 25 100 Boys school 2 22 95.7 0 0 1 4.3 0 0 23 100 Total 110 94.8 1 0.9 1 0.9 2 1.7 116 100
Table 3: Gender of teachers School Type Gender Group
Male Female Total No. % No. % No. %
Mixed school 4 18.2 18 81.8 22 100 Girls school 1 5 23.8 16 76.2 21 100 Girls school 2 5 20.0 20 80.0 25 100 Boys school 1 10 40.0 15 60.0 25 100 Boys school 2 4 17.4 19 82.6 23 100 Total 28 24.1 88 75.9 116 100
Table 4: Age of teachers
School Type Age Group
20-30 31-40 41-50 51+ Total No. % No. % No. % No. % No. %
Mixed school 6 27.3 6 27.3 5 22.7 5 22.7 22 100 Girls school 1 6 28.6 3 14.3 6 28.6 6 28.6 21 100 Girls school 2 8 32.0 8 32.0 6 24.0 3 12.0 25 100 Boys school 1 3 12.0 9 36.0 9 36.0 4 16.0 25 100 Boys school 2 8 34.8 8 34.8 5 21.7 2 8.7 23 100 Total 31 26.7 34 29.3 31 26.7 20 17.2 116 100

269
Table 5: Number of years of teaching experience
School type Number of years of teaching experience
0-5 6-10 11-15 16-20 21-25 25+ Total No. % No. % No. % No. % No. % No. % No. %
Mixed school 9 40.9 3 13.6 2 9.1 4 18.2 3 13.6 1 4.5 22 100 Girls school 1 8 38.1 1 4.8 0 0 4 19.0 7 33.3 1 4.8 21 100 Girls school 2 9 36.0 7 28.0 1 4.0 5 20.0 3 12.0 0 0 25 100 Boys school 1 5 20.0 7 28.0 4 16.0 4 16.0 4 16.0 1 4.0 25 100 Boys school 2 8 34.8 8 34.8 1 4.3 4 17.4 2 8.7 0 0 23 100 Total 39 33.6 26 22.4 8 6.9 21 18.1 19 16.4 3 2.6 116 100
Table 6: Teacher qualifications
School Type Highest qualification Master of Education
Post Graduate Diploma in Education
Degree Advanced Level Total
No. % No. % No. % No. % No. % Mixed school 1 4.5 4 18.2 5 22.7 12 54.5 22 100 Girls school 1 0 0 4 19.0 7 33.3 10 47.6 21 100 Girls school 2 0 0 4 16.0 9 36.0 12 48.0 25 100 Boys school 1 0 0 5 20.0 11 44.0 9 36.0 25 100 Boys school 2 1 4.3 2 8.7 10 43.5 10 43.5 23 100 Total 2 1.7 19 16.4 42 36.2 53 45.7 116 100

270
Table 7: Lengths of teaching experience and qualifications
Years of Teaching experience
Highest education qualification
Master of Education PGDE Degree A-level Total No. % No. % No. % No. % No. %
0-5 1 2.6 7 17.6 22 56.4 9 23.1 39 100
6-10 0 0 1 3.8 18 69.2 7 26.9 26 100
11-15 1 12.5 2 25.0 1 12.5 4 50.0 8 100
16-20 0 0 2 25.0 1 12.5 4 50.0 8 100
21-25 0 0 6 31.6 0 0 13 68.4 19 100
25+ 0 0 0 0 0 0 3 100 3 100 Total 2 1.7 19 16.4 42 42 53 45.7 116 100
Table 8: Length of teaching experience by attitude to multicultural education in five schools
Years of Teaching experience
Strongly Agree
Agree somewhat
Disagree Somewhat
Strongly disagree
No answer Total
No. % No. % No. % No. % No. % No. % 0-5 8 20.5 23 59.0 7 17.9 1 2.6 0 0 39 100 6-10 1 3.8 16 61.5 6 23.1 3 11.5 0 0 26 100 11-15 0 0 6 75.0 1 12.5 1 12.5 0 0 8 100 16-20 5 23.8 9 42.9 3 14.3 3 14.3 1 4.8 21 100 21-25 1 5.3 13 68.4 2 10.5 3 15.8 0 0 19 100 25+ 1 33.3 1 33.3 0 0 0 0 1 33.3 3 100 Total 16 13.8 68 58.6 19 16.4 11 9.5 2 1.7 116 100

271
Table 9: Educational qualifications by attitude to multicultural education
Highest educational qualification
Strongly Agree
Agree somewhat
Disagree somewhat
Strongly disagree No answer Total
No. % No. % No. % No. % No. % No. % Master of Education
0 0 1 50.0 0 0 1 50.0 0 0 2 100
Postgraduate diploma in education
4 21.1 11 57.9 2 10.5 2 10.5 0 0 19 100
Degree 5 11.9 26 61.9 3 7.1 8 19.0 0 0 42 100 Advanced level 7 13.2 30 56.6 6 11.3 8 15.1 2 3.8 53 100 Total 16 13.8 68 58.6 11 9.5 19 16.4 2 1.7 116 100
Table 10: Perceptions of whether teachers prefer to teach students of the same background as themselves
Years of Teaching experience
Strongly agree
Agree somewhat
Disagree somewhat
Strongly disagree
No answer Total
No. % No. % No. % No. % No. % No. % Mixed school 3 13.6 10 45.5 5 22.7 3 13.6 1 4.5 22 100 Girls school 1 3 14.3 12 57.1 6 28.6 0 0 0 0 21 100 Girls school 2 1 4.0 20 80.0 4 16.0 0 0 0 0 25 100 Boys school 1 3 12.0 13 52.0 8 32.0 1 4.0 0 0 25 100 Boys school 2 1 4.3 13 56.5 9 39.1 0 0 0 0 23 100 Total 11 9.5 68 58.6 32 27.6 4 3.4 1 0.9 116 100

272
Table 11: Teaching experience by beliefs about teachers’ preference to teach students of the same background as themselves
Years of Teaching experience
Strongly agree
Agree somewhat
Disagree somewhat
Strongly disagree
No answer Total
No. % No. % No. % No. % No. % No. % 0-5 5 12.8 22 56.4 8 20.5 3 7.7 1 2.6 39 100 6-10 0 0 19 73.1 7 20.9 0 0 0 0 26 100 11-15 1 12.5 6 75.0 1 12.5 0 0 0 0 8 100 16-20 2 9.5 12 57.1 6 28.6 1 4.8 0 0 21 100 21-25 3 15.8 7 36.8 9 47.4 0 0 0 0 19 100 25+ 0 0 2 66.7 1 33.3 0 0 0 0 3 100 Total 11 9.5 68 58.6 32 27.6 4 3.4 1 0.9 116 100
Table 12: Beliefs about importance of understanding students’ body language and speech
School Type Strongly Agree
Agree somewhat
Disagree somewhat
Strongly disagree
No answer Total
No. % No. % No. % No. % No. % No. % Mixed school 8 36.4 14 63.6 0 0 0 0 0 0 22 100 Girls school 1 8 38.1 13 61.9 0 0 0 0 0 0 21 100 Girls school 2 20 80.0 5 20.0 0 0 0 0 0 0 25 100 Boys school 1 13 52.0 12 48.0 0 0 0 0 0 0 25 100 Boys school 2 20 87.0 3 13.0 0 0 0 0 0 0 23 100 Total 69 59.5 47 40.5 0 0 0 0 0 0 116 100

273
Table 13: Teaching experience by respect for differences between students
Years of Teaching experience
Strongly agree
Agree somewhat
Disagree somewhat
Strongly disagree
No answer Total
No. % No. % No. % No. % No. % No. % 0-5 26 66.7 13 33.3 0 0 0 0 0 0 39 100 6-10 22 84.6 4 15.4 0 0 0 0 0 0 26 100 11-15 4 50.0 4 50.0 0 0 0 0 0 0 8 100 16-20 13 61.9 8 38.1 0 0 0 0 0 0 21 100 21-25 14 73.7 5 26.3 0 0 0 0 0 0 19 100 25+ 1 33.3 2 66.7 0 0 0 0 0 0 3 100 Total 80 69.0 36 31.0 0 0 0 0 0 0 116 100
Table 14: Educational qualification by beliefs about the importance of respect for differences between students
Highest educational qualification
Strongly agree
Agree somewhat
Disagree somewhat
Strongly disagree No answer Total
No. % No. % No. % No. % No. % No. %
Master of Education
1 50.0 1 50.0 0 0 0 0 0 0 2 100
Postgraduate diploma in education
14 73.7 5 26.3 0 0 0 0 0 0 19 100
Degree 32 76.2 10 23.8 0 0 0 0 0 0 42 100 Advanced level
33 62.3 20 37.7 0 0 0 0 0 0 53 100
Total 80 69.0 36 31.0 0 0 0 0 0 0 116 100

274
Table 15: Teachers’ beliefs about respect for students’ differences
School Type Strongly Agree
Agree somewhat
Disagree somewhat
Strongly disagree No answer Total
No. % No. % No. % No. % No. % No. % Mixed school 11 50.0 11 50.0 0 0 0 0 0 0 22 100 Girls school 1 11 52.4 10 47.6 0 0 0 0 0 0 21 100 Girls school 2 20 80.0 5 20.0 0 0 0 0 0 0 25 100 Boys school 1 19 76.0 6 24.0 0 0 0 0 0 0 25 100 Boys school 2 19 82.6 4 17.4 0 0 0 0 0 0 23 100 Total 80 69.0 36 31.0 0 0 0 0 0 0 116 100
Table 16: Highest educational qualifications by beliefs about the importance of understanding that body language and speech mean different things in different cultures
Highest educational qualification
Strongly agree
Agree somewhat
Disagree somewhat
Strongly disagree
No answer Total
No. % No. % No. % No. % No. % No. % Master of Education
1 50.0 1 50.0 0 0 0 0 0 0 2 100
Postgraduate diploma in education
13 68.4 6 31.6 0 0 0 0 0 0 19 100
Degree 27 64.3 15 35.7 0 0 0 0 0 0 42 100 Advanced level
28 52.8 25 47.2 0 0 0 0 0 0 53 100
Total 69 59.5 47 40.5 0 0 0 0 0 0 116 100

275
Table 17: Length of experience by teachers’ beliefs about the possibility of planning lessons and choosing resources with different languages of the various student groups in mind
Years of Teaching experience
Strongly agree
Agree somewhat
Disagree somewhat
Strongly disagree
No answer Total
No. % No. % No. % No. % No. % No. % 0-5 27 69.2 12 30.8 0 0 0 0 0 0 39 100 6-10 21 80.8 5 19.2 0 0 0 0 0 0 26 100 11-15 3 37.5 5 62.5 0 0 0 0 0 0 8 100 16-20 12 57.1 9 42.9 0 0 0 0 0 0 21 100 21-25 11 57.9 8 42.1 0 0 0 0 0 0 19 100 25+ 2 66.7 1 33.3 0 0 0 0 0 0 3 100 Total 76 65.5 40 34.5 0 0 0 0 0 0 116 100
Table 18: Beliefs about importance of awareness of students’ backgrounds
School Type Strongly Agree
Agree somewhat
Disagree somewhat
Strongly disagree
No answer Total
No. % No. % No. % No. % No. % No. % Mixed school 9 40.9 13 59.1 0 0 0 0 0 0 22 100 Girls school 1 7 33.3 13 61.9 0 0 0 0 1 4.8 21 100 Girls school 2 18 72.0 7 28.0 0 0 0 0 0 0 25 100 Boys school 1 13 52.0 12 48.0 0 0 0 0 0 0 25 100 Boys school 2 19 82.6 4 17.4 0 0 0 0 0 0 23 100 Total 66 56.9 49 42.2 0 0 0 0 1 0.9 116 100
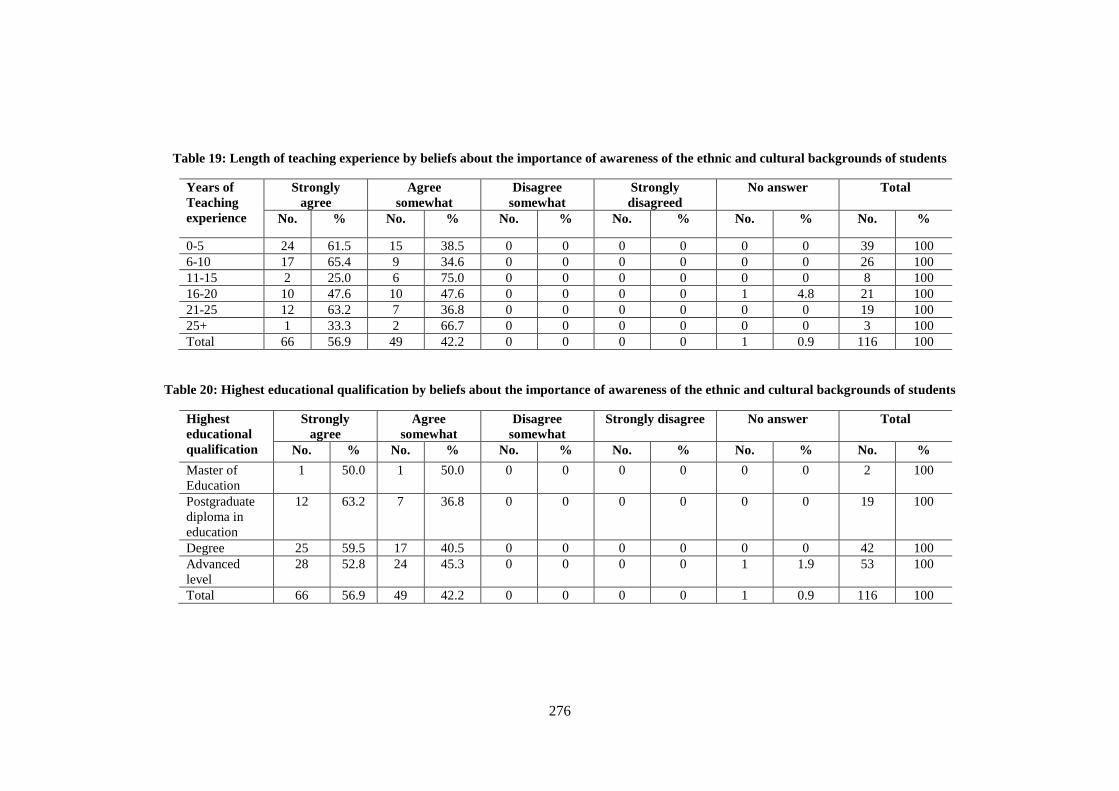
276
Table 19: Length of teaching experience by beliefs about the importance of awareness of the ethnic and cultural backgrounds of students
Years of Teaching experience
Strongly agree
Agree somewhat
Disagree somewhat
Strongly disagreed
No answer Total
No. % No. % No. % No. % No. % No. %
0-5 24 61.5 15 38.5 0 0 0 0 0 0 39 100 6-10 17 65.4 9 34.6 0 0 0 0 0 0 26 100 11-15 2 25.0 6 75.0 0 0 0 0 0 0 8 100 16-20 10 47.6 10 47.6 0 0 0 0 1 4.8 21 100 21-25 12 63.2 7 36.8 0 0 0 0 0 0 19 100 25+ 1 33.3 2 66.7 0 0 0 0 0 0 3 100 Total 66 56.9 49 42.2 0 0 0 0 1 0.9 116 100
Table 20: Highest educational qualification by beliefs about the importance of awareness of the ethnic and cultural backgrounds of students
Highest educational qualification
Strongly agree
Agree somewhat
Disagree somewhat
Strongly disagree No answer Total
No. % No. % No. % No. % No. % No. % Master of Education
1 50.0 1 50.0 0 0 0 0 0 0 2 100
Postgraduate diploma in education
12 63.2 7 36.8 0 0 0 0 0 0 19 100
Degree 25 59.5 17 40.5 0 0 0 0 0 0 42 100 Advanced level
28 52.8 24 45.3 0 0 0 0 1 1.9 53 100
Total 66 56.9 49 42.2 0 0 0 0 1 0.9 116 100

277
Table 21: Highest educational qualification by beliefs about planning and resources
Highest educational qualification
Strongly Agree
Agree somewhat
Disagree somewhat
Strongly disagree
No answer Total
No. % No. % No. % No. % No. % No. % Master of Education
1 50.0 1 50.0 0 0 0 0 0 0 2 100
Postgraduate diploma in education
12 63.2 7 36.8 0 0 0 0 0 0 19 100
Degree 32 76.2 10 23.8 0 0 0 0 0 0 42 100 Advanced level 31 58.5 22 41.5 0 0 0 0 0 0 53 100 Total 76 65.5 40 34.5 0 0 0 0 0 0 116 100
Table 22: Perceptions of whether there is an opportunity to participate in workshops for multicultural education
School type Sometime Occasionally Never No answer Total
No. % No. % No. % No. % No. % Mixed school 0 0 5 22.7 17 77.3 0 0 22 100 Girls school 1 2 9.5 7 33.3 12 57.1 0 0 21 100 Girls school 2 0 0 11 44.0 14 56.0 0 0 25 100 Boys school 1 3 12.0 7 28.0 13 52.0 2 8.0 25 100 Boys school 2 0 0 8 34.8 15 65.2 0 0 23 100 Total 5 4.3 38 32.8 71 61.2 2 1.7 116 100

278
Table 23: Teaching experience by opportunity to participate in workshops for multicultural education
Years of Teaching experience
Some time Occasionally Never No answer Total
No. % No. % No. % No. % No. % 0-5 1 2.6 10 25.6 27 69.2 1 2.6 39 100 6-10 1 3.8 11 42.3 14 53.8 0 0 26 100 11-15 0 0 2 25.0 6 75.0 0 0 8 100 16-20 1 4.8 9 42.9 11 52.4 0 0 21 100 21-25 2 10.5 5 26.3 11 57.9 1 5.3 19 100 25+ 0 0 1 33.3 2 66.7 0 0 3 100 Total 5 4.3 38 32.8 71 61.2 2 1.7 116 100
Table 24: Perceptions of whether school libraries had a good collection of multicultural materials
Years of Teaching experience
Strongly Agree
Agree somewhat
Disagree somewhat
Strongly disagree No answer Total
No. % No. % No. % No. % No. % No. % Mixed school 1 4.5 10 45.5 7 31.8 2 9.1 2 9.1 22 100 Girls school 1 3 14.3 9 42.9 8 38.1 1 4.8 0 0 21 100 Girls school 2 2 8.0 20 80.0 3 12.0 0 0 0 0 25 100 Boys school 1 4 16.0 13 52.0 6 24.0 0 0 2 8.0 25 100 Boys school 2 4 17.4 16 69.6 3 13.0 0 0 0 0 23 100 Total 14 12.1 68 58.6 27 23.3 3 2.6 4 3.4 116 100

279
Table 25: Perceptions of whether there is a procedure for conflict mediation when students experience ethnic or cultural harassment in the school or beyond
School Type Strongly agree
Agree somewhat
Disagree somewhat
Strongly disagree
No answer Total
No. % No. % No. % No. % No. % No. % Mixed school 6 27.3 11 50.0 4 18.2 0 0 1 4.5 22 100 Girls school 1 3 14.3 16 76.2 1 4.8 1 4.8 0 0 21 100 Girls school 2 1 4.0 13 52.0 11 44.0 0 0 0 0 25 100 Boys school 1 3 12.0 18 72.0 3 12.0 0 0 1 4.0 25 100 Boys school 2 16 69.6 7 30.4 0 0 0 0 0 0 23 100 Total 29 25.0 65 56.0 19 16.4 1 0.9 2 1.7 116 100
Table 26: Expectations of good student behaviour
School Type Strongly agree
Agree somewhat
Disagree somewhat
Strongly disagree No answer Total
No. % No. % No. % No. % No. % No. % Mixed school 17 77.3 5 22.7 0 0 0 0 0 0 22 100 Girls school 1 17 81.0 4 19.0 0 0 0 0 0 0 21 100 Girls school 2 18 72.0 7 28.0 0 0 0 0 0 0 25 100 Boys school 1 20 80.0 5 20.0 0 0 0 0 0 0 25 100 Boys school 2 18 78.3 5 21.7 0 0 0 0 0 0 23 100 Total 90 77.6 26 22.4 0 0 0 0 0 0 116 100

280
Table 27: Length of experience by expectations of behaviour
Years of Teaching experience
Strongly agree
Agree somewhat
Disagree somewhat
Strongly disagreed
No answer Total
No. % No. % No. % No. % No. % No. % 0-5 34 87.2 5 12.8 0 0 0 0 0 0 39 100 6-10 19 73.1 7 26.9 0 0 0 0 0 0 26 100 11-15 4 50.0 4 50.0 0 0 0 0 0 0 8 100 16-20 15 71.4 6 28.6 0 0 0 0 0 0 21 100 21-25 15 78.9 4 21.1 0 0 0 0 0 0 19 100 25+ 3 100 0 0 0 0 0 0 0 0 3 100 Total 90 77.6 26 22.4 0 0 0 0 0 0 116 100
Table 28: Educational qualifications by expectations of good behaviour
Highest Educational qualification
Strongly Agree
Agree somewhat
Disagree somewhat
Strongly disagree No answer Total
No. % No. % No. % No. % No. % No. % Master of Education
2 100 0 0 0 0 0 0 0 0 2 100
Postgraduate diploma in education
17 89.5 2 10.5 0 0 0 0 0 0 19 100
Degree 33 78.6 9 21.4 0 0 0 0 0 0 42 100 Advanced level 38 71.7 15 28.3 0 0 0 0 0 0 53 100 Total 90 77.6 26 22.4 0 0 0 0 0 0 116 100

281
Table 29: Perceptions of whether schools provide counselling services related to students’ social needs
School Type Strongly agree
Agree somewhat
Disagree somewhat
Strongly disagree
No answer Total
No. % No. % No. % No. % No. % No. % Mixed school 0 0 9 40.9 9 40.9 1 4.5 3 13.6 22 100 Girls school 1 2 9.5 10 47.6 8 38.1 1 4.8 0 0 21 100 Girls school 2 1 4.0 12 48.0 7 28.0 0 0 3 12.0 25 100 Boys school 1 2 8.0 12 48.0 7 28.0 1 4.0 3 12.0 25 100 Boys school 2 1 4.3 11 47.8 8 34.8 1 4.3 2 8.7 23 100 Total 6 5.2 54 46.6 44 37.9 4 3.4 8 6.9 116 100
Table 30: Perceptions of whether schools provide counselling services related to students’ academic needs
Type of School
Strongly agree
Agree somewhat
Disagree Somewhat
Strongly disagree
No answer Total
No. % No. % No. % No. % No. % No. % Mixed school 0 0 14 63.6 6 27.3 0 0 2 9.1 22 100 Girls school 1 2 9.5 13 61.9 5 23.8 1 4.8 0 0 21 100 Girls school 2 4 16.0 17 68.0 4 16.0 0 0 0 0 25 100 Boys school 1 4 16.0 13 52.0 7 28.0 1 4.0 0 0 25 100 Boys school 2 2 8.7 11 47.8 2 26.1 2 8.7 2 8.7 23 100 Total 12 10.3 68 58.6 28 24.1 4 3.4 4 3.4 116 100

282
Table 31: Perceptions of whether counsellors have knowledge and skills for effective cross-cultural counselling
School Type Strongly Agree
Agree somewhat
Disagree somewhat
Strongly Disagree
No answer Total
No. % No. % No. % No. % No. % No. % Mixed school 0 0 11 50.0 7 31.8 1 4.5 3 13.6 22 100 Girls school 1 1 4.8 13 61.9 6 28.6 1 4.8 0 0 21 100 Girls school 2 1 4.0 12 48.0 12 48.0 0 0 0 0 25 100 Boys school 1 3 12.0 13 52.0 7 28.0 0 0 2 8.0 25 100 Boys school 2 1 4.3 12 52.2 8 34.8 1 4.3 1 4.3 23 100 Total 6 5.2 61 52.6 40 34.5 3 2.6 6 5.2 116 100
Table 32: Perceptions of whether the schools have established mutually supportive relationships with community groups and agencies
School Type Strongly agree
Agree somewhat
Disagree somewhat
Strongly disagree
No answer Total
No. % No. % No. % No. % No. % No. % Mixed school 2 9.1 20 90.9 0 0 0 0 0 0 22 100 Girls school 1 3 14.3 16 76.2 1 4.8 0 0 1 4.8 21 100 Girls school 2 17 68.0 8 32.0 0 0 0 0 0 0 25 100 Boys school 1 4 16.0 18 72.0 1 4.0 1 4.0 1 4.0 25 100 Boys school 2 1 4.3 14 60.9 8 34.8 0 0 0 0 23 100 Total 27 23.3 76 65.5 10 8.6 1 0.9 2 1.7 116 100

283
Table 33: Perceptions of the importance of making an effort to raise students’ achievement
School Type Strongly agree
Agree somewhat
Disagree somewhat
Strongly disagree No answer Total
No. % No. % No. % No. % No. % No. %
Mixed school 4 18.2 13 59.1 3 13.2 0 0 2 9.1 22 100 Girls school 1 8 38.1 11 52.4 2 9.5 0 0 0 0 21 100 Girls school 2 3 12.0 20 80.0 2 8.0 0 0 0 0 25 100 Boys school 1 3 12.0 15 60.0 7 28.0 0 0 0 0 25 100 Boys school 2 4 17.4 17 73.9 2 8.7 0 0 0 0 23 100 Total 22 19.0 76 65.5 16 13.8 0 0 2 1.7 116 100
Table 34: Teaching experience by beliefs about importance of making a special effort to raise achievement of minority ethnic students
Years of Teaching experience
Strongly Agree
Agree somewhat
Disagree somewhat
Strongly disagree
No answer Total
No. % No. % No. % No. % No. % No. % 0-5 10 25.6 23 59.0 5 12.8 0 0 1 2.6 39 100 6-10 3 11.5 20 76.9 3 11.5 0 0 0 0 26 100 11-15 2 25 5 62.5 1 12.5 0 0 0 0 8 100 16-20 3 14.3 12 57.1 6 28.6 0 0 0 0 21 100 21-25 2 10.5 16 84.2 1 5.3 0 0 0 0 19 100 25+ 2 66.7 0 0 0 0 0 0 1 33.3 3 100 Total 22 19.0 76 65.5 16 13.8 0 0 2 1.7 116 100

284
Table 35: Educational qualifications by effort to raise students’ achievement
Highest educational qualification
Strongly Agree
Agree somewhat
Disagree somewhat
Strongly disagree
No answer Total
No. % No. % No. % No. % No. % No. %
Master of Education
0 0 1 50.0 1 50.0 0 0 0 0 2 100
Postgraduate diploma in education
4 21.1 12 63.2 3 15.8 0 0 0 0 19 100
Degree 10 23.8 24 57.1 8 19.0 0 0 0 0 42 100 Advanced level 8 15.1 39 73.6 4 7.5 0 0 2 3.8 53 100 Total 22 19.0 76 65.5 16 13.8 0 0 2 1.7 116 100
Table 36: Perceptions of whether schools have a system for monitoring the progress of all groups of students by ethnicity
Type of School Strongly Agree
Agree somewhat
Disagree somewhat
Strongly disagree
No answer Total
No. % No. % No. % No. % No. % No. % Mixed school 2 9.1 17 77.3 2 9.1 1 4.5 0 0 22 100 Girls school 1 5 23.8 16 76.2 0 0 0 0 0 0 21 100 Girls school 2 1 4.0 19 76.0 2 8.0 1 4.0 2 8.0 25 100 Boys school 1 4 16.0 19 76.0 1 4.0 1 4.0 0 0 25 100 Boys school 2 1 4.3 15 65.2 5 21.7 0 0 2 8.7 23 100 Total 13 11.2 86 74.1 10 8.6 3 2.6 4 3.4 116 100

285
Table 37: Educational qualifications by teachers’ beliefs regarding making a special effort for students with learning difficulties
Highest educational qualification
Strongly Agree
Agree somewhat
Disagree somewhat
Strongly disagree
No answer Total
No. % No. % No. % No. % No. % No. % Master of Education
2 100 0 0 0 0 0 0 0 0 2 100
Postgraduate diploma in education
17 89.5 2 10.5 0 0 0 0 0 0 19 100
Degree 33 78.6 7 16.7 1 2.4 0 0 1 2.4 42 100 Advanced level 36 67.9 17 32.1 0 0 0 0 0 0 53 100 Total 88 75.9 26 22.4 1 0.9 0 0 1 0.9 116 100

286
Appendix K: Statistical analysis of teacher data in England
Table 1: Ethnic background of teachers
Ethnic group No. % White British 9 64.3 White Irish 1 7.1 Mixed (White and Black Caribbean) 1 7.1 Asian British (Pakistani) 1 7.1 Asian British (Bangladeshi) 1 7.1 Not mention 1 7.1 Total 14 100
Table 2: Religious backgrounds of teachers
Religious group No. %
Christian 7 50.0 Muslim 2 14.3 No Religion 1 7.1 Not mentioned 4 28.6 Total 14 100
Table 3: Gender of teachers
Gender group No. % Male 12 85.7 Female 2 14.3 Total 14 100
Table 4: Teachers’ age
Age group No % 20-30 6 42.8 31-40 4 28.6 41-50 0 0 51+ 2 14.3 Not mention 2 14.3 Total 14 100
Table 5: Number of years of teaching experience
Number of years of teaching experience No. % 0-5 6 42.8 6-10 3 21.4 11-15 1 7.2 16-20 0 0 21-25 0 0 25+ 2 14.3 No answer 2 14.3 Total 14 100

287
Table 6: Highest teacher qualifications
Educational Qualification No. % Master of Arts 1 7.1 Postgraduate diploma in education 4 28.6 Degree 6 42.9 Teaching certificate 1 7.1 Not mention 2 14.3 Total 14 100
Table 7: Teachers’ ratings of whether teachers prefer to teach students of the same background as themselves by teacher ethnicity
Ethnic background
Strongly agree
Agree somewhat
Disagree Somewhat
Strongly disagree
No answer Total
White British 1 0 3 4 1 9 Mixed (White and Black Caribbean)
0 0 0 0 1 1
White- Irish 1 0 0 0 0 1 Asian British (Pakistani)
0 0 0 1 0 1
Asian British (Bangladeshi)
0 0 0 1 0 1
Not Mention 0 1 0 0 0 1 Total 2 1 3 6 2 14
Table 8: Beliefs about teachers’ preference to teach students of the same background as themselves by teaching experience
Years of Teaching experience
Strongly agree
Agree somewhat
Disagree Somewhat
Strongly disagree
No answer Total
0-5 1 1 1 3 0 6 6-10 0 0 1 1 1 3 11-15 0 0 0 1 0 1 16-20 0 0 0 0 0 0 21-25 0 0 0 0 0 0 25+ 1 0 1 0 0 2 Not mansion 0 0 0 1 1 2 Total 2 1 3 6 2 14

288
Table 9: Teacher perceptions of teachers’ preference to teach students of the same background as themselves by highest education qualification
Highest educational qualification
Strongly agree
Agree somewhat
Disagree somewhat
Strongly disagree
No answer Total
Master of Arts 0 0 1 0 0 1 Postgraduate diploma in education
1 1 1 1 0 4
Degree 0 0 1 4 1 6 Teaching Certificate
1 0 0 0 0 1
Not mention 0 0 0 1 1 2 Total 2 1 3 6 2 14
Table 10: Teachers’ ratings of the importance of understanding students’ body language and speech by teacher ethnicity
Ethnic background
Strongly agree
Agree somewhat
Disagree Somewhat
Strongly disagree
No answer Total
White British 8 1 0 0 0 9 Mixed (White and Black Caribbean)
1 0 0 0 0 1
White- Irish 1 0 0 0 0 1 Asian British (Pakistani)
0 1 0 0 0 1
Asian British (Bangladeshi)
1 0 0 0 0 1
Not Mention 1 0 0 0 0 1 Total 12 2 0 0 0 14
Table 11: Teachers’ rating of the importance of awareness of students’ backgrounds by teacher ethnicity
Ethnic background
Strongly agree
Agree somewhat
Disagree Somewhat
Strongly disagree
No answer Total
White British 5 4 0 0 0 9 Mixed (White and Black Caribbean)
0 1 0 0 0 1
White- Irish 1 0 0 0 0 1 Asian British (Pakistani)
0 1 0 0 0 1
Asian British (Bangladeshi)
1 0 0 0 0 1
Not Mention 1 0 0 0 0 1 Total 8 6 0 0 0 14

289
Table 12: Teachers’ ratings of the importance of awareness of the ethnic and cultural backgrounds of students by length of teaching experience
Years of Teaching experience
Strongly agree
Agree somewhat
Disagree Somewhat
Strongly disagree
No answer Total
0-5 6 0 0 0 0 6 6-10 0 3 0 0 0 3 11-15 0 1 0 0 0 1 16-20 0 0 0 0 0 0 21-25 0 0 0 0 0 0 25+ 0 2 0 0 0 2 Not mansion 2 0 0 0 0 2 Total 8 6 0 0 0 14
Table 13: Teachers’ ratings of the importance of awareness of the ethnic and cultural backgrounds of students by highest educational qualification
Highest educational qualification
Strongly agree
Agree somewhat
Disagree somewhat
Strongly disagree
No answer Total
Master of Arts 0 1 0 0 0 1 Postgraduate diploma in education
3 1 0 0 0 4
Degree 3 3 0 0 0 6 Teaching Certificate
0 1 0 0 0 1
Not mention 2 0 0 0 0 2 Total 8 6 0 0 0 14
Table 14: Teacher ratings of existence of the opportunity to participate in workshops for multicultural education by teaching experience
Years of Teaching experience
Sometimes Occasionally Never No answer Total
0-5 2 0 3 1 6 6-10 0 1 2 0 3 11-15 0 0 1 0 3 16-20 0 0 0 0 0 21-25 0 0 0 0 0 25+ 0 1 1 0 2 Not mansion 0 1 1 0 2 Total 2 3 8 1 14

290
Table 15: Teachers’ perceptions of the opportunity to participate in workshops for multicultural education by highest education qualification
Highest educational qualification
Sometimes Occasionally Never No answer Total
Master of Arts 0 1 0 0 1 Postgraduate diploma in education
0 0 3 1 4
Degree 2 1 3 0 6 Teaching Certificate 0 0 1 0 1 Not mention 0 1 1 0 2 Total 2 3 8 1 14
Table 16: Teachers’ ratings of whether school libraries had a good collection of multicultural materials by teacher ethnicity
Ethnic background
Strongly agree
Agree somewhat
Disagree Somewhat
Strongly disagree
No answer Total
White British 1 2 4 1 1 9 Mixed (White and Black Caribbean)
0 0 1 0 0 1
White- Irish 1 0 0 0 0 1 Asian British (Pakistani)
0 1 0 0 0 1
Asian British (Bangladeshi)
0 1 0 0 0 1
Not Mention 0 0 1 0 0 1 Total 2 4 6 1 1 14
Table 17: Teachers’ ratings of whether schools provide counselling services related to students’ academic needs by teacher ethnicity
Ethnic background
Strongly agree
Agree somewhat
Disagree Somewhat
Strongly disagree
No answer Total
White British 4 5 0 0 0 9 Mixed (White and Black Caribbean)
0 0 1 0 0 1
White- Irish 1 0 0 0 0 1 Asian British (Pakistani)
0 1 0 0 0 1
Asian British (Bangladeshi)
0 1 0 0 0 1
Not Mention 0 1 0 0 0 1 Total 5 9 0 0 0 14

291
Table 18: Teachers’ ratings of whether schools provide counselling services related to students’ social needs by ethnicity.
Ethnic background
Strongly agree
Agree somewhat
Disagree Somewhat
Strongly disagree
No answer Total
White British 7 2 0 0 0 9 Mixed (White and Black Caribbean)
0 1 0 0 0 1
White- Irish 1 0 0 0 0 1 Asian British (Pakistani)
0 1 0 0 0 1
Asian British (Bangladeshi)
0 1 0 0 0 1
Not Mention 0 0 1 0 0 1 Total 8 6 0 0 0 14
Table 19: Teachers’ ratings of whether counsellors have knowledge and skills for effective cross-cultural counselling by teacher ethnicity
Ethnic background
Strongly agree
Agree somewhat
Disagree Somewhat
Strongly disagree
No answer Total
White British 0 7 1 0 1 9 Mixed (White and Black Caribbean)
0 0 0 1 0 1
White- Irish 1 0 0 0 0 1 Asian British (Pakistani)
0 1 0 0 0 1
Asian British (Bangladeshi)
0 1 0 0 0 1
Not Mention 1 0 0 0 0 1 Total 2 9 1 1 1 14
Table 20: Ratings of the importance of making a special effort to raise the achievement of students from minority ethnic backgrounds by teaching experience
Years of Teaching experience
Strongly agree
Agree somewhat
Disagree Somewhat
Strongly disagree
No answer Total
0-5 3 3 0 0 0 6 6-10 2 1 0 0 0 3 11-15 0 1 0 0 0 1 16-20 0 0 0 0 0 0 21-25 0 0 0 0 0 0 25+ 1 1 0 0 0 2 Not mansion 1 1 0 0 0 2
Total 7 7 0 0 0 14

292
Table 21: Perceptions of whether schools have a system for monitoring the progress of all ethnic groups of students by teacher ethnicity
Ethnic background
Strongly agree
Agree somewhat
Disagree Somewhat
Strongly disagree
No answer Total
White British 3 1 3 0 2 9 Mixed (White and Black Caribbean)
0 0 0 1 0 1
White- Irish 0 1 0 0 0 1 Asian British (Pakistani)
0 1 0 0 0 1
Asian British (Bangladeshi)
0 1 0 0 0 1
Not Mention 1 0 0 0 0 1 Total 4 4 3 1 2 14
Table 22: Teachers ‘ratings of the importance of making a special effort for students with learning difficulties by teacher ethnicity
Ethnic background
Strongly agree
Agree somewhat
Disagree Somewhat
Strongly disagree
No answer Total
White British 9 0 0 0 0 9 Mixed (White and Black Caribbean)
1 0 0 0 0 1
White- Irish 1 0 0 0 0 1 Asian British (Pakistani)
0 1 0 0 0 1
Asian British (Bangladeshi)
1 0 0 0 0 1
Not Mention 1 0 0 0 0 1 Total 13 1 0 0 0 14