tiruppur sanitation plan - tiruppurcorporation.comtiruppurcorporation.com/pdf/amrut/csp1.pdf ·...
TRANSCRIPT
City Sanitation Plan Page 1
TIRUPPUR CITY MUNICIPALCORPORATION
City Sanitation Plan
City Sanitation Plan Page 2
Tiruppur City Municipal Corporation
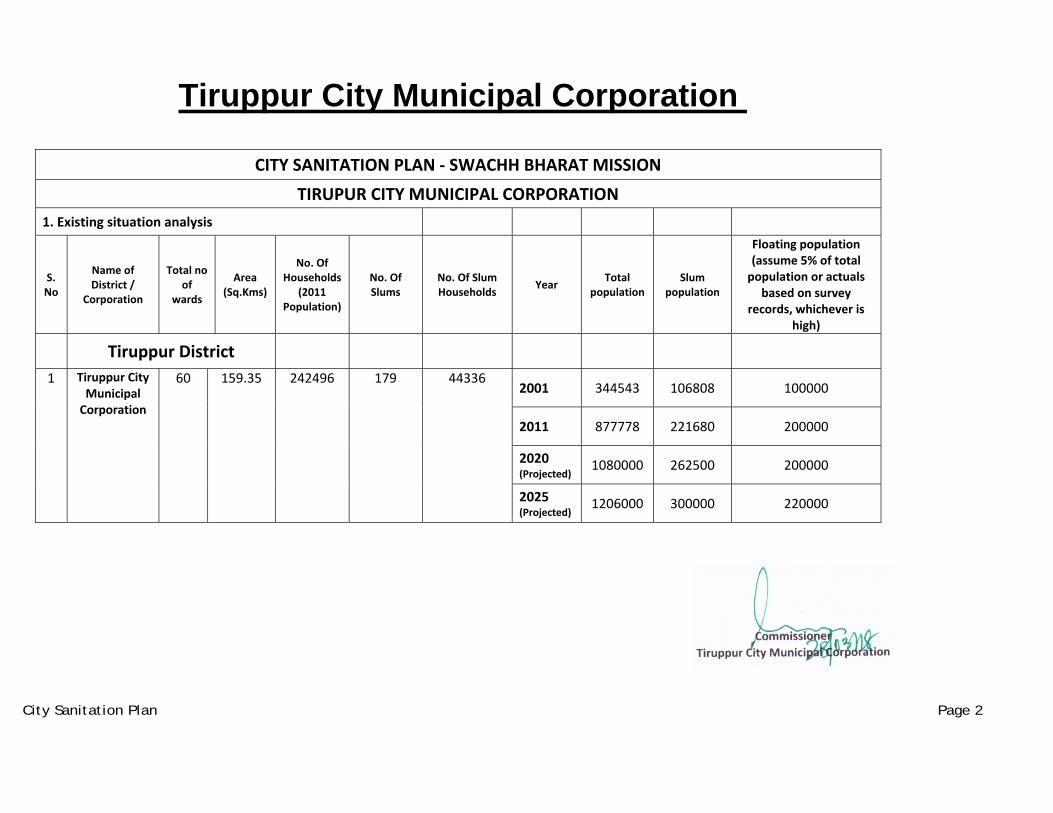
CITY SANITATION PLAN ‐ SWACHH BHARAT MISSION
TIRUPUR CITY MUNICIPAL CORPORATION 1. Existing situation analysis
S. No
Name of District /
Corporation
Total no of
wards
Area (Sq.Kms)
No. Of Households
(2011 Population)
No. Of Slums
No. Of Slum Households Year Total
population Slum
population
Floating population (assume 5% of total population or actuals
based on survey records, whichever is
high)
Tiruppur District
1 Tiruppur City Municipal Corporation
60 159.35 242496 179 44336 2001 344543 106808 100000
2011 877778 221680 200000
2020 (Projected) 1080000 262500 200000
2025 (Projected) 1206000 300000 220000
City Sanitation Plan Page 3
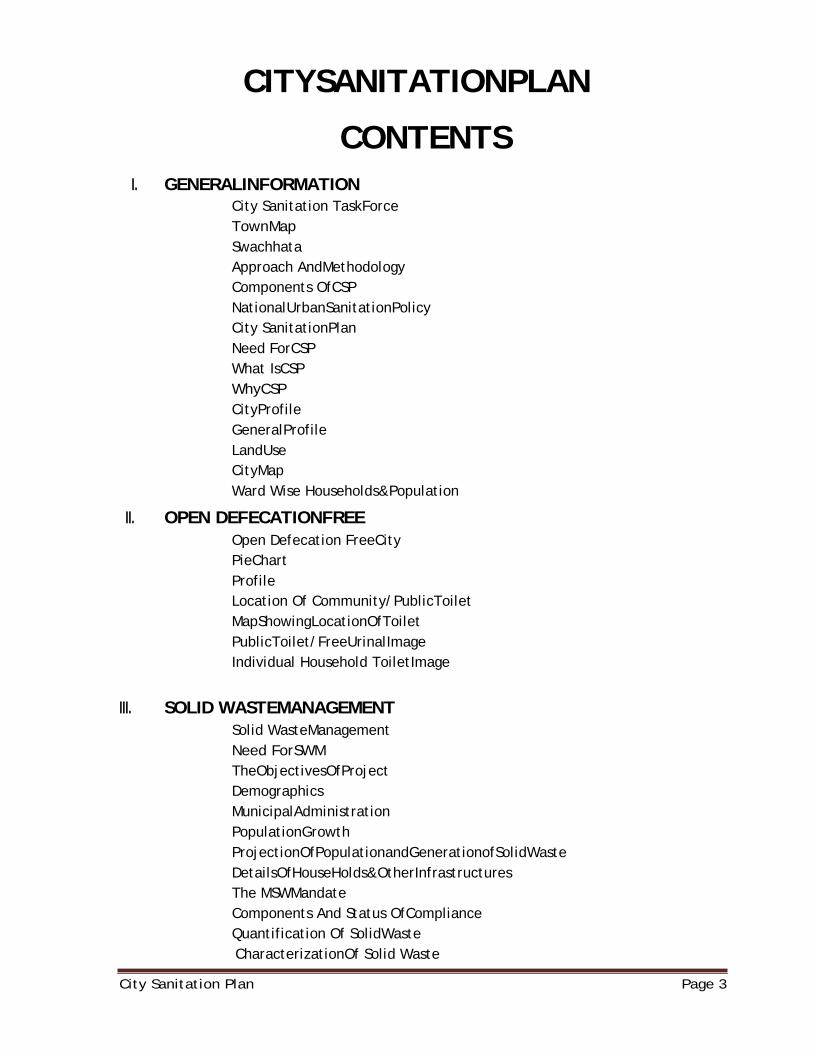
CITYSANITATIONPLAN
CONTENTS I. GENERALINFORMATION
� City Sanitation TaskForce � TownMap � Swachhata � Approach AndMethodology � Components OfCSP � NationalUrbanSanitationPolicy � City SanitationPlan � Need ForCSP � What IsCSP � WhyCSP � CityProfile � GeneralProfile � LandUse � CityMap � Ward Wise Households&Population
II. OPEN DEFECATIONFREE � Open Defecation FreeCity � PieChart � Profile � Location Of Community/PublicToilet � MapShowingLocationOfToilet � PublicToilet/FreeUrinalImage � Individual Household ToiletImage
III. SOLID WASTEMANAGEMENT
� Solid WasteManagement � Need ForSWM � TheObjectivesOfProject � Demographics � MunicipalAdministration � PopulationGrowth � ProjectionOfPopulationandGenerationofSolidWaste � DetailsOfHouseHolds&OtherInfrastructures � The MSWMandate � Components And Status OfCompliance � Quantification Of SolidWaste � CharacterizationOf Solid Waste
City Sanitation Plan Page 4
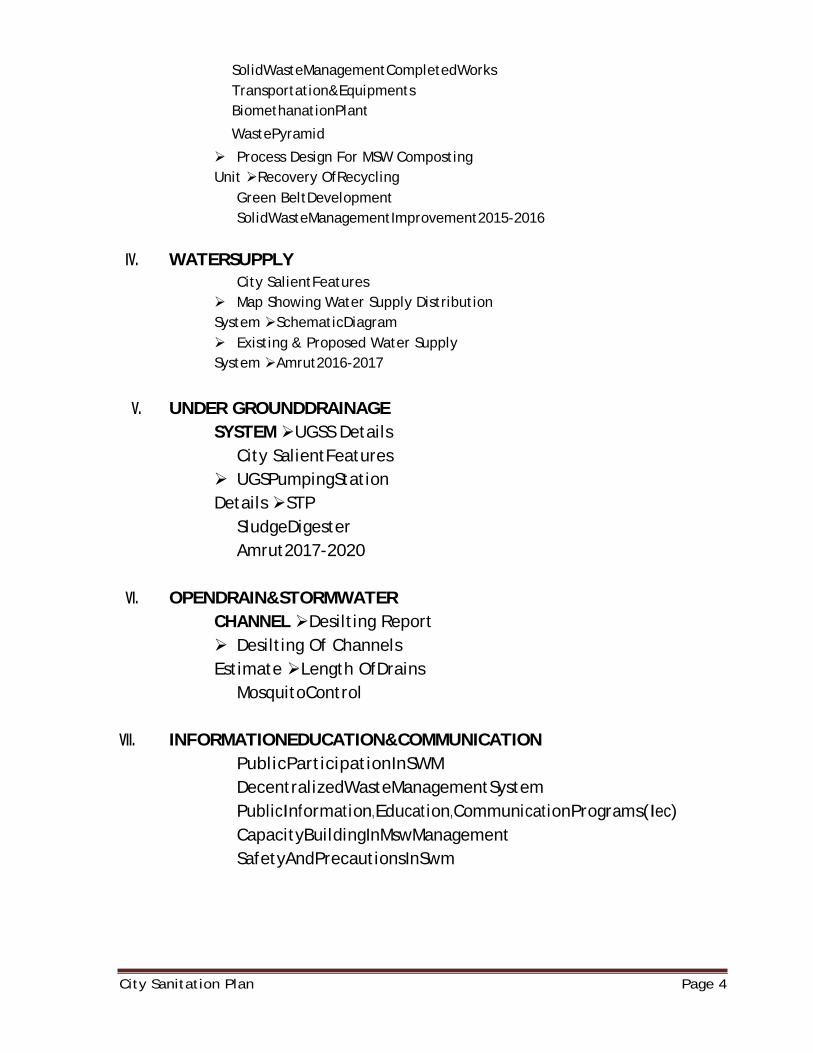
� SolidWasteManagementCompletedWorks � Transportation&Equipments � BiomethanationPlant
� WastePyramid
Process Design For MSW Composting Unit Recovery OfRecycling � Green BeltDevelopment � SolidWasteManagementImprovement2015-2016
IV. WATERSUPPLY
� City SalientFeatures Map Showing Water Supply Distribution
System SchematicDiagram Existing & Proposed Water Supply
System Amrut2016-2017
V. UNDER GROUNDDRAINAGE
SYSTEM UGSS Details � City SalientFeatures
UGSPumpingStation Details STP � SludgeDigester � Amrut2017-2020
VI. OPENDRAIN&STORMWATER
CHANNEL Desilting Report Desilting Of Channels
Estimate Length OfDrains � MosquitoControl
VII. INFORMATIONEDUCATION&COMMUNICATION
� PublicParticipationInSWM � DecentralizedWasteManagementSystem � PublicInformation,Education,CommunicationPrograms(Iec) � CapacityBuildingInMswManagement � SafetyAndPrecautionsInSwm
City Sanitation Plan Page 5
GENERAL INFORMATION
City Sanitation Plan Page 6
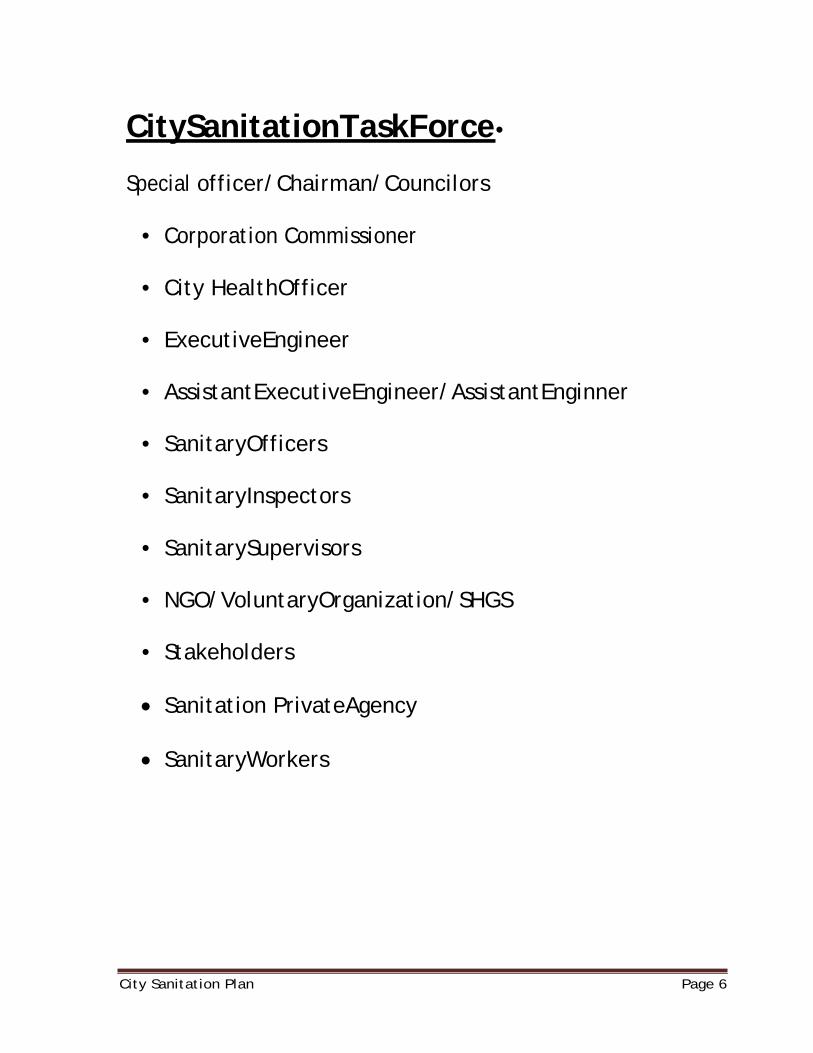
CitySanitationTaskForce•
Special officer/Chairman/Councilors
• Corporation Commissioner
• City HealthOfficer
• ExecutiveEngineer
• AssistantExecutiveEngineer/AssistantEnginner
• SanitaryOfficers
• SanitaryInspectors
• SanitarySupervisors
• NGO/VoluntaryOrganization/SHGS
• Stakeholders
• Sanitation PrivateAgency
• SanitaryWorkers
City Sanitation Plan Page 7
City Sanitation Plan Page 8
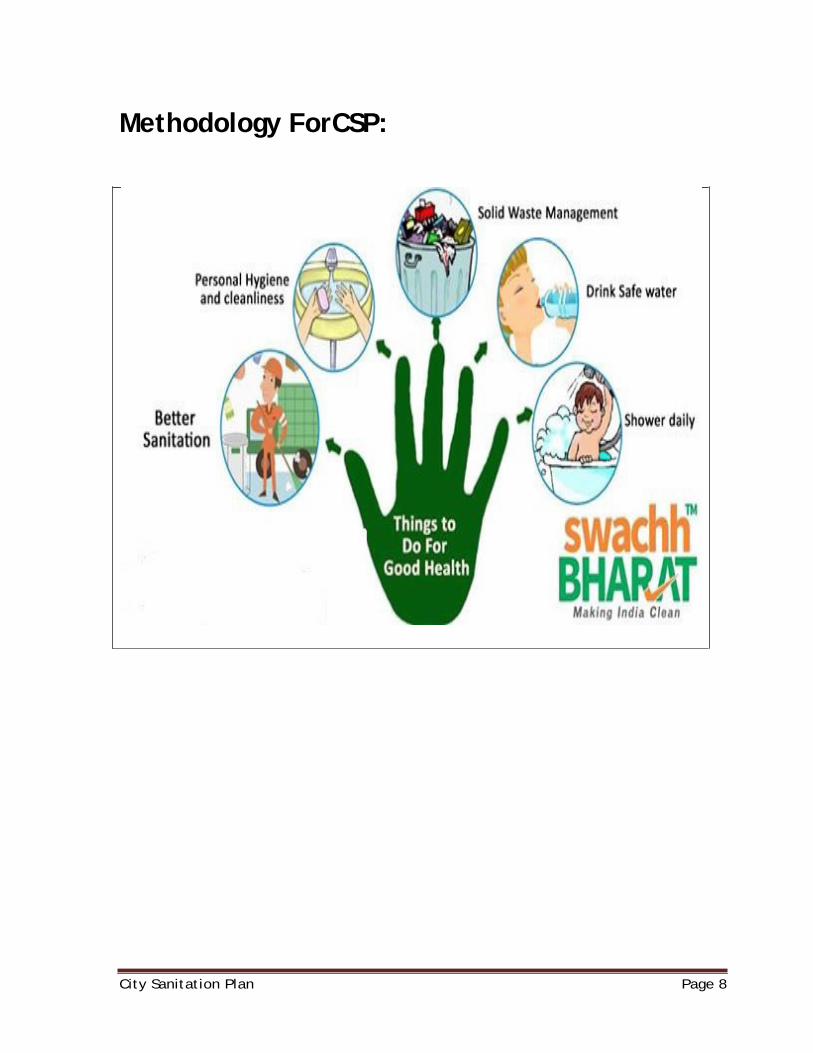
Methodology ForCSP:
City Sanitation Plan Page 9
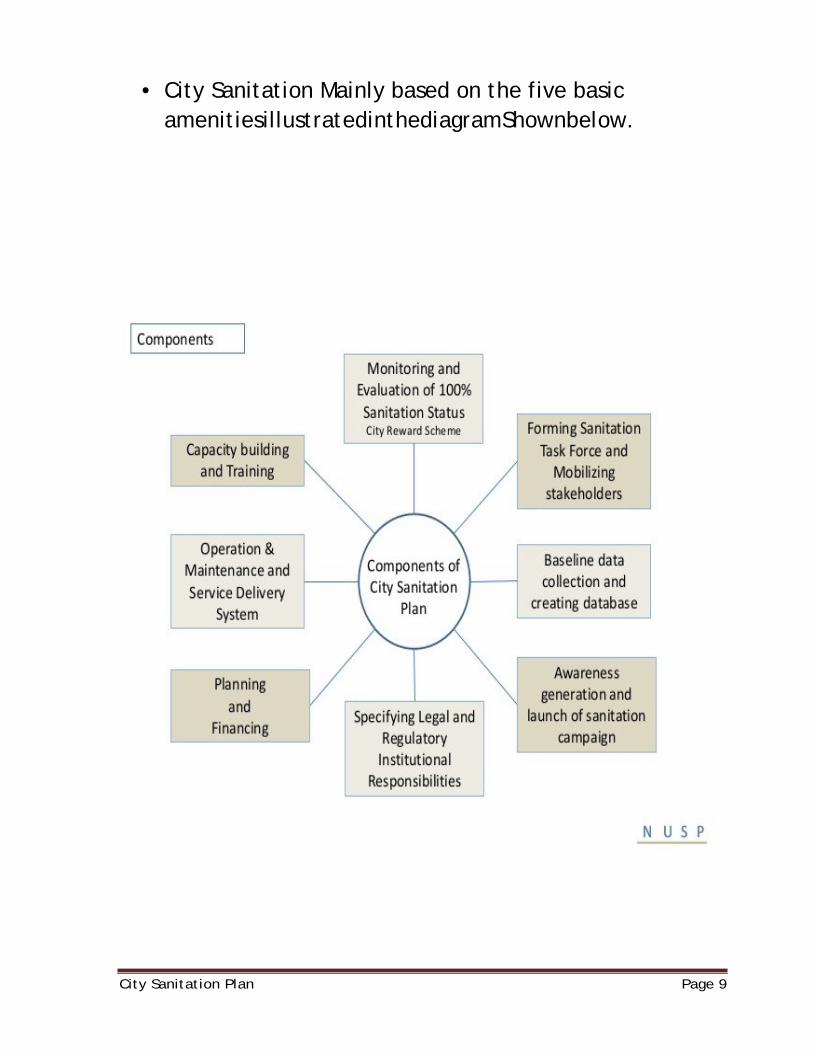
• City Sanitation Mainly based on the five basic amenitiesillustratedinthediagramShownbelow.
City Sanitation Plan Page 10
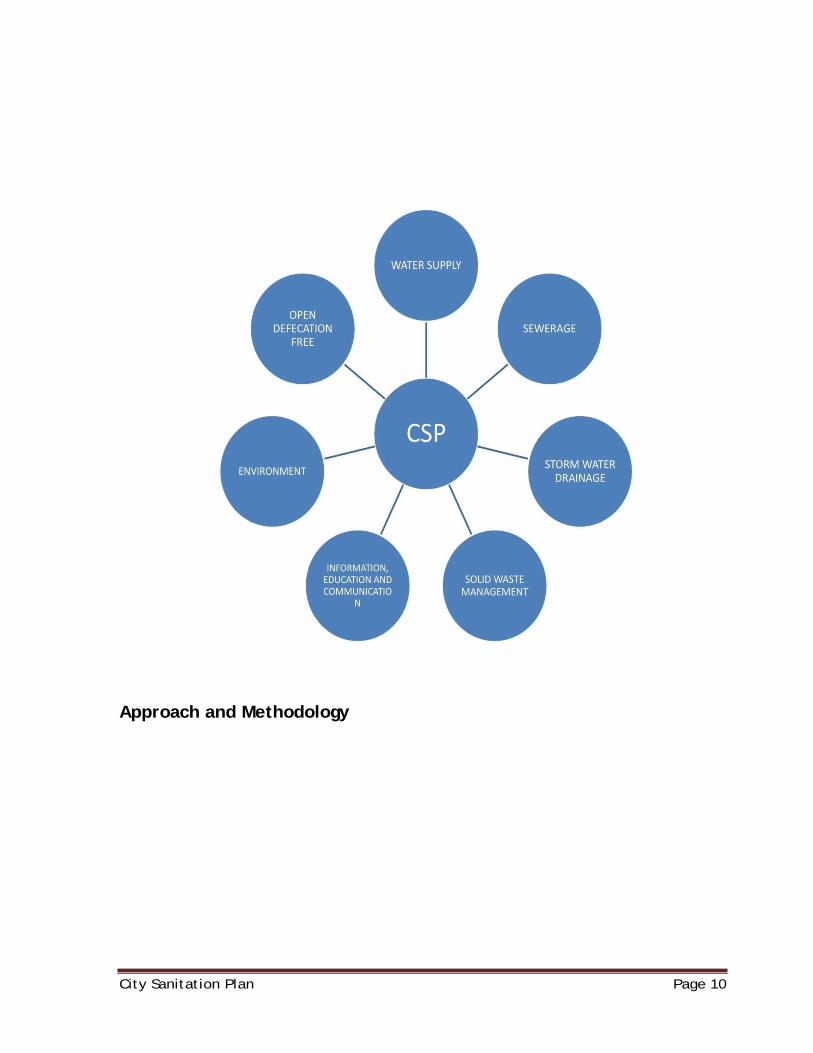
Approach and Methodology
City Sanitation Plan Page 11
COMPONENTS OFCSP
Water Supply
• Sewage
• Storm waterdrainage
• Solid WasteManagement
• Information,EducationandCommunication
• Environment
• Open defectionfree
City Sanitation Plan Page 12
National Urban sanitation Policy (NUSP)
National Urban Sanitation Policy (NUSP) has been
formulatedbyGovernmentofIndiawithavisiontoprovide
appropriateSanitationfacilitiesinallcities/towns.Statehave to
prepare State Sanitation Strategies and cities/townsare
requiredtopreparecitySanitationPlans(CSPs)asperNUSP
guidelines,so as to improve health and environmental
outcomes.TheCSPisavisiondocumentonsanitationwith20
to25yearshorizonwithshorttermtownlevelactionplans for
five years to achieve sanitation goals. CSP envisages
achievingthefollowingoutputs
� OpenDefecationfreestatus. � Elimination of manual Scavenging and safety of
sanitryworkers. � Prepare disposal of rain water and storm water
drainage. � Recycleandreuseoftreatedwastewaterfornon-
potableapplications. � Solid waste fullycollectedand safely disposedof
scientifically. � Servingtheunservedwithbasicminimumservices. � Measures for improved public health and
environmentalstandards.
City Sanitation Plan Page 13
CITY SANITATIONPLAN • Opendefecationfreetown
• Providingindividualhouseholdstoiletstoallhouseholdsin thecity
• MaintenanceofCommunity/PublicToiletsinahygenic manner
• Providingprotectedwatersupplytoallhouseholdsinthe town.
• SafedisposalofsewagewaterinUGDscheme.
• ProvidingUGDconnectiontoallhouseholds/Commercial / Public & Private institutions.
• Drainageandstormwaterdrainagetobestrengthenedand wellmaintenanceofthesame.
• 100%doortodoorSegregatedGarbageCollection.
• Bulkwastegarbagegeneratorstodisposebiowaste.
• Municipalsolidwastetobecollectedanddisposed scientifically.
• Reclamationofexistingdumpsite.
• Dryrecyclablewastearetobecollectedonceinaweek.
• Recyclablewastearetobesoldtotherecyclersandthe amountdisbursedamongsanitaryworkersconcerned.
• GarbagefreeTiruppurtobeachieved.
• Providingsafetyequipmentstoallsanitaryworkers.
• SettingupofMCCcenterssothatallbiowastearedisposed at thesite.
• Capacitybuilding/Trainingprogramsforallstaff.
City Sanitation Plan Page 14
• Medicalcamp/Eyecamptobeorganizedatperiodical intervals.
• ProvidingMedicalfacilitiestoallcitizensinthetown.
Need forCSP • Toachievethegoalofuniversalsanitation
• To develop access to safe and hygienic sanitation facility and arrangements (individual or community toilets) to all urban populationsothatnoonedefecatesintheopen
• To develop adequate availability and 100 percent upkeepand managementofpublicsanitationfacilitiesinallurbanareaslike commercialareas,offices,institutionandservicecentresetc.
• Toensurescientificcollection,treatmentandsafedisposaland establishappropriateandfeasibletechnologyofdisposalsystem for human excreta & liquid waste from all sanitationfacilities andestablishappropriatesystemofoperation&maintenanceof the disposalsystem.
City Sanitation Plan Page 15
What isCSP? The CSP is a vision document on Sanitation with 20 to 25
years horizon with short term town level action plans for 3-5 yearstoachievesanitationgoalsasperabovestatedobjections.
Broad areas to be covered in CSP are:
• Awarenessgeneration
• SanitarychoicesandTechnicaloptions
• Operation&MaintenanceandserviceDeliverysystem
• InstitutionalResponsibilities
• Reachingtheun-servedandpoorhouseholds
• LegalandRegulatoryInstitutionalResponsibilities
• Planning andFinancing
• Capacity Building &Training
• ImplementationManagement
• Monitoring&Evaluationandsupervision • City RewardSchemes.
City Sanitation Plan Page 16
WHY CSP • Facilitatevisiononalongtermperspective.
• Sanitationaspectshouldbeapproachedtoensure effectiveness
• Longtermvisionontransiontoa100%sanitizedcity.
• Tounderstandthecostanduserchargesimplications.
• Ensureproperassessmentofcodexandinvestment phasing
• Awarenessandsensitizationofcommunity.
City Sanitation Plan Page 17
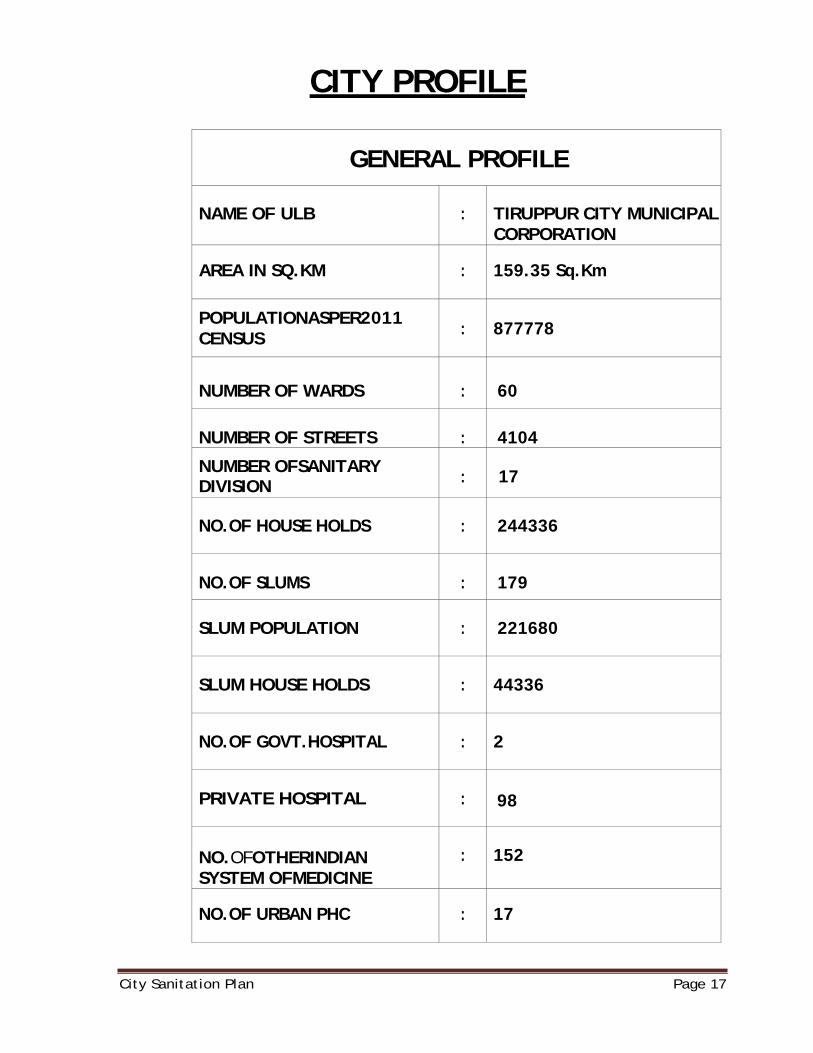
CITY PROFILE
GENERAL PROFILE NAME OF ULB
: TIRUPPUR CITY MUNICIPAL
CORPORATION
AREA IN SQ.KM : 159.35 Sq.Km
POPULATIONASPER2011 CENSUS
:
877778
NUMBER OF WARDS
:
60
NUMBER OF STREETS
:
4104
NUMBER OFSANITARY DIVISION
:
17
NO.OF HOUSE HOLDS
:
244336
NO.OF SLUMS
:
179
SLUM POPULATION
:
221680
SLUM HOUSE HOLDS
:
44336
NO.OF GOVT.HOSPITAL
:
2
PRIVATE HOSPITAL
:
98
NO.OFOTHERINDIAN SYSTEM OFMEDICINE
:
152
NO.OF URBAN PHC : 17
City Sanitation Plan Page 18
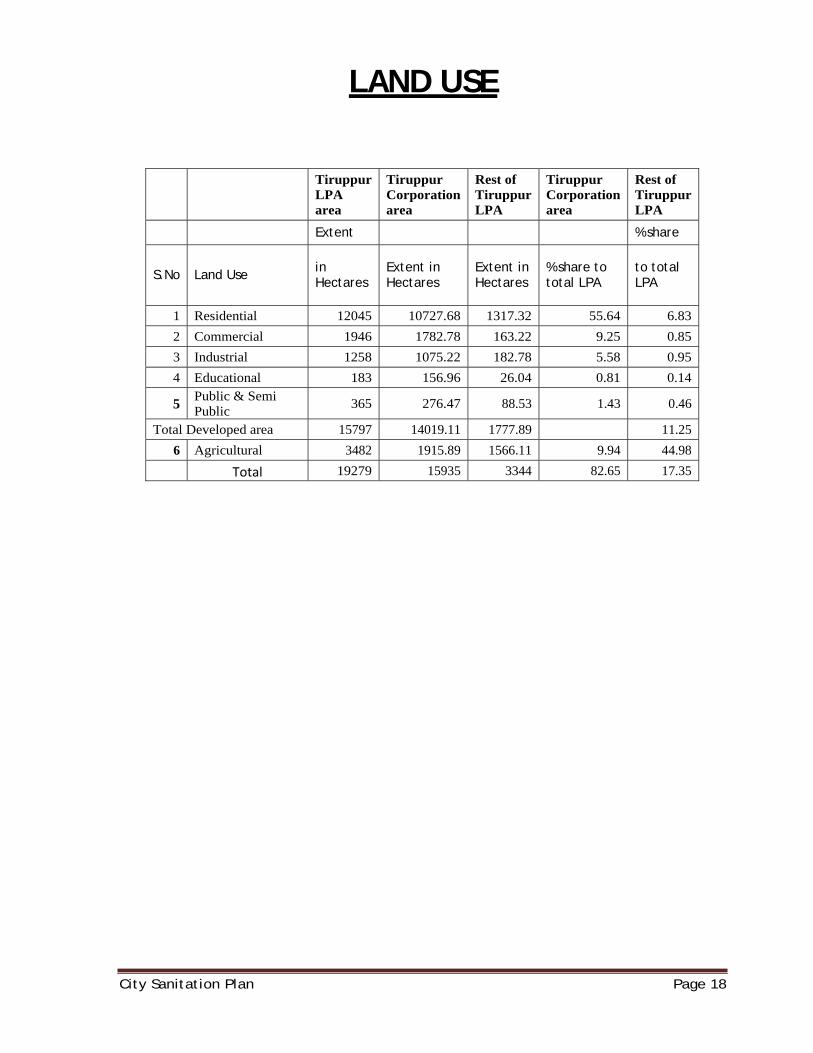
LAND USE
Tiruppur LPA area
Tiruppur Corporation area
Rest of Tiruppur LPA
Tiruppur Corporation area
Rest of Tiruppur LPA
Extent % share
S.No Land Use in Hectares
Extent in Hectares
Extent in Hectares
% share to total LPA
to total LPA
1 Residential 12045 10727.68 1317.32 55.64 6.83 2 Commercial 1946 1782.78 163.22 9.25 0.85 3 Industrial 1258 1075.22 182.78 5.58 0.95 4 Educational 183 156.96 26.04 0.81 0.14
5 Public & Semi Public 365 276.47 88.53 1.43 0.46
Total Developed area 15797 14019.11 1777.89 11.25 6 Agricultural 3482 1915.89 1566.11 9.94 44.98
Total 19279 15935 3344 82.65 17.35
City Sanitation Plan Page 19
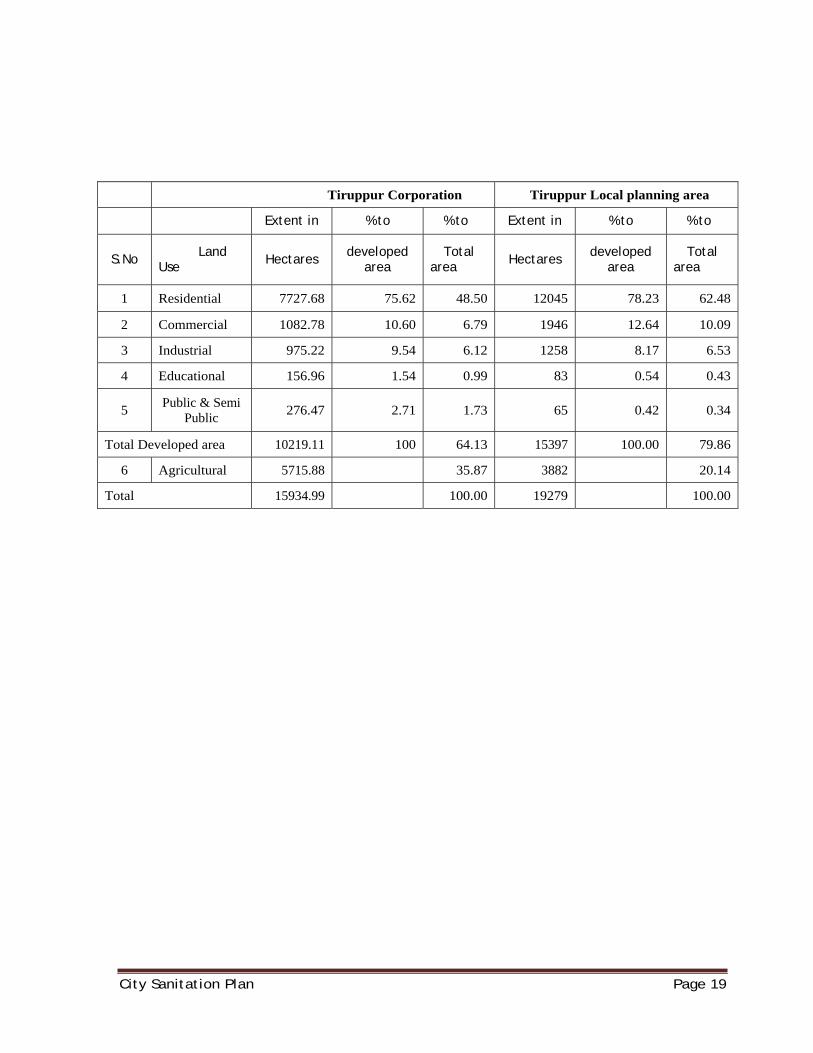
Tiruppur Corporation Tiruppur Local planning area
Extent in % to % to Extent in % to % to
S.No Land Use Hectares developed
area Total
area Hectares developed area
Total area
1 Residential 7727.68 75.62 48.50 12045 78.23 62.48
2 Commercial 1082.78 10.60 6.79 1946 12.64 10.09
3 Industrial 975.22 9.54 6.12 1258 8.17 6.53
4 Educational 156.96 1.54 0.99 83 0.54 0.43
5 Public & Semi Public 276.47 2.71 1.73 65 0.42 0.34
Total Developed area 10219.11 100 64.13 15397 100.00 79.86
6 Agricultural 5715.88 35.87 3882 20.14
Total 15934.99 100.00 19279 100.00
City Sanitation Plan Page 20
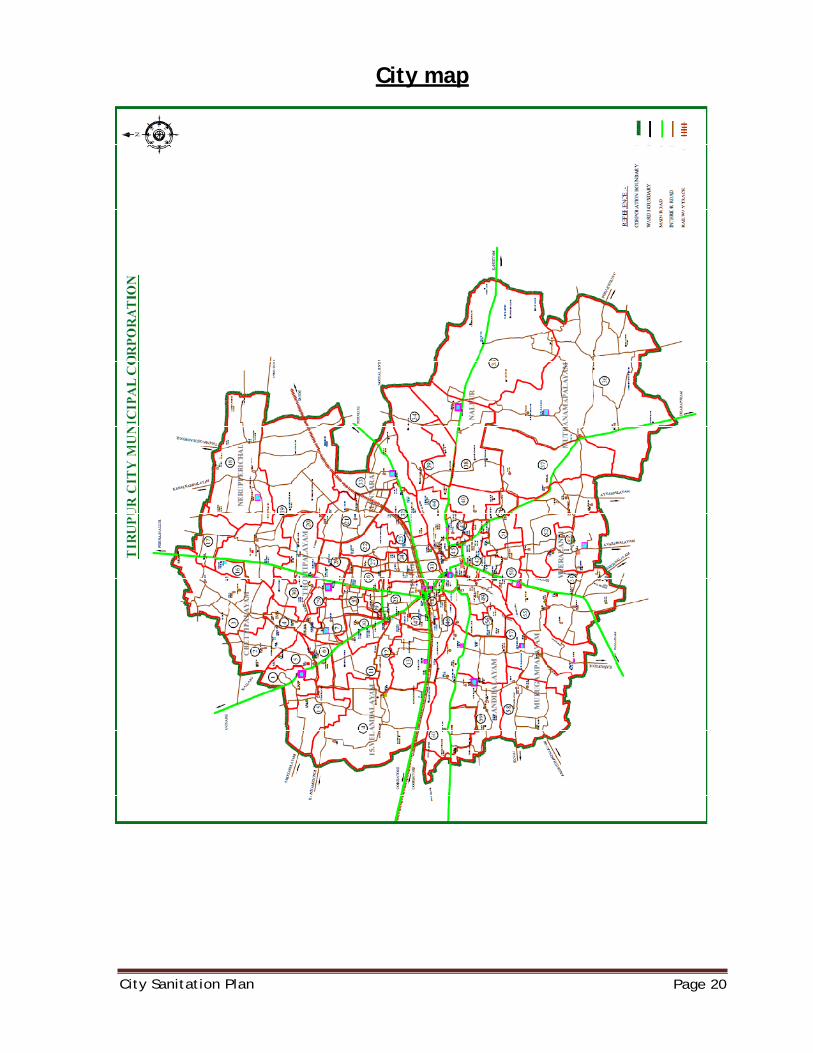
City map
City Sanitation Plan Page 21
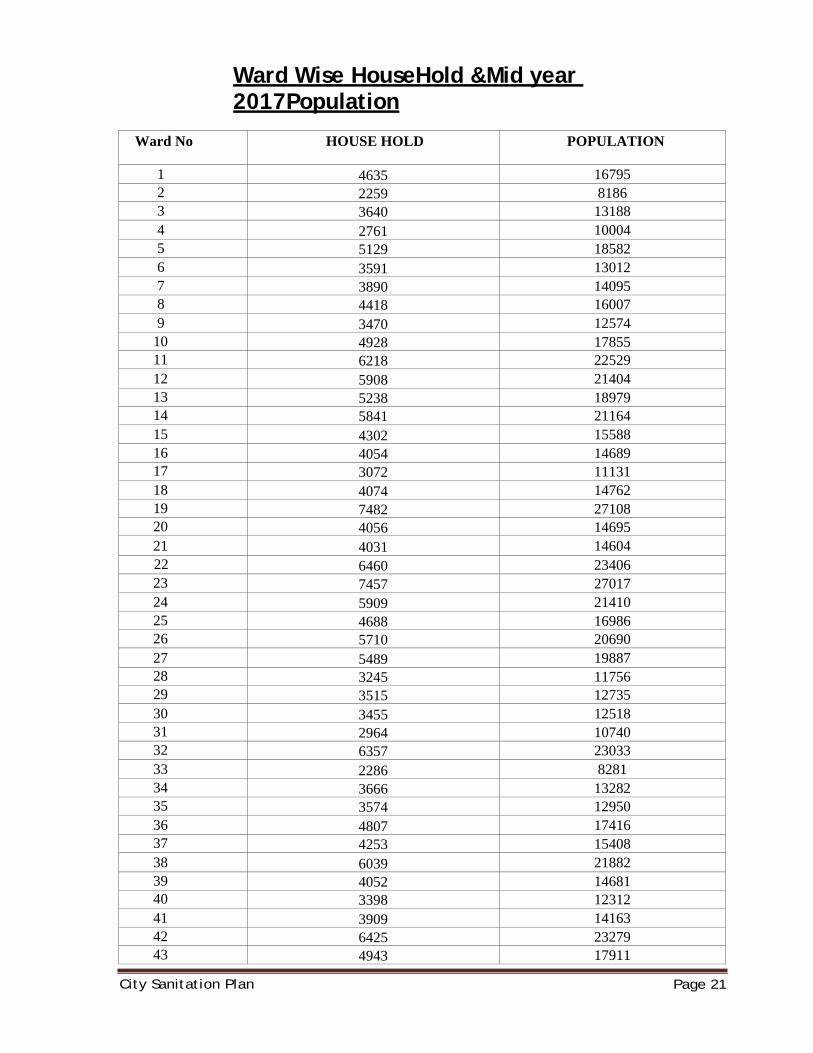
Ward Wise HouseHold &Mid year 2017Population
Ward No HOUSE HOLD POPULATION
1 4635 16795 2 2259 8186 3 3640 13188 4 2761 10004 5 5129 18582 6 3591 13012 7 3890 14095 8 4418 16007 9 3470 12574
10 4928 17855 11 6218 22529 12 5908 21404 13 5238 18979 14 5841 21164 15 4302 15588 16 4054 14689 17 3072 11131 18 4074 14762 19 7482 27108 20 4056 14695 21 4031 14604 22 6460 23406 23 7457 27017 24 5909 21410 25 4688 16986 26 5710 20690 27 5489 19887 28 3245 11756 29 3515 12735 30 3455 12518 31 2964 10740 32 6357 23033 33 2286 8281 34 3666 13282 35 3574 12950 36 4807 17416 37 4253 15408 38 6039 21882 39 4052 14681 40 3398 12312 41 3909 14163 42 6425 23279 43 4943 17911
City Sanitation Plan Page 22
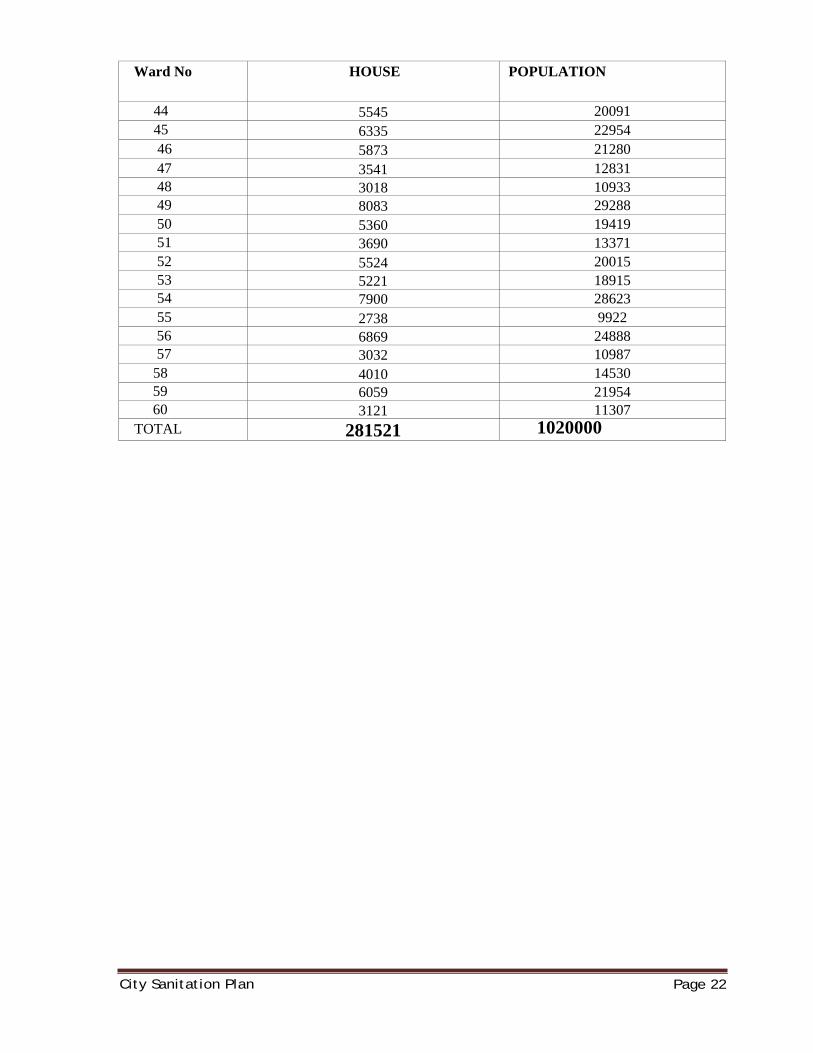
Ward No HOUSE POPULATION
44 5545 20091 45 6335 22954 46 5873 21280 47 3541 12831 48 3018 10933 49 8083 29288 50 5360 19419 51 3690 13371 52 5524 20015 53 5221 18915 54 7900 28623 55 2738 9922 56 6869 24888 57 3032 10987
58 4010 14530 59 6059 21954 60 3121 11307
TOTAL 281521 1020000
City Sanitation Plan Page 23
OPEN DEFECATION FREECITY
City Sanitation Plan Page 24
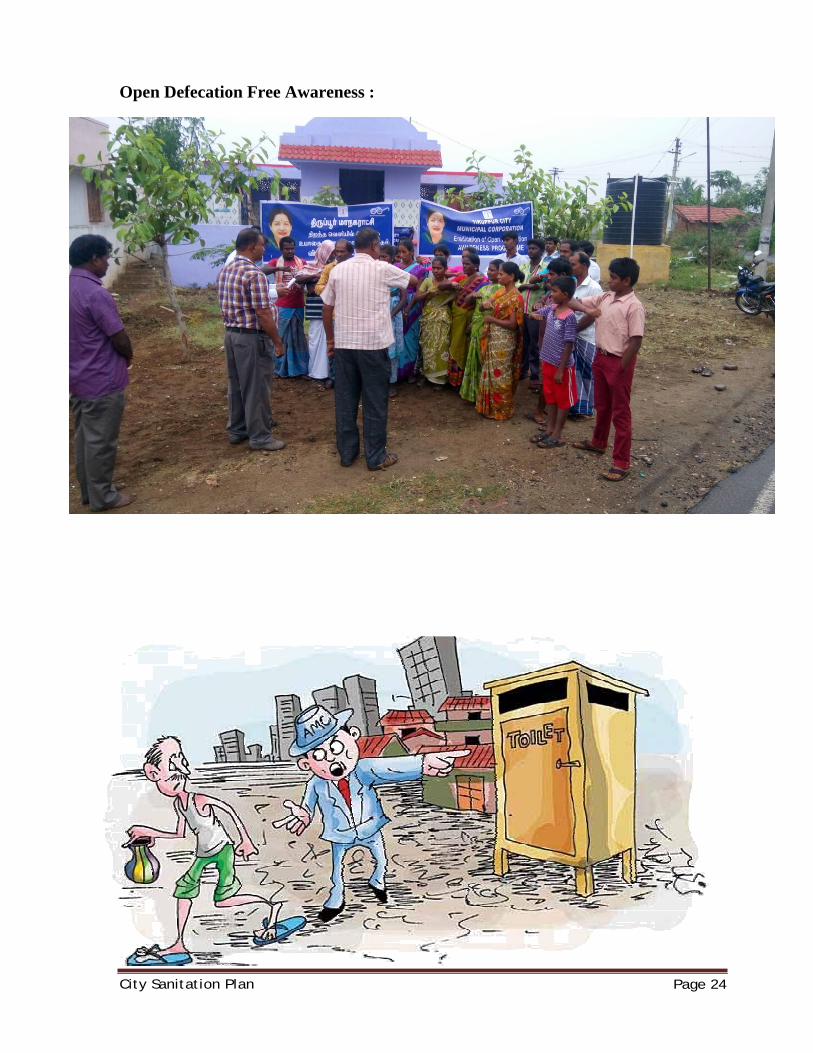
Open Defecation Free Awareness :
City Sanitation Plan Page 25
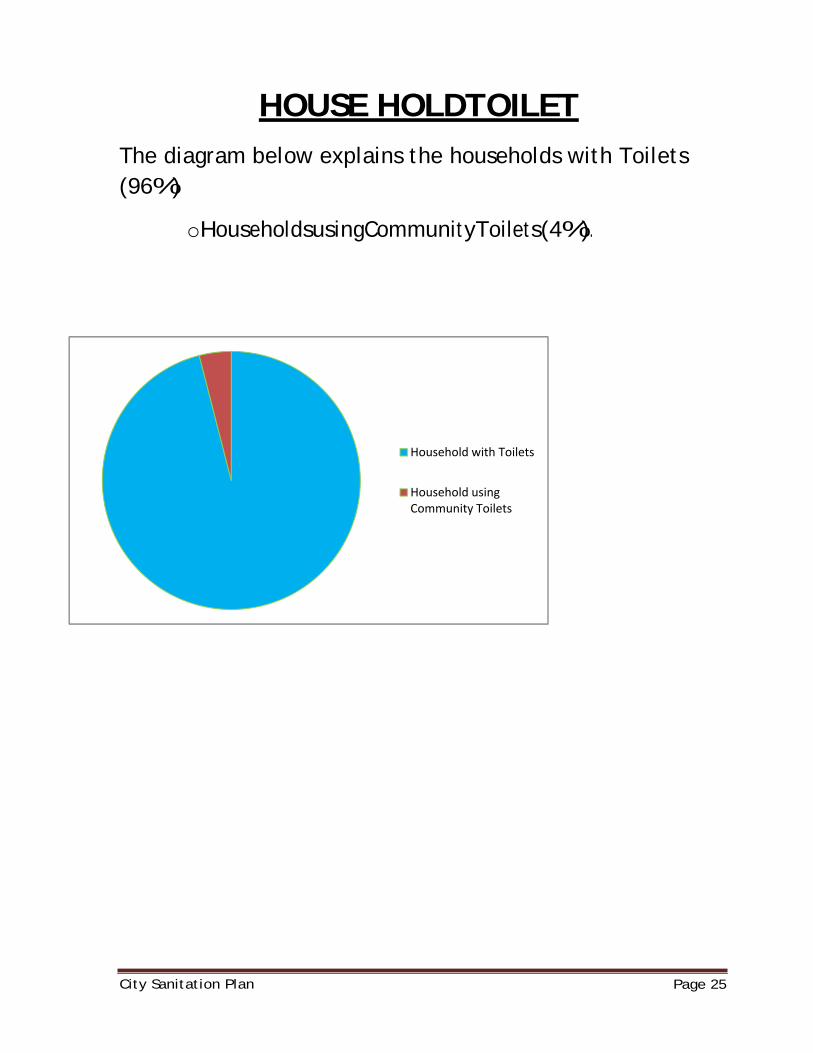
HOUSE HOLDTOILET The diagram below explains the households with Toilets (96%)
oHouseholdsusingCommunityToilets(4%).
Household with Toilets
Household using Community Toilets
City Sanitation Plan Page 26
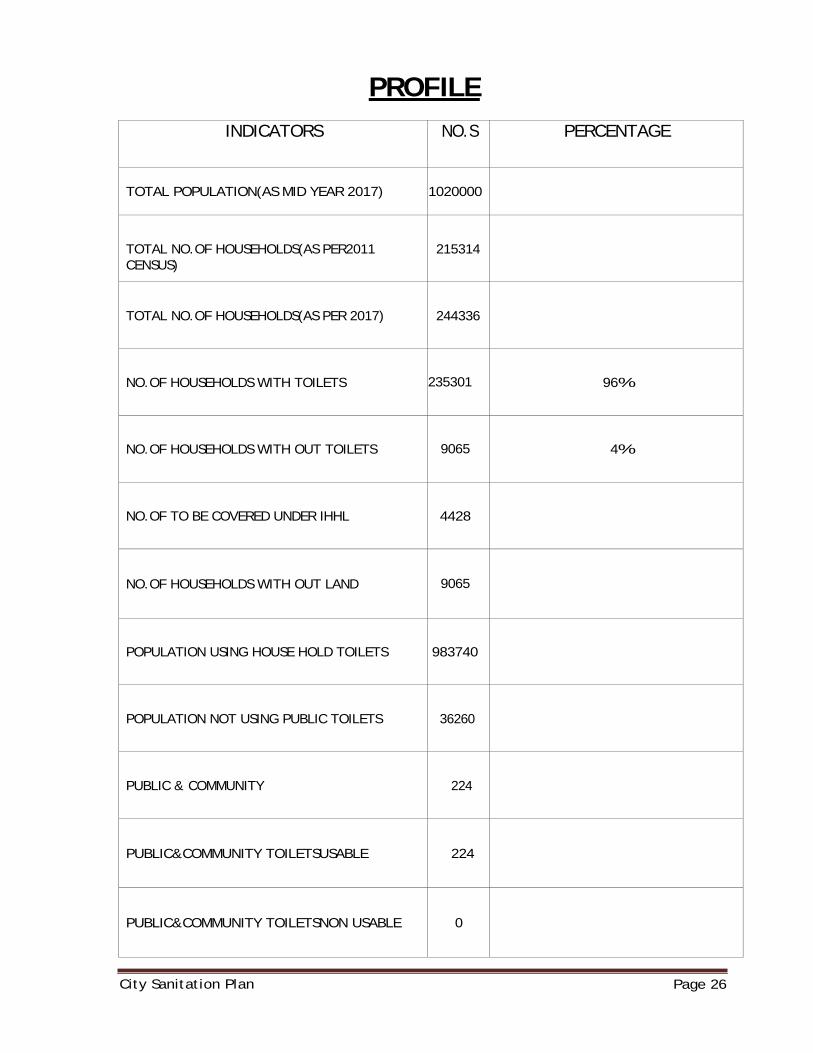
PROFILE
INDICATORS NO.S PERCENTAGE
TOTAL POPULATION(AS MID YEAR 2017)
1020000
TOTAL NO.OF HOUSEHOLDS(AS PER2011 CENSUS)
215314
TOTAL NO.OF HOUSEHOLDS(AS PER 2017)
244336
NO.OF HOUSEHOLDS WITH TOILETS
235301
96%
NO.OF HOUSEHOLDS WITH OUT TOILETS
9065
4%
NO.OF TO BE COVERED UNDER IHHL
4428
NO.OF HOUSEHOLDS WITH OUT LAND
9065
POPULATION USING HOUSE HOLD TOILETS
983740
POPULATION NOT USING PUBLIC TOILETS
36260
PUBLIC & COMMUNITY
224
PUBLIC&COMMUNITY TOILETSUSABLE
224
PUBLIC&COMMUNITY TOILETSNON USABLE
0
City Sanitation Plan Page 27
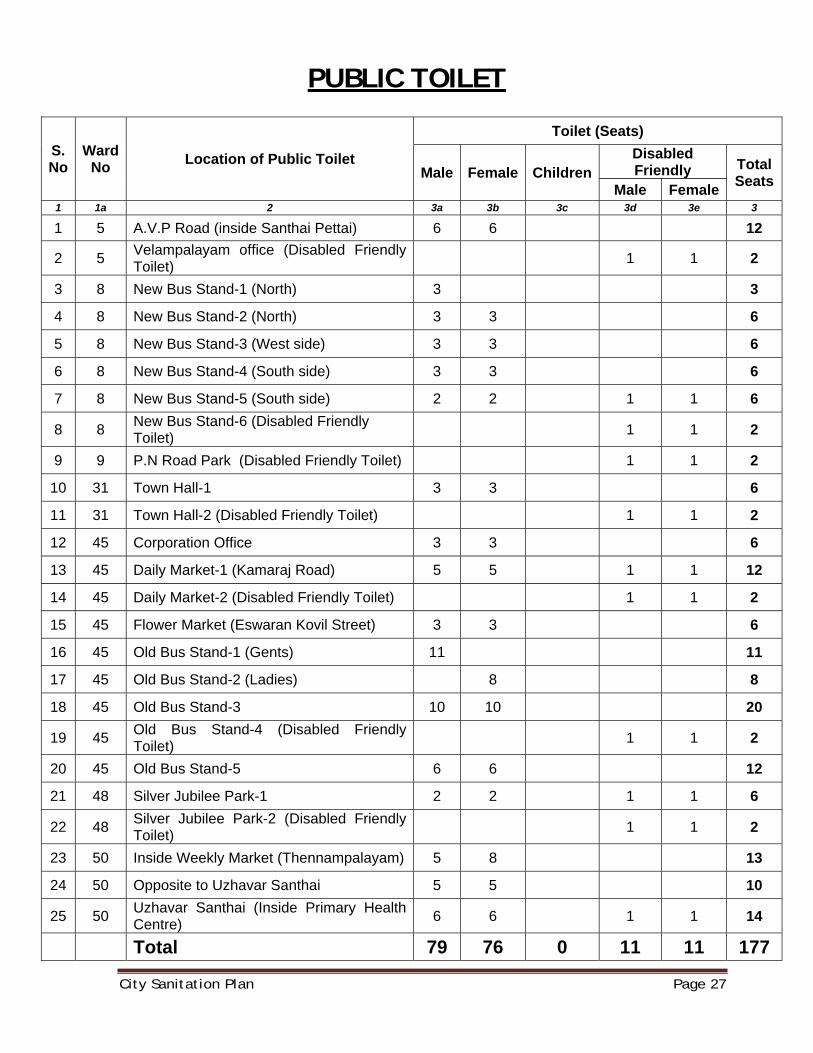
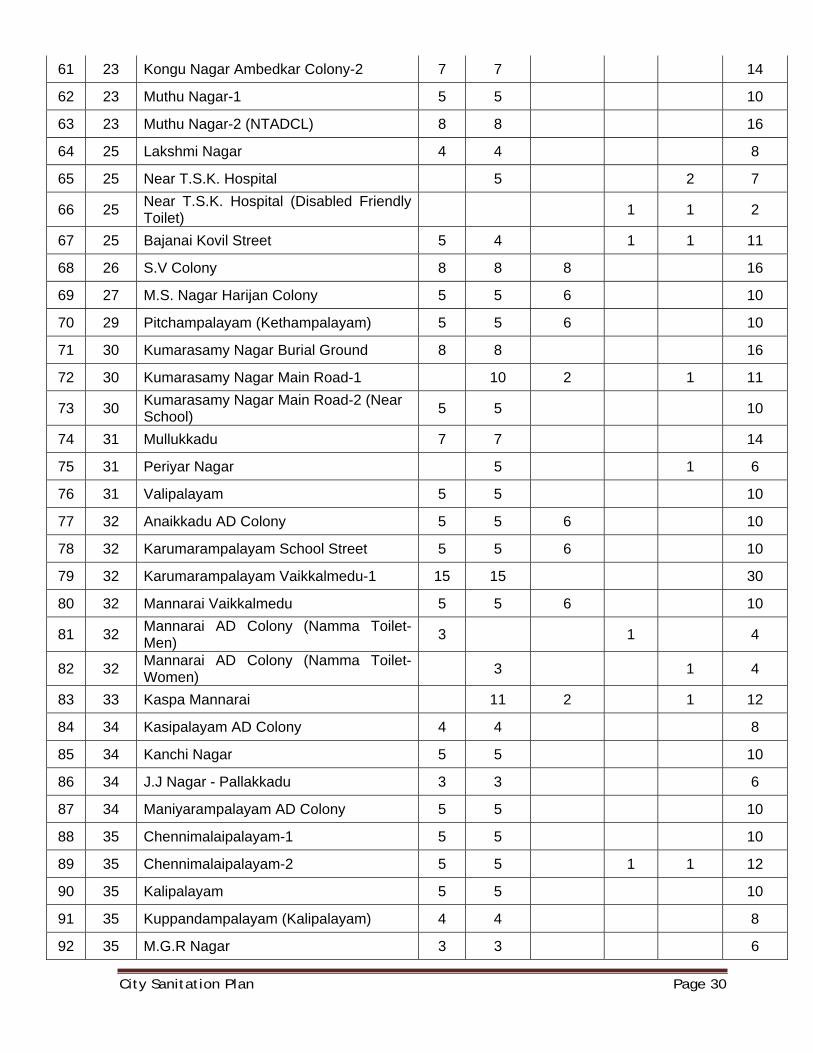
PUBLIC TOILET
S. No
Ward No Location of Public Toilet
Toilet (Seats)
Male Female Children Disabled Friendly Total
SeatsMale Female1 1a 2 3a 3b 3c 3d 3e 3
1 5 A.V.P Road (inside Santhai Pettai) 6 6 12
2 5 Velampalayam office (Disabled Friendly Toilet) 1 1 2
3 8 New Bus Stand-1 (North) 3 3
4 8 New Bus Stand-2 (North) 3 3 6
5 8 New Bus Stand-3 (West side) 3 3 6
6 8 New Bus Stand-4 (South side) 3 3 6
7 8 New Bus Stand-5 (South side) 2 2 1 1 6
8 8 New Bus Stand-6 (Disabled Friendly Toilet) 1 1 2
9 9 P.N Road Park (Disabled Friendly Toilet) 1 1 2
10 31 Town Hall-1 3 3 6
11 31 Town Hall-2 (Disabled Friendly Toilet) 1 1 2
12 45 Corporation Office 3 3 6
13 45 Daily Market-1 (Kamaraj Road) 5 5 1 1 12
14 45 Daily Market-2 (Disabled Friendly Toilet) 1 1 2
15 45 Flower Market (Eswaran Kovil Street) 3 3 6
16 45 Old Bus Stand-1 (Gents) 11 11
17 45 Old Bus Stand-2 (Ladies) 8 8
18 45 Old Bus Stand-3 10 10 20
19 45 Old Bus Stand-4 (Disabled Friendly Toilet) 1 1 2
20 45 Old Bus Stand-5 6 6 12
21 48 Silver Jubilee Park-1 2 2 1 1 6
22 48 Silver Jubilee Park-2 (Disabled Friendly Toilet) 1 1 2
23 50 Inside Weekly Market (Thennampalayam) 5 8 13
24 50 Opposite to Uzhavar Santhai 5 5 10
25 50 Uzhavar Santhai (Inside Primary Health Centre) 6 6 1 1 14
Total 79 76 0 11 11 177
City Sanitation Plan Page 28
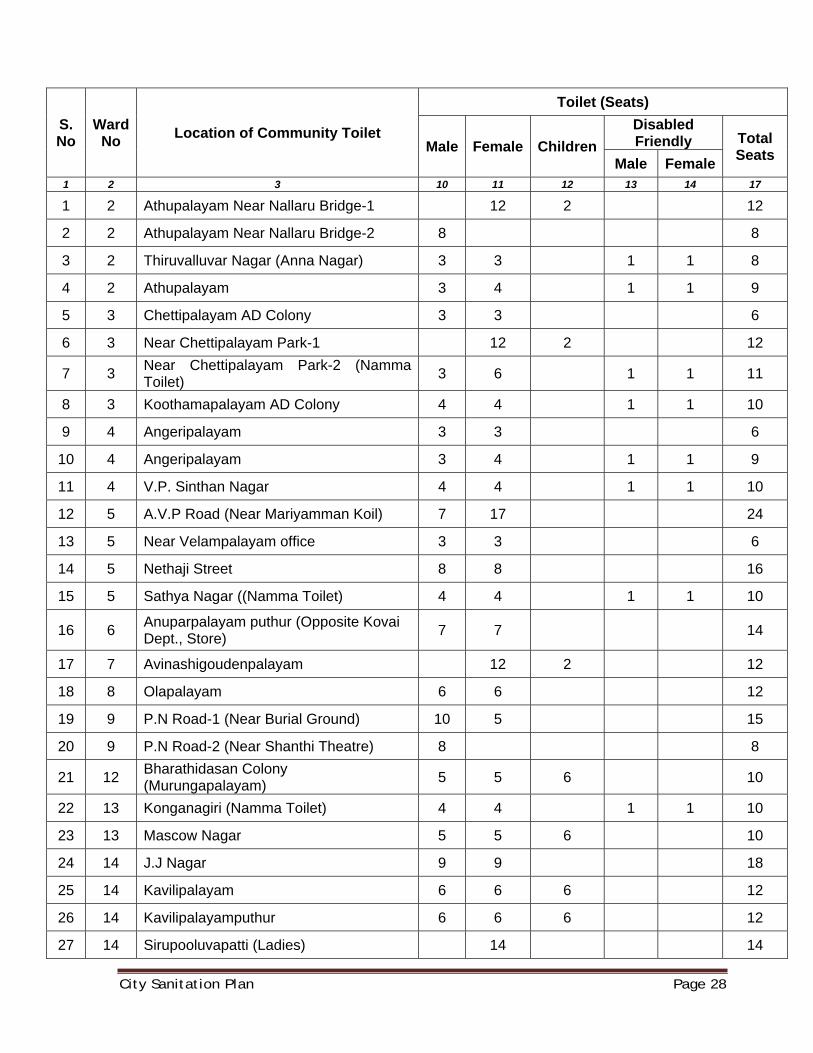
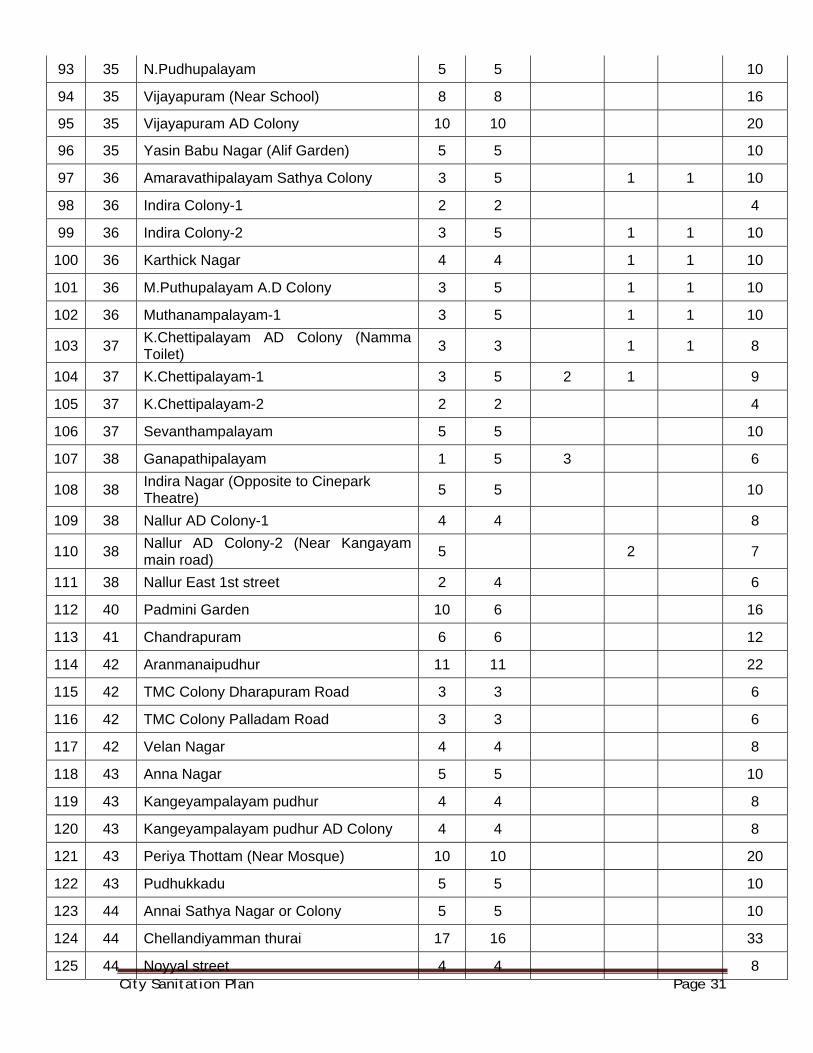
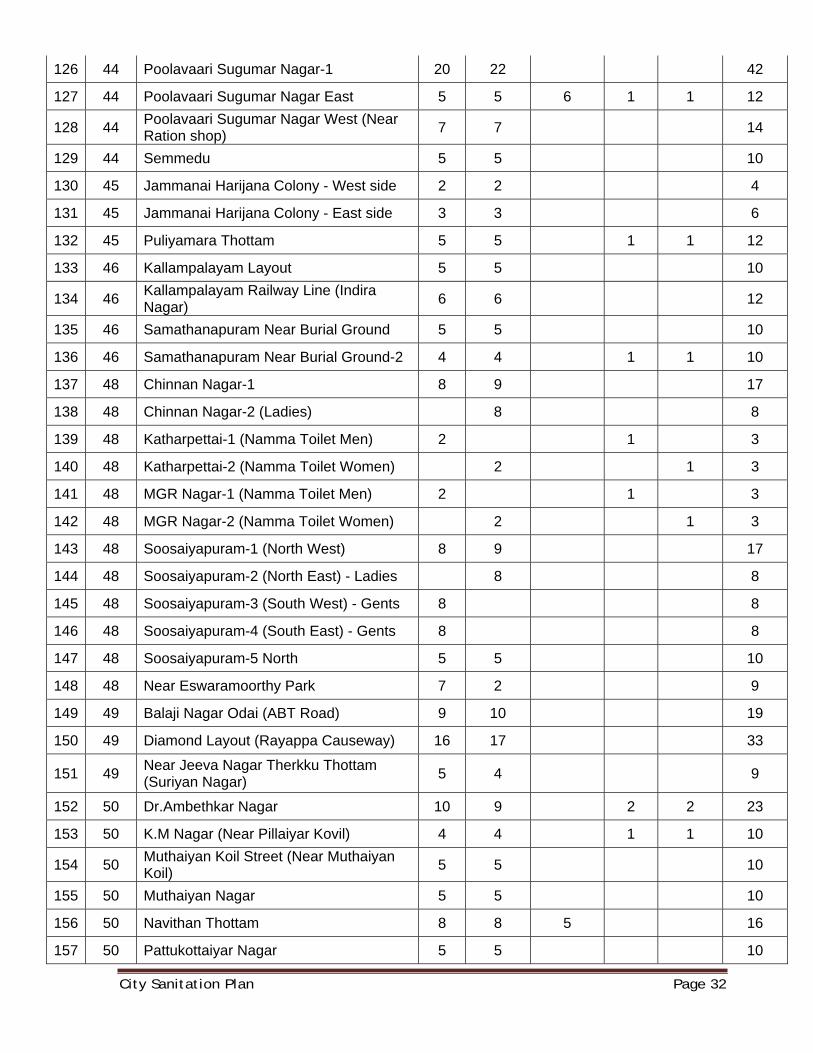
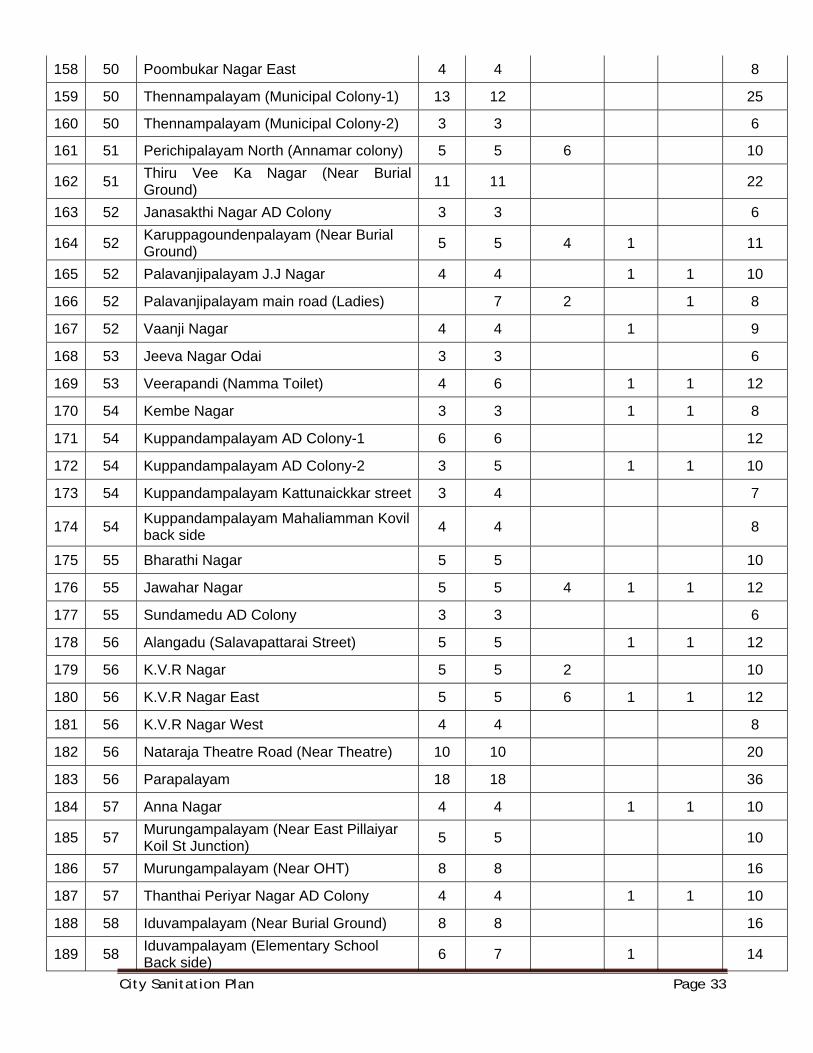
S. No
Ward No Location of Community Toilet
Toilet (Seats)
Male Female Children Disabled Friendly Total
Seats Male Female1 2 3 10 11 12 13 14 17
1 2 Athupalayam Near Nallaru Bridge-1 12 2 12
2 2 Athupalayam Near Nallaru Bridge-2 8 8
3 2 Thiruvalluvar Nagar (Anna Nagar) 3 3 1 1 8
4 2 Athupalayam 3 4 1 1 9
5 3 Chettipalayam AD Colony 3 3 6
6 3 Near Chettipalayam Park-1 12 2 12
7 3 Near Chettipalayam Park-2 (Namma Toilet) 3 6 1 1 11
8 3 Koothamapalayam AD Colony 4 4 1 1 10
9 4 Angeripalayam 3 3 6
10 4 Angeripalayam 3 4 1 1 9
11 4 V.P. Sinthan Nagar 4 4 1 1 10
12 5 A.V.P Road (Near Mariyamman Koil) 7 17 24
13 5 Near Velampalayam office 3 3 6
14 5 Nethaji Street 8 8 16
15 5 Sathya Nagar ((Namma Toilet) 4 4 1 1 10
16 6 Anuparpalayam puthur (Opposite Kovai Dept., Store) 7 7 14
17 7 Avinashigoudenpalayam 12 2 12
18 8 Olapalayam 6 6 12
19 9 P.N Road-1 (Near Burial Ground) 10 5 15
20 9 P.N Road-2 (Near Shanthi Theatre) 8 8
21 12 Bharathidasan Colony (Murungapalayam) 5 5 6 10
22 13 Konganagiri (Namma Toilet) 4 4 1 1 10
23 13 Mascow Nagar 5 5 6 10
24 14 J.J Nagar 9 9 18
25 14 Kavilipalayam 6 6 6 12
26 14 Kavilipalayamputhur 6 6 6 12
27 14 Sirupooluvapatti (Ladies) 14 14

City Sanitation Plan Page 29
28 14 Sirupooluvapatti (Near Community Hall) 7 7
29 14 Solipalayam 7 7 14
30 14 Thiruvalluvar Nagar 7 7 14
31 15 Velampalayam (Near Primary Health Centre) 17 17 34
32 15 Velampalayam (Near Burial ground) 5 5 10
33 16 Jayalakshmi Nagar (Namma Toilet) 3 5 1 1 10
34 17 Anna Nagar (Namma Toilet Men) 4 4
35 17 Anna Nagar (Namma Toilet Women) 4 4
36 17 Kamaraj Nagar 7 7 14
37 18 Bharathi Nagar (Namma Toilet) 3 5 1 1 10
38 18 J.J Nagar 3 5 1 1 10
39 18 May Nagar 3 5 1 1 10
40 18 Neruperichal 3 5 1 1 10
41 18 S.Guruvayurappan Nagar 3 5 1 1 10
42 18 Sedarpalayam 4 4 1 1 1 10
43 18 Vavipalayam 4 4 8
44 19 K.G Pudhur 3 3 6
45 19 Nallathupalayam 5 5 10
46 19 Pooluvapatty (Near School) 5 2 1 8
47 19 Upplipalayam-1 3 3 6
48 19 Upplipalayam-2 3 5 1 1 10
49 19 Bommanaickenpalayam 2 5 1 1 9
50 19 Koolipalayam AD Colony 3 3 1 1 8
51 19 Thiyaki Palanisamy Nagar 3 3 1 1 8
52 20 Boyampalayam AD Colony 5 5 10
53 20 Sakthi Nagar 11 2 1 12
54 20 Boyamapalayam 3 3 1 1 8
55 21 Thottimannarai AD Colony 5 5 1 1 12
56 22 Goundanaikanpalayam 5 5 10
57 22 Kattabomman Nagar 3 3 6
58 22 Pappanaikanpalayam 3 3 6
59 23 A.S. Pandit Nagar 5 5 6 10
60 23 Kongu Nagar Ambedkar Colony-1 6 6
City Sanitation Plan Page 30
61 23 Kongu Nagar Ambedkar Colony-2 7 7 14
62 23 Muthu Nagar-1 5 5 10
63 23 Muthu Nagar-2 (NTADCL) 8 8 16
64 25 Lakshmi Nagar 4 4 8
65 25 Near T.S.K. Hospital 5 2 7
66 25 Near T.S.K. Hospital (Disabled Friendly Toilet) 1 1 2
67 25 Bajanai Kovil Street 5 4 1 1 11
68 26 S.V Colony 8 8 8 16
69 27 M.S. Nagar Harijan Colony 5 5 6 10
70 29 Pitchampalayam (Kethampalayam) 5 5 6 10
71 30 Kumarasamy Nagar Burial Ground 8 8 16
72 30 Kumarasamy Nagar Main Road-1 10 2 1 11
73 30 Kumarasamy Nagar Main Road-2 (Near School) 5 5 10
74 31 Mullukkadu 7 7 14
75 31 Periyar Nagar 5 1 6
76 31 Valipalayam 5 5 10
77 32 Anaikkadu AD Colony 5 5 6 10
78 32 Karumarampalayam School Street 5 5 6 10
79 32 Karumarampalayam Vaikkalmedu-1 15 15 30
80 32 Mannarai Vaikkalmedu 5 5 6 10
81 32 Mannarai AD Colony (Namma Toilet- Men) 3 1 4
82 32 Mannarai AD Colony (Namma Toilet- Women) 3 1 4
83 33 Kaspa Mannarai 11 2 1 12
84 34 Kasipalayam AD Colony 4 4 8
85 34 Kanchi Nagar 5 5 10
86 34 J.J Nagar - Pallakkadu 3 3 6
87 34 Maniyarampalayam AD Colony 5 5 10
88 35 Chennimalaipalayam-1 5 5 10
89 35 Chennimalaipalayam-2 5 5 1 1 12
90 35 Kalipalayam 5 5 10
91 35 Kuppandampalayam (Kalipalayam) 4 4 8
92 35 M.G.R Nagar 3 3 6
City Sanitation Plan Page 31
93 35 N.Pudhupalayam 5 5 10
94 35 Vijayapuram (Near School) 8 8 16
95 35 Vijayapuram AD Colony 10 10 20
96 35 Yasin Babu Nagar (Alif Garden) 5 5 10
97 36 Amaravathipalayam Sathya Colony 3 5 1 1 10
98 36 Indira Colony-1 2 2 4
99 36 Indira Colony-2 3 5 1 1 10
100 36 Karthick Nagar 4 4 1 1 10
101 36 M.Puthupalayam A.D Colony 3 5 1 1 10
102 36 Muthanampalayam-1 3 5 1 1 10
103 37 K.Chettipalayam AD Colony (Namma Toilet) 3 3 1 1 8
104 37 K.Chettipalayam-1 3 5 2 1 9
105 37 K.Chettipalayam-2 2 2 4
106 37 Sevanthampalayam 5 5 10
107 38 Ganapathipalayam 1 5 3 6
108 38 Indira Nagar (Opposite to Cinepark Theatre) 5 5 10
109 38 Nallur AD Colony-1 4 4 8
110 38 Nallur AD Colony-2 (Near Kangayam main road) 5 2 7
111 38 Nallur East 1st street 2 4 6
112 40 Padmini Garden 10 6 16
113 41 Chandrapuram 6 6 12
114 42 Aranmanaipudhur 11 11 22
115 42 TMC Colony Dharapuram Road 3 3 6
116 42 TMC Colony Palladam Road 3 3 6
117 42 Velan Nagar 4 4 8
118 43 Anna Nagar 5 5 10
119 43 Kangeyampalayam pudhur 4 4 8
120 43 Kangeyampalayam pudhur AD Colony 4 4 8
121 43 Periya Thottam (Near Mosque) 10 10 20
122 43 Pudhukkadu 5 5 10
123 44 Annai Sathya Nagar or Colony 5 5 10
124 44 Chellandiyamman thurai 17 16 33
125 44 Noyyal street 4 4 8
City Sanitation Plan Page 32
126 44 Poolavaari Sugumar Nagar-1 20 22 42
127 44 Poolavaari Sugumar Nagar East 5 5 6 1 1 12
128 44 Poolavaari Sugumar Nagar West (Near Ration shop) 7 7 14
129 44 Semmedu 5 5 10
130 45 Jammanai Harijana Colony - West side 2 2 4
131 45 Jammanai Harijana Colony - East side 3 3 6
132 45 Puliyamara Thottam 5 5 1 1 12
133 46 Kallampalayam Layout 5 5 10
134 46 Kallampalayam Railway Line (Indira Nagar) 6 6 12
135 46 Samathanapuram Near Burial Ground 5 5 10
136 46 Samathanapuram Near Burial Ground-2 4 4 1 1 10
137 48 Chinnan Nagar-1 8 9 17
138 48 Chinnan Nagar-2 (Ladies) 8 8
139 48 Katharpettai-1 (Namma Toilet Men) 2 1 3
140 48 Katharpettai-2 (Namma Toilet Women) 2 1 3
141 48 MGR Nagar-1 (Namma Toilet Men) 2 1 3
142 48 MGR Nagar-2 (Namma Toilet Women) 2 1 3
143 48 Soosaiyapuram-1 (North West) 8 9 17
144 48 Soosaiyapuram-2 (North East) - Ladies 8 8
145 48 Soosaiyapuram-3 (South West) - Gents 8 8
146 48 Soosaiyapuram-4 (South East) - Gents 8 8
147 48 Soosaiyapuram-5 North 5 5 10
148 48 Near Eswaramoorthy Park 7 2 9
149 49 Balaji Nagar Odai (ABT Road) 9 10 19
150 49 Diamond Layout (Rayappa Causeway) 16 17 33
151 49 Near Jeeva Nagar Therkku Thottam (Suriyan Nagar) 5 4 9
152 50 Dr.Ambethkar Nagar 10 9 2 2 23
153 50 K.M Nagar (Near Pillaiyar Kovil) 4 4 1 1 10
154 50 Muthaiyan Koil Street (Near Muthaiyan Koil) 5 5 10
155 50 Muthaiyan Nagar 5 5 10
156 50 Navithan Thottam 8 8 5 16
157 50 Pattukottaiyar Nagar 5 5 10
City Sanitation Plan Page 33
158 50 Poombukar Nagar East 4 4 8
159 50 Thennampalayam (Municipal Colony-1) 13 12 25
160 50 Thennampalayam (Municipal Colony-2) 3 3 6
161 51 Perichipalayam North (Annamar colony) 5 5 6 10
162 51 Thiru Vee Ka Nagar (Near Burial Ground) 11 11 22
163 52 Janasakthi Nagar AD Colony 3 3 6
164 52 Karuppagoundenpalayam (Near Burial Ground) 5 5 4 1 11
165 52 Palavanjipalayam J.J Nagar 4 4 1 1 10
166 52 Palavanjipalayam main road (Ladies) 7 2 1 8
167 52 Vaanji Nagar 4 4 1 9
168 53 Jeeva Nagar Odai 3 3 6
169 53 Veerapandi (Namma Toilet) 4 6 1 1 12
170 54 Kembe Nagar 3 3 1 1 8
171 54 Kuppandampalayam AD Colony-1 6 6 12
172 54 Kuppandampalayam AD Colony-2 3 5 1 1 10
173 54 Kuppandampalayam Kattunaickkar street 3 4 7
174 54 Kuppandampalayam Mahaliamman Kovil back side 4 4 8
175 55 Bharathi Nagar 5 5 10
176 55 Jawahar Nagar 5 5 4 1 1 12
177 55 Sundamedu AD Colony 3 3 6
178 56 Alangadu (Salavapattarai Street) 5 5 1 1 12
179 56 K.V.R Nagar 5 5 2 10
180 56 K.V.R Nagar East 5 5 6 1 1 12
181 56 K.V.R Nagar West 4 4 8
182 56 Nataraja Theatre Road (Near Theatre) 10 10 20
183 56 Parapalayam 18 18 36
184 57 Anna Nagar 4 4 1 1 10
185 57 Murungampalayam (Near East Pillaiyar Koil St Junction) 5 5 10
186 57 Murungampalayam (Near OHT) 8 8 16
187 57 Thanthai Periyar Nagar AD Colony 4 4 1 1 10
188 58 Iduvampalayam (Near Burial Ground) 8 8 16
189 58 Iduvampalayam (Elementary School Back side) 6 7 1 14
City Sanitation Plan Page 34
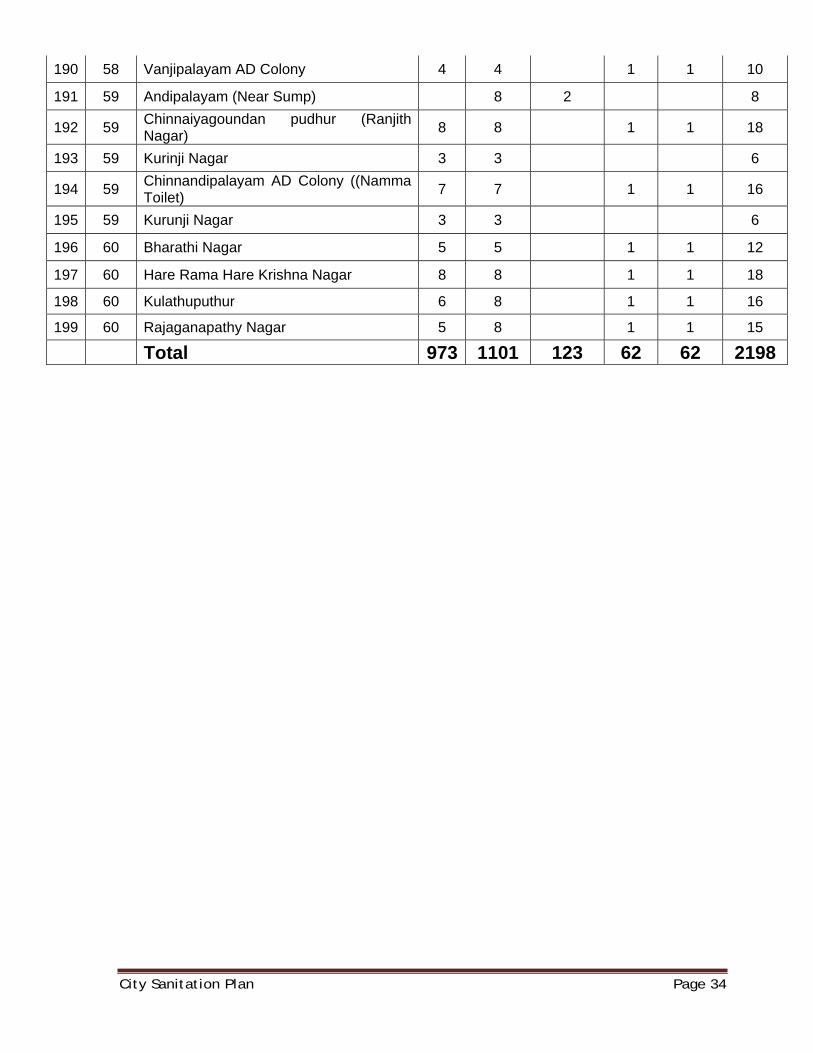
190 58 Vanjipalayam AD Colony 4 4 1 1 10
191 59 Andipalayam (Near Sump) 8 2 8
192 59 Chinnaiyagoundan pudhur (Ranjith Nagar) 8 8 1 1 18
193 59 Kurinji Nagar 3 3 6
194 59 Chinnandipalayam AD Colony ((Namma Toilet) 7 7 1 1 16
195 59 Kurunji Nagar 3 3 6
196 60 Bharathi Nagar 5 5 1 1 12
197 60 Hare Rama Hare Krishna Nagar 8 8 1 1 18
198 60 Kulathuputhur 6 8 1 1 16
199 60 Rajaganapathy Nagar 5 8 1 1 15
Total 973 1101 123 62 62 2198
City Sanitation Plan Page 35
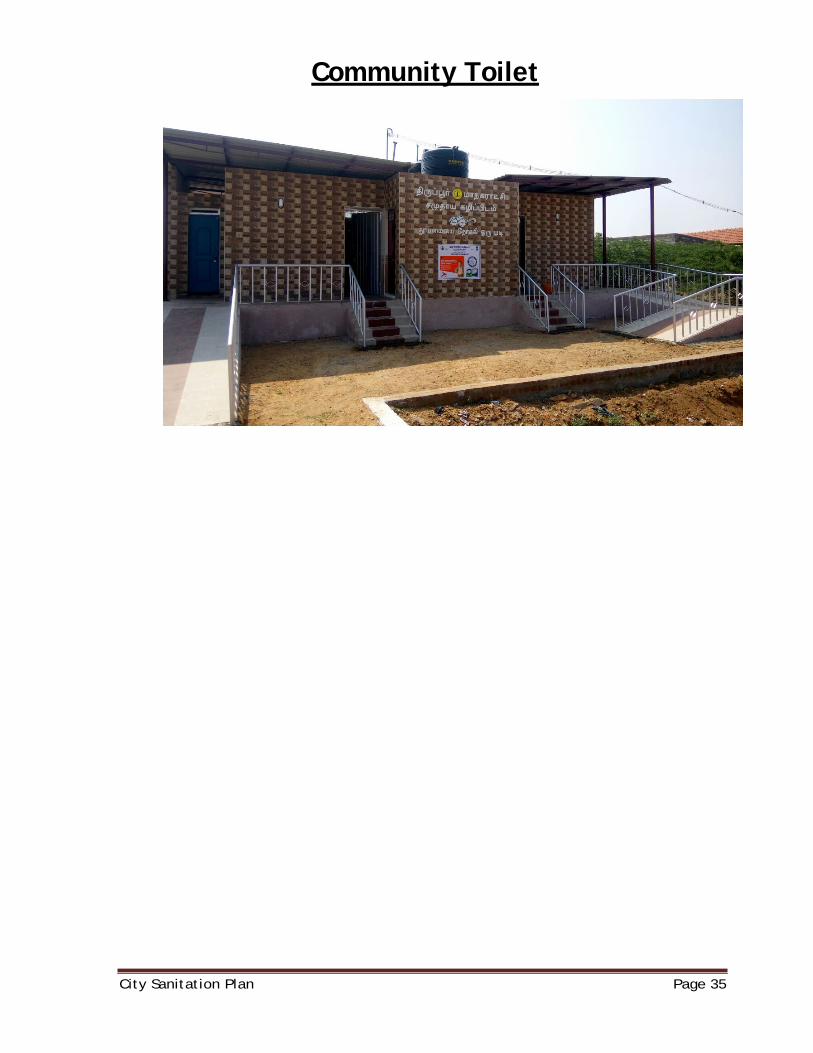
Community Toilet
City Sanitation Plan Page 36
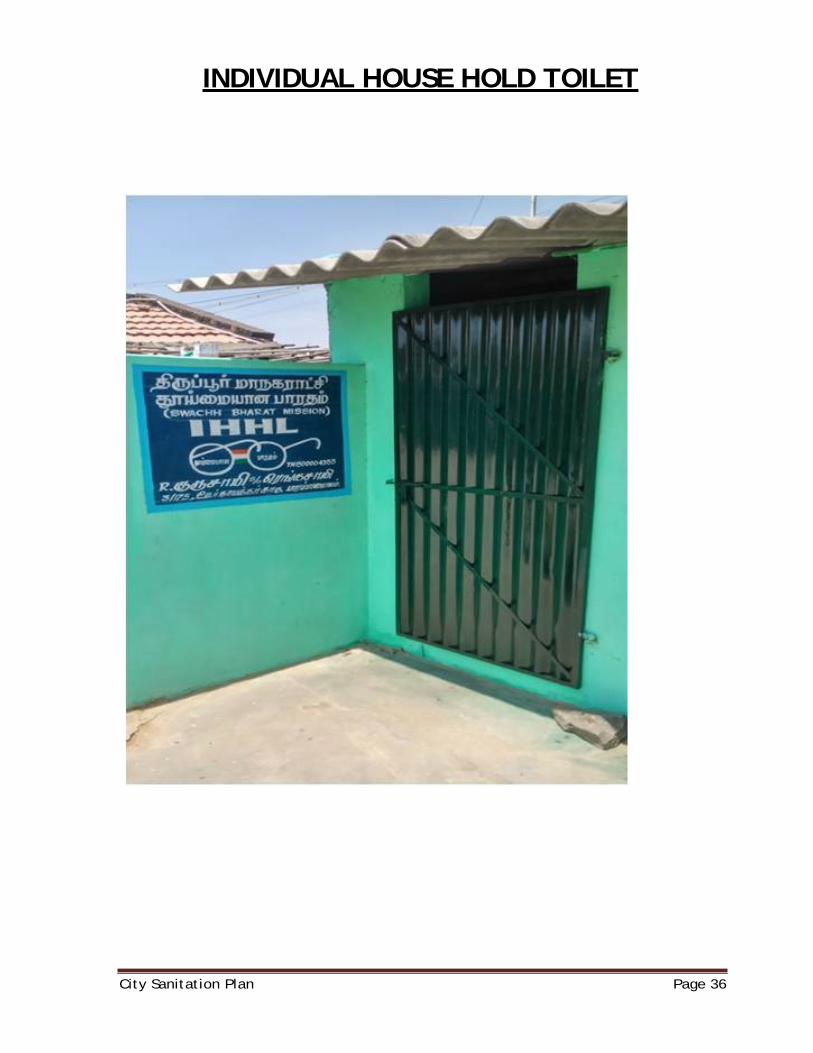
INDIVIDUAL HOUSE HOLD TOILET
City Sanitation Plan Page 37
SOLID WASTE MANAGEMENT
City Sanitation Plan Page 38
NEED FOR SOLID WASTE MANAGEMENT
AwelldesignedSolidWasteManagementsystem,based on the salient features of ‘Municipal Solid Waste (Management & Handling) Rules 2000’ and the ‘Manual onSolidWasteManagement’byCentralPublicHealth& Environmental Engineering Organization (CPHEEO) has beenframedtoformanapproachtoGreenlocalBodyasa model “GARBAGE FREE TIRUPPUR CITY MUNICIPAL CORPORATION”.
Thereisaneedtomakesubstantialimprovementinthe MSWMpracticesintheCorporationtoraisethestandards of health, sanitation and rural environment keepingpace withtherapidurbanizationandgrowingpopulation.Hence there is a need for strengthening and modernizing of the SWM practices. The Commissioner of Municipal Administration, Chennai encourages the preparation of Detail Project Report for Strengthening of Solid Waste Management as “Resource Recovery Project” for TiruppurCityMunicipalCorporationinTiruppurDistrict.
City Sanitation Plan Page 39
Theobjectivesoftheprojectareensuringthefollowings
• Nolitteringofwasteonthestreets. • Segregationofrecyclableandbiodegradablewasteatsourceof
wastegenerationanditsstorageatsourcefromhouseholds, commercialestablishments.
• Properstoragefacilitiesatpublicplaces. • Doortodoorcollectionofwastefromallhouseholds,shopsand
establishments as well informal settlement on day to day basis. • Streetsweepinginalltheareasincludinginformalsettlements
using improvedtools.
• Transportationofbiodegradable,recyclables,inertfromde- siltingofdrainagesinsecondarytransportvehiclesavoidingmultiple andmanualhandlingofwaste.
• Collectionandtreatmentofhighbiomethonizationpotential waste such as food waste, slaughter house waste, chicken/mutton/fish stall, vegetable and fruit waste separately.
• InstallationofOne more CentralisedBioMethanizationPlantforthe treatmentoffoodwaste,slaughterhousewasteandother potentialwasteatthecapacityof10MTperday
• Setting up a microbial compost plant of 200 MT/Day at Iduvai.
• Ensuringtheresidueofthewastewillbescientificallydisposed totheproposedSecureLandfillFacility.
• InvolvingCommunity,Industries,NGOandprivatesectorinmanagingthewastescientificallyandcosteffectivelyespecially forthecreationofawarenessonsourcesegregation.
• Introducingtheelementofcostrecoverythroughuserfees from commercial establishments, sale of compost and recyclablematerials.
• Capacitybuildingamongtheconcernedstakeholdersof MSWMbytraining.Maintainingproperdatabaseforthe effectiveimplementationofMSWM.
City Sanitation Plan Page 40
Demographics: According to2011census, TiruppurCity Municipal
Corporation had a population of 877778 with a sex-ratio of
989females forevery1,000males,muchabovethenational
average of929.
The gross density in Tiruppur City Municipal Corporation
is 215 persons per hectare the ward wise population density
indicates that most of the ward in Tiruppur City municipal
corporation have population density of 150 persons per
hectare. High above 300 pph is found in wards 8,9 ,10,14,
15, 43, 46 and 47. Low density below 100pph is found in
wards 22,26,36,38,40 and 45.
Residentialareasmakeup67.32%ofthecitytotalareawhile
commercial enterprises and industrial units make up
11.19%and6.75%respectively.Thenon-
urbanportionofthetownconstitutesabout12.02%ofthetotalarea.T
iruppurcityhasatotalof179slumswithapopulationof2,21,680.
City Sanitation Plan Page 41
Municipal Administration The Tiruppur City Municipal Corporation was officially
constitutedasmunicipalityin the year 1917. Upgraded asa
Corporationon01.01.2008 Initially, the city exercised
itsjurisdictionoveranareaof27.20Sq
.Kmanditsaffairswere administered by a city level
committee or municipal committee.Thecorporation and
currently, exercises its authorityoveranareaof159.35Sqkm
It comprises 60wards and is the 5thbiggest
corporationinTamilnadustate.Practicallythegrowthrateof
populationisalmost2.25%per annum.
Thefloatingpopulationof 2,00,000 may be reason for the
higher per capita generation of waste.
The functions of the corporation are devolved
intoFourzonesandonemainoffice.Comprisingdepart
ments of General, Engineering, Revenue, Public Health,
Townplanning, Accounts and the Special schemeWing.
Allthese departmentsareunderthecontrolofaCorporation
Commissioner who is the supreme executivehead.
City Sanitation Plan Page 42
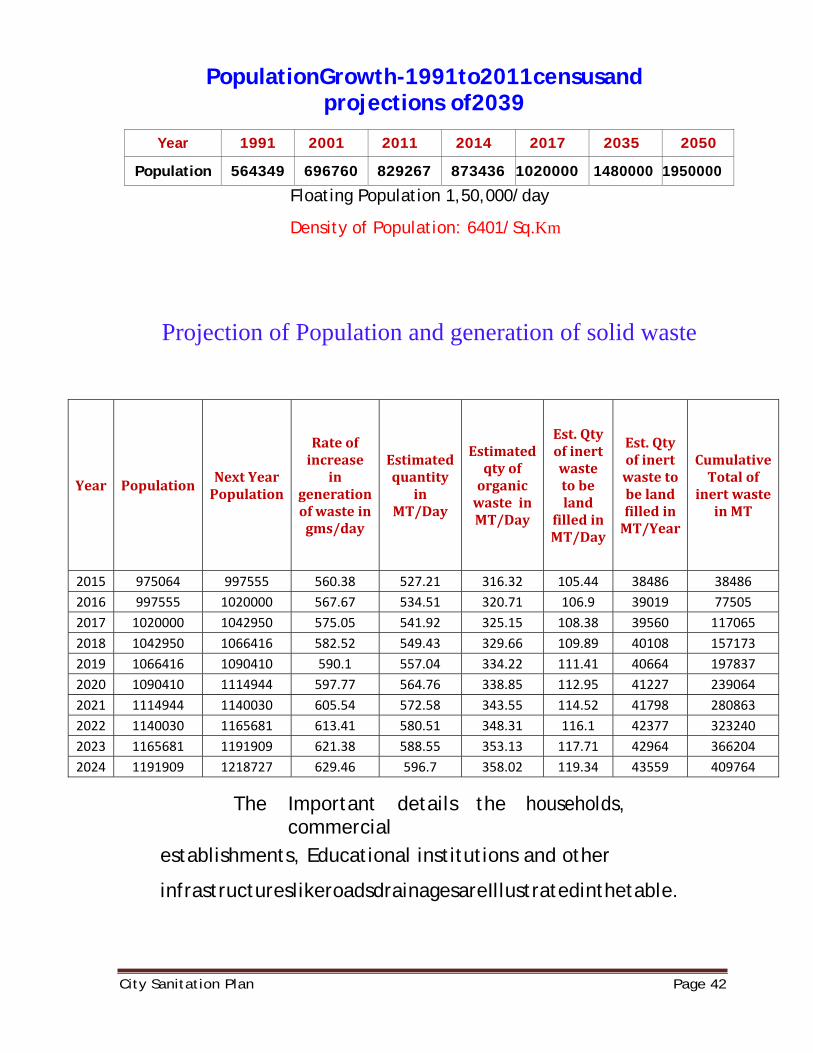
PopulationGrowth-1991to2011censusand projections of2039
Year 1991 2001 2011 2014 2017 2035 2050
Population 564349 696760 829267 873436 1020000 1480000 1950000
Floating Population 1,50,000/day
Density of Population: 6401/Sq.Km
Projection of Population and generation of solid waste
Year Population Next Year Population
Rate of increase
in generation of waste in gms/day
Estimated quantity
in MT/Day
Estimated qty of organic waste in MT/Day
Est. Qty of inert waste to be land
filled in MT/Day
Est. Qty of inert waste to be land filled in MT/Year
Cumulative Total of
inert waste in MT
2015 975064 997555 560.38 527.21 316.32 105.44 38486 38486 2016 997555 1020000 567.67 534.51 320.71 106.9 39019 77505 2017 1020000 1042950 575.05 541.92 325.15 108.38 39560 117065 2018 1042950 1066416 582.52 549.43 329.66 109.89 40108 157173 2019 1066416 1090410 590.1 557.04 334.22 111.41 40664 197837 2020 1090410 1114944 597.77 564.76 338.85 112.95 41227 239064 2021 1114944 1140030 605.54 572.58 343.55 114.52 41798 280863 2022 1140030 1165681 613.41 580.51 348.31 116.1 42377 323240 2023 1165681 1191909 621.38 588.55 353.13 117.71 42964 366204 2024 1191909 1218727 629.46 596.7 358.02 119.34 43559 409764
The Important details the households, commercial
establishments, Educational institutions and other
infrastructureslikeroadsdrainagesareIllustratedinthetable.
City Sanitation Plan Page 43
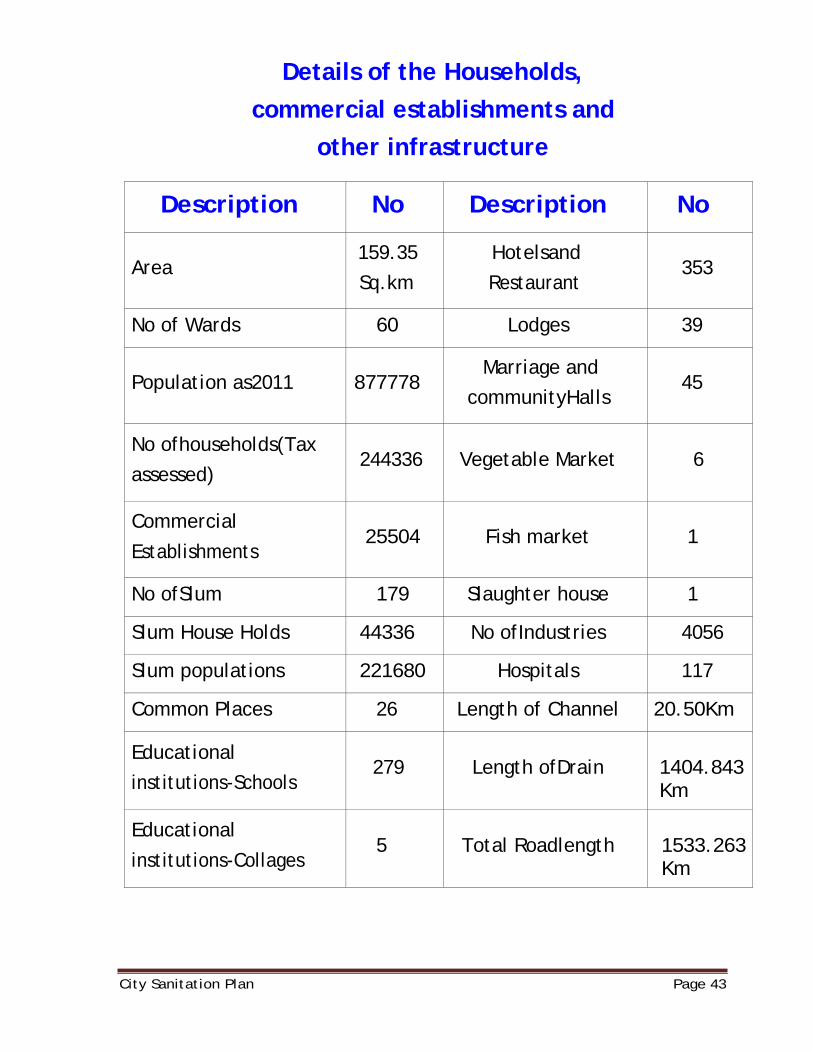
Details of the Households, commercial establishments and
other infrastructure
Description No Description No Area
159.35
Sq.km
Hotelsand
Restaurant
353
No of Wards 60 Lodges 39
Population as2011
877778
Marriage and
communityHalls
45
No ofhouseholds(Tax
assessed)
244336
Vegetable Market
6
Commercial
Establishments
25504
Fish market
1
No ofSlum 179 Slaughter house 1
Slum House Holds 44336 No ofIndustries 4056
Slum populations 221680 Hospitals 117
Common Places 26 Length of Channel 20.50Km
Educational
institutions-Schools
279
Length ofDrain
1404.843 Km
Educational
institutions-Collages
5
Total Roadlength
1533.263Km
City Sanitation Plan Page 44
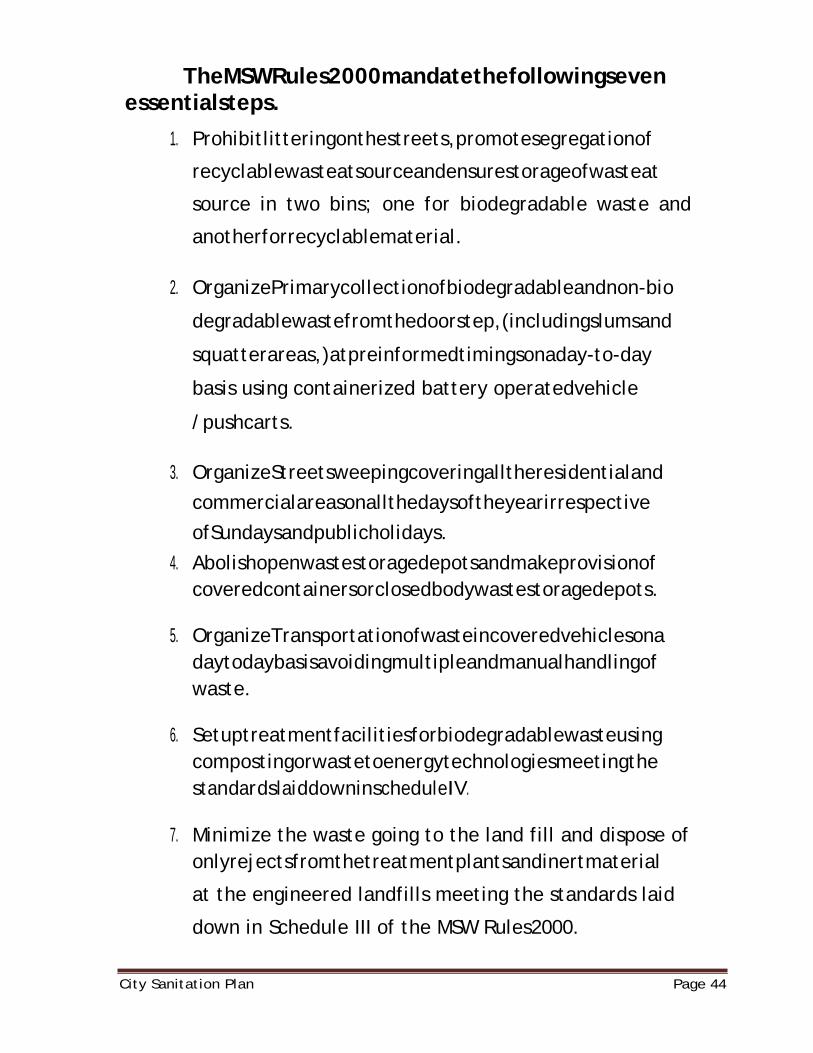
TheMSWRules2000mandatethefollowingseven essentialsteps.
1. Prohibitlitteringonthestreets,promotesegregationof
recyclablewasteatsourceandensurestorageofwasteat
source in two bins; one for biodegradable waste and
anotherforrecyclablematerial.
2. OrganizePrimarycollectionofbiodegradableandnon-bio
degradablewastefromthedoorstep,(includingslumsand
squatterareas,)atpreinformedtimingsonaday-to-day
basis using containerized battery operatedvehicle
/pushcarts.
3. OrganizeStreetsweepingcoveringalltheresidentialand
commercialareasonallthedaysoftheyearirrespective
ofSundaysandpublicholidays.
4. Abolishopenwastestoragedepotsandmakeprovisionof coveredcontainersorclosedbodywastestoragedepots.
5. OrganizeTransportationofwasteincoveredvehiclesona daytodaybasisavoidingmultipleandmanualhandlingof waste.
6. Setuptreatmentfacilitiesforbiodegradablewasteusing compostingorwastetoenergytechnologiesmeetingthe standardslaiddowninscheduleIV.
7. Minimize the waste going to the land fill and dispose of onlyrejectsfromthetreatmentplantsandinertmaterial
at the engineered landfills meeting the standards laid
down in Schedule III of the MSW Rules2000.
City Sanitation Plan Page 48
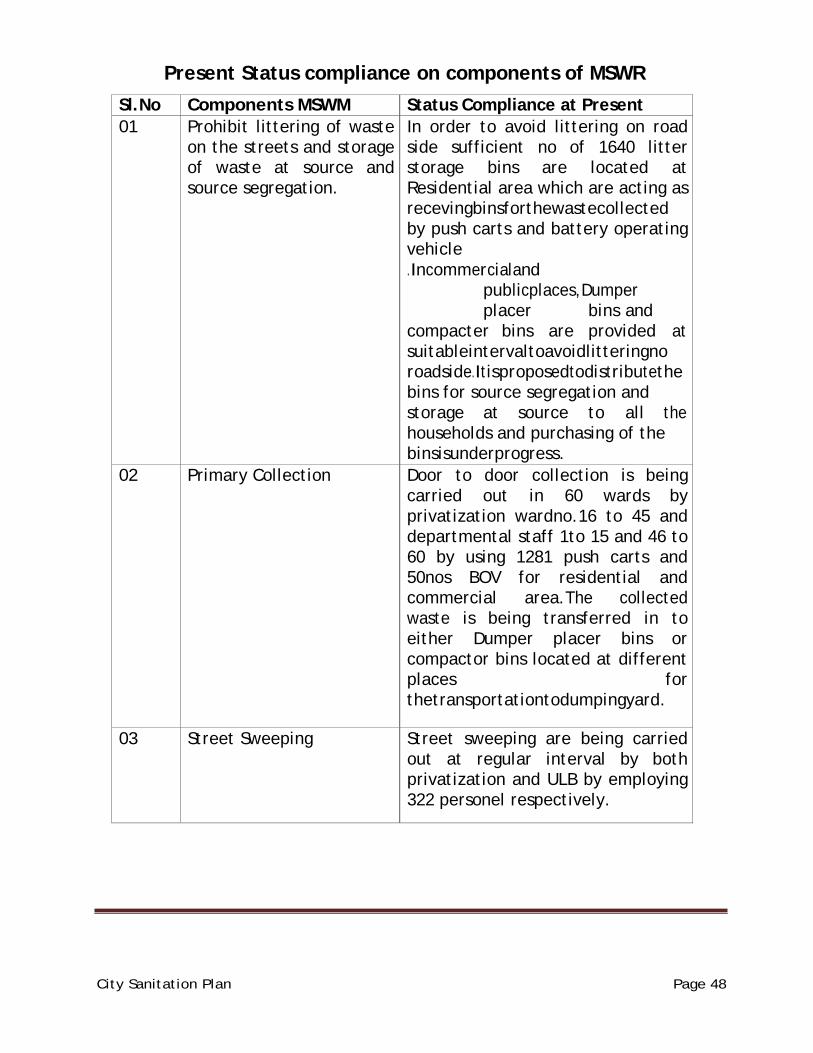
Present Status compliance on components of MSWR
Sl.No Components MSWM Status Compliance at Present 01 Prohibit littering of waste
on the streets and storage of waste at source and source segregation.
In order to avoid littering on road side sufficient no of 1640 litter storage bins are located at Residential area which are acting as recevingbinsforthewastecollected by push carts and battery operating vehicle .Incommercialand publicplaces,Dumper placer bins and compacter bins are provided at suitableintervaltoavoidlitteringno roadside.Itisproposedtodistributethe bins for source segregation and storage at source to all the households and purchasing of the binsisunderprogress.
02 Primary Collection Door to door collection is being carried out in 60 wards by privatization wardno.16 to 45 and departmental staff 1to 15 and 46 to 60 by using 1281 push carts and 50nos BOV for residential and commercial area.The collected waste is being transferred in to either Dumper placer bins or compactor bins located at different places for thetransportationtodumpingyard.
03 Street Sweeping Street sweeping are being carried out at regular interval by both privatization and ULB by employing 322 personel respectively.
City Sanitation Plan Page 49
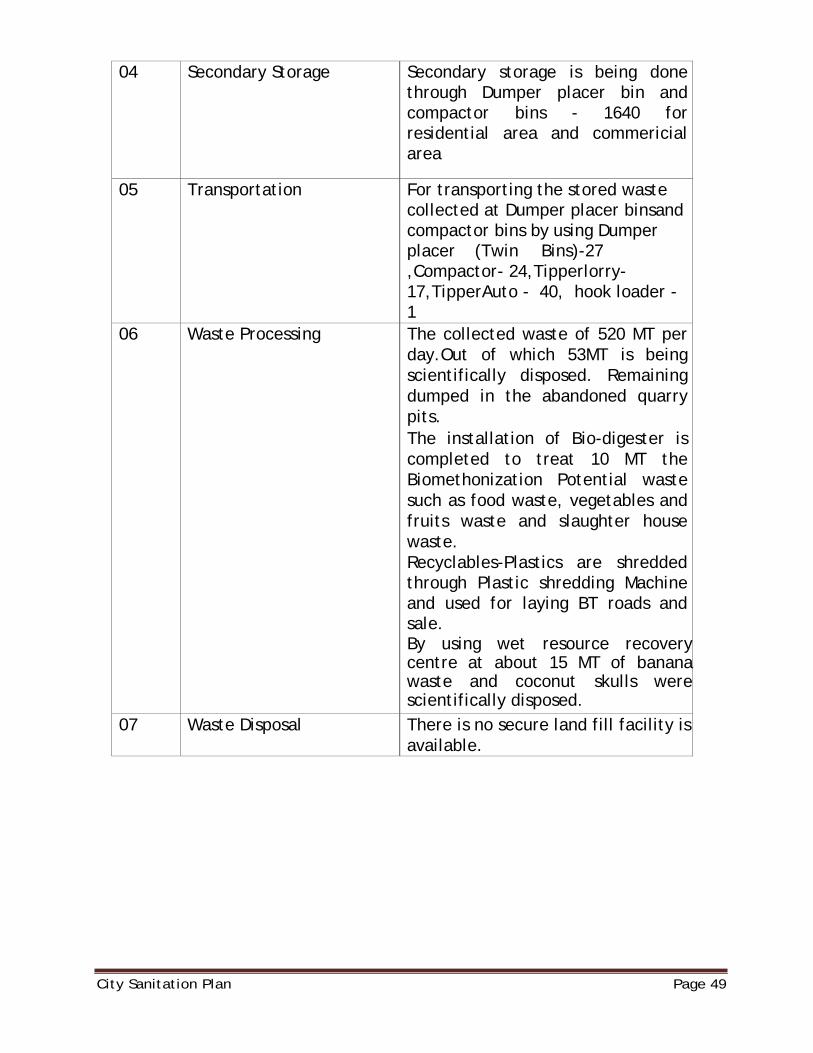
04 Secondary Storage Secondary storage is being done through Dumper placer bin and compactor bins - 1640 for residential area and commericial area
05 Transportation For transporting the stored waste collected at Dumper placer binsand compactor bins by using Dumper placer (Twin Bins)-27 ,Compactor- 24,Tipperlorry-17,TipperAuto - 40, hook loader - 1
06 Waste Processing The collected waste of 520 MT per day.Out of which 53MT is being scientifically disposed. Remaining dumped in the abandoned quarry pits. The installation of Bio-digester is completed to treat 10 MT the Biomethonization Potential waste such as food waste, vegetables and fruits waste and slaughter house waste. Recyclables-Plastics are shredded through Plastic shredding Machine and used for laying BT roads and sale. By using wet resource recovery centre at about 15 MT of banana waste and coconut skulls were scientifically disposed.
07 Waste Disposal There is no secure land fill facility is available.
City Sanitation Plan Page 50
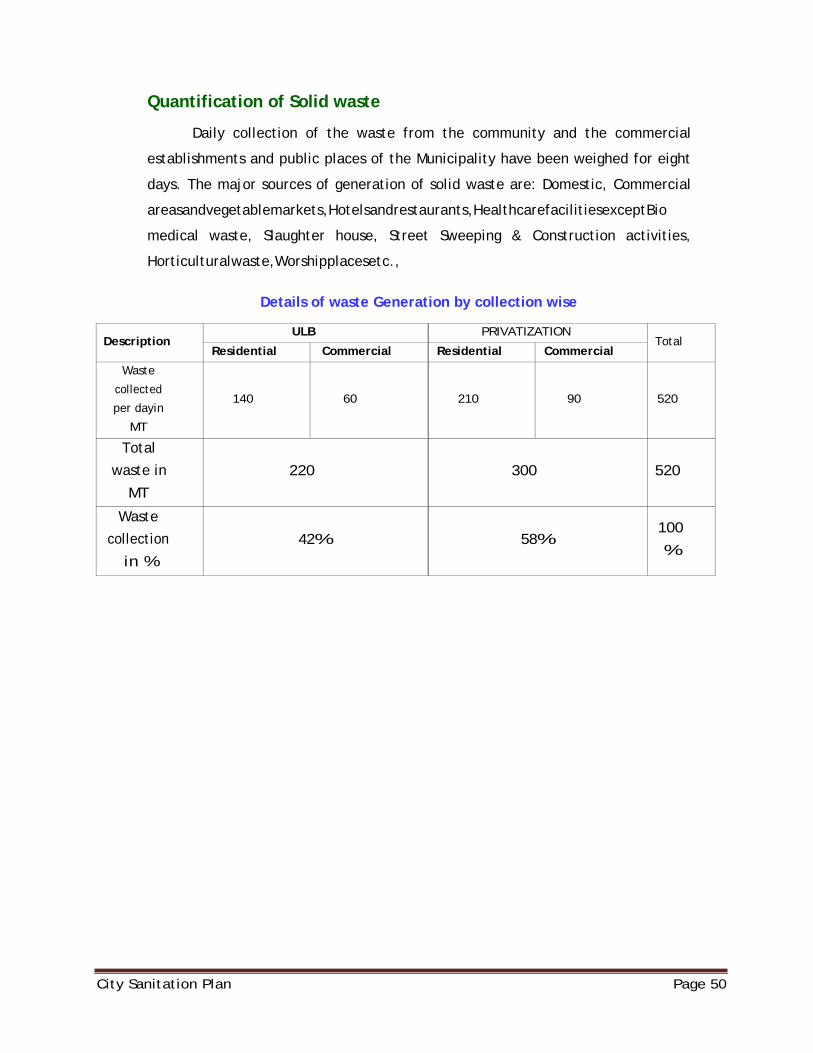
Quantification of Solid waste
Daily collection of the waste from the community and the commercial
establishments and public places of the Municipality have been weighed for eight
days. The major sources of generation of solid waste are: Domestic, Commercial
areasandvegetablemarkets,Hotelsandrestaurants,HealthcarefacilitiesexceptBio
medical waste, Slaughter house, Street Sweeping & Construction activities,
Horticulturalwaste,Worshipplacesetc.,
Details of waste Generation by collection wise
Description ULB PRIVATIZATION
Total Residential Commercial Residential Commercial
Waste
collected
per dayin
MT
140
60
210
90
520
Total
waste in
MT
220
300
520
Waste
collection
in %
42%
58%
100
%
City Sanitation Plan Page 51
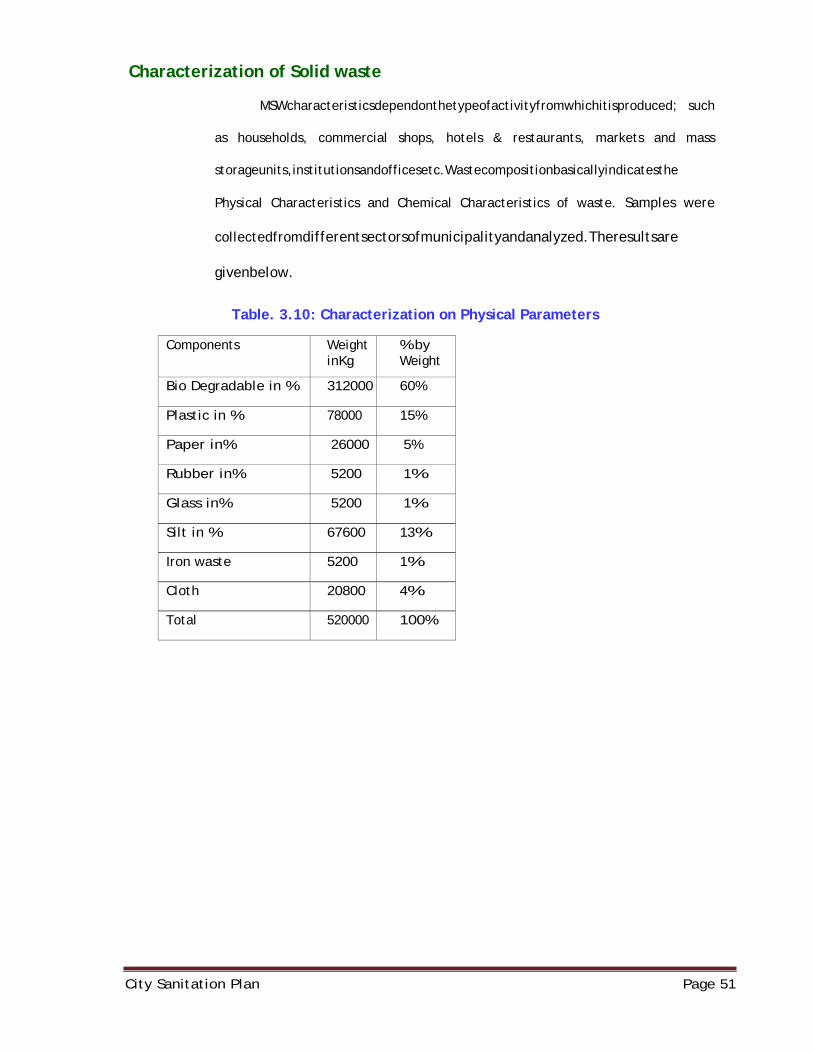
Characterization of Solid waste
MSWcharacteristicsdependonthetypeofactivityfromwhichitisproduced; such
as households, commercial shops, hotels & restaurants, markets and mass
storageunits,institutionsandofficesetc.Wastecompositionbasicallyindicatesthe
Physical Characteristics and Chemical Characteristics of waste. Samples were
collectedfromdifferentsectorsofmunicipalityandanalyzed.Theresultsare
givenbelow.
Table. 3.10: Characterization on Physical Parameters
Components Weight inKg
% by Weight
Bio Degradable in % 312000 60%
Plastic in % 78000 15%
Paper in% 26000 5%
Rubber in% 5200 1%
Glass in% 5200 1%
Silt in % 67600 13%
Iron waste 5200 1%
Cloth 20800 4%
Total 520000 100%
City Sanitation Plan Page 52
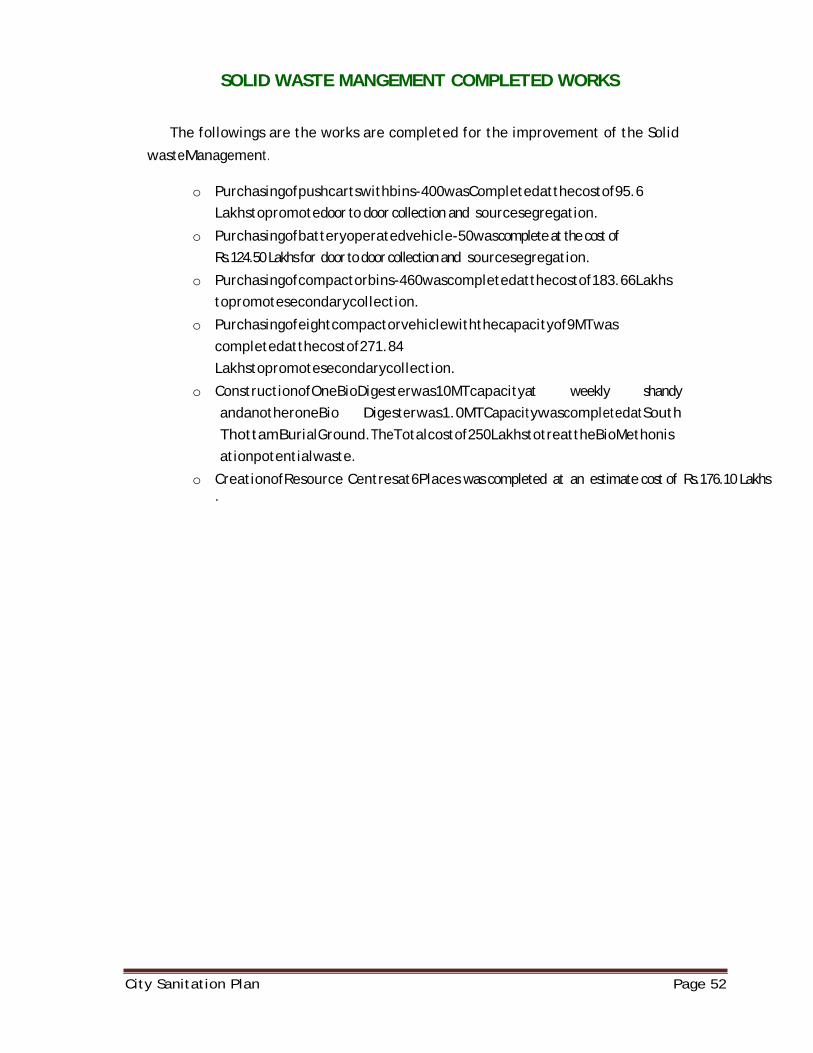
SOLID WASTE MANGEMENT COMPLETED WORKS
The followings are the works are completed for the improvement of the Solid
wasteManagement.
o Purchasingofpushcartswithbins-400wasCompletedatthecostof95.6 Lakhstopromotedoor to door collection and sourcesegregation.
o Purchasingofbatteryoperatedvehicle-50wascomplete at the cost of Rs.124.50 Lakhs for door to door collection and sourcesegregation.
o Purchasingofcompactorbins-460wascompletedatthecostof183.66Lakhs topromotesecondarycollection.
o Purchasingofeightcompactorvehiclewiththecapacityof9MTwas completedatthecostof271.84 Lakhstopromotesecondarycollection.
o ConstructionofOneBioDigesterwas10MTcapacityat weekly shandy andanotheroneBio Digesterwas1.0MTCapacitywascompletedatSouth ThottamBurialGround.TheTotalcostof250LakhstotreattheBioMethonisationpotentialwaste.
o CreationofResource Centresat6Places was completed at an estimate cost of Rs.176.10 Lakhs .
City Sanitation Plan Page 53
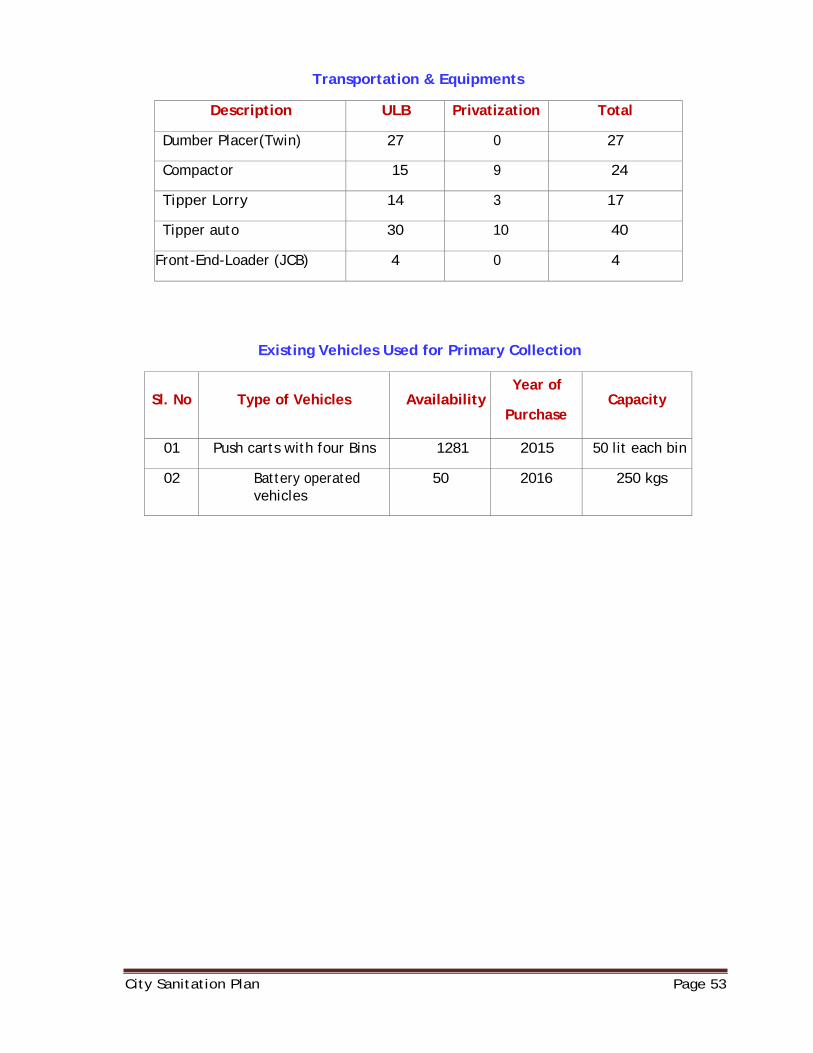
Transportation & Equipments
Description ULB Privatization Total
Dumber Placer(Twin) 27 0 27
Compactor 15 9 24
Tipper Lorry 14 3 17
Tipper auto 30 10 40
Front-End-Loader (JCB) 4 0 4
Existing Vehicles Used for Primary Collection
Sl. No
Type of Vehicles
Availability
Year of
Purchase
Capacity
01 Push carts with four Bins 1281 2015 50 lit each bin
02 Battery operated vehicles
50 2016 250 kgs
City Sanitation Plan Page 54
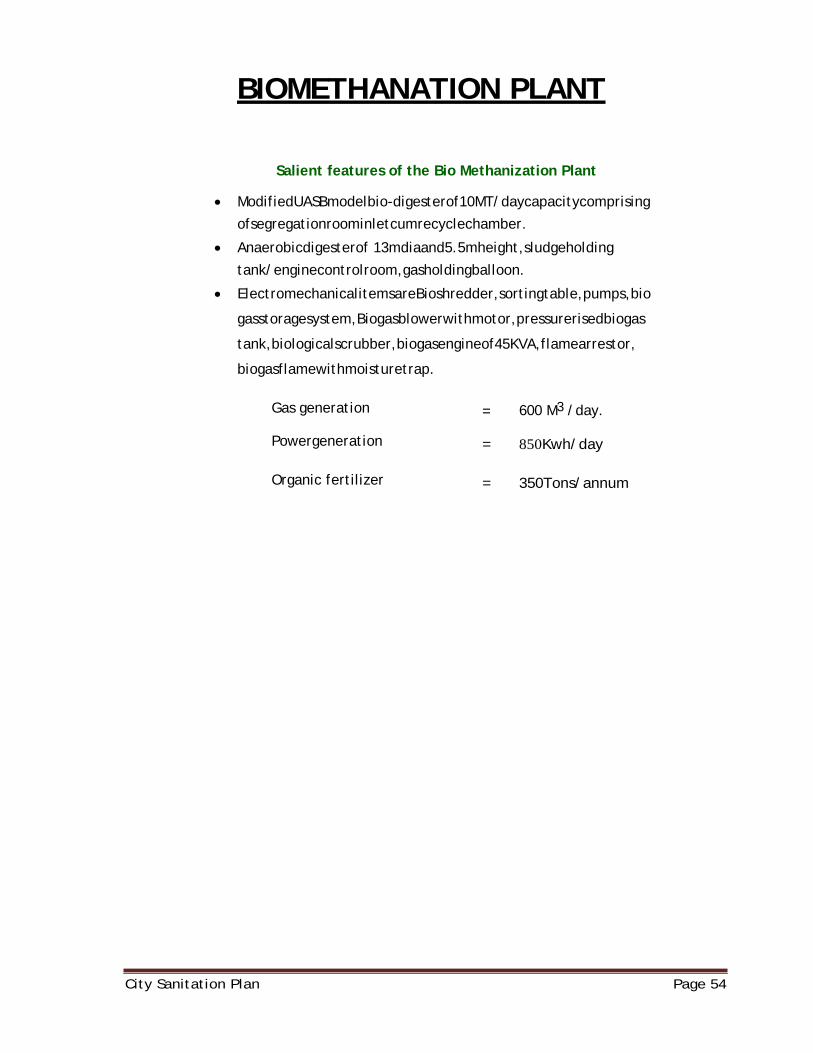
BIOMETHANATION PLANT
Salient features of the Bio Methanization Plant
• ModifiedUASBmodelbio-digesterof10MT/daycapacitycomprising
ofsegregationroominletcumrecyclechamber.
• Anaerobicdigesterof 13mdiaand5.5mheight,sludgeholding
tank/enginecontrolroom,gasholdingballoon.
• ElectromechanicalitemsareBioshredder,sortingtable,pumps,bio
gasstoragesystem,Biogasblowerwithmotor,pressurerisedbiogas
tank,biologicalscrubber,biogasengineof45KVA,flamearrestor,
biogasflamewithmoisturetrap.
Gas generation
Powergeneration
Organic fertilizer
= 600 M3 /day.
= 850Kwh/day
= 350Tons/annum
City Sanitation Plan Page 55
PROPOSED MSW MANAGEMENT SYSTEM
Refuse
Refusing is one of the newer ‘5R’s. Some people also call it pre-cycling. In
terms of smart waste management, this is the simple act of refusing the
excessive or unnecessary packaging. When shopping, it means saying "no
thanks"toabagforsmallpurchasesthatyoucaneasilycarryinyourhands.
Youcanalsorefuse-choosetonotbuy-foods,beverages,orotherproducts
infancy,multilayerpackagingthatyouwilljusthavetothrowintothetrash
assoonasyouopenthem.
Refusetheuseofplasticcarrybags,cups,disposables,thermocol.disposable
orsingleuseproductssuchasrazors,eatingutensils,plates,andcups.
Refuse the products which have more packaging materials. Donotbuyproductswhichmayharmyourenvironment.Thealternativeisto usenon-biodegradableproductssparingly.. Forexample:Cleaningproductsforfloorsetc.Cleaningproductsfordishes,
Polish.
Reduce
Reducingmeansproducinglesswastesothatyouthrowawaylesstrashand
garbageintolandfills.Reducingisthemosteffectivewaytomanagewaste
andtheplacetobeginwheneveryoucan.Asimplestepatthegrocerystore:
Bringyourownclothormeshbags,soyoudon'ttakeeitherpaperorplastic! You
have immediately reduced the bags you might throw into the trash
whenyougethome.Howtorememberyourbags?Alwayskeeptheminthe
carorrightbythedoor.
Manyitemsthatwewouldnormallythrowoutcanberepaired,upgraded,or
reused.Thisisusuallycheaperthanbuyinganewoneandsavesthespaceof
disposing of the old one. These items include tires, shoes, home and office
furnitureandequipment,lightingfixtures,lawnmowers,electronics,clothes,
and automotiveparts.
Considerreupholstering,refinishing,ordonatingoldfurnituretobeused
again.
Havelargeappliancesrepairedinsteadofbuyingnew ones.Reuse
City Sanitation Plan Page 56
Reusing products prevents you from producing more
waste. For example
Reuseplasticbags,Newspaperalsocanbereusedforpackagingor
wrapping.
Donateunwantedclothingingoodconditiontocharityshops.Clotheswhich
arewornoutorinunsalableconditioncanbeturnedintowipingclothes.
Tins,glassesetc.canbeusedasstoragecontainersforsugar,teabags,
saltetc.
Reuse disposal crockery Reusingisprettysimpleonceyougetintothehabit,likewritingashopping
listonanopenedenvelopeorthebackofofficepaperratherthanonabrand
newsheet.Plasticbags(bothlargewhitebagsandclearproducebags)canbe
reusedseveraltimesbeforetheyarerecycled.
Recycle
Theprocessoftransformingmaterialsintosecondaryresourcesfor manufacturingnewproductsisknownasRecycling.
Waste recycling leads to less utilization of raw materials, saves on landfill
space,reducestheamountofenergyrequiredtomanufacturenewproducts.
Infactrecyclingcanpreventthecreationofwasteatthesource.
Prepareyourrecyclablesaccordingtothedirectionsgivenbyyourrecycling
provider. This will make it easier and less costly for them to continue
providing theseservices.
Drywasteconsistingofcans,aluminiumfoils,plastics,metal,glass,andpaper could
berecycled.
Turn “waste” into a new product. Forexample:Bottlecapscanbeusedformakingbags,chairsortables.
Ringpullsfromdrinkandfoodcanscanbewovenintoformbags.Patches
ofoldclothcanbeusedformakingcushionsorteddies.Makeearringsout
ofnewspaper.Rollthepaperintotheshapeofpearls,andthenpaintand
varnishthem.
Recover
Source separation: by keeping recyclables and organics waste separate at
source, i.e., at the point of generation facilitate reuse, recycling, and
composting to recover nutrient value from organic matter.
Homecompostingisbestoptiontorecoverthenutrientatdecentralizedat
sourceitself.
City Sanitation Plan Page 57
EnergycanberecoveredfromtheBioMethonisationPotentialwastesuchas food
waste, vegetable and food waste and slaughter waste through Bio Digseter.
This can avoid the Green House Gas discharged in to atmosphere
responsibleforGlobalWarming.
Simplewayofrecoveringthevegetablewasteandmarketwasteinto
nitrogenenrichedcowdungbyfeedingthecattle.
City Sanitation Plan Page 58
Recovery of Recycling
The recyclable waste will be collected separately with various methods and
sorted out in the mechanized sorting table according to the nature and sold.The
Corporation is also planning to buy another higher capacity plastic pulverizer for
plastic materials processing.
In plastic reprocessing after the types of plastic separated is aMechanical
processingtoruntheplasticthroughthePulverizer.
Pulverizercrushestheplasticintotinyshredsorgranules.Plasticpulverizer is
the particular equipment for recycling disused insignificant materials in
producingandgrindingheat-sensitivityplasticsuchasPVC.
The recovered shredded plastic will be used for laying plastic road as the
partial replacement of bitumen and sale.
Baling machine utilised to bale rags as RDF.
City Sanitation Plan Page 59
Green belt Development
Inordertonullifytheeffectsemissionofcarbondooxideduringcomposting
process,itisplannedtodevelopthegreenbeltall-aroundthecompostyardon
theperipheryofthecompoundwallintworowswhereispossibleusingthorn
lessbamboo.Bambooisthebestpracticalatmosphericcarbonabsorbingplant.It
isthefastestandleastexpensivewaytosolvetheproblemsofCarbondioxide
emissionandwaterpollution.ItisproposedtoplantThornlessvarietyBamboo
allaroundthecompostplantasgreenbeltandtheplantationwillbecarriedout
oncompletionoftheconstructionofcompoundwall.
City Sanitation Plan Page 60
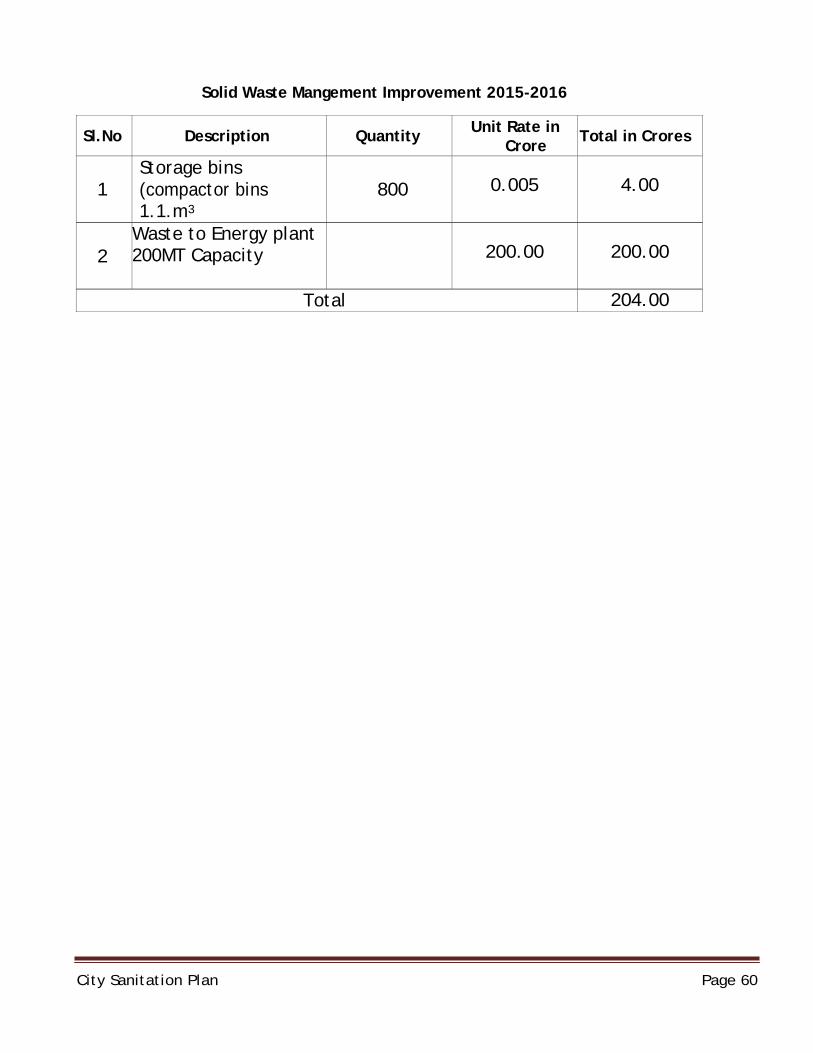
Solid Waste Mangement Improvement 2015-2016
Sl.No Description Quantity Unit Rate in Crore Total in Crores
1
Storage bins (compactor bins 1.1.m3
800
0.005
4.00
2
Waste to Energy plant 200MT Capacity
200.00
200.00
Total 204.00
City Sanitation Plan Page 61
WATERSUPPLY
City S
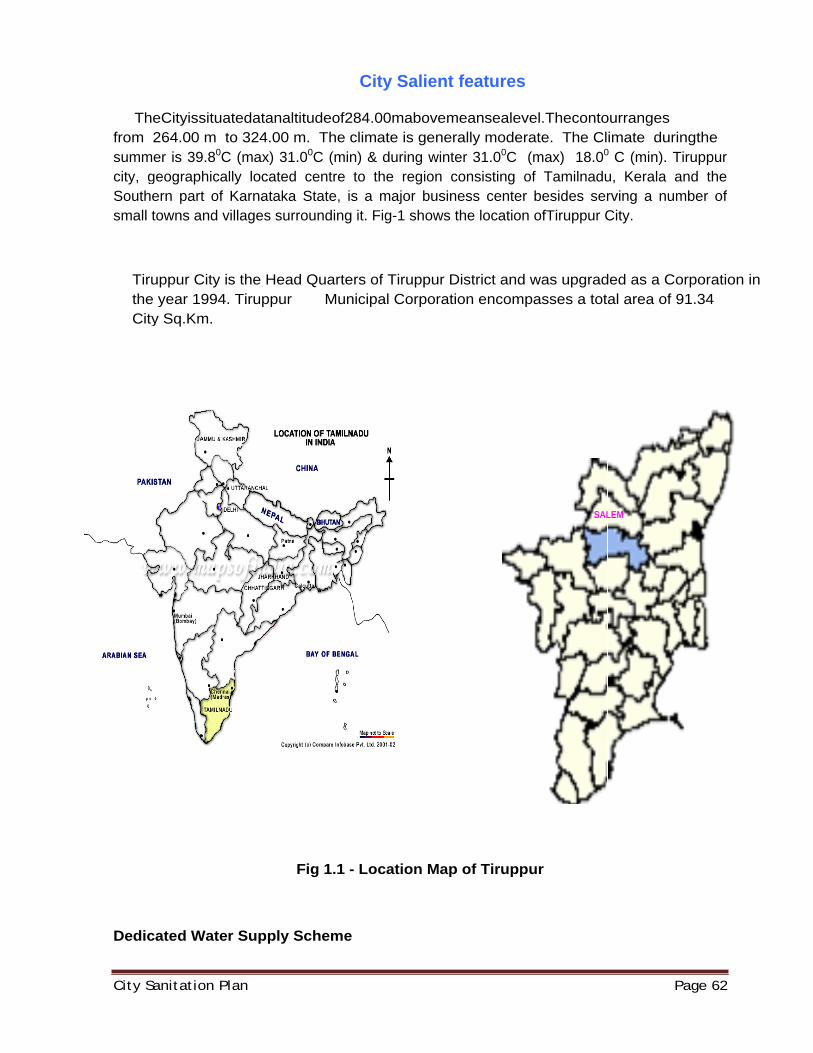
Thfrom summcity, gSouthesmall t
TirutheCity
Dedic
anitation P
eCityissitua264.00 m t
mer is 39.80Cgeographicaern part of towns and v
uppur City ie year 1994.y Sq.Km.
cated Wate
lan
atedatanaltitto 324.00 m
C (max) 31.0lly located Karnataka S
villages surro
s the Head . Tiruppur
F
r Supply Sc
Cit
tudeof284.0m. The clima00C (min) & centre to thState, is a mounding it. F
Quarters ofMunicipa
Fig 1.1 - Loc
cheme
ty Salient
00mabovemate is generduring winte
he region cmajor businig-1 shows t
f Tiruppur Dal Corporati
cation Map
features
meansealeverally moderaer 31.00C (consisting ofess center the location
District and won encomp
p of Tiruppu
el.Thecontoate. The Clmax) 18.00
f Tamilnadubesides serofTiruppur C
was upgradasses a tota
ur
SAL
Pa
ourranges imate durin
0 C (min). Tiu, Kerala anrving a numCity.
ed as a Coal area of 9
LEM
age 62
ngthe ruppur nd the
mber of
rporation in1.34
City Sanitation Plan Page 63
ThepopulationofTiruppurCorporationaspercensus2001is6,93,236whichisestimated to be about 8.2 lakhs in the year 2010. Consequent to Tiruppur being a Corporation now, therateofwatersupplytobeadoptedasperCPHEEOnormsis135lpcd.
Design Criteria
(a) DesignPeriod : 30years
Baseyear : 2010
IntermediatePeriod : 15 years(2025)
UltimatePeriod : 30 years(2040)
(b) Population Population(2001) : 6, 93,236
Base yearPopulation(2010) : 8, 20, 000
Intermediate StagePopulation(2025) : 10, 52,000
Ultimate Stage Population(2040) : 13, 24,000
Per capita Water Supply for Corporation
Area as perCPHEEOnorms : 135lpcd
Existing&Proposedwatersupplysystem
Existing water supply systemdetails:
PopulationCovered :8,29,267
City Sanitation Plan Page 64
AreaCovered : 91.34sq.kms
PerCapitasupply : 135LPCD
DistributionNetwork : 821.70km
Water supplystoragecapacity : 56 Nos. OHT (458.00 Lakhslitres)
HSC :1,05,435
Dedicated Water supply scheme details:
Populationcovered(Basedyear2010) : 8, 20, 000
Areacovered : 91.34sq.km
Distnetwork :212.km
PerCapitasupply : 135lpcd
Distribution system (100mm dia to 600mm dia DI K7 pipe)
ProposedNewlength :16.35 km
Replacementlength : 119.55km
Total :135.9km
Waterstoragecapacity :22 Nos OHT ( 169.50 lakhslitres)
HSC ( Old+New) : 56 Nos. OHT (458.00 lakhslitres)
SCADASystem :Forentirepumpinganddistributionsystem.
Dedicated Water supply scheme details:
Base yearPopulation(2010) : 8, 20, 000 –120.74MLD
Intermediate StagePopulation(2025) : 10, 52,000 – 154.52MLD
Ultimate StagePopulation(2040) : 13,24,000–193.74MLD
Rezoning ofDist.System : A.
City Sanitation Plan Page 65
B.
C.
D.
E.
F.Total ----
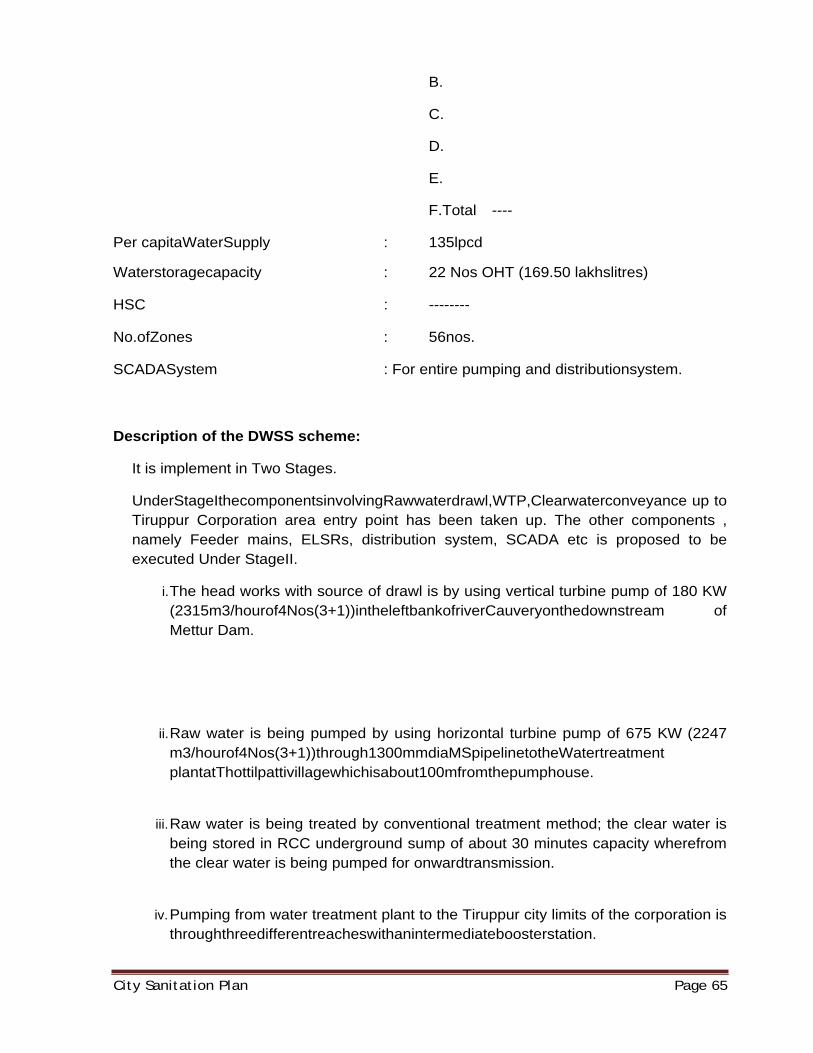
Per capitaWaterSupply : 135lpcd
Waterstoragecapacity : 22 Nos OHT (169.50 lakhslitres)
HSC : --------
No.ofZones : 56nos.
SCADASystem : For entire pumping and distributionsystem.
Description of the DWSS scheme:
It is implement in Two Stages.
UnderStageIthecomponentsinvolvingRawwaterdrawl,WTP,Clearwaterconveyance up to Tiruppur Corporation area entry point has been taken up. The other components , namely Feeder mains, ELSRs, distribution system, SCADA etc is proposed to be executed Under StageII.
i. The head works with source of drawl is by using vertical turbine pump of 180 KW (2315m3/hourof4Nos(3+1))intheleftbankofriverCauveryonthedownstream of Mettur Dam.
ii. Raw water is being pumped by using horizontal turbine pump of 675 KW (2247 m3/hourof4Nos(3+1))through1300mmdiaMSpipelinetotheWatertreatment plantatThottilpattivillagewhichisabout100mfromthepumphouse.
iii. Raw water is being treated by conventional treatment method; the clear water is being stored in RCC underground sump of about 30 minutes capacity wherefrom the clear water is being pumped for onwardtransmission.
iv. Pumping from water treatment plant to the Tiruppur city limits of the corporation is throughthreedifferentreacheswithanintermediateboosterstation.
City Sanitation Plan Page 66
Intake
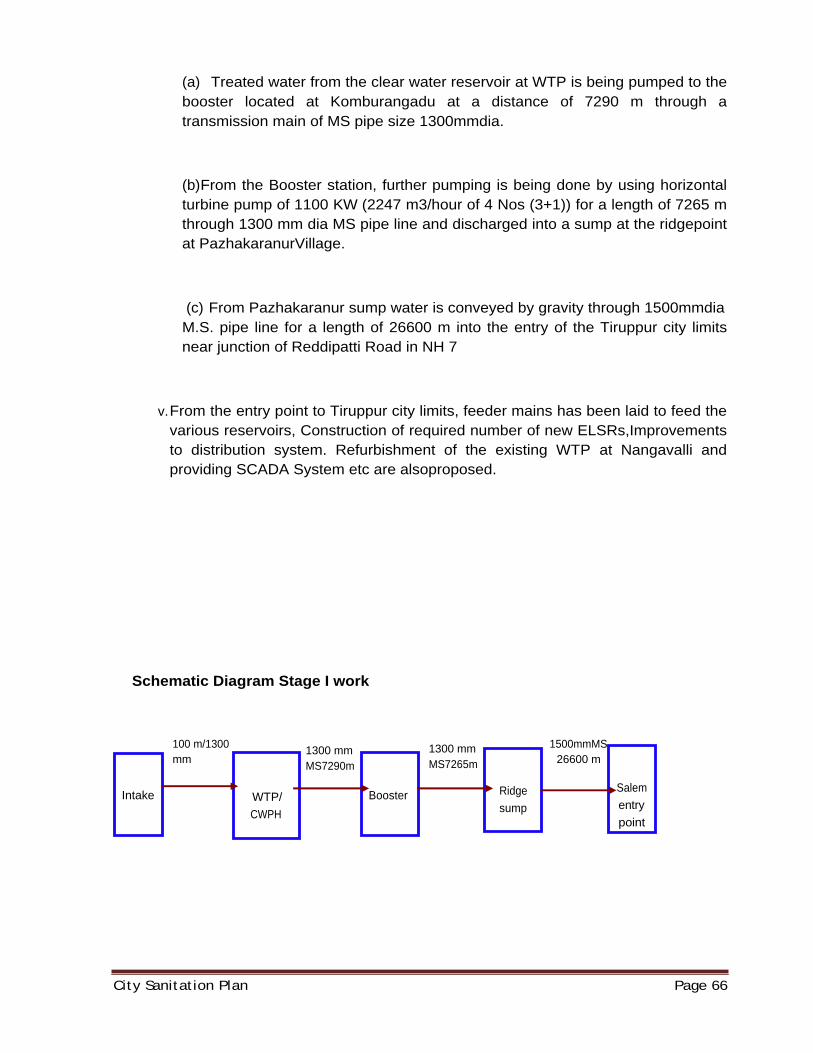
(a) Treated water from the clear water reservoir at WTP is being pumped to the booster located at Komburangadu at a distance of 7290 m through a transmission main of MS pipe size 1300mmdia.
(b) From the Booster station, further pumping is being done by using horizontal turbine pump of 1100 KW (2247 m3/hour of 4 Nos (3+1)) for a length of 7265 m through 1300 mm dia MS pipe line and discharged into a sump at the ridgepoint at PazhakaranurVillage.
(c) From Pazhakaranur sump water is conveyed by gravity through 1500mmdia M.S. pipe line for a length of 26600 m into the entry of the Tiruppur city limits near junction of Reddipatti Road in NH 7
v. From the entry point to Tiruppur city limits, feeder mains has been laid to feed the various reservoirs, Construction of required number of new ELSRs,Improvements to distribution system. Refurbishment of the existing WTP at Nangavalli and providing SCADA System etc are alsoproposed.
Schematic Diagram Stage I work 100 m/1300
mm 1300 mmMS7290m
1300 mmMS7265m
1500mmMS 26600 m
WTP/ CWPH
Booster Ridgesump
Salem entry point
City Sanitation Plan Page 67
City Sanitation Plan Page 68
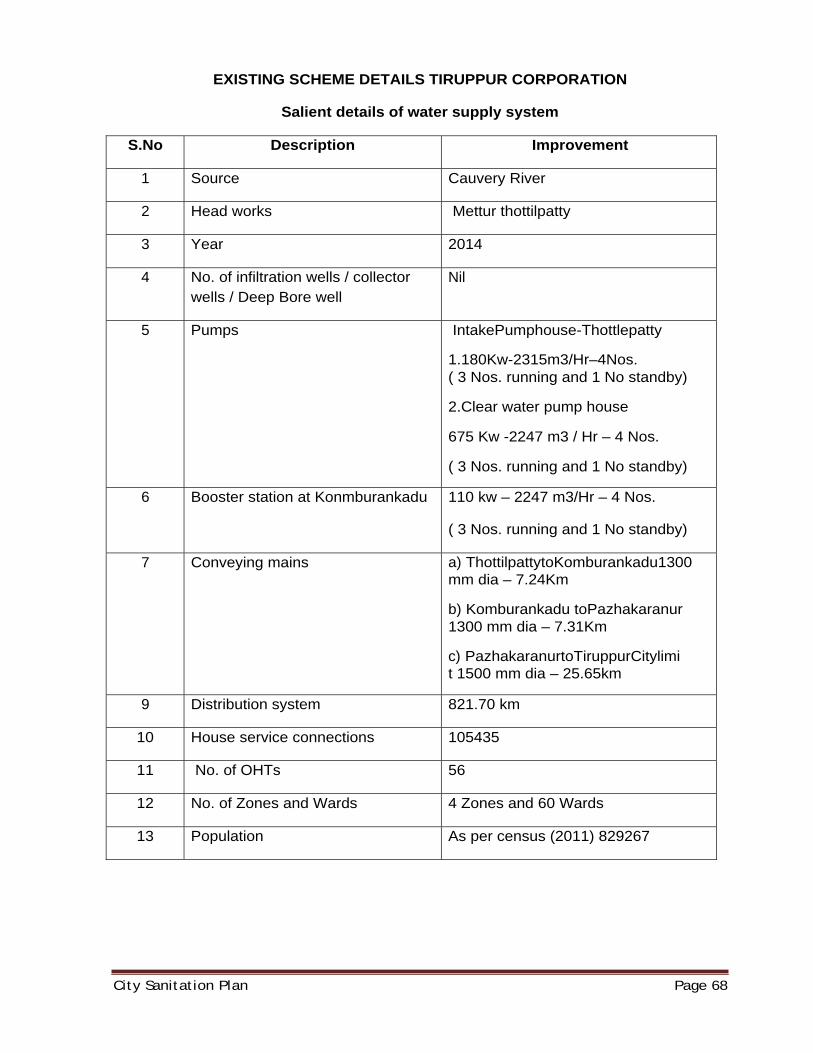
EXISTING SCHEME DETAILS TIRUPPUR CORPORATION
Salient details of water supply system
S.No Description Improvement
1 Source Cauvery River
2 Head works Mettur thottilpatty
3 Year 2014
4 No. of infiltration wells / collector wells / Deep Bore well
Nil
5 Pumps IntakePumphouse-Thottlepatty
1.180Kw-2315m3/Hr–4Nos. ( 3 Nos. running and 1 No standby)
2.Clear water pump house
675 Kw -2247 m3 / Hr – 4 Nos.
( 3 Nos. running and 1 No standby)
6 Booster station at Konmburankadu 110 kw – 2247 m3/Hr – 4 Nos. ( 3 Nos. running and 1 No standby)
7 Conveying mains a) ThottilpattytoKomburankadu1300 mm dia – 7.24Km
b) Komburankadu toPazhakaranur 1300 mm dia – 7.31Km
c) PazhakaranurtoTiruppurCitylimit 1500 mm dia – 25.65km
9 Distribution system 821.70 km
10 House service connections 105435
11 No. of OHTs 56
12 No. of Zones and Wards 4 Zones and 60 Wards
13 Population As per census (2011) 829267
City Sanitation Plan Page 69
UNDER GROUND SEWERAGESCHEME
City Sanitation Plan Page 70
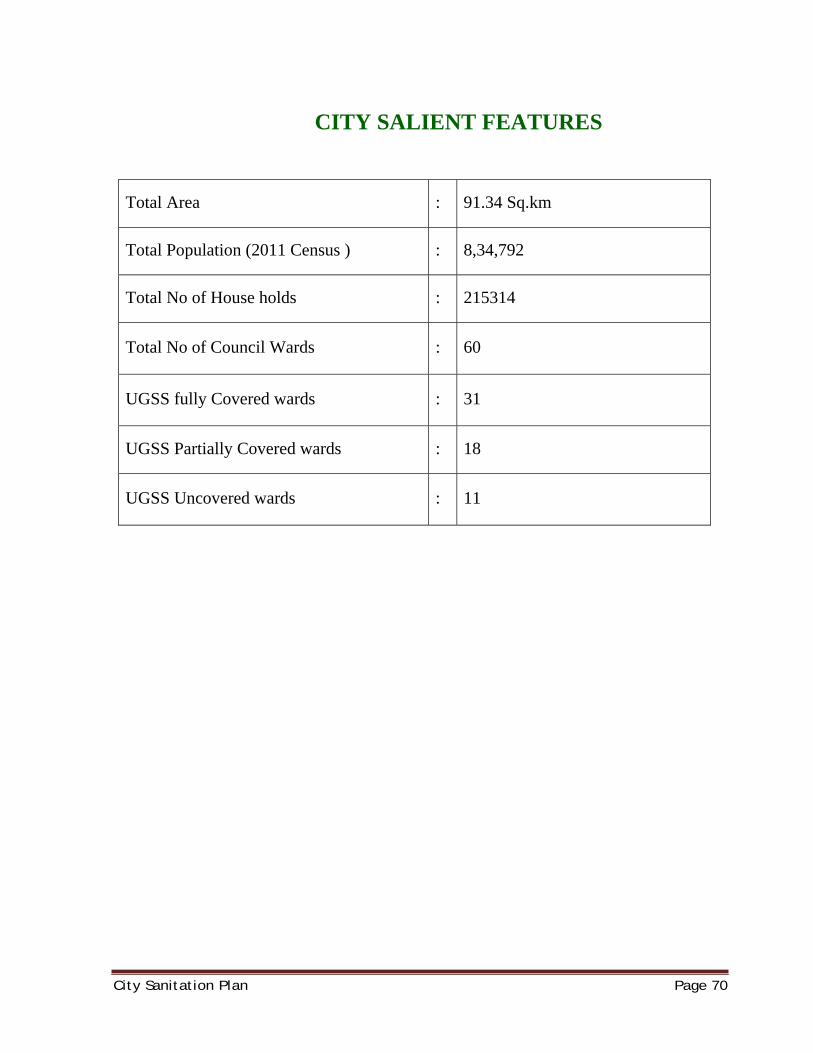
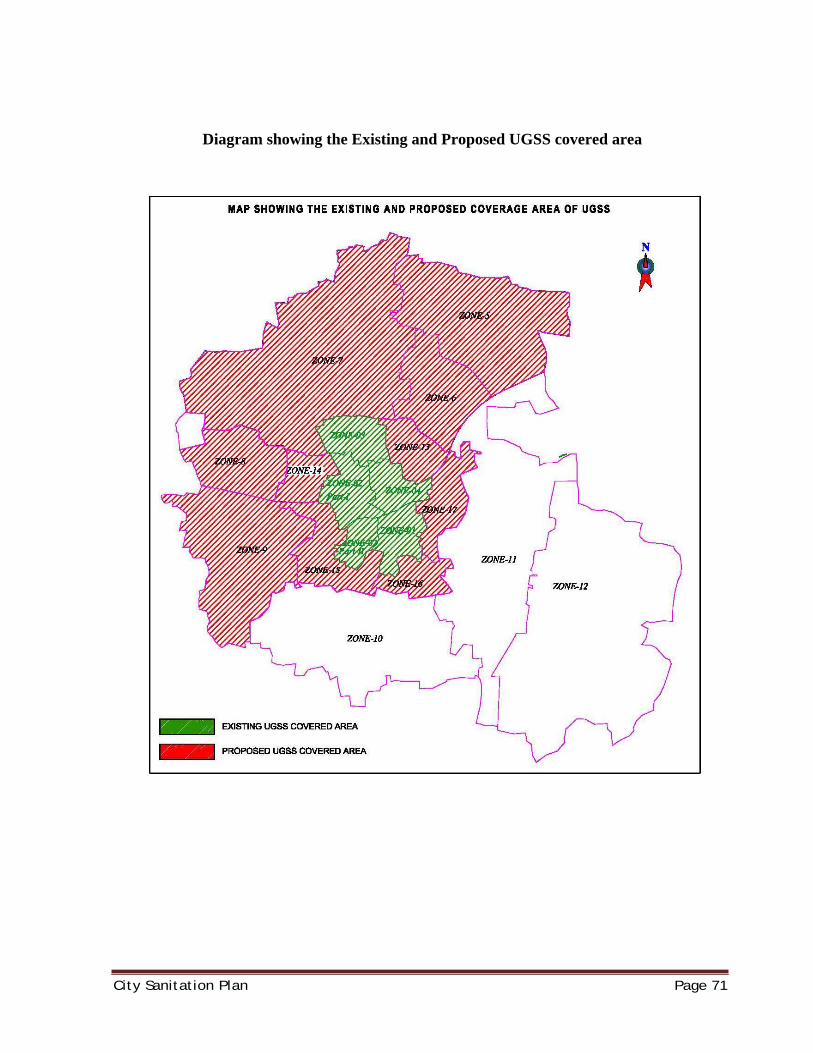
CITY SALIENT FEATURES
Total Area : 91.34 Sq.km
Total Population (2011 Census ) : 8,34,792
Total No of House holds : 215314
Total No of Council Wards : 60
UGSS fully Covered wards : 31
UGSS Partially Covered wards : 18
UGSS Uncovered wards : 11
City Sanitation Plan Page 71
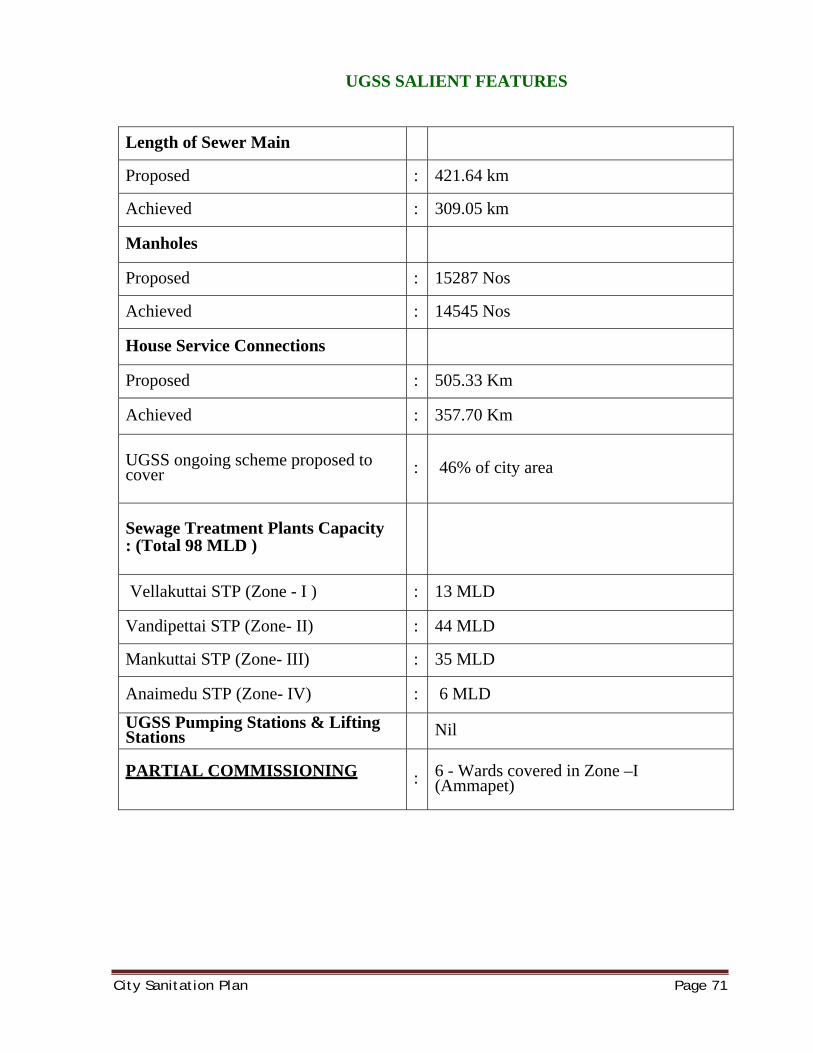
UGSS SALIENT FEATURES
Length of Sewer Main
Proposed : 421.64 km
Achieved : 309.05 km
Manholes
Proposed : 15287 Nos
Achieved : 14545 Nos
House Service Connections
Proposed : 505.33 Km
Achieved : 357.70 Km
UGSS ongoing scheme proposed to cover
:
46% of city area
Sewage Treatment Plants Capacity : (Total 98 MLD )
Vellakuttai STP (Zone - I ) : 13 MLD
Vandipettai STP (Zone- II) : 44 MLD
Mankuttai STP (Zone- III) : 35 MLD
Anaimedu STP (Zone- IV) : 6 MLD
UGSS Pumping Stations & Lifting Stations
Nil
PARTIAL COMMISSIONING : 6 - Wards covered in Zone –I
(Ammapet)
City Sanitation Plan Page 72
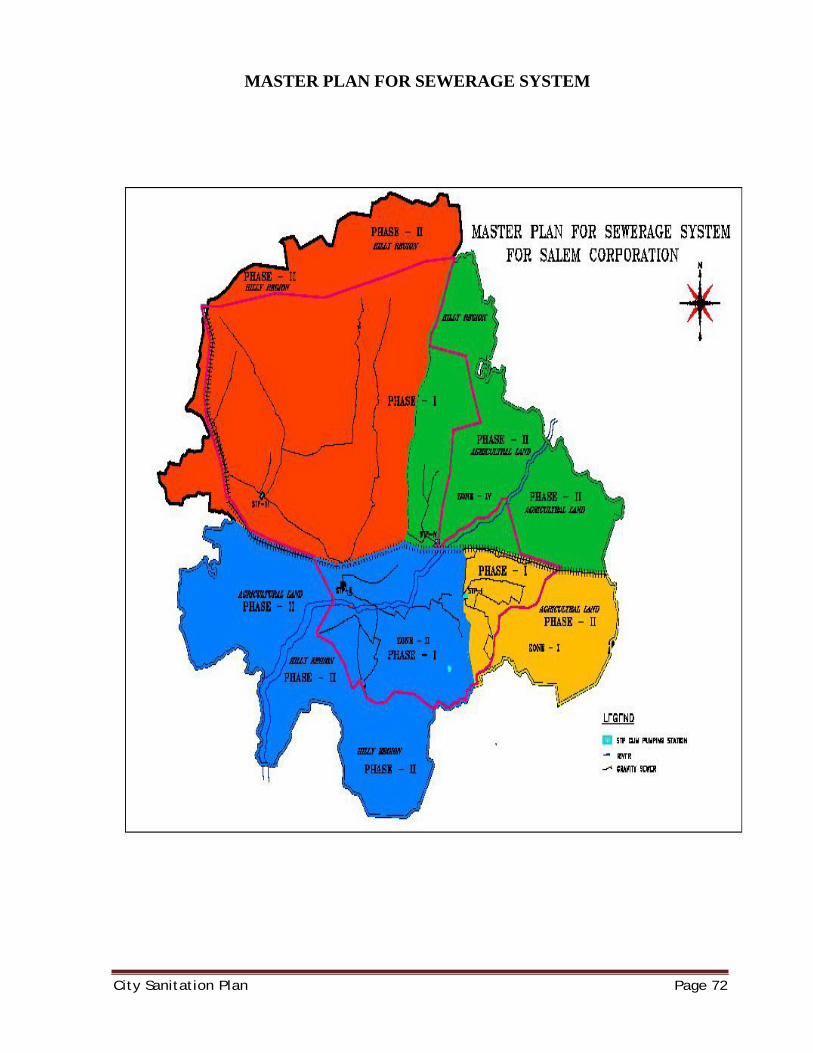
MASTER PLAN FOR SEWERAGE SYSTEM
City Sanitation Plan Page 73
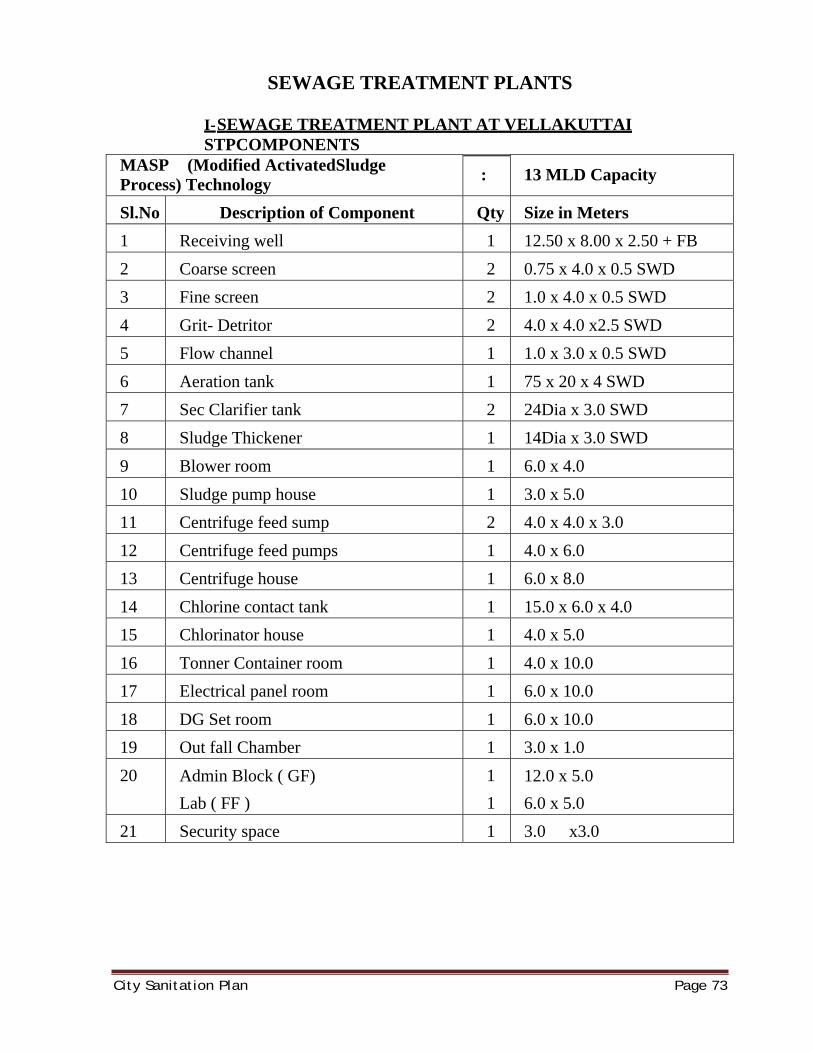
SEWAGE TREATMENT PLANTS
I- SEWAGE TREATMENT PLANT AT VELLAKUTTAI STPCOMPONENTS
MASP (Modified ActivatedSludgeProcess) Technology : 13 MLD Capacity
Sl.No Description of Component Qty Size in Meters 1 Receiving well 1 12.50 x 8.00 x 2.50 + FB 2 Coarse screen 2 0.75 x 4.0 x 0.5 SWD 3 Fine screen 2 1.0 x 4.0 x 0.5 SWD 4 Grit- Detritor 2 4.0 x 4.0 x2.5 SWD 5 Flow channel 1 1.0 x 3.0 x 0.5 SWD 6 Aeration tank 1 75 x 20 x 4 SWD 7 Sec Clarifier tank 2 24Dia x 3.0 SWD 8 Sludge Thickener 1 14Dia x 3.0 SWD 9 Blower room 1 6.0 x 4.0 10 Sludge pump house 1 3.0 x 5.0 11 Centrifuge feed sump 2 4.0 x 4.0 x 3.0 12 Centrifuge feed pumps 1 4.0 x 6.0 13 Centrifuge house 1 6.0 x 8.0 14 Chlorine contact tank 1 15.0 x 6.0 x 4.0 15 Chlorinator house 1 4.0 x 5.0 16 Tonner Container room 1 4.0 x 10.0 17 Electrical panel room 1 6.0 x 10.0 18 DG Set room 1 6.0 x 10.0 19 Out fall Chamber 1 3.0 x 1.0 20 Admin Block ( GF)
Lab ( FF ) 1 1
12.0 x 5.0 6.0 x 5.0
21 Security space 1 3.0 x3.0
City Sanitation Plan Page 74
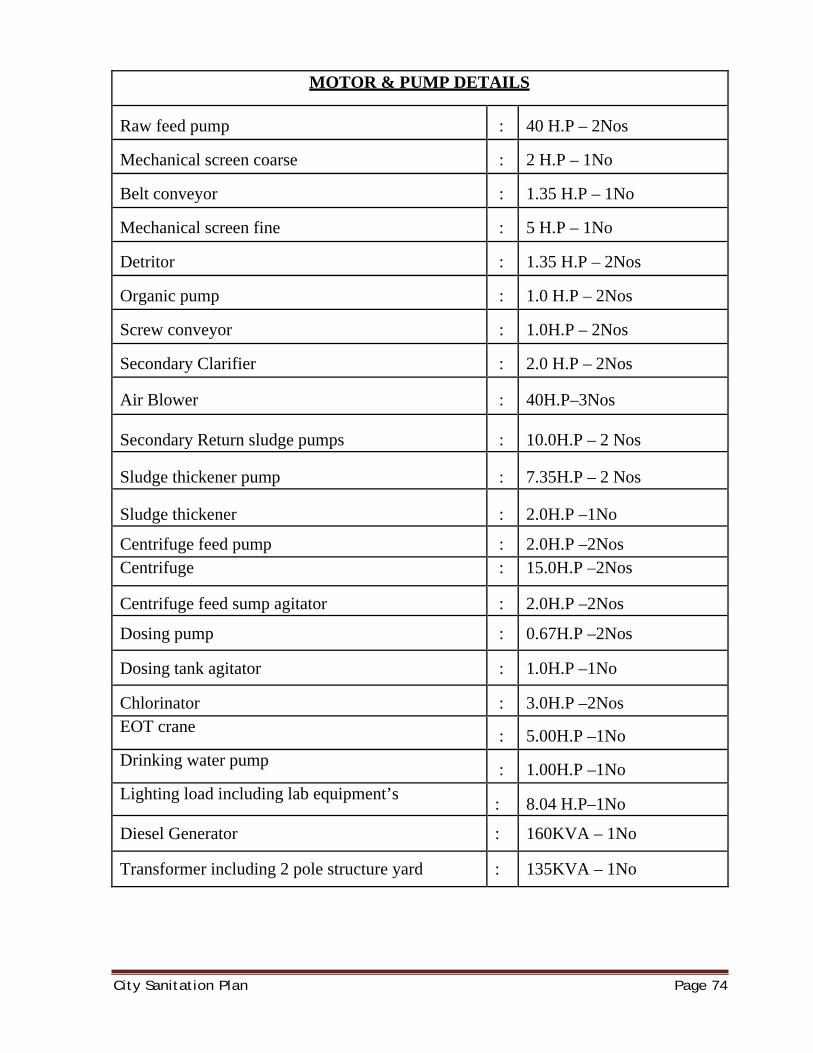
MOTOR & PUMP DETAILS
Raw feed pump : 40 H.P – 2Nos
Mechanical screen coarse : 2 H.P – 1No
Belt conveyor : 1.35 H.P – 1No
Mechanical screen fine : 5 H.P – 1No
Detritor : 1.35 H.P – 2Nos
Organic pump : 1.0 H.P – 2Nos
Screw conveyor : 1.0H.P – 2Nos
Secondary Clarifier : 2.0 H.P – 2Nos
Air Blower : 40H.P–3Nos
Secondary Return sludge pumps : 10.0H.P – 2 Nos
Sludge thickener pump : 7.35H.P – 2 Nos
Sludge thickener : 2.0H.P –1No
Centrifuge feed pump : 2.0H.P –2Nos Centrifuge : 15.0H.P –2Nos
Centrifuge feed sump agitator : 2.0H.P –2Nos
Dosing pump : 0.67H.P –2Nos
Dosing tank agitator : 1.0H.P –1No
Chlorinator : 3.0H.P –2Nos EOT crane : 5.00H.P –1No Drinking water pump : 1.00H.P –1No Lighting load including lab equipment’s : 8.04 H.P–1No
Diesel Generator : 160KVA – 1No
Transformer including 2 pole structure yard : 135KVA – 1No
City Sanitation Plan Page 75
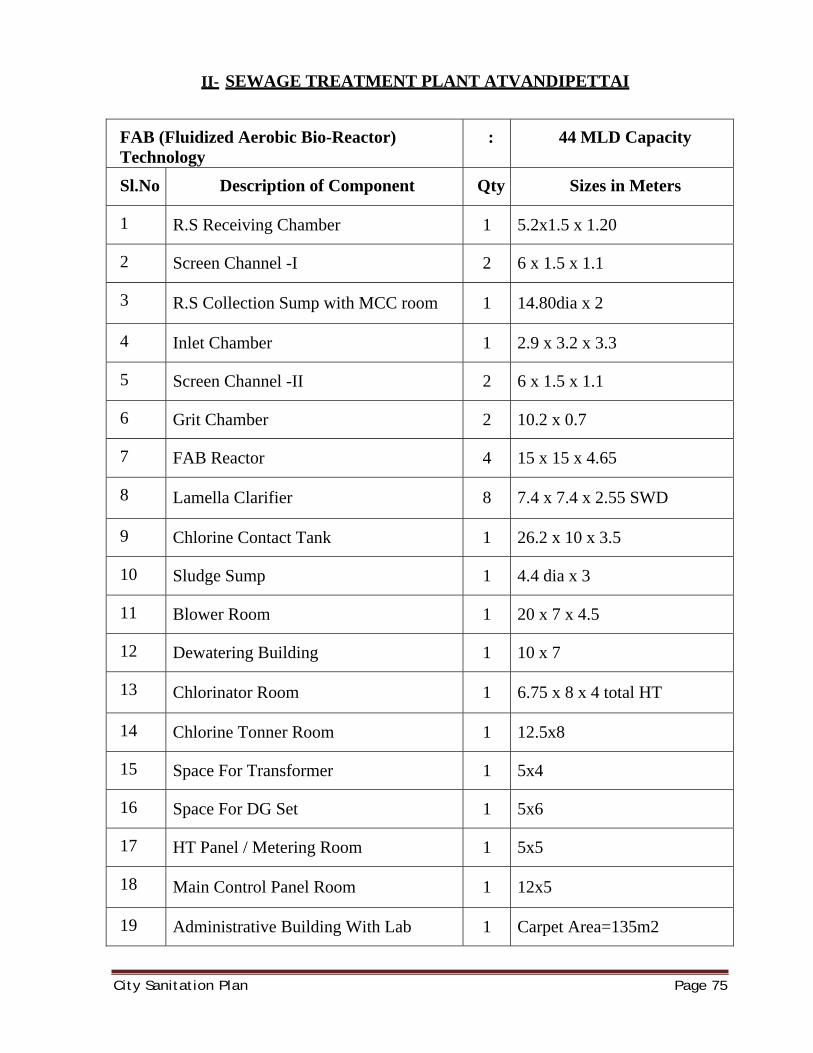
II- SEWAGE TREATMENT PLANT ATVANDIPETTAI
FAB (Fluidized Aerobic Bio-Reactor) Technology
: 44 MLD Capacity
Sl.No Description of Component Qty Sizes in Meters
1 R.S Receiving Chamber 1 5.2x1.5 x 1.20
2 Screen Channel -I 2 6 x 1.5 x 1.1
3 R.S Collection Sump with MCC room 1 14.80dia x 2
4 Inlet Chamber 1 2.9 x 3.2 x 3.3
5 Screen Channel -II 2 6 x 1.5 x 1.1
6 Grit Chamber 2 10.2 x 0.7
7 FAB Reactor 4 15 x 15 x 4.65
8 Lamella Clarifier 8 7.4 x 7.4 x 2.55 SWD
9 Chlorine Contact Tank 1 26.2 x 10 x 3.5
10 Sludge Sump 1 4.4 dia x 3
11 Blower Room 1 20 x 7 x 4.5
12 Dewatering Building 1 10 x 7
13 Chlorinator Room 1 6.75 x 8 x 4 total HT
14 Chlorine Tonner Room 1 12.5x8
15 Space For Transformer 1 5x4
16 Space For DG Set 1 5x6
17 HT Panel / Metering Room 1 5x5
18 Main Control Panel Room 1 12x5
19 Administrative Building With Lab 1 Carpet Area=135m2
City Sanitation Plan Page 76
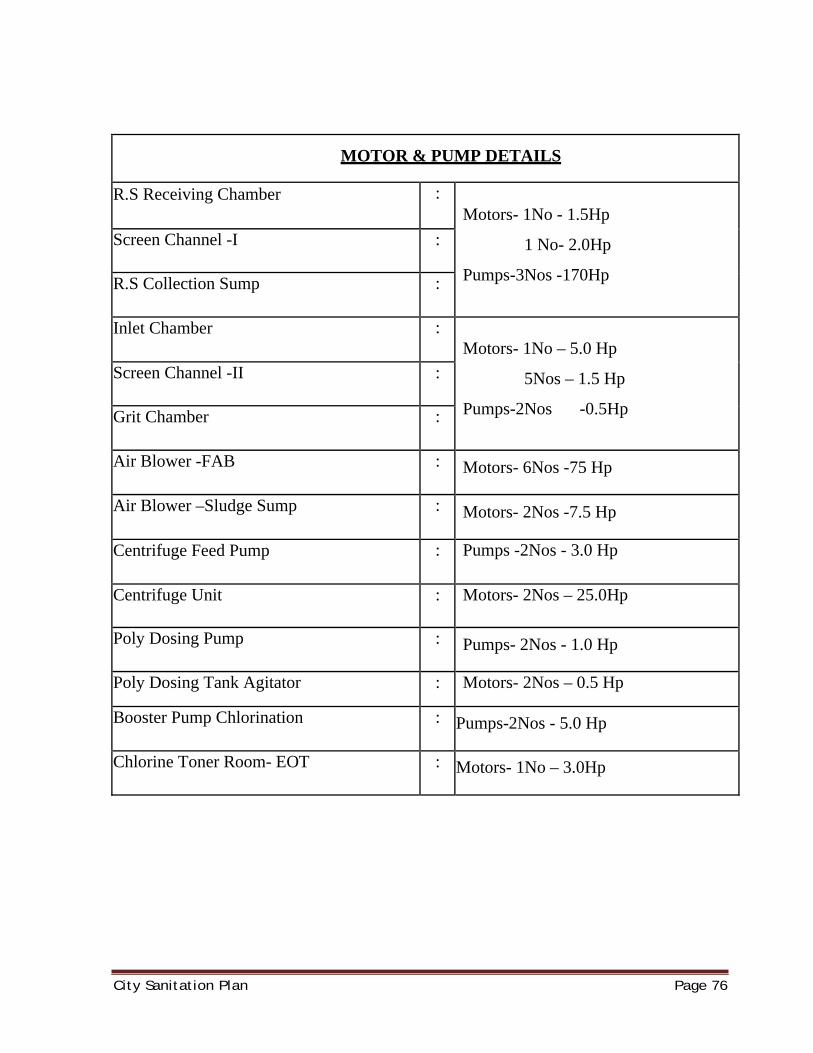
MOTOR & PUMP DETAILS
R.S Receiving Chamber : Motors- 1No - 1.5Hp
1 No- 2.0Hp
Pumps-3Nos -170Hp
Screen Channel -I :
R.S Collection Sump :
Inlet Chamber : Motors- 1No – 5.0 Hp
5Nos – 1.5 Hp
Pumps-2Nos -0.5Hp
Screen Channel -II :
Grit Chamber :
Air Blower -FAB : Motors- 6Nos -75 Hp
Air Blower –Sludge Sump : Motors- 2Nos -7.5 Hp
Centrifuge Feed Pump : Pumps -2Nos - 3.0 Hp
Centrifuge Unit : Motors- 2Nos – 25.0Hp
Poly Dosing Pump : Pumps- 2Nos - 1.0 Hp
Poly Dosing Tank Agitator : Motors- 2Nos – 0.5 Hp
Booster Pump Chlorination : Pumps-2Nos - 5.0 Hp
Chlorine Toner Room- EOT : Motors- 1No – 3.0Hp
City Sanitation Plan Page 77
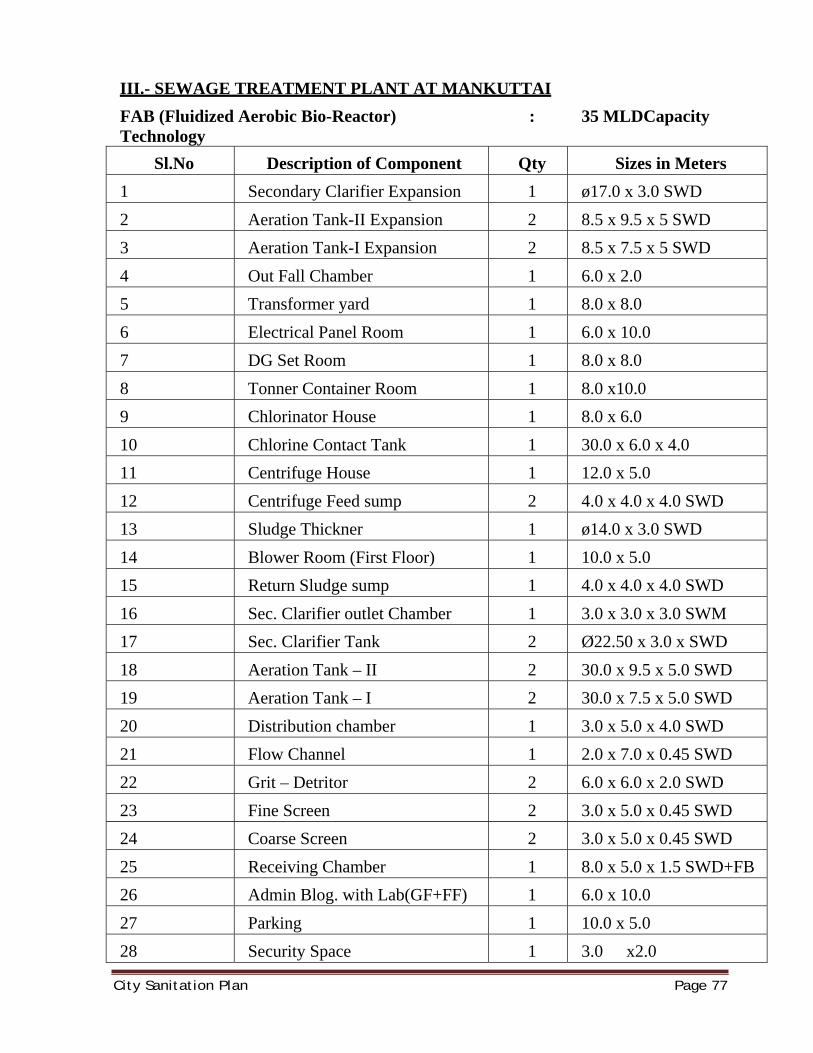
III.- SEWAGE TREATMENT PLANT AT MANKUTTAI FAB (Fluidized Aerobic Bio-Reactor) Technology
: 35 MLDCapacity
Sl.No Description of Component Qty Sizes in Meters 1 Secondary Clarifier Expansion 1 ø17.0 x 3.0 SWD 2 Aeration Tank-II Expansion 2 8.5 x 9.5 x 5 SWD 3 Aeration Tank-I Expansion 2 8.5 x 7.5 x 5 SWD 4 Out Fall Chamber 1 6.0 x 2.0 5 Transformer yard 1 8.0 x 8.0 6 Electrical Panel Room 1 6.0 x 10.0 7 DG Set Room 1 8.0 x 8.0 8 Tonner Container Room 1 8.0 x10.0 9 Chlorinator House 1 8.0 x 6.0 10 Chlorine Contact Tank 1 30.0 x 6.0 x 4.0 11 Centrifuge House 1 12.0 x 5.0 12 Centrifuge Feed sump 2 4.0 x 4.0 x 4.0 SWD 13 Sludge Thickner 1 ø14.0 x 3.0 SWD 14 Blower Room (First Floor) 1 10.0 x 5.0 15 Return Sludge sump 1 4.0 x 4.0 x 4.0 SWD 16 Sec. Clarifier outlet Chamber 1 3.0 x 3.0 x 3.0 SWM 17 Sec. Clarifier Tank 2 Ø22.50 x 3.0 x SWD 18 Aeration Tank – II 2 30.0 x 9.5 x 5.0 SWD 19 Aeration Tank – I 2 30.0 x 7.5 x 5.0 SWD 20 Distribution chamber 1 3.0 x 5.0 x 4.0 SWD 21 Flow Channel 1 2.0 x 7.0 x 0.45 SWD 22 Grit – Detritor 2 6.0 x 6.0 x 2.0 SWD 23 Fine Screen 2 3.0 x 5.0 x 0.45 SWD 24 Coarse Screen 2 3.0 x 5.0 x 0.45 SWD 25 Receiving Chamber 1 8.0 x 5.0 x 1.5 SWD+FB 26 Admin Blog. with Lab(GF+FF) 1 6.0 x 10.0 27 Parking 1 10.0 x 5.0 28 Security Space 1 3.0 x2.0
City Sanitation Plan Page 78
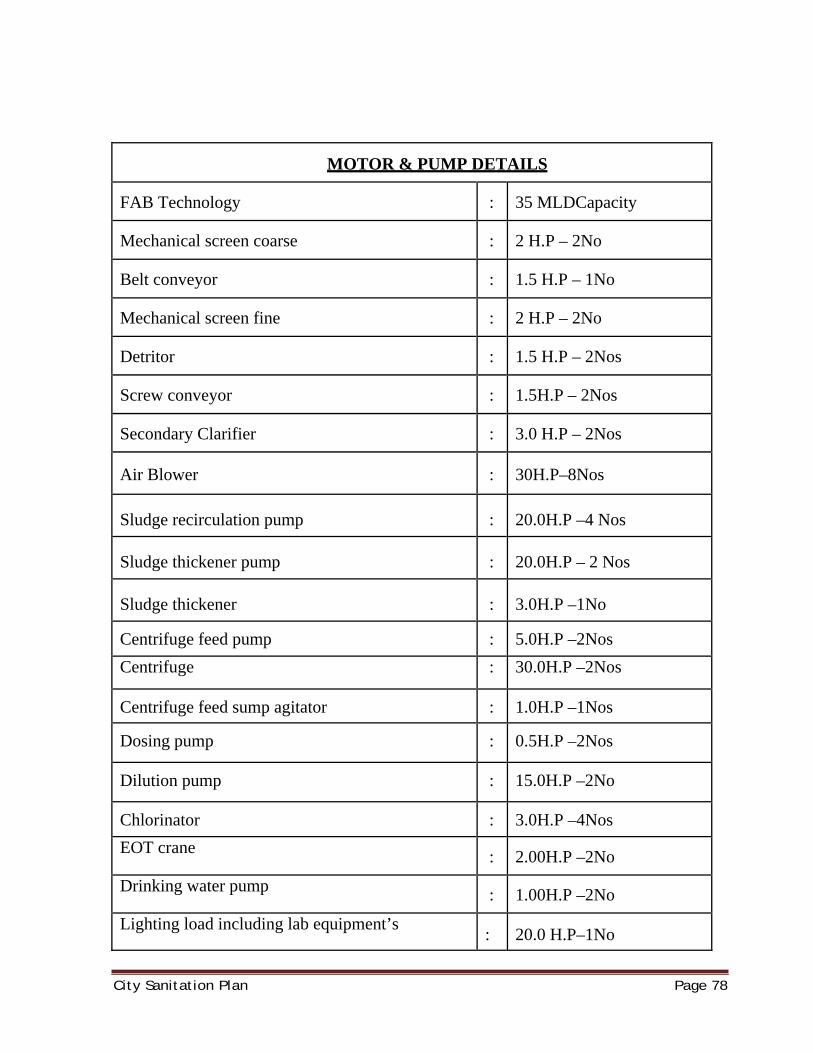
MOTOR & PUMP DETAILS
FAB Technology : 35 MLDCapacity
Mechanical screen coarse : 2 H.P – 2No
Belt conveyor : 1.5 H.P – 1No
Mechanical screen fine : 2 H.P – 2No
Detritor : 1.5 H.P – 2Nos
Screw conveyor : 1.5H.P – 2Nos
Secondary Clarifier : 3.0 H.P – 2Nos
Air Blower : 30H.P–8Nos
Sludge recirculation pump : 20.0H.P –4 Nos
Sludge thickener pump : 20.0H.P – 2 Nos
Sludge thickener : 3.0H.P –1No
Centrifuge feed pump : 5.0H.P –2Nos Centrifuge : 30.0H.P –2Nos
Centrifuge feed sump agitator : 1.0H.P –1Nos
Dosing pump : 0.5H.P –2Nos
Dilution pump : 15.0H.P –2No
Chlorinator : 3.0H.P –4Nos EOT crane : 2.00H.P –2No
Drinking water pump : 1.00H.P –2No
Lighting load including lab equipment’s : 20.0 H.P–1No
City Sanitation Plan Page 79
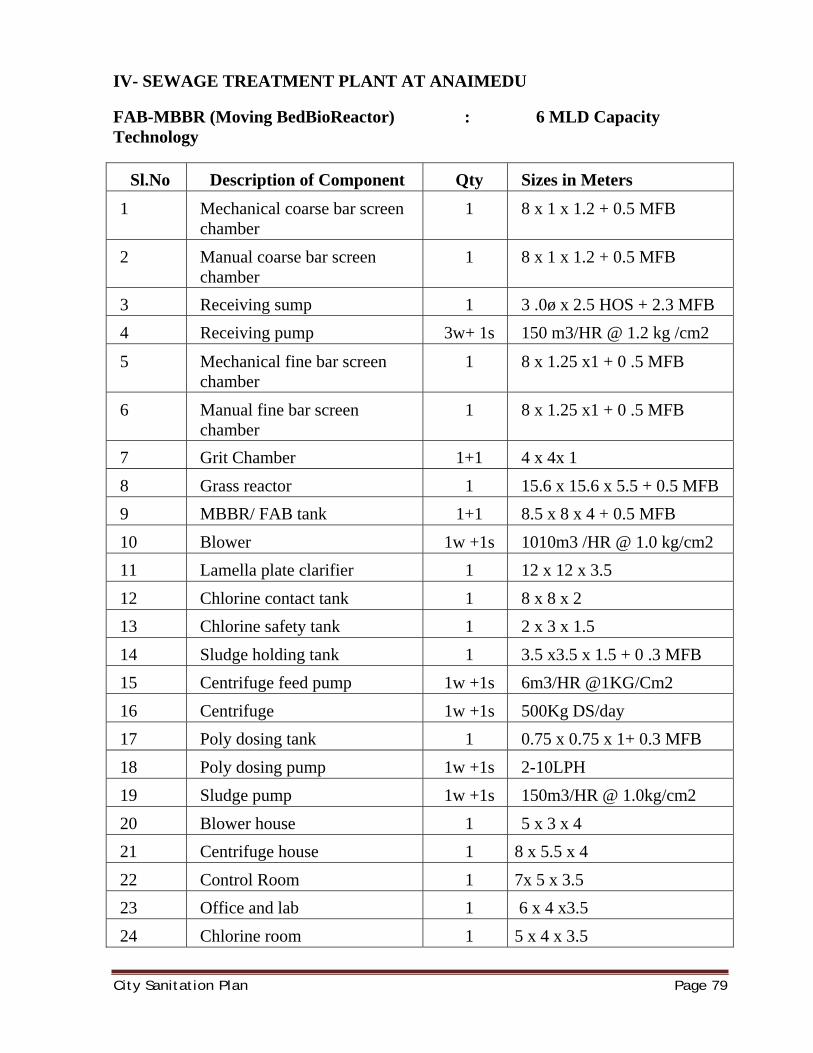
IV- SEWAGE TREATMENT PLANT AT ANAIMEDU
FAB-MBBR (Moving BedBioReactor) : 6 MLD Capacity Technology
Sl.No Description of Component Qty Sizes in Meters
1 Mechanical coarse bar screen chamber
1 8 x 1 x 1.2 + 0.5 MFB
2 Manual coarse bar screen chamber
1 8 x 1 x 1.2 + 0.5 MFB
3 Receiving sump 1 3 .0ø x 2.5 HOS + 2.3 MFB 4 Receiving pump 3w+ 1s 150 m3/HR @ 1.2 kg /cm2
5 Mechanical fine bar screen chamber
1 8 x 1.25 x1 + 0 .5 MFB
6 Manual fine bar screen chamber
1 8 x 1.25 x1 + 0 .5 MFB
7 Grit Chamber 1+1 4 x 4x 1 8 Grass reactor 1 15.6 x 15.6 x 5.5 + 0.5 MFB 9 MBBR/ FAB tank 1+1 8.5 x 8 x 4 + 0.5 MFB 10 Blower 1w +1s 1010m3 /HR @ 1.0 kg/cm2 11 Lamella plate clarifier 1 12 x 12 x 3.5 12 Chlorine contact tank 1 8 x 8 x 2 13 Chlorine safety tank 1 2 x 3 x 1.5 14 Sludge holding tank 1 3.5 x3.5 x 1.5 + 0 .3 MFB 15 Centrifuge feed pump 1w +1s 6m3/HR @1KG/Cm2 16 Centrifuge 1w +1s 500Kg DS/day 17 Poly dosing tank 1 0.75 x 0.75 x 1+ 0.3 MFB 18 Poly dosing pump 1w +1s 2-10LPH 19 Sludge pump 1w +1s 150m3/HR @ 1.0kg/cm2 20 Blower house 1 5 x 3 x 4 21 Centrifuge house 1 8 x 5.5 x 4 22 Control Room 1 7x 5 x 3.5 23 Office and lab 1 6 x 4 x3.5 24 Chlorine room 1 5 x 4 x 3.5
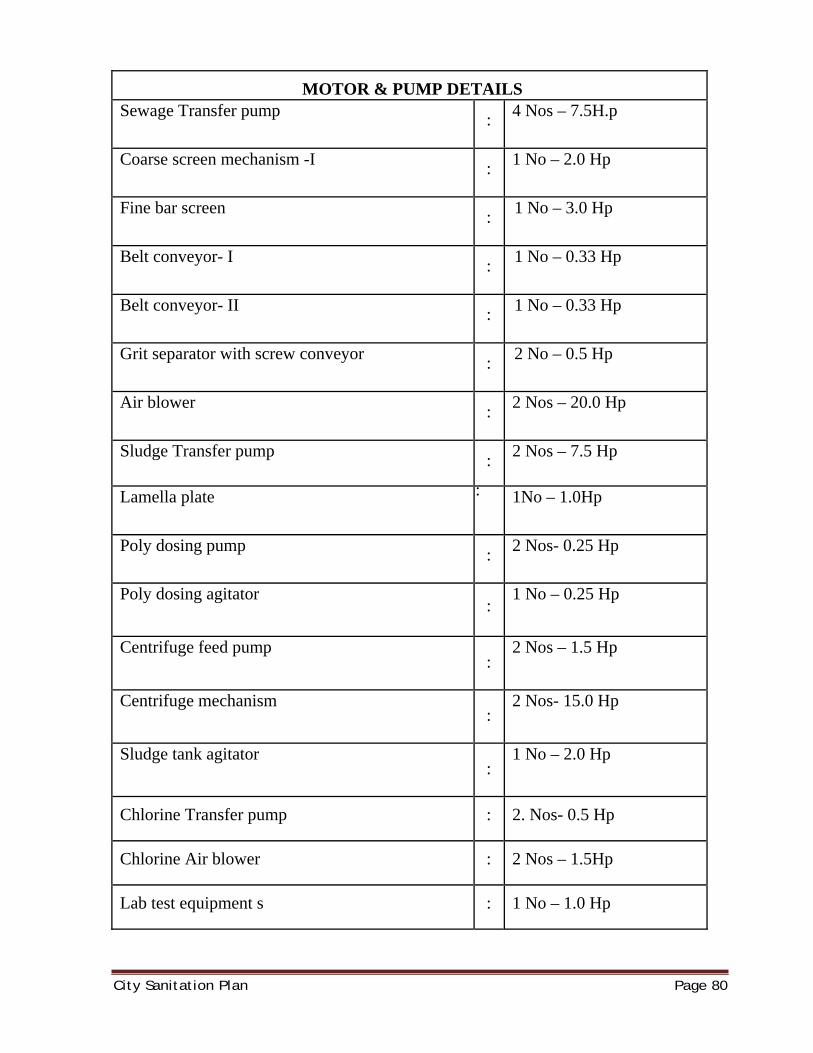
City Sanitation Plan Page 80
MOTOR & PUMP DETAILS Sewage Transfer pump : 4 Nos – 7.5H.p
Coarse screen mechanism -I : 1 No – 2.0 Hp
Fine bar screen : 1 No – 3.0 Hp
Belt conveyor- I : 1 No – 0.33 Hp
Belt conveyor- II : 1 No – 0.33 Hp
Grit separator with screw conveyor : 2 No – 0.5 Hp
Air blower : 2 Nos – 20.0 Hp
Sludge Transfer pump : 2 Nos – 7.5 Hp
Lamella plate : 1No – 1.0Hp
Poly dosing pump : 2 Nos- 0.25 Hp
Poly dosing agitator :
1 No – 0.25 Hp
Centrifuge feed pump :
2 Nos – 1.5 Hp
Centrifuge mechanism :
2 Nos- 15.0 Hp
Sludge tank agitator :
1 No – 2.0 Hp
Chlorine Transfer pump : 2. Nos- 0.5 Hp
Chlorine Air blower : 2 Nos – 1.5Hp
Lab test equipment s : 1 No – 1.0 Hp
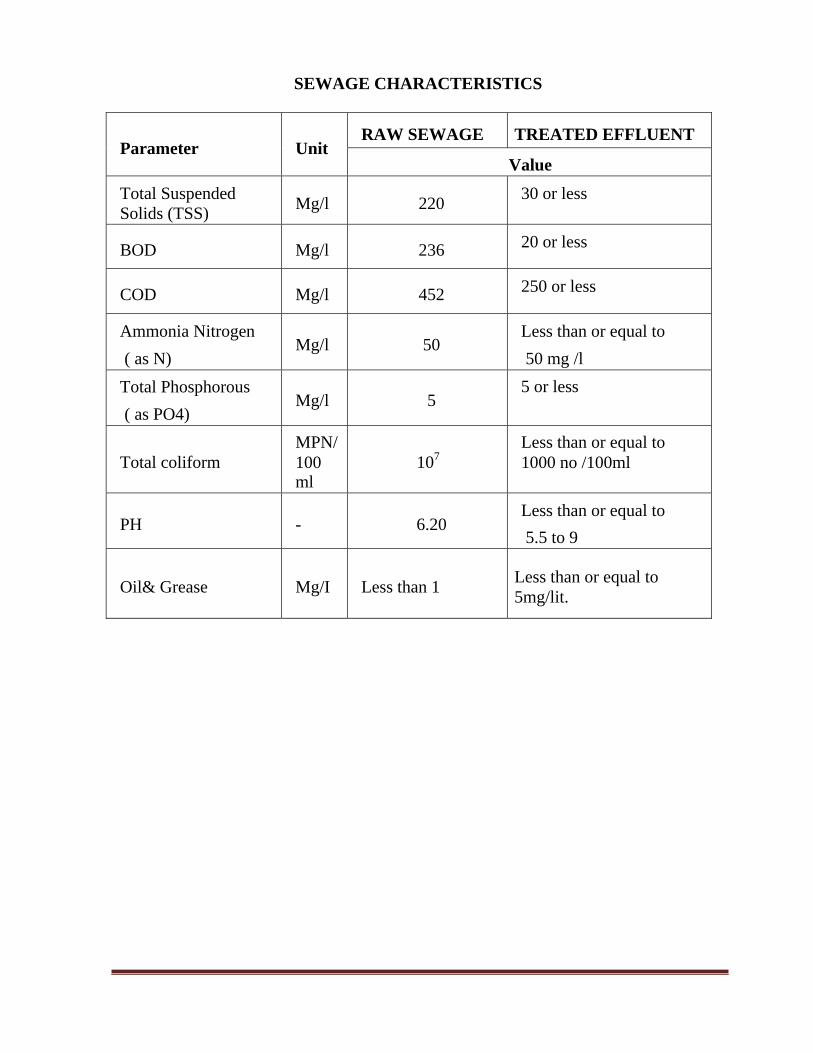
SEWAGE CHARACTERISTICS
Parameter
Unit
RAW SEWAGE TREATED EFFLUENT
Value
Total Suspended Solids (TSS)
Mg/l
220 30 or less
BOD Mg/l 236 20 or less
COD Mg/l 452 250 or less
Ammonia Nitrogen ( as N)
Mg/l
50
Less than or equal to 50 mg /l
Total Phosphorous ( as PO4)
Mg/l
5
5 or less
Total coliform
MPN/ 100 ml
107
Less than or equal to 1000 no /100ml
PH
-
6.20
Less than or equal to 5.5 to 9
Oil& Grease
Mg/I
Less than 1
Less than or equal to 5mg/lit.

WATERSUPPLY
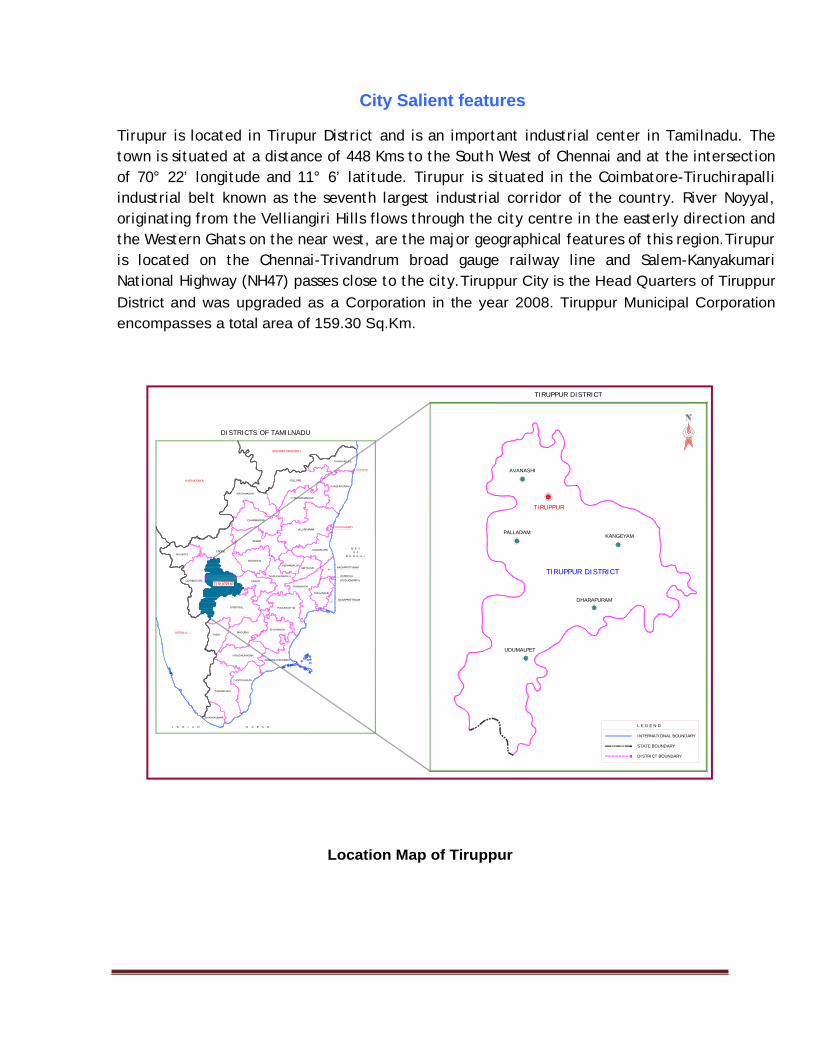
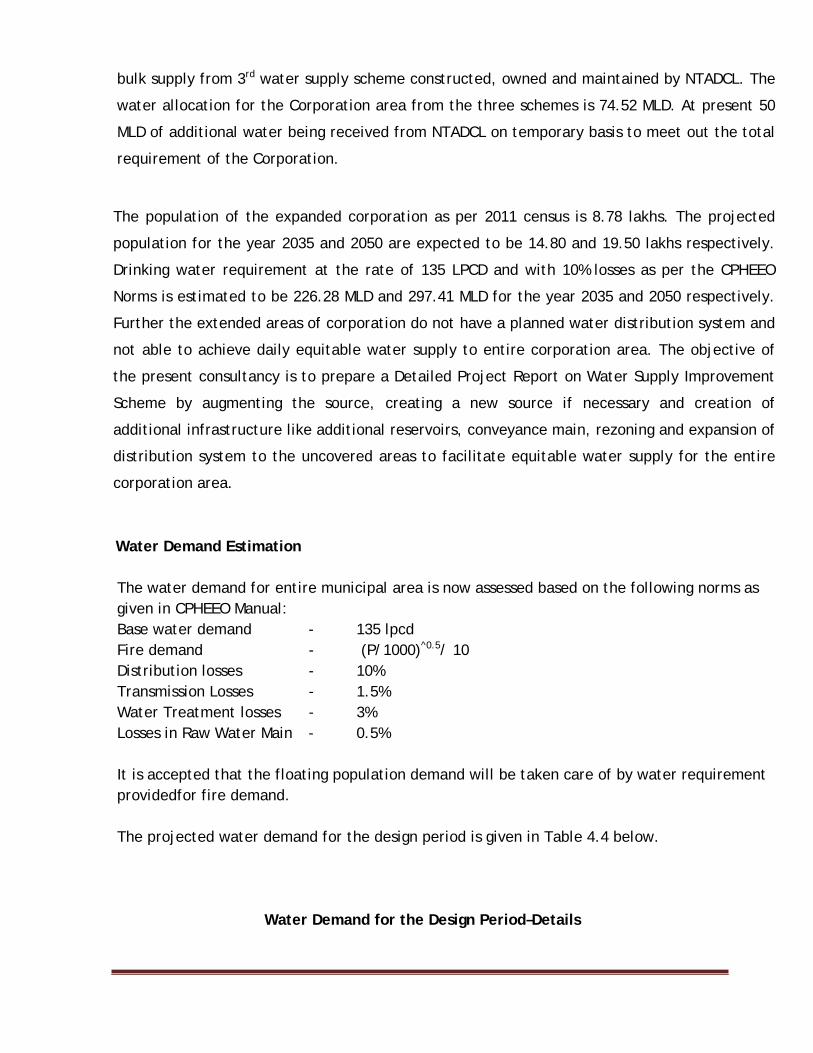
City Salient features
Tirupur is located in Tirupur District and is an important industrial center in Tamilnadu. The town is situated at a distance of 448 Kms to the South West of Chennai and at the intersection of 70° 22’ longitude and 11° 6’ latitude. Tirupur is situated in the Coimbatore-Tiruchirapalli industrial belt known as the seventh largest industrial corridor of the country. River Noyyal, originating from the Velliangiri Hills flows through the city centre in the easterly direction and the Western Ghats on the near west, are the major geographical features of this region.Tirupur is located on the Chennai-Trivandrum broad gauge railway line and Salem-Kanyakumari National Highway (NH47) passes close to the city.Tiruppur City is the Head Quarters of Tiruppur District and was upgraded as a Corporation in the year 2008. Tiruppur Municipal Corporation encompasses a total area of 159.30 Sq.Km.
Location Map of Tiruppur
DISTRICTS OF TAMILNADU
TIRUPPUR
TIRUPPUR DISTRICT
UDUMALPET
PALLADAM
DHARAPURAM
KANGEYAM
AVANASHI
TIRUPPUR DISTRICTTIRUPPUR
STATE BOUNDARY
DISTRICT BOUNDARY
L E G E N D
INTERNATIONAL BOUNDARY
KERALA
B A YO F
B E N G A L
I N D I A N O C E A N
KARNATAKA
ANDHRA PRADESH
THIRUVALLUE
CHENNAI
VELLORE
KANCHIPURAM
DHARMAPURI
TIRUVANNAMALAI
VILUPPURAM
KRISHNAGIRI
SALEM
ERODE
NAMAKKAL
THIRUCHIRAPALLI
PERAMBALURARIYALUR
CUDDALORE
NAGAPPATTINAM
TIRUVARUR
THANJAVUR
PUDUKKOTTAI
RAMANATHAPURAM
SIVAGANGA
VIRUDHUNAGAR
MADURAI
DINDIGUL
THENI
COIMBATORE KARUR
NILGIRIS
THOOTHUKUDI
TIRUNELVELI
KANYAKUMARI
KARAIKAL(PUDUCHERRY)
PUDUCHERRY
NAGAPPATTINAM
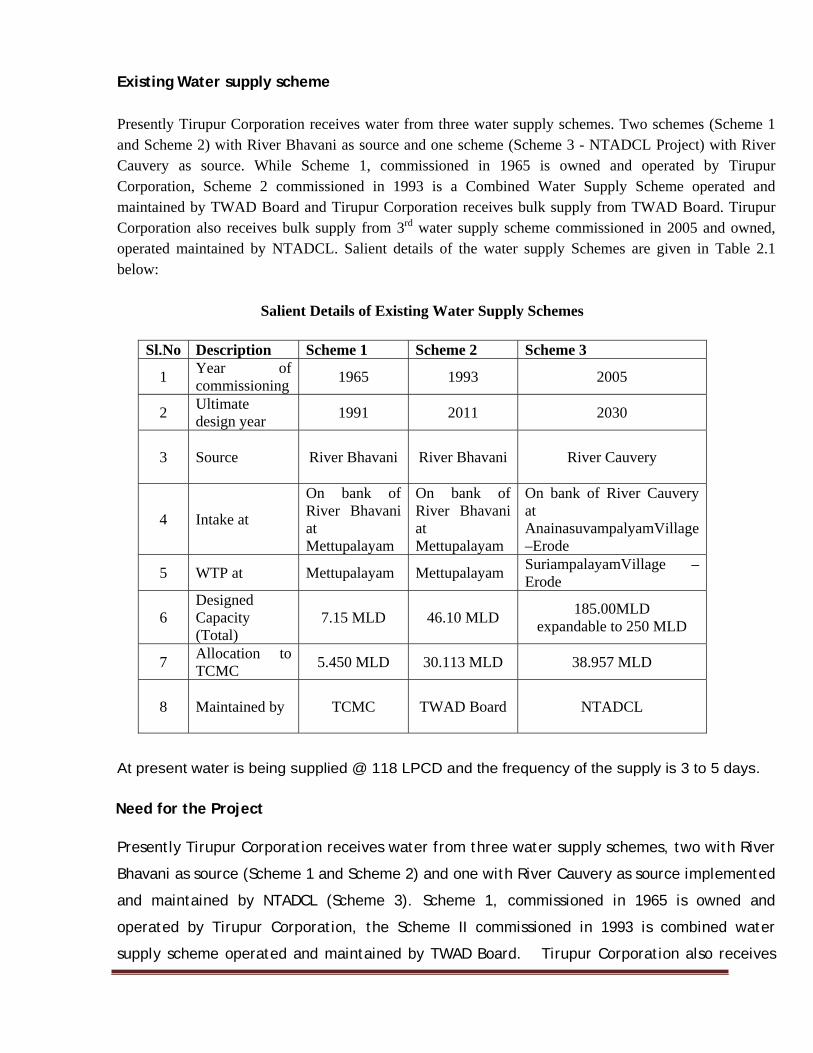
Existing Water supply scheme Presently Tirupur Corporation receives water from three water supply schemes. Two schemes (Scheme 1 and Scheme 2) with River Bhavani as source and one scheme (Scheme 3 - NTADCL Project) with River Cauvery as source. While Scheme 1, commissioned in 1965 is owned and operated by Tirupur Corporation, Scheme 2 commissioned in 1993 is a Combined Water Supply Scheme operated and maintained by TWAD Board and Tirupur Corporation receives bulk supply from TWAD Board. Tirupur Corporation also receives bulk supply from 3rd water supply scheme commissioned in 2005 and owned, operated maintained by NTADCL. Salient details of the water supply Schemes are given in Table 2.1 below:
Salient Details of Existing Water Supply Schemes
Sl.No Description Scheme 1 Scheme 2 Scheme 3
1 Year of commissioning 1965 1993 2005
2 Ultimate design year 1991 2011 2030
3 Source River Bhavani
River Bhavani
River Cauvery
4 Intake at
On bank of River Bhavani at Mettupalayam
On bank of River Bhavani at Mettupalayam
On bank of River Cauvery at AnainasuvampalyamVillage –Erode
5 WTP at Mettupalayam Mettupalayam SuriampalayamVillage – Erode
6 Designed Capacity (Total)
7.15 MLD 46.10 MLD 185.00MLD expandable to 250 MLD
7 Allocation to TCMC 5.450 MLD 30.113 MLD 38.957 MLD
8 Maintained by
TCMC TWAD Board NTADCL
At present water is being supplied @ 118 LPCD and the frequency of the supply is 3 to 5 days.
Need for the Project
Presently Tirupur Corporation receives water from three water supply schemes, two with River
Bhavani as source (Scheme 1 and Scheme 2) and one with River Cauvery as source implemented
and maintained by NTADCL (Scheme 3). Scheme 1, commissioned in 1965 is owned and
operated by Tirupur Corporation, the Scheme II commissioned in 1993 is combined water
supply scheme operated and maintained by TWAD Board. Tirupur Corporation also receives
bulk supply from 3rd water supply scheme constructed, owned and maintained by NTADCL. The
water allocation for the Corporation area from the three schemes is 74.52 MLD. At present 50
MLD of additional water being received from NTADCL on temporary basis to meet out the total
requirement of the Corporation.
The population of the expanded corporation as per 2011 census is 8.78 lakhs. The projected
population for the year 2035 and 2050 are expected to be 14.80 and 19.50 lakhs respectively.
Drinking water requirement at the rate of 135 LPCD and with 10% losses as per the CPHEEO
Norms is estimated to be 226.28 MLD and 297.41 MLD for the year 2035 and 2050 respectively.
Further the extended areas of corporation do not have a planned water distribution system and
not able to achieve daily equitable water supply to entire corporation area. The objective of
the present consultancy is to prepare a Detailed Project Report on Water Supply Improvement
Scheme by augmenting the source, creating a new source if necessary and creation of
additional infrastructure like additional reservoirs, conveyance main, rezoning and expansion of
distribution system to the uncovered areas to facilitate equitable water supply for the entire
corporation area.
Water Demand Estimation The water demand for entire municipal area is now assessed based on the following norms as given in CPHEEO Manual:
Base water demand - 135 lpcd Fire demand - (P/1000)^0.5/ 10
Distribution losses - 10% Transmission Losses - 1.5% Water Treatment losses - 3% Losses in Raw Water Main - 0.5% It is accepted that the floating population demand will be taken care of by water requirement providedfor fire demand. The projected water demand for the design period is given in Table 4.4 below.
Water Demand for the Design Period–Details
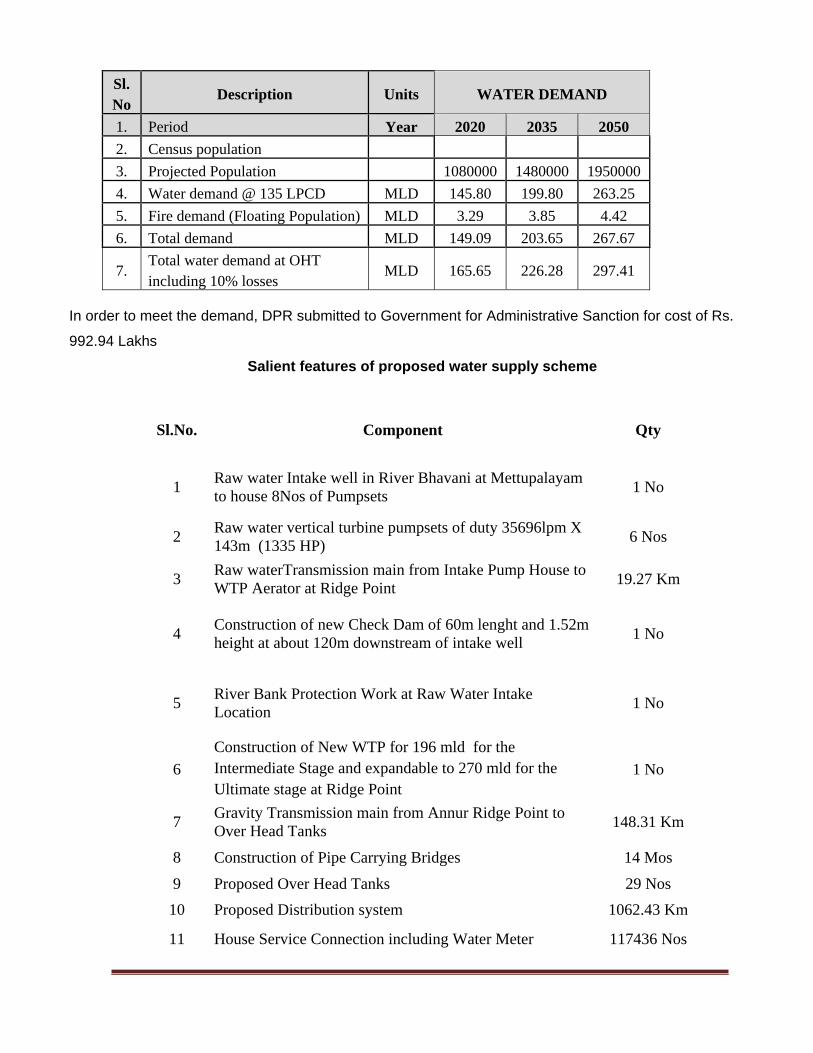
Sl. No
Description Units WATER DEMAND
1. Period Year 2020 2035 2050 2. Census population 3. Projected Population 1080000 1480000 1950000 4. Water demand @ 135 LPCD MLD 145.80 199.80 263.25 5. Fire demand (Floating Population) MLD 3.29 3.85 4.42 6. Total demand MLD 149.09 203.65 267.67
7. Total water demand at OHT including 10% losses
MLD 165.65 226.28 297.41
In order to meet the demand, DPR submitted to Government for Administrative Sanction for cost of Rs.
992.94 Lakhs
Salient features of proposed water supply scheme
Sl.No. Component Qty
1 Raw water Intake well in River Bhavani at Mettupalayam to house 8Nos of Pumpsets 1 No
2 Raw water vertical turbine pumpsets of duty 35696lpm X 143m (1335 HP) 6 Nos
3 Raw waterTransmission main from Intake Pump House to WTP Aerator at Ridge Point 19.27 Km
4 Construction of new Check Dam of 60m lenght and 1.52m height at about 120m downstream of intake well 1 No
5 River Bank Protection Work at Raw Water Intake Location 1 No
6 Construction of New WTP for 196 mld for the Intermediate Stage and expandable to 270 mld for the Ultimate stage at Ridge Point
1 No
7 Gravity Transmission main from Annur Ridge Point to Over Head Tanks 148.31 Km
8 Construction of Pipe Carrying Bridges 14 Mos
9 Proposed Over Head Tanks 29 Nos 10 Proposed Distribution system 1062.43 Km
11 House Service Connection including Water Meter 117436 Nos
Intake
Sl.No. Component Qty
12 Chlorination Plants 29 Nos
13 Providing SCADA system for main components & with provision for centralized status monitoring of distribution system
1 No
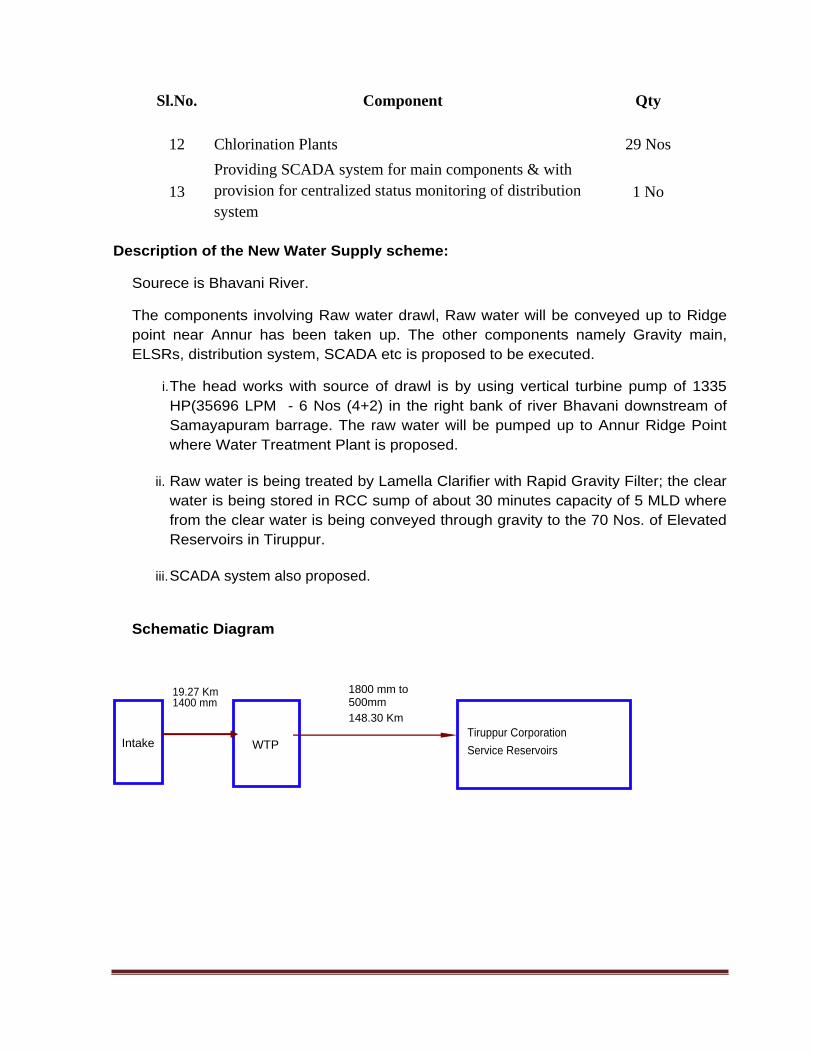
Description of the New Water Supply scheme:
Sourece is Bhavani River.
The components involving Raw water drawl, Raw water will be conveyed up to Ridge point near Annur has been taken up. The other components namely Gravity main, ELSRs, distribution system, SCADA etc is proposed to be executed.
i. The head works with source of drawl is by using vertical turbine pump of 1335 HP(35696 LPM - 6 Nos (4+2) in the right bank of river Bhavani downstream of Samayapuram barrage. The raw water will be pumped up to Annur Ridge Point where Water Treatment Plant is proposed.
ii. Raw water is being treated by Lamella Clarifier with Rapid Gravity Filter; the clear
water is being stored in RCC sump of about 30 minutes capacity of 5 MLD where from the clear water is being conveyed through gravity to the 70 Nos. of Elevated Reservoirs in Tiruppur.
iii. SCADA system also proposed.
Schematic Diagram 1800 mm to
500mm 148.30 Km
19.27 Km 1400 mm
WTP Tiruppur Corporation Service Reservoirs
UNDER GROUND SEWERAGESCHEME
City Sanitation Plan Page 70
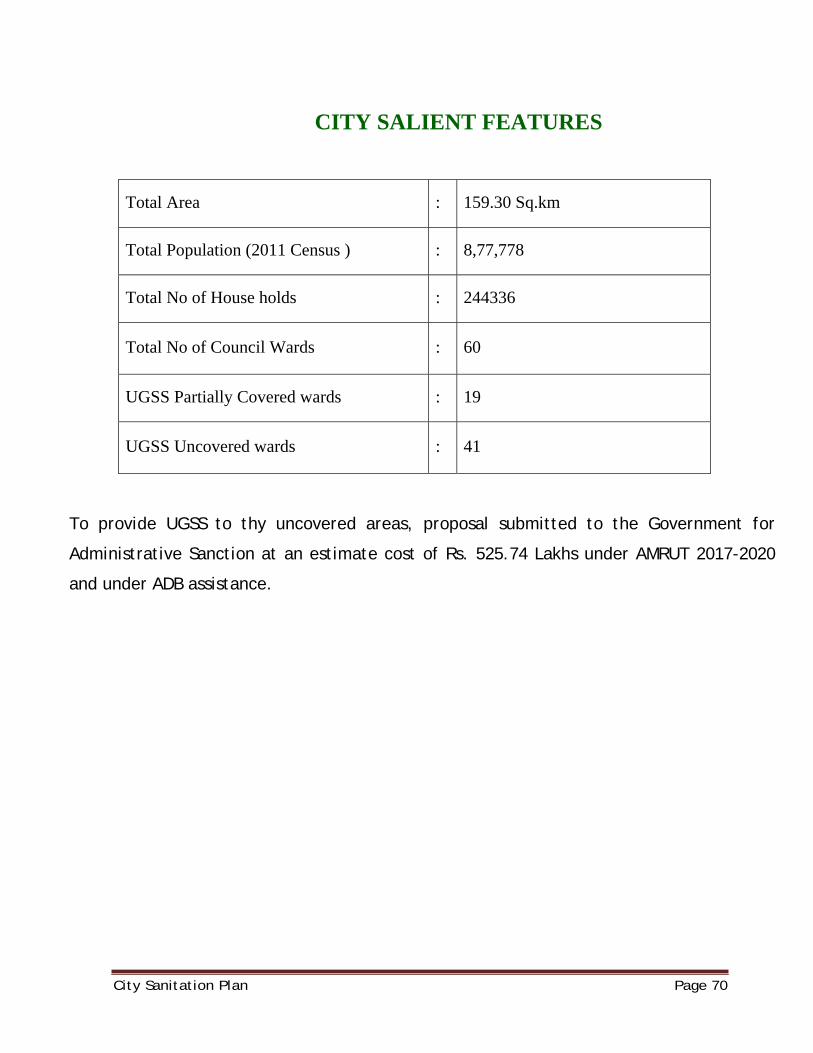
CITY SALIENT FEATURES
Total Area : 159.30 Sq.km
Total Population (2011 Census ) : 8,77,778
Total No of House holds : 244336
Total No of Council Wards : 60
UGSS Partially Covered wards : 19
UGSS Uncovered wards : 41
To provide UGSS to thy uncovered areas, proposal submitted to the Government for
Administrative Sanction at an estimate cost of Rs. 525.74 Lakhs under AMRUT 2017-2020
and under ADB assistance.
City Sanitation Plan Page 71
Diagram showing the Existing and Proposed UGSS covered area
City Sanitation Plan Page 72
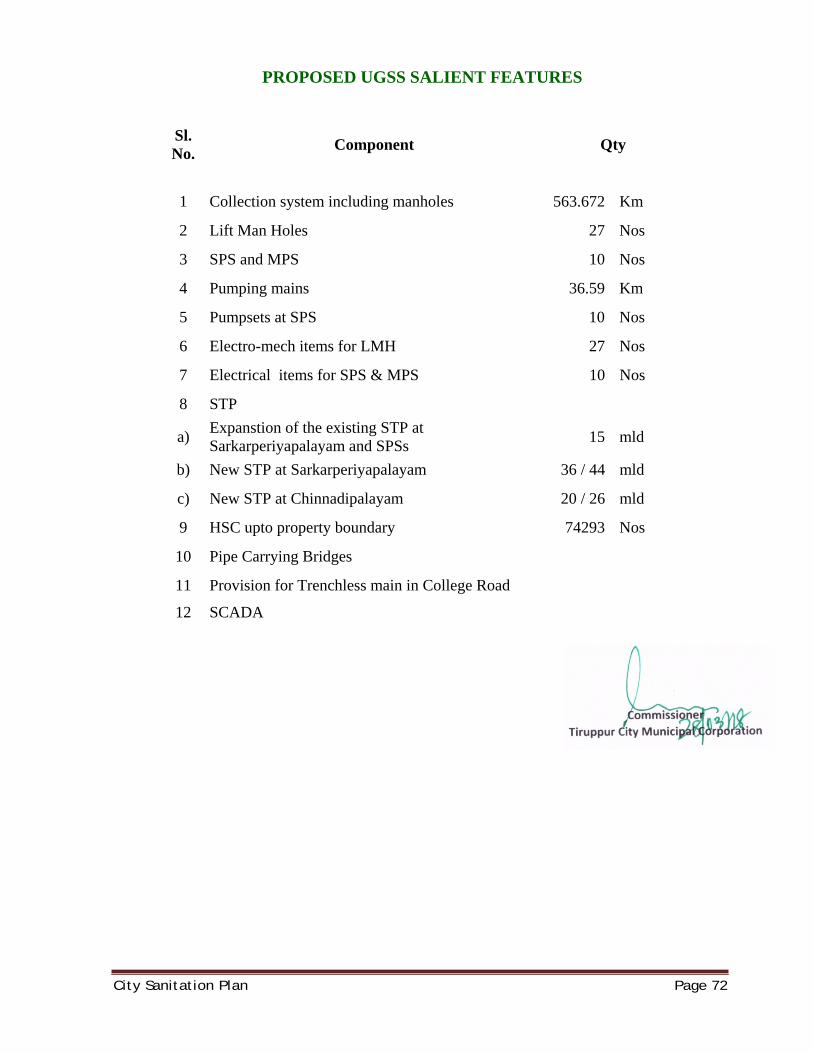
PROPOSED UGSS SALIENT FEATURES
Sl. No. Component Qty
1 Collection system including manholes 563.672 Km
2 Lift Man Holes 27 Nos
3 SPS and MPS 10 Nos
4 Pumping mains 36.59 Km
5 Pumpsets at SPS 10 Nos
6 Electro-mech items for LMH 27 Nos
7 Electrical items for SPS & MPS 10 Nos
8 STP
a) Expanstion of the existing STP at Sarkarperiyapalayam and SPSs 15 mld
b) New STP at Sarkarperiyapalayam 36 / 44 mld
c) New STP at Chinnadipalayam 20 / 26 mld
9 HSC upto property boundary 74293 Nos
10 Pipe Carrying Bridges
11 Provision for Trenchless main in College Road
12 SCADA