ti–ni–sn thermoelectric material three-dimensional ... · three-dimensional multimodal imaging...
TRANSCRIPT

Three-dimensional multimodal imaging and analysis of biphasic microstructure in aTi–Ni–Sn thermoelectric material
Jason E. Douglas, , McLean P. Echlin, William C. Lenthe, Ram Seshadri, and Tresa M. Pollock
Citation: APL Materials 3, 096107 (2015); doi: 10.1063/1.4931764View online: http://dx.doi.org/10.1063/1.4931764View Table of Contents: http://aip.scitation.org/toc/apm/3/9Published by the American Institute of Physics
Articles you may be interested inNanoscale structural heterogeneity in Ni-rich half-Heusler TiNiSnAPL Materials 116, 163514163514 (2014); 10.1063/1.4900497
Phase stability and property evolution of biphasic Ti–Ni–Sn alloys for use in thermoelectric applicationsAPL Materials 115, 043720043720 (2014); 10.1063/1.4862955
Enhancement of thermoelectric properties in the Nb–Co–Sn half-Heusler/Heusler system throughspontaneous inclusion of a coherent second phaseAPL Materials 120, 075104075104 (2016); 10.1063/1.4961215
APL MATERIALS 3, 096107 (2015)
Three-dimensional multimodal imaging and analysisof biphasic microstructure in a Ti–Ni–Snthermoelectric material
Jason E. Douglas,1,2,a McLean P. Echlin,1 William C. Lenthe,1Ram Seshadri,1,2,3 and Tresa M. Pollock1,21Materials Department, University of California, Santa Barbara, California 93106, USA2Materials Research Laboratory, University of California, Santa Barbara,California 93106, USA3Department of Chemistry and Biochemistry, University of California, Santa Barbara,California 93106, USA
(Received 28 May 2015; accepted 14 September 2015; published online 28 September 2015)
The three-dimensional microstructure of levitation melted TiNi1.20Sn has been char-acterized using the TriBeam system, a scanning electron microscope equippedwith a femtosecond laser for rapid serial sectioning, to map the character ofinterfaces. By incorporating both chemical data (energy dispersive x-ray spec-troscopy) and crystallographic data (electron backscatter diffraction), the grainstructure and phase morphology were analyzed in a 155 µm × 178 µm × 210 µmvolume and were seen to be decoupled. The predominant phases present in thematerial, half-Heusler TiNiSn, and full-Heusler TiNi2Sn have a percolated struc-ture. The distribution of coherent interfaces and high-angle interfaces has beenmeasured quantitatively. C 2015 Author(s). All article content, except where other-wise noted, is licensed under a Creative Commons Attribution 3.0 Unported License.[http://dx.doi.org/10.1063/1.4931764]
Among the possible avenues for increasing the efficiency of global energy usage, thermoelectricsare an exciting, solid-state option. Thermoelectric materials, which convert an internal temperaturegradient into a voltage and vice versa, have found applications in refrigeration as well as powergeneration from waste heat.1–4 Semiconductors that form in the half-Heusler (hH) crystal structureare of particular interest5,6 due to the very favorable electronic transport properties—conductivityand Seebeck coefficient—at relevant temperature regimes (between 500 ◦C and 800 ◦C), and becausethe common starting elements are relatively abundant and inexpensive. However, the efficiency ofthese materials suffers due to their relatively high thermal conductivities, typically >5 Wm−1K−1.5 Bycontrast, the best performing thermoelectrics have thermal conductivities approaching 1 Wm−1K−1
or less.7,8 The most common approaches to reduce the thermal conductivity of n-type, TiNiSn-basedhalf-Heusler materials are grain size reduction, through extended ball-milling followed by rapiddensification,5 and isoelectronic substitution on the Ti atomic site, forming Ti1−x−yZrxHf yNiSn al-loys in which mass fluctuation at point defects9,10 and strain in the lattice5,11 act to scatter high-energyphonons.
A third approach that has been explored more recently in the literature is to introduce full-Heusler (fH) particles, of the composition XNi2Sn (X = Ti, Zr, or Hf), into the matrix.5,6,12–14 Bypreparing materials of the formula XNi1+xSn—where typically x ≤ 0.15—intentionally biphasicmaterials have been engineered in which thermal conductivity is reduced by interfacial boundaryscattering and strain effects. In addition, the presence of interstitial Ni defects in the half-Heuslerstructure is understood to play a role in phonon scattering,15–17 and the electronic properties arepotentially improved by hot-carrier filtering at the phase interface.18
aElectronic mail: [email protected]
2166-532X/2015/3(9)/096107/8 3, 096107-1 ©Author(s) 2015

096107-2 Douglas et al. APL Mater. 3, 096107 (2015)
These half-/full-Heusler composite materials XNi1+xSn share a commonality with the best-performing Ti1−x−yZrxHf yNiSn alloys, in that phase separation is seen to play a central role in theefficiency of the latter19 in addition to the mass contrast effects. While ZrzHf1−zNiSn materials tendto be single-phase with full solubility between the Zr and Hf, if x + y < 1 in Ti1−x−yZrxHf yNiSn thematerials will separate into a Ti-rich half-Heusler phase and a Zr/Hf-rich half-Heusler phase.20–22
This holds true in p-type Ti1−x−yZrxHf yCoSb as well.23 Given the importance of phase separation inthe most advanced half-Heusler based thermoelectrics, it is critical to understand the microstructurein order to relate composition to properties, as recognized in previous studies.
A challenging aspect of examining and quantifying microstructure in bulk materials is thatwhile phases and grains are generally 3-D in nature, most microscopy techniques only allow for 2-Dcharacterization, a planar micrograph of an exposed surface. This is further complicated by the factthat multiple types of data are often required to address a single microstructural question. Previousstudies have explored two-phase alloys, such as the γ/γ′ microstructure of Ni-base superalloys, bysequential imaging and focused-ion beam milling,24 but the collection time is prohibitive for largevolumes. And while some microstructural properties can be calculated from stereological analysisin 2-D, others such as permeability25 and percolation are difficult or impossible to determine without3-D tomography. X-ray tomography is commonly employed to acquire 3-D data, to study questionssuch as precipitate curvature upon solidification,26 with the advantage of being able to collect largevolumes quickly and non-destructively. However, the similar lattice parameters and poor absorptioncontrast between the phases precludes this approach for full-Heusler/half-Heusler mixtures.
When the excess Ni concentration x in TiNi1+xSn exceeds 0.15 in induction-melted materials,we have previously measured an abrupt jump in the thermal conductivity, attributed to percolationof the metallic TiNi2Sn at the composition TiNi1.20Sn.14 In this letter, we detail a 3-D microstruc-tural study of melt-prepared TiNi1.20Sn by use of the TriBeam tomography system,27 a scanningelectron microscope (SEM) equipped with a femtosecond laser (150 fs pulse) for serial section-ing. Femtosecond lasers have been demonstrated to achieve in situ material removal rates thatare 5–6 orders of magnitude faster than conventional Ga+ source focused ion beams (FIBs) whilemaintaining low-damage ablation surfaces27 that can be directly probed with SEM microanalyticaltechniques such as energy dispersive x-ray spectroscopy (EDS) and electron backscatter diffraction(EBSD), for chemical and structural information respectively. We have collected a tomographicdataset, 155 µm × 178 µm × 210 µm in size, and used these data to study grain structure and phasemorphology. In particular, we examine connectivity of the TiNi2Sn phase and the presence ofhigh angle versus coherent interfaces between the phases, and relate these to the thermal transportproperties of the bulk sample.
The material used for this study was prepared by levitation induction melting the respectiveconstituent elements (Ti, Ni, and Sn in a ratio of 1:1.2:1) followed by a homogenizing heat treatment,described in detail in Ref. 14. A rectangular specimen just over 200 µm thick and 1 cm2 in area wasprepared for the TriBeam from this heat-treated material using a low speed cut-off saw with a diamondwafering blade. Along one edge, square pillars approximately 200 µm wide were cut to limit rede-position of ablating material onto the specimen. The dataset was collected from one of these pillars.
Femtosecond laser pulses with 780 nm wavelength and 1 kHz repetition rate were used to ablatematerial from the sample surface. The laser beam was scanned horizontally and parallel to the samplesurface, ablating material with the low-fluence radial edge of Gaussian profile pulses.27 Therefore,high resolution encoded piezoelectric stages control the slice thickness by incrementally raising thesample surface into the beam. As such, slices as thin as 100 nm may be removed. However, 2 µmslices were made for the TiNi1.20Sn samples due to the size of the dendritic microstructural featuresand the interaction volume of 20 keV EDS imaging (1 µm deep). In total, 89 slices were collected withEBSD and EDS maps at 0.7 µm step size, giving an overall voxel size of 0.7 µm × 0.7 µm × 2.0 µm.The total dataset collection required roughly 48 h for fully automated acquisition of all signals.
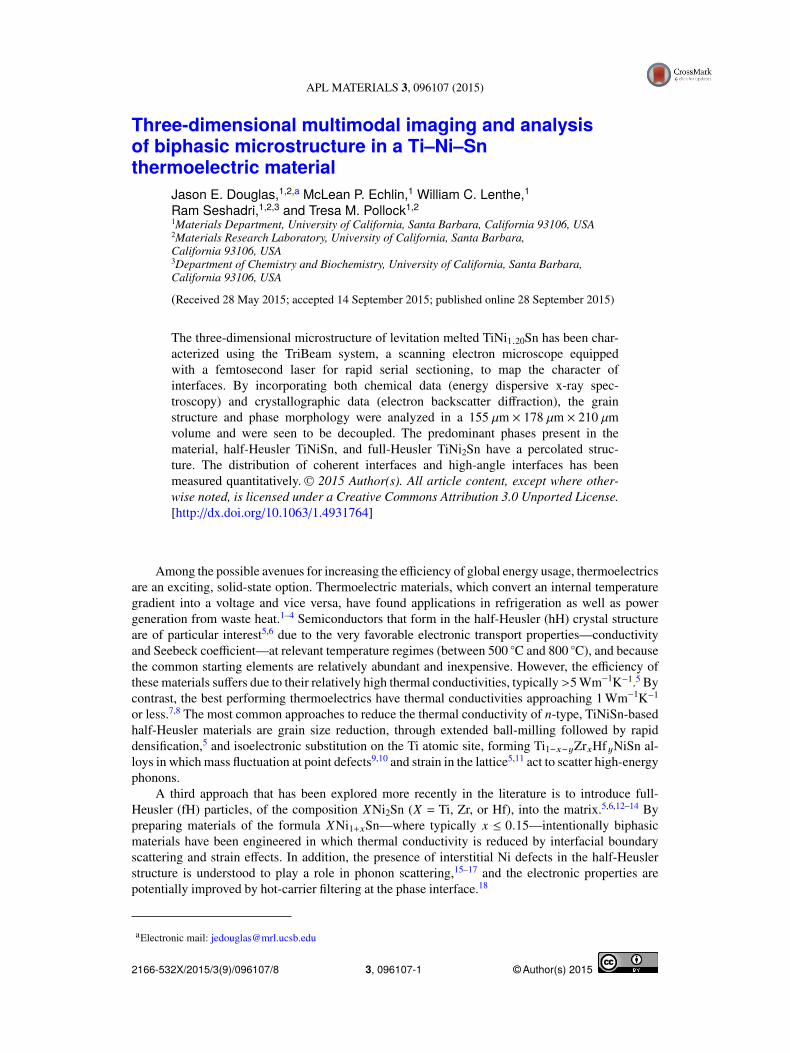
The procedure for reconstructing the dataset into a 3-D volume is outlined in Figure 1. Allcollected data are stored in an archival HDF5, binary, or Matlab file, with the ability to query any mo-dality of information for any voxel. Phases were defined per slice using the expectation-maximization/maximization of the posterior marginals (EM/MPM) algorithm,28 as implemented in BlueQuartz soft-ware EM/MPM Workbench, to threshold maps of the Ni EDS signal into three classes: hH TiNiSn, fH
096107-3 Douglas et al. APL Mater. 3, 096107 (2015)
FIG. 1. Schematic process for data segmentation and reconstruction—decomposed to example 2-D maps for ease of view,though in practice all raw data are stored and retained at each voxel, and segmentation and analysis are performed in 3-D. (a)At each slice, chemical and crystallographic data are collected simultaneously and used, respectively, to segment phases anddefine unique grains. (b) These data reconstructed into a 3-D volume.
TiNi2Sn, and a Ti–Sn binary phase, Ti5Ni1−ySn3, the three phases observed in the material by x-raydiffraction (XRD) and by EDS (considering Ti and Sn signal in addition to Ni).
EBSD data collected simultaneously were indexed to either fH or Ti5Ni1−ySn3 to gain orienta-tion data; while EBSD can give higher resolution phase identification than EDS, which has an inter-action volume of between 1 and 2 µm, the diffraction patterns given by hH and fH are too similarto be distinguishable by EBSD analysis software. The data of these two modalities, segmented EDSand EBSD orientation data, were then combined using the Dream3D software package,29 in whichvolume reconstruction, stack alignment, data cleanup, property measurement, and data analysiswere performed.
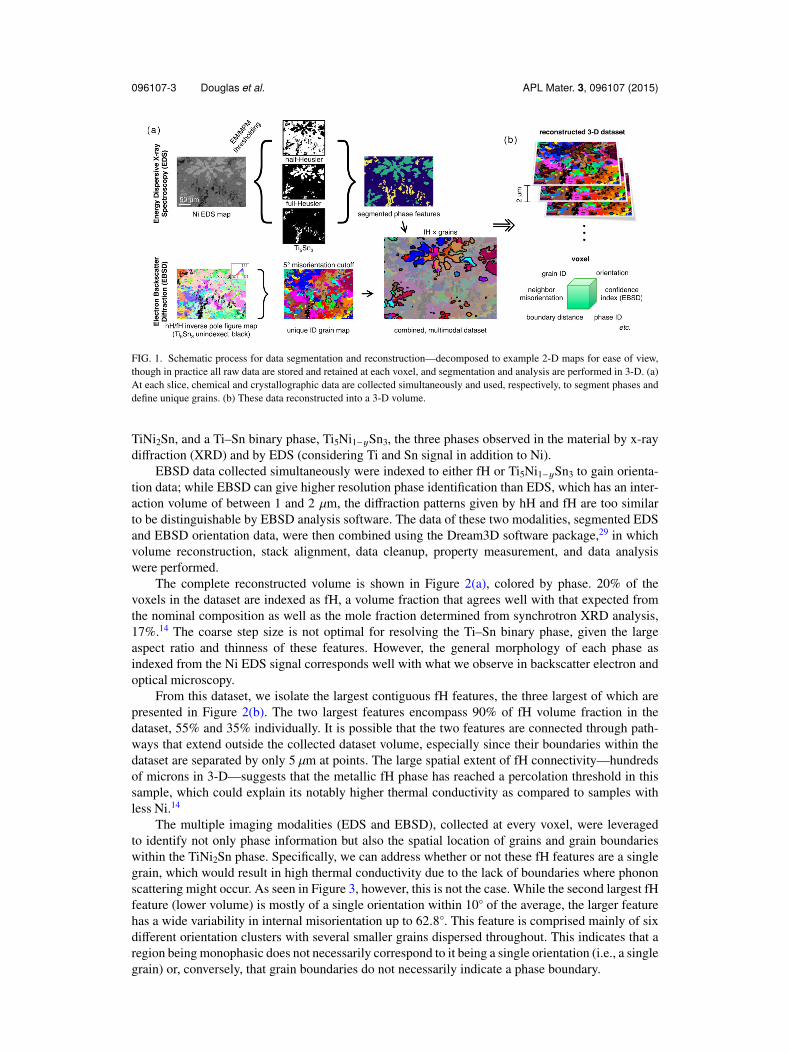
The complete reconstructed volume is shown in Figure 2(a), colored by phase. 20% of thevoxels in the dataset are indexed as fH, a volume fraction that agrees well with that expected fromthe nominal composition as well as the mole fraction determined from synchrotron XRD analysis,17%.14 The coarse step size is not optimal for resolving the Ti–Sn binary phase, given the largeaspect ratio and thinness of these features. However, the general morphology of each phase asindexed from the Ni EDS signal corresponds well with what we observe in backscatter electron andoptical microscopy.
From this dataset, we isolate the largest contiguous fH features, the three largest of which arepresented in Figure 2(b). The two largest features encompass 90% of fH volume fraction in thedataset, 55% and 35% individually. It is possible that the two features are connected through path-ways that extend outside the collected dataset volume, especially since their boundaries within thedataset are separated by only 5 µm at points. The large spatial extent of fH connectivity—hundredsof microns in 3-D—suggests that the metallic fH phase has reached a percolation threshold in thissample, which could explain its notably higher thermal conductivity as compared to samples withless Ni.14
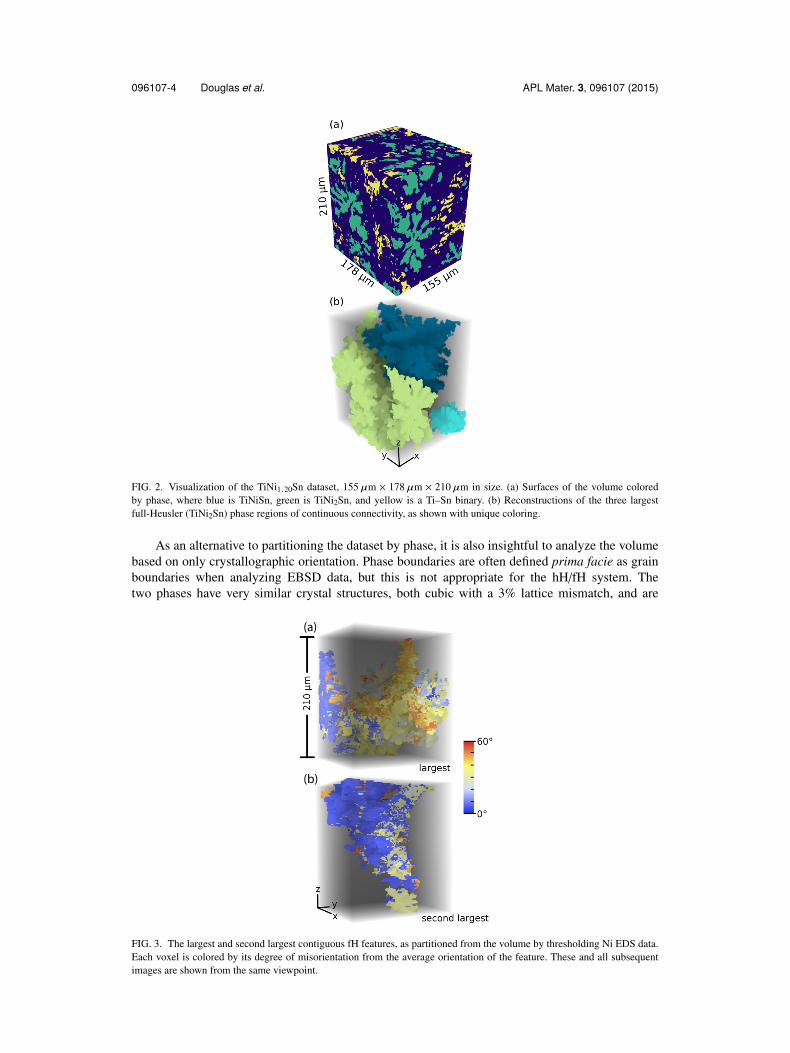
The multiple imaging modalities (EDS and EBSD), collected at every voxel, were leveragedto identify not only phase information but also the spatial location of grains and grain boundarieswithin the TiNi2Sn phase. Specifically, we can address whether or not these fH features are a singlegrain, which would result in high thermal conductivity due to the lack of boundaries where phononscattering might occur. As seen in Figure 3, however, this is not the case. While the second largest fHfeature (lower volume) is mostly of a single orientation within 10◦ of the average, the larger featurehas a wide variability in internal misorientation up to 62.8◦. This feature is comprised mainly of sixdifferent orientation clusters with several smaller grains dispersed throughout. This indicates that aregion being monophasic does not necessarily correspond to it being a single orientation (i.e., a singlegrain) or, conversely, that grain boundaries do not necessarily indicate a phase boundary.
096107-4 Douglas et al. APL Mater. 3, 096107 (2015)
FIG. 2. Visualization of the TiNi1.20Sn dataset, 155 µm × 178 µm × 210 µm in size. (a) Surfaces of the volume coloredby phase, where blue is TiNiSn, green is TiNi2Sn, and yellow is a Ti–Sn binary. (b) Reconstructions of the three largestfull-Heusler (TiNi2Sn) phase regions of continuous connectivity, as shown with unique coloring.
As an alternative to partitioning the dataset by phase, it is also insightful to analyze the volumebased on only crystallographic orientation. Phase boundaries are often defined prima facie as grainboundaries when analyzing EBSD data, but this is not appropriate for the hH/fH system. Thetwo phases have very similar crystal structures, both cubic with a 3% lattice mismatch, and are
FIG. 3. The largest and second largest contiguous fH features, as partitioned from the volume by thresholding Ni EDS data.Each voxel is colored by its degree of misorientation from the average orientation of the feature. These and all subsequentimages are shown from the same viewpoint.

096107-5 Douglas et al. APL Mater. 3, 096107 (2015)
known to form (semi)coherent interfaces.13,14 As such, grains were analyzed with boundary locationsdefined only as interfaces with high crystallographic misorientation—here we use a voxel-to-voxelmisorientation threshold of 5◦ and a minimum size cutoff of 25 voxels. By this measure, there are2182 grains in the volume, as compared to the (chemistry-identified) 133 unique fH features >25voxels in size and an almost completely connected hH phase. (99.992% of the latter phase belongsto a single feature, one of only 6 hH features >25 voxels.)
The resulting 11 grains with size greater than 100 000 µm3 are reconstructed in Figure 4, consti-tuting 92% of the cubic material volume (hH or fH) in the dataset. The largest grain is approximately30% of the volume. Despite the large size of this grain, which has an equivalent diameter of 70 µmwithin the collected volume, the crystallographic orientation is extremely homogeneous throughout.As displayed in Figure 5(a), almost every part of the grain is oriented within 10◦ of the grain average.The few pockets of high internal misorientation (>15◦, 21.1◦ at maximum) are less than 10 µm indiameter.
The voxels of the largest grain that are indexed as TiNi2Sn are presented in Figure 5(b).Approximately 30% of the grain volume is fH, the bulk of which is a part of the fH feature from Fig.3(b). The fH phase in the interior of this grain indicates that a single orientation in these materialsdoes not necessarily denote a single phase, and that phase boundaries can occur within a singlegrain. This is particularly striking because it demonstrates a high areal density of coherent hH/fHphase boundaries present throughout the material. The coherent interface persists for lengths greaterthan a hundred microns and acts to increase the boundary density within the material; the ratio ofboundary-area to volume for this grain is 60% greater when both phase and grain boundaries areincluded, rather than just the latter. Given that grain and phase sizes within the volume are largerthan typical phonon mean free path lengths when considered separately, these coherent interfaceswill be important for scattering and thermal conductivity reduction. The coherency of fH with thehH is of additional significance as coherent boundaries, which account for just over half of the total
FIG. 4. The eleven largest grains of cubic material (hH and fH) within the volume, in which boundaries are defined only by a5◦ voxel-to-voxel misorientation threshold on the EBSD data (i.e., no phase information). Colored only to distinguish for theeye and presented in three frames to ease visualization of all grains. The blue grain in the bottom frame is the single largest,making up ∼30% of the volume.

096107-6 Douglas et al. APL Mater. 3, 096107 (2015)
FIG. 5. (a) The single largest grain in the volume. (b) The same grain, but displaying only the voxels indexed as fH, whichconstitutes ∼30% of the grain. Each voxel is colored by its degree of misorientation from the average orientation of the grain.
hH/fH interface area in the volume, are believed to damp phonon transport more strongly, due to theelastic strain fields and dislocations introduced into the material.30
In the grain of Figure 5, the shape and location of the fH are also noteworthy in that thefH appears to form the core of the grain. Due to the higher melting temperature of TiNi2Sn ascompared to TiNiSn, we have posited that the fH solidifies first in TiNi1+xSn materials prepared bythe induction melting process, as evidenced by the dendritic morphology of the features.14 This issupported by the grain structure observed here: fH particles solidify first in the melt, onto whichheterogeneous hH nucleation occurs, eventually growing to the observed grain structure. The arealdensity of grain boundaries is 47% greater within the hH (0.33 µm−1) than the fH (0.23 µm−1),likely because nucleation of isolated fH dendrites initially occurs and subsequently the crystalsimpinge—and grain boundaries form—more frequently in the interdendritic hH regions. With thesimilarity of the two crystal structures, this sequence would also predict the observed large highareas of coherent interfaces.
The misorientation distribution function (MDF), Figure 6, shows that the grain boundary char-acter is effectively independent of the structure. Here, boundary is defined as voxel faces that arebounded by voxels belonging to two different grains segmented in the volume. Intraphase andinterphase boundaries show the same distribution, and there is almost an equal area of coherentand incoherent interface between TiNiSn and TiNi2Sn. This suggests that the MDF is stronglyinfluenced by the solidification path and orientation relationship between the fH and hH. Becauseof these factors, neither EBSD nor EDS can be used to determine the boundaries of this systemindependently. The MDF deviates from a uniformly random cubic distribution,31 exhibiting morelow-angle boundaries (<15◦) and a peak near 30◦. The peak likely corresponds to a coincident sitelattice (CSL) boundary, however current algorithms for calculating boundary misorientation in 3-Ddatasets do not support boundary character determination based on local misorientation.
While the dataset collection volume was initially chosen to capture the scale of phase fea-tures in 2-D SEM micrographs, 100 µm or smaller, we see in 3-D that these grains and featurescan approach or exceed the edge lengths of our collected volume. As such, in the future a largerdataset may be required to accurately characterize some quantities such as maximum grain size.However, a large number of unique grains and phase features are able to be captured, which alsoappears to be a representative volume for a number of other microstructural features such as connec-tivity, phase boundary versus grain boundary location, and the relative abundance of boundary

096107-7 Douglas et al. APL Mater. 3, 096107 (2015)
FIG. 6. (a) Misorientation distribution function for grain boundaries (GB) at each of three interfaces in the volume:TiNiSn/TiNiSn (hH/hH), TiNiSn/TiNi2Sn (hH/fH), and TiNi2Sn/TiNi2Sn (fH/fH). The three are nearly identical. Dashedline is the Mackenzie distribution for randomly oriented grains in a cubic material.31 (b) Relative fraction of the total GBarea comprised of each interface, as well as coherent hH/fH interface (hH/fH:c).
types. Simultaneously, this study has helped develop reconstruction and analysis techniques for 3-Dmicrostructural data.
In summary, we have used the new TriBeam tomography instrument to study phase and grainmorphology in TiNi1.20Sn prepared by induction melting. With this technique, we were able tostudy a large, three-dimensional dataset that incorporates both chemical (EDS) and crystallographic(EBSD) data. We find that the fH phase appears to be percolated in this sample, with almost allof the fH phase contained in one of two contiguous features. Half- and full-Heusler coherencyare maintained over large interfacial areas. In this material, we observe that phase boundaries donot necessarily coincide with grain boundaries and vice versa. The fact that phase boundaries andgrain boundaries are decoupled means there is a higher density of interfaces than would be presentotherwise, potentially increasing phonon scattering within the material. While the effect of perco-lated metallic pathways dominated interfacial scattering in this sample, the separably controllablegrain boundary character and fH phase distribution present an opportunity for the optimization ofmicrostructure in biphasic hH-based thermoelectric materials.
This work was supported by the MRSEC Program of the National Science Foundation throughDMR-1121053. J.E.D. is supported by the National Science Foundation Graduate Research Fellow-ship Program under Grant No. 1144085. TriBeam development and W.C.L. are supported by the AirForce Research Laboratory Center of Excellence (Grant No. FA9550-12-1-0445). We would alsolike to thank Stuart Wright (EDAX) for OIM Analysis software support. The Materials ResearchLaboratory is a member of the NSF-supported Materials Research Facilities Network.1 J. R. Sootsman, D. Y. Chung, and M. G. Kanatzidis, Angew. Chem., Int. Ed. 48, 8616 (2009).2 K. Smith and M. Thornton, Feasibility of Thermoelectrics for Waste Heat Recovery in Conventional Vehicles (NREL, U.S.
Department of Energy, 2009).3 T. M. Tritt, Annu. Rev. Mater. Res. 41, 433 (2011).4 M. Zebarjadi, K. Esfarjani, M. S. Dresselhaus, Z. F. Ren, and G. Chen, Energy Environ. Sci. 5, 5147 (2012).5 S. Chen and Z. Ren, Mater. Today 16, 387 (2013).6 J.-W. G. Bos and R. A. Downie, J. Phys.: Condens. Matter 26, 433201 (2014).7 M. W. Gaultois and T. D. Sparks, Appl. Phys. Lett. 104, 113906 (2014).8 L. D. Zhao, S. H. Lo, Y. Zhang, H. Sun, G. Tan, C. Uher, C. Wolverton, V. P. Dravid, and M. G. Kanatzidis, Nature 508,
373 (2014).

096107-8 Douglas et al. APL Mater. 3, 096107 (2015)
9 A. Peterson, S. Bhattacharya, T. M. Tritt, and S. J. Poon, J. Appl. Phys. 117, 035706 (2015).10 H. Xie, H. Wang, Y. Pei, C. Fu, X. Liu, G. J. Snyder, X. Zhao, and Y. Zhu, Adv. Funct. Mater. 23, 5123 (2013).11 J. Schmitt, Z. M. Gibbs, G. J. Snyder, and C. Felser, Mater. Horiz. 2, 68 (2015).12 H. Hazama, M. Matsubara, R. Asahi, and T. Takeuchi, J. Appl. Phys. 110, 063710 (2011).13 Y. W. Chai and Y. Kimura, Acta Mater. 61(18), 6684 (2013).14 J. E. Douglas, C. S. Birkel, N. Verma, V. M. Miller, M.-S. Miao, G. D. Stucky, T. M. Pollock, and R. Seshadri, J. Appl. Phys.
115, 043720 (2014).15 C. Colinet, P. Jund, and J.-C. Tédenac, Intermetallics 46, 103 (2014).16 J. E. Douglas, P. A. Chater, C. M. Brown, T. M. Pollock, and R. Seshadri, J. Appl. Phys. 116, 163514 (2014).17 D. T. Do, S. D. Mahanti, and J. J. Pulikkoti, J. Phys.: Condens. Matter 26, 275501 (2014).18 Y. Liu, P. Sahoo, J. P. A. Makongo, X. Zhou, S.-J. Kim, H. Chi, C. Uher, X. Pan, and P. F. P. Poudeu, J. Am. Chem. Soc.
135, 7486 (2013).19 M. Schwall and B. Balke, Phys. Chem. Chem. Phys. 15, 1868 (2013).20 J. Krez, J. Schmitt, G. J. Snyder, C. Felser, W. Hermes, and M. Schwind, J. Mater. Chem. A 2, 13513 (2014).21 R. A. Downie, D. A. MacLaren, and J.-W. G. Bos, J. Mater. Chem. A 2, 6107 (2014).22 K. Gałazka, S. Populoh, L. Sagarna, L. Karvonen, W. Xie, A. Beni, P. Schmutz, J. Hulliger, and A. Weidenkaff, Phys. Status
Solidi A 6, 1259 (2014).23 E. Rausch, B. Balke, S. Ouardi, and C. Felser, Phys. Chem. Chem. Phys. 16, 25258 (2014).24 M. D. Uchic, M. DeGraef, R. Wheeler, and D. M. Dimiduk, Ultramicroscopy 109, 1229 (2009).25 M. P. Echlin, A. Mottura, M. Wang, P. J. Mignone, D. P. Riley, G. V. Franks, and T. M. Pollock, Acta Mater. 64, 307 (2014).26 J. W. Gibbs and P. W. Voorhees, Integr. Mater. Manuf. Innovation 3, 6 (2014).27 M. P. Echlin, A. Mottura, C. J. Torbet, and T. M. Pollock, Rev. Sci. Instrum. 83, 023701 (2012).28 J. P. Simmons, P. Chuang, M. Comer, J. E. Spowart, M. D. Uchic, and M. De Graef, Modell. Simul. Mater. Sci. Eng. 17,
025002 (2009).29 M. A. Groeber and M. A. Jackson, Integr. Mater. Manuf. Innovation 3, 1 (2014).30 J. He, J. R. Sootsman, S. N. Girard, J.-C. Zheng, J. Wen, Y. Zhu, M. G. Kanatzidis, and V. P. Dravid, J. Am. Chem. Soc.
132, 8669 (2010).31 J. K. Mackenzie, Biometrika 45, 229 (1958).