time-resolved tunable diode laser detection of the ... · pdf filethe products of the infrared...
TRANSCRIPT

/
...
....."'. -
---..;....-_._ •.
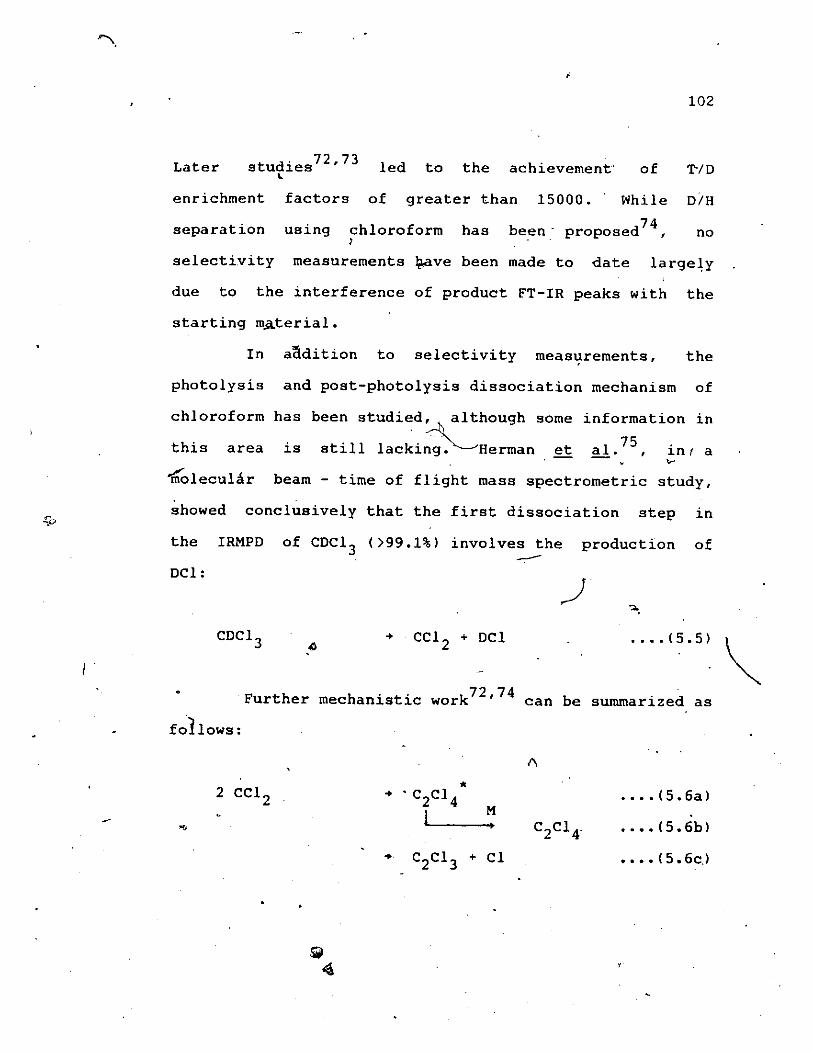
TIME-RESOLVED TUNABLE DIODE LASER DETECTION pF
THE PRODUCTS OF THE INFRARED MULTI PHOTON DISSOCIATION
) OF CF2 HCl, (CF3)2CO, AND CHC1 3
•
by
JOHN JOSEPH ORLANDO, B.Sc .
A Thesis
Submitted to the School of Graduate Studie~
in Partial Fulfilme~t of the Requirements
•
, -
•
,@
for' the Degree
Doctor "'of Rhilosophy
~.
"'McMaster University
1987
..

~\
\
.." ./
l"j
:
~.
TUNABLE DrODE "LASER DETECTION
OF THE PRODUCTS OF IRMPD
,
,
\
--.'-"

, '
, ..,
DOCTOR OF PHILOSOPHY (1987)(Chemistry)
..
.'~
McMASTER UNIVERSITYHamilton, Ontario
\
, \
TITLE: Time-resolved'Tunable Diode Laser Detection of t~e
Products of the Infrared Multiphoton Dissociation.'~f CF2HCI, (CF3)2CO, and CaCl 3
of
AUTHOR: John Joseph Orlando, B.Sc. (McMaster University) ,
\
(
ii
i
,.,i
--..J
ABSTRACT
./ -In the, experiments"descr'ib~d in thesis,' tunable
u
diode lasers are used to detect infrared absorption by the\
transient species produced in the infrared multiphoton
disltociation (IRMPO) of CF 2HCl, /CF3)2CO, and CHCl 3·.
The time-resQlved infrared absorptions ,of CF 2 and
HOI are detected following' the IRMPD of CF 2HCl. /
,em
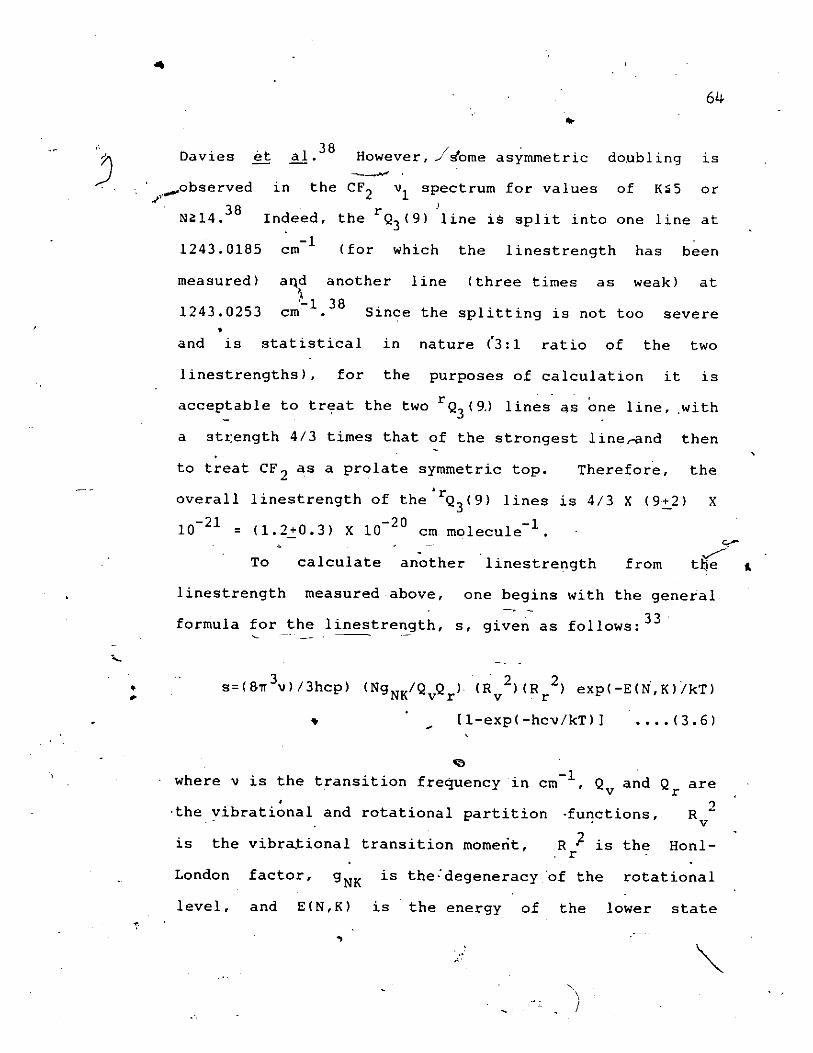
of the HCl allows one to det~rmine aI I
(9+'2)L ~ X 10-21,Quantification
\
infrared-labsorption. Iinestrength,
-1 rmolecule for the .93(9) line. From this linest.re~th,
the CF2
VI bandsirengt~ is found to be (3.4+0.8) ~ 10-18,
cm molecule-I. The rate c~nstant for CF2
recombination to
form C2
F4
is found to be (2.3~O"7) X.10-~4 cm3 molecuie-1
-1s
Time-resolvetl .detection of· CF3 , C2F6 , anCL,_CO</ •
following the IRMPD of (CF3)2CO establishes that the.
dissociation mechanism involves the production of one
-,
~s
em
found
From, this stoichiometry,
rr.- ~ 3
~ilculated 'to be :(8+2) X 10-17
rate constant for CF' recombination3
then1S
. The
molecule of co and two of CF3
"
h " ~h f h rt e 11nestrengt 0 t e R16(~0) CF 3 transition is
'-" 0 =-1to be (1.4+0.3) X 10 - 'cm' molecule and the
bandstrength
-1molecule.
iii

•
, "
..
10 - 12 cm3· -1-1measured to be (.z-:.2+0.Sf X molecule s at or
near the high pressure- limit, while the ra.te constant for.('
-1s
reacting
and
respectively.
wi th 02 .;.nd NO are
('"2 • 8~0 " 7 ) X 10 - 2 9"-.
f ouod to be . ( 2 .1 +0 • S )
cm 6 . molecule~2
x
~he use of TDLs in determiping the isotopic
selectivity of IRMPD processes is· then analysed. The
sensitivity of the t~chniqti~ is demonstrated in the
detectioQ of the DCI ~roduced in' the IRMPD of - natural
com~lications due to _
monitoring the DCI and HC 1 on a' short timesca Ie (tens
Cbundance CDCI] in CHCl 3 " However,
wall adsorption and desorption effects necessitate..,.
of
~s) to obtain meaningful quantitative information. It 1.s.
shown that the CC1 4 and much of the HCI produced 1.n the
photolysis of mixtures is ~he result of
j.sotopically non-selective reactions involving Cl ,aio,?
\-
\:iv
. 1
..

"
ACKNOWLEDGMENTS
I' would like to thank the following people for~
their contribution to this thesis :' •
(( Qr. Don Smith, for his guidance, throughout this
work;
Dr. JolJn Re{d, for lending his expertise in the
area of TDL analysis and'for helpful discussions regarding
,
all aspects of this work;
'"Atomic Energy of Canada Ltd., for the. loan of the
high repetition rate ,C0 2 \laser; ..
Dr. JoHn Johns of N.R.C., for confirming the
, method used in calculating the CFi ba~dstrength;
, N.S.E.R.C.• , ......for financial support in .the form of a•
post-grad~ate scholarship;
Mr. Carl Brown,' for his collaboration in the
development of the transient detection technique for CF 2
(Section 3.2) and CF 3 <Section 4.2) and in the measurement
of th~ CF3 recombina.tion r~te.-constant (Section 4.4.5),
his general ass~stance throughout the course of this work
~ and for making the lab an enjoyable place to work.
-0 Mr. Paul Beckwith, for his collaboration ~n the4
, development of the transient detection technique for CF,
v

\.
(S~~tion 3.2), the development of D&l detection and r in
particular, for collecting the data presented in figurer
5.4.
support;
My<J
parents and brother for ~heir continbal
The many friends who made my graduate life
that much more. rewarding;
manuscript and for her constant support and friendship .•
Brian fahie,
especially. Joan fahie,
for his advice and'~friendship, . and~
-lfor her help in proofreading this ..
?-
-",,",
vi
., •

J
p
TABLE OF CONTENTS
ABSTRACT
ACKNOWLEDGEMENTS
LIST OF FIGURES
LIST OF TABLES
CHAPTER
iii
v
x
. xx
1 INTRODUCTION
1.1 General
1.2 The IRMPD Process
1.3 Theory of Infrared Absorpt~on
1 . 4: SUmmary
1
1
5
24
28
,
2' EXPER"rMENTAL
2.1 Introduction
2.2 Gases ~nd Gas~Handling Tech~iques
30
30
30
2.3 Photolysis and Stable Pro~uct Analysis 31Techniques.
3.4 Tim~esolved Detection of Transients with 40TDLs'
2."5 Summary 47
vii
fI

~.
S. I
3 IRMPD OF CF 2HCl
3.1 Introduction
48
48
3.4.3 CF2 Kinetics
3.4 Results and Discussion
3.2 .E~periinental
3.3 }hotolysis Mechanism
59
5S
66
52
55
48
(
1.r
CF2 and HCl Vibrational Relaxation ,.... . -
LineJtrength and BandstrengthCalculations
3.4.2
3.4.1,
3.5 Summary 68
tIRMPD OF HEXAFLUOROACETONE 70
4.1 Introduction 70
4.2 Experimental<!:l
4.3 P¥ev10us Work
70
73
4;4 Results and Discussion 75
4.4.1 Photolys~~ Mechanism
4.4.2 Vibrational Relaxation of CF 3
4.4.3 Photolysis Yield as arFunctionof Fluence
75
80
80 .
4.4.4 CF3 .Linestrength and BandstrengthCalculations
81
.'4.4.5 CF
3Kinetic stud1es
4.5 Summary
85
92
viii. c.

5.4.3 Time-Resolved TDL Detection~ofDCI/RCl ' ,
5.4.1 Effect of Additives on ProductYield in ~DCl3 IRMPD
5.4.2 ;DCl/HCI Detection Following IRMPDof Chloroform
.,
95
9.5
96
98•104
104.".~\
110
117
121
C--123
I
\
5 • 2 Exper imEmta 1
5.4 Results and Discussion
5.3 Previous Work
".5.5 Summary
6 CONCLUSIONS
" 5 IRMPD O~ CDCl3
/CHCl3
5.1 Introduction
\.....
~6.1 Introduction 123.
6.2 Ti~e-Resolved~Detectionwith TDLs
6.3 Determination of the IRMPD Mechanis~
124
125
6.4 Linestrengthand Bandstren~th calculatio~ 127
6.5 Kinetic~studies of Transie~t Species 12~-~ I ~
6.6 Laser Isotope Separati911 131,
6'.7 Summary 132
REFERENCES ' ,J:
APPENDIX A f
- ).,
,
133
'148
}
ix

NO.
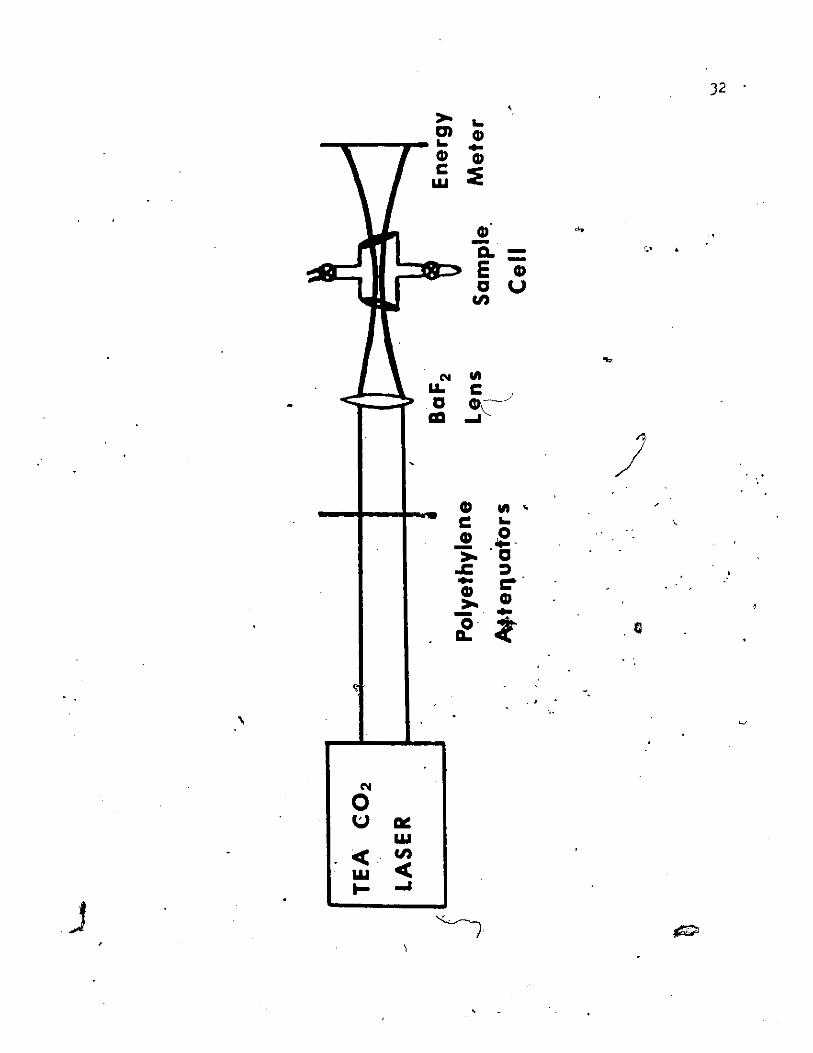
2.1
LIST OF FIGURES
Experimental dlesign for static . sample'\
photolyses. The CO2 laser beam is
focussed by means of a 25 cm BaF2 lens
PAGE
32
into the cell. Polyethylene sheets are
2.• 2
.. used as necessary to obtain the desired
CO 2 laser pulse energy .•
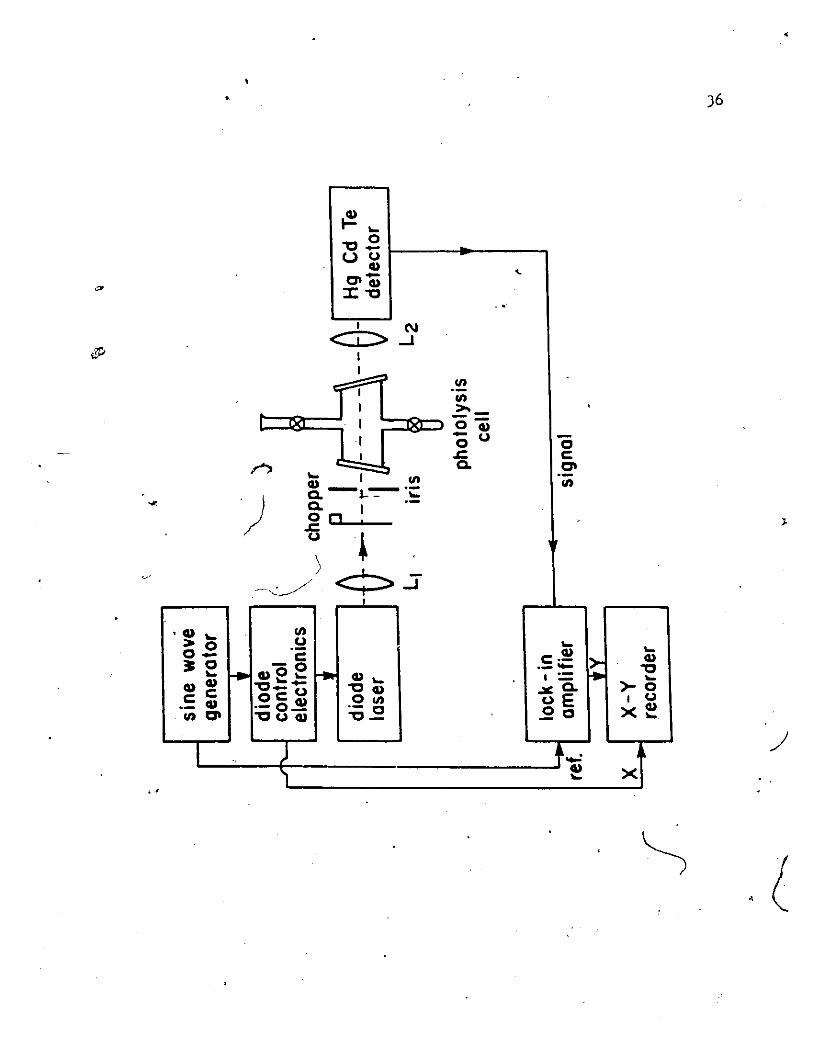
Schematic diagram of TDL stable product
analysis apparatus. The TDL beam ~s
~ .focussed into the cell by means of LI ,
aqd then focussed onto ~he IR detector
using L2 • The TDL beam is cnopped· by the
36
mechanical chopper. Detection 4S done
2.3
using a. lock-in amplifie~ whose phase
matches that" of the chopper.
Calibration plots ~or CO dnd C,O-CHCl 3
mixtures~- Line A, shewing detection of
p~re CO, gives a.linestrength for R<8l in
38
agreement with the literature. Line B '\
shows the effects of pressure broadening
x ...
~ ,...
....

on the co absorption coefficient. The
data are consistent with a pressure
broadening coefficient of 8.0 X 10⁻⁵ cm- 1
-1Torr ' as measured in our lab. Line C,
with detection done on R(6), shows that
the measured absorption coefficien{ (by
either direct or second harmonic
detection) is linear over a ra\1ge of co
pressures of greater than thre~ orders of
magnitude. The inset defines the
parameters I and I 0'used in the
measurement of (l .0
2.4 Schematic
apparatus.
~~ .of TDL transient detection
Lens L1 is ~sed to focus the
41
The two beams are
TDL beam, while lens L2 collimates the
-CO2 laser beam.
combined on beamsplitter M1 and focussed
on L 3 into the capillary cell. The two
beams are then separated on a diffr~ction
grating, with the TDL beam then' being
focussed onto the infrared detector,. and
the CO 2 laser beam being focussed onto an
energy meter.
xi

2.5 Idealized
(
schematic of the detector ..output in a transient detection
experiment. In each modulation cycle,
the absorption feature ~ sampled twice,
once in each direction.
2.6 Demonstration of .the advantages of 46
background subtraction in TDL transient
spectroscopy. Note that the subtraction
3.1
removes the precursor absorptions and.
enhances the CF 2 signal. The CF 2 is ~
produced by photolysis of 1.5 Torr of
C2
F3cl, and both the signal and
background represent the average of 50
scans.
FT-IR spectrum of 2 Torr of CF2HCl.~, The
pathlength is 10 cm, while the FT-IR
resolution- is set at i em-1
50
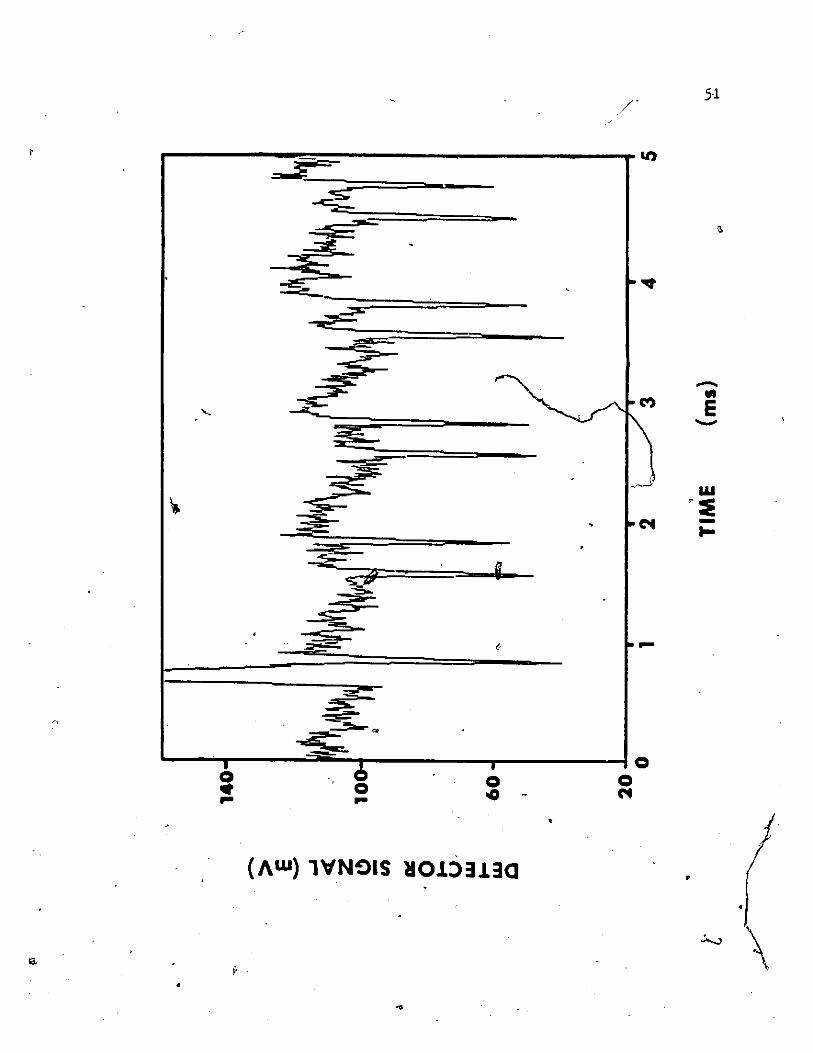
3.2 Transient TDL aQsorption by HCl. The 51
absorption feature monitored is P(9) at
2677.732 -1em The HCl is produced by
photolysis of 800 mTorr of CF 2HCl..:J
". '';'
xii
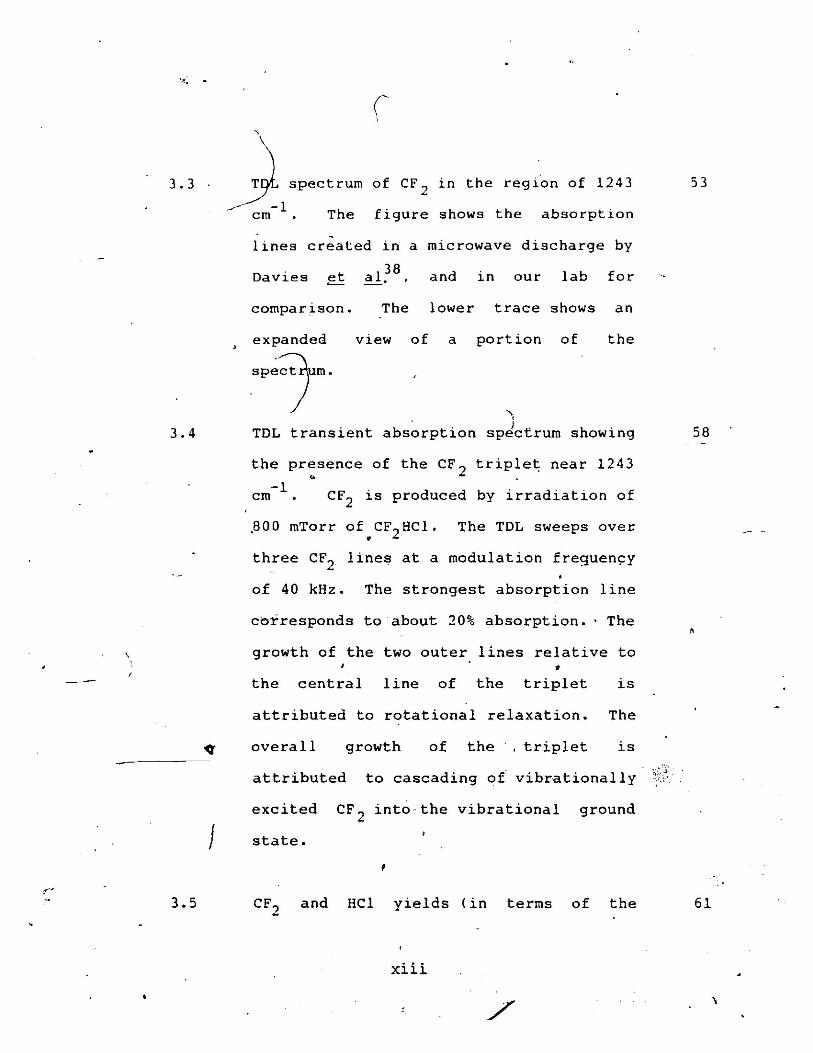
3.3 . )' spectrum
-1cm The
of CF 2 in the region of 1243
figure shows the absorption
53
lines created in a microwave discharge by
Davies ~38 and in lab for~. , our
compar~son. The lower trace shows an
expanded view of a portion of the
sP~7m.."
t
3.4 TDL transient absorption } t showing 58spec rum
the presence of the CF 2 triple~ near 1243..-1
cm CF2 is produced by irradiation of
~OO mTorr of.CF2 HCI. The TDL sweeps ovec
three CF2 line~ at a modulation freguen~y
of 40 kHz. The strongest absorption line
corresponds to about 20% absorption .. The
growth of the two outer lines relative to
the central line of the triplet is
attributed to rotational relaxation. The
overall growth of the·, triplet is
3.5
attributed to cascading of vibrational I y \(::f
excited CF 2 into-the vibrational ground
f state.
,
CF2
and Hel yields (in terms of the
xiii
61
\

absorption per cm, B ) as a function ofo
the average CO2 laser fluence. The
CF2 HCl pressure 19 800 mTorr.
3.6 Partial pressure of CF2 and C2 f 4 as a
•function of time f~llowing photolysis of _
800 mTorr~ of CF2HCl at an average CO2
laser fluence of 17 J cm- 2
"'---(
1.7 second order plot (the inverse of the CF2 67
linecenter absorption coefficient, B ,o
versus time) showing the decay of CF~ via
recombination. The data were obtained by
photolys~s of 800 mTorr of CF2 HCl with a
. -.?peak CO 2 laser fluence of 17 J cm -
4.1 FT-IR spectrum of ,,\.5 Torr of 72
-recorded at a resolution of
pathl~ngth of 10 ern.
\
over a
-is
-1'2 em
spec~rumThehexafluoroaeetone.
4.2 Transient tunable diode laser absorption 77
signal from CF3 created in the IRMPD of
hexafluoroaeetone. The detection i~ done
xiv
on the
1264.739
r R16
(20) CF3
absorption line
-1cm
at
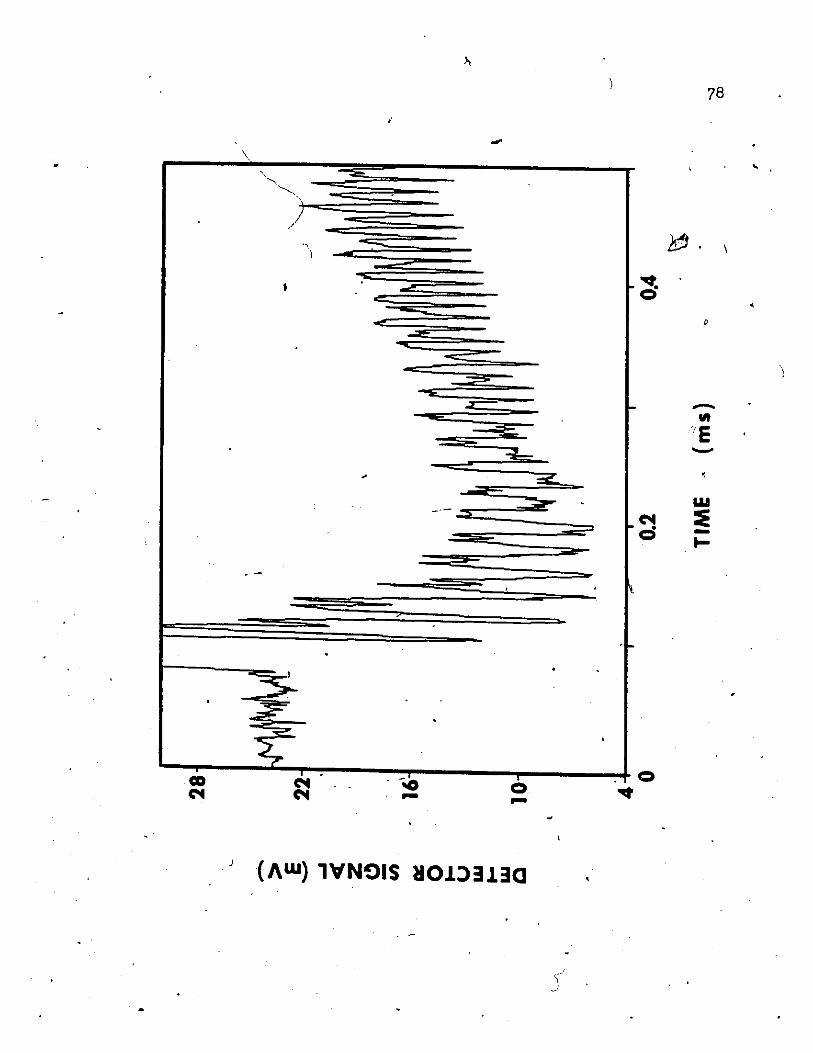
4.3 Transient absorption near 1263-1
cm 78
showing CF3
decay immediately following
the CO2 .laser pulse, and the growth of
C2
F6 at later times.
CO(+) and C2 F6 (O) yields from IRMPD of 82
600 mTorr hexafluoroacetone as a
",
..4.5
function of the average incident CO2
lase~ fluence. The irradiations are done
with the lOR(~02' laser line.
Plot of CF3 absorption per em at
lineeenter, ao ' as a function of CF3
pressure. a for CF3is -rtfeasured at a
0
variety of ,CO2 laser f 1uences, -,and the
83
yields measured at each of these
pressure is obtained from the CO and
fluences and a~ "
knowledge of the
l 4.6
dissociation stoichiometry.
second order decay plot (the inverse of
xv
90
'.

4.7
the absorption coefficient per cm versus
time) for the recombinatio~ of CF 3 . CF3
is created from the IRMPD of 600 mTorr of
hexafluoroacetone. The 10R(14) laser
'line, with a fluence of 34 J cm- 2 is
emplo'yed.
plot 4f the inverse CF3
half-life (ms- i ) t:. 91
versus the concentration of added °2 or
NO (Torr) • CF 3 is created by the IRMPD
of 600 mTorr of hexafluoroacetone at a,
,c'rn-2CO 2 laser fluence of 34 J (on
10RnO) ).
5.1
11
An FT-IR spectrum of a mixture of 2.5
Torr CDC13
and 2.5 Torr CHC13
, recorded
in a 10 cm long Pyrex with a resolution
of 4 cm- l
97
5.2 plot of the produc;t yield of CCl 4 and 106
dissociation yield of CDCl 3 following the
photolysis of 1 Torr CDCl 3 in the
presence of additives. The irradiation
is done on lOP(48), with a'peak focal
. -2fluence of 10 J cm • Errors are +10.
xvi,<

o
'..
Line A: C~14 yield fol~owing irradiation-,
CDCl 3
tJJ
yield
Torrof 1irradiation
B:Line
of 1 Torr CDCl 3 with 1 Torr Ar ..Upper limit of CCl 4
~ith 1 Torr C2F4 •/
\"-
'\ .'"" following
"'-..,
Line C: CCl4 yield following irradiation
of 1 Tor~ 'CDCl] with 1 Torr Cl 2 .
Line 0:
)
CCl 4 !ield following irradiation
of 1 -Torr CDCl 3 with 5 Torr Cl 2 •
Line E: Average dissociation yield of
CDCl 3 ~in the above ~xperiments A through
D. The difference in the dissociation.,
yield in the four cases was not
. significant.
5.3 Relative DCI yield as a fundtion ·of\
. pho~olysis fr~quency fol~owing IRMPD of 1
Torr CDC1 3 in a 10 cm Pyrex cell. The
112
peak -2focal fluence is 10 J em ) in all
.'cases. The error bar represents ~10 •
5.4 Successive scans taken of a 5 Torr sample
~. of natural c'l,loroform after ,k~diatiOn
with 100 pulses of 10P(38) . an~10P(48)
-114 .
xvii

.". )
.1
I.-radiation (about 10 J -2cm )" The •
increase in DCI concen~ration after
irradiation with 10P(48) is attributed to
IRMPD of naturally occurring CDCl 3 in the
sample. The noise level 1S equivajent to
'- ~ about 0.8 ppm DC I.
5.5 Dissociation yield of CDCl 3 (lower line)
and total (HCI + DCI) yield following the
irradiatLon of a mixture of 0.1 Torr--
116
CDCl 3 and 1.9 Torr CHCI 3 . The photoiysis
1S performed at a peak focal fluence of
10 J-2cm with the 10P(48) laser
line. Th~ 'points labelled 1,2, and 3
represent the CDCl3dis~ciation yield 1n
three separate experiments, while the
points labelled a,b, and c represent the
(HCl and DCI) yield in the same three
"experiments.
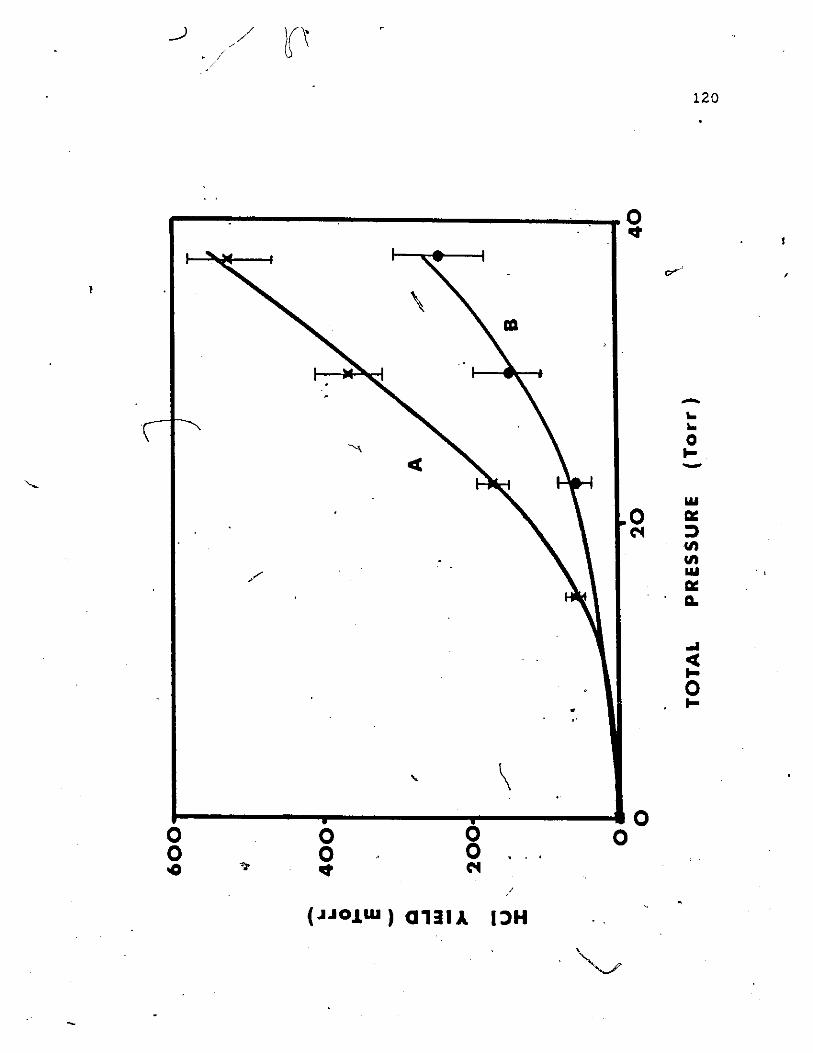
5.6 Transient HCI yield following the single 120
pUl~~adiation of an equimolar mixture
of CDCI3
:CHCl3 :Ar (Line A) or
CDCl 3 : CSCl 3 : Ci F4 (Li1ne B) • The
irradiation is performed with tht:: 10P(38)
xviii.
I

•
.,
CO 2 laser line at ~peak focal fluence of
16 J cm-2 E 1rrors are + o.1;
I
//
/I
.'
xix